The RainBO Platform for Enhancing Urban Resilience to Floods: An Efficient Tool for Planning and Emergency Phases

Abstract
:1. Introduction
2. Materials and Methods
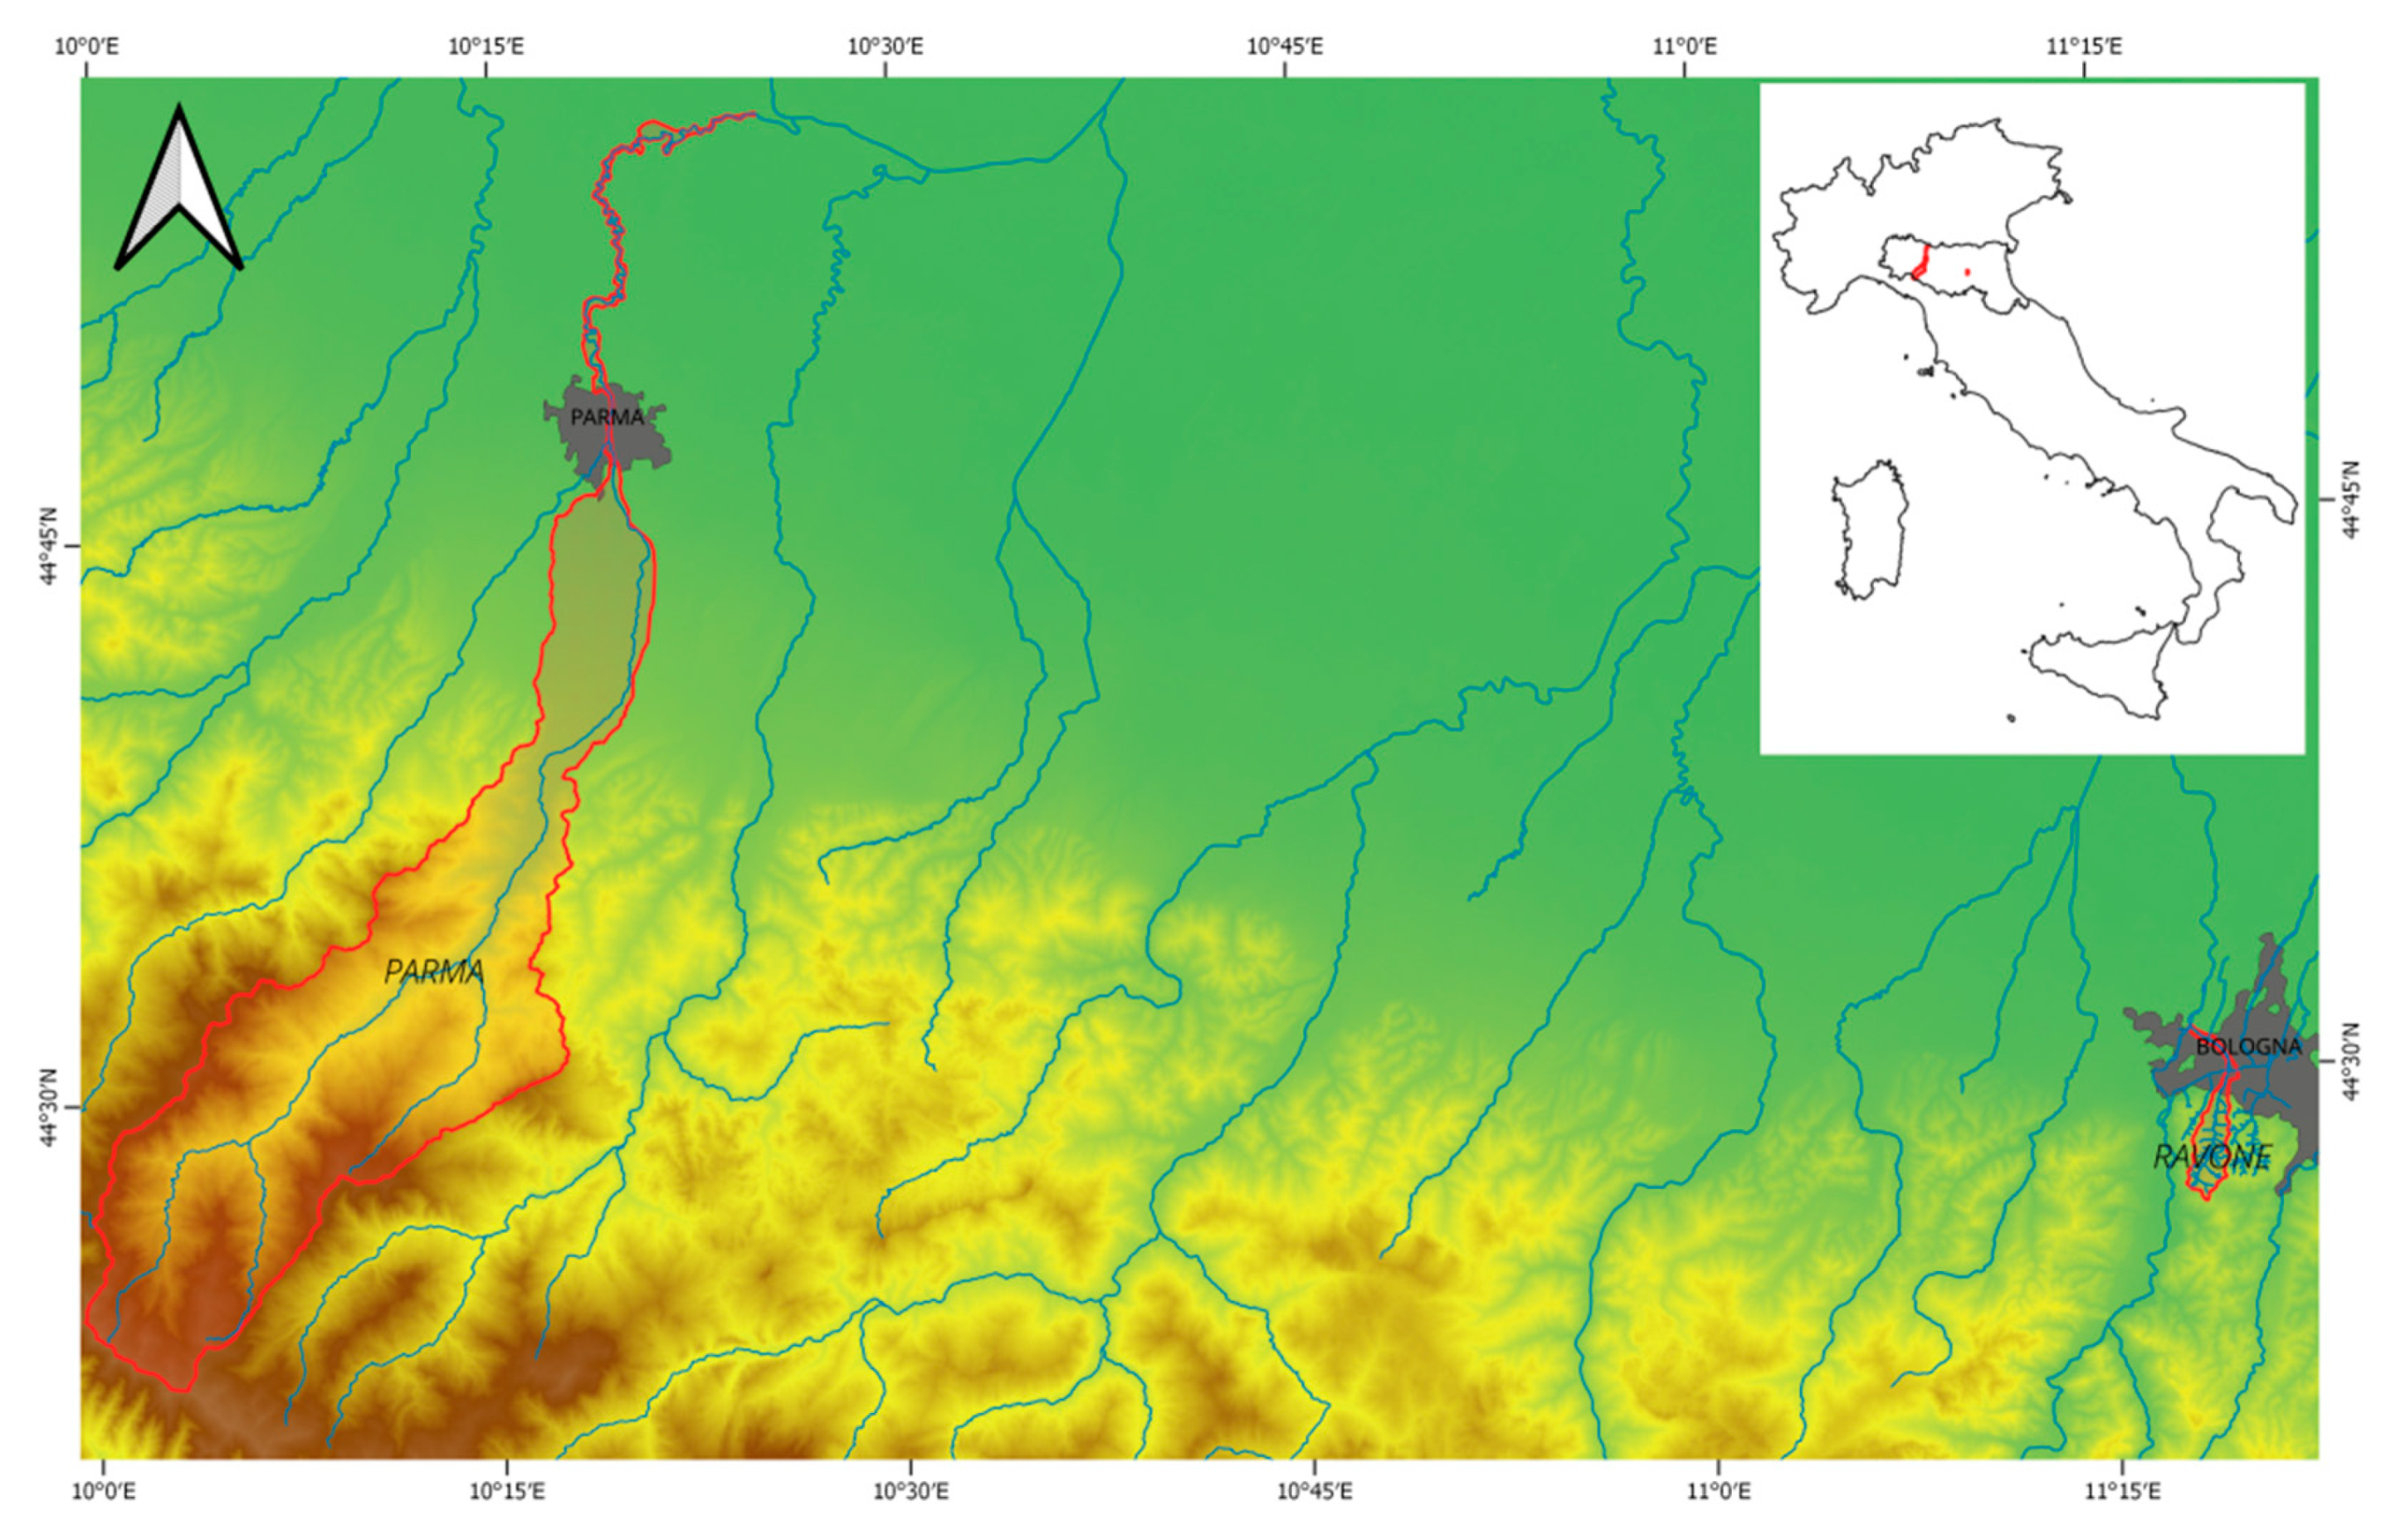
2.1. Study Areas
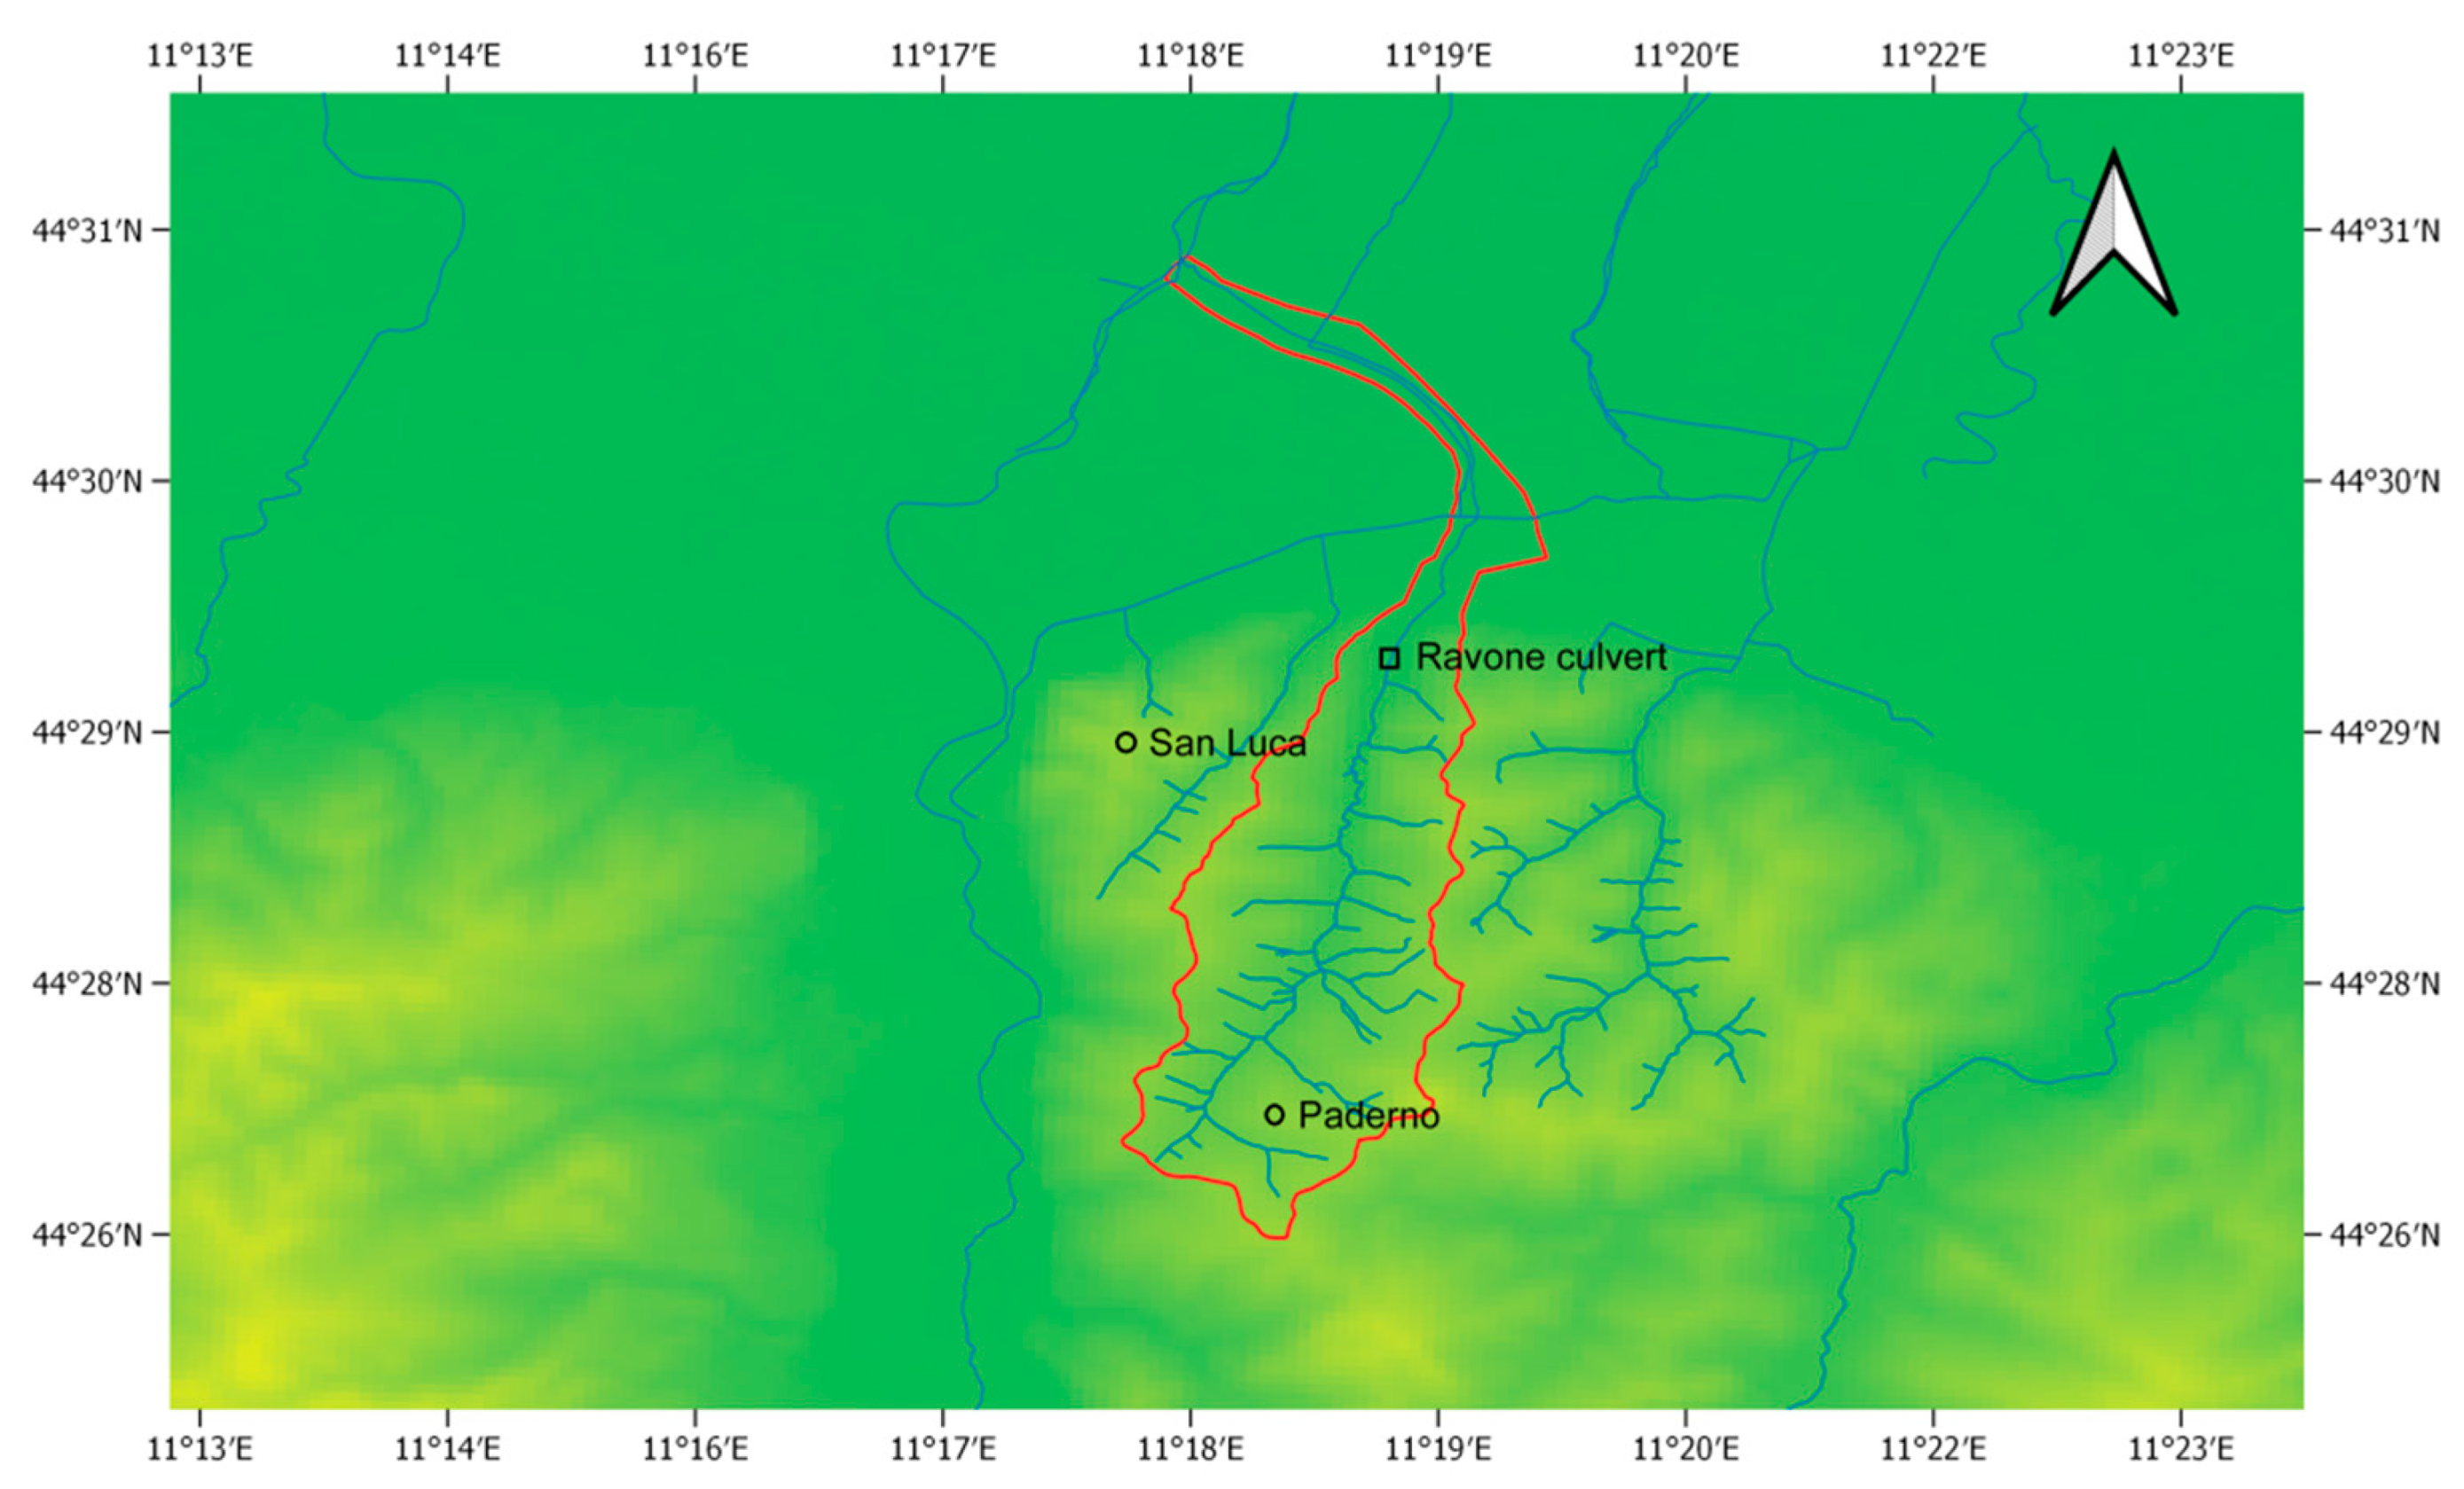
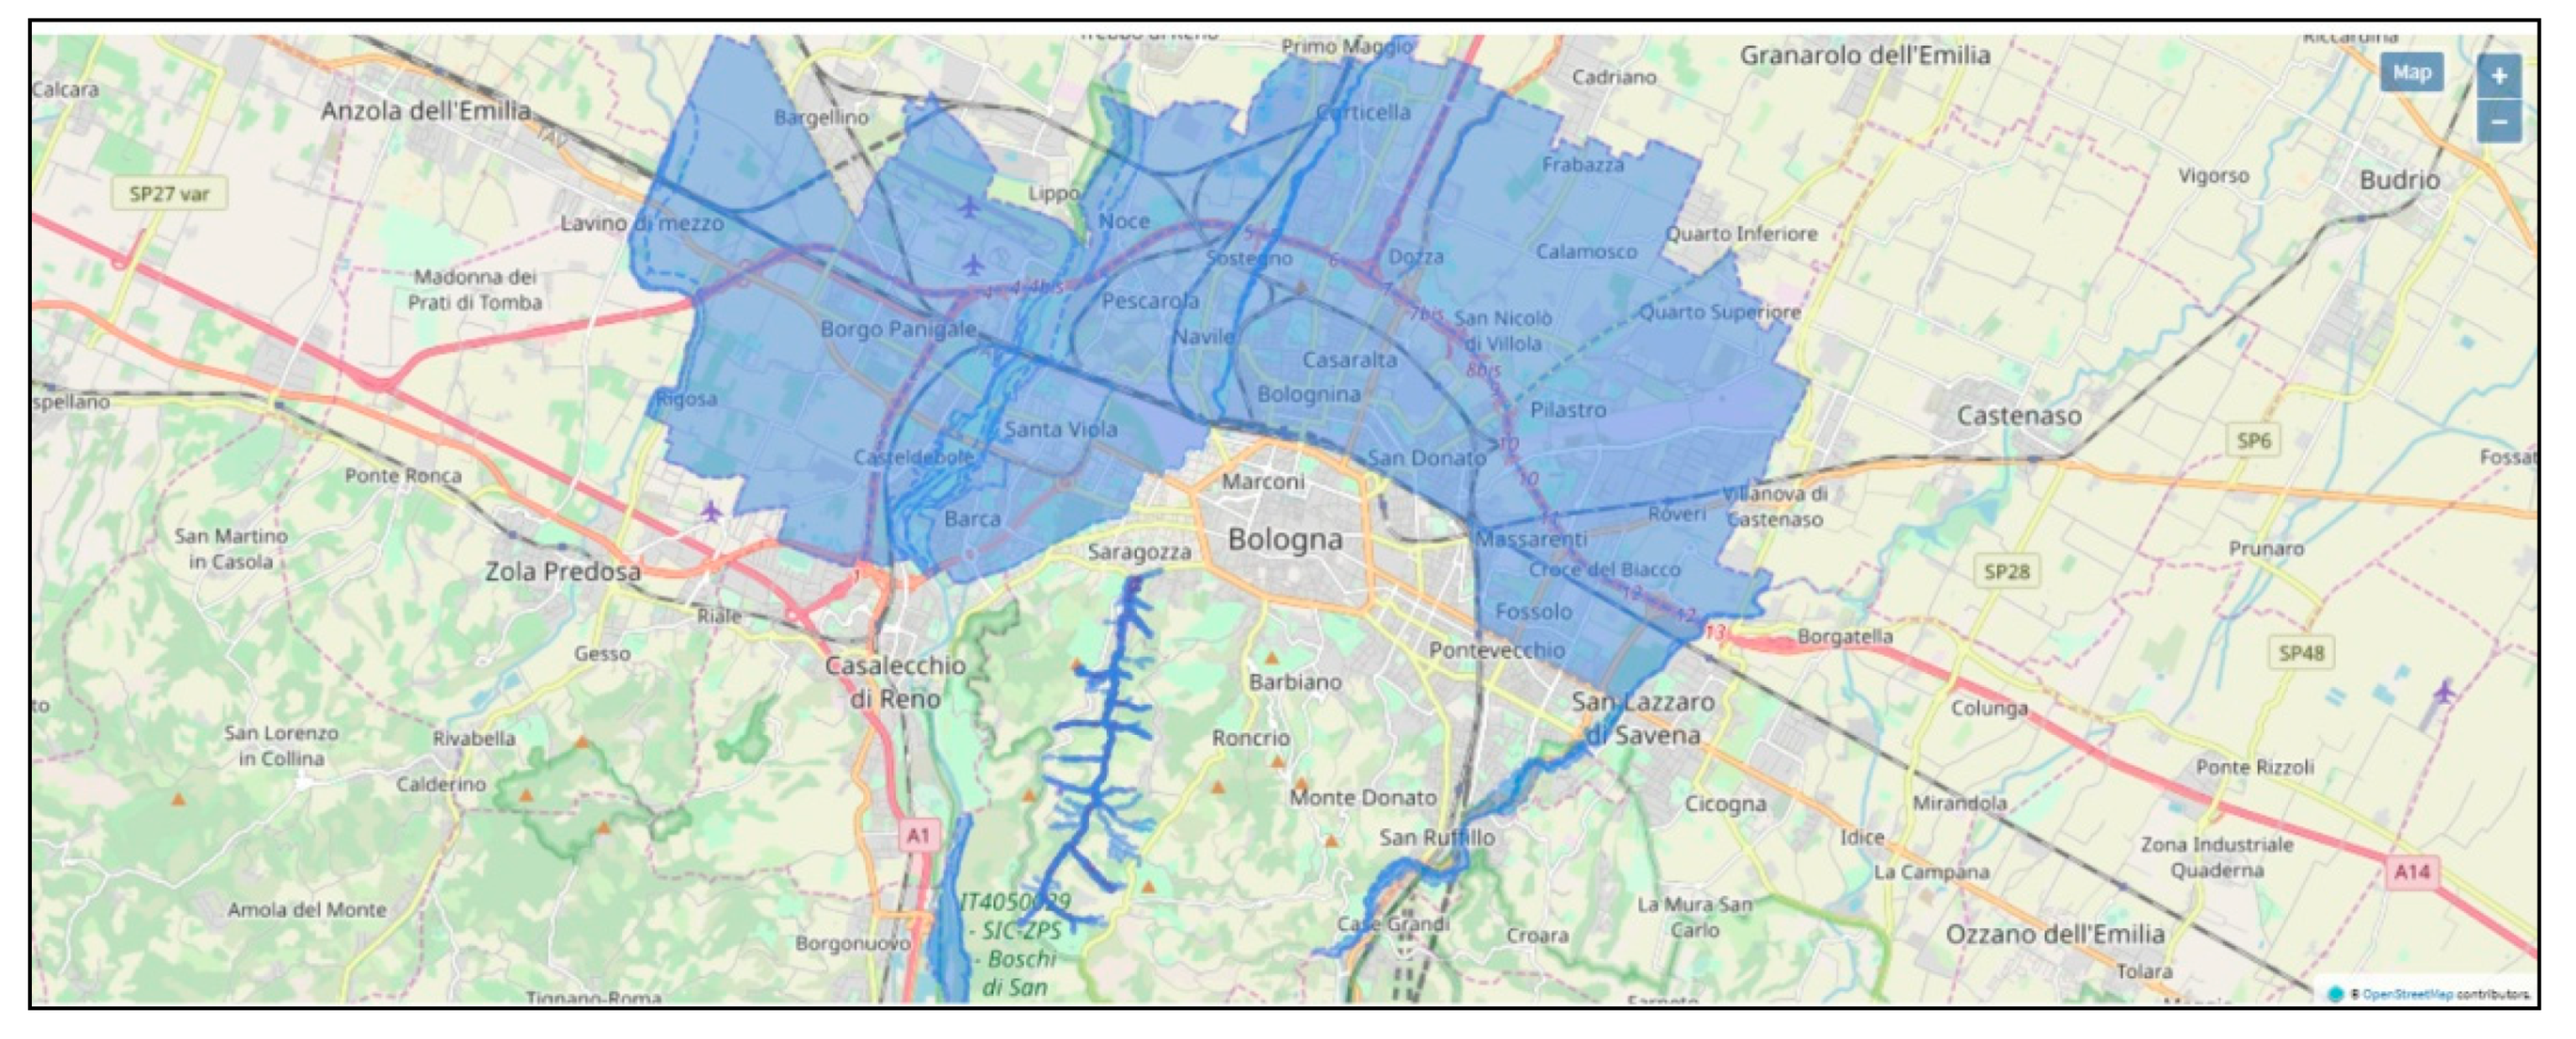
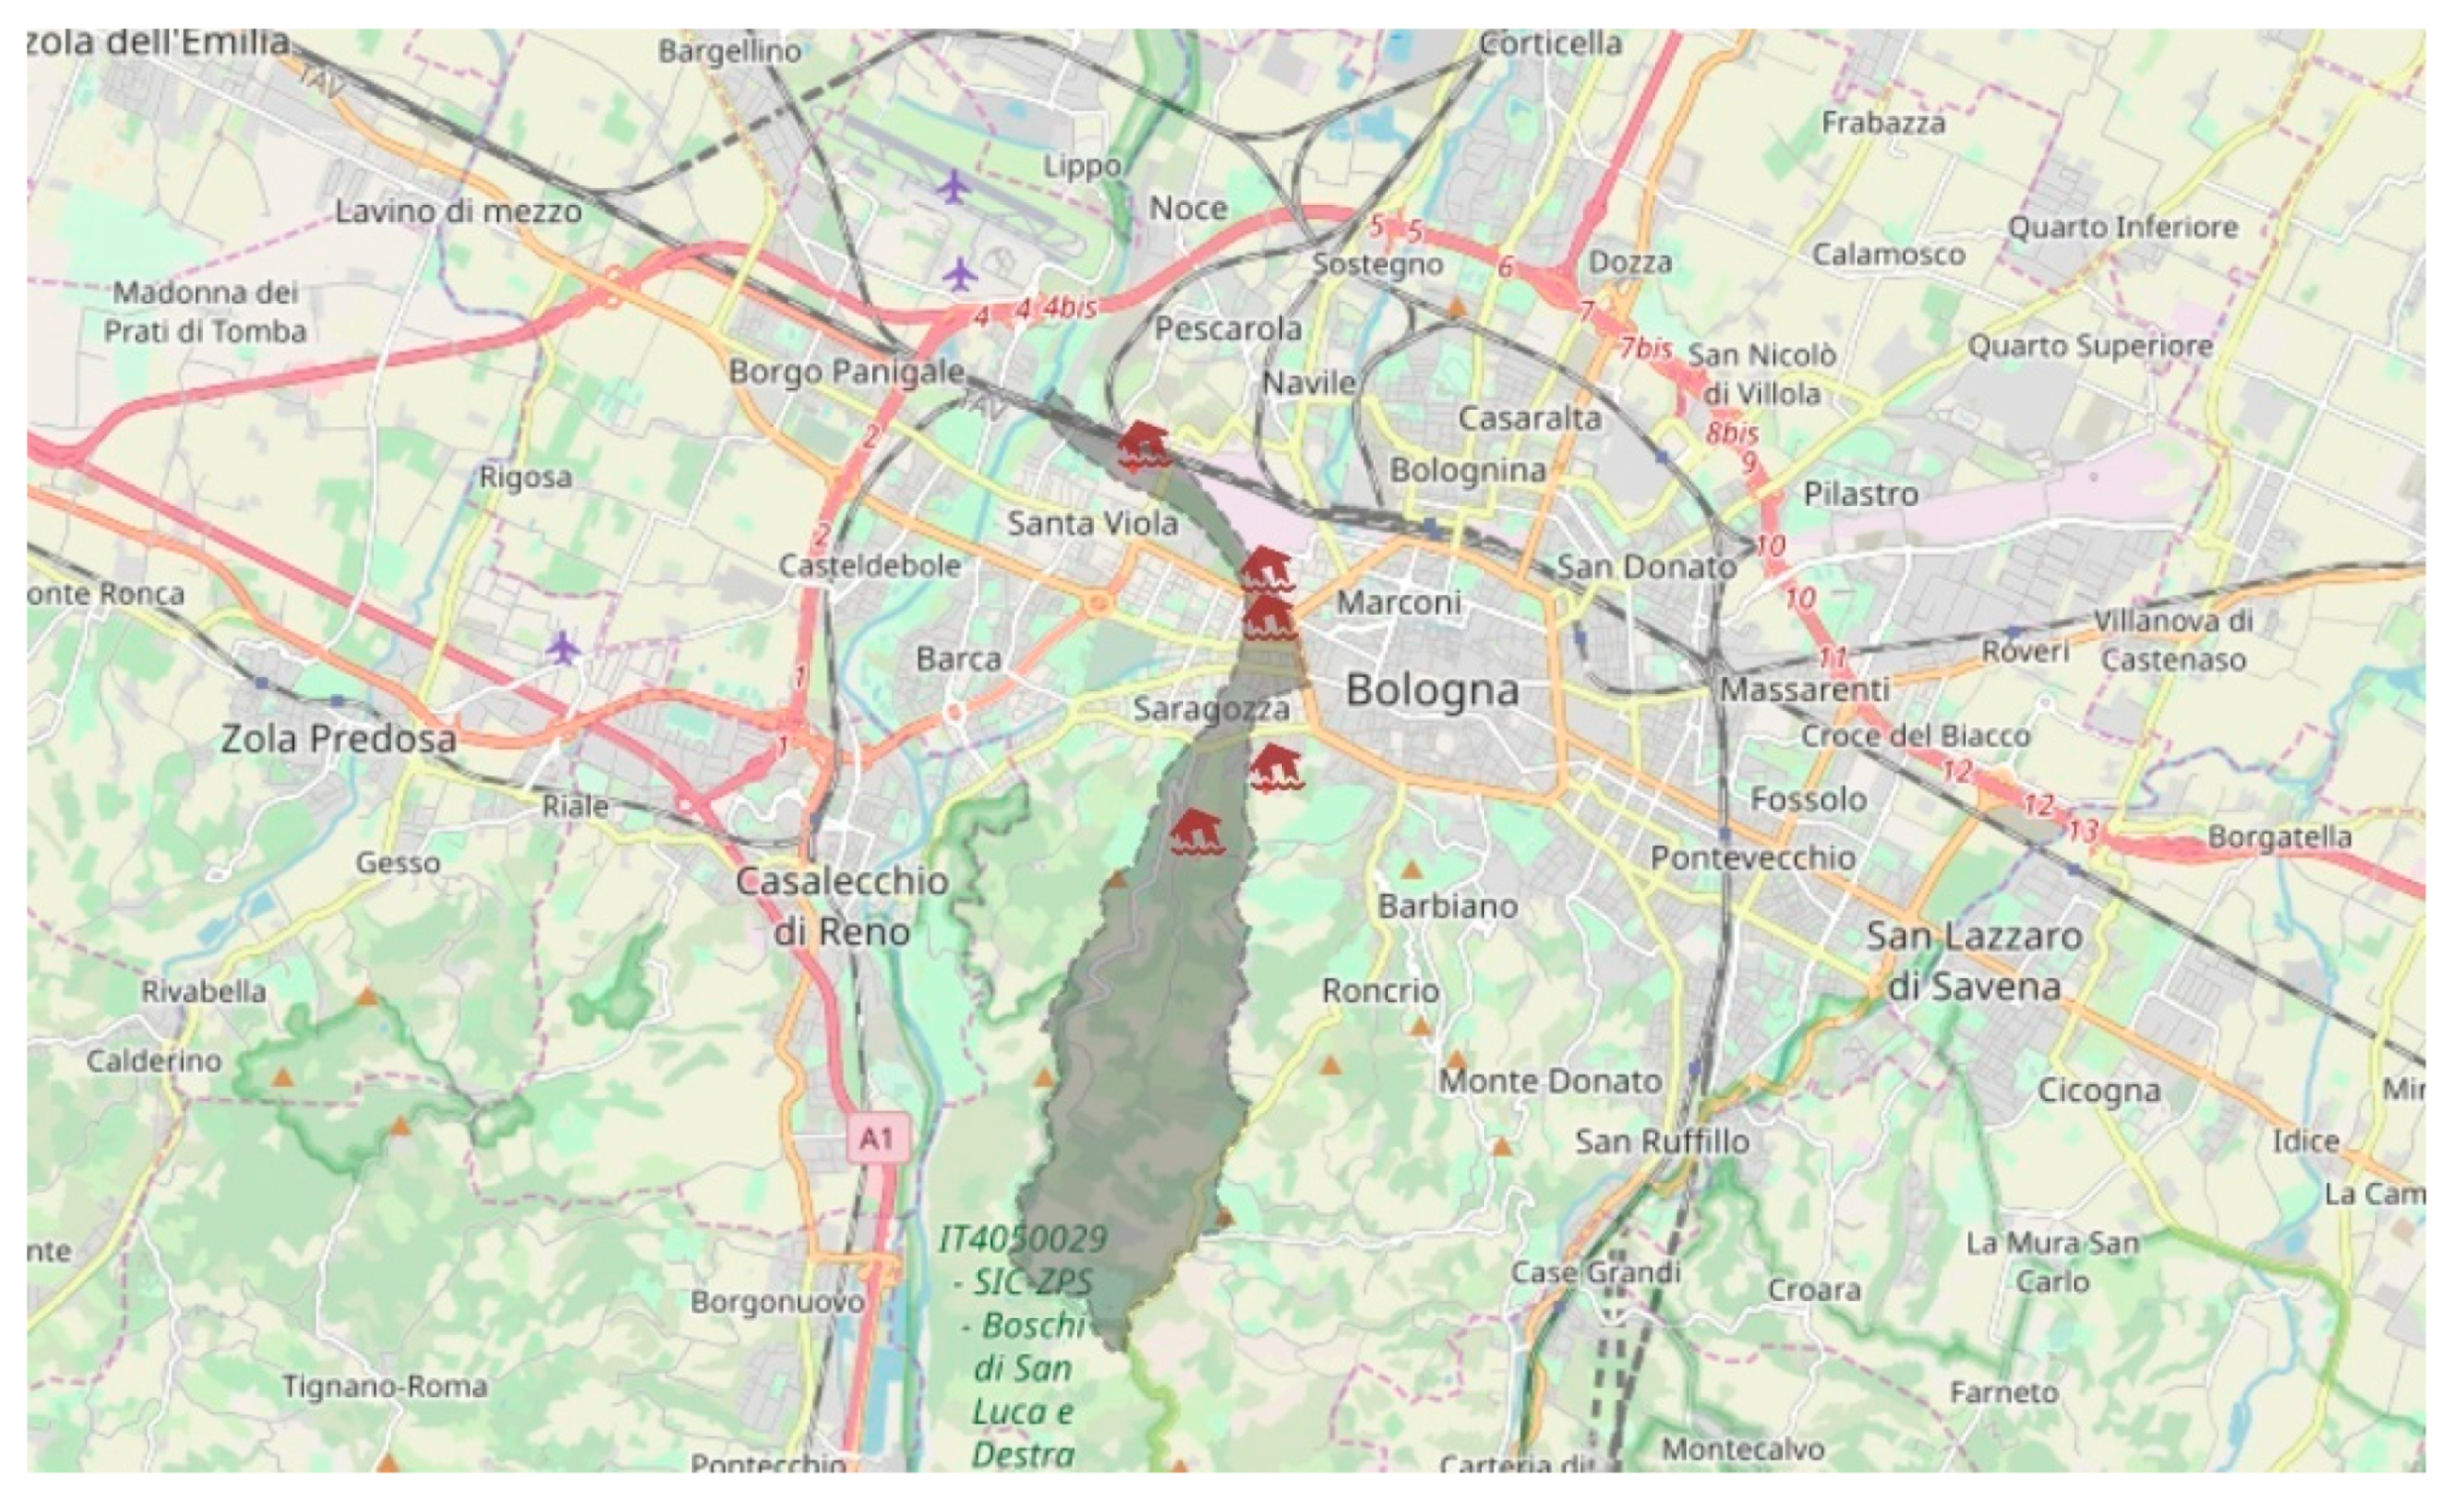
2.1.1. Ravone Catchment
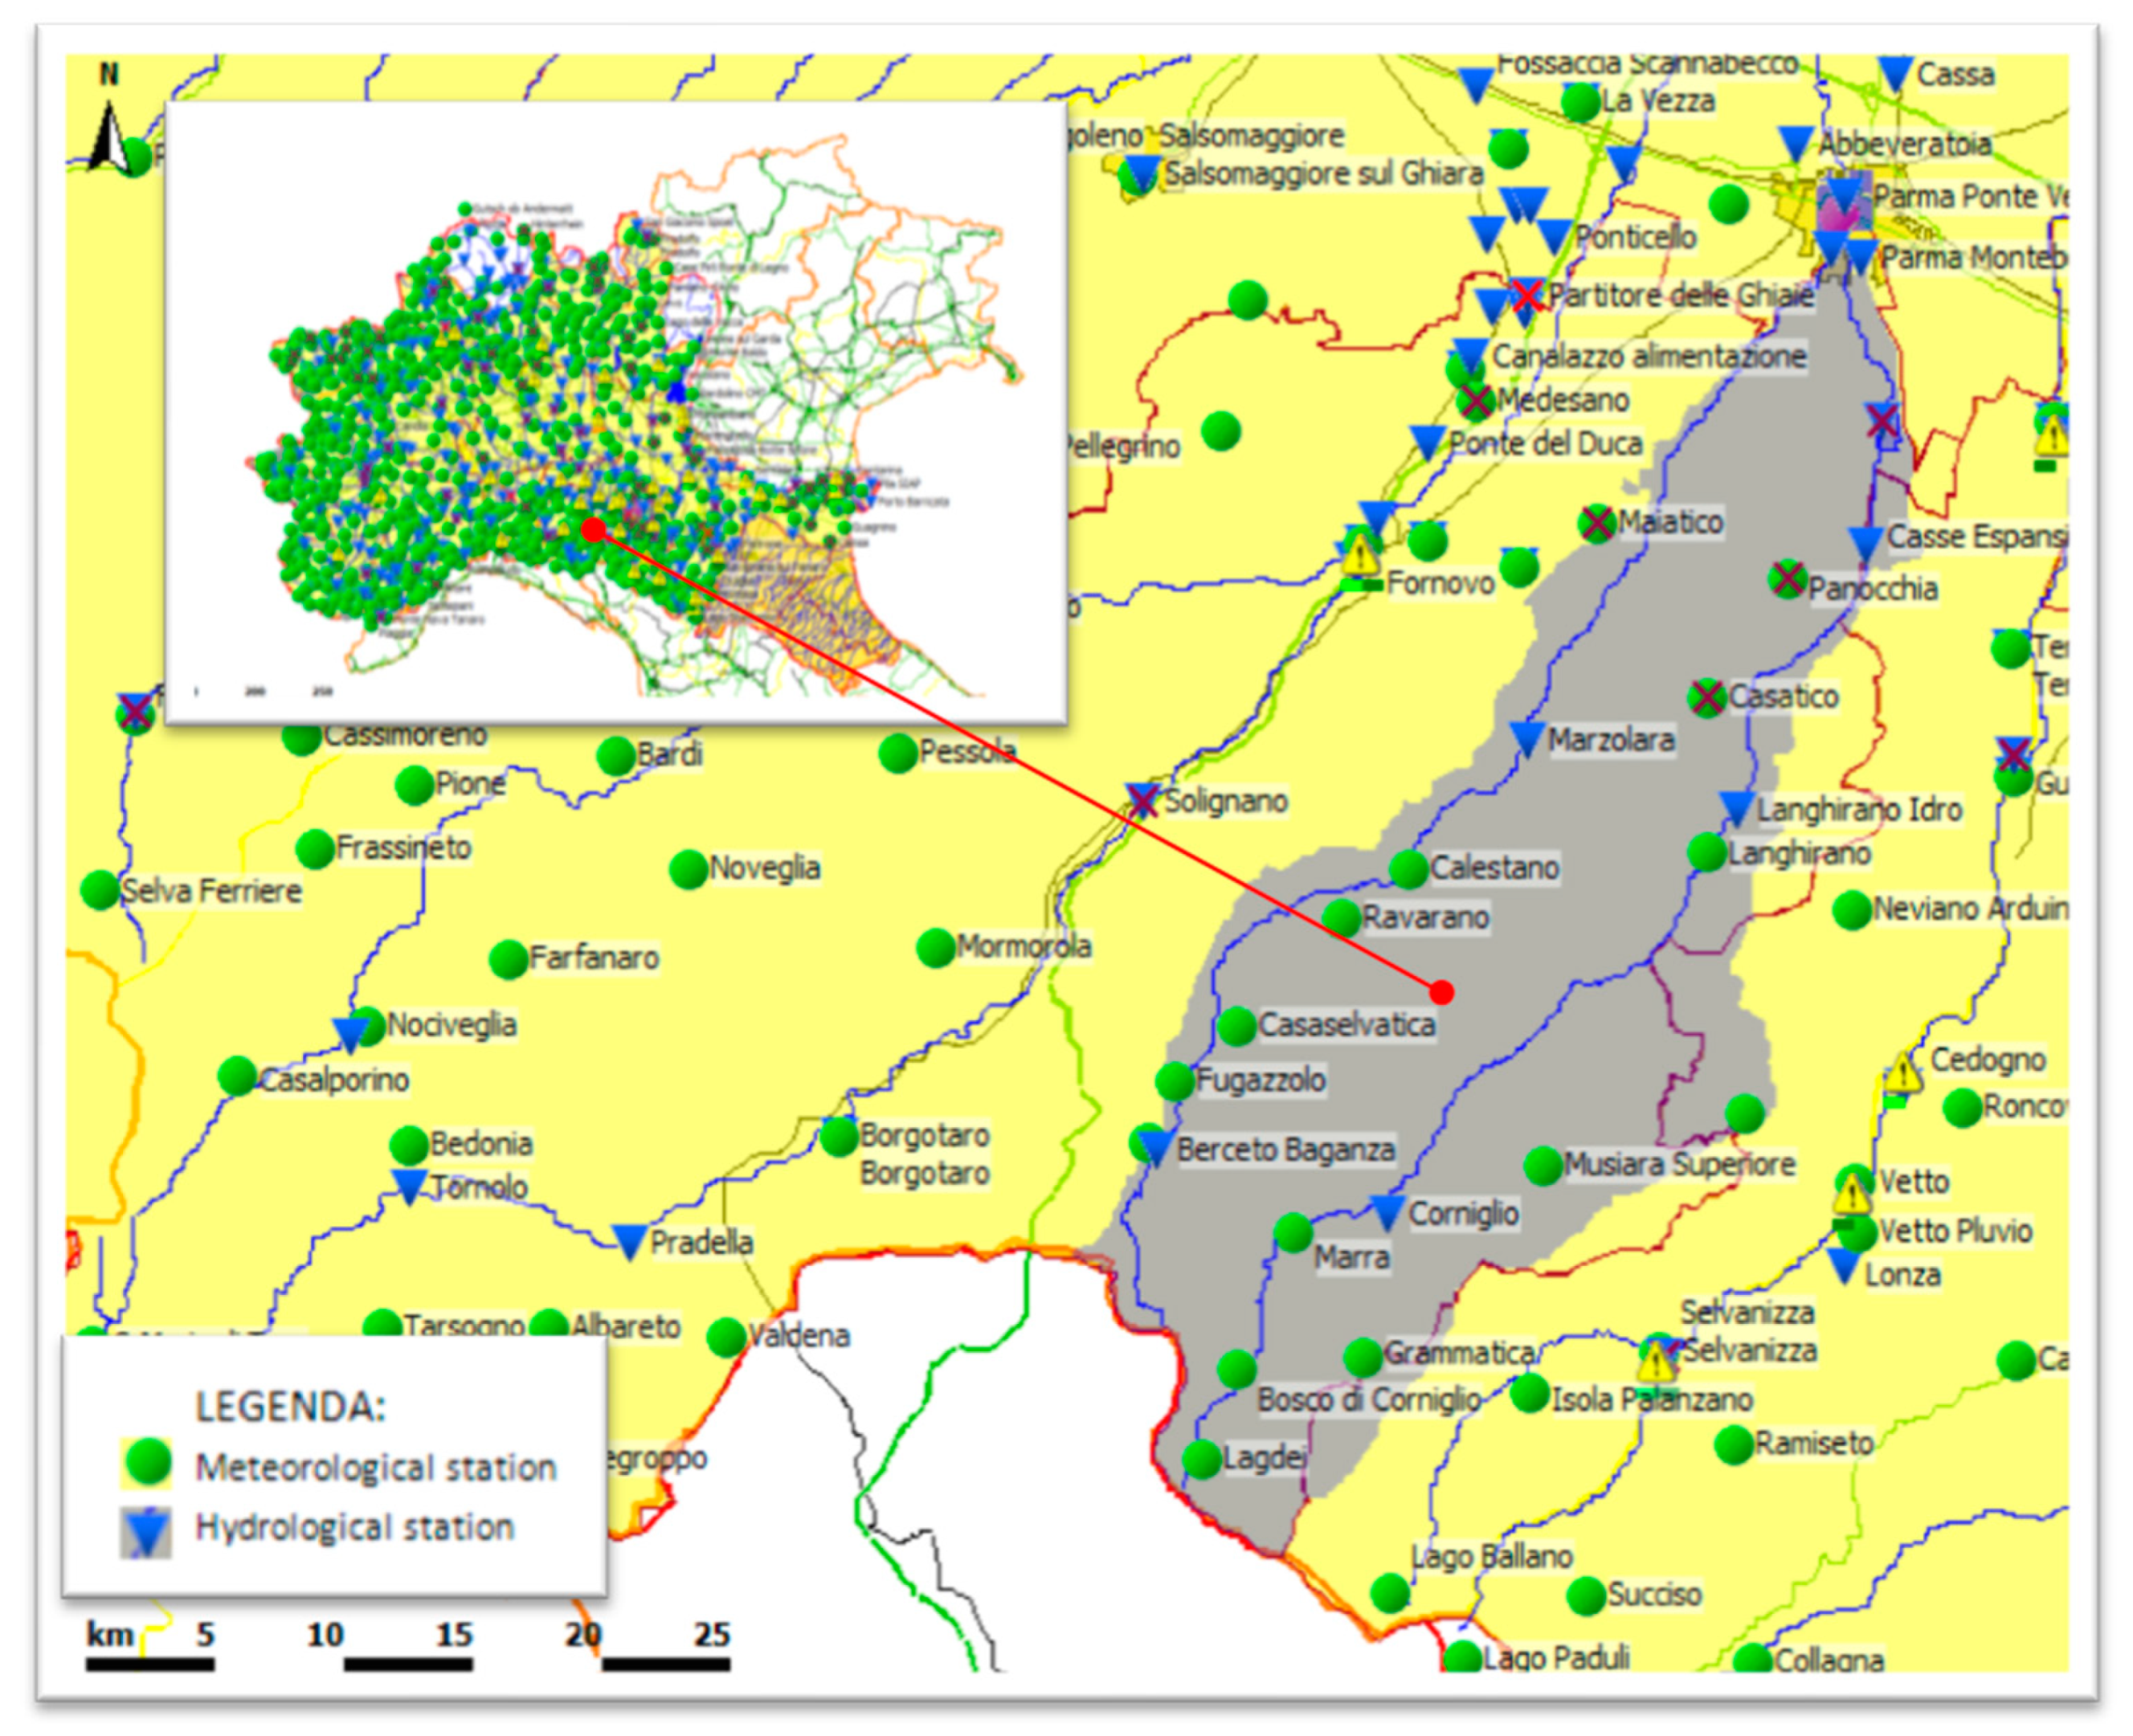
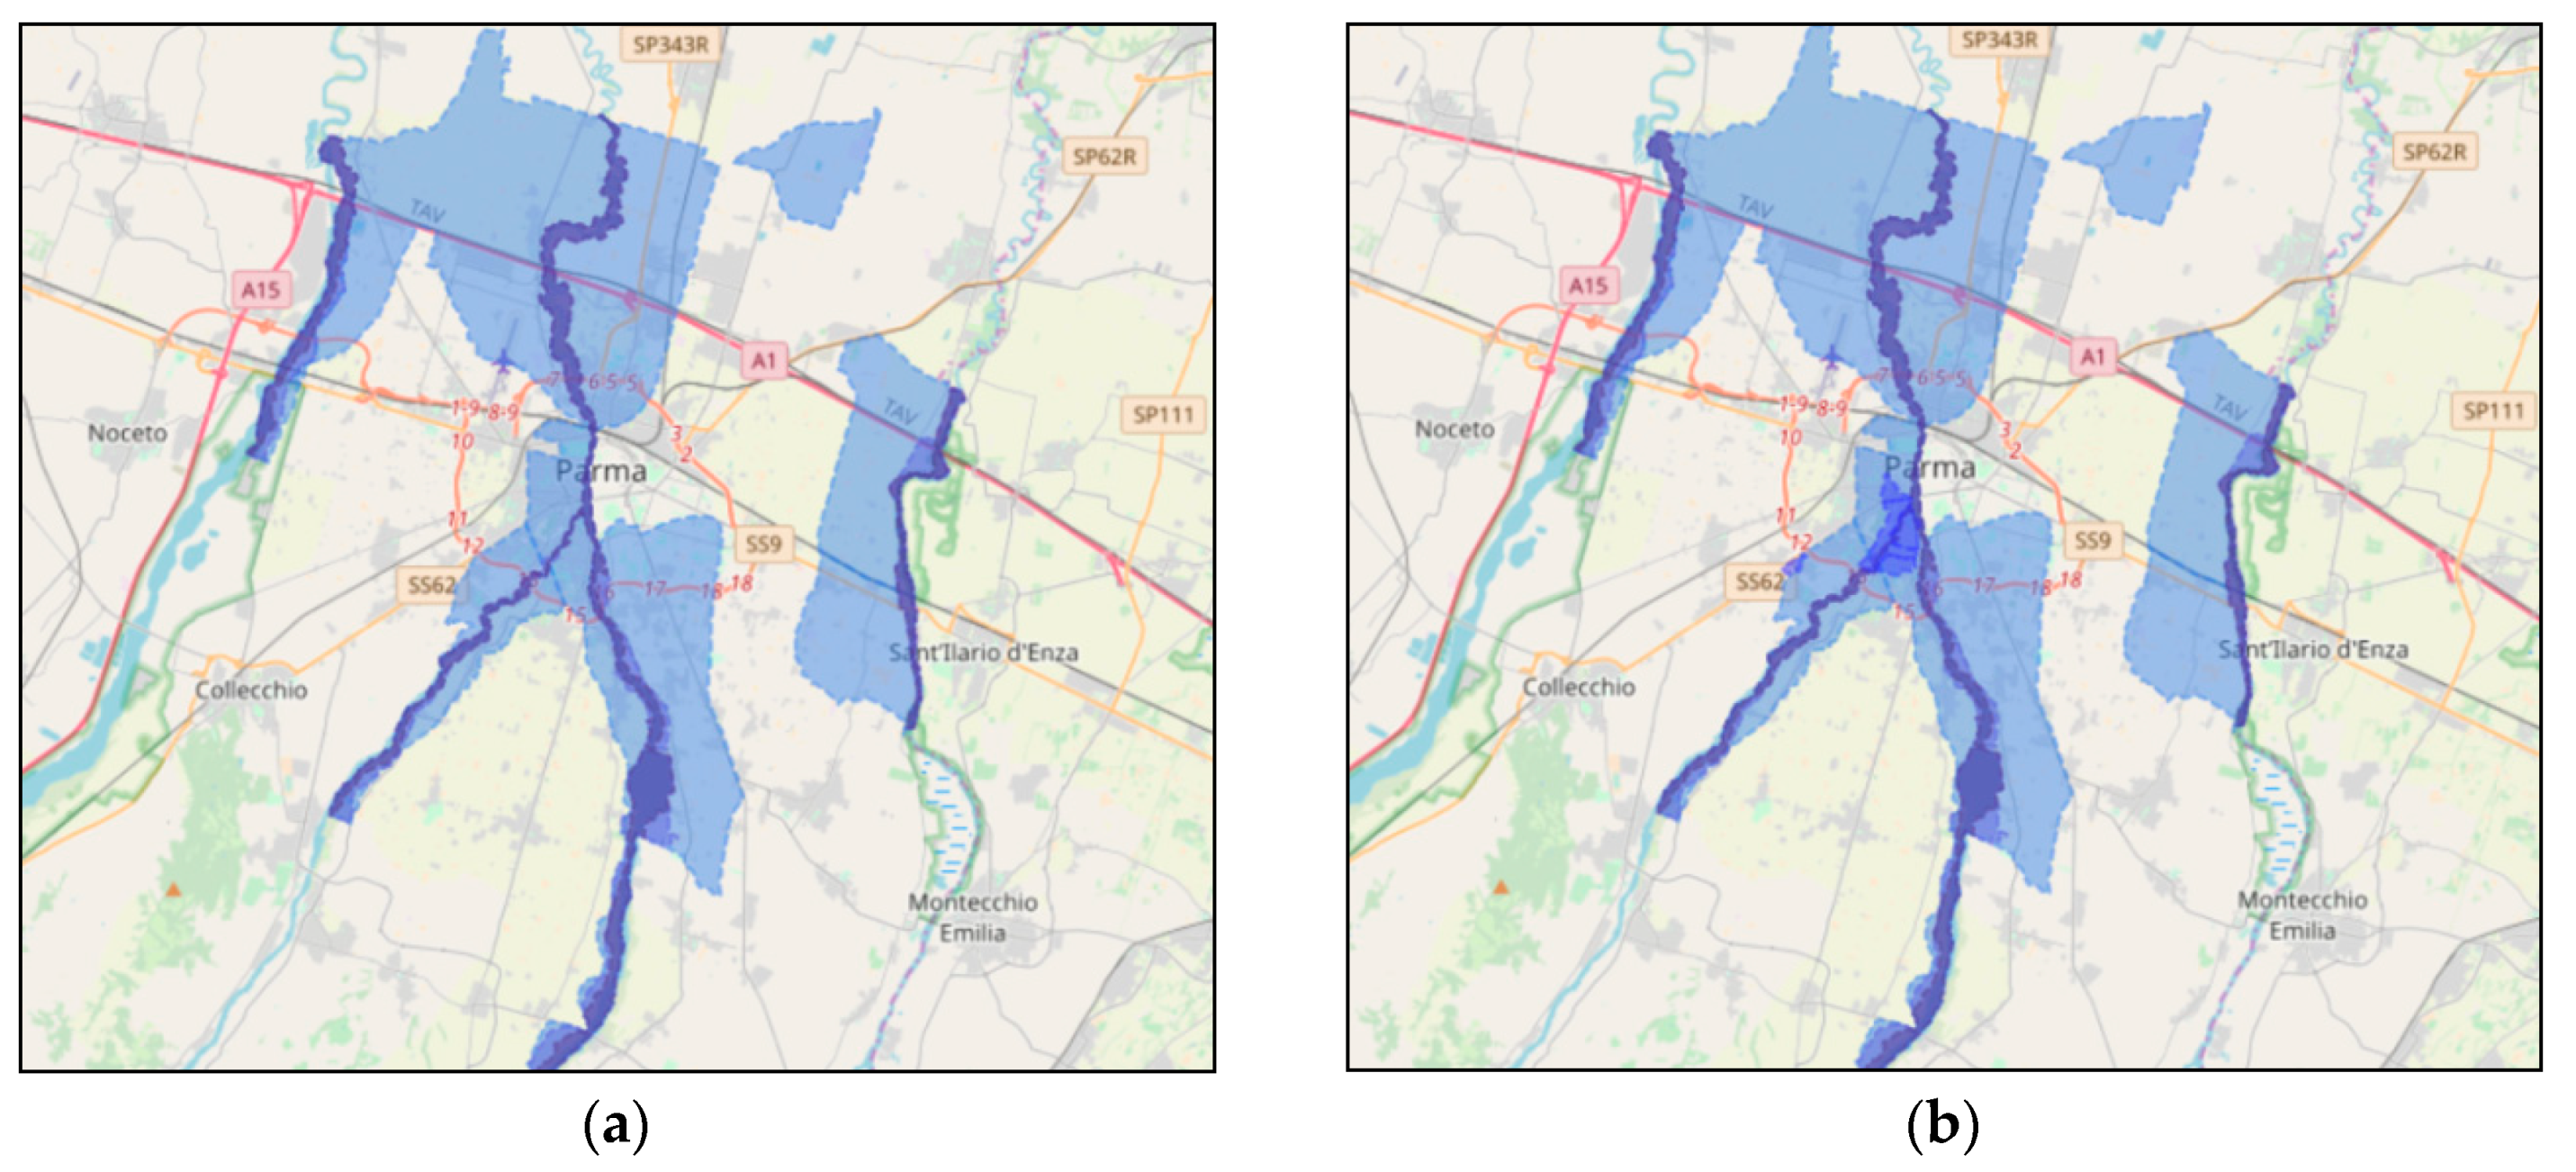
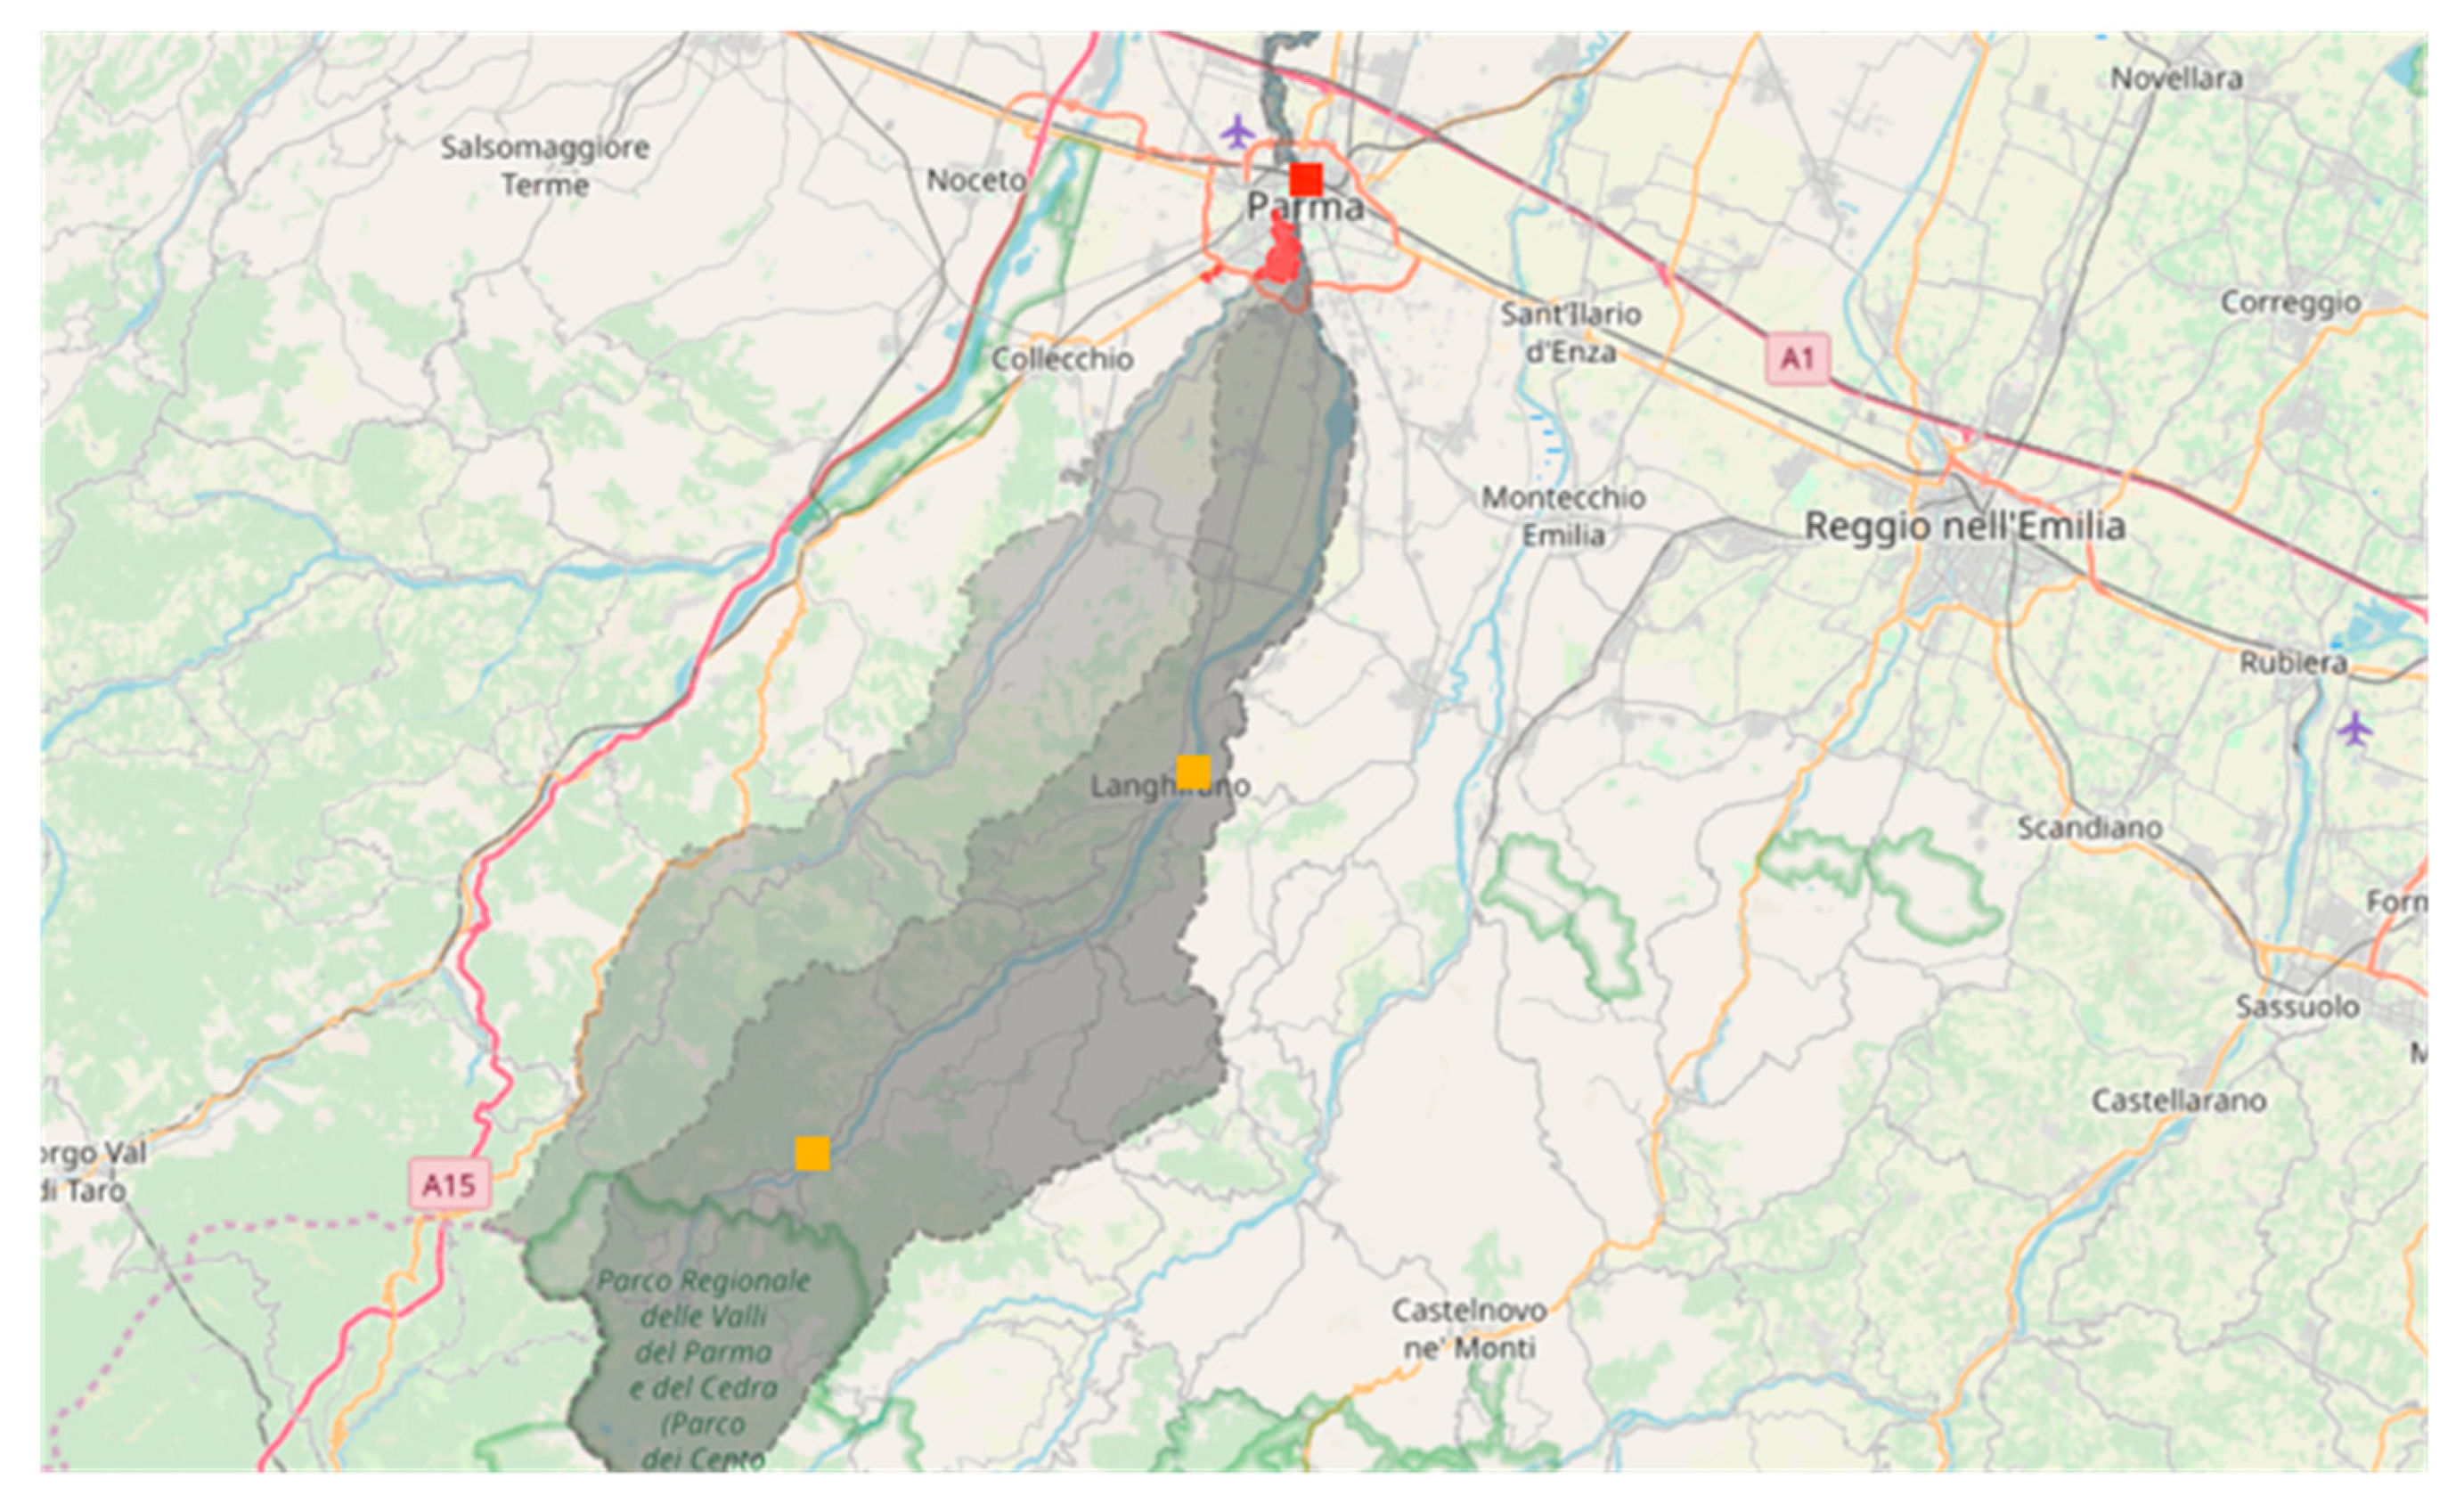
2.1.2. Parma Catchment
2.2. Background of the RainBO Project
2.2.1. Territorial Data
- Regional technical cartography (CTR) 1:5000 updated in 2013 with the topographic database (TIFF format)
- Ortho-photo Agea2014 (TIFF format) resolution 50 m
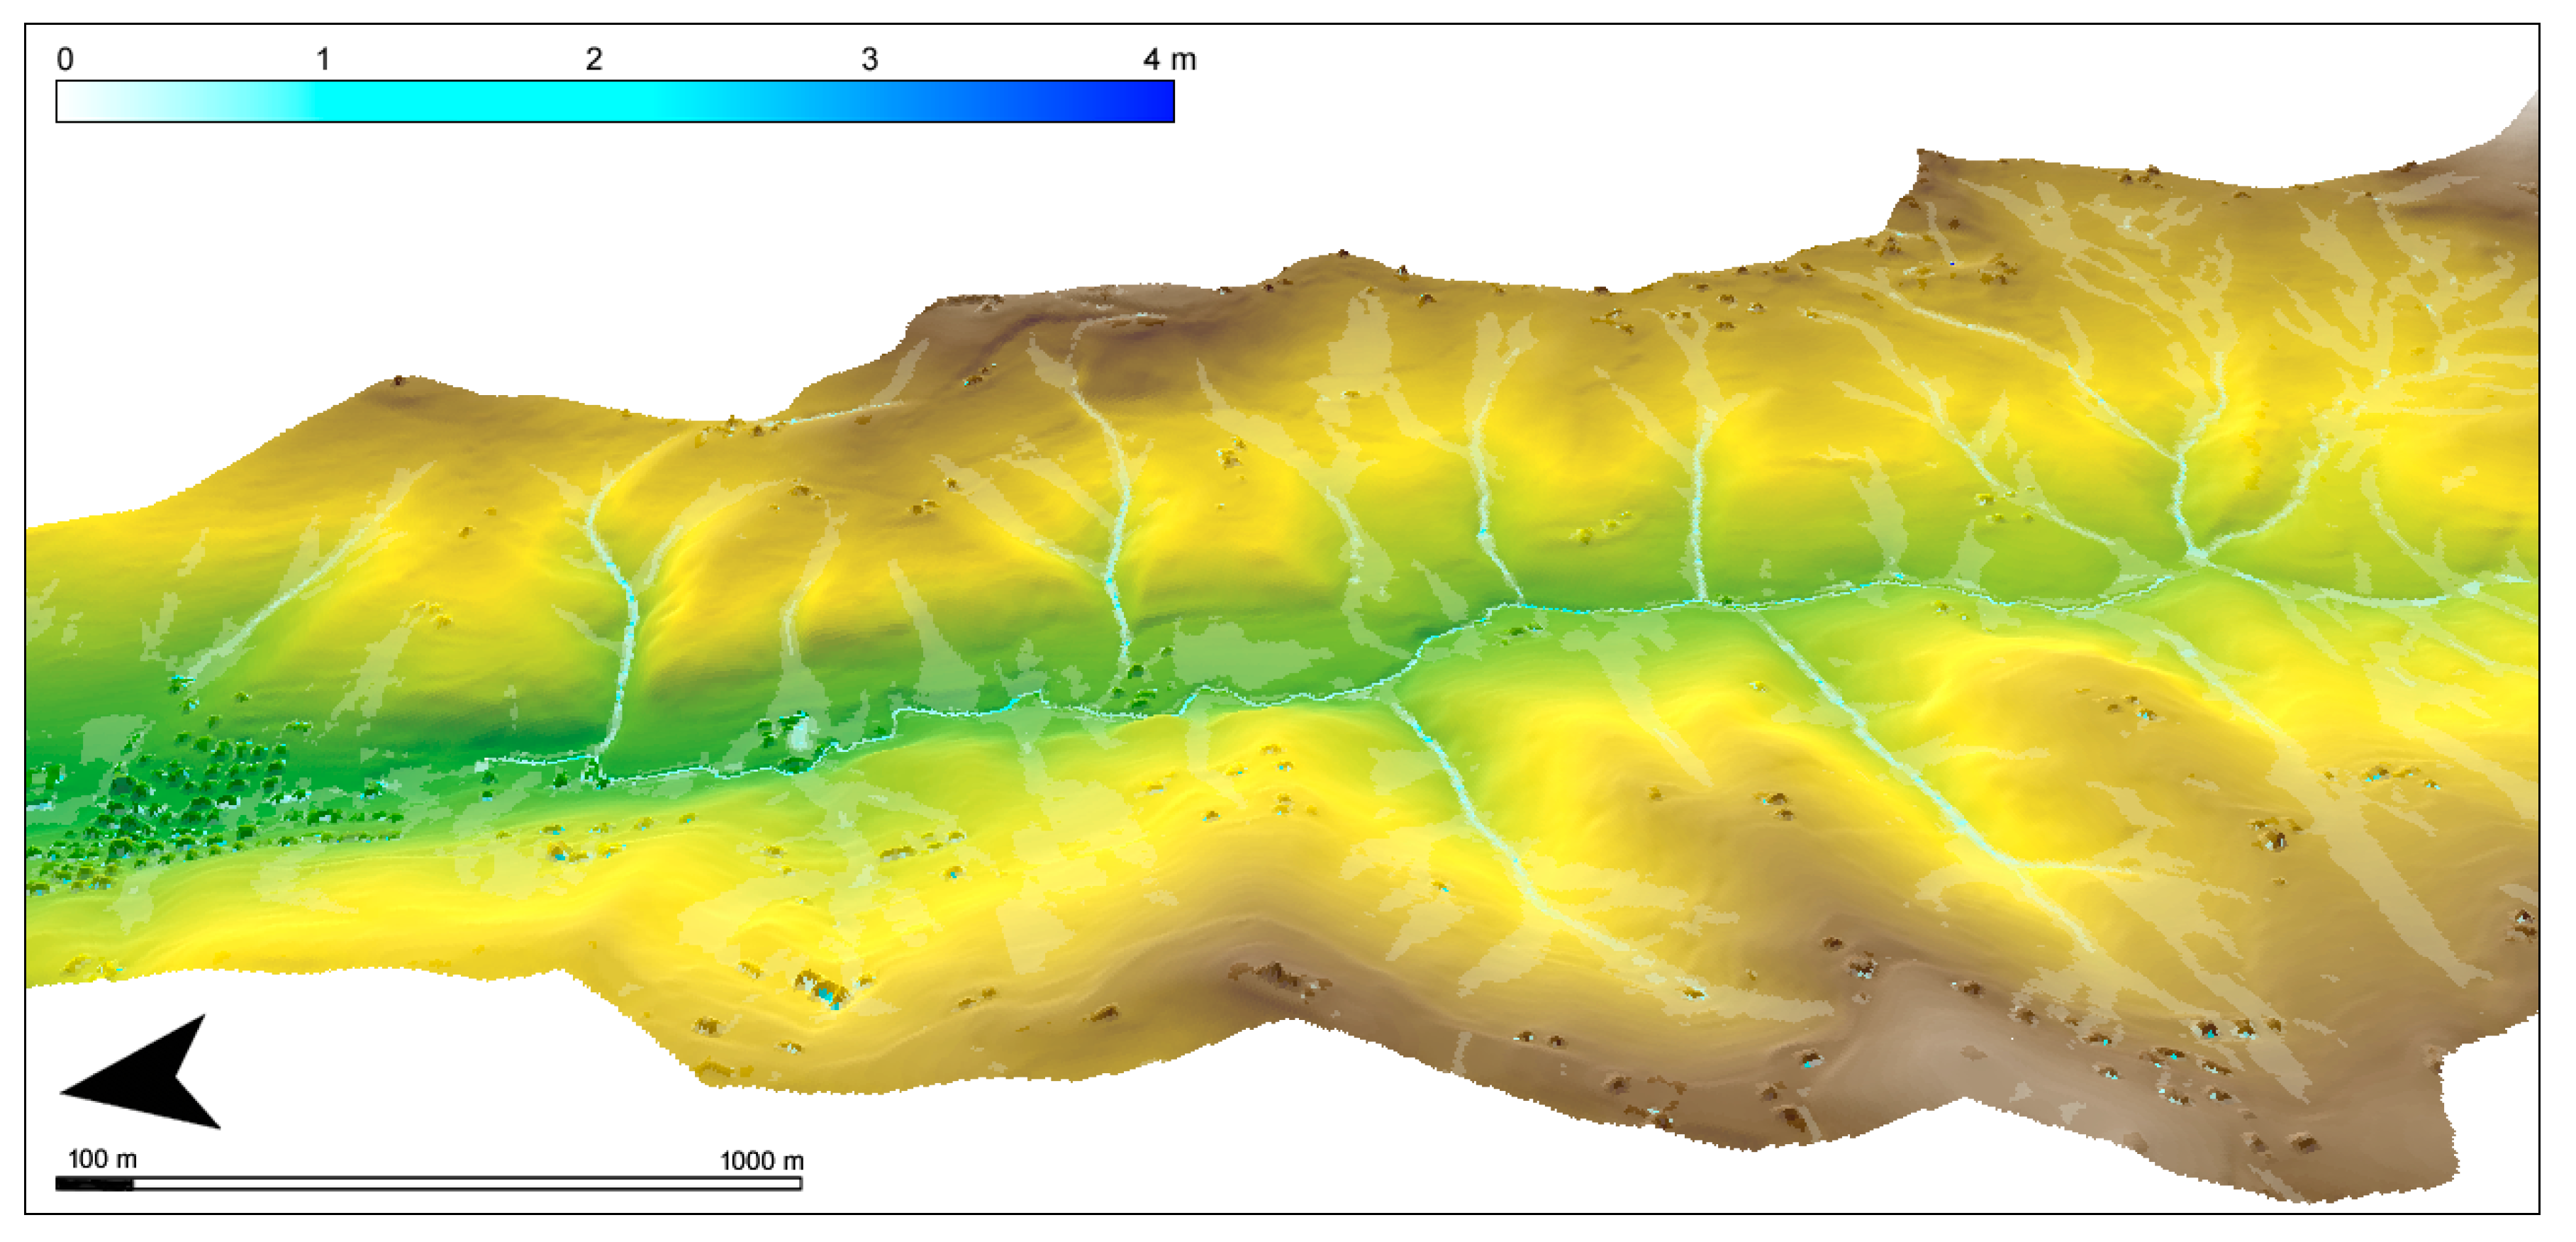
- Digital Surface Model Agea2008 (TIFF format) resolution 5 m × 5 m
- Digital Terrain Model Agea2008 (TIFF format) resolution 5 m × 5 m
- River catchments from numerical data 1:10.000 (shapefile format)
- Toponymy (shapefile format) 1:5000
2.2.2. Hazard, Vulnerability, and Risk Maps
- P (Hazard): it is the probability of occurrence, within a certain area and in a certain time interval, of a natural phenomenon of assigned intensity
- E (Exposure): it represents people and/or assets (structures, infrastructures, etc.) and/or activities (economic, social, etc.) exposed to a natural event
- V (vulnerability): the degree of capacity (or incapacity) of a system/element to resist at the natural event
- Dp (potential damage): it is considered as the degree of foreseeable loss following a natural phenomenon of a given intensity, the function of both value and vulnerability of the exposure
- R (risk): expected number of victims, injured persons, damage to property, cultural assets e environmental, destruction or interruption of economic activities, as a result of a natural phenomenon of assigned intensity
- rare floods of extreme intensity: return time up to 500 years from the event (low probability)
- infrequent floods: return time between 100 and 200 years (average probability)
- frequent floods: return time between 20 and 50 years (high probability)
- urban areas and urban expansion areas
- industrial and technological areas
- environmental heritage and cultural assets of significant interest
- presence of critical infrastructures such as transport, communication, utility networks
- presence of public and private services: sports plant, recreational facilities, accommodation facilities
2.2.3. Historical Events
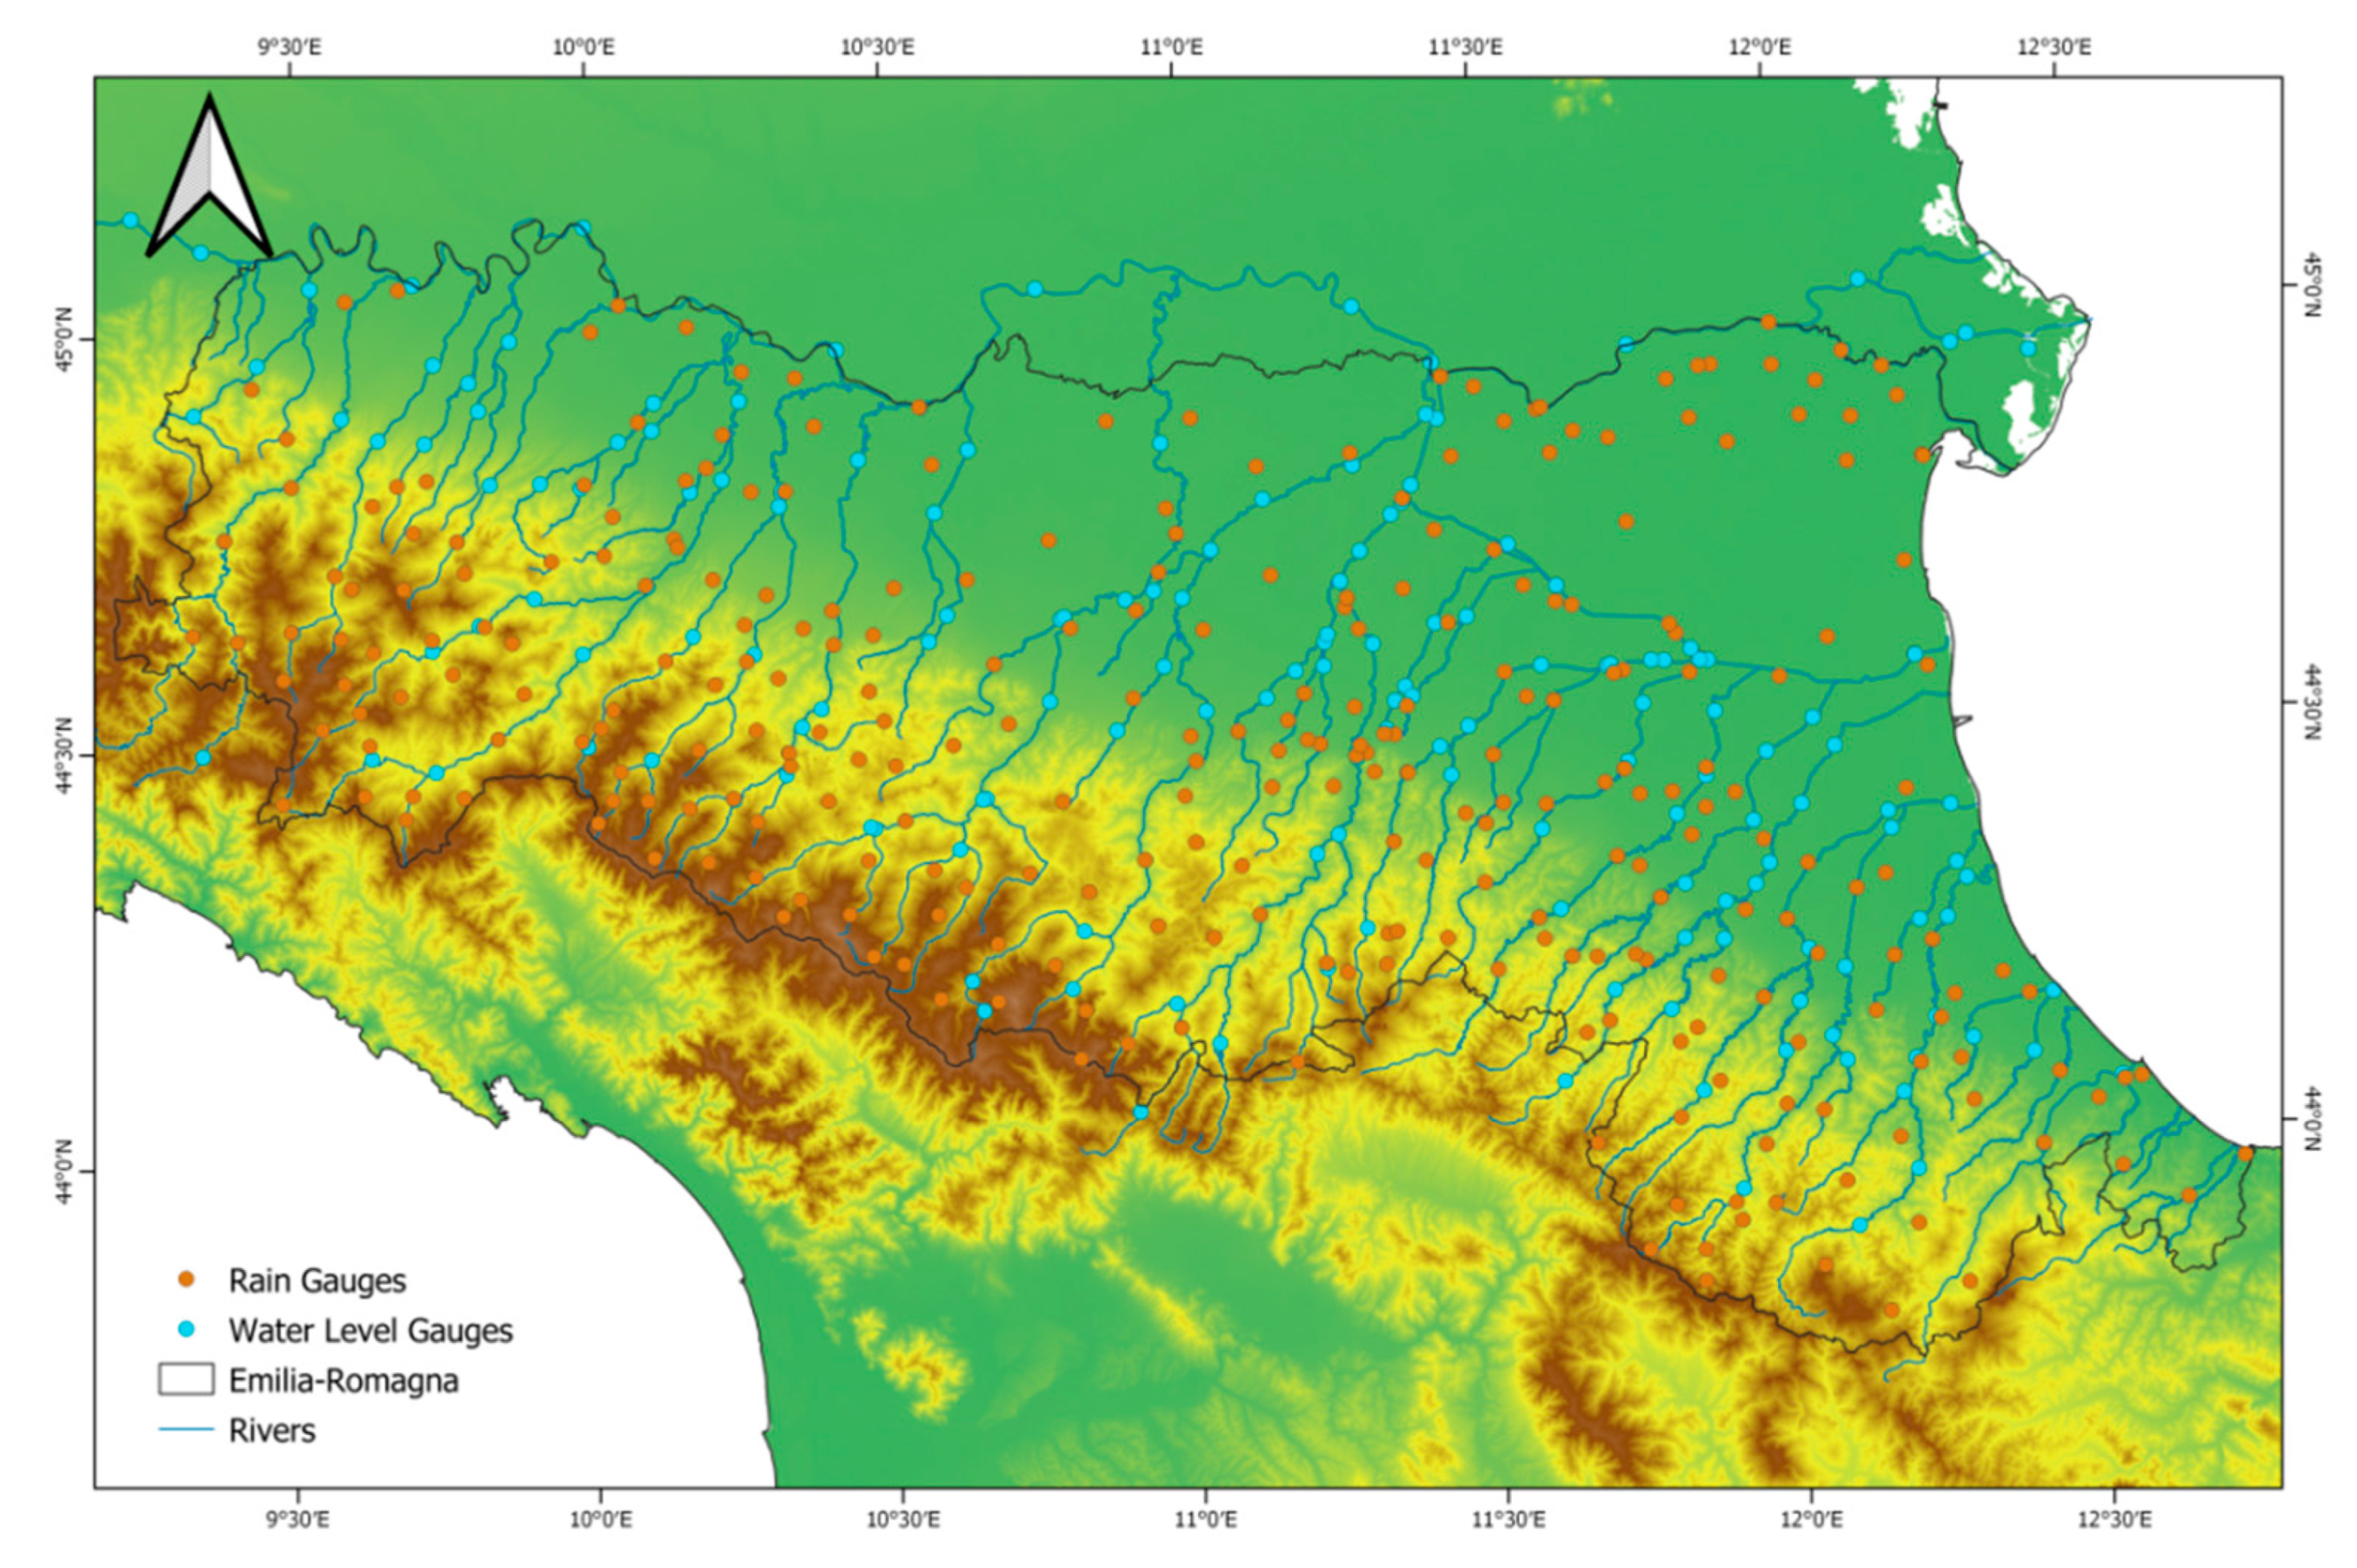
2.2.4. Observed Meteorological Data
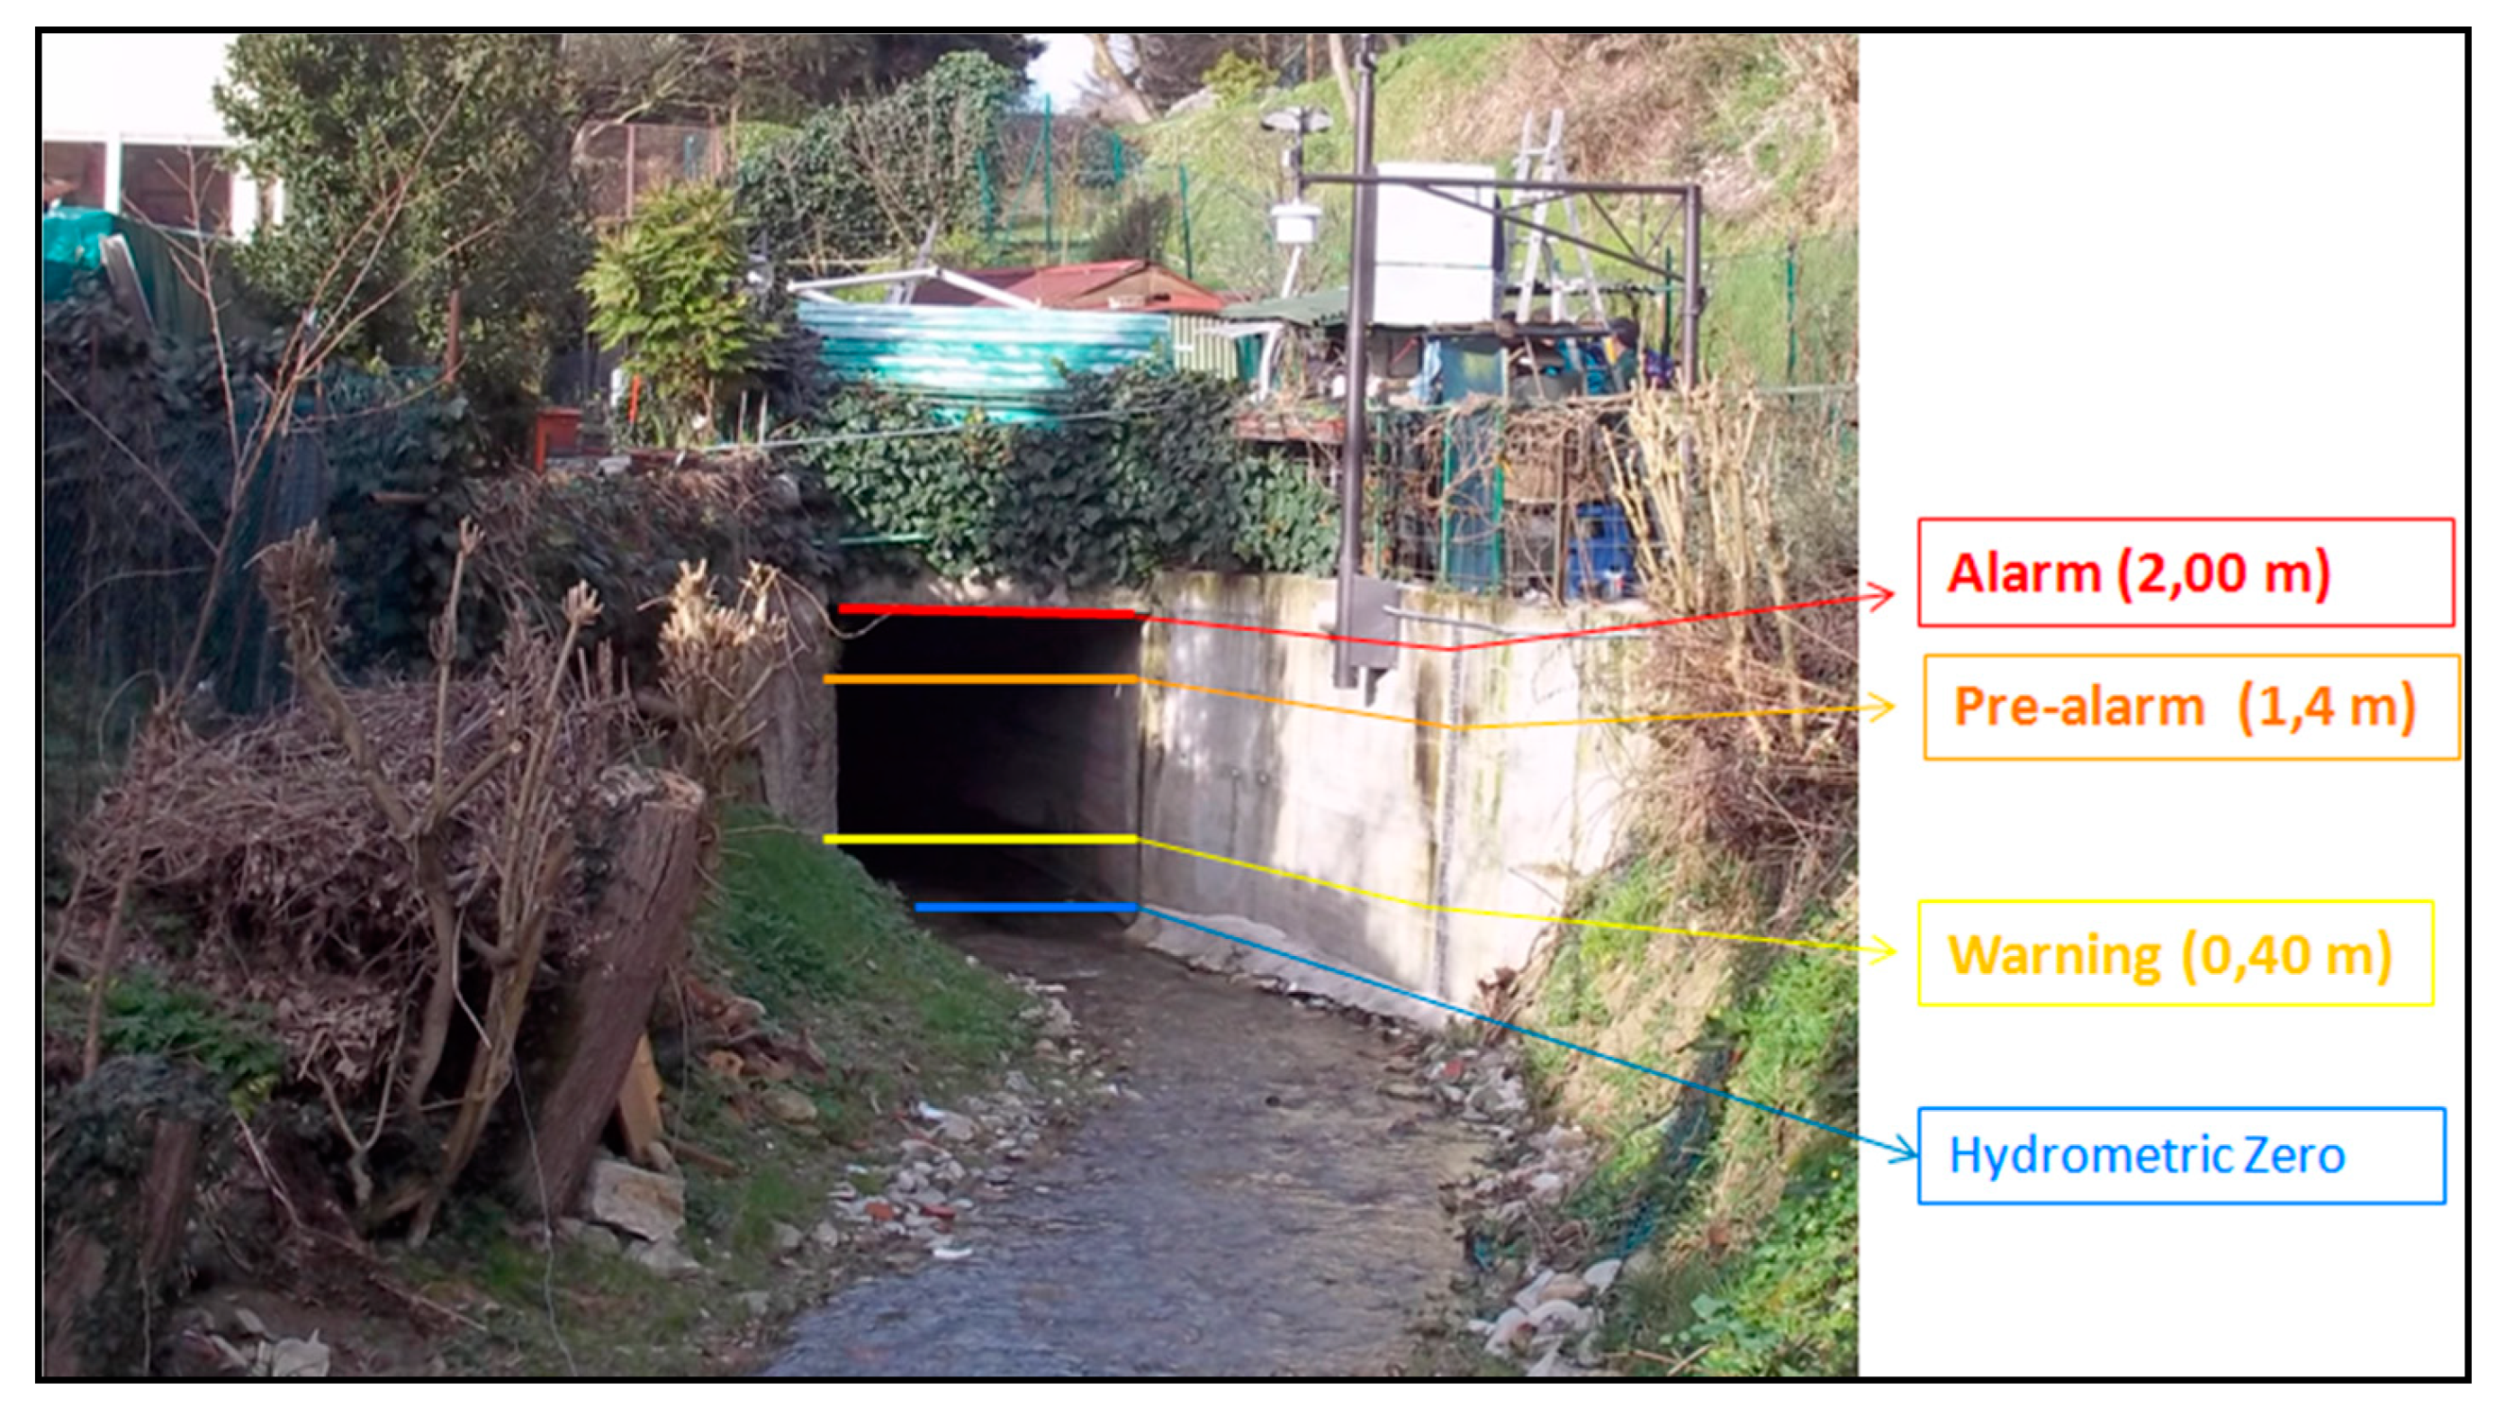
- a new real-time water level gauge has been installed in the upper part of the river basin
- a new weighing rain gauge has been located in a public property on the right side of the valley
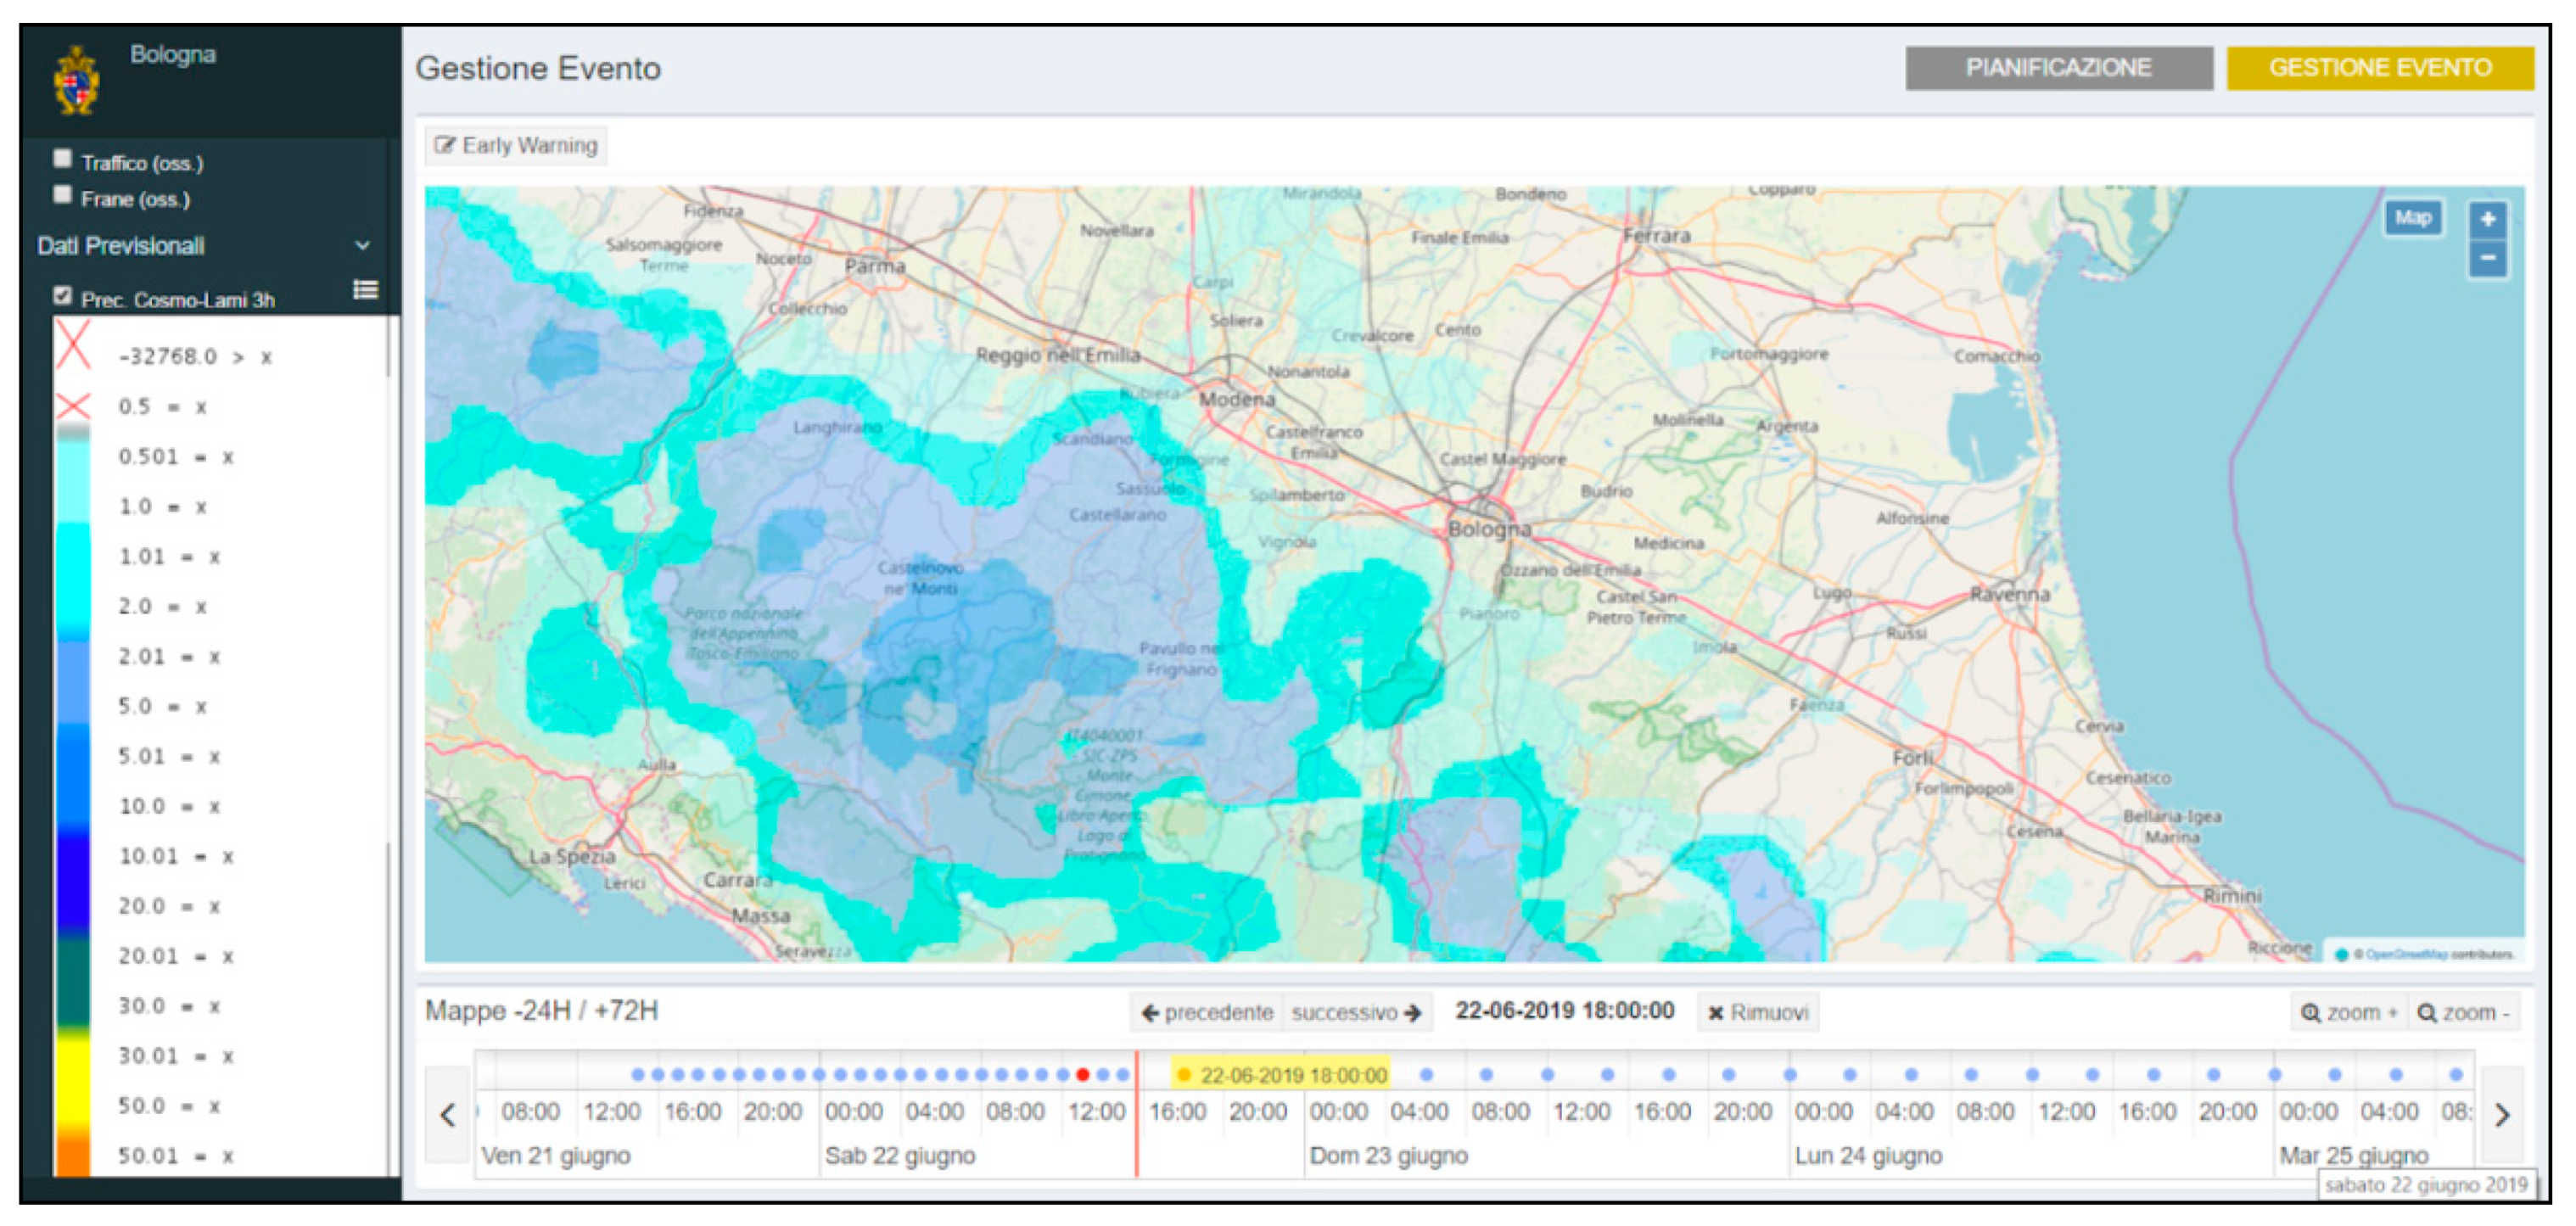
2.2.5. Forecast Meteorological Data
2.2.6. Estimated Data
2.2.7. Crowdsourcing
2.2.8. Models
- CRITERIA-1D
- CRITERIA-3D
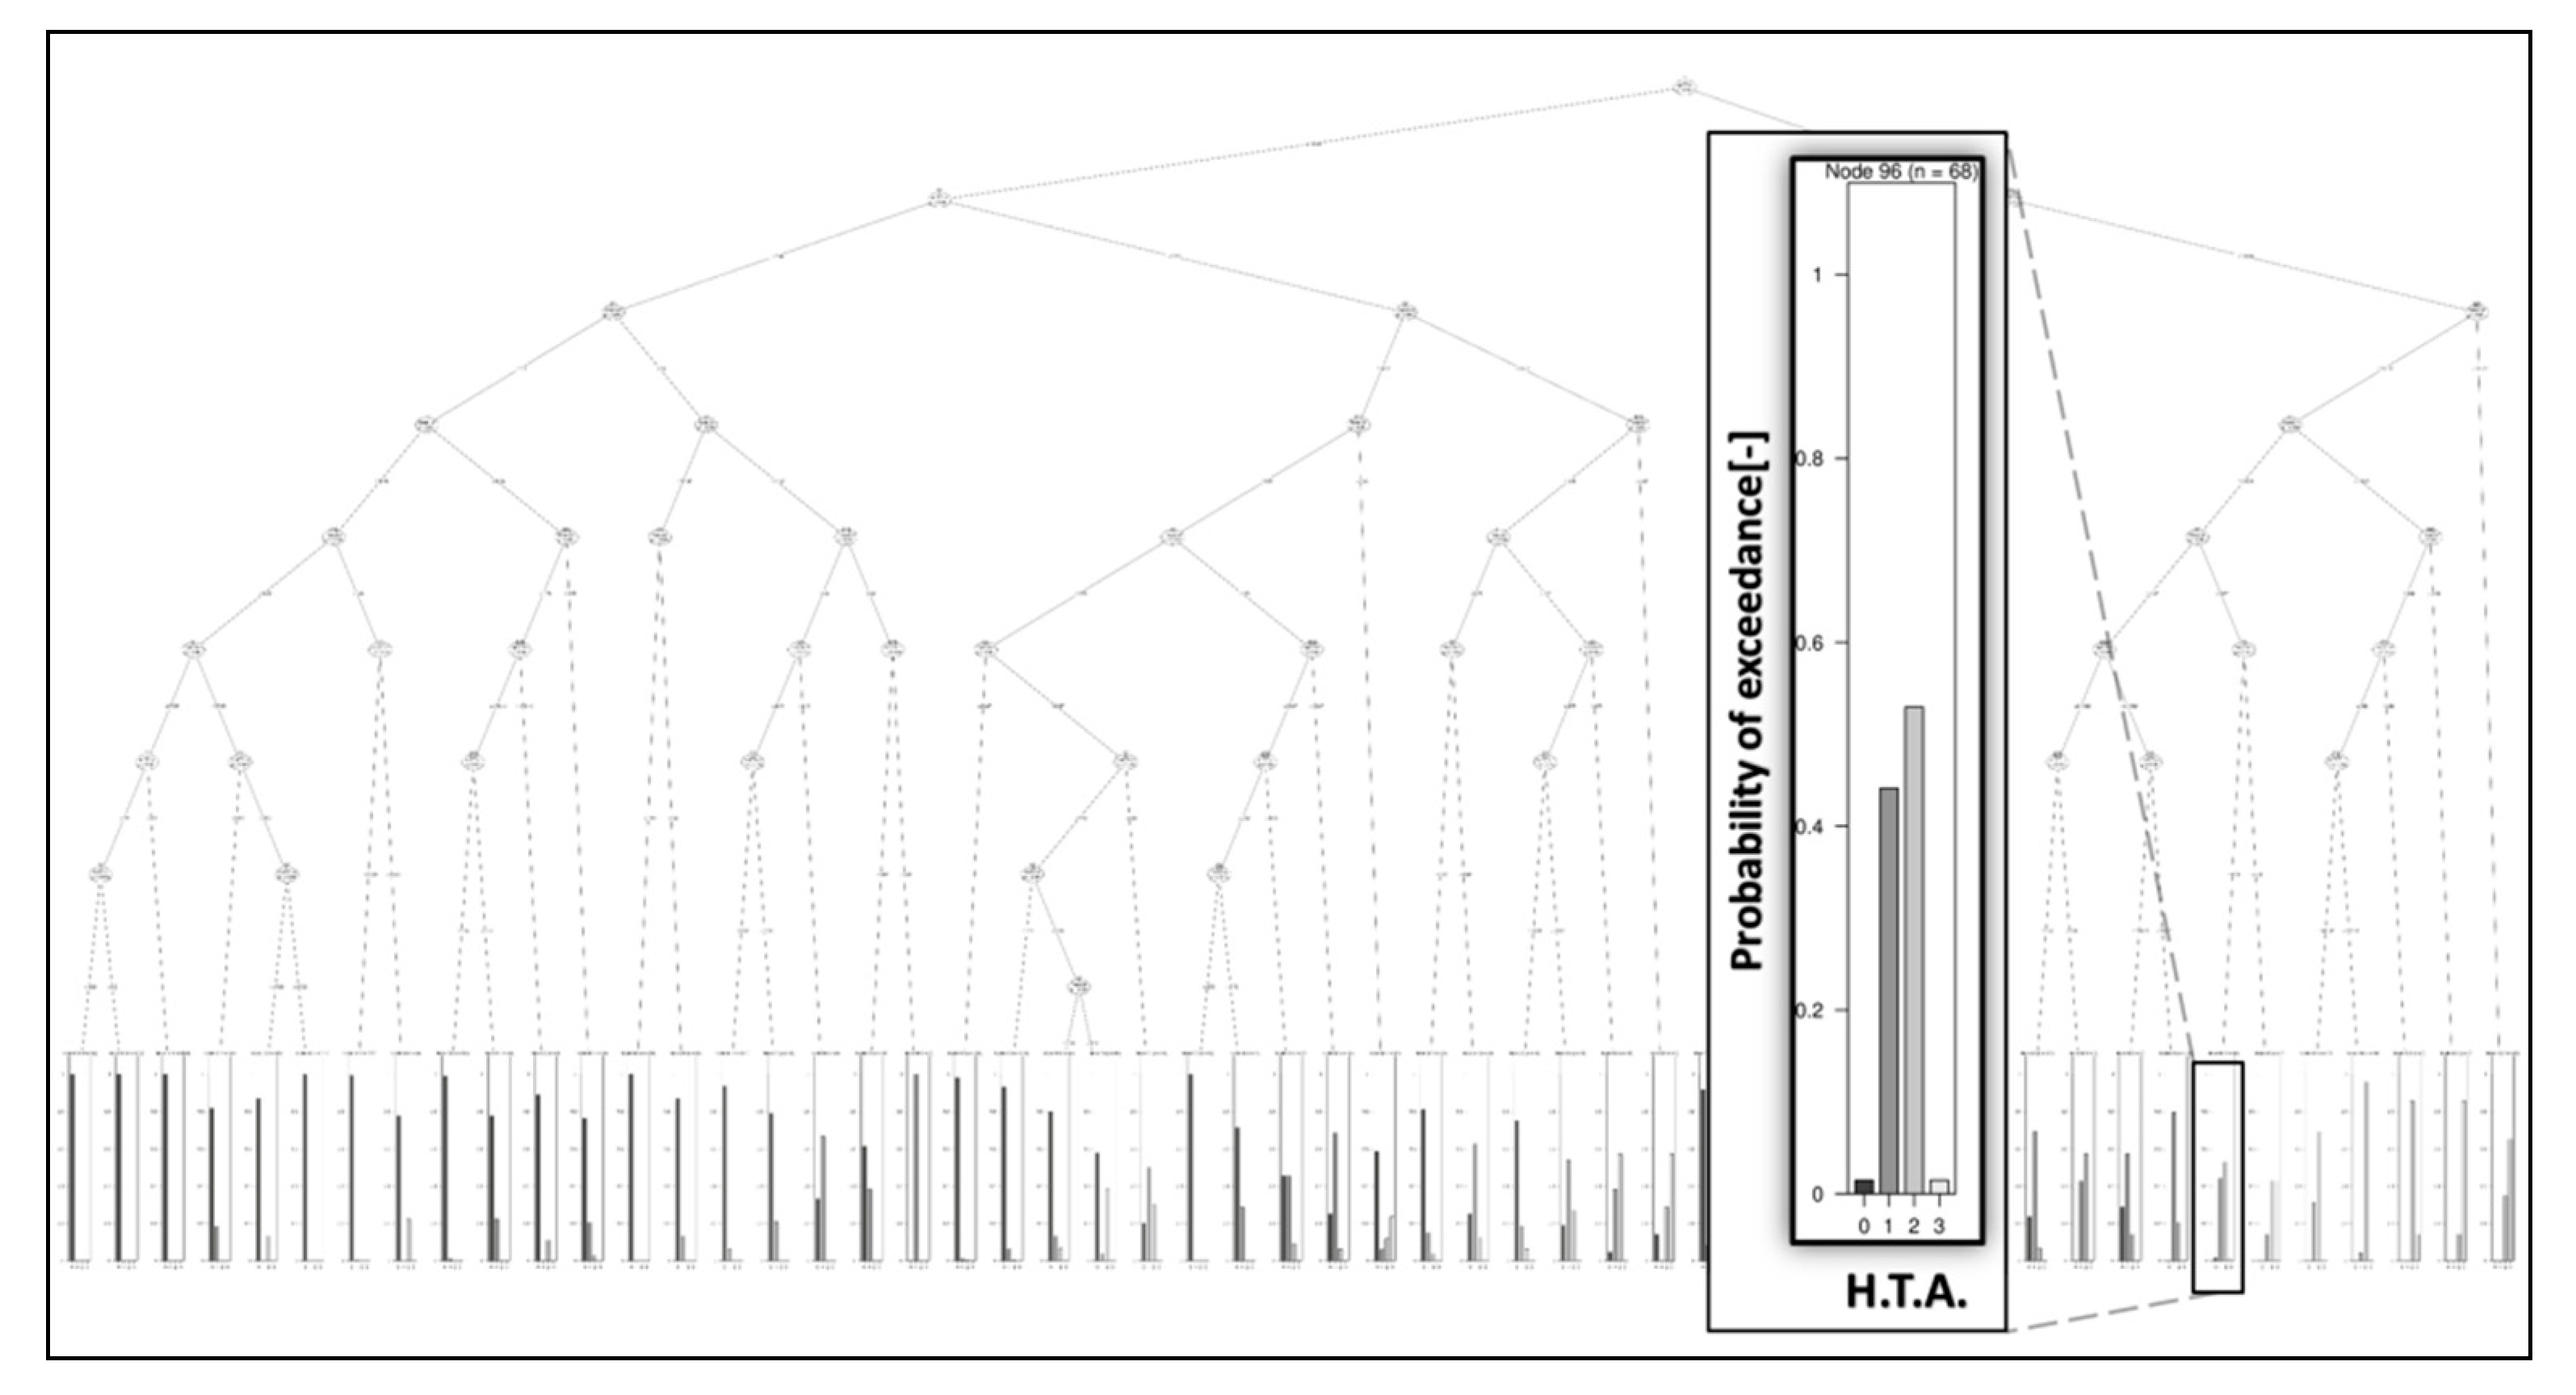
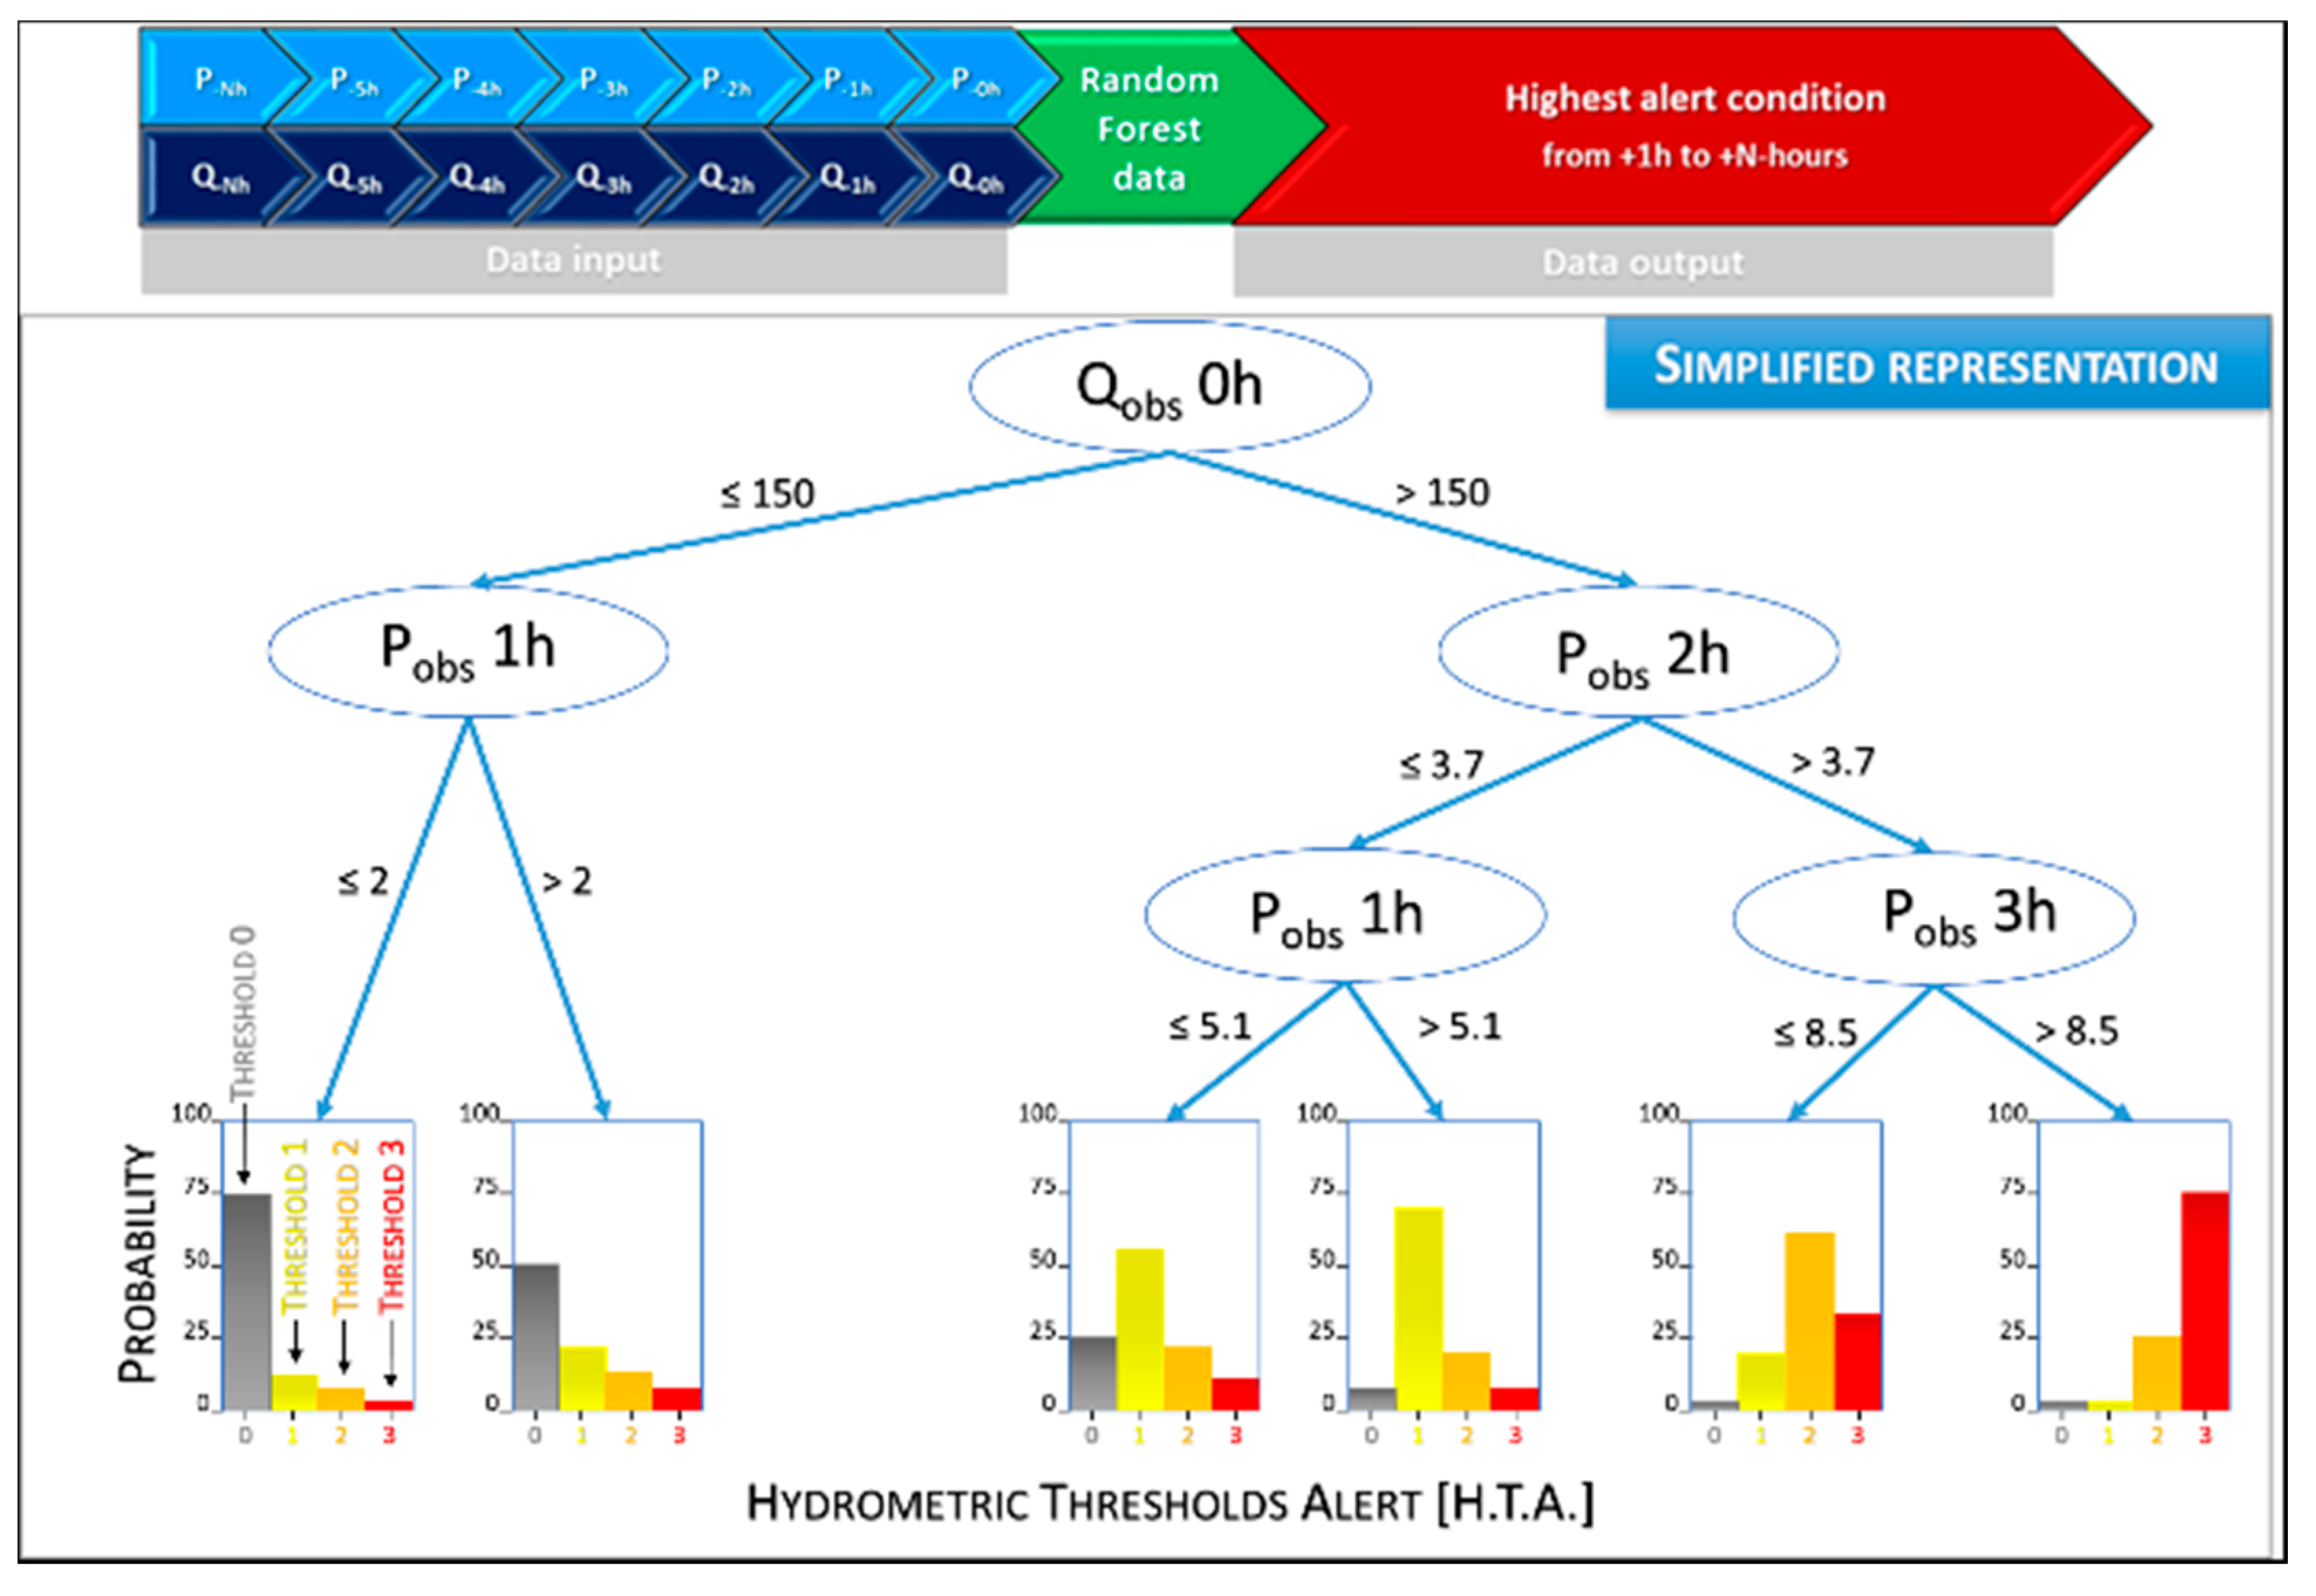
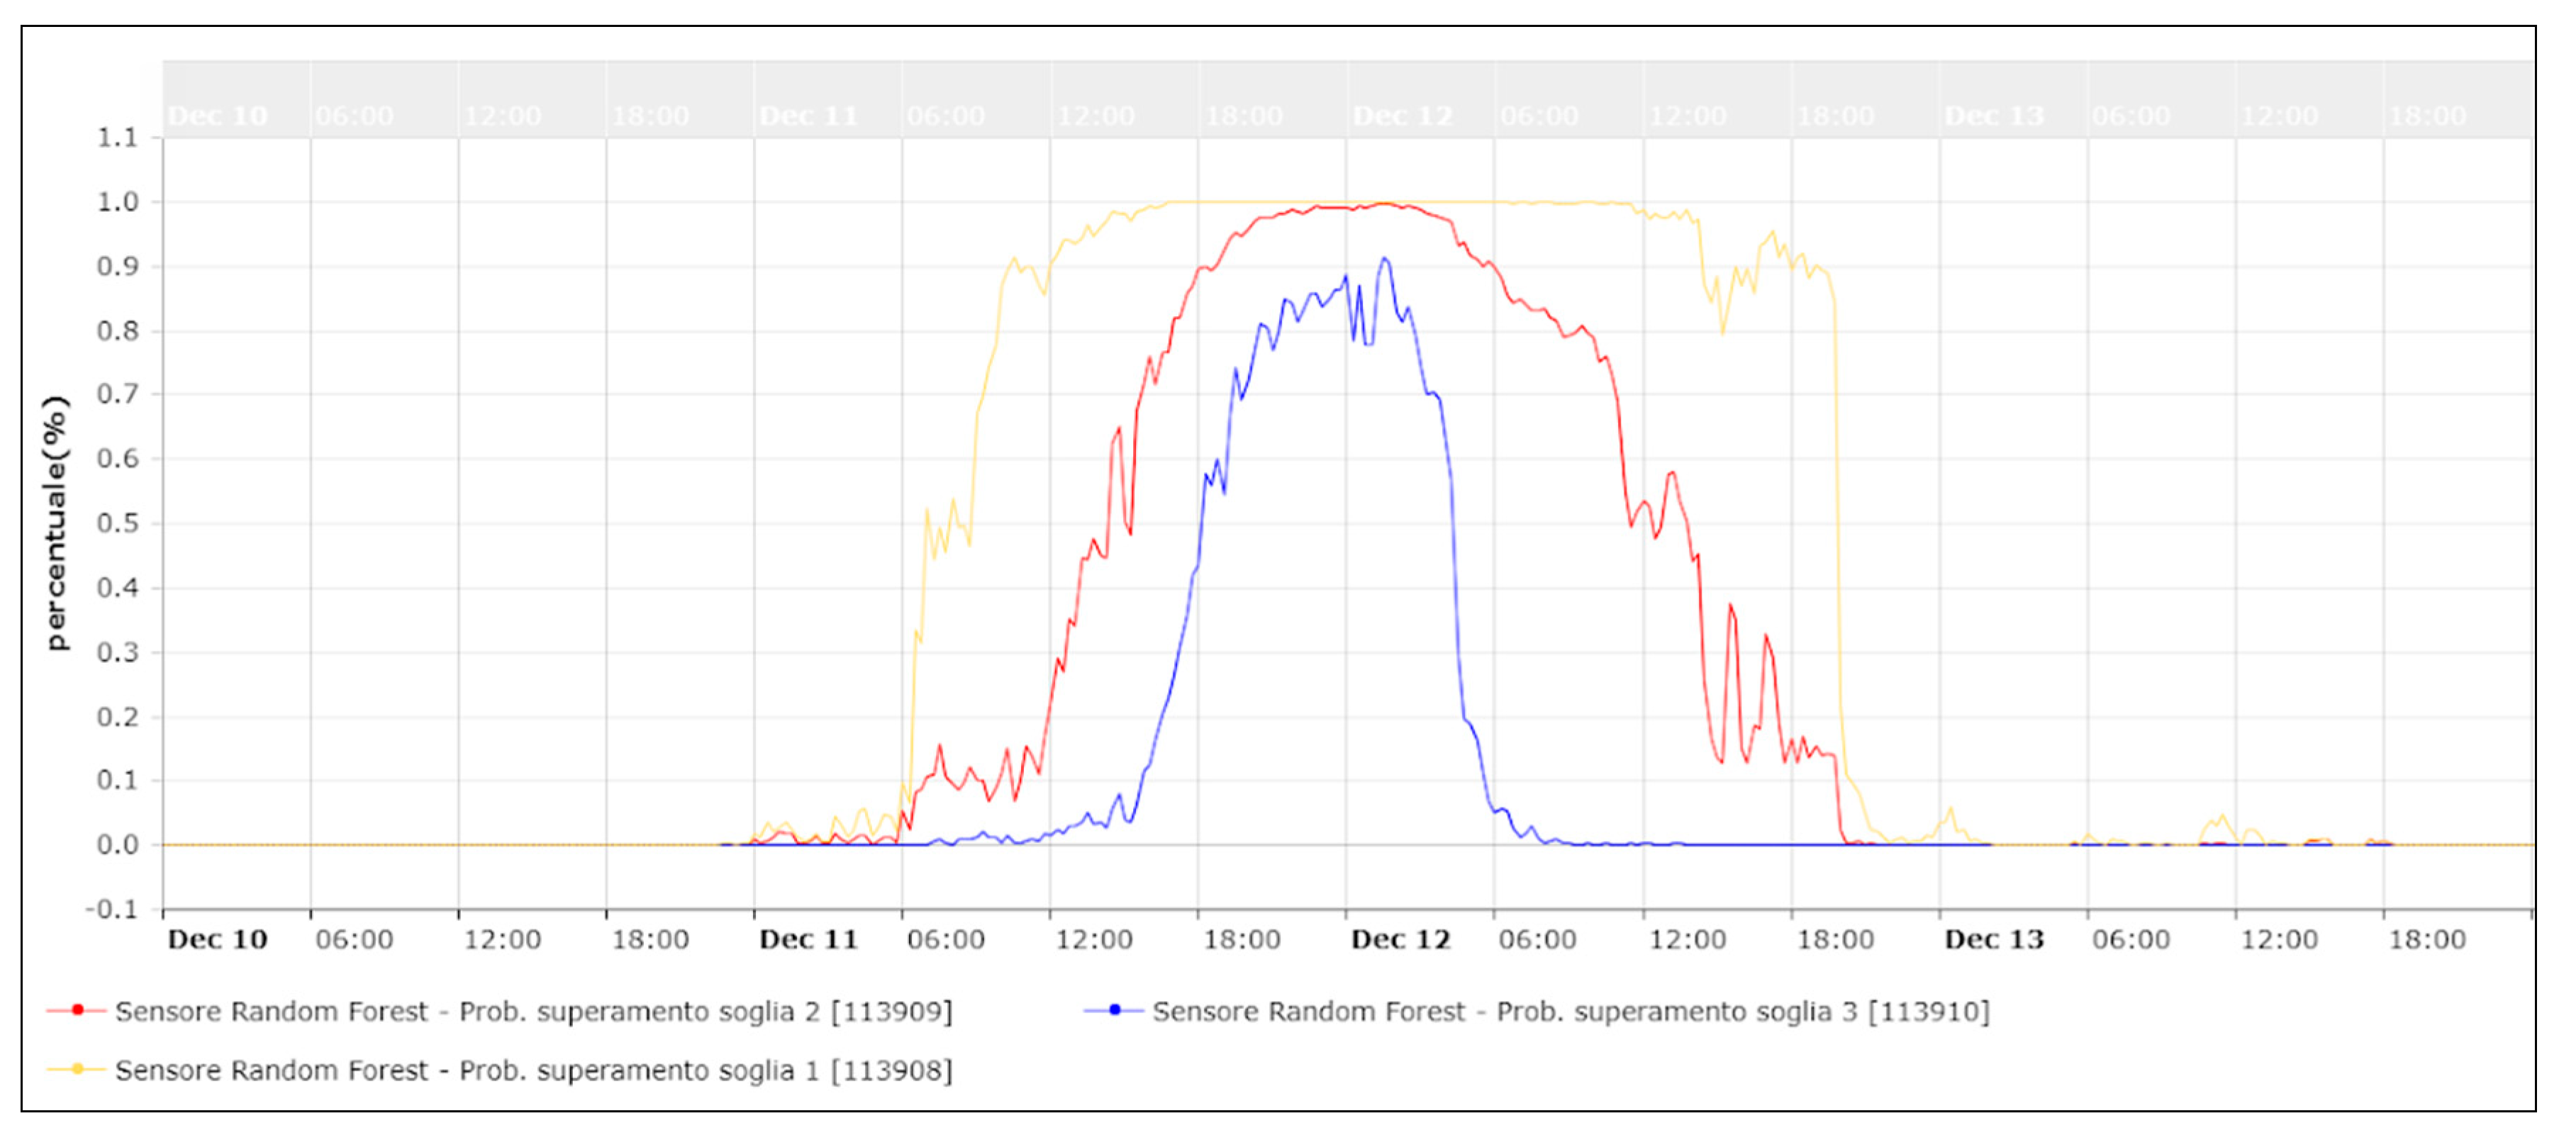
- RANDOM FOREST
2.3. Foreground of RainBO Project: Innovation and Development
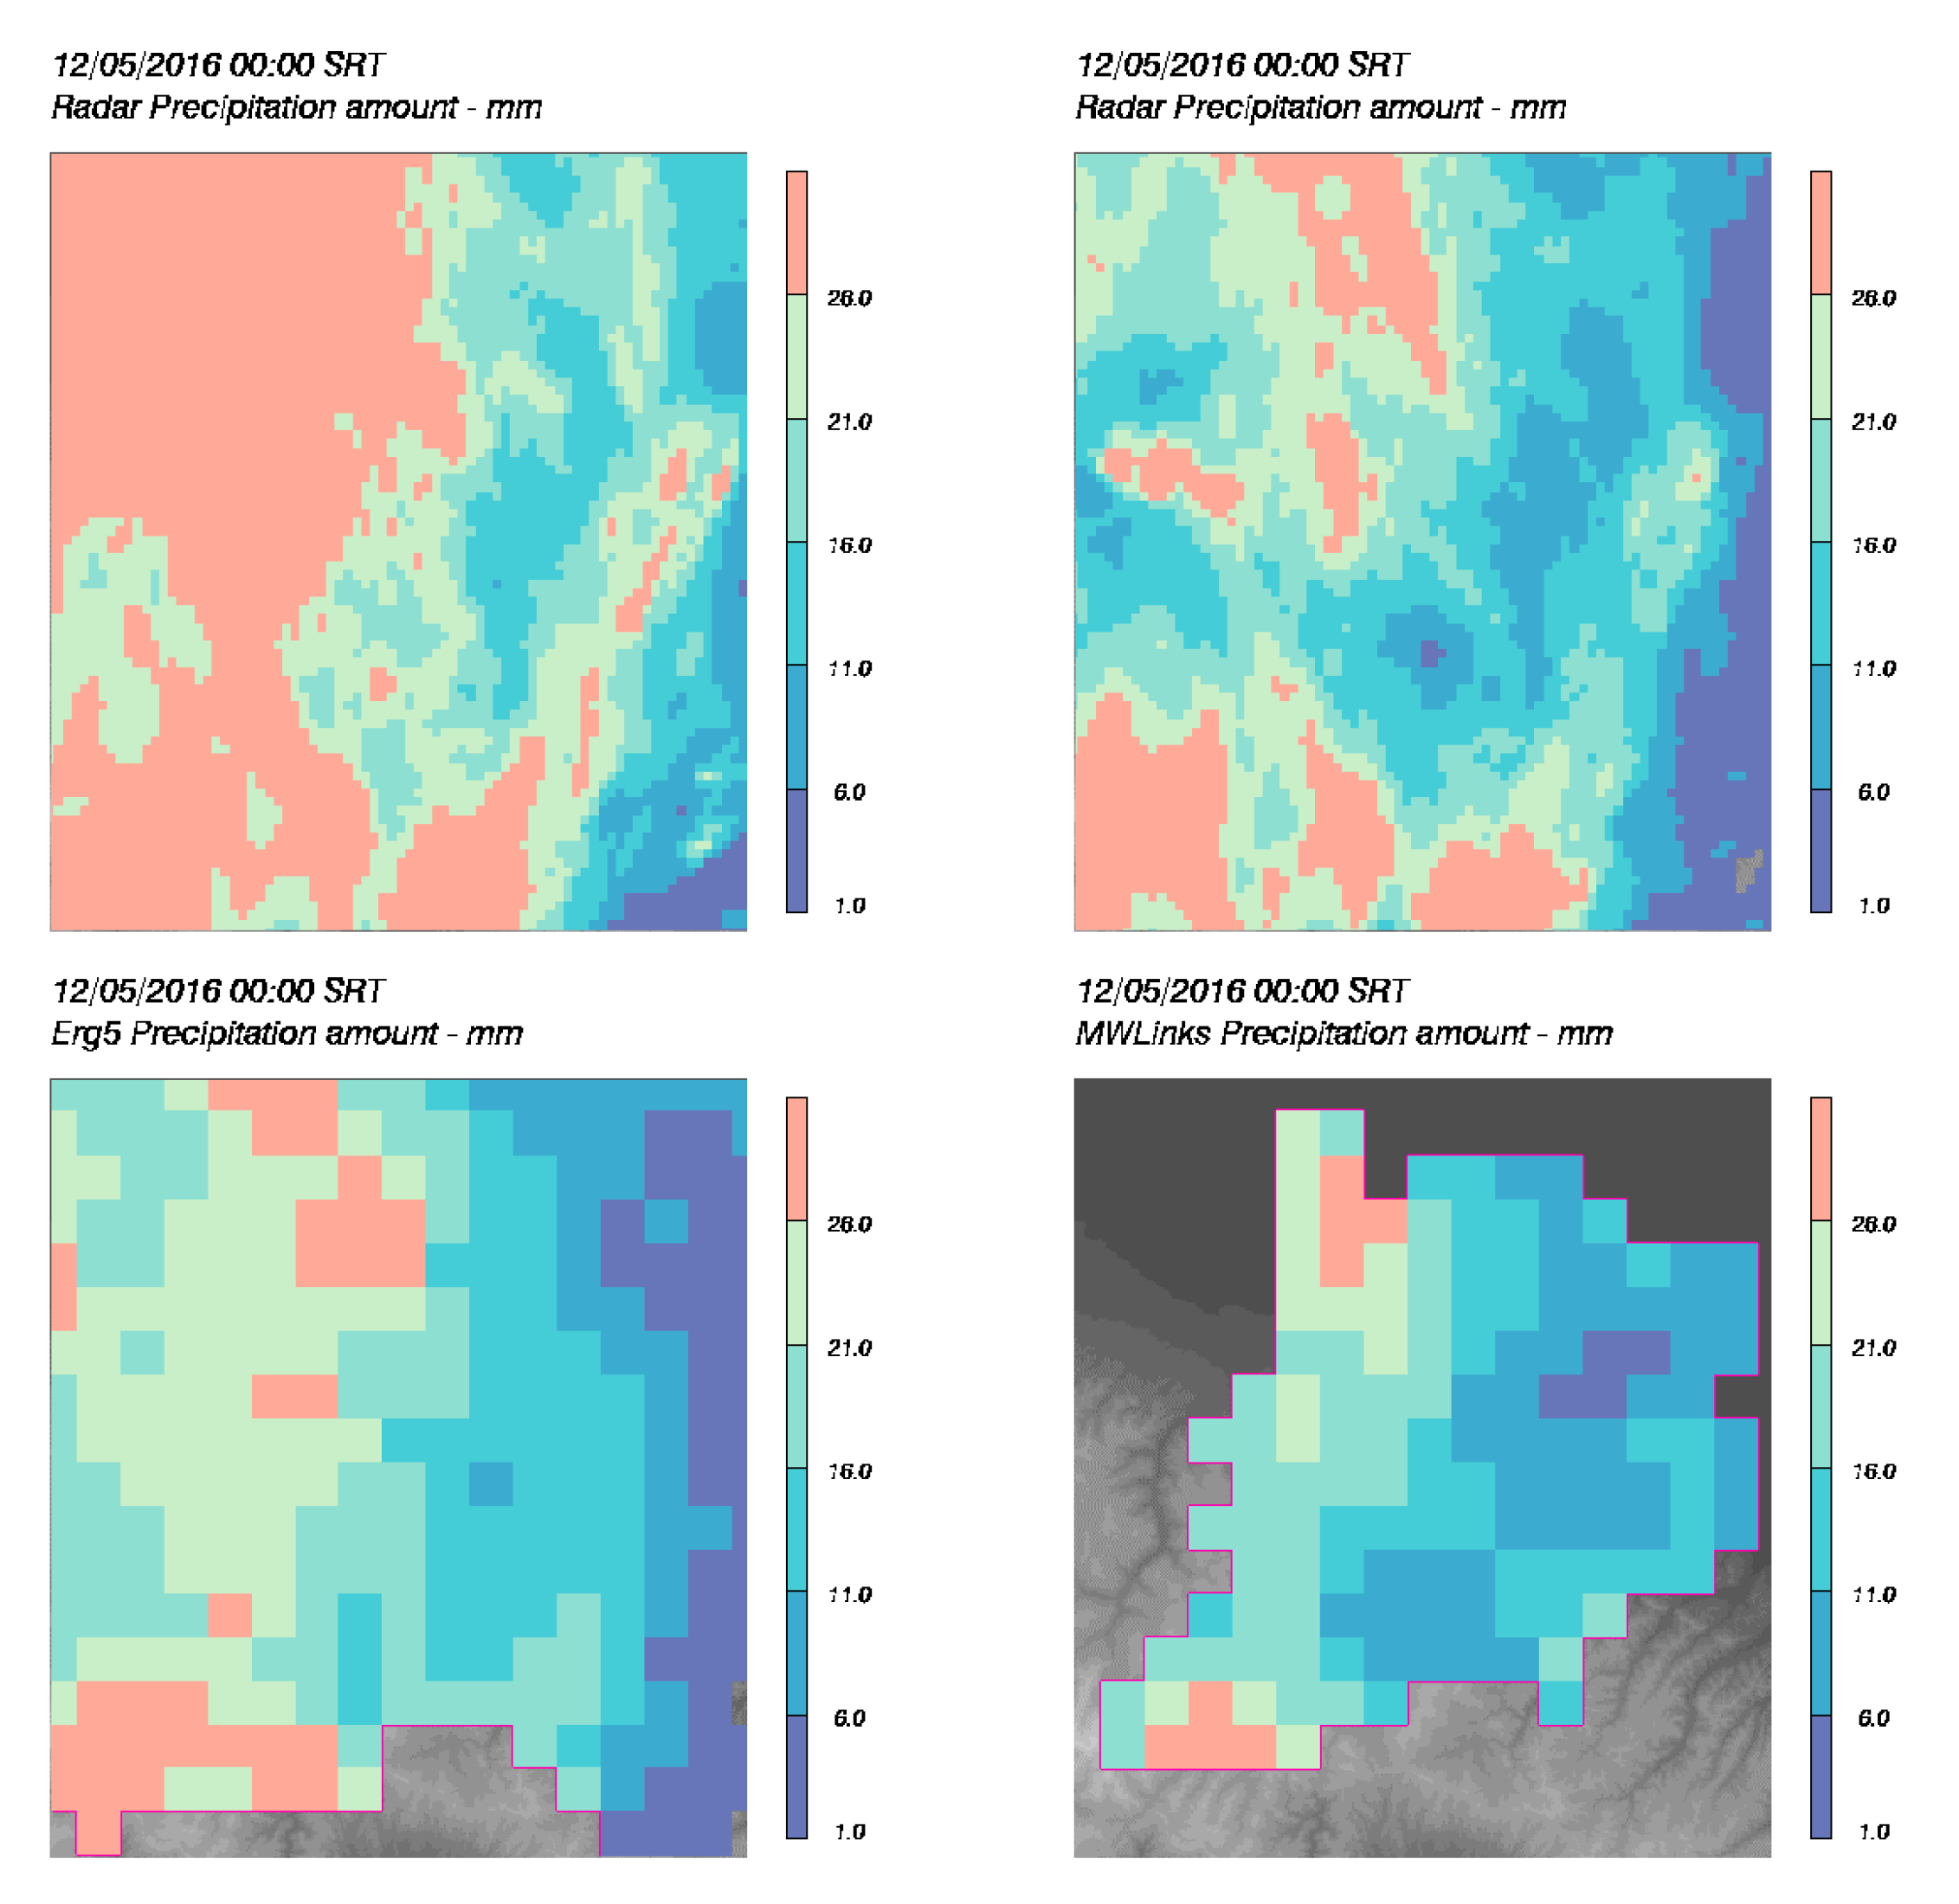
2.3.1. Commercial Microwave Links
2.3.2. Crowdsourcing App
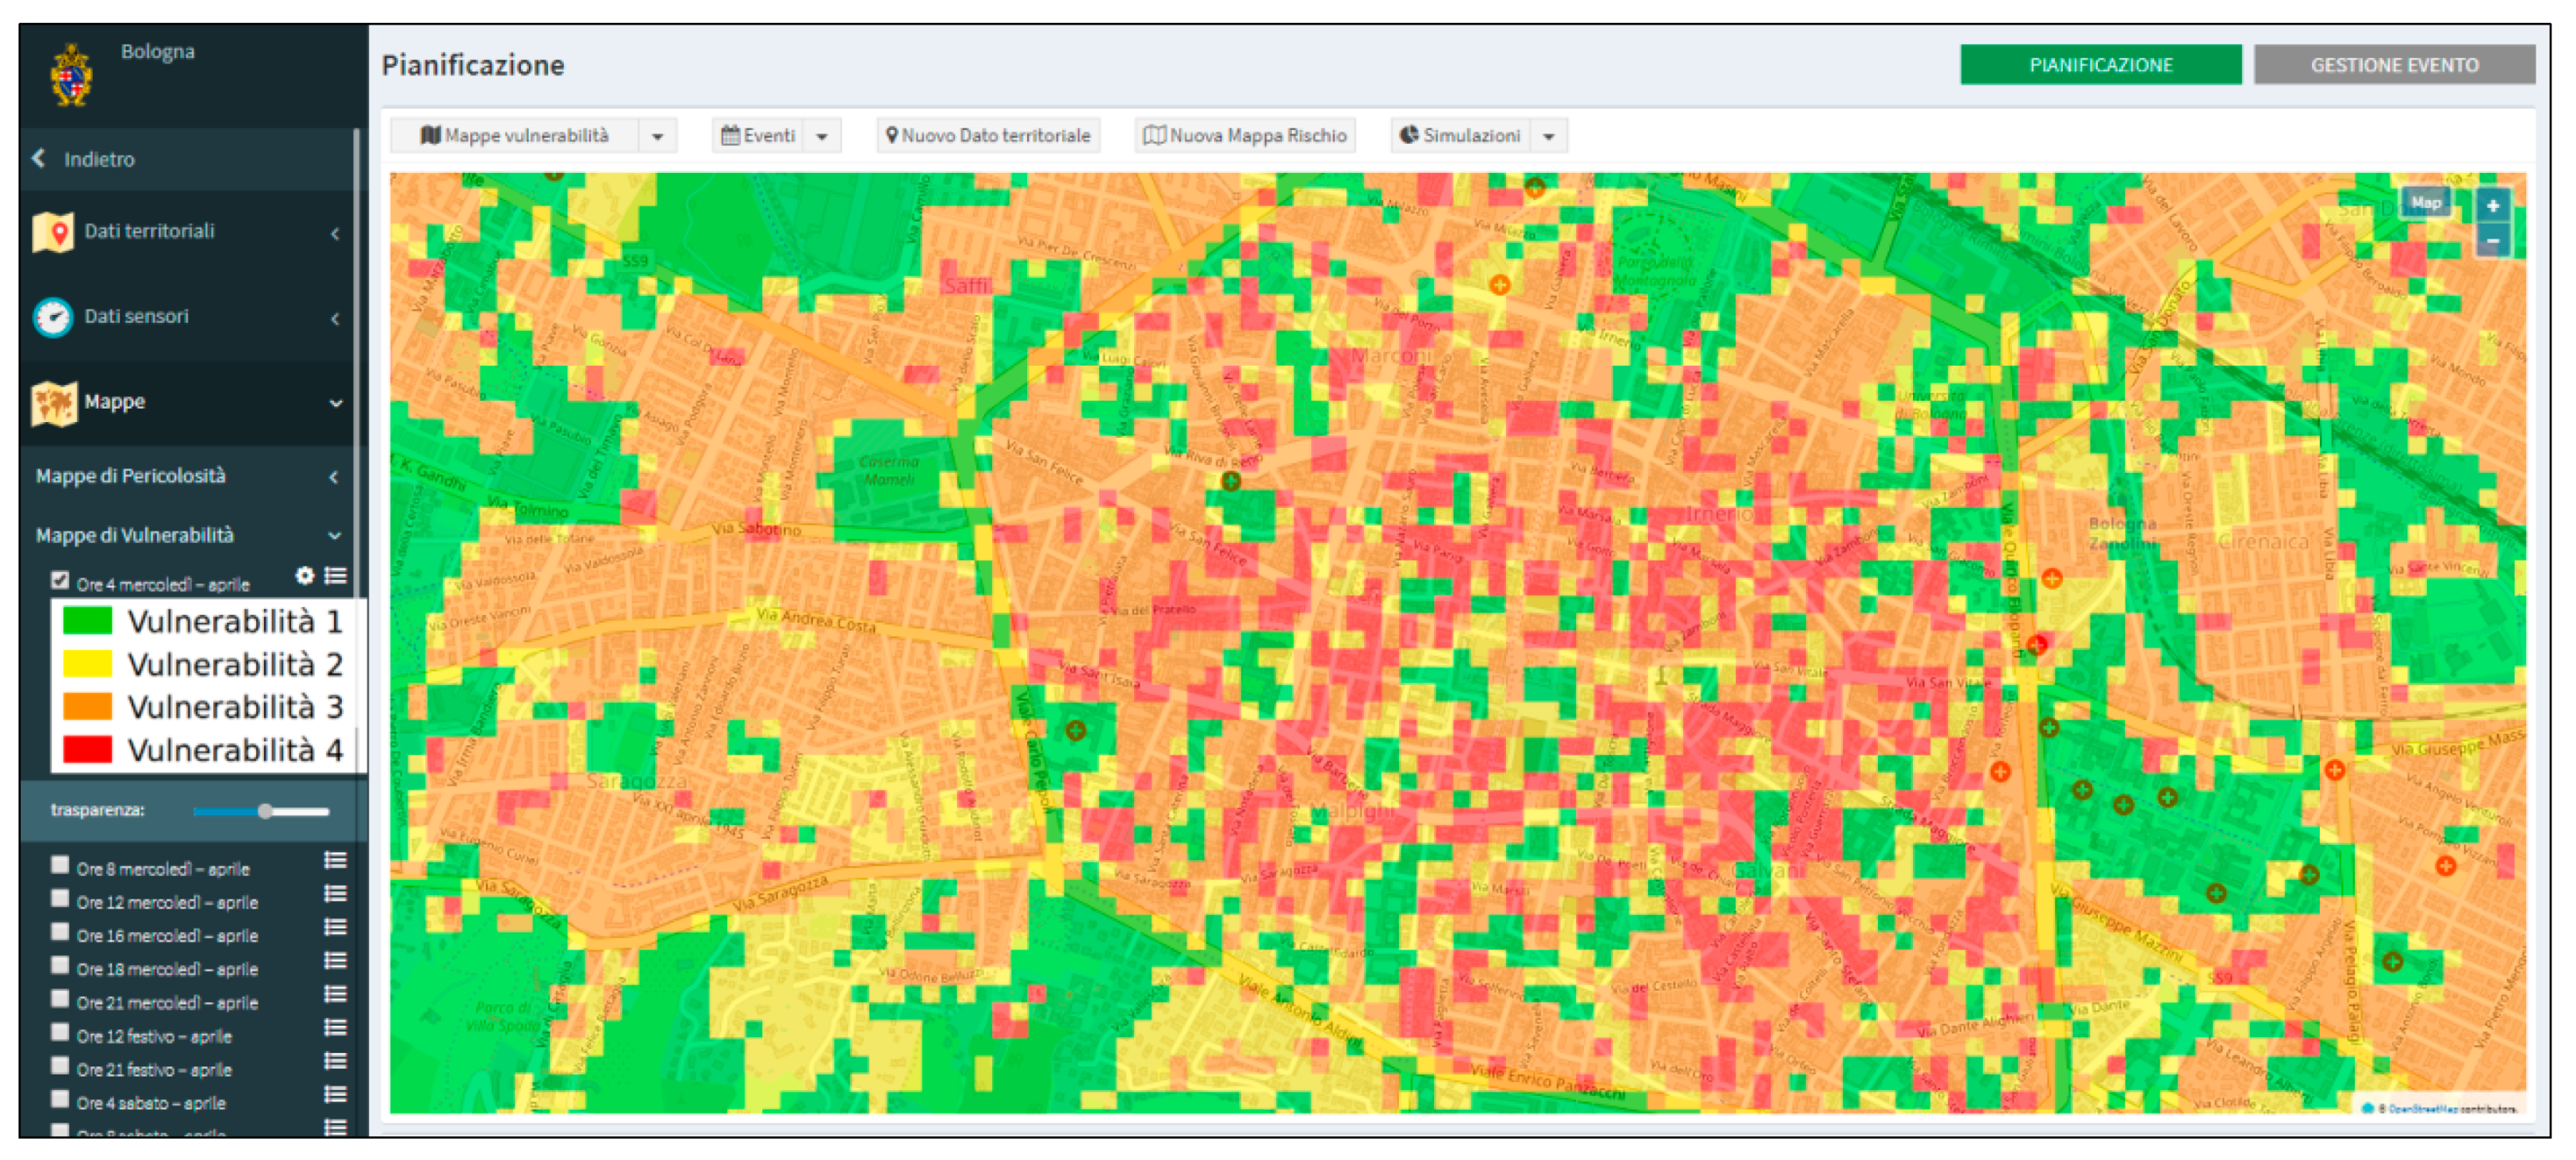
2.3.3. RainBO Vulnerability Model
- time frame
- resident population distribution (based on land use—Copernicus, Urban Atlas 2012)
- employees distribution of industrial, commercial and agricultural sectors (based on land use—Copernicus, Urban Atlas 2012)
- users of sensible targets
- presence of critical targets as institutional site and first aid structures that could reduce the resilience of a territory, if they are involved by emergency events
- presence of critical targets such as industrial areas and utility networks, which could produce a domino effect if they are involved by emergency events
2.3.4. Hydrologic Forecast for Small Catchments
3. Results and Discussion
3.1. The RainBO Platform
- database containing monitoring, territorial, and historical data
- software modules, which are the platform intelligence
- graphic interface, which is the platform output
- real sensors data (e.g., weather stations)
- “virtual sensors” data, not associated with observed measurements from physical sensors, but obtained indirectly through the estimation of correlated data or from simulation models
- forecast data, provided by simulation models
- open: each module exposes standard interfaces (web services) to ensure system generality and replicability as well as interoperability and integration with other platforms
- centralized: each DB is centralized and enables data sharing, managed, and updated by different users
- scalable: each module is developed so as to be implemented on different machines
- modular: the platform is formed by individual modules ensuring more flexibility, maintainability over time, as well as platform evolution as each module can evolve or be replaced independently from each other
- configurable: each module is configurable, i.e., the operating parameters must be read from the table and not written in code
- Planning support
- Event management
3.2. Territorial Data
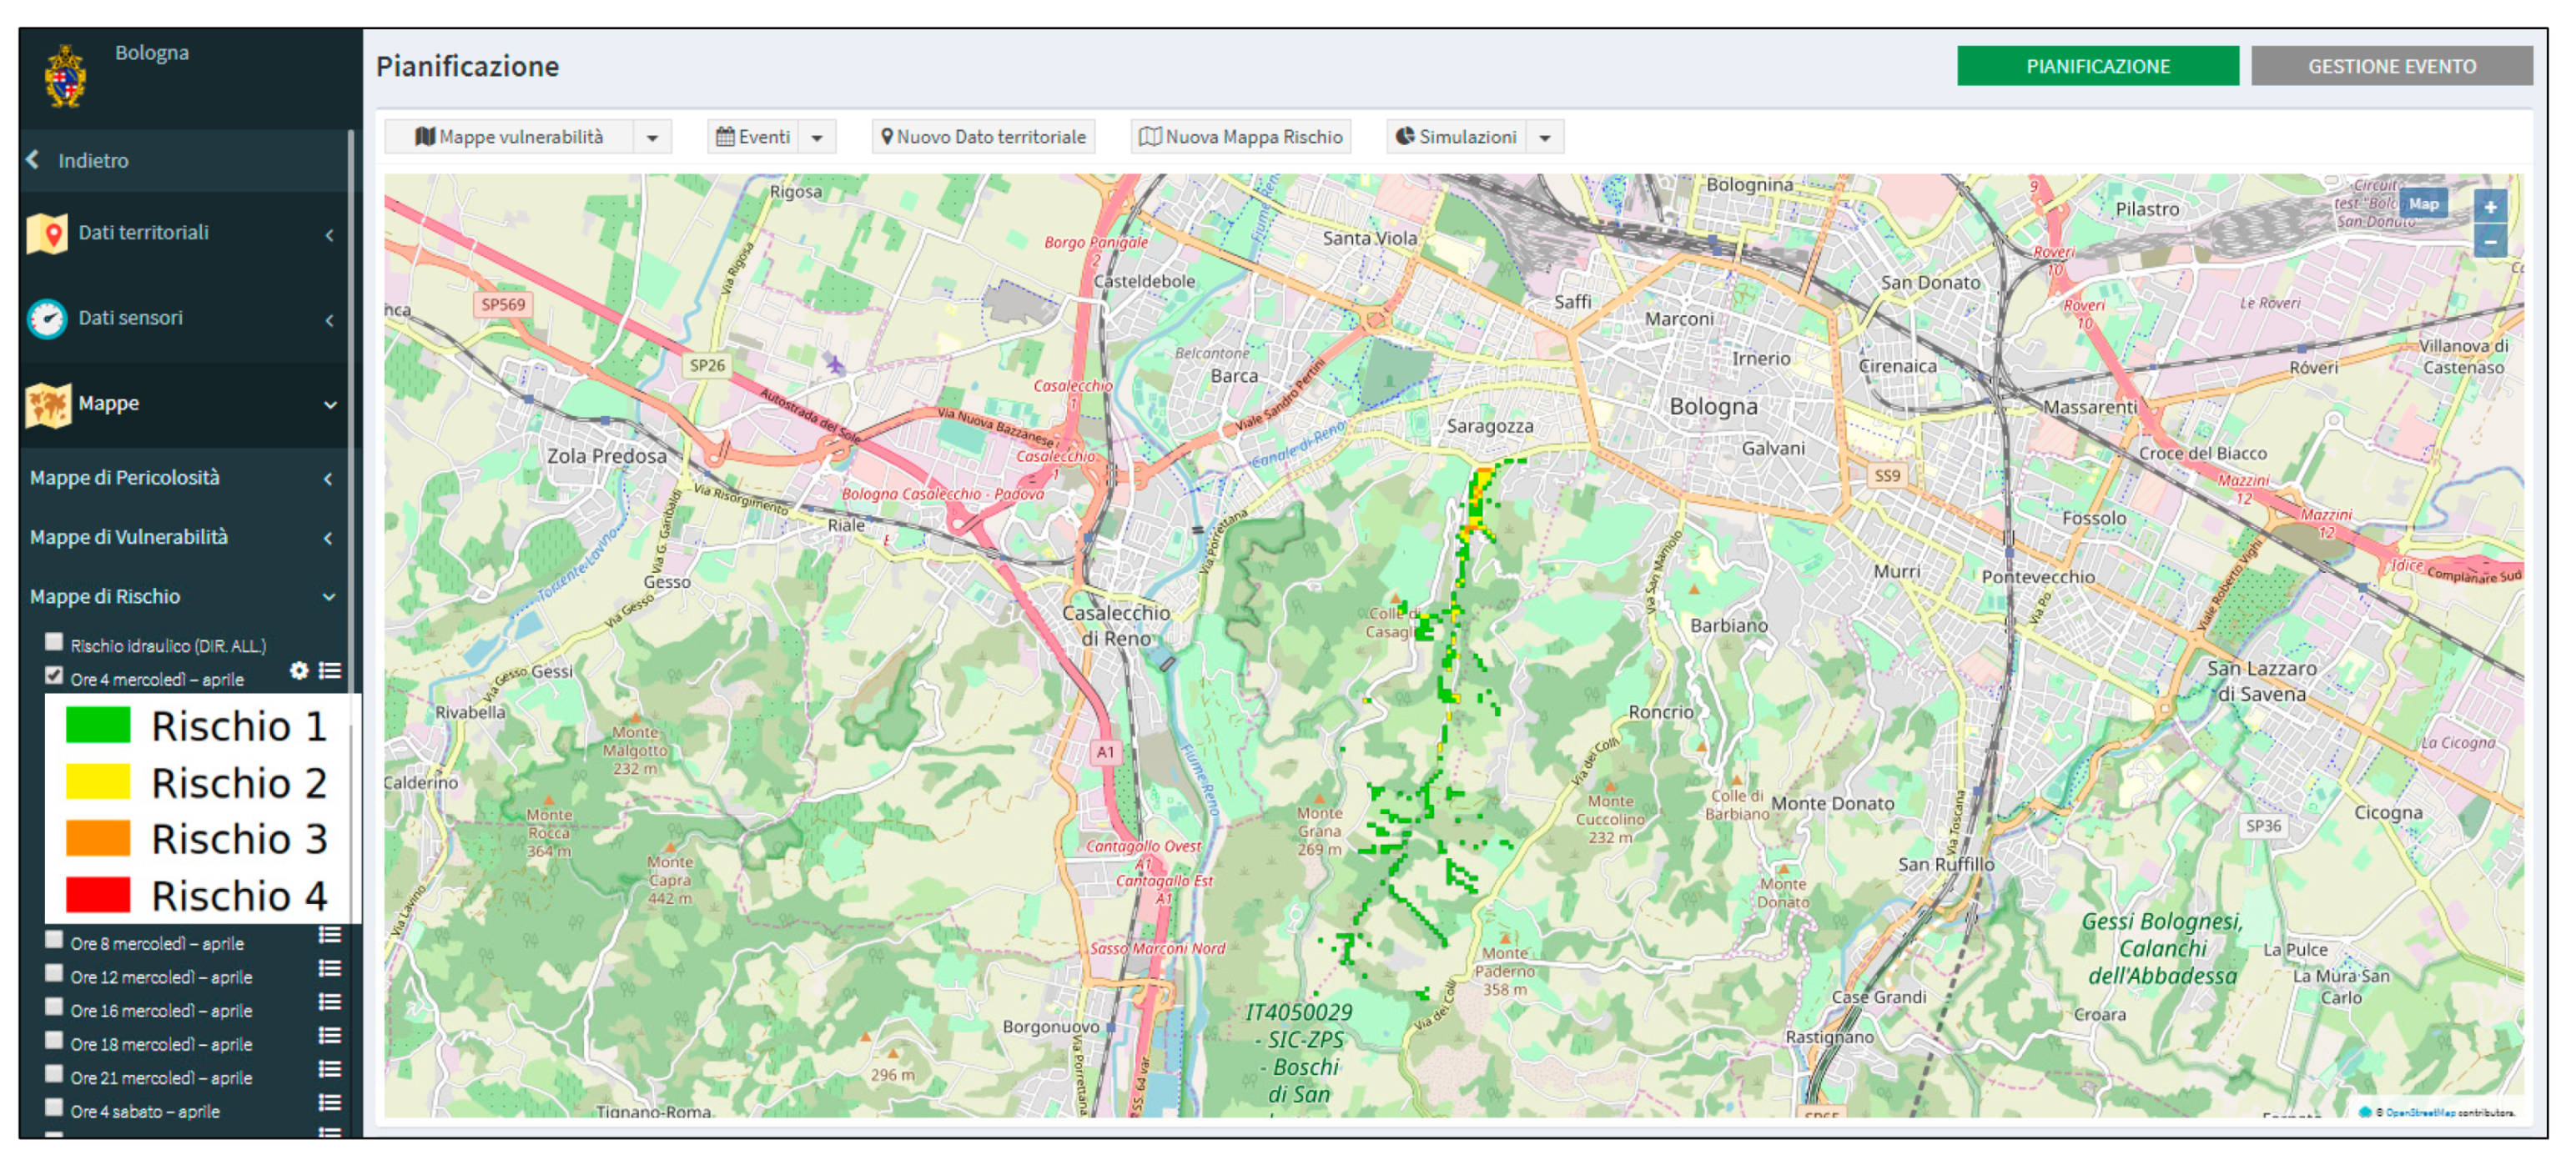
3.2.1. Hazard, Vulnerability, and Risk Maps
- hazard maps deriving from the Floods Directive: they represent the potential extent of flooding caused by (natural and artificial) watercourses or by sea, with reference to three scenarios (rare floods (P1—L), infrequent (P2—M) and frequent (P3—H)) represented with three different shades of blue, where the decrease of frequency of flooding corresponds to the decrease in intensity of color. The Floods Directive hazard maps derive from the national hydro-geological management plan (PAI) and they are available for the main basins
- hazards maps from specific hydraulic model/studies for small basins, not included in the Floods Directive maps
- historical events maps that are maps of the flooded areas due to past events. These maps represent an important source of additional information to compare reference maps listed before and real ground effects expected in case of an event.
- Red for high vulnerability, which means the presence of many people in the grid cell.
- Orange is medium-high vulnerability
- Yellow is medium vulnerability
- Green is low vulnerability, due to the presence of few people in the grid cell
3.2.2. Historical Events
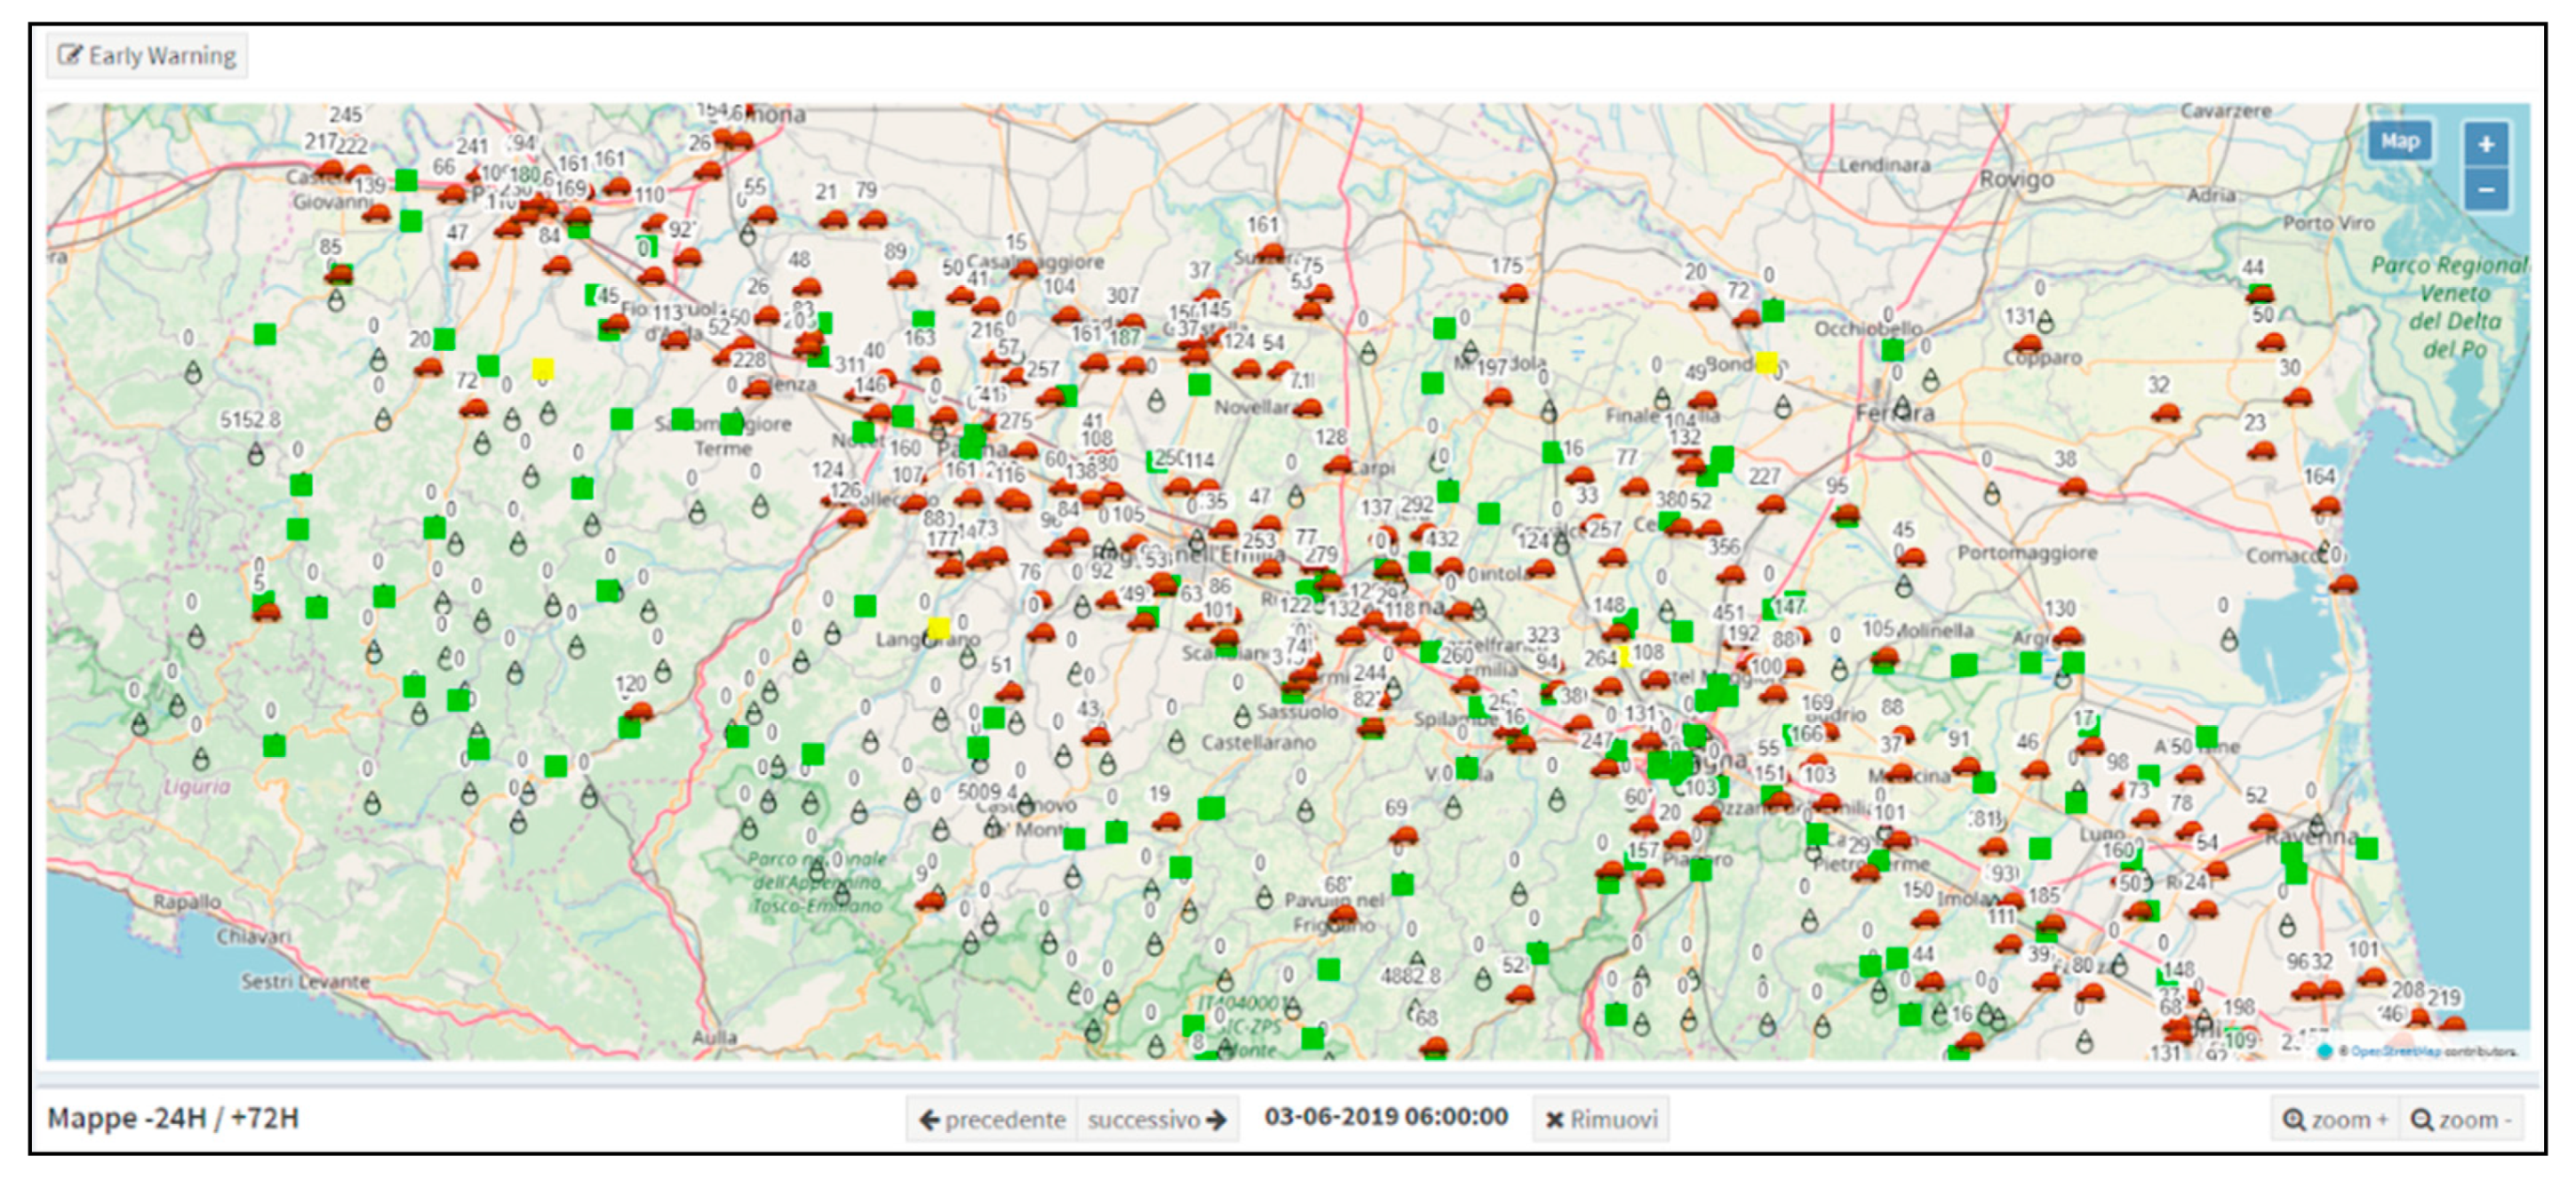
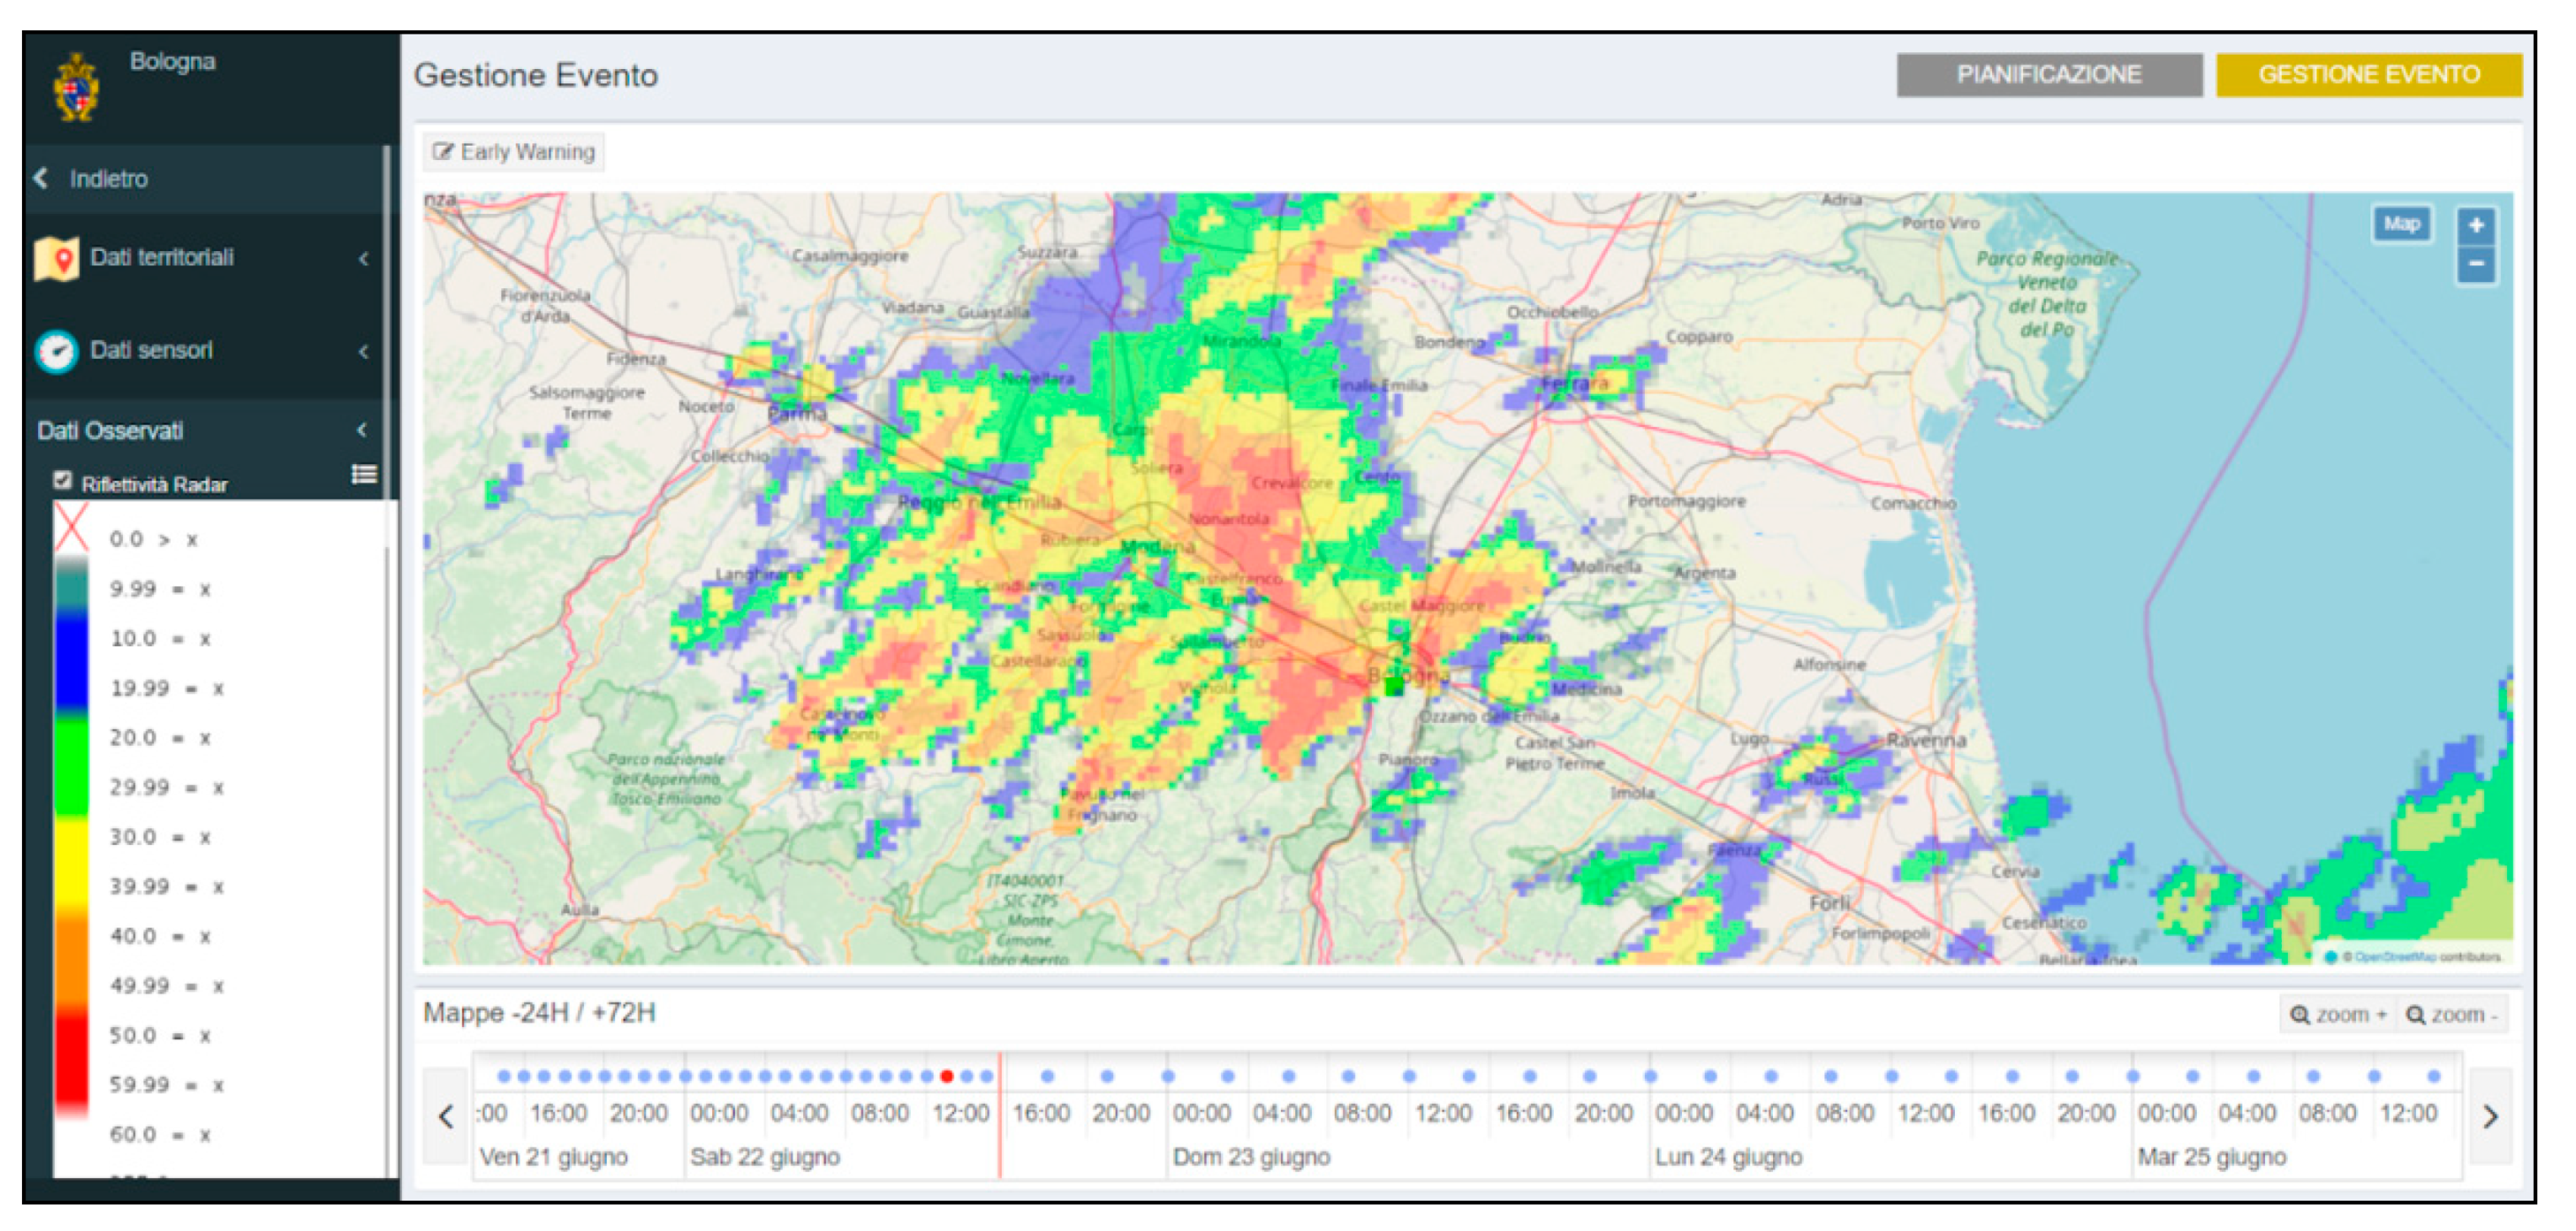
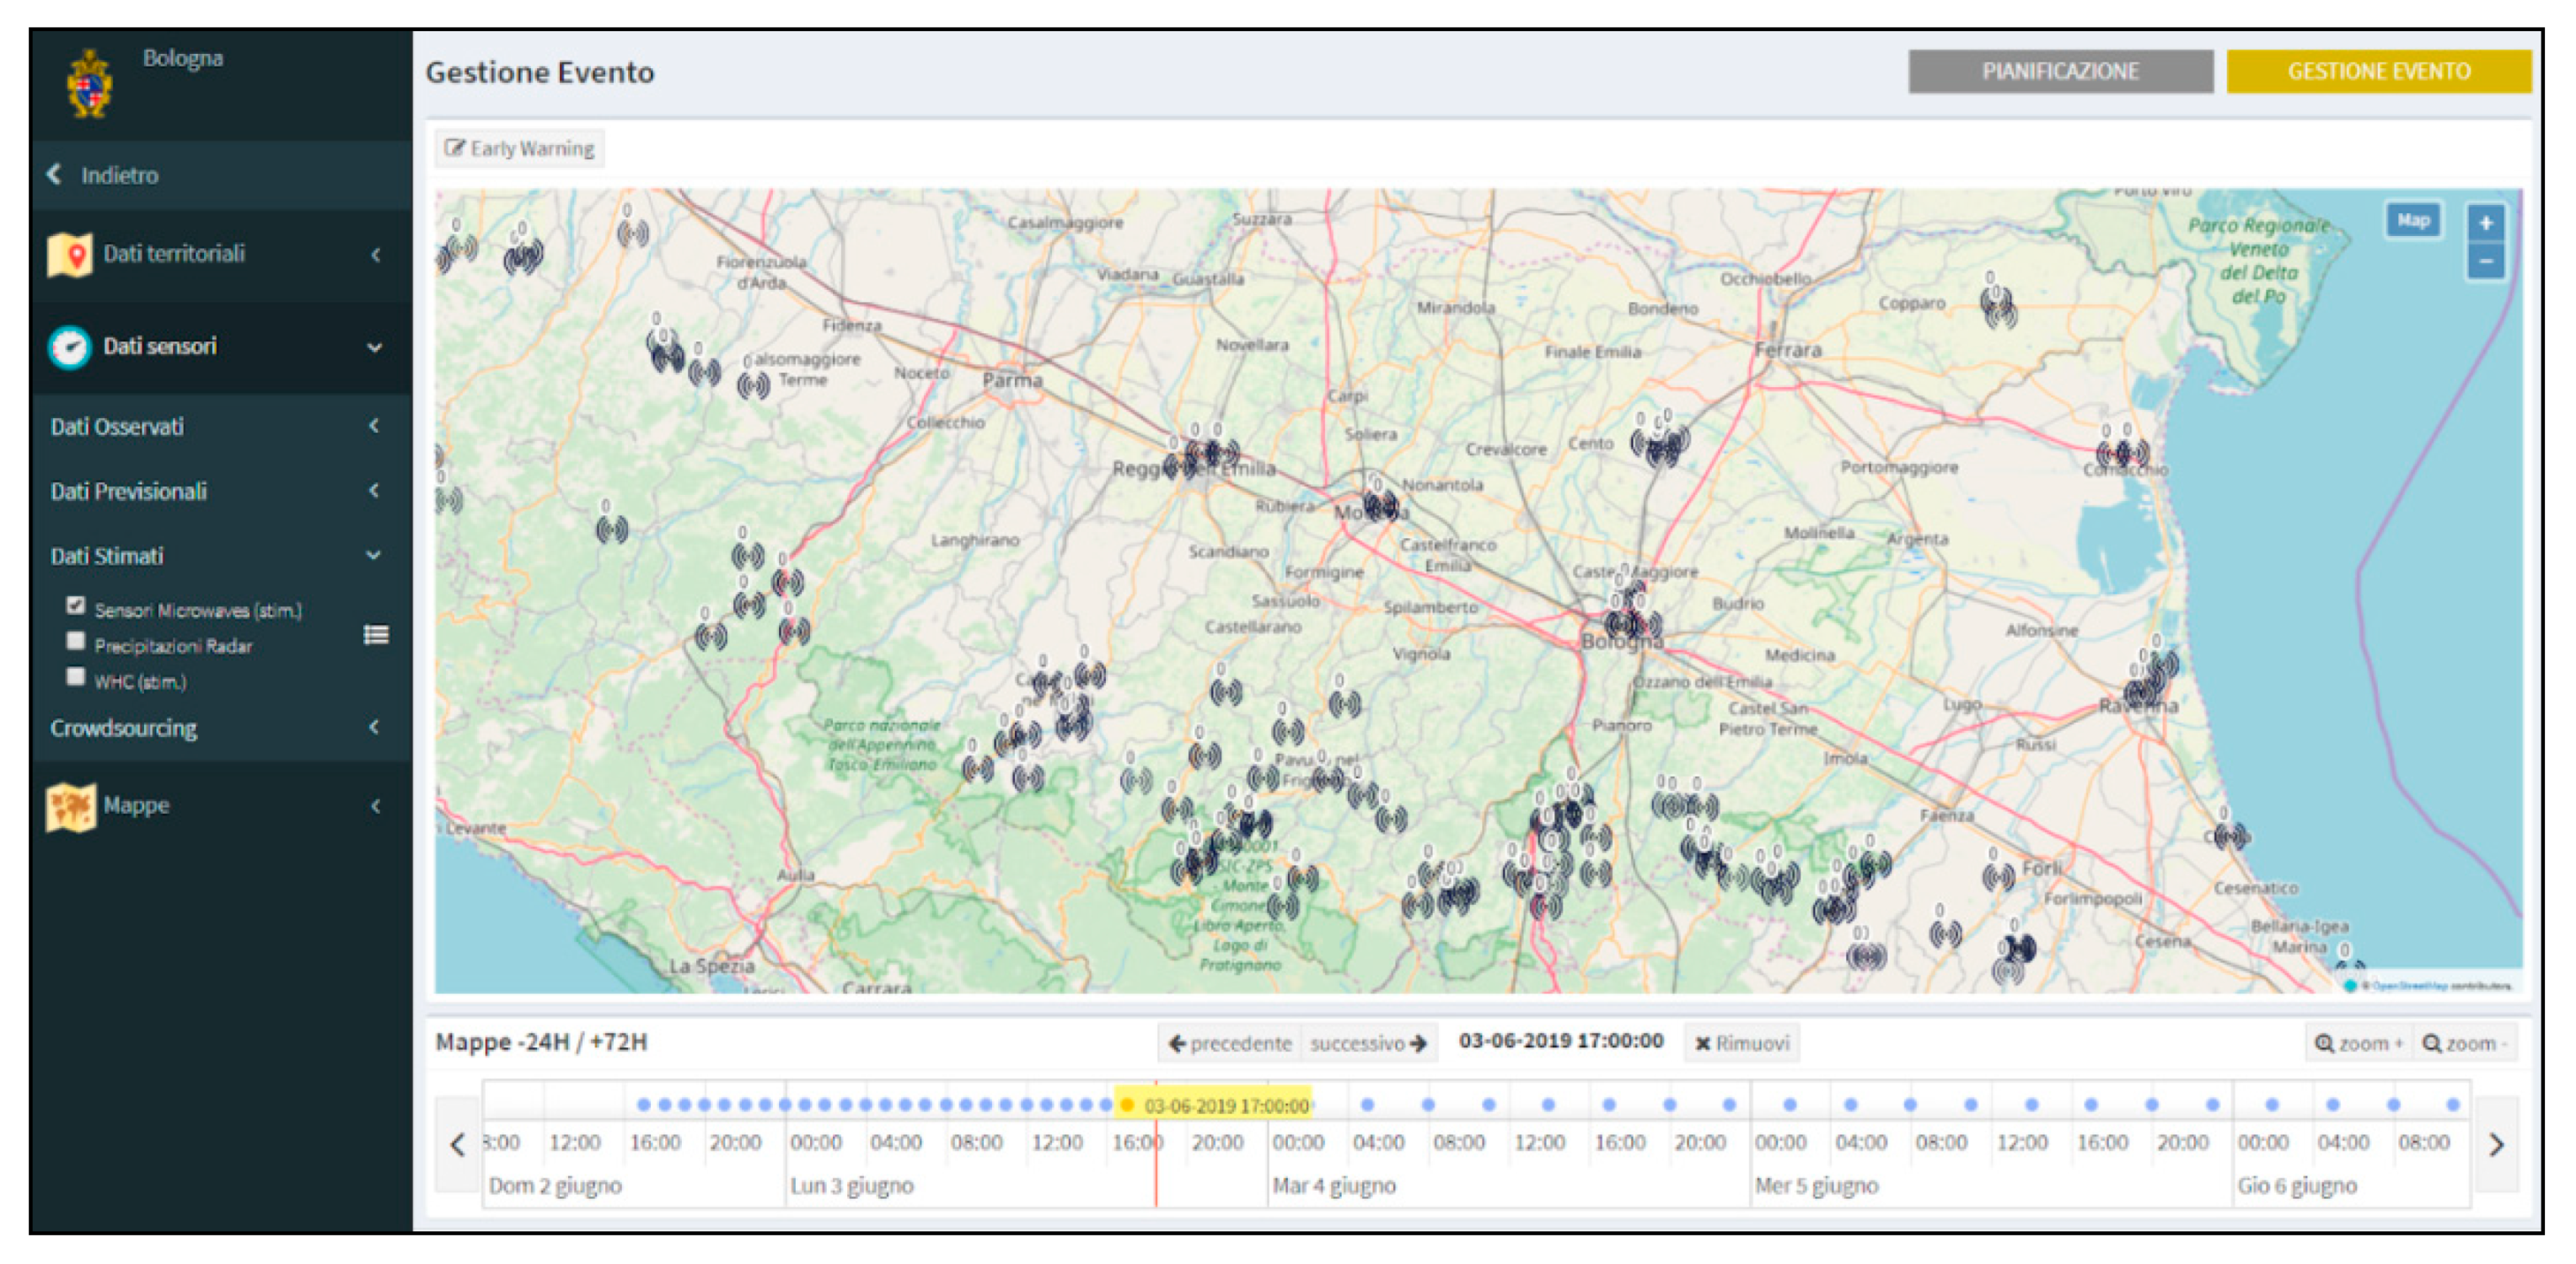
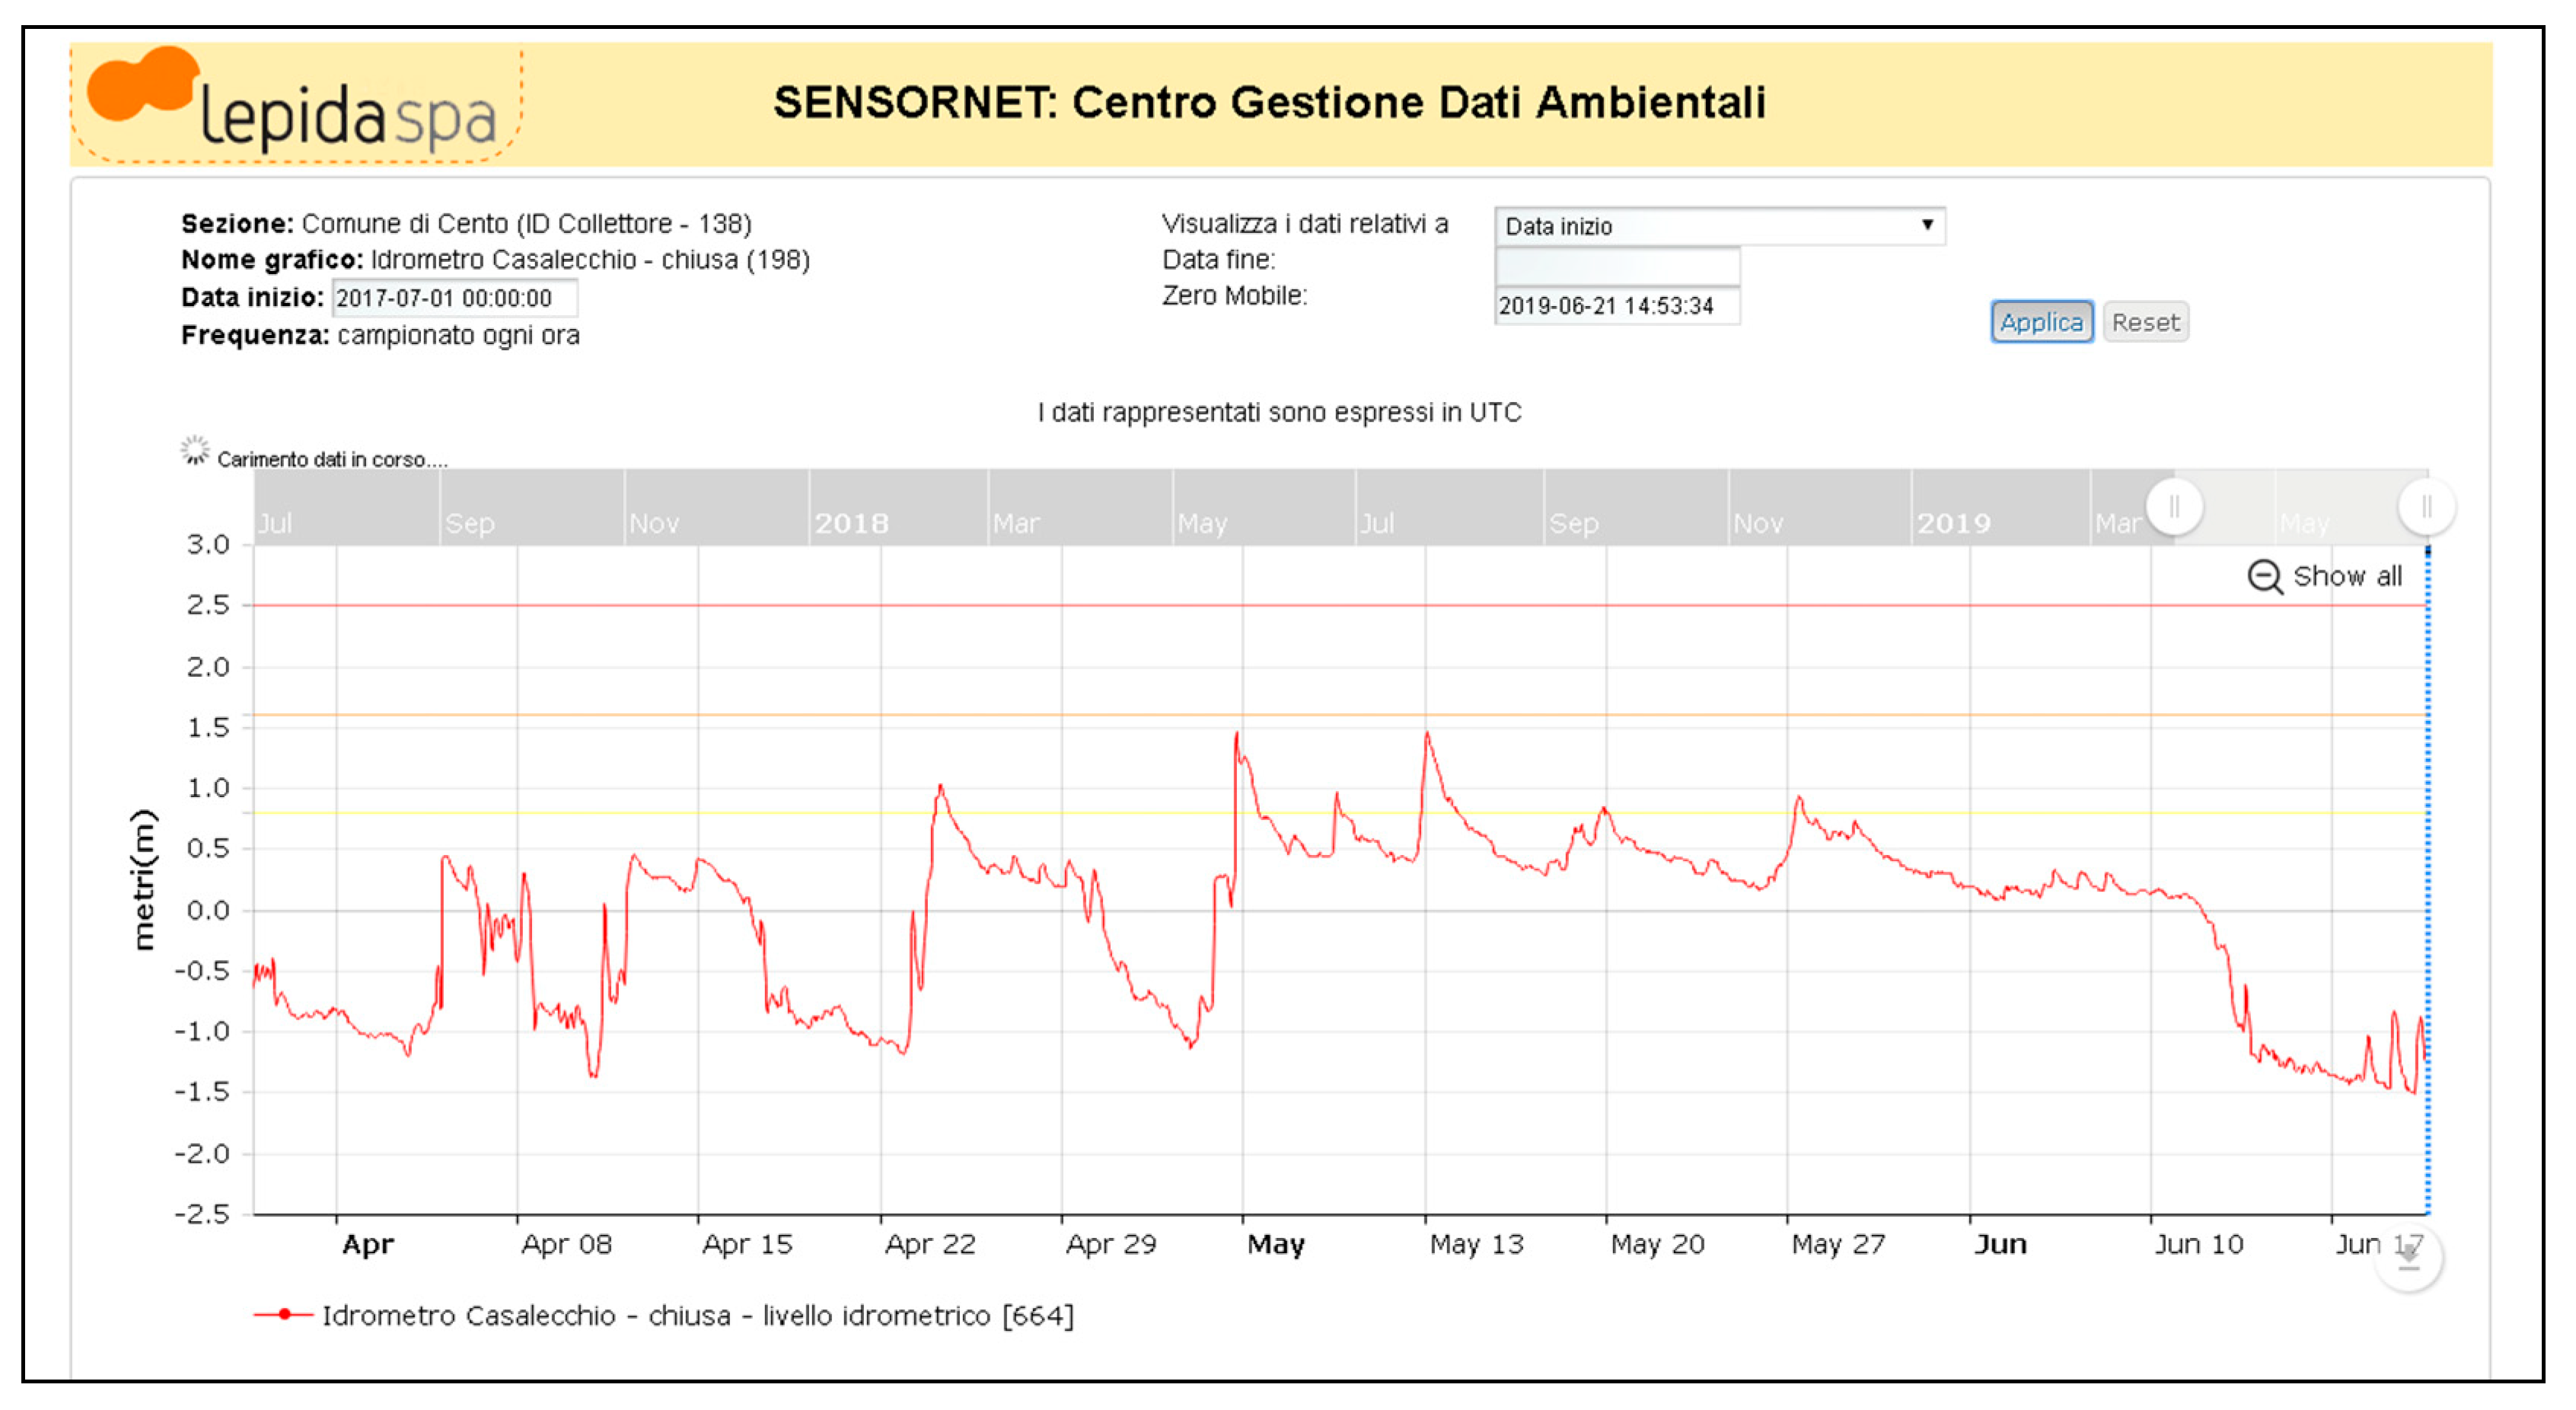
3.3. Observed, Forecast, and Estimated Data
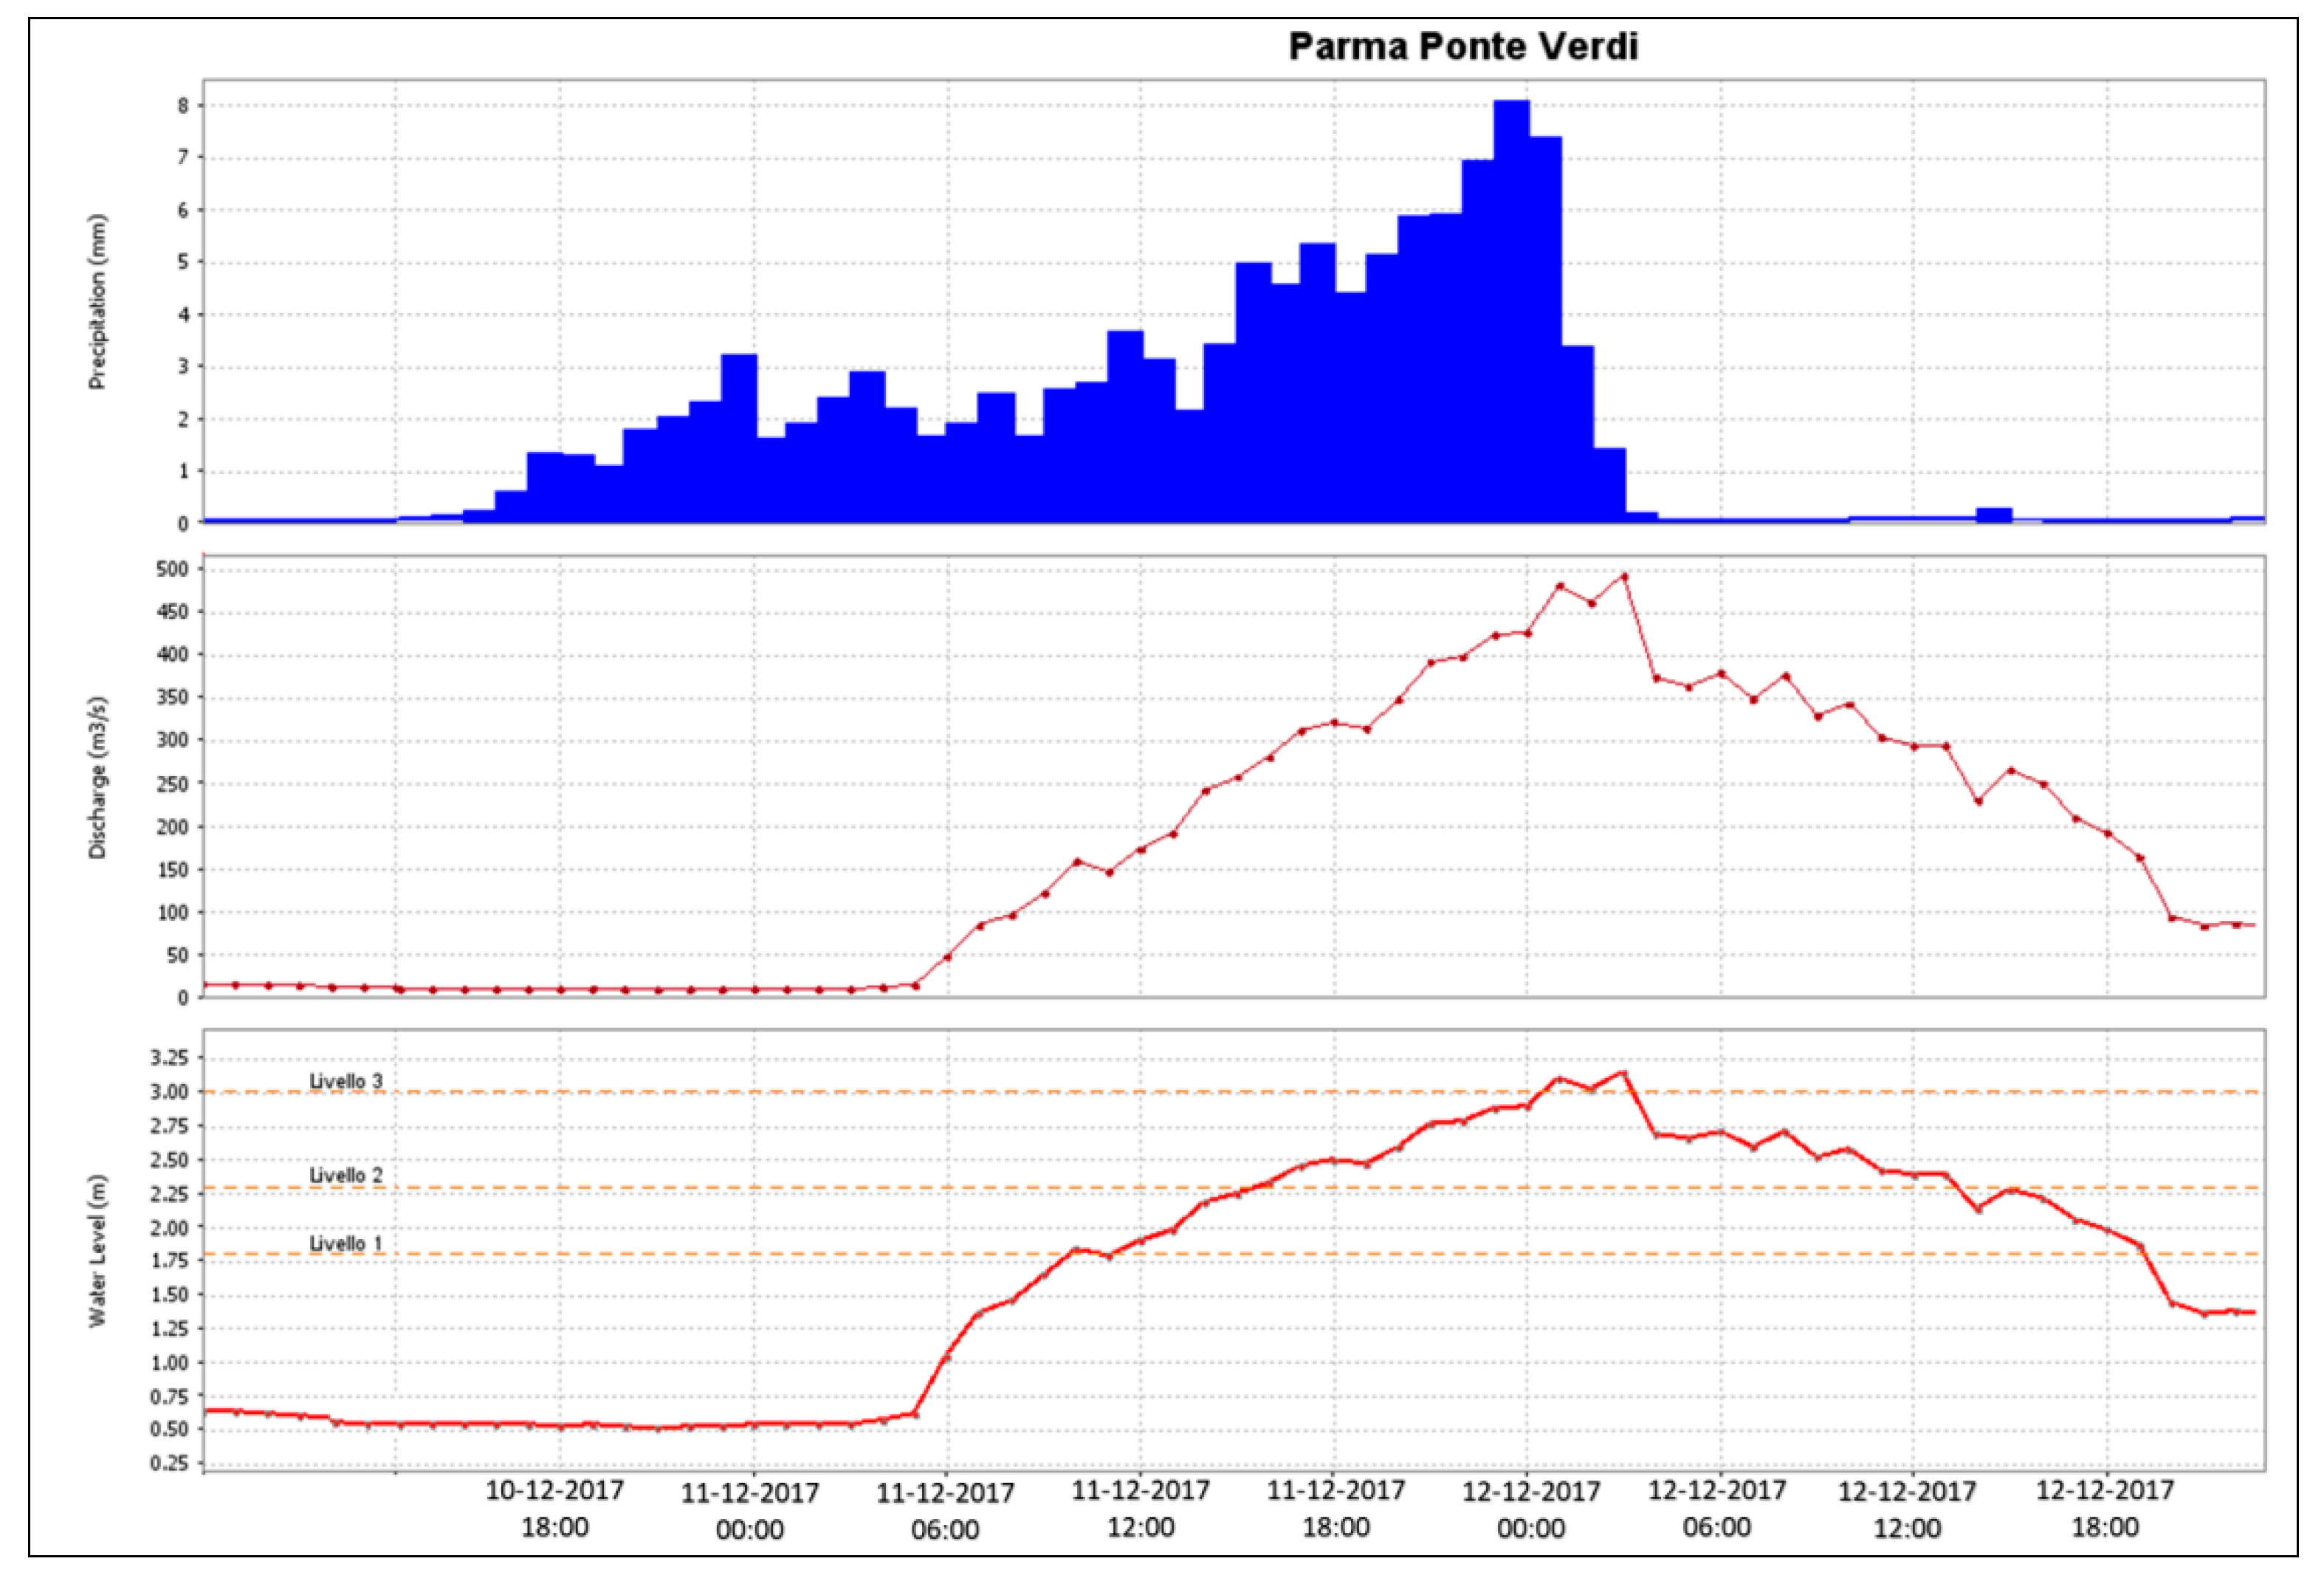
3.4. Hydrologic Forecast
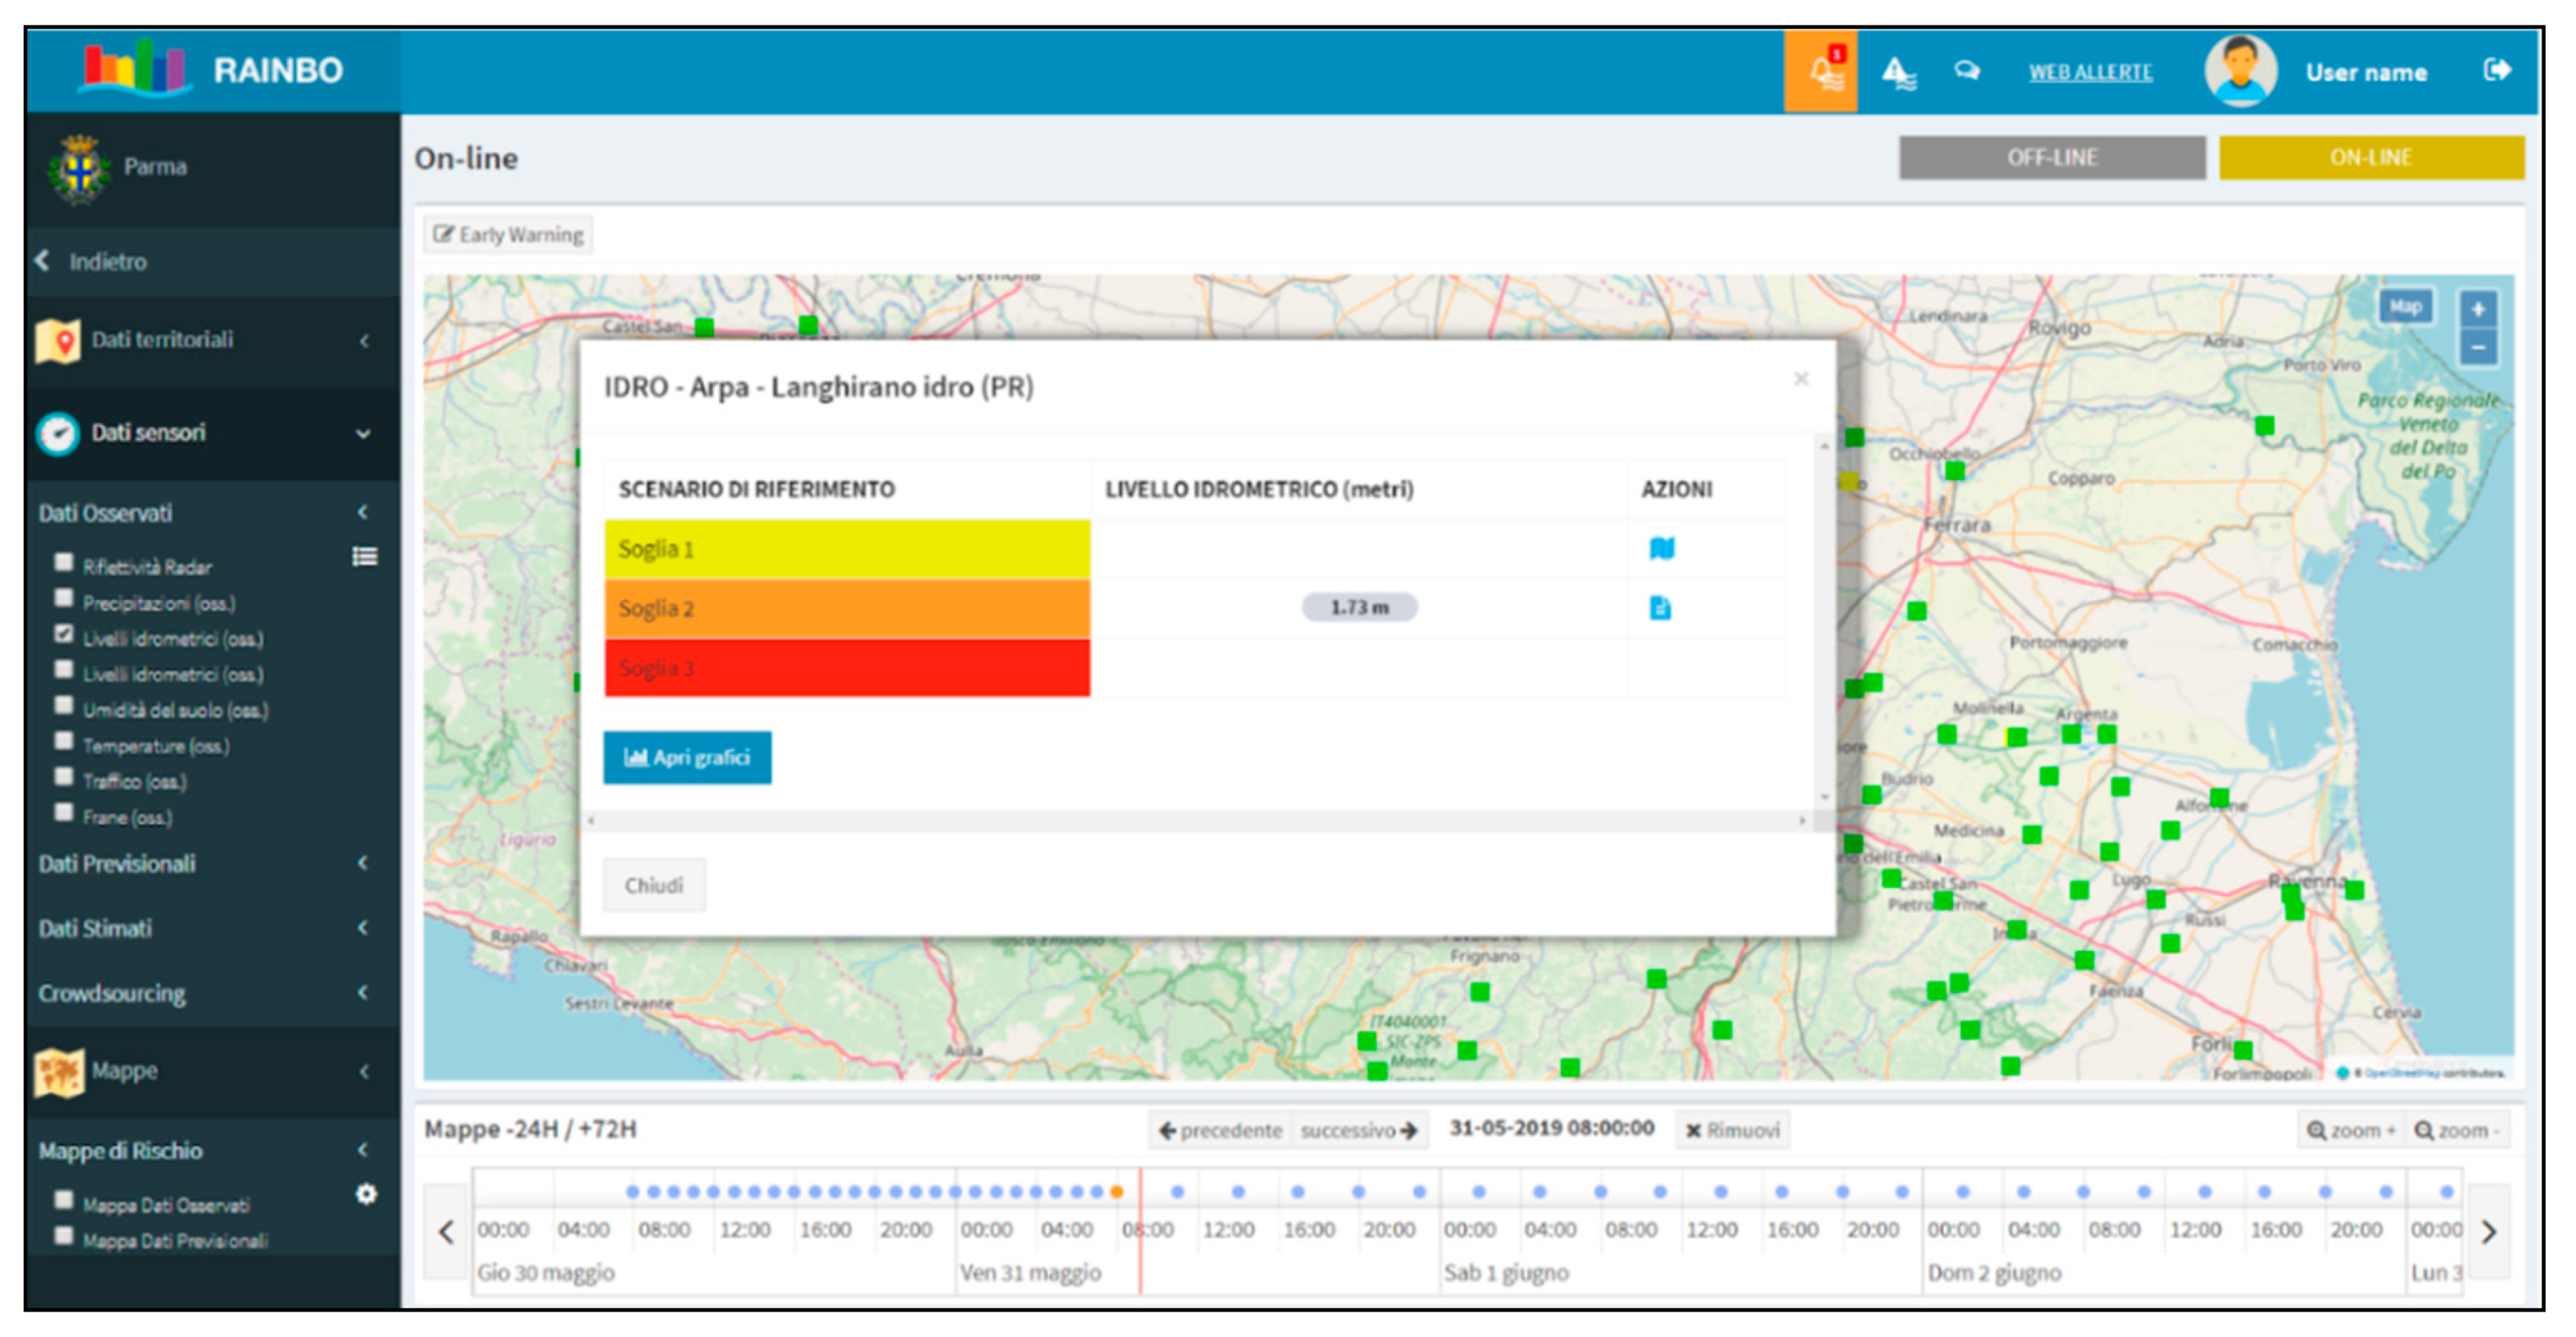
3.5. Early Warning Module
3.6. Discussion
- Vulnerability map calculation module (for hydraulic risk purposes)
- Integration of observed, estimated, and predicted data
- Hydrological simulation model for small basins
4. Conclusions
- The platform is addressed to decision-makers but not to citizens (the citizens can only send information through crowdsourcing)
- The hydrologic models used within the platform have to be calibrated and validated if applied in different river basins, therefore they are not easily replicable in other contexts
- A very large amount of information can be challenging to manage
Author Contributions
Funding
Acknowledgments
Conflicts of Interest
References
- IPCC. IPCC Special Report on Managing the Risks of Extreme Events and Disasters to Advance Climate Change Adaptation (SREX); Cambridge University Press: Cambridge, UK, 2012. [Google Scholar]
- EEA. Climate Change, Impacts and Vulnerability in Europe—An Indicator-Based Report; EEA: Copenhagen, Denmark, 2017. [Google Scholar]
- Blöschl, G.; Hall, J.; Parajka, J.; Perdigão, R.A.; Merz, B.; Arheimer, B.; Čanjevac, I. Changing climate shifts timing of European floods. Science 2017, 357, 588–590. [Google Scholar] [CrossRef] [PubMed] [Green Version]
- Blöschl, G.; Hall, J.; Zivkovic, N. Changing climate both increases and decreases European river floods. Nature 2019, 573, 108–111. [Google Scholar] [CrossRef] [PubMed]
- Alfieri, L.; Burek, P.; Feyen, L.; Forzieri, G. Global warming increases the frequency of river floods in Europe. Hydrol. Earth Syst. Sci. 2015, 19, 2247–2260. [Google Scholar] [CrossRef] [Green Version]
- EU, Directive 2007/60/EC of the European Parliament and of the Council of 23 October 2007 on the Assessment and Management of Flood Risks. 6.11. 2007, pp. 27–34. Available online: https://eur-lex.europa.eu/legal-content/EN/TXT/?uri=CELEX:32007L0060 (accessed on 26 November 2019).
- Alfieri, L.; Salamon, P.; Pappenberger, F.; Wetterhall, F.; Thielen, J. Operational early warning systems for water-related hazards in Europe. Environ. Sci. Policy 2012, 21, 35–49. [Google Scholar] [CrossRef]
- UNEP. Early Warning Systems: A State of the Art Analysis and Future Directions; UNEP: Nairobi, Kenya, 2012. [Google Scholar]
- UNFCCC. Adoption of the Paris Agreement; UN Framework Convention on Climate Change: Bonn, Germany, 2015. [Google Scholar]
- UNISDR. Sendai Framework for Disaster Risk Reduction 2015–2030; United Nations: Geneva, Switzerland, 2015. [Google Scholar]
- UNDRR. Global Assessment Report on Disaster Risk Reduction; United Nations: Geneva, Switzerland, 2019. [Google Scholar]
- Golnaraghi, M. Institutional Partnerships in Multi-Hazard Early Warning Systems; Springer: Berlin/Heidelberg, Germany, 2008; pp. 1–8. [Google Scholar]
- Bouwer, L.; Papyrakis, E.; Poussin, J.; Pfurtscheller, C.; Thieken, A. The costing of measures for natural hazard mitigation in Europe. Nat. Hazards Rev. 2014, 15, 04014010. [Google Scholar] [CrossRef]
- UN. Transforming Our World: The 2030 Agenda for Sustainable Development; United Nations: New York, NY, USA, 2015. [Google Scholar]
- UNISDR. Disaster Risk Reduction and Resilience in the 2030 Agenda for Sustainable Development; United Nations: Geneva, Switzerland, 2015. [Google Scholar]
- Hapuarachchi, H.A.P.; Wang, Q.J.; Pagano, T.C. A review of advances in flash flood forecasting. Hydrol. Process. 2011, 25, 2771–2784. [Google Scholar] [CrossRef]
- Jain, S.K.; Mani, P.; Jain, S.K.; Prakash, P.; Singh, V.P.; Tullos, D.; Kumar, S.; Agarwal, S.P.; Dimri, A.P.A. Brief review of flood forecasting techniques and their applications. Int. J. River Basin Manag. 2018, 16, 329–344. [Google Scholar] [CrossRef]
- Acosta-Coll, M.; Ballester-Merelo, F.; Martinez-Peiró, M.; De la Hoz-Franco, E. Real-Time Early Warning System Design for Pluvial Flash Floods-A Review. Sensors 2018, 18, 2255. [Google Scholar] [CrossRef] [PubMed] [Green Version]
- EU. Establishing the Urban Agenda for the EU ‘Pact of Amsterdam’. Agreed at the Informal Meeting of EU Ministers Responsible for Urban Matters on 30 May 2016 in Amsterdam, The Netherlands; EU: Brussels, Belgium, 2016. [Google Scholar]
- UN. New Urban Agenda; United Nations: Geneva, Switzerland, 2017. [Google Scholar]
- URBAN-PREX–Interreg Project. Available online: http://www.urban-prex.org/ (accessed on 18 November 2019).
- RAINGAIN–Interreg Project. Available online: http://www.raingain.eu/en/interreg-ivb-north-west-europe-programme-1 (accessed on 18 November 2019).
- STAR-FLOOD FP7 Project. Available online: https://www.starflood.eu/ (accessed on 18 November 2019).
- FLOOD-SERV Horizon 2020 Project. Available online: http://www.floodserv-project.eu/ (accessed on 18 November 2019).
- Climatic Tables of Emilia-Romagna. Available online: https://www.arpae.it/dettaglio_generale.asp?id=4143&idlivello=1591 (accessed on 26 November 2019).
- Grazzini, F.; Dottori, F.; Di Lorenzo, M.; Spisni, A.; Tomei, F. Nubifragi e Rischio Idraulico Nella Collina Bolognese: Il Caso Studio del Torrente Ravone; Public Report of Arpae; Arpae: Bologna, Italy, 2013.
- Bracaloni, A. Analisi del Rischio Idraulico in Ambiente Urbano: Il Caso del Torrente Ravone a Bologna. Master’s Thesis, University of Bologna, Bologna, Italy, 10 March 2016. [Google Scholar]
- Dottori, F.; Grazzini, F.; Di Lorenzo, M.; Spisni, A.; Tomei, F. Analysis of flash flood scenarios in an urbanized catchment using a two-dimensional hydraulic model. In Proceedings of the International Association of Hydrological Sciences, Bologna, Italy, 4–6 June 2014. [Google Scholar]
- Technical Reports of Hydro-Meteo Events in Emilia-Romagna. Available online: https://www.arpae.it/documenti_find.asp?parolachiave=sim_rapportoradar&cerca=si&idlivello=64 (accessed on 18 October 2019).
- Nanni, S.; Mazzini, G. Advanced Infrastructure for Environmental Monitoring and Early-Warning System Integration, Sensor Networks. In International Conference on Sensor Networks; Benavente-Peces, C., Cam-Winget, N., Fleury, E., Ahrens, A., Eds.; Springer Nature: Basel, Switzerland, 2019. [Google Scholar]
- Numerical Weather Forecasts of Emilia-Romagna. Open Data of ARPAE. Available online: https://dati.arpae.it/fa_IR/dataset/previsioni-meteorologiche-numeriche-emilia-romagna (accessed on 18 October 2019).
- Lanza, L.; Stagi, L. Certified accuracy of rainfall data as a standard requirement in scientific investigations. Adv. Geosci. 2008, 16, 43–48. [Google Scholar] [CrossRef] [Green Version]
- Porcù, F.; Milani, L.; Petracca, M. On the uncertainties in validating satellite instantaneous rainfall estimates with raingauge operational network. Atmos. Res. 2014, 144, 73–81. [Google Scholar] [CrossRef]
- Casicci, L.; Ioiò, C.; Pecora, S. An operational system for the Po flood forecasting in Italy. In Proceedings of the 7th International Conference on Hydroinformatics, Nice, France, 4–8 September 2006. [Google Scholar]
- Zinevich, A.; Messer, H.; Alpert, P. Frontal Rainfall Observation by a Commercial Microwave Communication Network. J. Appl. Meteorol. Climatol. 2009, 48, 1317–1334. [Google Scholar] [CrossRef]
- Doumounia, A.; Gosset, M. Rainfall monitoring based on microwave links from cellular telecommunication networks: First results from a West African test bed. Geophys. Res Lett. 2014, 41, 6016–6022. [Google Scholar] [CrossRef]
- Overeem, A.; Leijnse, H.; Uijlenhoet, R. Country-wide rainfall maps from cellular communication networks. Proc. Natl. Acad. Sci. USA 2013, 110, 2741–2745. [Google Scholar] [CrossRef] [PubMed] [Green Version]
- Radar Meteo. Open Data of ARPAE. Available online: https://dati.arpae.it/dataset/radar-meteo (accessed on 18 October 2019).
- Rmap Participatory Monitoring and Exchange System. Available online: http://rmap.cc/ (accessed on 18 October 2019).
- Marletto, V.; Ventura, F.; Fontana, G.; Tomei, F. Wheat growth simulation and yield prediction with seasonal forecasts and a numerical model. Agric. For. Meteorol. 2007, 147, 71–79. [Google Scholar] [CrossRef]
- Tomei, F.; Antolini, G.; Bittelli, M.; Marletto, V.; Pasquali, A.; Van Soetendael, M. Validazione del modello di bilancio idrico CRITERIA. Ital. J. Agrometeorol. 2007, 1, 66–67. [Google Scholar]
- Bittelli, M.; Tomei, F.; Pistocchi, A.; Flury, M.; Boll, J.; Brooks, E.S.; Antolini, G. Development and testing of a physically based, three-dimensional model of surface and subsurface hydrology. Adv. Water Resour. 2010, 33, 106–122. [Google Scholar] [CrossRef]
- CRITERIA-3D. Open Source Code of ARPAE. Available online: https://github.com/ARPA-SIMC/CRITERIA3D/wiki/CRITERIA3D (accessed on 18 October 2019).
- Breiman, L. Random Forests. Mach. Learn. 2001, 45, 5. [Google Scholar] [CrossRef] [Green Version]
- RAINLINK Retrieval Algorithm Open Source Code. Available online: https://github.com/overeem11/RAINLINK (accessed on 30 October 2019).
- Crowdsourcing App Rmap4RainBO. Available online: https://partecipa.RainBOlife.eu (accessed on 30 October 2019).
- RainBO Platform. Available online: http://webgis.rainbolife.eu/prototipo/01-tempo-di-pace.html (accessed on 18 October 2019).


| Variable | Bologna | Parma |
|---|---|---|
| Minimum temperatures (unit: °C) | 9.88 | 8.76 |
| Maximum temperatures (unit: °C) | 19.27 | 19.14 |
| Mean temperatures (unit: °C) | 14.59 | 13.95 |
| Precipitation (unit: mm) | 775.7 | 795.3 |
| Thr/hrs | 07:00 A.M. | 08:00 A.M. | 09:00 A.M. | 10:00 A.M. | 12:00 A.M. | 02:00 P.M. | 04:00 P.M. | 06:00 P.M. | 08:00 P.M. | 10:00 P.M. | 00:00 A.M. | 02:00 A.M. | 03:00 A.M. |
|---|---|---|---|---|---|---|---|---|---|---|---|---|---|
| 1 | 52 | 54 | 67 | 87 | 90 | 96 | 100 | 100 | 100 | 100 | 100 | 100 | 100 |
| 2 | 11 | 10 | 10 | 11 | 22 | 45 | 76 | 90 | 96 | 99 | 99 | 99 | 99 |
| 3 | 0 | 0 | 1 | 0 | 1 | 4 | 12 | 44 | 73 | 81 | 89 | 83 | 74 |
© 2019 by the authors. Licensee MDPI, Basel, Switzerland. This article is an open access article distributed under the terms and conditions of the Creative Commons Attribution (CC BY) license (http://creativecommons.org/licenses/by/4.0/).
Share and Cite
Villani, G.; Nanni, S.; Tomei, F.; Pasetti, S.; Mangiaracina, R.; Agnetti, A.; Leoni, P.; Folegani, M.; Mazzini, G.; Botarelli, L.; et al. The RainBO Platform for Enhancing Urban Resilience to Floods: An Efficient Tool for Planning and Emergency Phases. Climate 2019, 7, 145. https://doi.org/10.3390/cli7120145
Villani G, Nanni S, Tomei F, Pasetti S, Mangiaracina R, Agnetti A, Leoni P, Folegani M, Mazzini G, Botarelli L, et al. The RainBO Platform for Enhancing Urban Resilience to Floods: An Efficient Tool for Planning and Emergency Phases. Climate. 2019; 7(12):145. https://doi.org/10.3390/cli7120145
Chicago/Turabian StyleVillani, Giulia, Stefania Nanni, Fausto Tomei, Stefania Pasetti, Rita Mangiaracina, Alberto Agnetti, Paolo Leoni, Marco Folegani, Gianluca Mazzini, Lucio Botarelli, and et al. 2019. "The RainBO Platform for Enhancing Urban Resilience to Floods: An Efficient Tool for Planning and Emergency Phases" Climate 7, no. 12: 145. https://doi.org/10.3390/cli7120145
APA StyleVillani, G., Nanni, S., Tomei, F., Pasetti, S., Mangiaracina, R., Agnetti, A., Leoni, P., Folegani, M., Mazzini, G., Botarelli, L., & Castellari, S. (2019). The RainBO Platform for Enhancing Urban Resilience to Floods: An Efficient Tool for Planning and Emergency Phases. Climate, 7(12), 145. https://doi.org/10.3390/cli7120145