3.1. Physical and Chemical Attributes
Over the 17 month study period, 16 events generated discharge in one or more streams (
Table 2). Precipitation was monitored for 12 months (May 2010 through May 2011;
Figure 2) and ranged from 21–110 mm per event with a mean of 55 mm. The maximum precipitation rate occurred at the onset of an event and ranged from 10–72 mm h
−1 with a mean of 36 mm h
−1. Precipitation between January and May accounted for 53% of the annual total and 94% of the discharge events over 15 months. Event duration ranged from 1.0 h to 22.3 h with a mean of 8.0 h. Precipitation events triggered 233 flow event samples ranging from a total of 14 to 82 samples per watershed per event (
Table 1). Mean event discharge across all recorded events for ephemeral and perennial streams was 749 m
3 event
−1 and 7324 m
3 event
−1, respectively.
Particulate constituent concentrations among ES were highly variable (
Table 2-A). The TSS concentration ranged from 54.1 mg L
−1 to 1713.0 mg L
−1, and POC concentrations ranged from 2.27 mg L
−1 to 21.33 mg L
−1. Average ES TSS (566.1 mg L
−1; instantaneous flow-weighted average across all streams and storms of within-event measurements; from
Table 2) was higher than that of the perennial stream (101.1 mg L
−1) by a factor of 5.6; thus, it appears that the perennial stream was a sink for suspended solids. Average ES POC concentration (9.30 mg L
−1) was higher than that of the perennial stream (3.46 mg L
−1) by a factor of 2.7.
Dissolved constituent values DOC, Cl, UVA
254, and specific UV absorbance at 254 nm (SUVA
254) were consistent among ES (
Table 2-A). The UVA
254 of ES was consistently higher than that of the perennial stream, probably due to the average DOC being (14.51 mg L
−1) 2.5 times higher than that of the perennial stream (5.83 mg L
−1). The SUVA
254, on the other hand, was similar among perennial and ES. The ES Cl concentration was consistently lower than that of the perennial stream indicating that the perennial stream acquired Cl from another source(s).
We quantified concentrations of five potential source contributors to surface waters: precipitation, canopy throughfall, O-horizon soil leachate, mineral soil leachate, and groundwater (
Table 2). The DOC concentration increased from precipitation through the canopy as throughfall and O-horizon leachate then declined through the soil profile reaching a minimum in the groundwater samples suggesting that it was removed or diluted with depth. The Cl concentrations generally increased from the canopy through the soil and into the groundwater. The Cl concentration of ephemeral event water was similar to that of canopy throughfall and O-horizon soil, whereas the Cl concentration in perennial event water was most similar to that of mineral soil leachate and groundwater. There was a strong linear correlation (Pearson’s
R = 0.923,
p < 0.001) between UVA
254 absorbance and DOC concentration, explaining the similar pattern between UVA
254 and DOC. The UVA
254 in precipitation was low but increased as water passed through the forest canopy. Highest UVA
254 levels were observed in O-horizon leachates; UVA
254 decreased with depth as water passed through the soil profile. Mean UVA
254 in ES water (0.56) was nearly three times that of perennial stream water (0.19) suggesting that C was lost or diluted during transport. The ratio of DON:DOC was highest in precipitation and groundwater and reached minimums in throughfall and mineral soil leachate while being relatively high in the O-horizon. Organic horizon water had the most depleted DOC-δ
13C, and there was a steady enrichment with soil depth (O, A, to groundwater). The DON:DOC had a relatively small standard error among potential sources and, hence, is probably a good tracer of DOM in stream water. On the other hand, the stable isotopic composition of DOC varied <2‰ among stream water and <4‰ among potential sources; therefore, DOC is indistinguishable from potential sources using stable isotopic signature alone (
Table 2). Ephemeral stream DON:DOC and %OC was consistently lower than that of the perennial stream and most closely resembled that of O-horizon leachate, except within the disturbed clear-cut site in which DON:DOC resembled that of mineral soil. Perennial stream DON:DOC was similar to that of groundwater and precipitation. The POC:DOC was similar for ES and perennial stream waters; however, %OC of the perennial stream was significantly higher (
p = 0.002) than that of ES. Mean ES PON-δ
15N was 1.4 (ranged 0.9 to 2.0) as compared to 1.0 in perennial stream water (
Table 2). The PON:POC was similar among streams.
We calculated the area-weighted average instantaneous flux for all storms over the water year. Instantaneous flux is the flow-weighted flux at a given time within an event; thus, instantaneous flux could represent a point on the rising limb, peak flow, or the receding limb of an event. Values represent the means for all events in which we were able to collect water samples and quantify Q with rating curves (
Table 3). Average Q was higher in the perennial stream than in the ES (
Table 1); however, area-weighted discharge (Unit Q) in the ES was more than twice that of the downstream perennial stream (
Table 3), even though the overall area was the same for the ES and perennial streams. Event sampling in ES was triggered by a 20 mm increase in flow over 15 min; thus, the Unit Q measurements only represent periods of high flow (storms) in the ES. There was higher Unit Q from the ES than at the downstream perennial stream gauge suggesting that some of the water discharged to the perennial stream was lost to groundwater before exiting the perennial stream gauge.
The ES exports were 2.0–6.5 times that of the perennial stream, depending upon the parameter (
Table 3). Unit Q was higher for the ephemeral streams as a result of this value being calculated from the sample set from which the constituents were determined. The ephemeral catchments are very small—from 1.8–3.8 ha; yet during storms, their exports were significant which has implications for changes in storm events due to the climate forcing. Surface water, groundwater, and soil storage water are linked, so we used geochemical signatures from the stream exports and potential source areas in order to understand how the pools and fluxes might interact with changes in climate.
3.2. Source of OM in Surface Waters during Storms: Active and Contributing Areas
In order to get a better understanding of whether ephemeral and perennial stream waters were derived from similar source areas and were therefore connected during storm events, we compared the Cl and UVA254 of ephemeral and perennial stream event water to that of groundwater and soil leachate. Cl was used as a conservative tracer of potential contributors to stream water and UVA254 was used as a first-order evaluation of DOC inputs. We used UVA254 rather than DOC because of the strong linear correlation between the two in our data and because the larger UVA254 dataset gave us better control on variability. The UVA254 and Cl had a significant negative correlation (R = –0.595, p < 0.001) such that during an event, UVA254 was elevated and Cl concentration was depleted with respect to base flow conditions. The relationship between Cl and UVA254 amongst pools suggests that ES Cl and DOC are controlled by water routing through the soil profile, whereas the perennial stream is influenced by groundwater inputs.
We did not attempt to quantify the relative contributions of groundwater versus Horton- and Dunne-type overland flow; however, we used OM characteristics of ES and potential source areas to clarify from which pools ES water may have been derived (
Figure 3 and
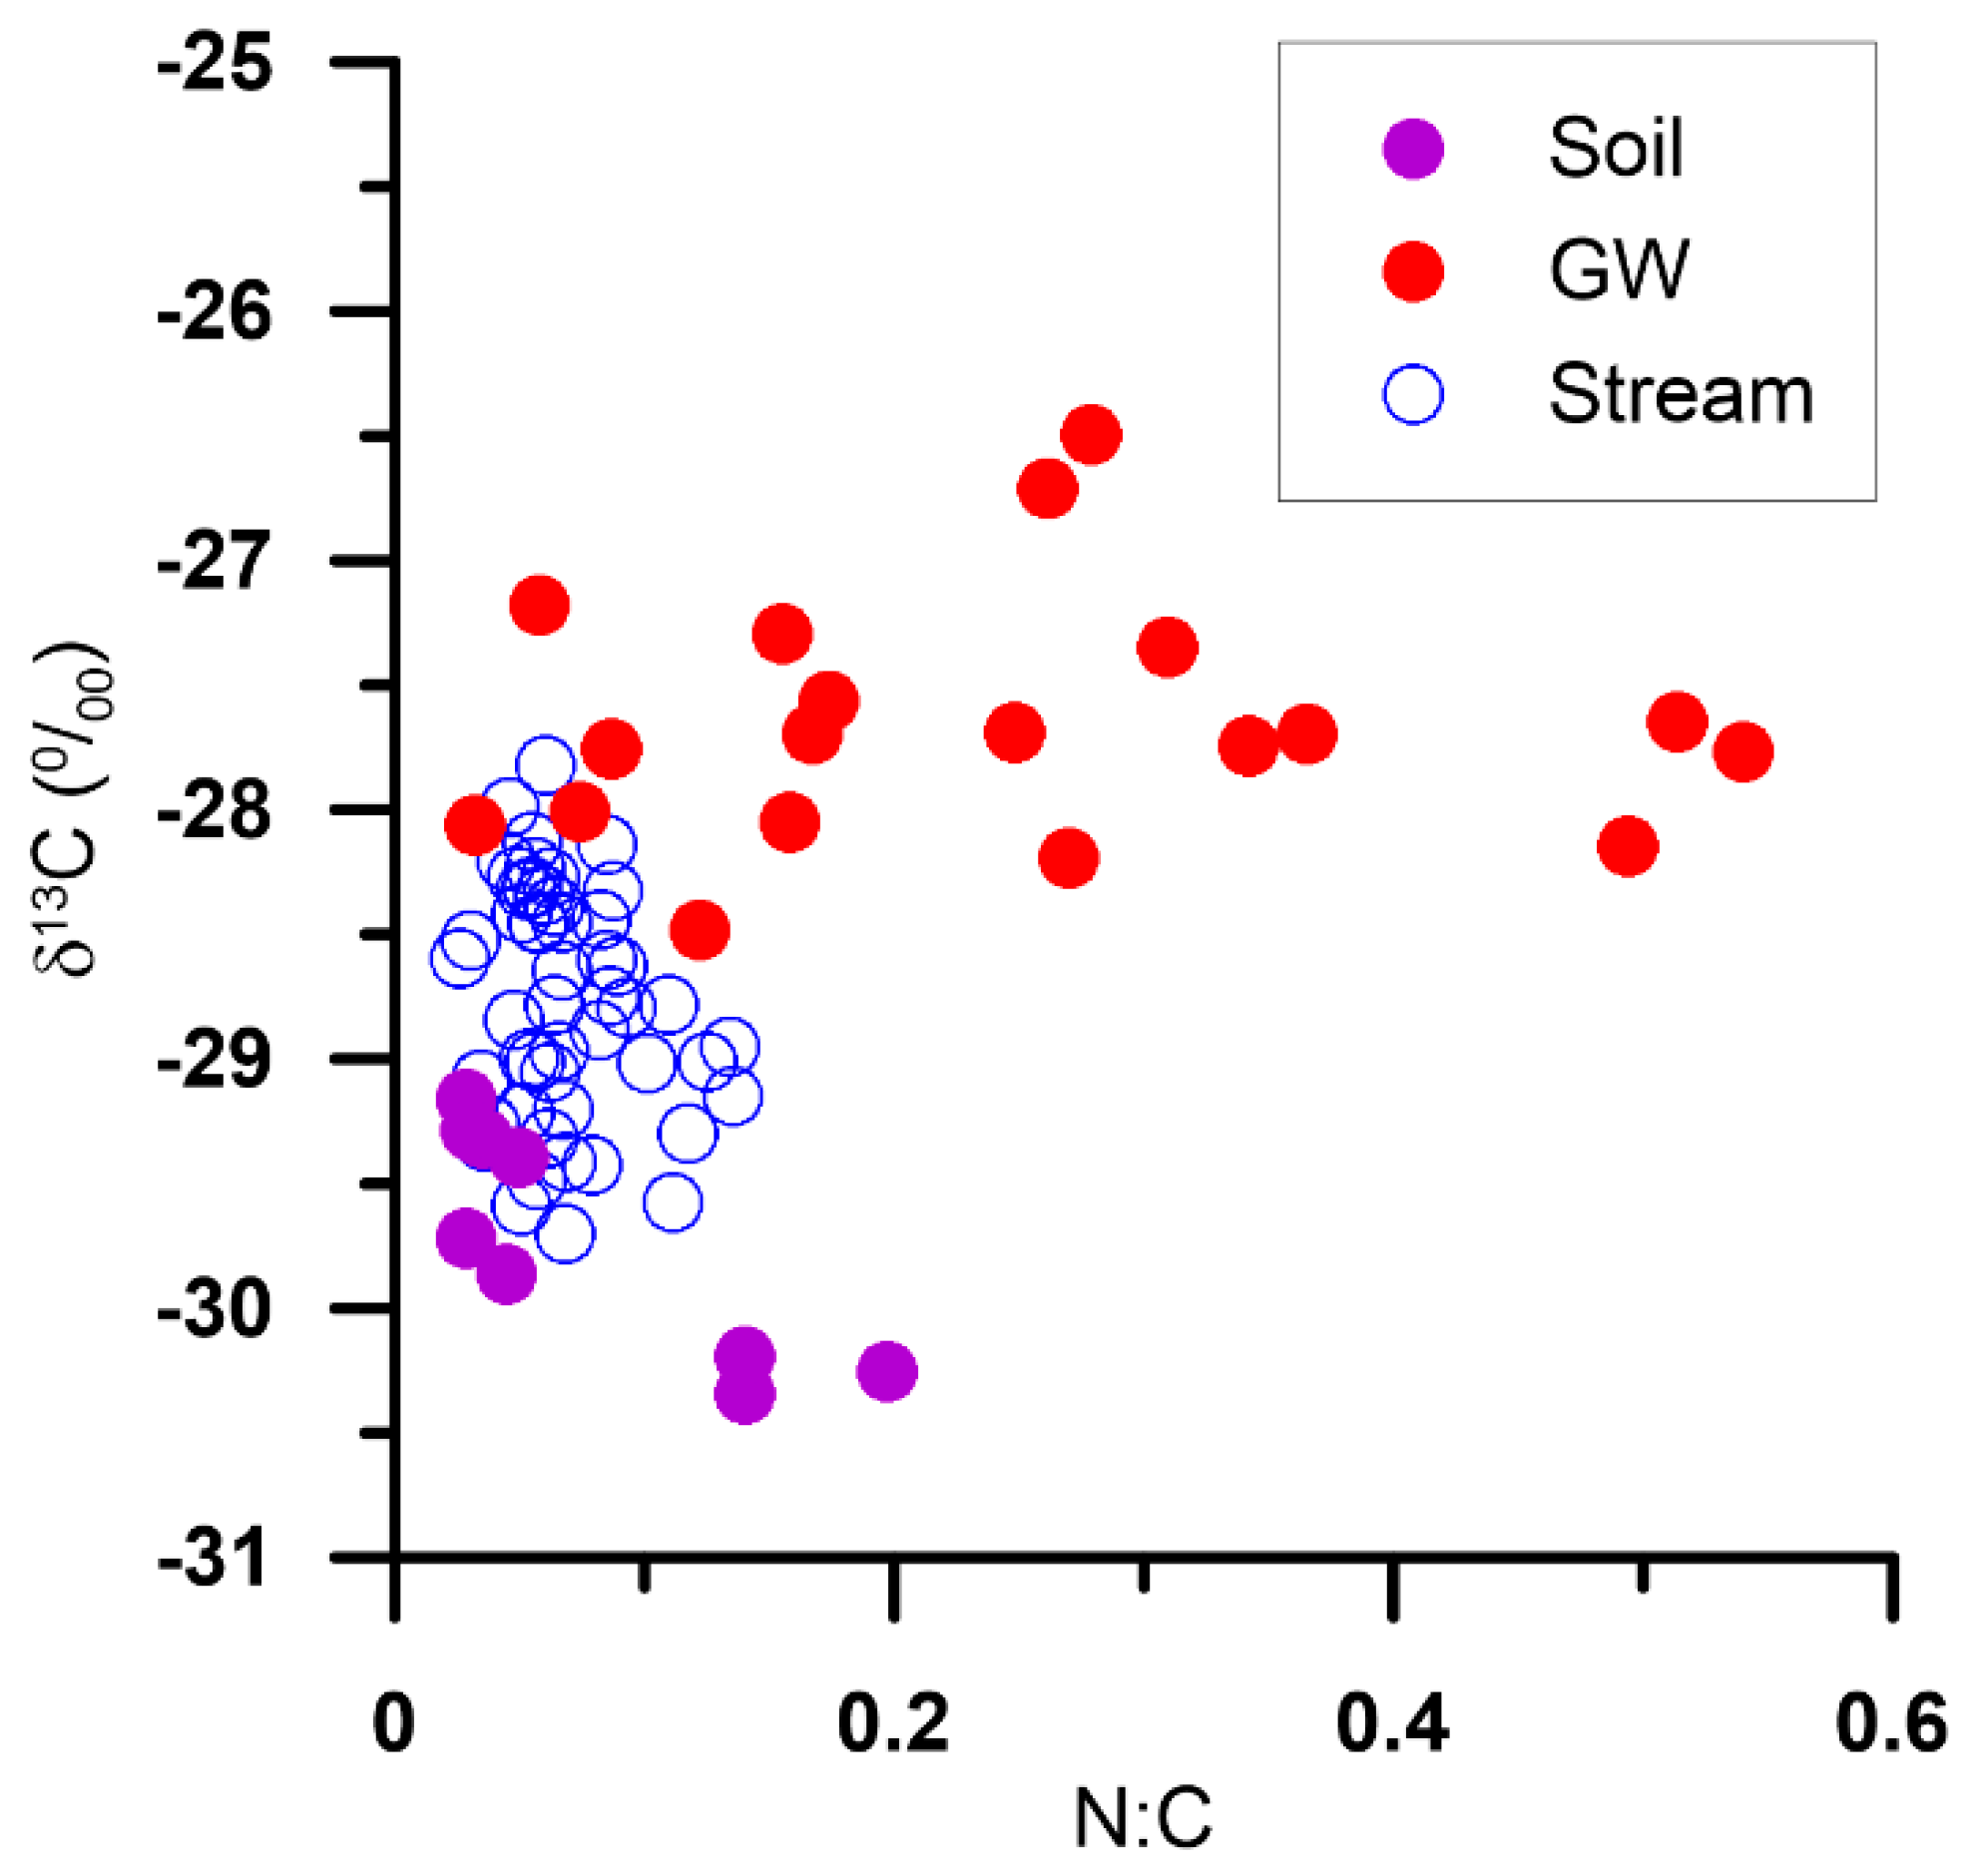
Figure 4). We did not attempt to trace N through the system; however, N and C cycling are coupled therefore we incorporated both components in source-attribution, and the ensuing discussion is framed in terms of OM. Ephemeral storm water DOC-δ
13C was intermediate between that of groundwater and soil solution dissolved OM with a DON:DOC composition close to that of soil solution and the
minimum DON:DOC value (max N:C value) for groundwater (
Figure 3).
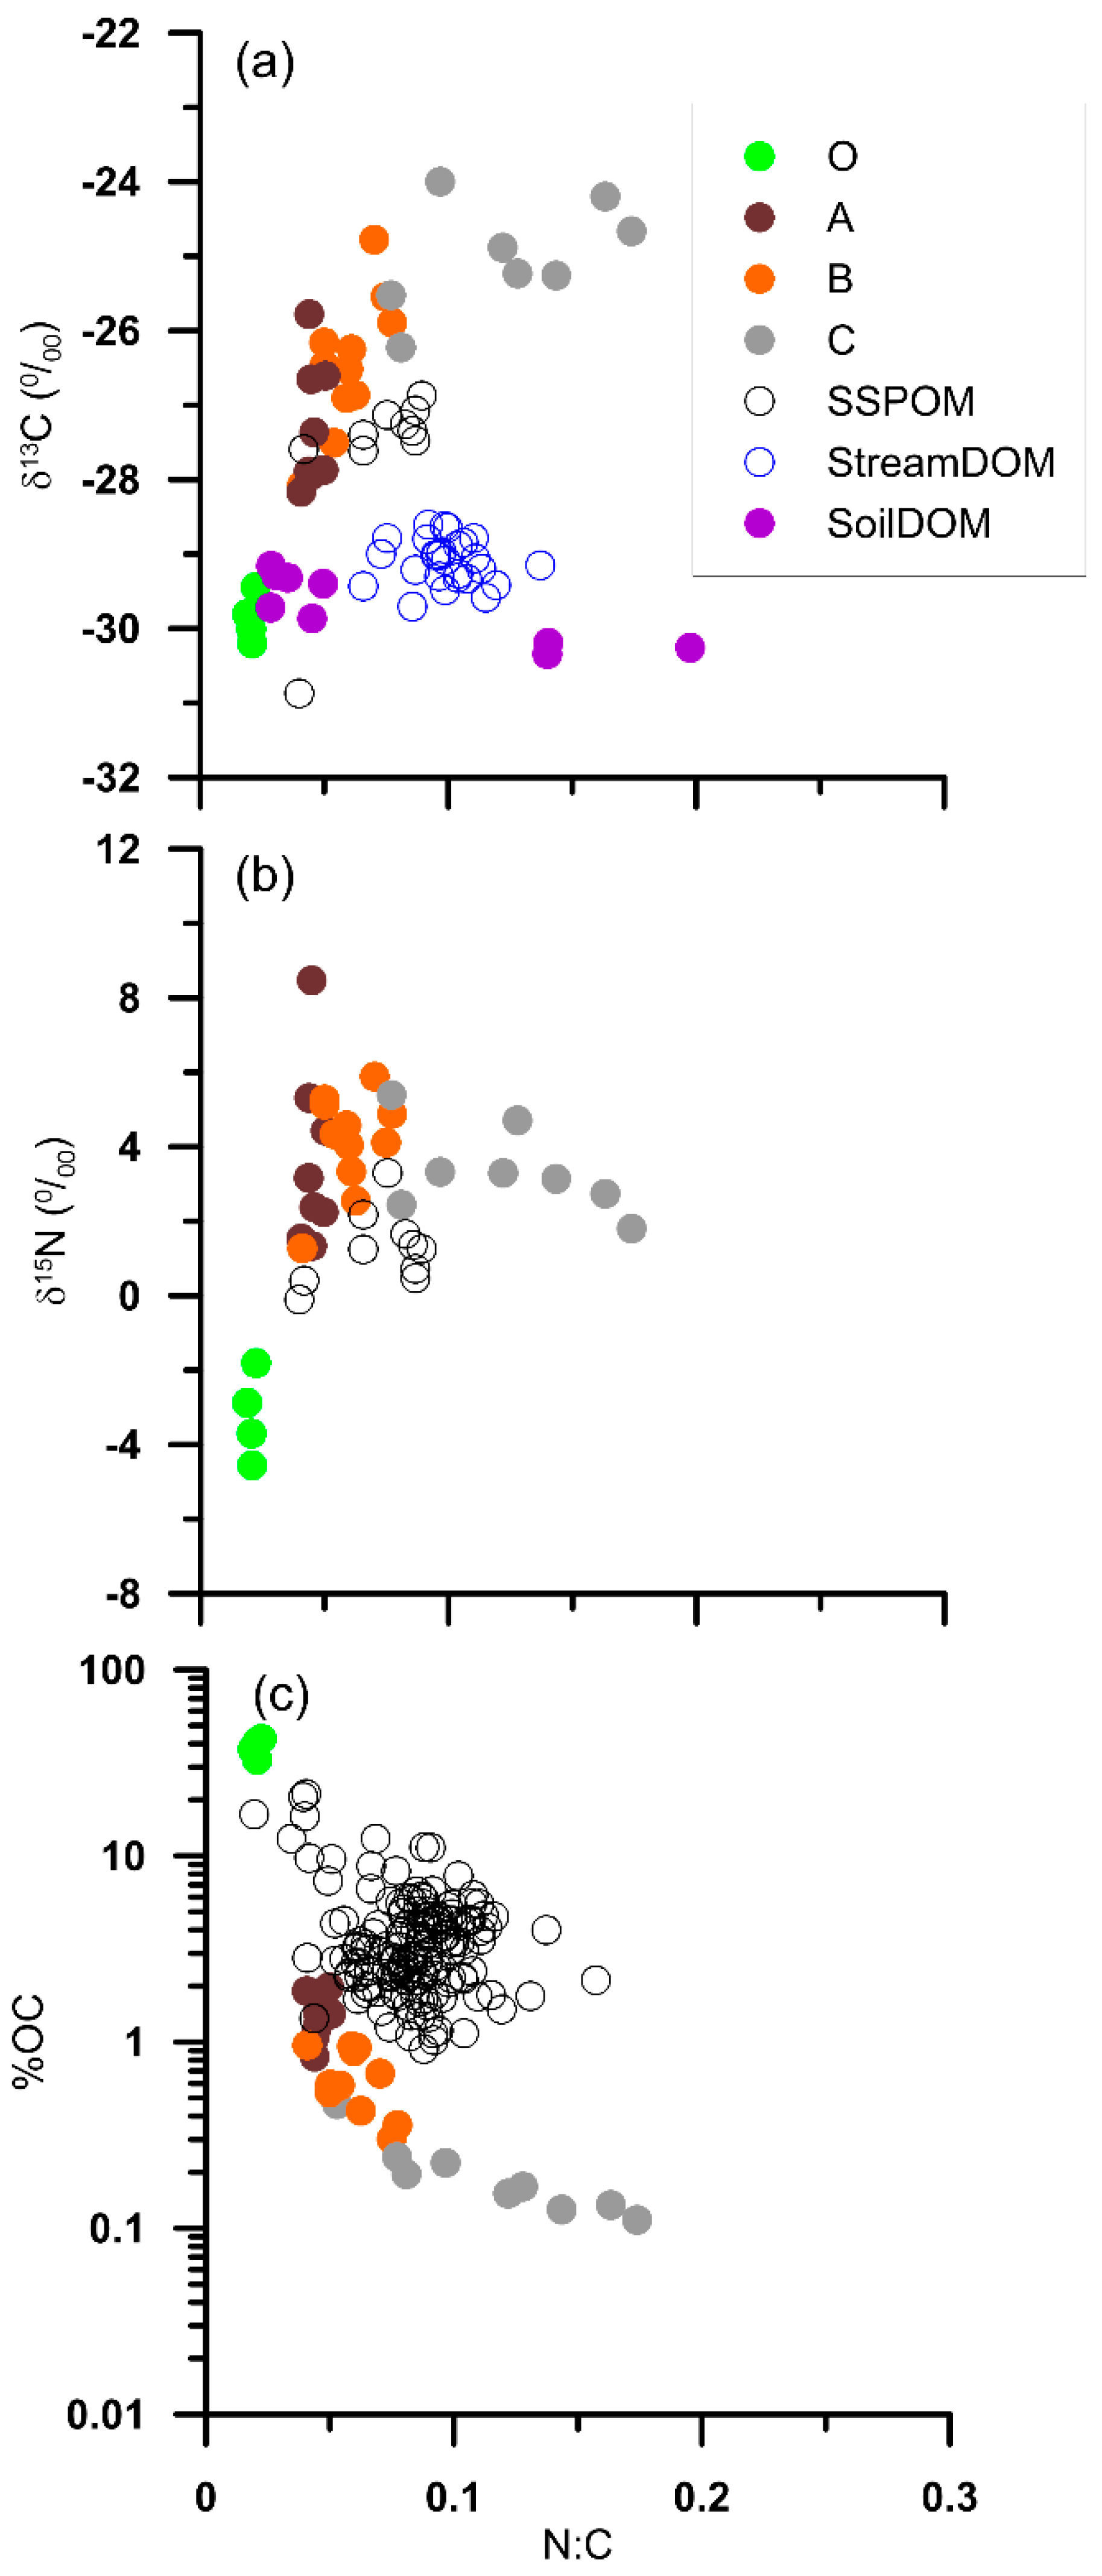
A comparison between DOM and suspended sediment particulate organic matter (POM) of ES collected during storm events (
Figure 4) illustrates the difference in source attributes for DOM and POM. Ephemeral stream DOM and suspended sediment POM clustered tightly in separate-δ
13C versus N:C mixing spaces: storm water plotted in a space that was close to intermediate soil dissolved OM values, whereas suspended sediment particulate DOM plotted closest to values of A- and B- horizon mineral soils (
Figure 4a). Soil leachate values plotted close to that of O-horizon POM (and to a lesser extend A-horizon POM) suggesting that O-horizon soils were an accessible source for labile DOM during storm events. Workers have reported that as much as 66% of DOC in stormflow from headwater streams originated as saturated flow through the uppermost soil horizons within the riparian zone [
50]. Estimated contributions from the upper portions of the soil profile (for lowland riparian soils) represent 64–86% of DOC flux in some watersheds (e.g., [
51]). High DOC values were attributed to a larger proportion of wetland soils (i.e., larger potential DOC pool) and larger watershed area [
51]. Storm-derived ES POM was more closely related to A-horizon and to a lesser extent B-horizon soils (
Figure 4a–c), which suggests that these soils are mobilized or reworked enough to release POM during storm events.
3.3. Storm-Driven C Dynamics
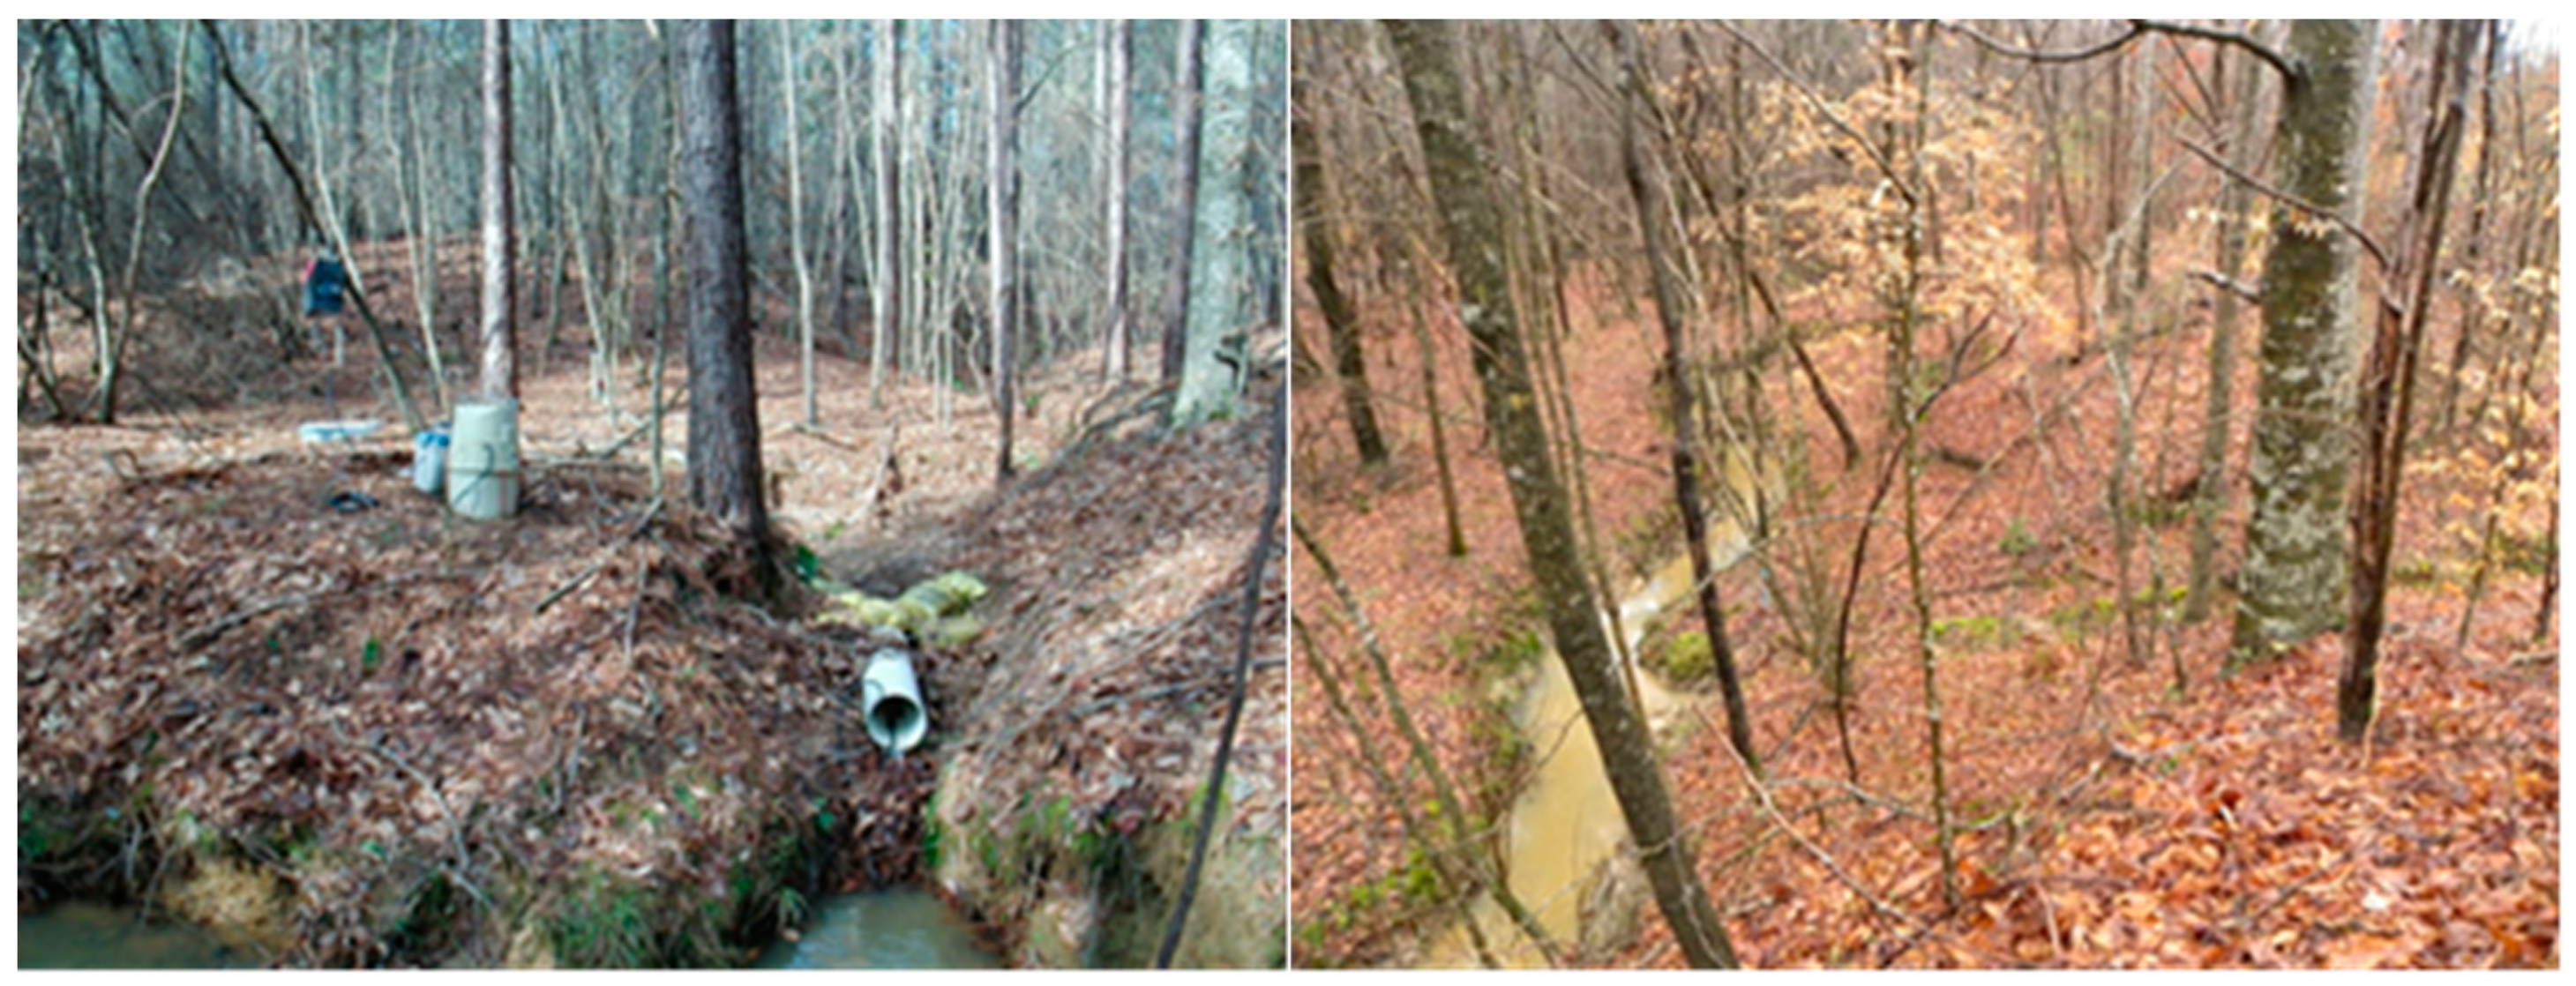
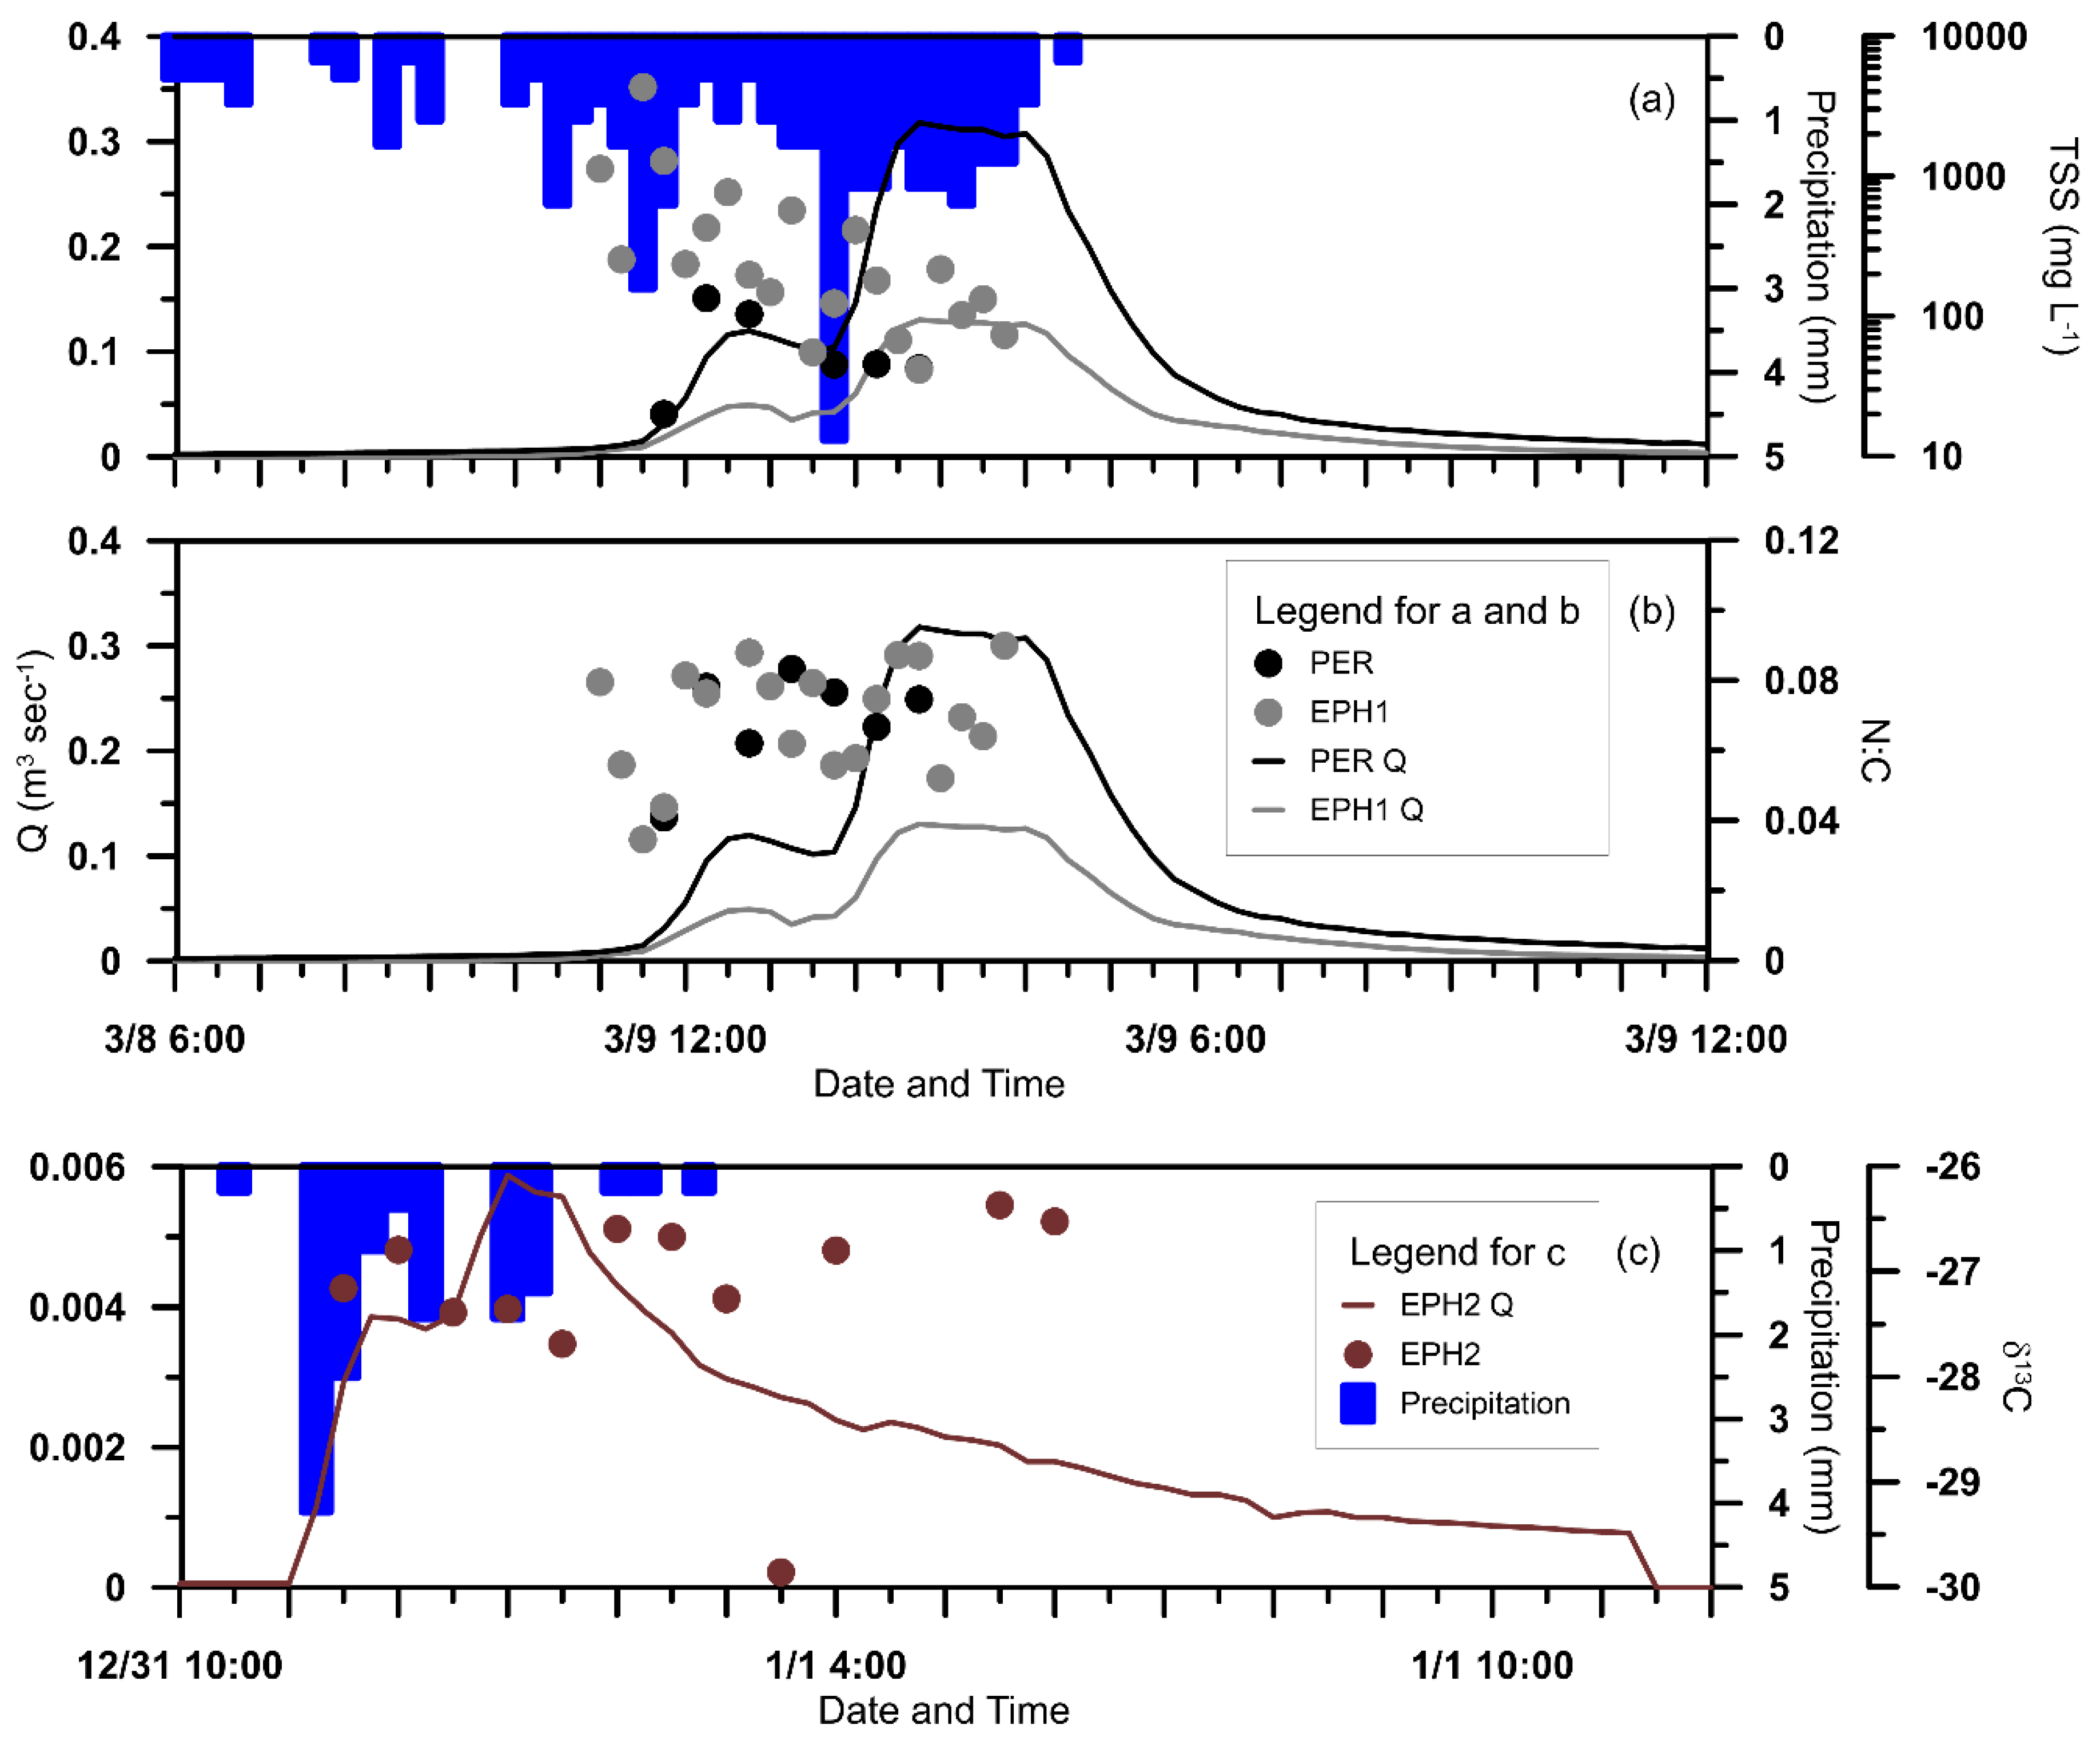
Samples collected during storm events provided evidence that the ES interacted with the soil profile during rainfall events. The next question we wanted to answer was whether the source or proportion of sources changed within a storm event. We selected storm events for which there was sufficient data to construct plots illustrating the behavior of TSS and OM over the course of an event (
Figure 5). The TSS concentrations in ES were highest at the start of an event before peak Q and declined as the event progressed (
Figure 5a). Peak perennial stream TSS concentration lagged behind ES peak TSS and coincided with an initial increase in Q. The N:C of particulate material remained constant as ES TSS decreased throughout an event (
Table 2 and
Figure 5b), thus there is a separation of C-poor material and C-rich material as the event progresses. There is a weak trend of enrichment in δ
13C with event time (
Figure 5c) which suggests a within-event shift in C to progressively deeper sources.
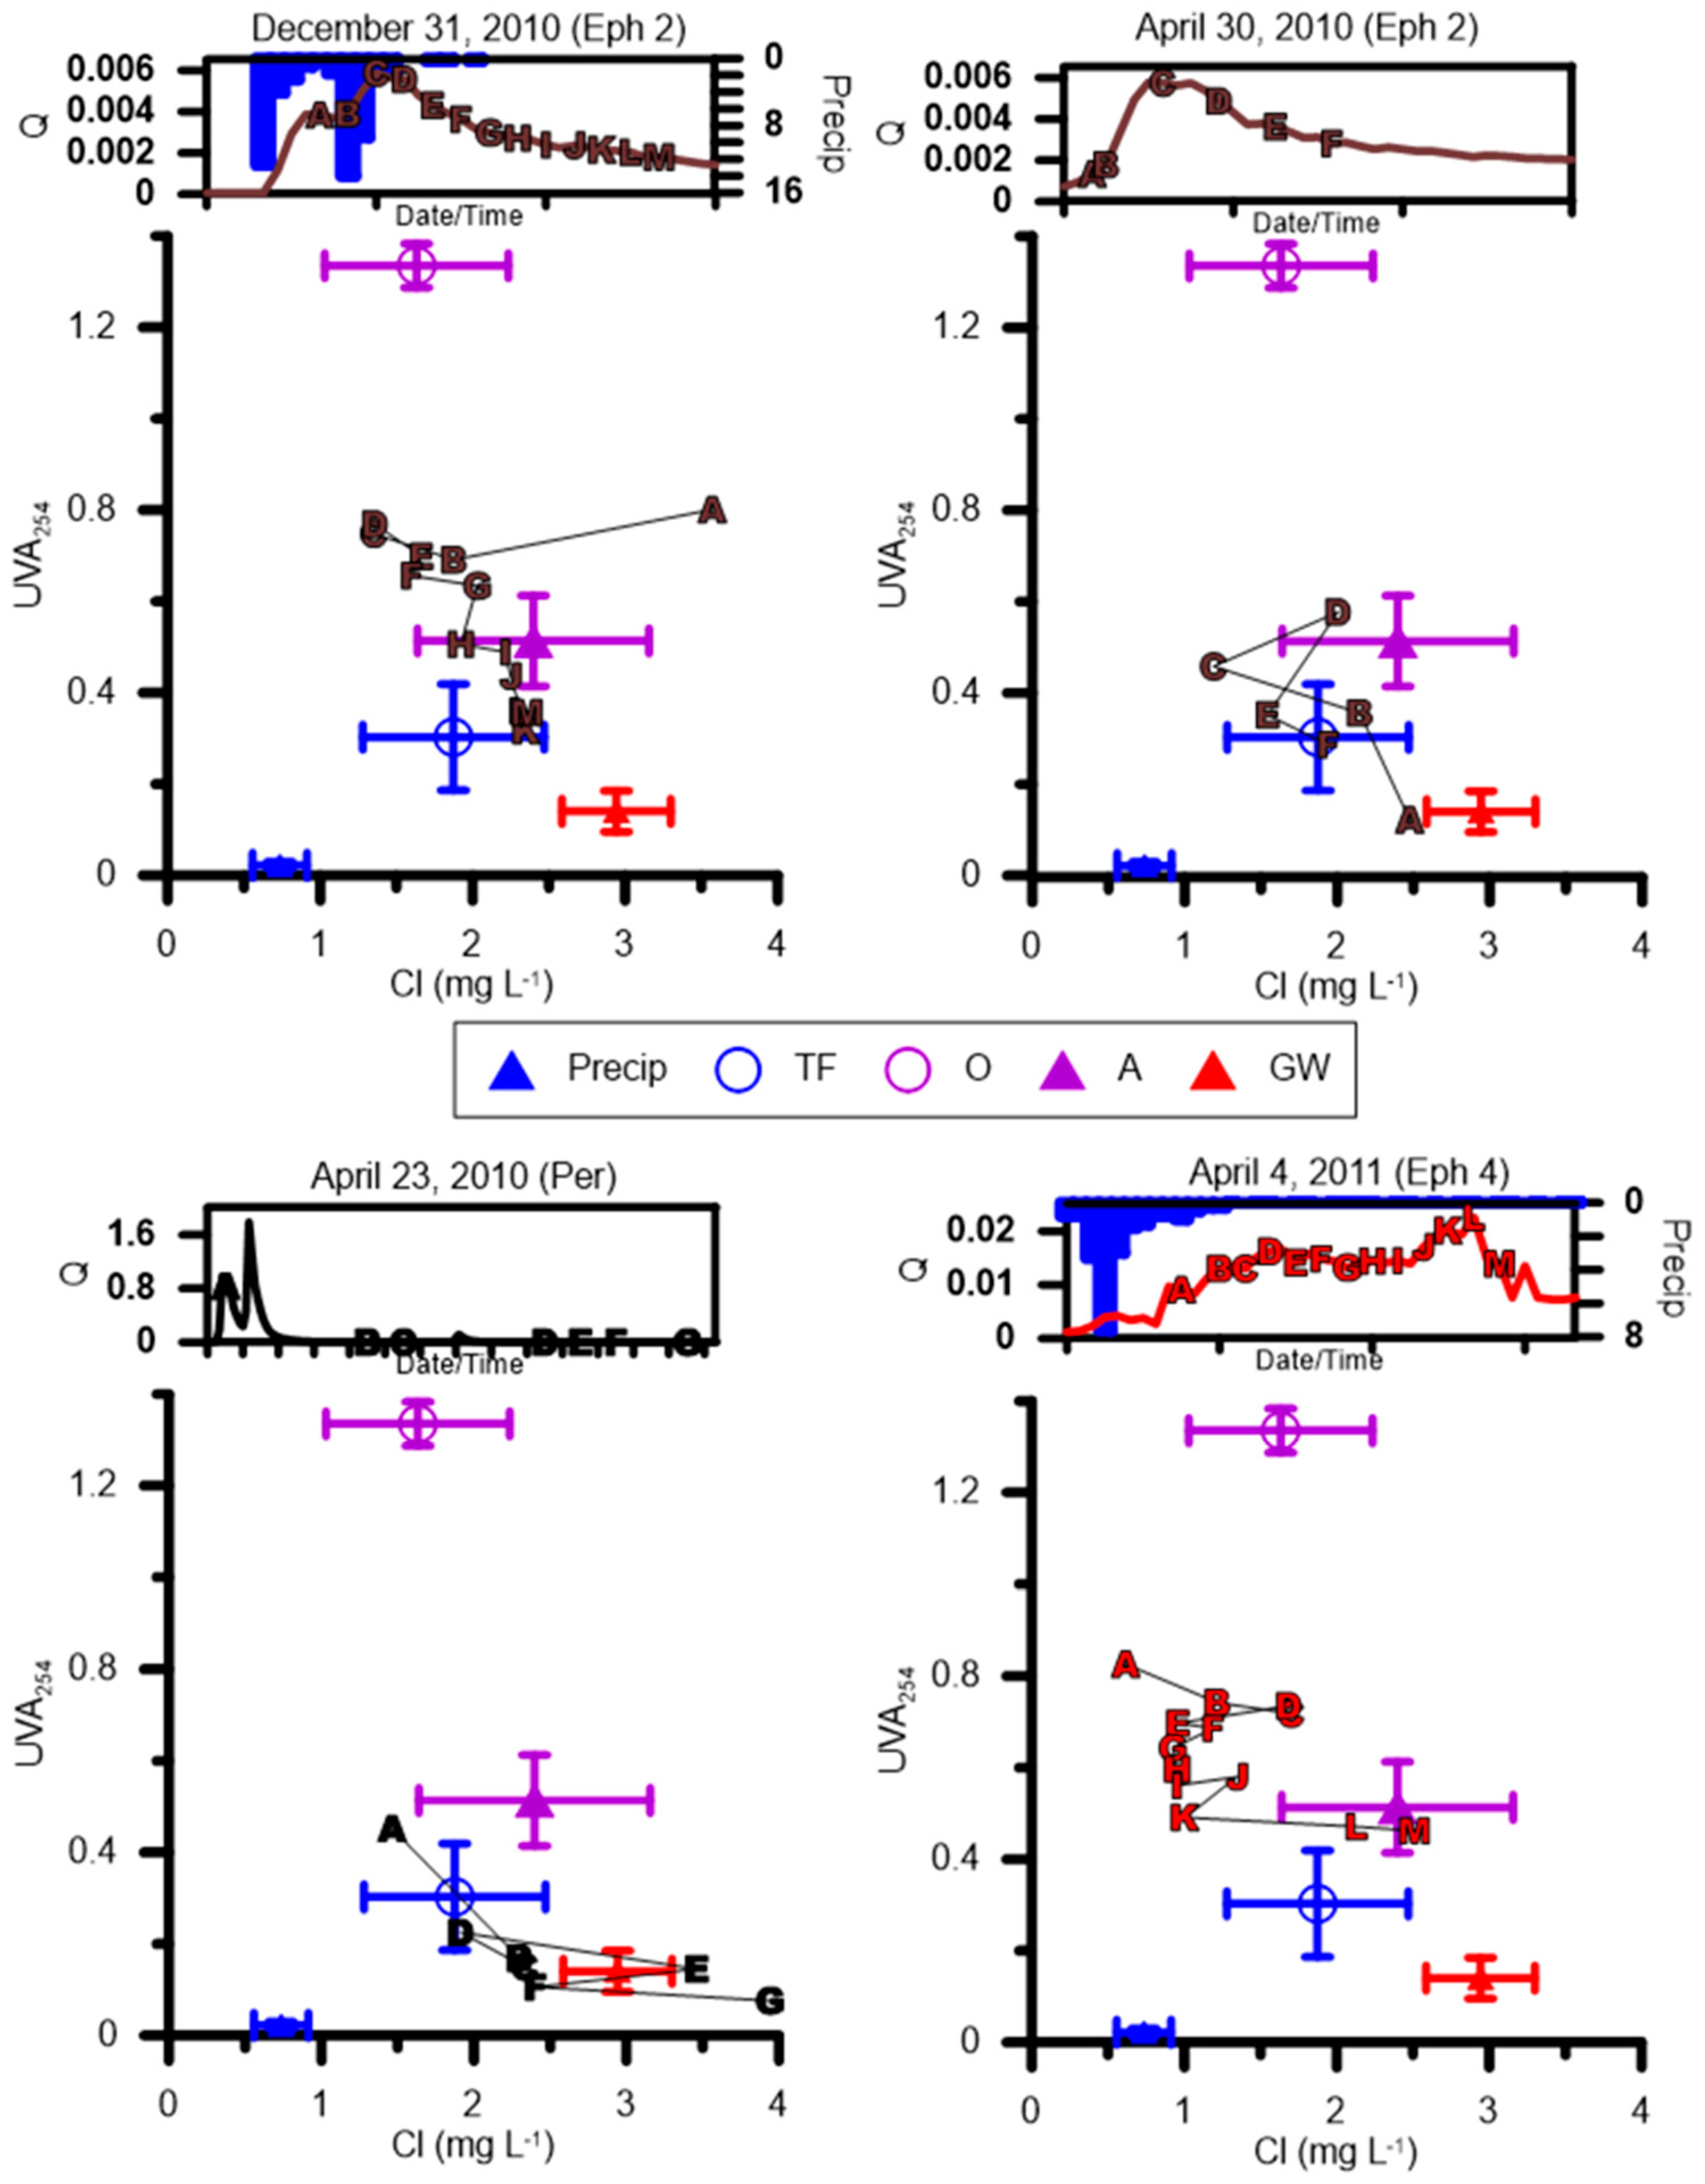
We attempted to track the responses of UVA
254 (as a proxy for DOC) and Cl to storms in the perennial and ephemeral watersheds by constructing hysteresis plots from each of the 5 potential sources. In general, we found that the ES (31 December 2010, 30 April 2010, and 4 April 2011 storm panels in
Figure 6) had higher UVA
254 and lower Cl than the perennial stream (23 April 2010 storm panel). However, there were different trends among watersheds and storms.
An early season storm (31 December 2010) showed what appears to be flushing of a high Cl and UVA254 source that could be recently fallen litter. Cl concentration becomes diluted as the source of stream water shifted towards throughfall and then a mixture of O-horizon leachate and precipitation. The source then shifted towards throughfall and A-horizon leachate and eventually towards the groundwater source.
This pattern essentially repeats itself in a later season storm (30 April 2010) in the same watershed (ES2) without the flushing of recently fallen litter. For a late spring storm (4 April 2011) in ES4 (clearcut), there appears to be less influence from throughfall on the earliest storm samples, but the source of water eventually shifts through the soil and towards groundwater. The source of water from the perennial stream (23 April 2010) appears to be from deeper within the soil profile at the onset of a typical storm event relative to the ES. Eventually the source of water appears to be entirely derived from a groundwater source late in the event.
Differences in hysteresis at different times of the year suggest that there may be critical thresholds in some storm parameters that control both the source from which the sediment and OM are derived and the flux of sediment and OM within the system. Due to our sampling protocol, it is possible that the timing of our sampling in relation to the storm hydrograph varied with season; however, our sampling procedure was designed to eliminate as much bias as possible. We compared surface water characteristics to seven event variables related to storms: discharge, peak time, flow time, rate of change, event time, water year day, and precipitation (
Table 4) to glean which event variables exerted the greatest control over surface water concentrations and fluxes in ES and perennial streams. Where distributions were not normal, we log-transformed the data. Data presented are those that were significant predictors of constituent flux. The larger the value, the greater the control. The sign determines whether the event variable was negatively or positively associated with the dependent variable.
As expected, Q and precipitation exerted the greatest control on TSS and OM for both streams. Precipitation is interesting in that all of the measured exports of ES increased with increasing precipitation, whereas the reverse was true in the perennial stream either as a result of dilution of exports as they reached the perennial stream or reduced carrying capacity in the perennial stream, or both. An increase in DOC with increasing precipitation and Q has been reported in other headwater studies (e.g., [
26]). Rate Change, which is tied to the shape of the hydrograph (i.e., flashy behavior equates to a more rapid rate of change), was a significant predictor for TSS, POC, and PN in the perennial stream, but was weakly correlated to TSS in the ES. The other independent variables, PeakTime, FlowTime, EventTime, and WY DAY, were significant only for ES. Dependent variables decreased with increasing FlowTime and EventTime, which suggests that there was a pool of sediment, DOM, and POM which was accessed early in an event and became depleted over time. The positive correlation with WY DAY for all dependent variables indicates that the time at which the pools were accessed may be significant in terms of interpreting potential responses to climate change. We recognize that WY DAY likely has a sinusoidal relationship and, thus, may not be a good predictor; however, we explored the use of sin transformation and it did not improve
R2.
3.4. The Water Year
There is a growing body of evidence that the seasonal component to OM pools and fluxes in headwater streams (e.g., [
24]) is linked to the wet–dry cycles that are prevalent in IRES and affects the quality and quantity of OM exports from IRES (e.g., [
26,
30,
52,
53]). If that is the case, then there should be a relationship between flux and timing within the water year, as the watershed transitions from hot, dry summer conditions to cool, wet winter conditions. We examined correlations between dissolved and particulate constituents and timing within the water year (WY Day; 1 October to 30 September) to see if there were effects associated with wet and/or dry periods (
Table 4). There were significant effects between WY Day and flux of TSS, POC, PN, and DOC for ES, whereas these fluxes were not significant for the perennial stream. Flux of TSS, POC, and PN all had positive correlations with WY Day which indicates that flux of these particulates increases over the course of the water year. The most likely mechanism for this would be active downcutting and headward erosion which releases sediment and associated particulate OM into ES with successive storm events.
The negative correlation between water year date versus DOC indicates that ES DOC concentration was highest at the beginning of the “wet” season and gradually decreased over time which is consistent with data from a meta-analysis of 30 forested watersheds in the eastern United States documenting higher DOC exports at the end of a dry period [
26]. Flushing of high Cl and UVA
254 sources (e.g., throughfall and O-horizon material;
Table 2) during an early season storm (
Figure 6; 31 December 2010 storm panel) is not as evident later in the season. The late season storm (
Figure 6; 30 April 2010 storm panel) has a Cl versus UVA
254 signal which is similar to GW (i.e., wet season base flow) at the event onset, followed by throughfall and A-horizon soil. These relationships suggest that early in the season there was a larger pool of labile DOC available within and leached from the upper soil profile (e.g., O-horizon soil solution) and that over multiple flushing events the labile C pool was depleted. If storm events are “hot moments” for the flushing of stored DOC [
28,
40], then peak DOC efflux should occur at the onset of the wet season (late fall) and decrease throughout the wetter winter months during successive leaching events. The DOC pool will build during drier months such that events that occur after prolonged dry conditions will have high DOC concentrations [
26,
54]. Our data support belowground storage of a leachable C pool during the dry season and flushing of the soil C pool during storm events throughout the wet season, such that availability of DOC decreases to minimum at the beginning of the next dry season. In contrast, the flushing signal that is evident within the ES is not detectable within the perennial stream, most likely due to the dilution from groundwater inputs (
Figure 6; 23 April 2010) or CO
2 evasion.
3.5. The Climate Connection
Climate projections for the southeastern US indicate a slight increase in warm days and especially warm nights, which will lead to a longer duration of frost-free days, and an increase in drought length [
55]. Concurrent with the overall increase in temperature, there is “high confidence” that there will be an increase in the number of annual days for which there are heavy (>75 mm) precipitation events [
55] even though MAP is expected to be relatively stable [
34]. A comparison of several models from the Mississippi River Basin also predict an increase in temperature which leads to a shift in the seasonality of the precipitation such that precipitation will decrease during summer months and increase during winter months [
56]. Regional climate models from the central U.S. postulate a localized summertime warming minimum or “warming hole” [
57] such that convective storms will result in precipitation that is greater than evapotranspiration, setting the stage for increases in soil moisture at the end of the summer season. These models pose a conundrum for how climatic drivers will affect fluxes from IRES to downstream rivers.
If MAP does not change but event precipitation increases, then there must be less frequent events of higher intensity with increased drying time between events. This scenario would result in higher fluxes of Sediment and OM (until it is depleted seasonally) from the ephemeral watersheds with increasing precipitation and Q (
Table 4) especially during the first flood pulses as has been reported for both particulate and dissolved OM e.g., [
5,
26]. The four ephemeral watersheds we gauged had a combined area of 11.6 ha, representing 36% of the source area contributing to the perennial stream at our gauge point, yet as small as they were, they discharged an average of 328 g s
−1 ha
−1 of OM (
Table 3; POC + PN + DOC + DON) during storm events. The high standard deviations of these measurements indicate that the fluxes could be much higher or much lower. We used the existing relationship between precipitation/Q and the dependent variables within a regression function to provide an indication of how the watershed might respond to increases in precipitation or Q. The equation used was:
where
X is the dependent variable of interest (e.g., TSS, POC, PN, and DOC), B0 is the intercept, and B1–B7 are the coefficients for each of the predictor variables (0 if the predictor variable was not a significant predictor of the dependent). The resultant projected increase or decrease (%) in TSS and OM components given a 5% increase in precipitation or Q is provided in
Table 5.
A century-long study of precipitation trends in forest lands of the Lower Mississippi River Alluvial Valley (LMRAV) reported precipitation increases (estimated to be 7%) at the south coastal area of the LMRAV and constant or a slight decrease at the middle area of the LMRAV [
58]. Our study site was between the south and middle parts of the LMRAV and, therefore, a 5% increase in precipitation is a reasonable estimate. A 5% increase in stream discharge is considered as the extreme case because not all of the 5% increase precipitation contributes to discharge.
Where there is a 5% increase in precipitation, within ES we would expect increases across all particulate constituents. However, given the perennial stream sensitivity to precipitation there would most likely be a negative effect of on the flux of most constituents. When and how the precipitation occurs can change the outcome insofar as precipitation and Q are coupled. Higher magnitude storms, which may cause an increase in Q, will be the primary drivers for additional materials flux. Given a 5% increase in Q, there was an increase from 1.6% to 2.8% in average instantaneous flux of materials from both the ES and the perennial stream (
Table 5). For example, an increase of 0.63 × 10
3 m
3 s
−1 ha
−1 in Q within ES would result in an increase of 69.0 g s
−1 ha
−1 average instantaneous flux of TSS and 7.8 g s
−1 ha
−1 of OM (
Table 6). While increases appear to be small, it is important to remember these are instantaneous fluxes, so over the course of an event the flux will be much higher depending upon the change in the discharge-rating curve relative to historical data. Changes between ES and the perennial stream are similar, which suggests that materials flux from the ES continues in the perennial stream and that the perennial stream acts as a conduit for materials generated in the ES.
The hydrologic transition from dry to wet in these IRES could result in pulses of DOC release [
30,
31,
59] followed by mineralization and CO
2 release from the perennial stream [
60], especially since rates increase with increasing catchment area [
61]. Much of the DOC and POC in the ES derived from the soil profile (
Figure 2 and
Figure 3). If, as a result of climate change, there is an increase in convective storms and greater soil moisture at the end of the summer season, then wetting and drying cycles of soils and streams will be moderated and there may be lower DOC production and flux simultaneously with higher POM due to the increased energy in the system to mobilize particulates and sediment.
If MAP does not change but rainfall shifts to winter months, then presumably the summer drought season would be lengthened. Increased drought during the warmer months followed by short-term high intensity events would result in increased downcutting and headward erosion followed by greater flux of TSS, POC, and PN (
Figure 4 and
Table 3). A compilation of climate models for an agricultural watershed in Mississippi predicted that an increase in summer temperatures would result in a decrease in runoff, but approximately 12% greater TSS loads, presumably due to the higher intensity precipitation events [
62]. Perhaps of greater import is that prolonged drought may increase the areal extent of IRES [
1] which means that there would be a greater time and area over which soil OM can accumulate. If Horton infiltration excess is the primary path for DOC to streams, then perhaps there would be no change beyond what is mobilized with sediment due to the erosion. If Dunne saturation excess is the primary source of DOC as is suggested by our data (
Figure 2 and
Figure 4a), then there will be a greater time over which the pool can build and potentially larger releases to the stream network. Longer-term studies are needed to determine the impact of climate change on the flux of (OM) from IRES in the southeastern US.


