Article

Reactive Flow Dynamics of Low-Frequency Instability in a Scramjet Combustor

Department of Aerospace Engineering, Pusan National University, Busan 46241, Republic of Korea
*
Authors to whom correspondence should be addressed.
Aerospace 2023, 10(11), 932; https://doi.org/10.3390/aerospace10110932
Submission received: 15 September 2023 / Revised: 23 October 2023 / Accepted: 26 October 2023 / Published: 31 October 2023
(This article belongs to the Special Issue Supersonic Combustion in Scramjet Engine)

Abstract

:
This study numerically investigated the combustion instability and characteristics of a laboratory-scale gaseous hydrogen-fueled scramjet combustor. For this purpose, a numerical simulation with an improved detached eddy simulation and a detailed hydrogen/oxygen reaction mechanism was performed. The numerical framework used high-resolution schemes with high-order accuracy to ensure high resolution and fidelity. A total of five fuel injection pressures were considered to characterize the combustion instability as a function of the equivalence ratio. A sampling time of up to 100 ms was considered to sufficiently accumulate several cycles of low-frequency combustion instability dynamics with a period in the order of 100 Hz. Numerical results revealed the repetitive formation/dissipation dynamics of the upstream-traveling shock wave, and it acts as a key factor of combustion instability. The period and derived principal frequency of these upstream-traveling shock waves is several ms. The frequency analysis showed that the instability frequency increased in the low-frequency range as the combustion mode transitioned from the cavity shear-layer to the jet-wake type. This characteristic was derived from the transition in combustion mode at the same equivalence ratio. Therefore, it suggests that the instability frequency shifting is governed by the combustion mode rather than the equivalence ratio. These comprehensive numerical results demonstrated not only the effect of the equivalence ratio but also the important role of the combustion mode on the low-frequency combustion instability.

1. Introduction

Over the past decade, scramjet engines have developed rapidly, which has enabled their practical application and possible technological advances. However, factors such as combustion instability under typical flight conditions have been experimentally demonstrated to remain a technical challenge to their practical application. In early scramjet studies, the combustion oscillation or acoustic fields generated downstream of the combustor were considered to not propagate upstream owing to the high speed and very short residence time of the main flow [1,2].
However, Ma et al. [1], Li et al. [2], and Choi et al. [3,4] suggested that this assumption may differ from the actual phenomenon. Through a combustion experiment on the direct-connect scramjet test facility at the Air Force research laboratory (AFRL), Ma et al. [1] and Li et al. [2] demonstrated the occurrence of major instability in the frequency range from 100–350 Hz regardless of the fuel used. To analyze this phenomenon, a quasi-one-dimensional analysis was performed using the Helmholtz-type solver. Despite the limitation of the Helmholtz-type solver (i.e., suitability for subsonic combustion flow field analysis), the study revealed the generation of acoustic disturbance by combustion oscillation from the flame region downstream of the combustor [5]. In addition, the comparison of the phases induced by various fueling schemes and flame regions confirmed the upstream travel of acoustic waves. Choi et al. [3,4] conducted a numerical analysis using the HyShot test model with varying fuel injection scheme and shapes. They confirmed the occurrence of oscillation in the shear layer of the fuel stream and the combustion oscillation in the combustor, thus confirming the combustion oscillation nature of the supersonic combustor. These studies have provided evidence for the occurrence of combustion oscillation or combustion instability in a supersonic combustor, particularly scramjet engines, and this has accelerated related studies.
Several studies have experimentally investigated the combustion instability of ram/scramjet engines under various operating conditions. Micka et al. [6] conducted combustion experiments on an ethylene-fueled dual-mode scramjet under various operating combustions and fuel injection schemes. They distinguished the combustion mode according to each condition and observed the generation of a strong combustion instability when there was a transition in operating mode, particularly from ram to scram mode. Also, they conducted an experimental study on the same combustor with different operating conditions to investigate the characteristics of instability frequency [7]. By completing a focused analysis on the CH* heat release data obtained from the injector and the cavity close-out region, they derived a peak frequency of 250 Hz in the cavity combustion mode and a peak frequency in the range of 1000 Hz in the jet-wake stabilized combustion mode. Through the combustion experiment of an ethylene fuel supersonic combustor, Wang et al. [8] captured the flash-forward and blow-off behavior of flame at the region between the fuel injector and cavity with a low frequency of approximately 200–400 Hz. Nakaya et al. [9] analyzed the results of the experimental combustion of an ethylene-fueled scramjet combustor using an image-based mode decomposition method. The CH chemiluminescence analysis results obtained using the dynamic mode decomposition (DMD) method demonstrated the combustion instability on the cavity shear-layer with a low-frequency range with a transition from operating mode to ram mode. Furthermore, they derived six different combustion modes through experimental tests on the same combustor with various equivalence ratio conditions and presented the instability frequency ranges associated with each combustion mode [10]. The frequency results obtained through proper orthogonal decomposition (POD) revealed that as the equivalence ratio increased from 0.070 to 0.25, the instability frequency range increased from 10 Hz to 460 Hz to 55 Hz to 1830 Hz. Lee et al. [11] conducted an experimental study on a scramjet combustor with a secondary fuel injector inside the cavity front wall side. They showed that the POD and DMD mode of CH chemiluminescence images has an extremely low-frequency oscillation of 5 Hz to 50 Hz depending on the changing of fuel injection of the cavity fuel injector.
Several numerical studies were also conducted to investigate various types of combustion oscillation or instability of scramjet combustors. Zhao et al. [12] conducted a numerical analysis under similar conditions to investigate the factors affecting the occurrence of this phenomenon. They applied various boundary conditions and heat sources. They found that the flame-forward and flashback are mainly caused by the interaction between the flame region of the cavity downstream and the boundary layer. Jiang et al. [13], who demonstrated the possibility of a standing oblique detonation (SOD) ramjet, illustrated the surging of a scramjet engine while operating under the general flight condition owing to the strong combustion instability in the low-frequency range. In addition, through simple numerical analysis, they illustrated that the control of upstream-traveling shock waves generated in the combustor is essential to prevent the inlet un-start and engine surging of the scramjet engine. Zettervall et al. [14] conducted a numerical simulation of the University of Michigan dual-mode ramjet combustor to investigate combustion dynamics. The results showed the flame behavior, which is the repetitive moves between the fuel injector and the cavity close-out region with a 3.0~6.0 ms period.
These studies suggest that combustion oscillation or instability in scramjet engines exist in different forms depending on the operating conditions and shape configuration. In addition, these events have been observed to occur in a low-frequency range of several tens of Hz or hundreds of Hz rather than at a high-frequency range of several kHz or more. This indicates that it is essential to intensively investigate the dynamics of the low-frequency range. Moreover, to understand this low-frequency mechanism, it is necessary to obtain data over a long physical time with a repetitive period [15].
Owing to the efforts of various research groups, various high-fidelity numerical approaches have been developed and applied to investigate the characteristics of reactive flow fields in a supersonic combustor. Bermejo-Moreno et al. [16] conducted a numerical study on HIFIRE-2 using the wall-modeled large eddy simulation (LES) and flamelet/progress variable approach (F/PVA) frameworks. They identified combustion dynamics that cannot be easily examined in a ground combustion experiment. Notably, they captured the combustion instability near the recirculation region of the fuel injector caused by the dynamics of the shock train traveling between the upstream and downstream of the isolator region under the conditions of flight Mach number 6.5. Larson et al. [17] conducted a large-scale LES analysis on HyShot II to investigate the flow field’s characteristics according to the equivalence ratio. Numerical results demonstrated the structure of the shock and combustion/flow dynamics. In particular, the effect of the equivalence ratio on the combustion field and flow choking process was demonstrated. Potturi et al. [18] performed a hybrid LES/RANS analysis on the ethylene-fueled University of Virginia’s scramjet combustion facility (UVa’s SCF). They characterized the combustion regimes in the region from the fuel injector to the downstream of the combustor using the flame index and Borghitype diagram. Lacaze et al. [19] performed a numerical experiment on the HIFiRE Direct Connect Rig (HDCR). The results confirmed that the premixed regime only contributed a small portion of the total heat release. Using OpenFOAM, Nordin et al. [20] conducted a large-scale LES analysis on HyShot II without a cavity. They focused on identifying the effect of the shock system on fuel mixing. They confirmed that the Richtmyer–Meshkov instability, caused by the interaction between the fuel–air interface and shock, plays a significant role in fuel/air mixing. Ruan et al. [21] conducted a large-scale numerical simulation on the ethylene-fueled supersonic combustor of AFRL focused on the combustion characteristic inside the cavity and revealed the residence time of the cavity and combustion regime in detail. Hash et al. [22] demonstrated the dynamics that occur under the unstable ram-mode operation of an axisymmetric ethylene-fueled combustor. In addition, they employed a high-order, high-resolution numerical approach for spatial accuracy, such as the sixth-order piecewise parabolic method (PPM), with structured-based grid topology. They considered various inflow cases with different chemical compositions. Their results revealed the limitation of a high-speed ground test facility using a rocket-type vitiated air heater by extensively describing the change in the reactive flow-field dynamics with a change in the inflow condition. Cao et al. [23] conducted two cases of a numerical study, wherein one considered an upstream-only fuel injection and the other considered both the upstream and inside cavity fuel injection. Their results revealed that fuel injection inside the cavity increased the combustion efficiency and changed the local combustion mode from cavity shear-layer to cavity-assisted jet-wake stabilized combustion mode. Peterson et al. [24,25] conducted a comprehensive numerical study on a round direct connect ground test facility. They employed various periodic boundary conditions for the same combustor and operating conditions. Their results revealed that applying the periodic boundary condition on a round-shaped combustor to reduce computational cost should be strictly prohibited. In addition, the results obtained using a partially stirred reactor (PaSR) model with multiple model constant suggested that when a large volume combustor was dominated by subsonic combustion, the turbulent-combustion model should be considered essential to predict the reactive flow-field accurately.
Prior experimental investigations have revealed that combustion instability within supersonic combustors manifests within the low-frequency spectrum, typically in hundreds of Hz. It suggests that a meticulous examination of combustion instability with repetitive periods necessitates capturing outcomes spanning no less than tens of milliseconds. Additionally, the dynamic changing of combustion instability within a supersonic combustor by working fluid conditions mandates a comprehensive numerical resolution of the entire combustion process. However, numerical simulations will face formidable challenges owing to the intricate characteristics of supersonic combustion—characterized by the amalgamation of compressible, highly turbulent, and high-density combustion. This complexity is further exacerbated when pursuing higher-order accuracy to attain high-fidelity outcomes. Furthermore, given that the time increment per iteration in hybrid RANS/LES and LES simulations is on the nano-second scale, protracting results to tens of milliseconds necessitates millions of iterations. These intricacies pose significant barriers to acquiring temporal sampling data, limiting three-dimensional numerical investigations of combustion field behavior within supersonic combustors to durations of only a few milliseconds.
In this context, we attempted to obtain tremendous sampling data using a two-dimensional approach for identifying the mechanism of low-frequency supersonic combustion instability. The previous study [26] conducted a two-dimensional high-resolution hybrid LES/RANS simulation on a hydrogen-fueled direct connect scramjet combustor. Three equivalence ratio cases were considered, and a sampling time of up to 100 ms was achieved in each case. A repetitive dynamic of the pressure with a period of several ms was captured in a high equivalence ratio case, and it was revealed that these repetitive dynamics, known as the “upstream-traveling shock wave,” play a key role in the generation of the low-frequency combustion instability in a scramjet combustor. The instability frequency shifting, which is an increase in the instability frequency with an increase in the equivalence ratio, was detected, consistent with the findings of several experimental studies.
However, because this numerical work has a limitation, in that it was conducted on three equivalence ratio cases, the upstream-traveling shock wave could not be characterized as a function of the equivalence ratio or the combustion mode. In order to overcome the limitation of the previous numerical study, this study considered a total of five equivalence ratios. The numerical approach employed in this study is identical to the previous studies. High-resolution numerical schemes with a high-order accurate approach were applied to a structure grid system to ensure high fidelity. Field data with a sampling time of up to 100 ms were accumulated in all equivalence ratio cases. This study’s comprehensive high-resolution two-dimensional numerical simulation with a tremendous sampling time revealed the detailed mechanism and the characteristics of the low-frequency combustion instability as a function of the operating conditions.

2. Methodology

2.1. Two-Dimensional Turbulent Combustion Simuilation

Due to various factors, a three-dimensional computational domain is imperative for accurately simulating a combustion flow field. This necessity arises primarily from the perspective of fluid dynamics. The development of the boundary layer on the left and right wall surfaces, along with the edge effect, leads to the induction of walls. In contrast to the two-dimensional domain, this induction results in a notable reduction in the effective cross-sectional area. The existing left–right wall configuration also influences the interaction between the upper and lower wall surface boundary layers. Such complexities are beyond the scope of consideration in a two-dimensional numerical simulation. Furthermore, in terms of combustion, the linear proportionality between fuel/air mixing and the contact surfaces of these two streams adds to the intricacy. The presence of supersonic combustion, characterized by high density, compressibility, and Mach number, exacerbates this by augmenting the contact surface due to dimensional changes. Hinterberger et al. [27] have reported that the contact surface of a three-dimensional domain is approximately twice that of a two-dimensional domain. Nonetheless, this study aims to comprehend and analyze the low-frequency combustion instability in scramjet engines. As previously mentioned, supersonic combustion instability occurs within the low-frequency range of tens to hundreds of Hz. A comprehensive understanding of these low-frequency dynamics necessitates accumulating numerical results over multiple cycles, encompassing tens to hundreds of milliseconds rather than just several milliseconds. Furthermore, obtaining results across various equivalence ratio conditions repeatedly to confirm the influence of working fluid conditions or combustion characteristics is practically constrained within the scope of three-dimensional numerical simulations. These are the limitations on accumulating 100 ms sampling time numerical results through three-dimensional simulation. The total computational cost and resources required for a two-dimensional simulation are 0.5% to 1% of that needed for a three-dimensional simulation.
As discussed earlier, several factors fundamentally constrain the accuracy of two-dimensional simulations. Specifically, for ram/scramjet combustors, essential physical phenomena such as horseshoe vortices and counter-rotating vortex pairs resulting from fuel injection remain unaccounted for in the two-dimensional simulation. Consequently, two-dimensional simulations introduce uncertainty when comprehending small-scale dynamics around the fuel injector. Despite these limitations, several studies have reported that the two-dimensional approach can yield satisfactory outcomes in large-scale dynamics like vortex roll-up, mixing, and shock trains, constituting most of the overall combustion dynamics and flame characteristics [28,29,30]. Moreover, the current computational model has a square cross-section scramjet combustor, which differs from an axis-symmetric cylindrical shape, a principal source of errors in two-dimensional simulations. Garby et al. [31] proposed that axis-symmetric two-dimensional simulations can produce reasonably reliable results comparable to both three-dimensional simulations and experimental findings, provided meticulous consideration is considered. Based on these prior investigations, this study adopts a two-dimensional approach. While acknowledging the inherent uncertainties in capturing the physical dynamics within the fuel injection region, this approach is deemed capable of delivering acceptable outcomes in the broader context of large-scale dynamics. Thus, the two-dimensional simulation was selected to gather field data over a sampling period of up to 100 ms across various equivalence ratio conditions in the present study.

2.2. Governing Equations

The governing equations are chemical species, momentum, and energy conservation equation, fully coupling fluid motion and chemical reactions. All governing equations were treated via the finite volume method using the density-based in-house solver, known as “PNU-RPL2D” [3,4,32,33,34,35].
Q t + E x + F y = E v x + F v y + S
Q = ρ 1 ρ 2 ρ n ρ u ρ v e ρ k ρ ω ,   E = ρ 1 u ρ 2 u ρ n u ρ u 2 + p ρ u v e + p u ρ u k ρ u ω ,   F = ρ 1 v ρ 2 v ρ n v ρ v u ρ v 2 + p e + p v ρ v k ρ v ω E v = ρ 1 u 1 d ρ 2 u 2 d ρ n u n d τ x x τ x y β x μ k k / x μ ω ω / x ,   F v = ρ 1 v 1 d ρ 2 v 2 d ρ n v n d τ y x τ y y β x μ k k / y μ ω ω / y ,   S = S 1 S 2 S n 0 0 0 S k S ω
The above equation presents the Favre-filtered formulation of conserved variables, convection, viscous terms, and the chemical reaction source term in a two-dimensional coordinate system. Density was computed as the aggregate of partial densities of each chemical species, while pressure was determined using the ideal-gas equation of state. Subscript “n” represents a chemical species, and nine chemical species were considered. u ,   v and u n d , v n d are the velocity and diffusion velocity of each component. τ x x ,   τ x y ,   τ y y are the viscous stress tensor, and β x , β y are the thermal flux of each velocity component. Thermal flux β x is calculated by u τ x x + v τ x y q x , where q x is diffusive thermal flux. Owing to thermal diffusion coefficient being much smaller than the binary diffusion coefficient, the Dufour effect can be ignored in the diffusive thermal flux term; therefore, q x can be formed as K T / x + k = 1 n s ρ k u k d h k , where K is conductivity. S n , S k S w are the source term of the chemical reaction, turbulent kinetic, and dissipation rate, respectively. The present study is based on ideal gas of a mixture of thermally perfect gases. The mixture density, ρ , is treated with a sum of the partial density ρ k of each chemical species. The total energy per unit volume e is evaluated as the sum of kinetic, internal, and turbulent kinetic energy.
To account for the interaction between turbulence and chemical reaction, a Partially Stirred Reactor (PaSR) model based on the Eddy Dissipation Concept (EDC) was suggested and has been widely used owing to its simple implementation [36,37,38,39,40]. However, the PaSR model exhibits critical uncertainties due to the sensitivity of its model coefficients. Perterson’s research demonstrated that the PaSR model coefficients significantly influence predicting the pre-combustion shock location in a ramjet combustor [25]. Moreover, it was observed that the numerical results varied with changes in the equivalence ratio, even though the framework has the same PaSR model. Owing to this suggestion, we concluded that developing turbulence–combustion modeling with sufficient robustness for a high Mach number system should be needed. The entire volume of the computational domain in this study is on the order of 100 cm3, with a sufficiently fine grid. Gonzalez-Juez et al. [41] suggested that when numerical results are obtained for a small-volume combustor (<O (1000 cm3)) with fine grid resolution and detailed laminar chemical mechanisms, the “no-model” or “quasi-laminar chemical” approach can yield feasible results comparable to experimental data. Furthermore, typically, the size of a reaction-zone thickness range of the present combustor system is in the order of mm (millimeters). In contrast, the maximum spatial resolution in the entire domain used in this study is x-direction ≈(∆~0.009 mm) and y-direction ≈(∆~0.09 mm). This means that no fewer than at least tens of grids would be located within the reaction zone. Based on this, the present study solved all chemical species conservation equations using a laminar chemical reaction mechanism and applied the “no-model” or “quasi-laminar chemical” approach, which is deemed acceptable for addressing the high-speed compressible combustion flow field of this study. The University of California San Diego (UCSD) pressure-dependent detailed laminar chemical reaction mechanism, comprising eight chemical species and twenty-one reaction steps with three-third body effects, was employed as the chemistry [42]. In this study, nine chemical species were considered, including nitrogen, which has a minor effect on the flame evolution process due to its inert nature, as mentioned earlier.

2.3. Numerical Approaches

The hybrid RANS/LES model was first introduced as an S-A detached eddy simulation (DES) model by Spalart et al. [43] and simulates flow-field near wall region as a RANS approach, and treats outside the boundary layer region as a LES approach. However, because the S-A DES model is based on the S-A RANS model, S-A DES contains potential inaccuracy in predicting boundary layer separation. To address this problem, several DES models have been proposed [44,45]. However, DES models inherently face a limitation known as “grid-induced separation (GIS),” which leads to potential inaccuracies in the thickness of the boundary layers and flow separation when grid spacing increases. This phenomenon results from the steep gradient of the turbulent viscous term at the RANS-LES interface, yielding unphysical numerical solutions. Various DES models have sought to overcome this, accurately predicting mean flow fields [46,47]. Nevertheless, limitations persist in capturing unsteady flow fields. To address this, the delayed DES (DDES) model, redefining the length scale of DES, was introduced. The SST-DDES model employs a shielding function containing turbulent viscosity information to induce a numerical delay (suppression) in treating different turbulent viscosities at the transient point of the RANS-LES computational domain, thereby suppressing GIS. This study adopts the SST-DDES model [48] as the turbulent model.
The spatial discretization method in numerical simulations is directly related to calculation efficiency and reliability. Choi et al. [35] compared the capture capabilities of various approaches for turbulent mixing, utilizing the third-order accuracy monotonic upstream-centered scheme for conservation laws (MUSCL) [49], the fifth-order accuracy weighted essentially non-oscillatory (WENO) [50,51,52], and the optimized multi-dimensional limiting process (oMLP) [53,54]. They found that the oMLP scheme, based on multi-dimensional extrapolation of convective properties with a multi-dimensional limiting function, exhibited enhanced performance compared to the MUSCL and WENO methods, which relied on an extrapolation of the one-dimensional convective property, even at a lower grid resolution. However, the high-order multi-dimensional extrapolation-based method is highly sensitive to grid quality and the gradient of physical properties, resulting in several computational difficulties. Furthermore, the presence of a chemical reaction process intensifies this sensitivity. Nevertheless, previous studies have demonstrated that high-order schemes are crucial for the reliability and efficiency of the solver and must be considered despite the challenges posed by high-order multi-dimensional methods in conducting numerical simulations, as previously mentioned. In this study, the oMLP method with fifth-order accuracy was employed as the spatial reconstruction approach.
The convection flux was discretized using the AUSM scheme with flux difference splitting and flux vector splitting (AUSMDV) [55]. The viscous flux was treated using a fourth-order central differential. The time integral was processed using the second-order fully implicit optimized lower-upper symmetric Gauss–Seidel (LU-SGS) method [56], with each iteration consisting of a maximum of four sub-time steps. The CFL number was maintained within the range of 0.5 to 1.0, and the average time interval between each iteration was approximately 1.5 × 10⁻⁸ s. The calculation was parallelized using OpenMP and multi-core shared-memory processors. For further detailed information about the baseline framework and other aspects of the present numerical framework, please refer to our previous papers [3,4,32,33,34,35].

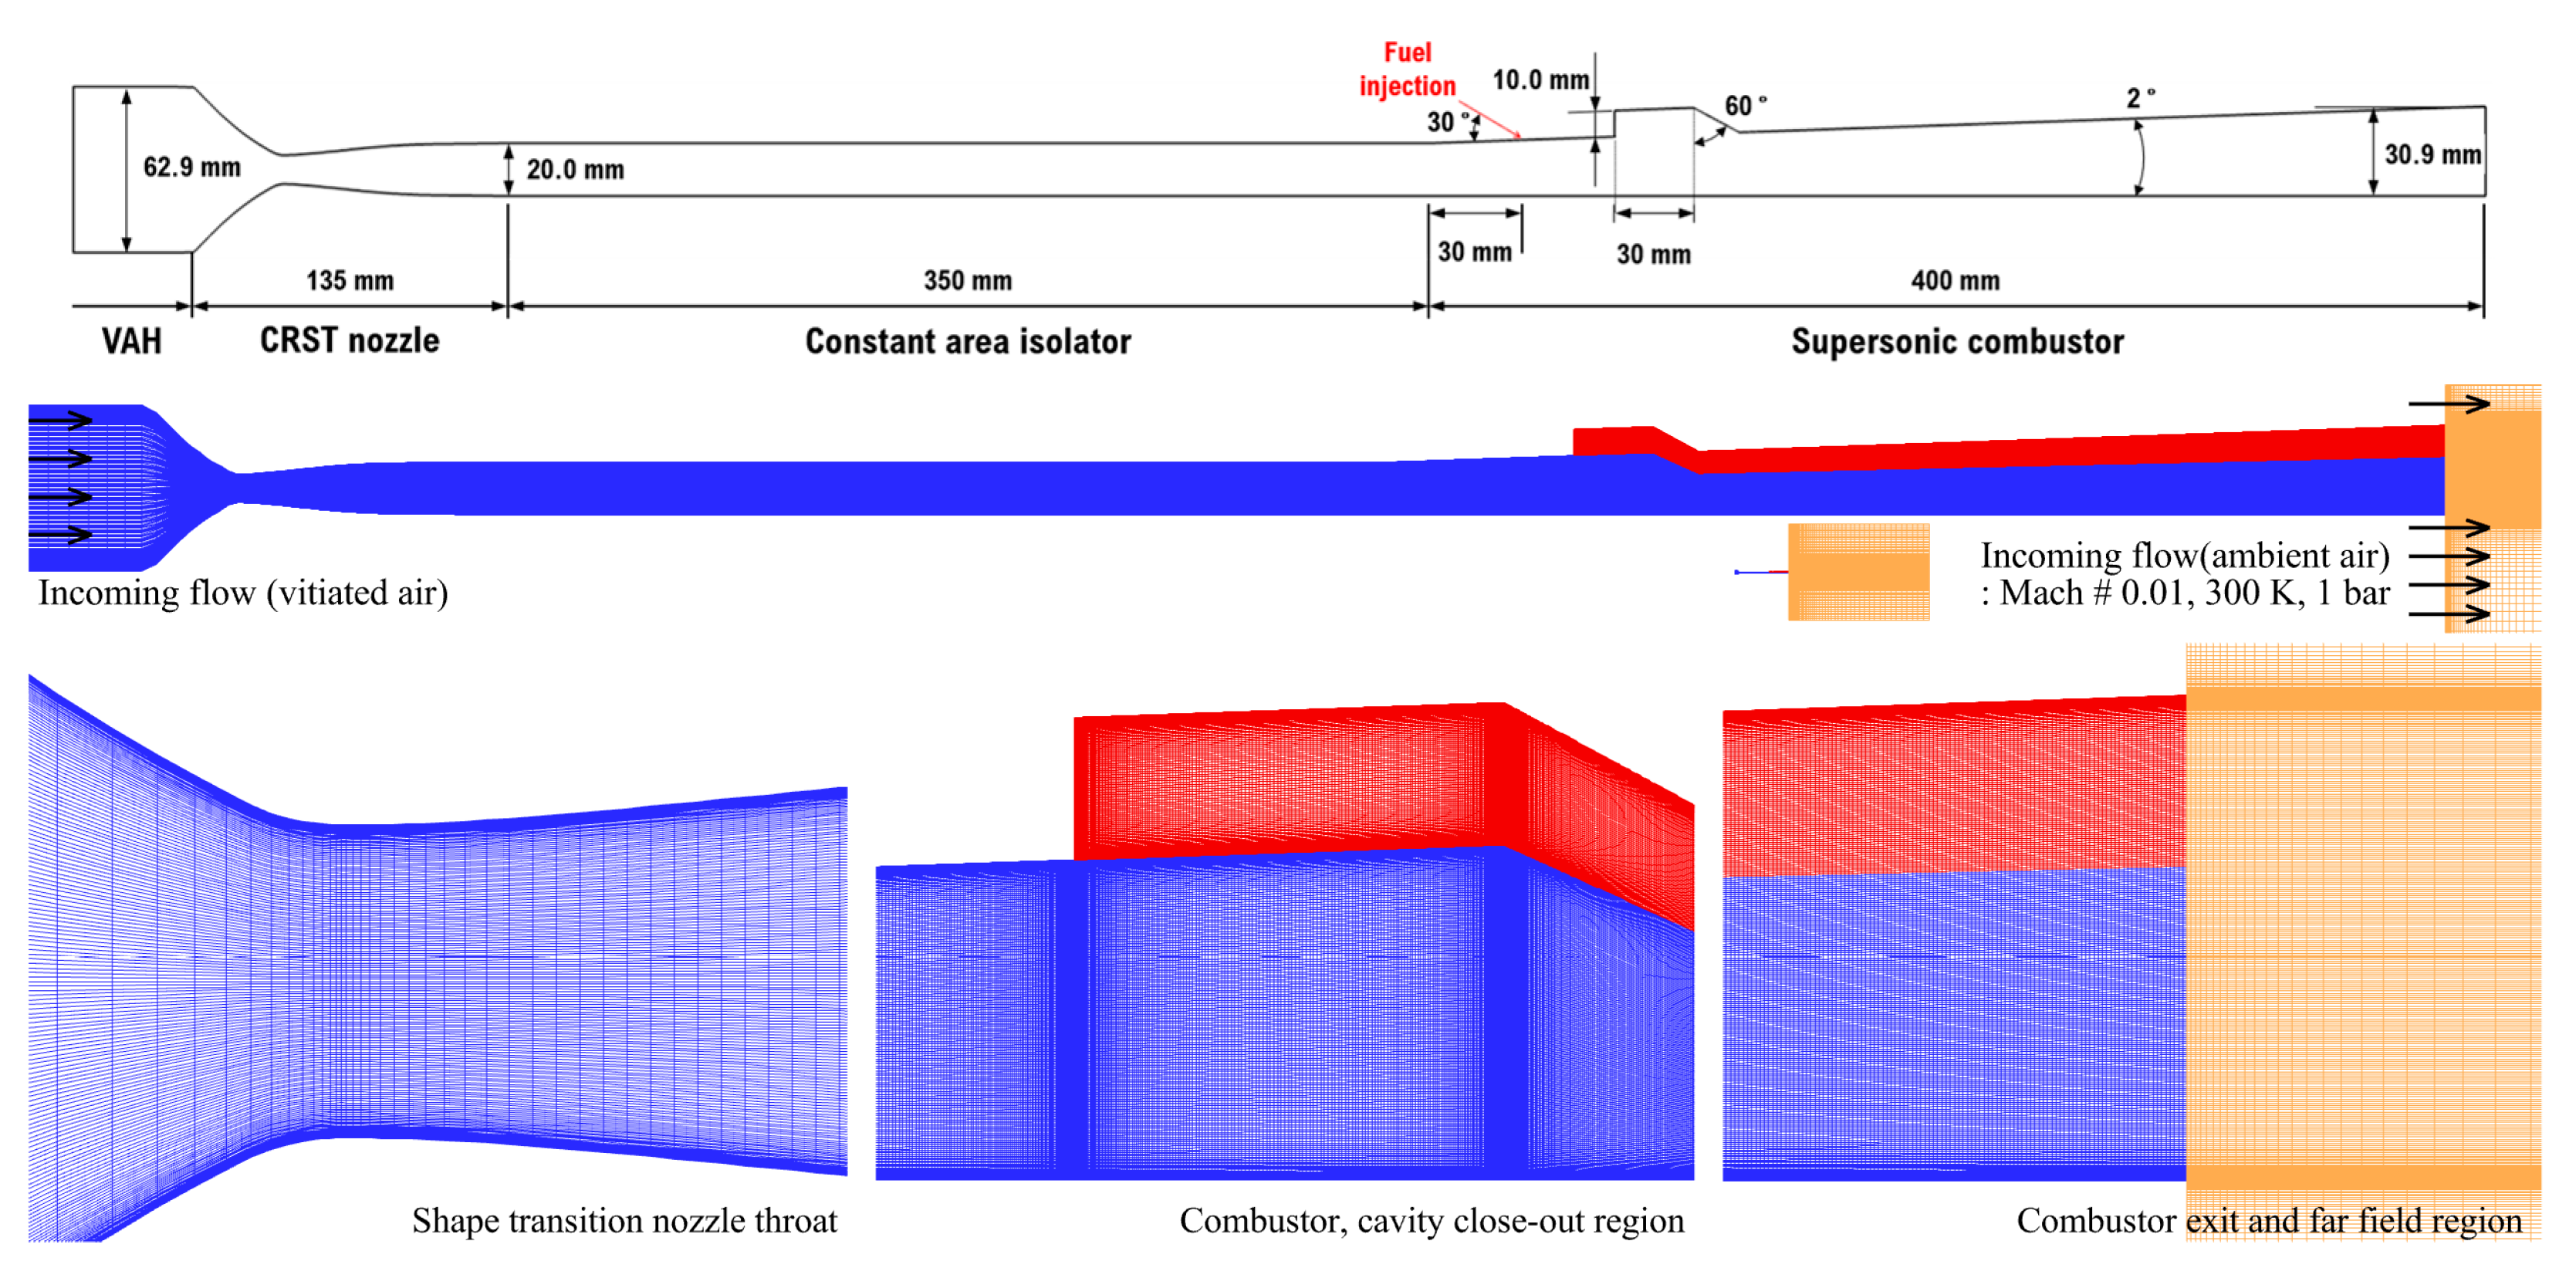
2.4. Model Supersonic Combustor and Operating Condition
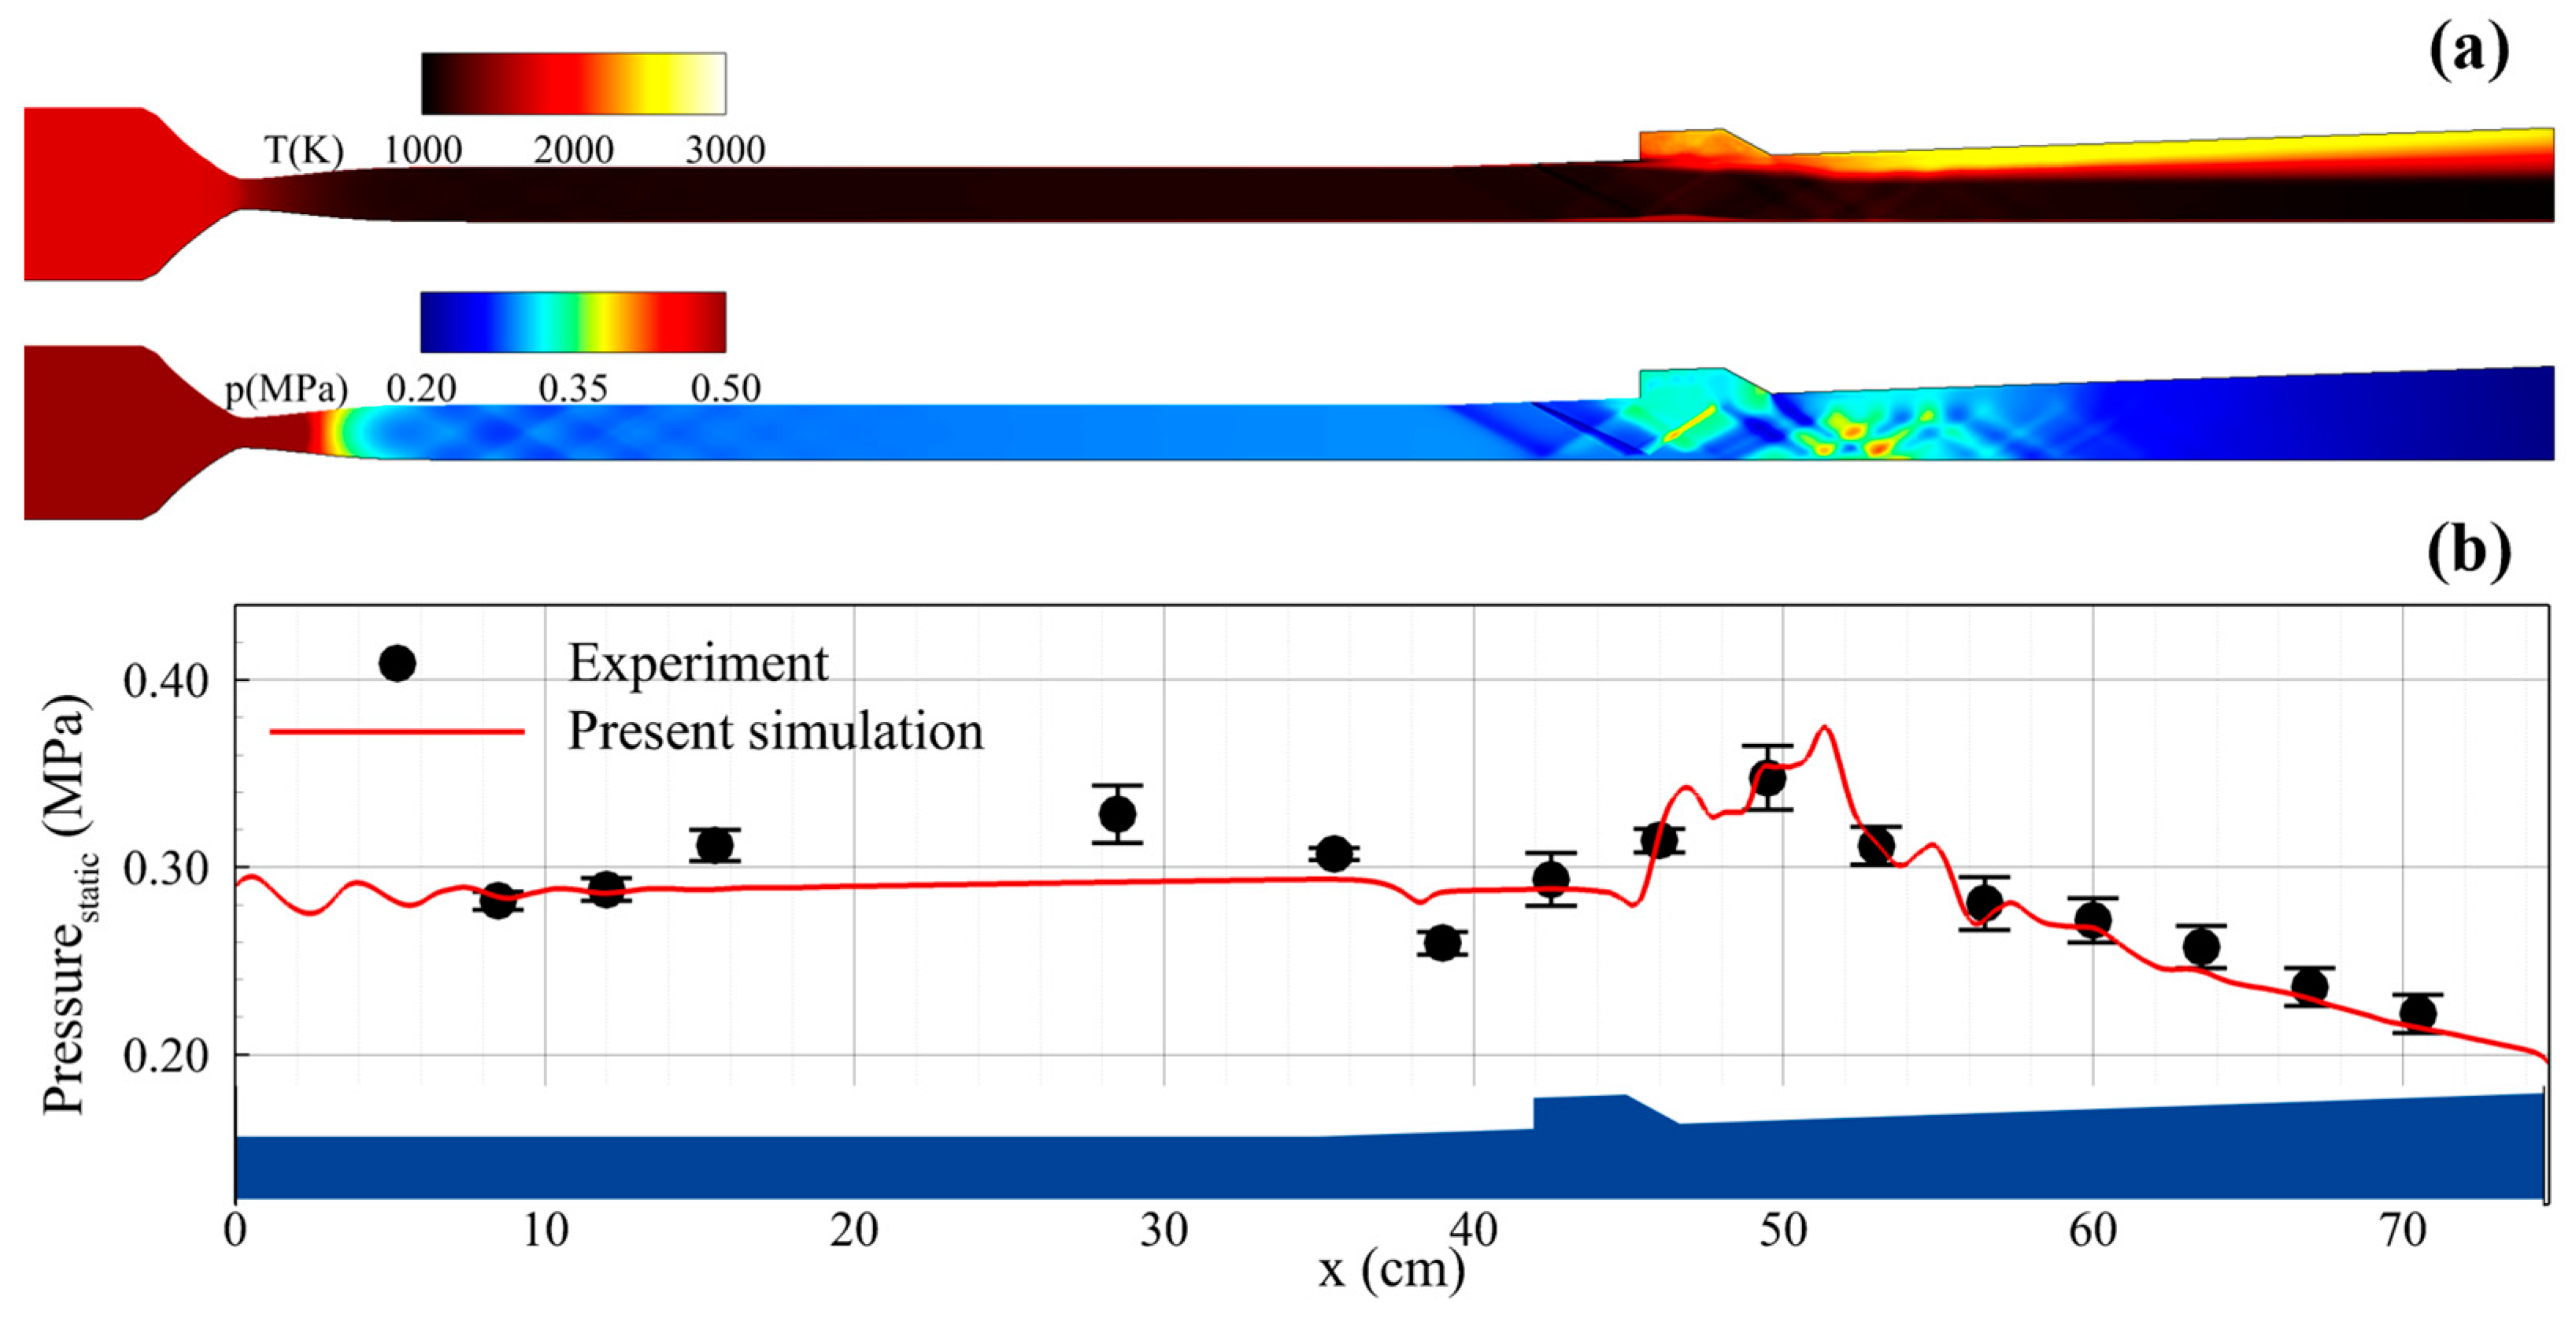
Figure 1 depicts the Pusan National University Direct-Connect Scramjet Combustor (PNU DCSC), the combustor model utilized in the present study. The PNU DCSC primarily comprises a vitiation air heater (VAH), a circular-to-rectangular shape transition (CRST) nozzle, and a supersonic combustor. The DCSC’s design aims to establish stabilized supersonic flow fields with a Mach number of 2.0 and a static temperature of 1000 K within the isolator. The VAH, which is a small rocket combustor designed to supply a supersonic flow with a high-enthalpy, has a similar shape to the Rocket Combustor Model-1 (RCM-1) by Marshall et al. [57]. The VAH has a single shear-coaxial injector injecting gaseous hydrogen and oxygen. One different point compared to RCM-1 is that the VAH has 24 hole-type air injectors positioned radially along the head side.
The VAH’s cross-section is circular, while the isolator section of the supersonic combustor has a square cross-section with an edge length of 2.0 mm. Consequently, when the high-enthalpy flow is channeled from the VAH to the isolator, a non-uniform flow and boundary layer may be formed. To mitigate this, CRST nozzles were conceived to suppress flow inhomogeneity and generate an optimal boundary layer [58]. Leveraging cross-sectional data derived from the two-dimensional axisymmetric Method of Characteristics (MOC) design, the 3D CRST nozzle was developed by integrating the shape transition function, accounting for the cross-sectional shift from circular to square. The three-dimensional steady-state numerical analysis results validated the achievement of a homogenous Mach number distribution and the development of a homogenous boundary layer in the CRST nozzle exit region [58].
The computational domain is from the downstream of the vitiation air heater (VAH) to a wake region after the exit of the supersonic combustor. Figure 2 illustrates the entire computational domain, excluding the wake region of the supersonic combustor. To impose an accurate mass flow rate, the entire computational region was transformed into the area ratio of a square duct with a width of 2.0 mm. The isolator is 350 mm long from the endpoint of the circular-to-rectangular shape transition (CRST) nozzle. From the end of the isolator, an expansion angle of 2° was applied to the upper wall of the combustor. Gaseous hydrogen is injected at a 30° angle. Originally, the fuel injection port was an oval shape with a shortened axis of 2.0 mm and a longer axis of 3.675 mm. For the two-dimensional numerical simulation, the fuel injection port was transformed into a slit with a width of 0.029 mm. The cavity has a ramp angle of 60° and a length-to-depth ratio of 3.
All walls except for the inflow, outflow, and fuel injector were imposed a no-slip adiabatic wall condition. The initial conditions for both the VAH downstream and the supersonic combustor are outlined in Table 1. A total of 16 grid levels were employed for the grid convergence test. Except for the combustor wake region, the coarsest and finest grids comprised around 133,000 and 683,000 grid points, respectively. The y+ value of the wall surface was maintained below 0.7~1.0, contingent on the grid level, to ensure adequate sub-boundary layer consideration. The present grid topology is based on a structure grid. Therefore, the y+ value is identical throughout the entire wall surface at the isolator. Due to roughly 30 grid points within the boundary layer region, most of the turbulent kinetic energy was resolved in the boundary layer. For the grid convergence test, fuel was injected at an equivalence ratio, ϕ of 0.30, representing a stable combustion mode, and the time-averaged outcomes were collected over 20 ms. The grid convergence study showed that the same pressure fields are derived at about 571,000 and 683,000 grid systems. The results of the grid refinement study are detailed in the previous study [26]. The current computational domain encompasses approximately 571,000 grid points, consistent with the previous research.

2.5. Validation

Due to the ongoing calibration of the experimental test rig to fulfill the design point, our previous study was conducted to validate the numerical framework using Evans et al.’s supersonic jet problem [26,59]. The results revealed that the present framework accurately predicted pitot pressure distribution compared to the experiment and another numerical study [60,61]. In the current study, validation was performed using experimental data extracted from the design point experimental test. The incoming vitiated air features a total pressure and total temperature of 17.64 ± 0.22 bar and 1753 ± 37.0 K, respectively, with a vitiated air composition in terms of mole fraction at N2:H2O:O2 = 0.6036:0.1984:0.1980. This high enthalpy incoming air condition aligns exactly with the PNU-DCSC design point. The fuel injection condition is 4.0 bar. Validation results show that the pressure increase in the isolator region was not accurately captured due to the absence of the left and right walls. However, the combustion pressure rises and declines of the combustor exhibit good agreement with experimental results, as depicted in Figure 3. Therefore, despite certain limitations attributed to the two-dimensional simulation, the present framework can offer reasonable numerical results for comprehensively identifying the overall macroscopic dynamics.

2.6. Formation and Stabilization of Supersonic Flow Field

Starting scramjet engines requires specific sequences, such as forming supersonic flow fields, fuel injection, ignition, and stabilization. Establishing these procedures is essential for both experimental tests and numerical simulations. Therefore, a preliminary numerical simulation was performed to investigate the time for requiring a supersonic flow field stabilized at the entire field. The CFL number was maintained in the range of 5 to 10 using the third-order MUSCL scheme to obtain data rapidly. The working fluid conditions were imposed, as shown in Table 1. The results indicated that the time taken to stabilize the supersonic flow field in the combustor after VAH starts was at least 4.0 ms. It was confirmed that completely stable supersonic flow in the isolator satisfies the design point as a Mach number of 2.0 and 1000 K. Based on the results, fuel was injected 8.0 ms after the VAH was started. The time taken for the pressure fields to fully develop in the VAH downstream should be considered in experimental tests. As previously mentioned, the VAH in this study is similar in shape and operating condition to the RCM-1. In several numerical studies on the RCM-1, it was observed that it took approximately 24 ms or more to build up the pressure downstream of the VAH combustor. Therefore, in the combustion test, it was estimated that about 30 ms is required to stabilize the supersonic flow field after VAH starts.

3. Combustion Characteristics

Numerical simulation was performed at five global equivalence ratios from 0.30 to 0.50. As mentioned in the previous section, fuel was injected starting from 8.0 ms after the stabilization of the supersonic flow field was completed. Up to 100 ms of the numerical results were obtained at all the equivalence ratios. The time averaging was initiated starting from 20 ms after the combustion flow field was sufficiently developed. Because the flow through time (FTT) was only 0.2 ms, there was no lack of data acquisitions to derive the time-averaged result. Before analyzing the combustion instability of the scramjet engine, the combustion characteristics and the combustion mode and operating mode will be explained in Section 3.1 and Section 3.2. Section 3.3 presents the examination of the dynamics of the pressure and temperature fluctuation using the x–t diagram on the wall. Next, the investigation of the dynamics of upstream-traveling shock waves in the cavity shear-layer combustion mode is presented in Section 4.1. The transition process of the combustion mode is explained in Section 4.2, and the dynamics of the upstream-traveling shock wave in the jet-wake combustion mode is presented in Section 4.3. The analysis of the low-frequency supersonic combustion instability and difference as a function of the equivalence ratio and combustion mode is presented in Section 4.4 and Section 4.5.

3.1. Combustion Modes

The combustion mode of a supersonic combustor is determined by the fuel injection scheme, combustor shape, and cavity condition and can be broadly classified into cavity shear-layer and jet-wake combustion modes [6,62,63,64,65,66]. Alongside the combustion mode, the operating mode, which can be categorized as ram/scram mode, is a crucial parameter for characterizing the reactive flow field. The instantaneous results for each property at 100 ms are depicted in Figure 4. Initially, within an equivalence ratio range of 0.3~0.4, the shear layer of the fuel stream originating from the cavity region is distinctly observable in the flow field. The formation of this shear layer is accompanied by an intense OH concentration and a temperature field distribution of over 2000 K. Furthermore, except within the shear layer, a high-temperature flow field of 1500 K is distributed in the cavity region. After the cavity close-out region, the combustion of the fuel stream intensified, leading to a substantial elevation in the temperature distribution, reaching up to 3000 K. The pressure gradient indicated the creation of expansion fans and oblique shock waves in the fuel injection zone. These fans and shock waves have multiple reflections between the fuel stream and the lower wall of the combustor. The maximum combustion pressure is anchored in the rear of the cavity close-out region. With a further increase in the equivalence ratio to 0.45 or beyond, the fuel burned following injection, leading to a notable OH mass fraction distribution near the injector side. Additionally, a high-temperature flow field was formed in the forward recirculation region of the fuel injector. This process collapses the shear layer of the fuel stream, the expansion fan, and the oblique shock wave structure. At the pressure and pressure gradient contour, the gaseous fuel was observed to be immediately mixed and burned owing to the relatively strong injection pressure, and a subsonic flow field was locally formed in this region.
Figure 5 illustrates the time–averaged OH mass fraction and temperature field outcomes across all equivalence ratios. As the equivalence ratio transitions from 0.30 to 0.40, distinct characteristics of the cavity shear-layer combustion mode become evident. Oblique shockwaves and expansion fans, generated during fuel injection, form a sizable separation region along the lower wall of the combustor, which is subsequently reflected. The fuel stream undergoes mixing and combustion at the cavity close-out region, revealing a strong combustion reaction within the mixing layer. Within this region, the mixing layer thickness increases, accompanied by an expansion of the reaction area. At an equivalence ratio of 0.30, an intense combustion reaction and high-temperature distribution occur within the fuel/air mixing layer, with the temperature field exceeding 2000 K. These findings imply that the flow field manifests characteristics of the cavity shear-layer combustion mode within the range of 0.30–0.40 equivalence ratios. However, at an equivalence ratio of 0.45, the flow field showcases characteristics of both cavity shear-layer and jet-wake combustion modes. Upon reaching an equivalence ratio of 0.50, the flow field distinctly manifests jet-wake combustion mode characteristics. In this configuration, the injected fuel rapidly mixes with the main flow, followed by combustion. Consequently, a high-temperature zone exceeding 1400 K is formed between the fuel injector and the cavity. Notably, the shock wave structures and separation region along the lower wall, triggered by fuel injection, which were prominent at lower equivalence ratios, become absent. Moreover, elevated temperature flow fields above 2000 K are distributed inside the cavity region.
The transition in combustion mode accompanies the variation in combustion regimes with changes in the equivalence ratio. The time–averaged Takeno flame index [67], used to distinguish non-premixed and premixed combustion regimes according to the combustion mode, is depicted in Figure 6. At an equivalence ratio of 0.30–0.40, where the cavity shear-layer combustion mode characteristics were observed, strong premixed combustion traits were evident exclusively along the fuel stream. At an equivalence ratio of 0.3, this premixed combustion region is extended upstream of the combustor. As the equivalence ratio increased to 0.40, the premixed region gradually diminished, yet the trend persisted, and the non-premixed combustion characteristics dominated inside the cavity. With an increase in equivalence ratio to 0.45, non-premixed and premixed combustion traits were observable in the jet-wake region following fuel injection. This suggests that the fuel injected at an equivalence ratio of 0.45 promptly penetrated the main flow, mixing and burning thereafter. This sort of numerical result shows that an equivalence ratio of 0.30–0.40 presents the cavity shear-layer combustion mode, and above 0.45 has the jet-wake combustion mode.

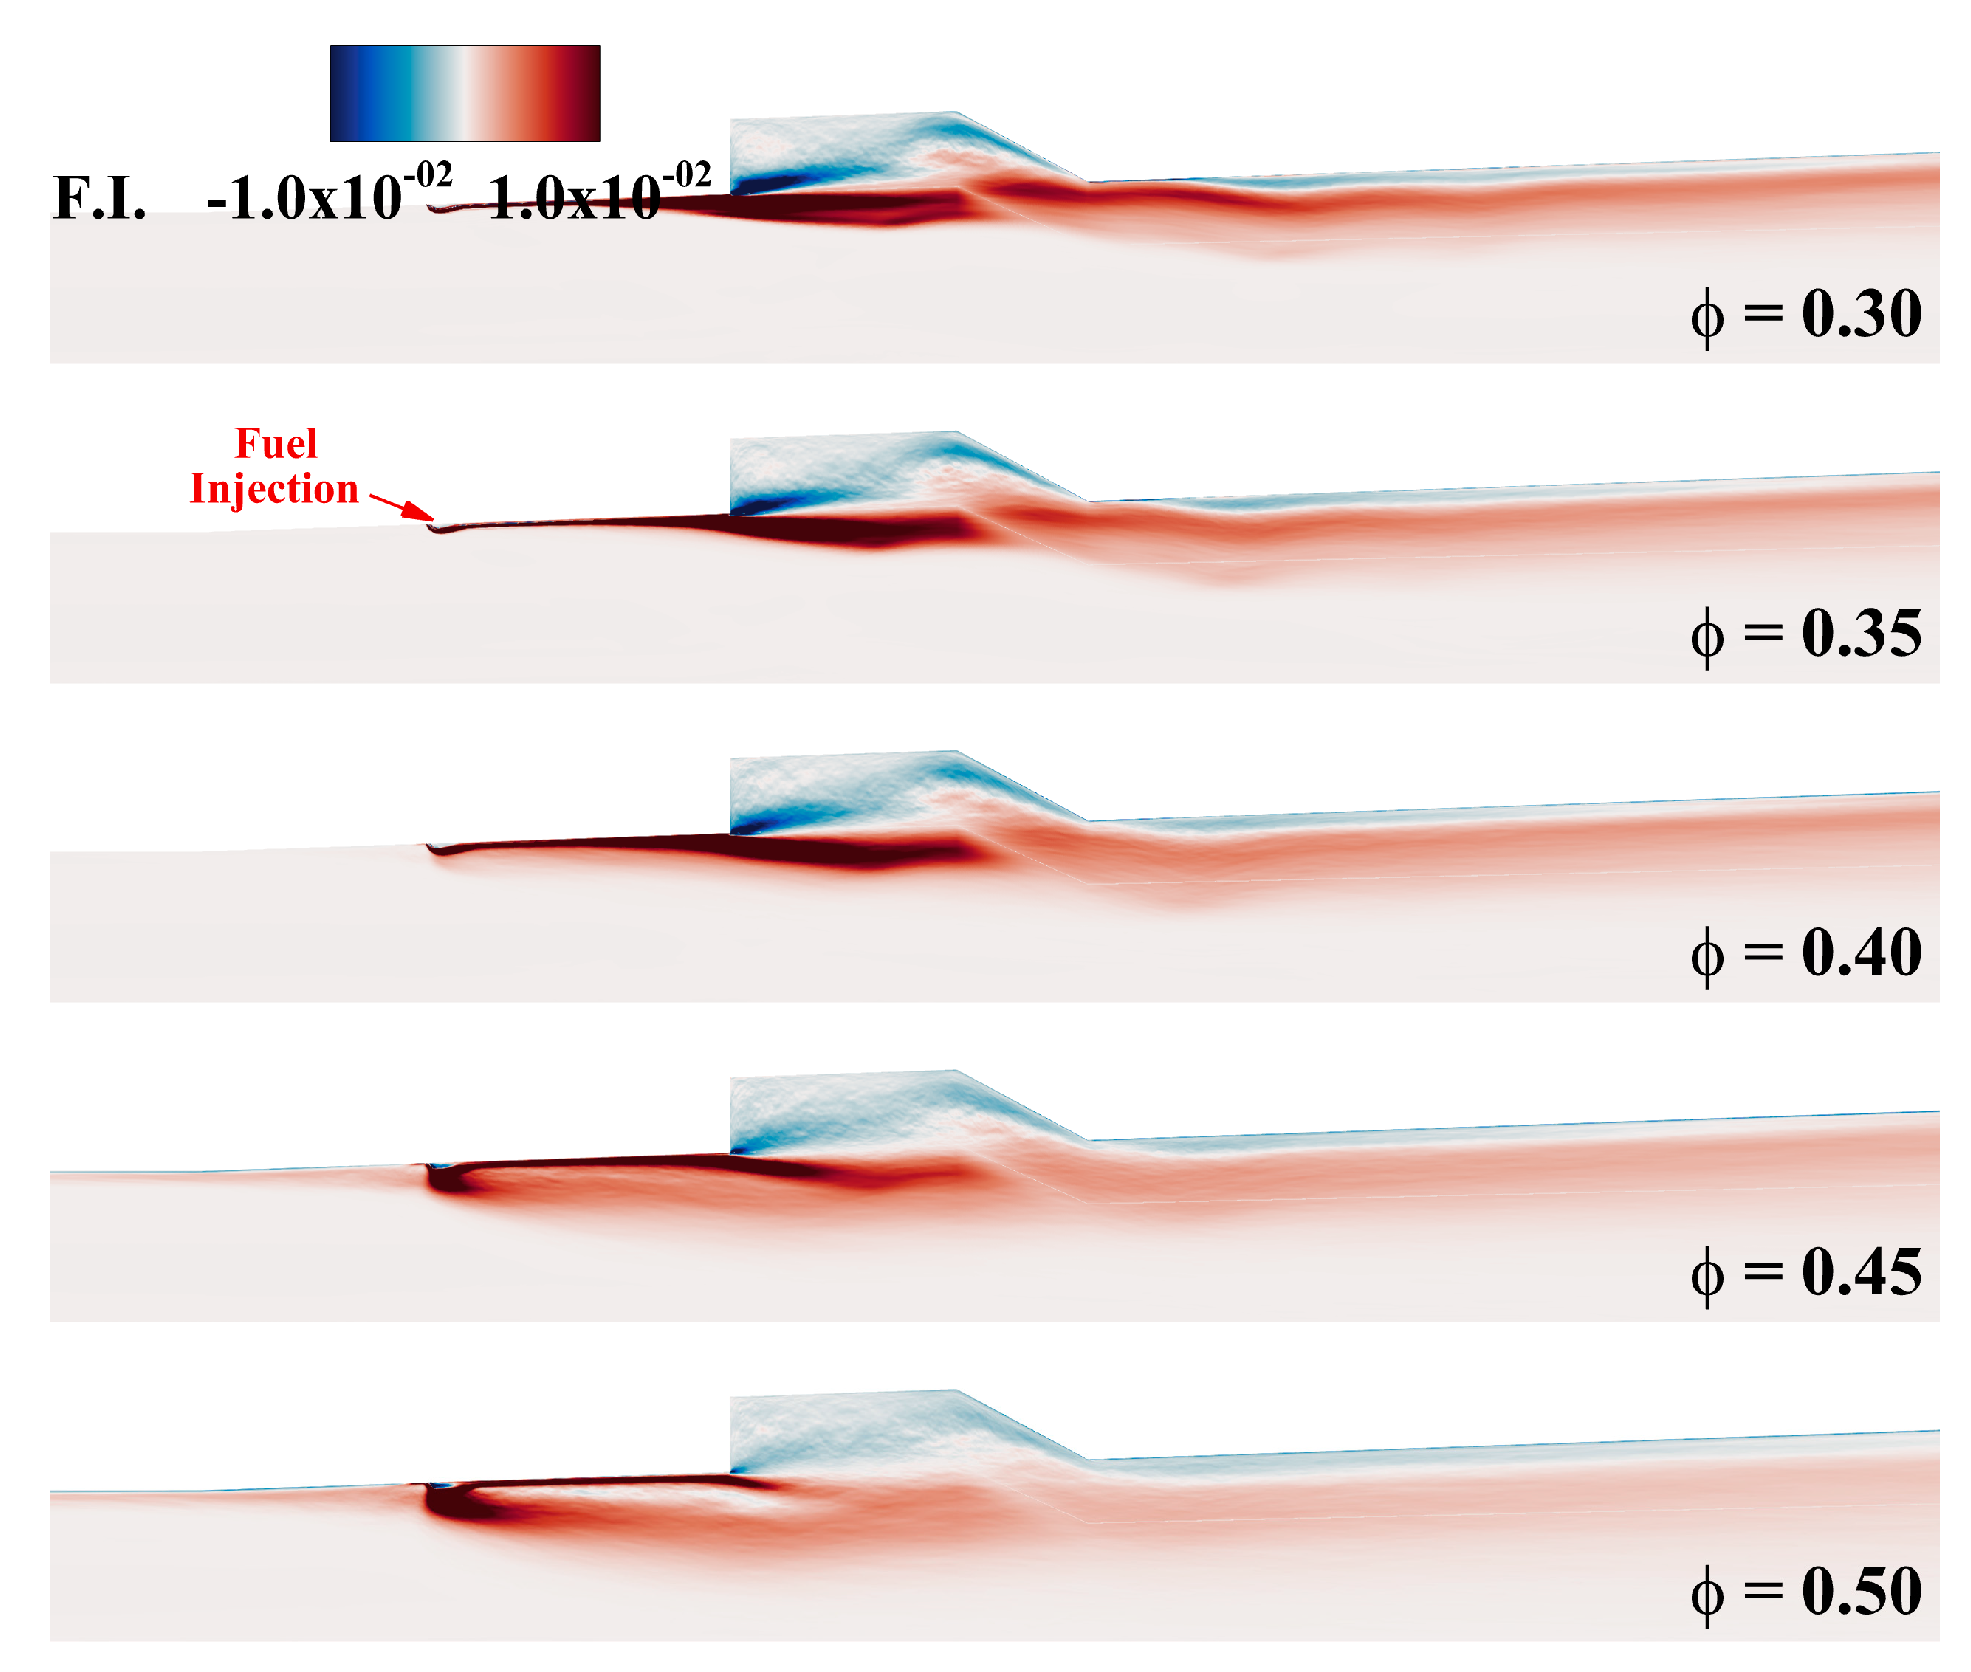
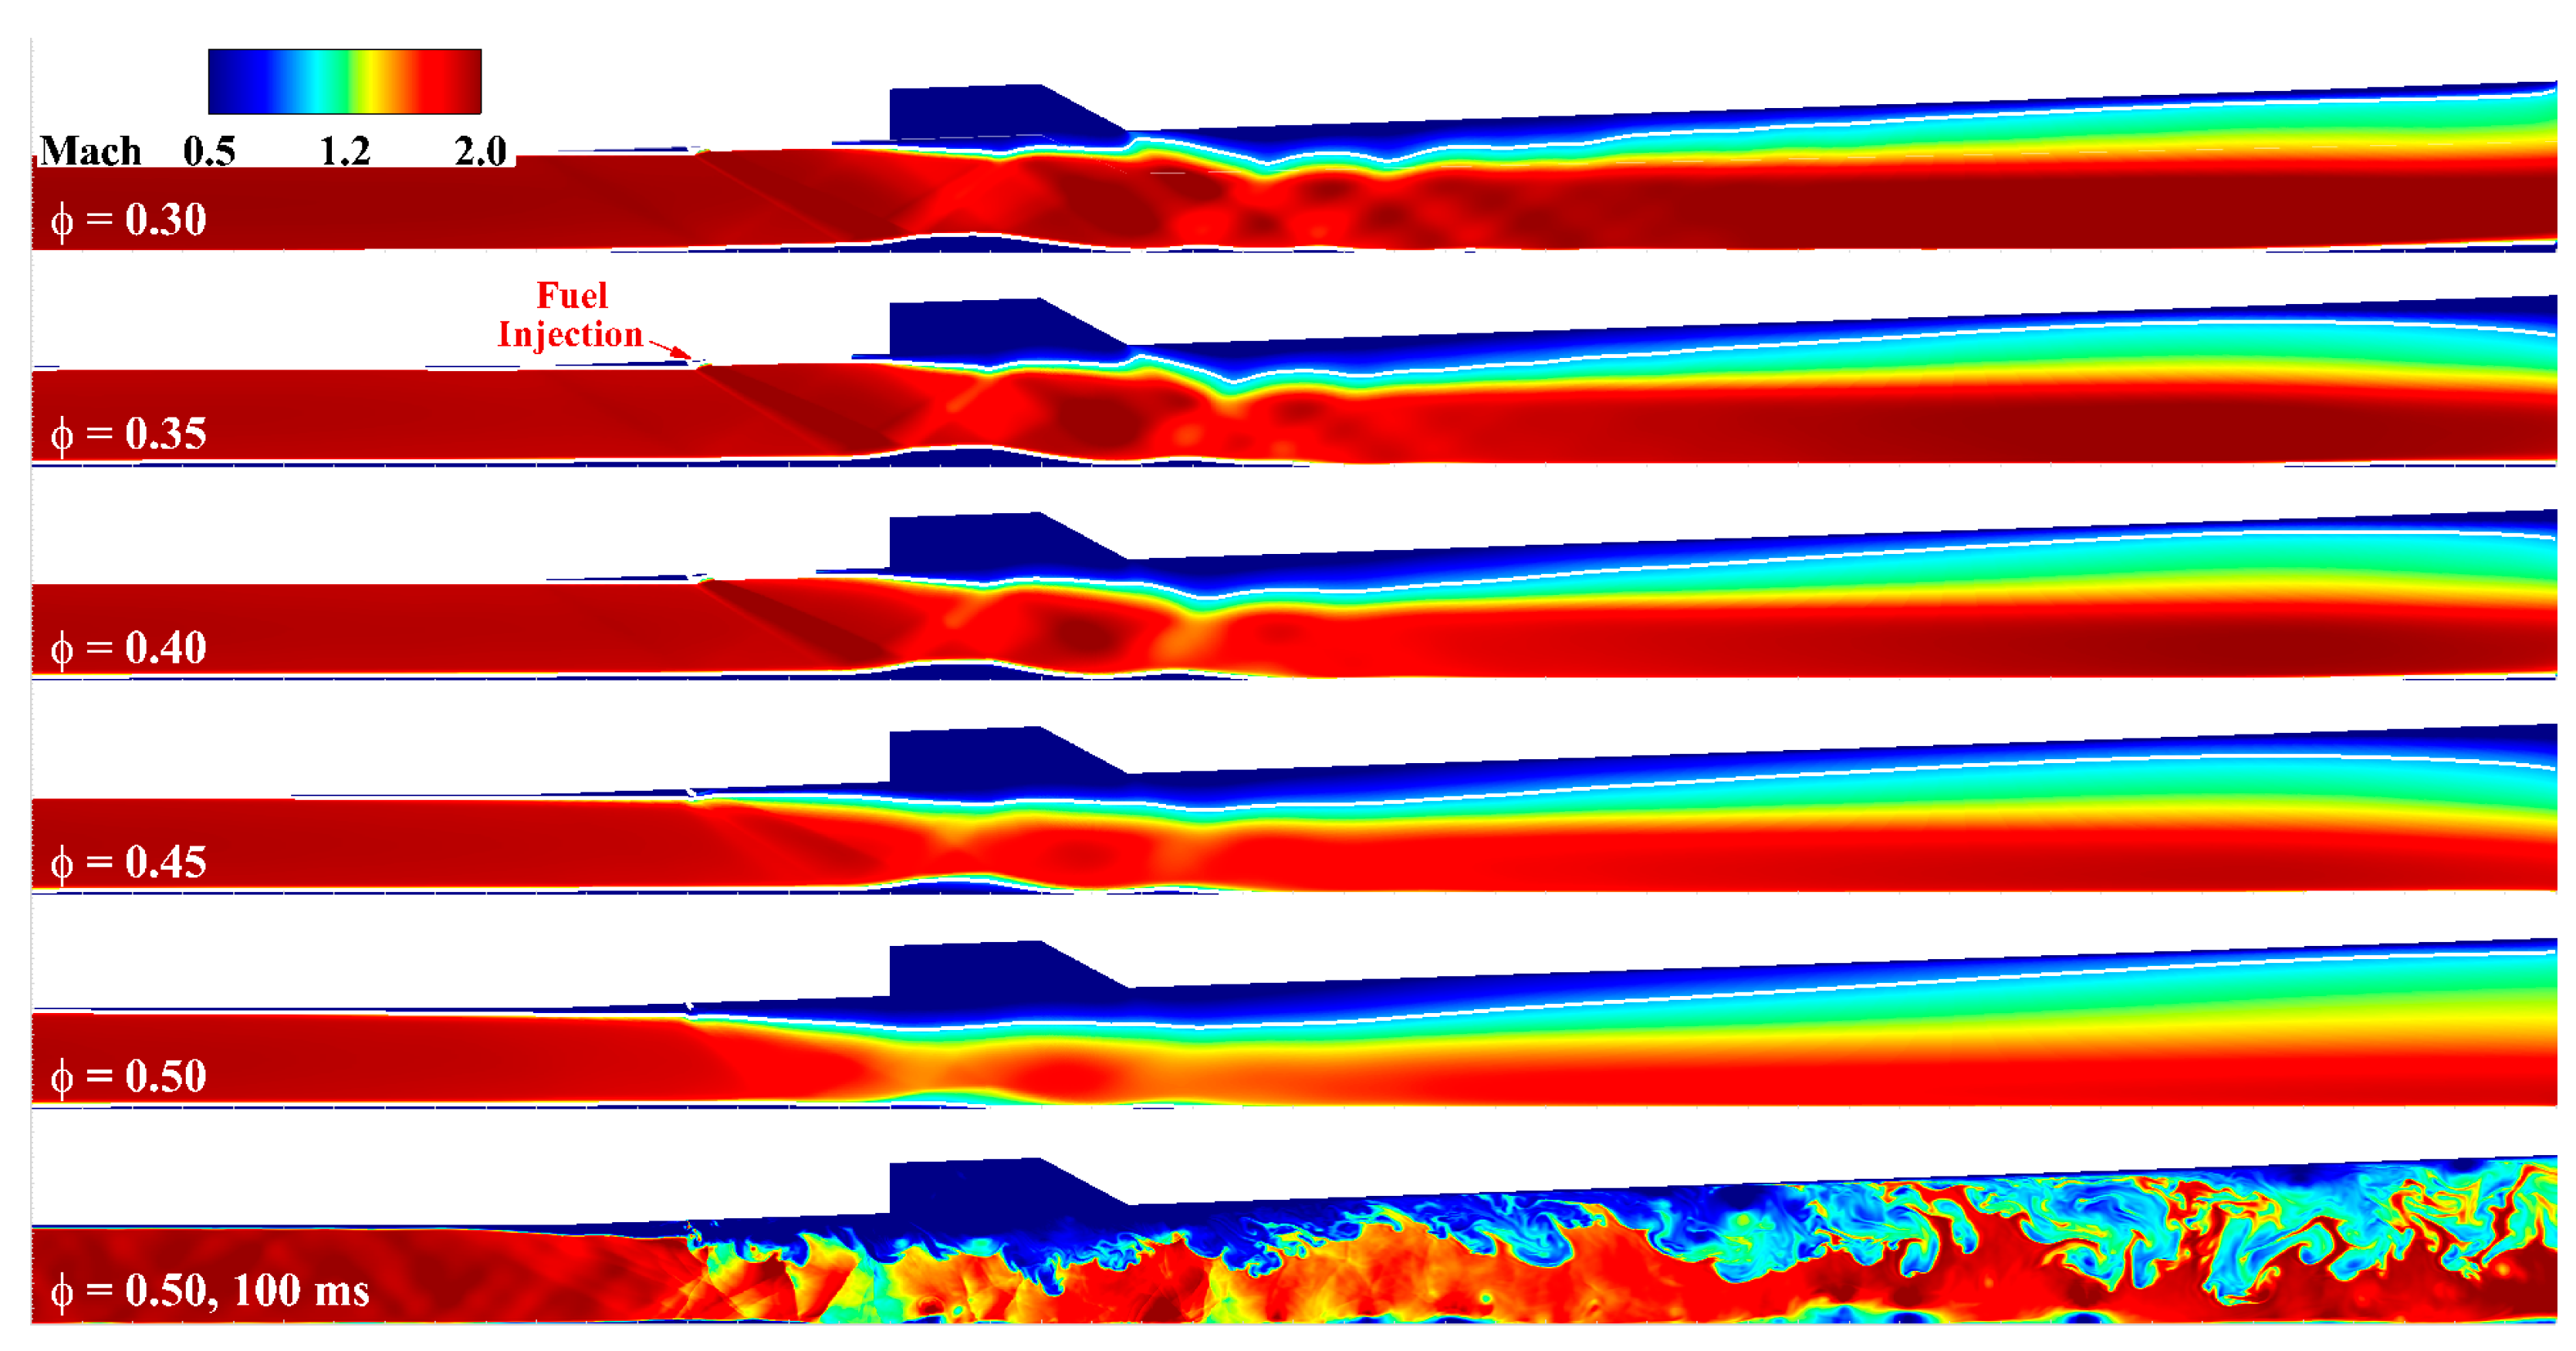
3.2. Operating Conditions

To confirm the operating mode under each equivalence ratio, both time–averaged and instantaneous results for the Mach number distribution, represented by the Mach line as a white iso-line, are depicted in Figure 7. At the low equivalence ratios ranging from 0.30 to 0.40, which exhibited a cavity shear-layer combustion mode, large separation regions were consistently observed along the lower wall of the combustor. Additionally, the acceleration and deceleration of the Mach number, resulting from the shockwaves and expansion fan structure induced by fuel injection, were noticeable. As the equivalence ratio exceeded 0.45, the large separation region along the lower wall was significantly reduced. Subsonic regions were formed between the fuel injector and the cavity. This subsonic region expanded progressively with an increase in the equivalence ratio. At an equivalence ratio of 0.50, the Mach number of the main flow notably decreased around a Mach number of 1.5. There was a decline in the local Mach number. However, it did not fall below sonic conditions. Consequently, considering the operating mode, the time-averaged Mach number distribution indicated that the scram mode was sustained across all equivalence ratio conditions. Nonetheless, the instantaneous results in Figure 7 demonstrate a mode transition from scram to weak ram with thermal choking.
For a more quantitative analysis, an x-P-M scatterplot was generated, depicting the relationship between Mach number and static pressure, as shown in Figure 8. The x-axis of the scatterplot corresponds to the axial distance from the exit of the isolator to the upstream section of the supersonic combustor, while the y-axis represents static pressure. The contour represents the Mach number distribution. By abstracting spatial information from the depicted region, the x–P–M scatterplot offers a significant advantage: facilitating an effective quantitative analysis of pressure and Mach number distributions along the axial direction. Figure 8 shows that the region of maximum combustion pressure anchored points towards the cavity region to the fuel injection region as the equivalence ratio increases. Owing to numerous grid points being concentrated to investigate boundary layer behavior and separation regions along the wall, the physical properties near the wall, where no-slip adiabatic conditions were applied, might be accentuated. Nonetheless, at equivalence ratios of 0.35 and 0.40, the region between the fuel injector and the cavity remained supersonic, with only a small section after the cavity exhibiting subsonic behavior within the combustor. Except for these regions, there were no instances of the entire longitudinal axis being subsonic. Thus, the operating mode at equivalence ratios of 0.35 and 0.40 can be deemed to consistently maintain the scram operating mode, as indicated in Figure 7. However, in the x-P-M scatterplots obtained at equivalence ratios of 0.45 and 0.50, several subsonic points were evident, particularly in the fuel injection region and the front wall of the cavity. This suggests that a transition from the scram mode to the thermal choking mode or weak ram mode occurs intermittently in these equivalence ratios. Nevertheless, considering the limited extent of the subsonic region and the findings of the time-averaged Mach number distribution presented in Figure 7, it is improper to propose a complete shift in operating mode to ram or weak ram mode. Consequently, the analysis confirms that most flow fields consistently maintained a thermally unchoked and supersonic state, with the operating mode only intermittently shifting to weak ram mode. These transitions to weak ram mode occur intermittently over a very short time window relative to the total operating time. This is a combustion instability-induced phenomenon, and it will be explained in the following section.

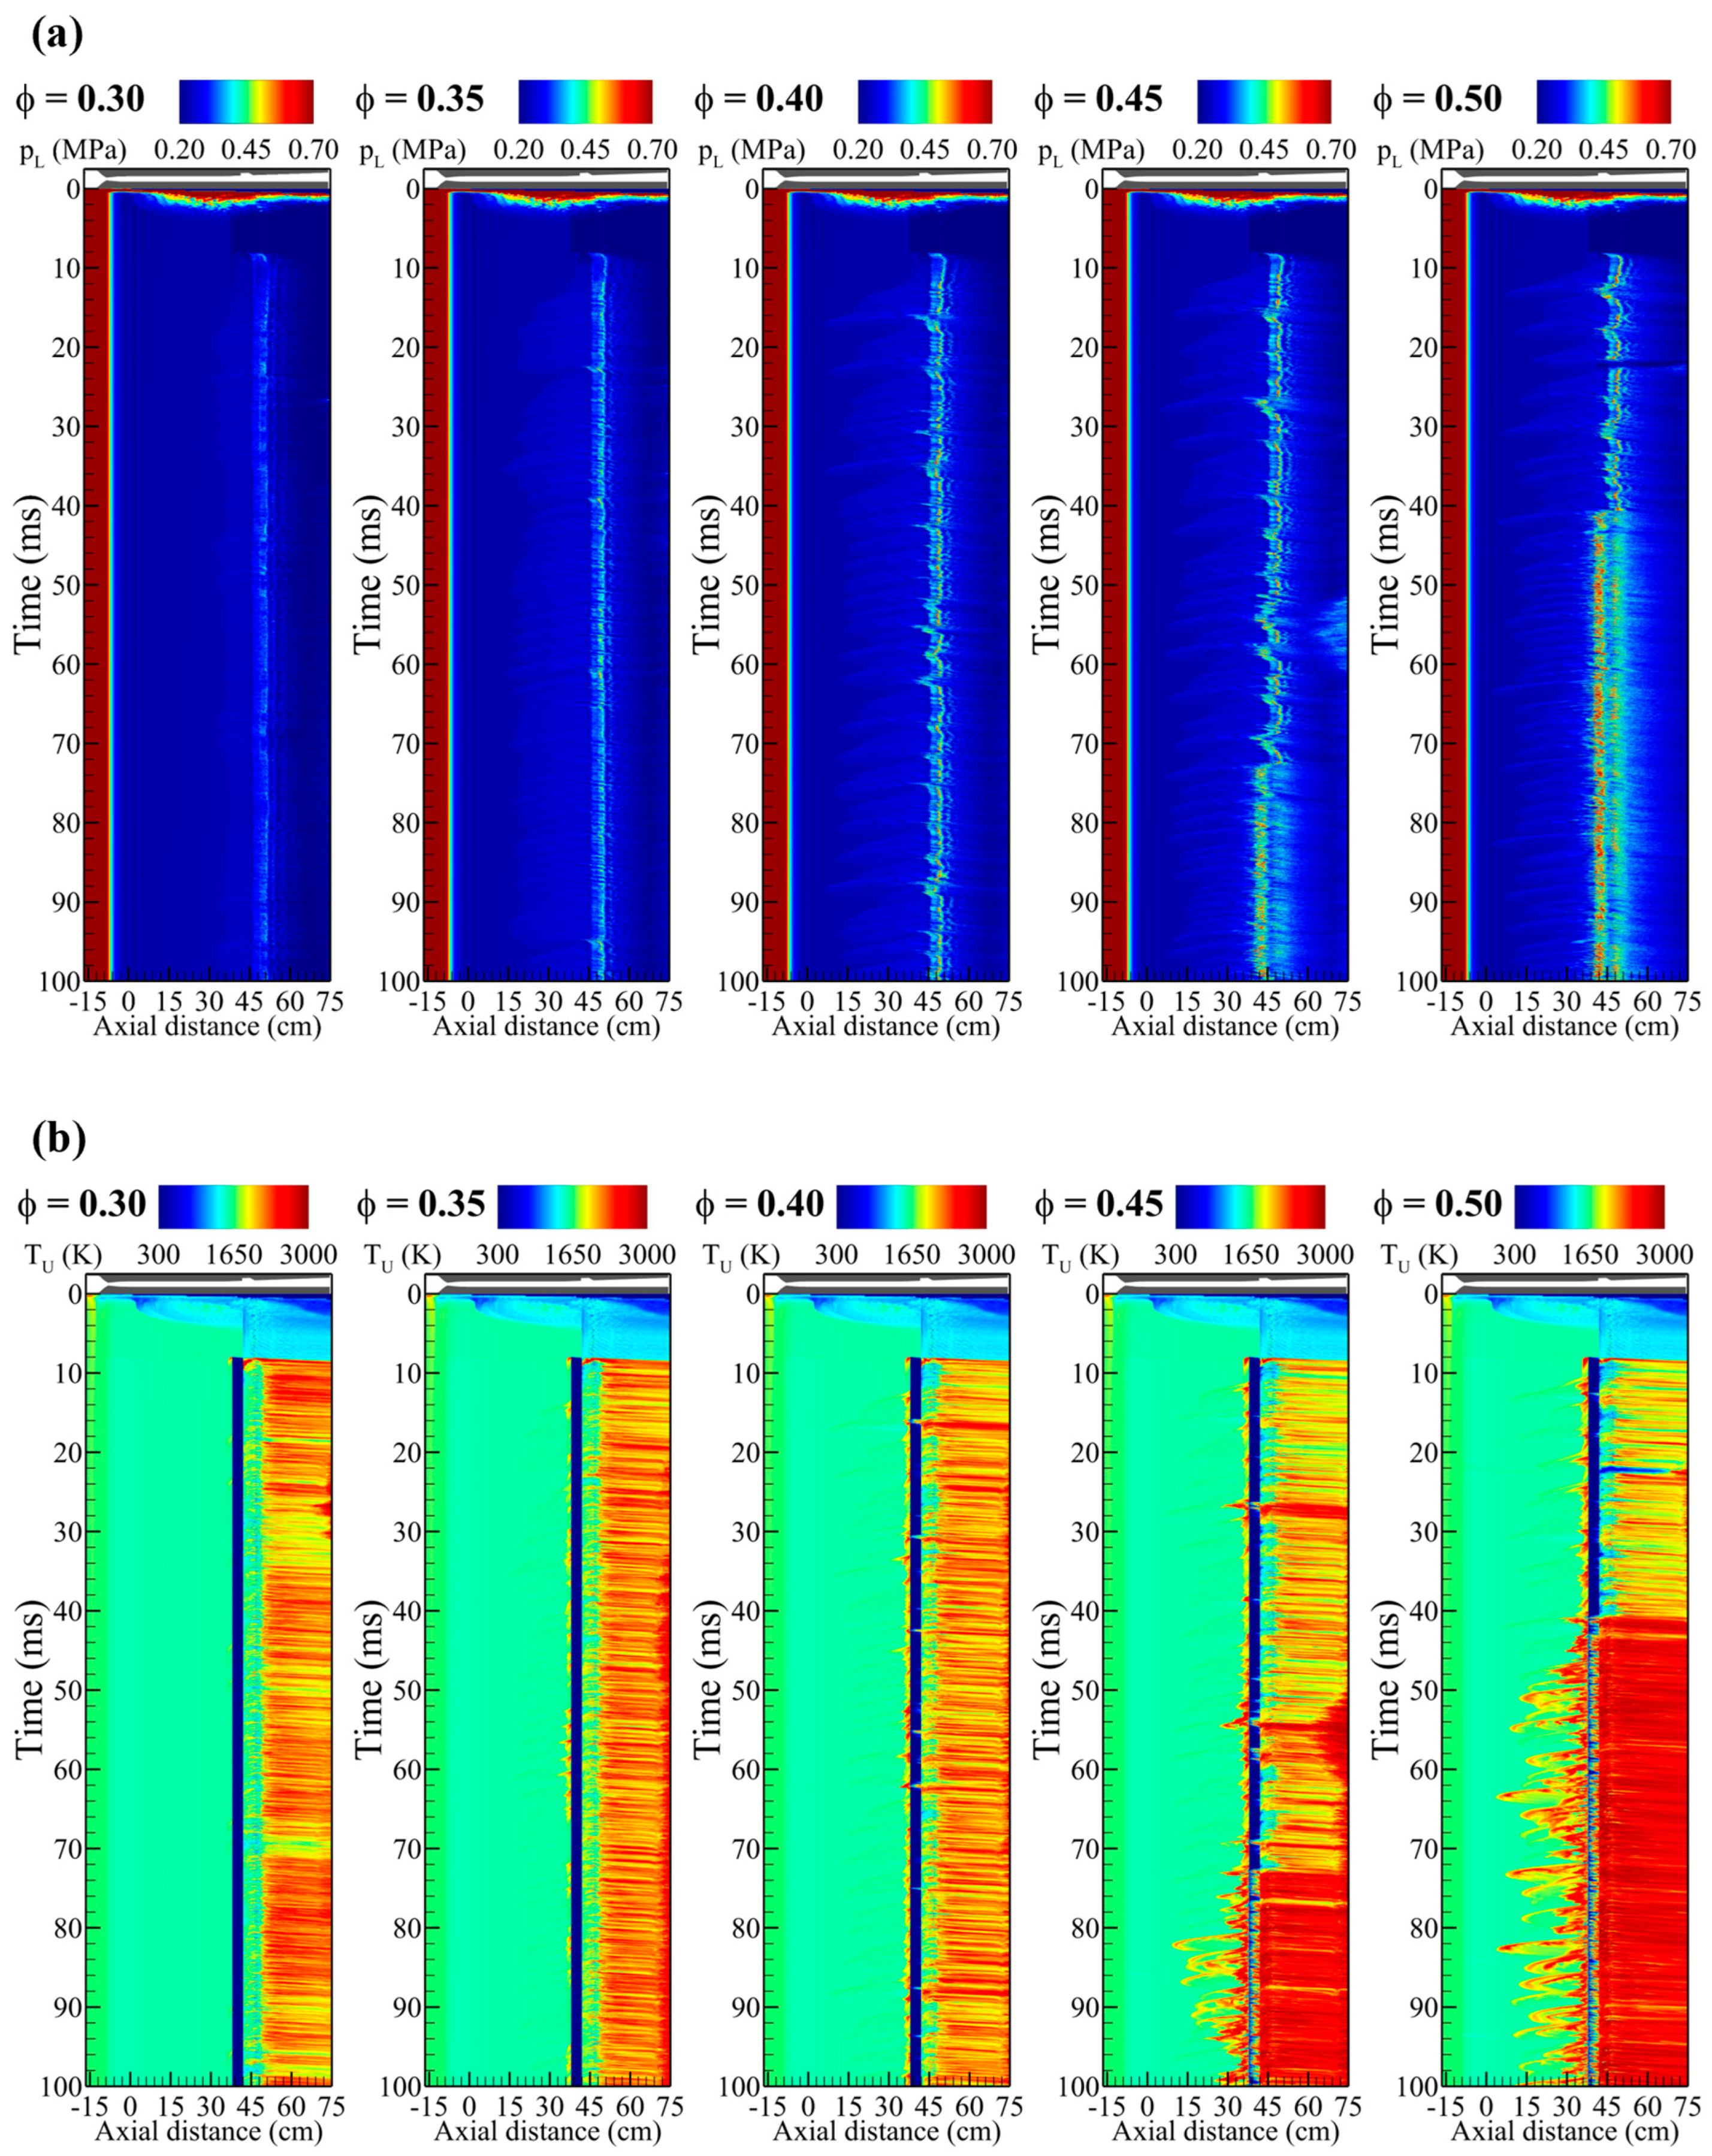
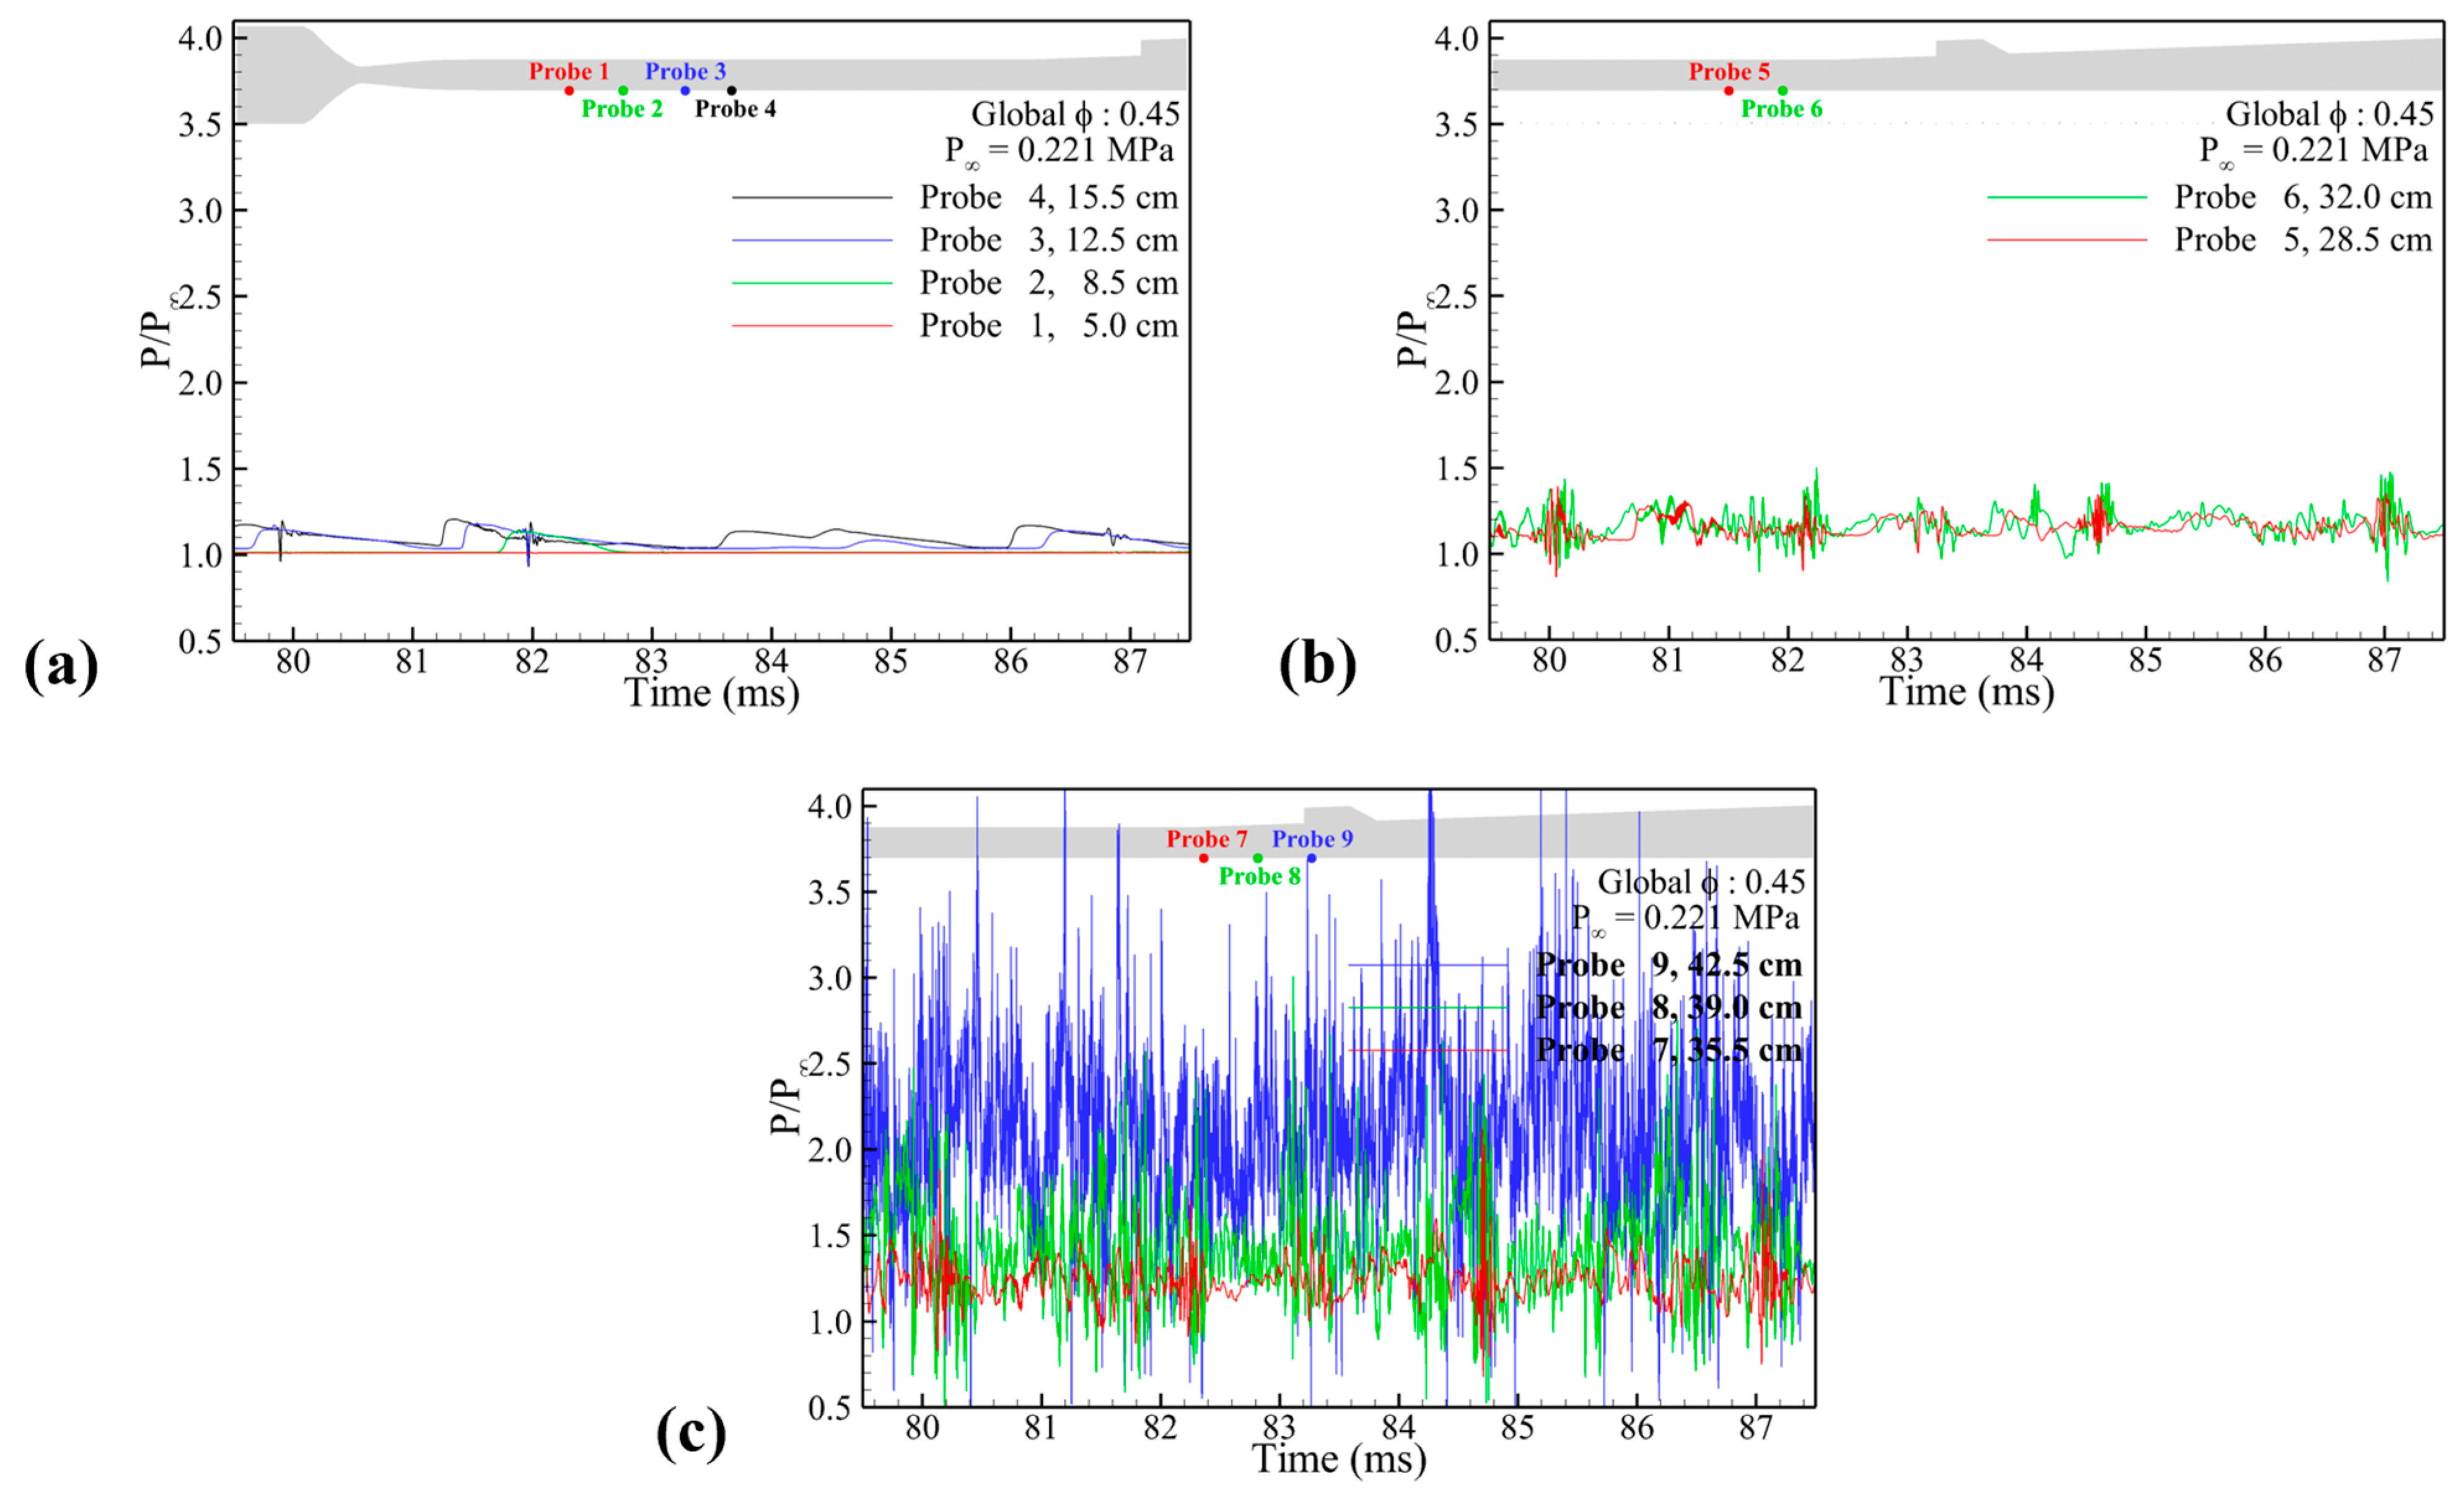
3.3. Fluctuation of Pressure and Temperature

Figure 9 shows the pressure distribution on the lower wall and the temperature field distribution on the upper wall of the entire computational domain, except for the combustor exit wake region (0 cm corresponds to the CRST nozzle exit or the isolator inlet and 75 cm corresponds to the supersonic combustor exit). As mentioned above, fuel injection was performed 8.0 ms after the start of the VAH.
Figure 9 shows that the combustion pressure propagated into the isolator at all equivalence ratios. First, at an equivalence ratio of 0.30, the combustion pressure propagated into the isolator but showed a very stable state. At an equivalence ratio of 0.35, the pressure propagation reached the central region of the isolator. In addition, the pressure gradient exhibited a repetitive behavior and induced a weak disturbance in the flow field in the combustor. Due to these dynamics, a weak oscillation was captured where the maximum combustion pressure was anchored. Although a weak combustion oscillation occurred at this equivalence ratio, it did not induce significant changes in the flow field.
The maximum combustion pressure at an equivalence ratio of 0.40 was anchored in the region of the cavity ramp angle. It was observed to maintain the cavity shear-layer combustion mode as equal to the equivalence ratios of 0.30 and 0.35. However, the pressure gradient indicating the repeated propagation–dissipation–repropagation dynamics in the insulator induced a strong fluctuation in the region where the maximum combustion pressure was anchored. When the pressure gradient inside the isolator was dissipated, the maximum combustion pressure-anchored region was shifted toward the fuel injector side. These dynamics, which were not observed at a low equivalence ratio, were observed repeatedly over the entire time range. Therefore, it is expected that this perturbation is a factor that caused the combustion instability and collapsed the flow field structure of the cavity shear-layer combustion mode explained in Section 3.1.
At equivalence ratios of 0.45 and 0.50, similar propagation–dissipation–repropagation dynamics of combustion pressure were observed. The maximum combustion pressure was located along the cavity close-out region as in the low equivalence ratio conditions but fluctuated significantly. This fluctuation gradually intensified and changed the combustion mode to the jet-wake type at 73 and 42 ms, respectively. After the change in combustion mode, the region of anchored maximum combustion pressure was changed from the cavity immediately after fuel injection. In addition, the pressure propagation into the isolator was similarly captured, but the cycle of this behavior was significantly shortened. In addition, the combustion mode transition, which occurred after a considerable amount of time, also demonstrated the importance of obtaining long-term results from a numerical simulation perspective.
Figure 9 shows that the temperature field distribution of the upper wall varies significantly depending on the combustion mode. For the equivalence ratio conditions that maintained the cavity shear-layer combination mode, particularly the equivalence ratio of 0.30, the high-temperature distribution was observed only in the regions after the cavity. At equivalence ratios of 0.35 and 0.40, a high-temperature distribution was locally detected at the exit of the isolator when the disturbance occurred in the maximum combustion pressure region. This tendency was further enhanced at equivalence ratios of 0.45 and 0.50. After the transition to a jet-wake combustion mode, the pressure propagation to the isolator induces a strong adverse pressure gradient and a higher-temperature flow than the cavity shear-layer combustor mode.
The x–t diagram results at each equivalence ratio condition indicated that the effect of the pressure propagating into the isolator increased with the increase in the equivalence ratio, and the period significantly decreased when the combustion mode transition occurred. Although there was a difference in strength, the interaction between the pressure propagated to the isolator and the flow field inside the combustor was observed. Jiang et al. [13] performed a simple numerical simulation on the phenomenon of heat release generation in a constant cross-section flow path. They found that the spherical shock wave generated downstream was propagated upstream, although there were differences with a change in the inlet Mach number. This dynamic is caused by continuous heat release in a scramjet combustor called an upstream-traveling shock wave. In addition, they found that it is essential to maintain the balance between the inlet Mach number and these upstream-traveling shock waves to prevent scramjet inlet unstart or engine surge, as reported in several experimental studies [68]. The x–t diagram results, which are the numerical simulation results over a long physical time, revealed that the upstream-traveling shock wave induced combustion instability in the combustor and presented the possibility that it could lead to scramjet unstart depending on the design and operating conditions.

4. Low-Frequency Combustion Instability

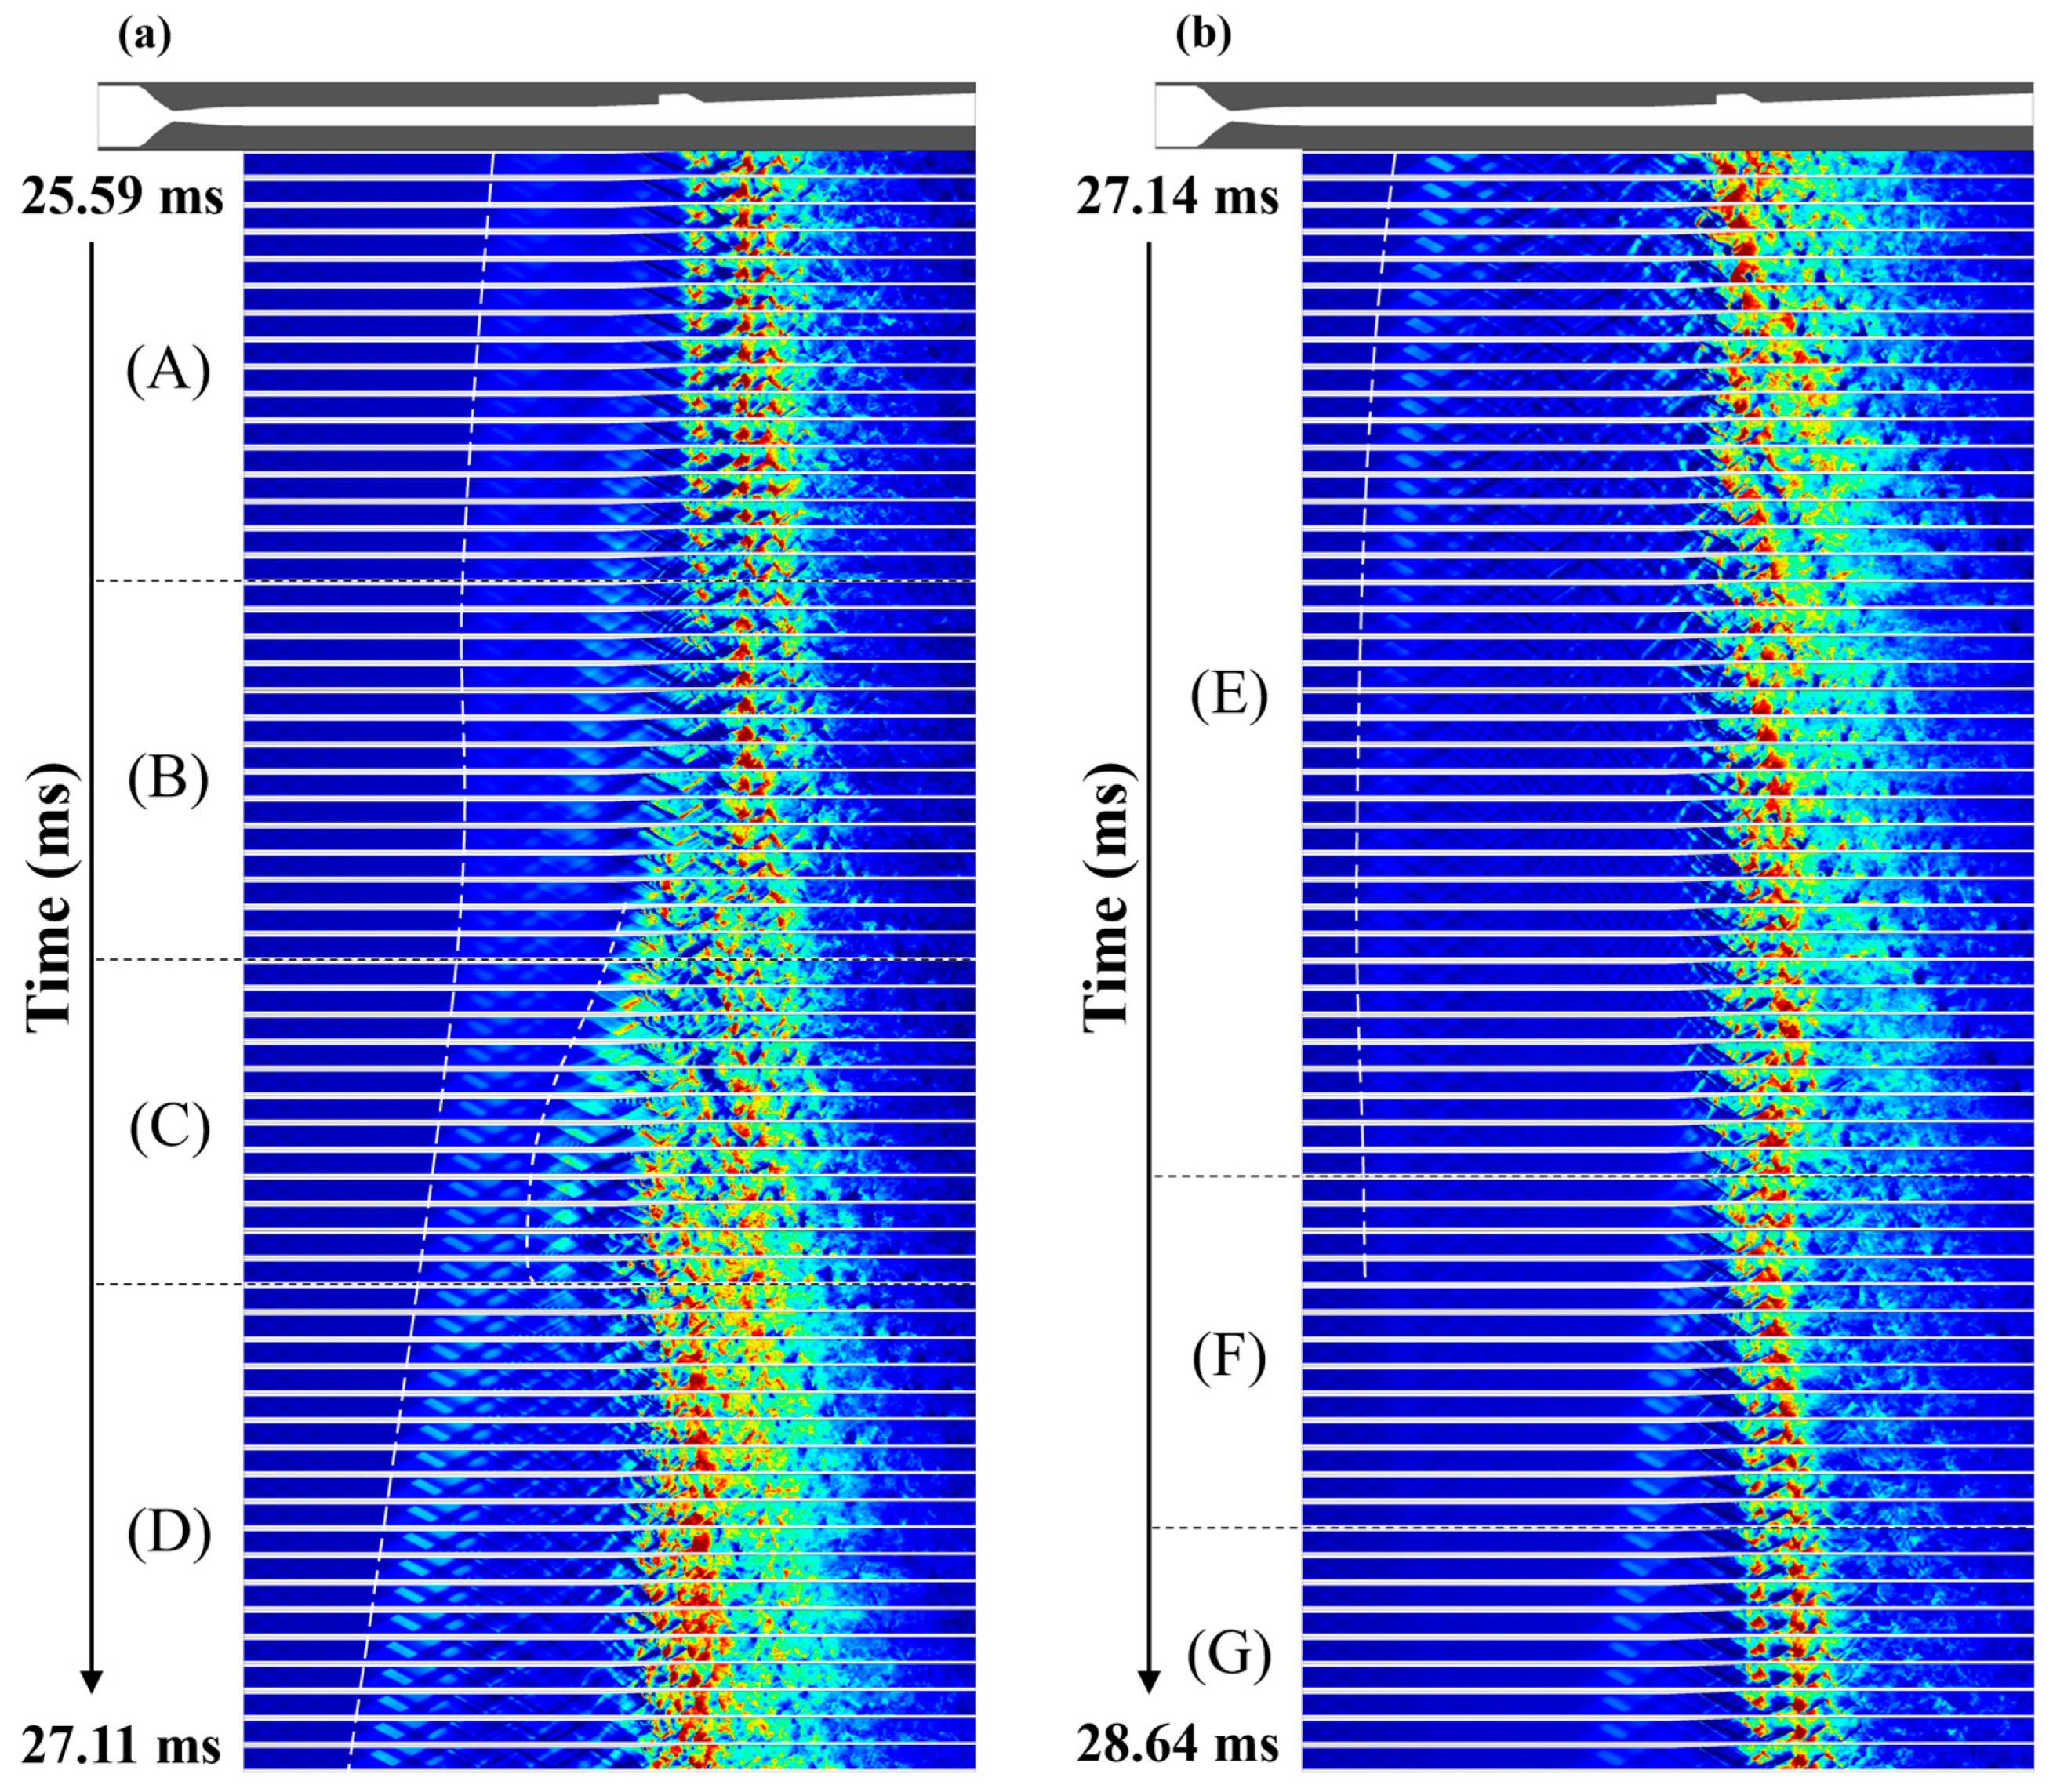
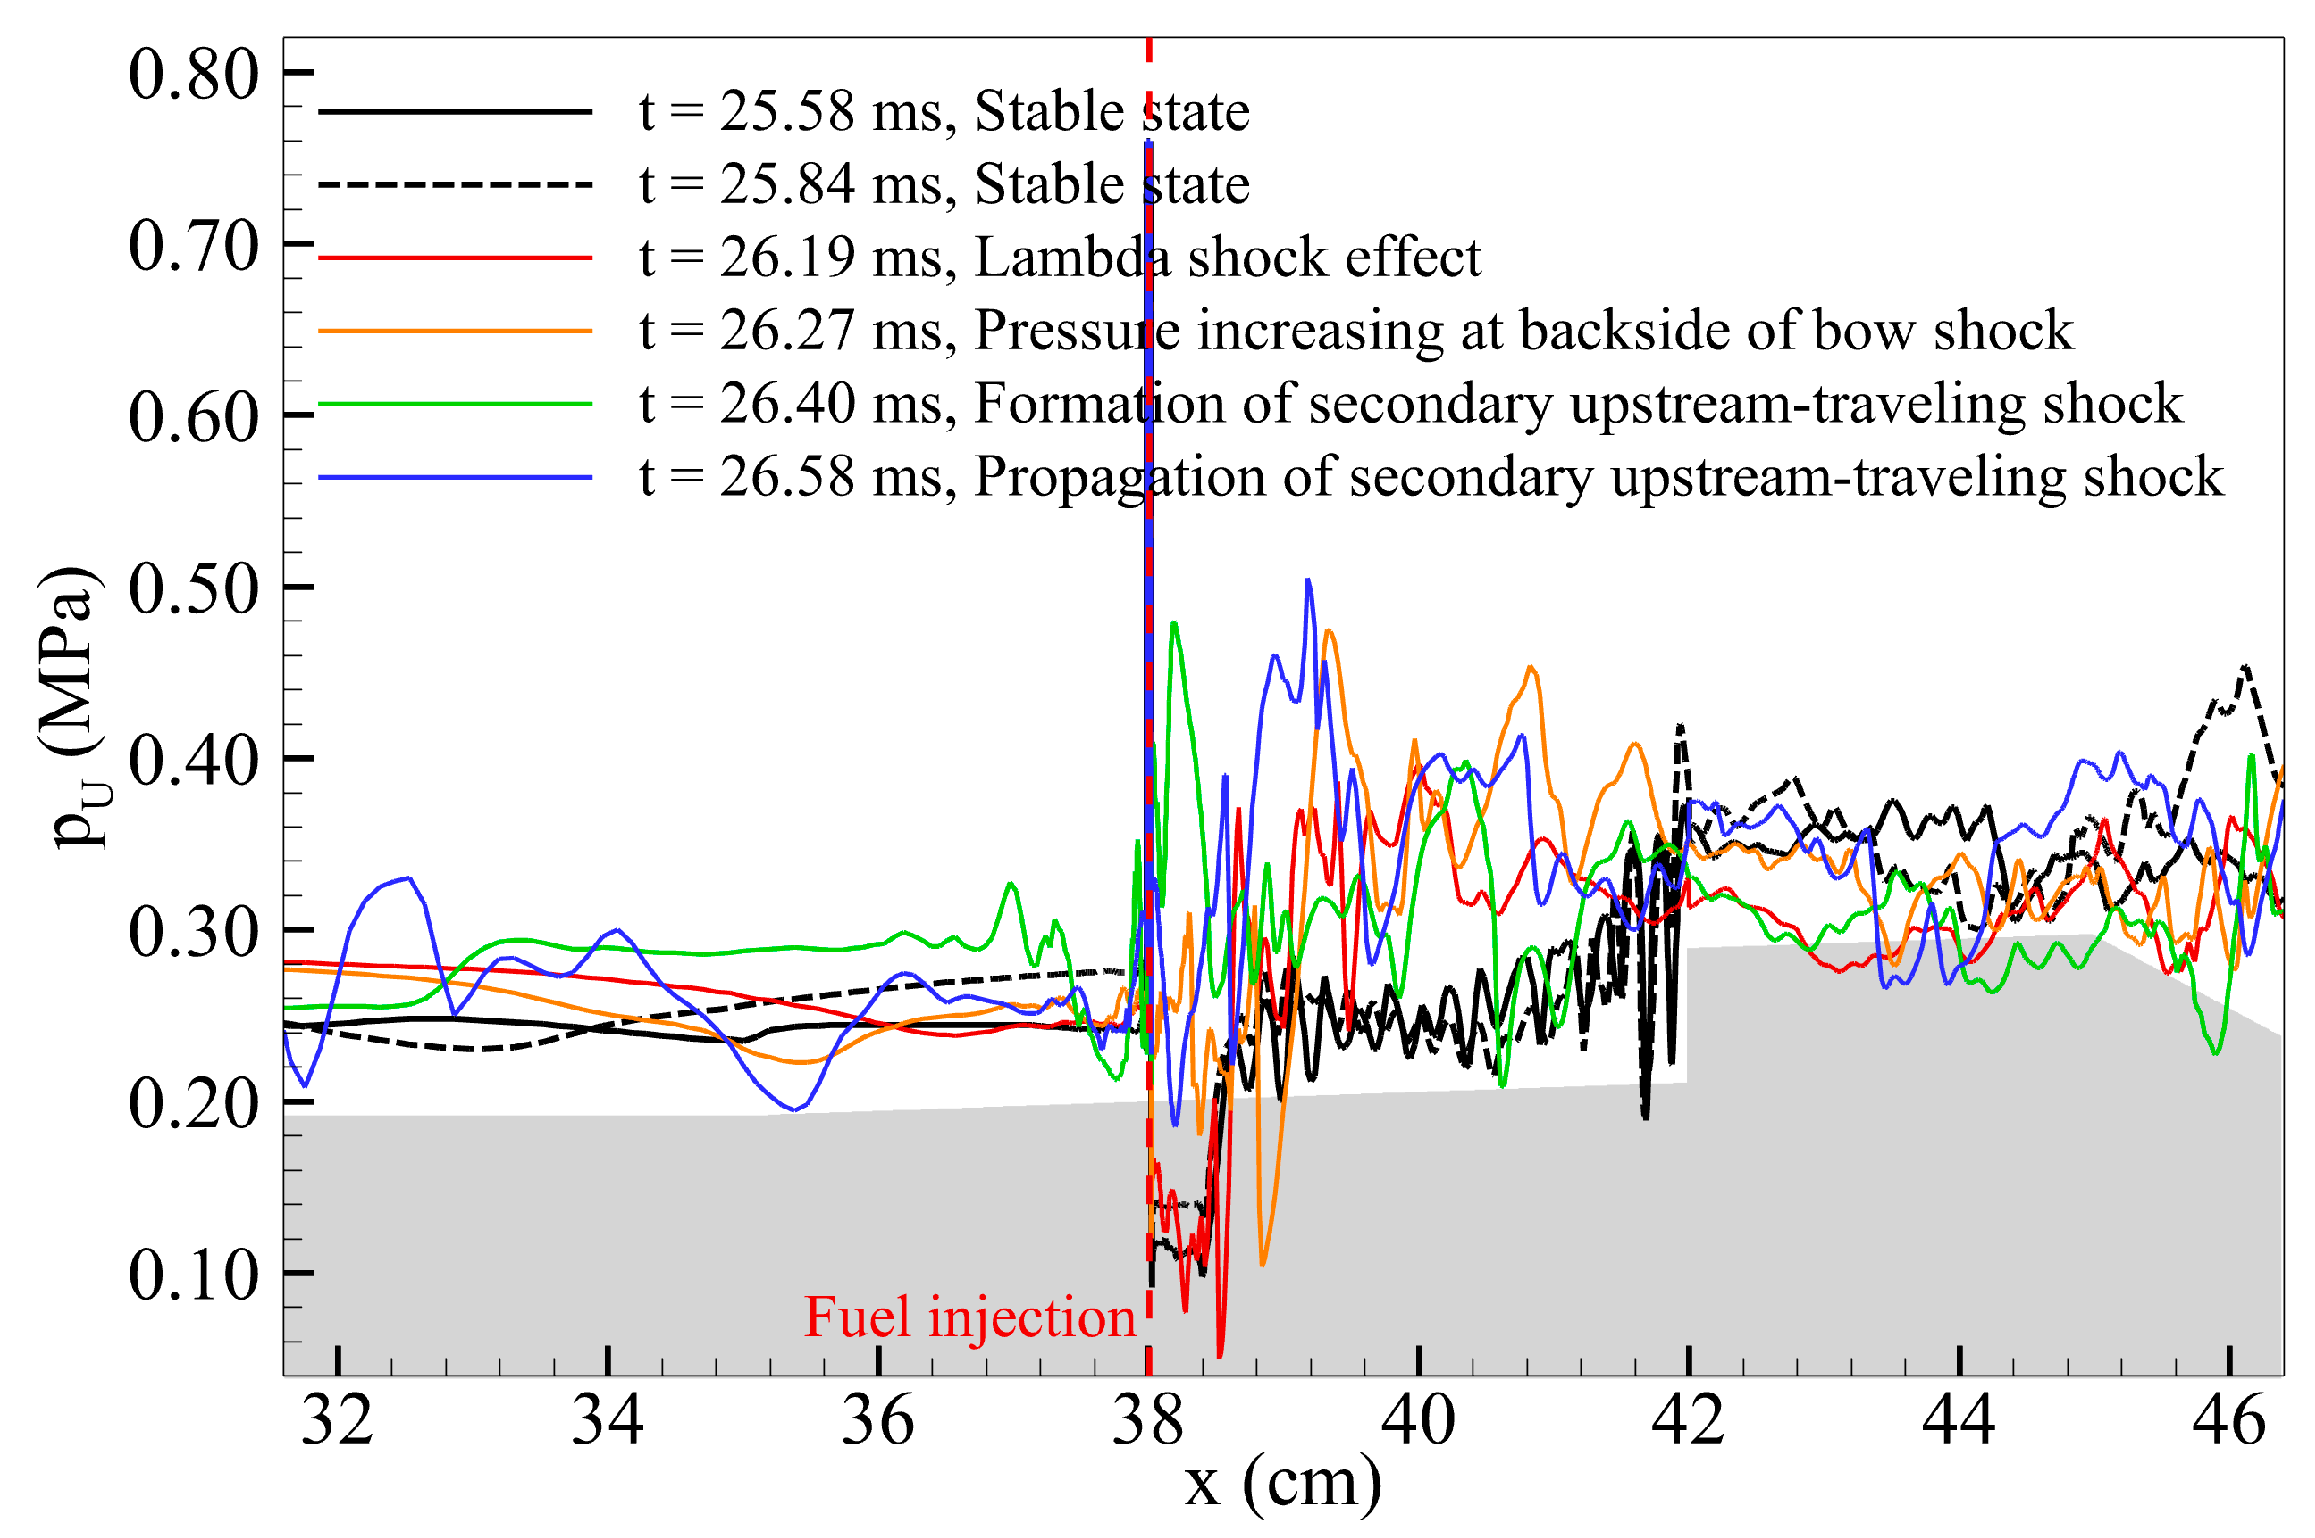
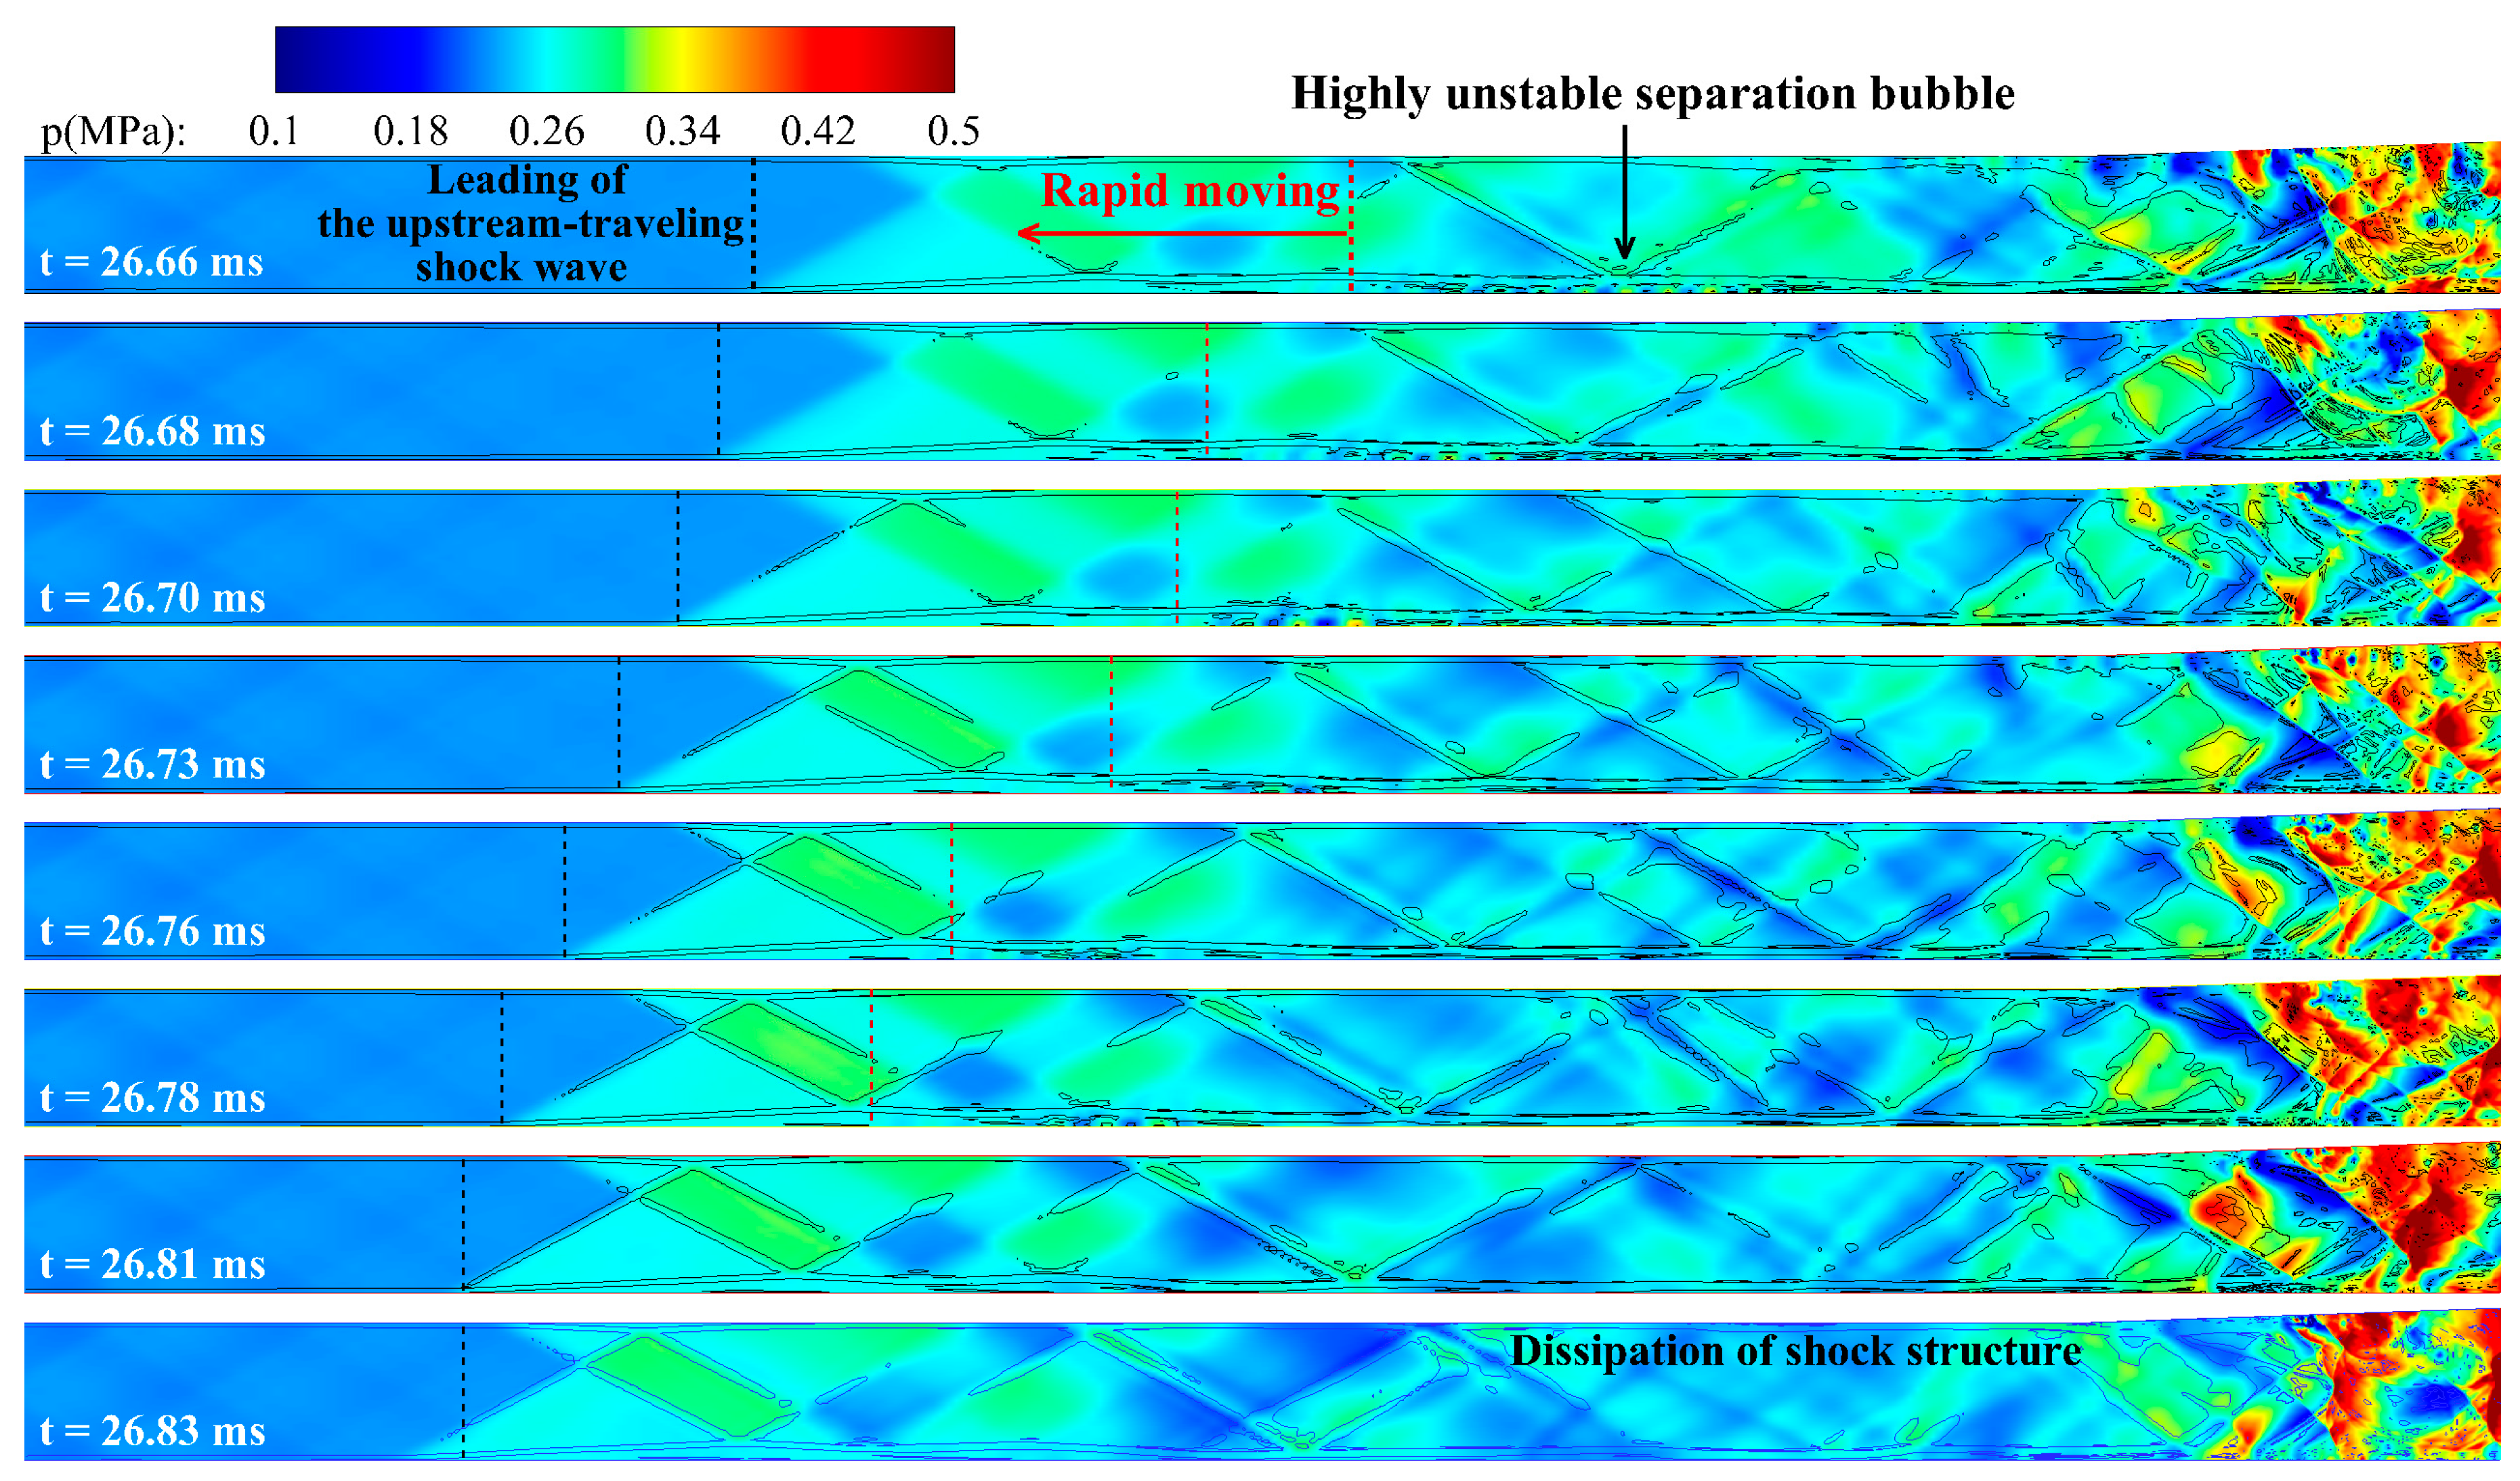
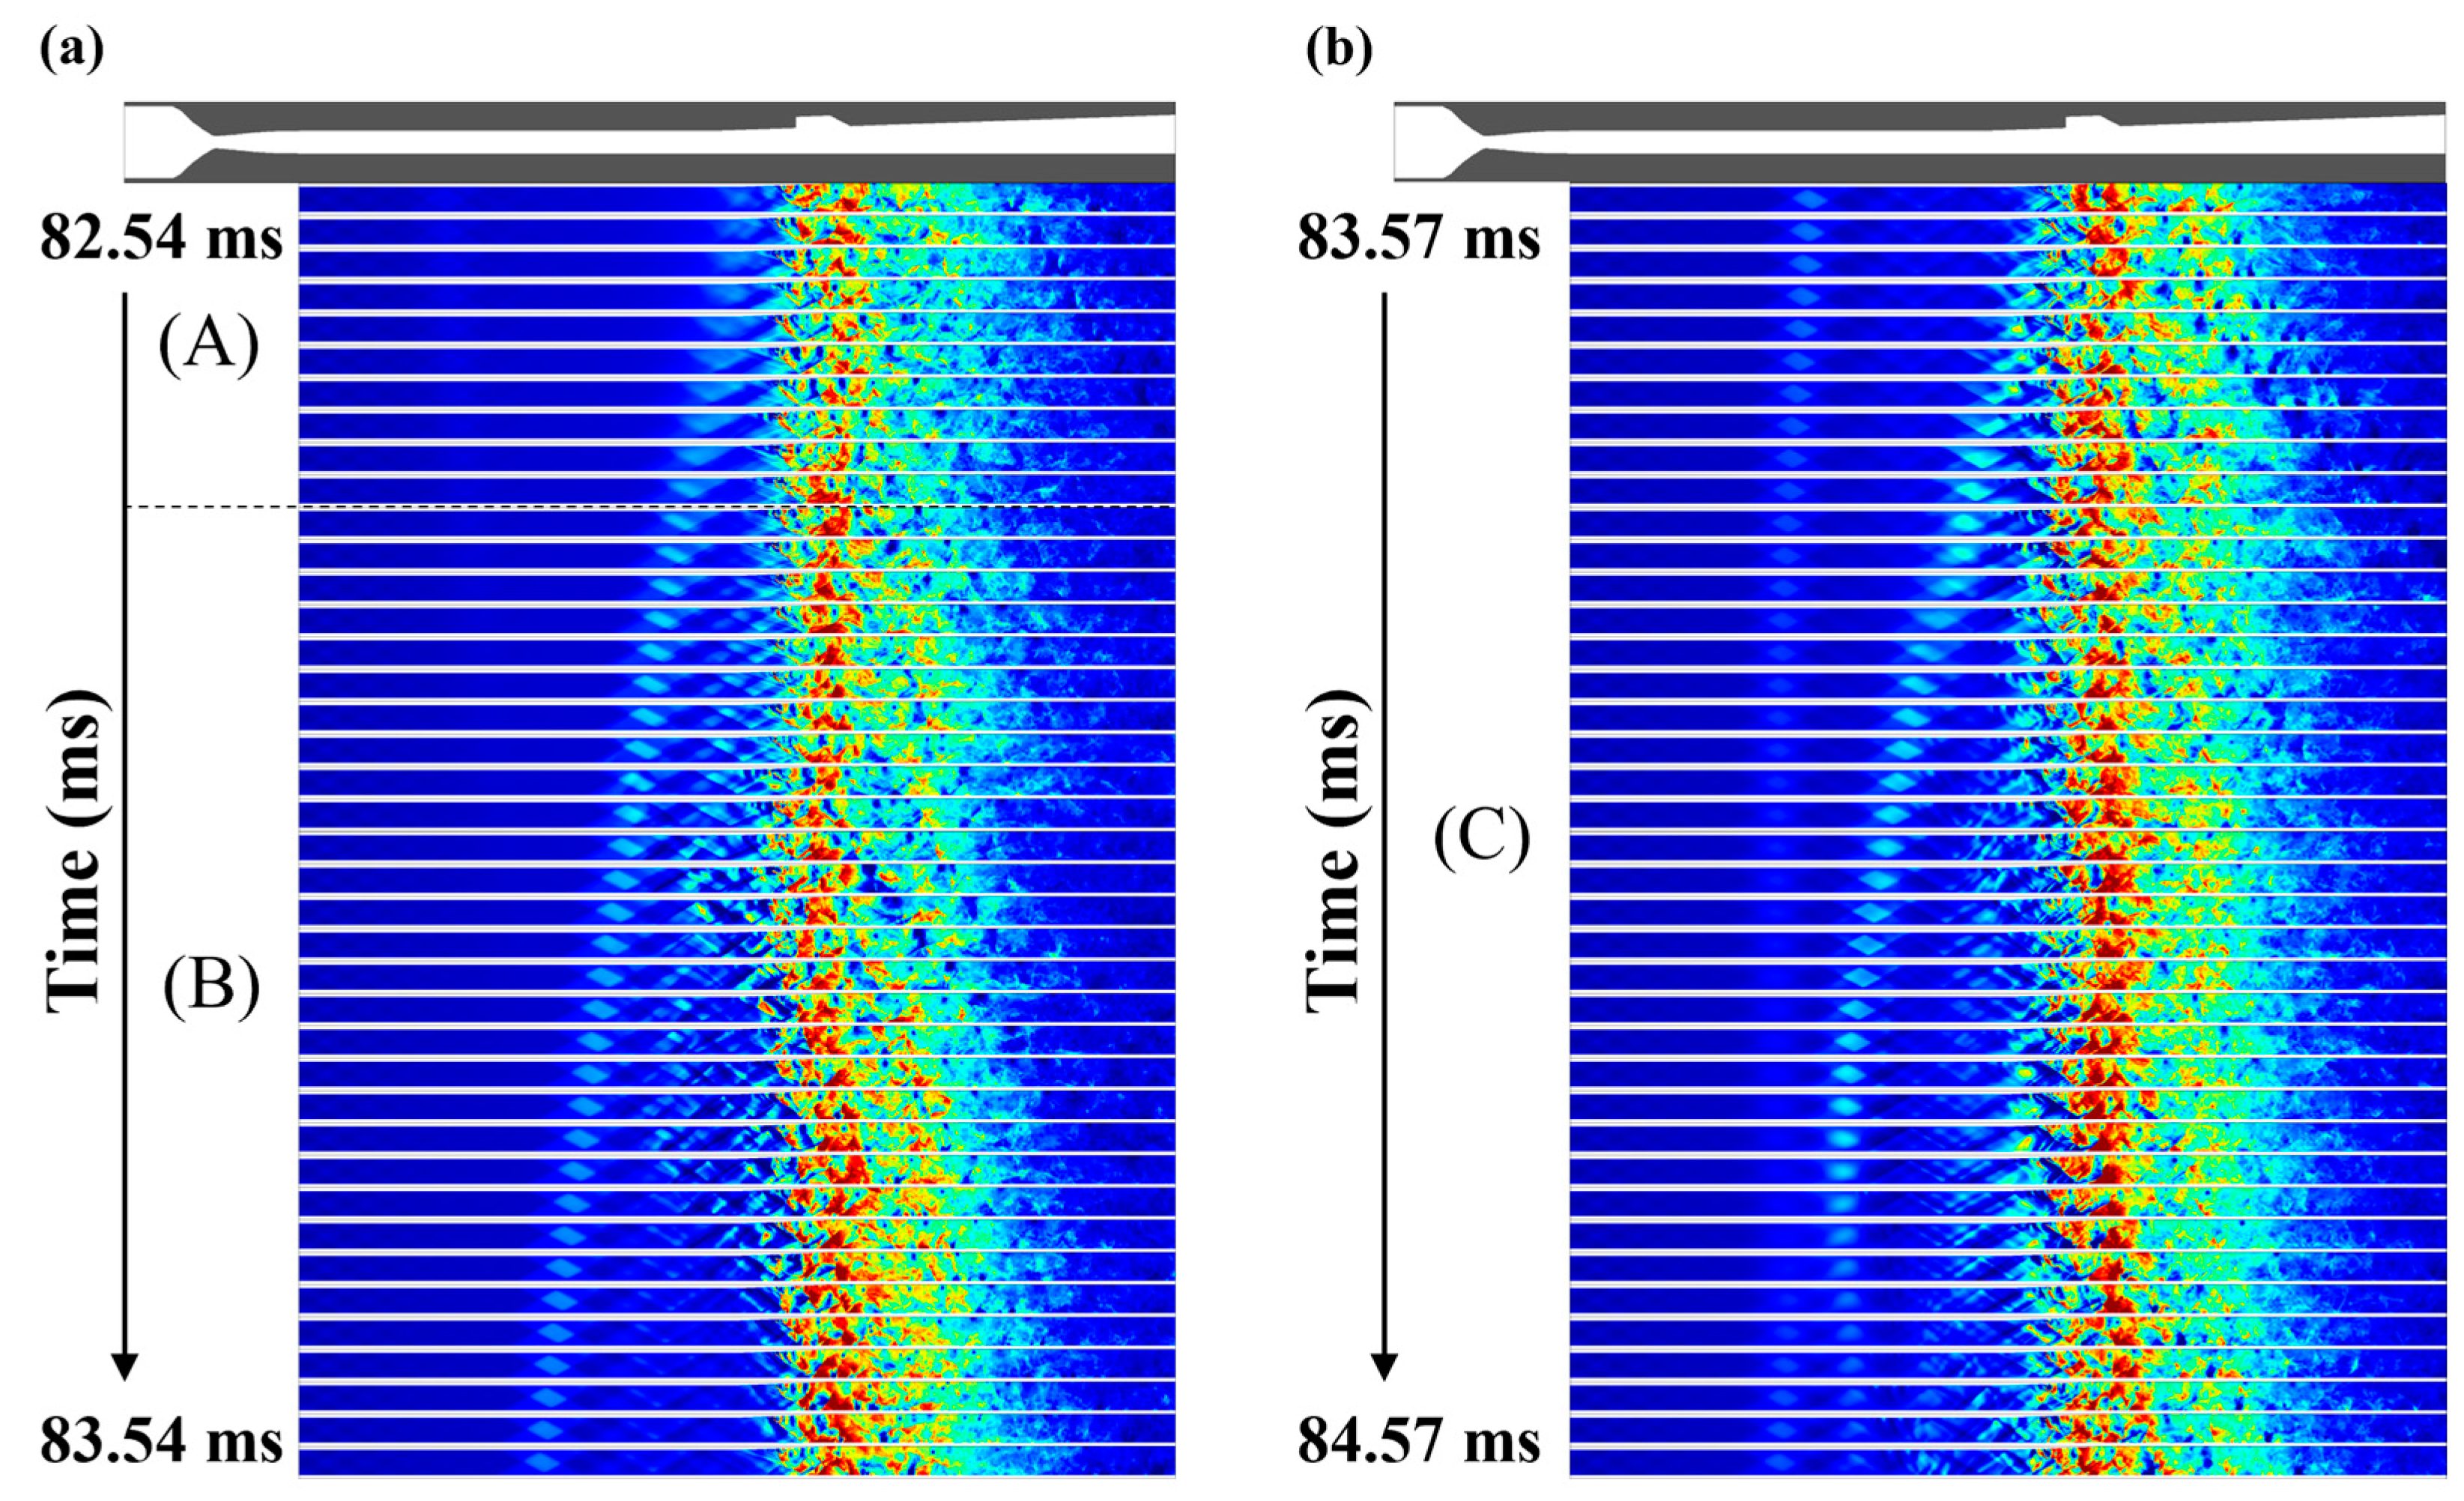
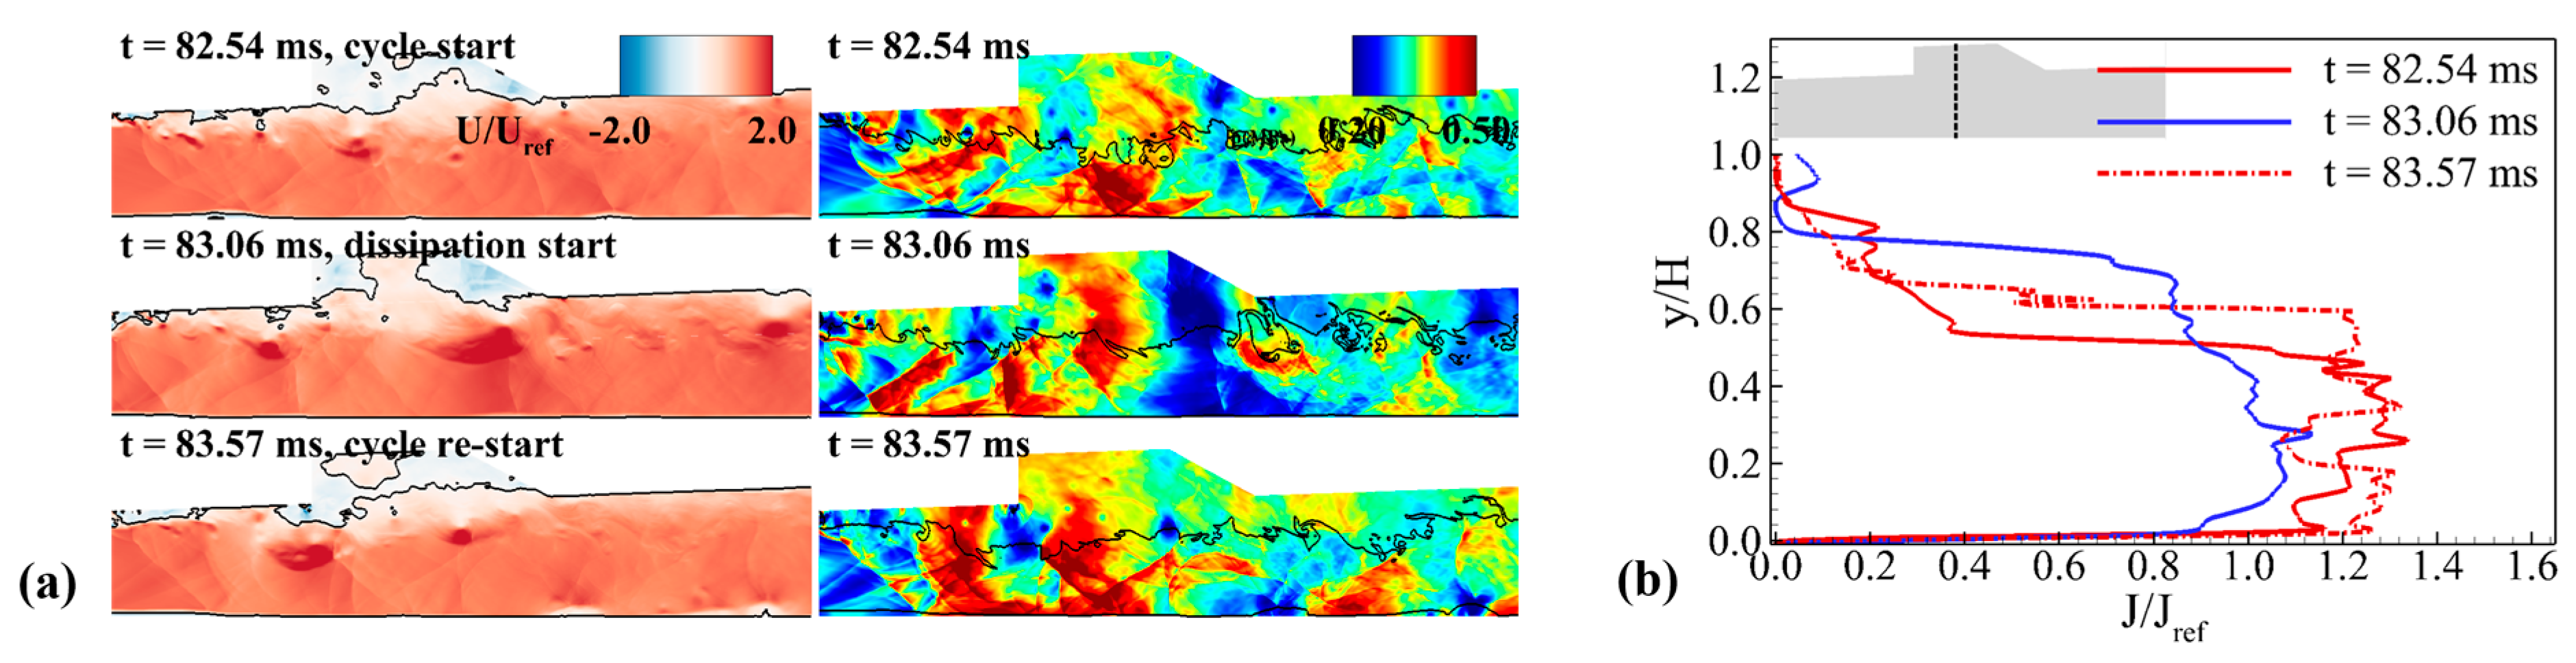
4.1. Dynamics of the Upstream-Traveling Shock Waves in the Cavity Shear-Layer Combustion Mode

As previously confirmed, the upstream-traveling shock wave that causes combustion oscillation or instability depends on the combustion mode and equivalence ratio. In particular, the propagation–dissipation–repropagation cycle within the isolator tends to be very sensitive to the combustion mode. Therefore, it is necessary to classify the dynamics of the upstream-traveling shock wave according to the combustion mode. For this purpose, an equivalence ratio of 0.45 was chosen, in which the cavity shear-layer type and the jet-wake type combustion modes were exhibited simultaneously. This section analyzed the results obtained from 22.58–28.63 ms at an equivalence ratio of 0.45, which induced strong combustion instability in the flow field of the cavity shear-layer combustion mode.
Figure 10 shows the instantaneous results of the pressure field plotted over time, consisting of a single cycle of combustion instability. All data have been divided into sections (A) through (G) according to the specific events. First, in section (A), a primary upstream-traveling shock wave consisting of a multiple oblique shock structure accompanied by a weak pressure gradient was gradually propagated to the isolator. The combustor maintained the cavity shear-layer stabilized combustion mode, and the maximum combustion pressure was homogeneously anchored at the cavity back wall, indicating the stability of the combustion field. However, compared to section (A), where a stable reactive flow field was maintained, disturbances start to occur in the fuel injection region in section (B). Specific events from sections (A) to (C) are shown in Figure 11 and Figure 12.
The shock structure caused by fuel injection formed a separation region along the lower wall of the combustor. The gradually growing separation region expanded towards the upstream. At this time, multiple reflected shock waves were formed along with shock wave boundary interaction in front of the separation region. These reflected shock waves disturb the fuel stream and stimulate the fuel–air mixing. As a result, the combustion pressure increased in all regions of the back of the oblique shock formed by the fuel injection, and the subsonic region was expanded at the same time. Due to the expansion of the subsonic region, the fuel penetration length increased. Therefore, the fuel was involved in a combustion process immediately after injection, and a rapid increase in combustion pressure occurred.
Owing to these processes, the structure of the cavity shear-layer combustion mode was no longer observed. The change in the maximum combustion pressure region shifted the separation bubble from the lower wall of the combustor to the isolator, as shown in Figure 12(iv). A secondary upstream-traveling shock wave was generated and propagated to the isolator due to the increased backpressure. This secondary upstream-traveling shock wave was accompanied by relatively higher pressure than the primary shock. The secondary shock propagated the primary upstream-traveling shock wave, anchored to no longer move upstream, as shown in section (B) of Figure 10. The re-propagation of the primary upstream-traveling shock wave was observed in sections (C) to (D).
The propagation process and bifurcation of the separation region during the formation of the secondary upstream-traveling shock wave is shown in Figure 13 and Figure 14. At 26.34 ms of an early stage of section (C), the separation bubble propagating toward the isolator is exhibited on the lower wall. However, due to the high propagation velocity, this separation continuously interacted with the oblique shocks generated by the primary upstream-traveling shock wave. Starting from 26.46 ms, the separation region became highly unstable. The pressure fluctuation distribution within the separation region is consistent with the LES/DNS results and its modal analysis tendencies for shock wave–boundary layer interaction (SBLI) instability [69,70]. The separation bubbles grew and spread rapidly upstream of the isolator until about 26.76 ms. Soon, however, the unstable bubbles were bifurcated, and the downstream bifurcated region was pushed back into the combustor. The front of the bifurcated bubble traveled upstream of the isolator with the secondary shock and propagated the primary upstream-traveling shock wave forward.
Due to the rapid expansion of the shock structure, as shown in sections (C) and (D), the downstream shock waves begin to dissipate. In addition, due to the formation and propagation of the upstream-traveling shock wave, the expansion wave or shock wave structure near the injector that appeared under the stable condition was no longer formed. Figure 15 shows the instantaneous results at the initiation of the instability cycle and the beginning of the dissipation of the upstream-traveling shock wave. The velocity contour indicated that the effective cross-sectional area increased significantly when the primary and secondary upstream-traveling shock wave was in the isolator. When the expansion fan and the injector-induced shock wave structure were destroyed, the large separation zone formed on the lower wall also collapsed. These collapses rapidly increased the effective cross-sectional area at the combustor inlet, which was accompanied by a decrease in back pressure. The ratio of the jet momentum along the height direction of the combustor to the averaged value in the separator is shown on the right side of Figure 15. The effective cross-sectional area expanded starting from approximately 26.58 ms, rapidly increasing the jet momentum ratio, which released the backpressure and exhausted the mainstream. The increase in effective cross-sectional area induced by the collapse of the shock wave structure near the injector does not return to its original state (i.e., a stable state accompanied by decreasing cross-sectional area until upstream-traveling shock wave propagating to the isolator are entirely exhausted). Therefore, the dissipation and exhaustion of the shock structure in the isolator were accelerated. The dissipation of the upstream-traveling shock wave in the isolator progressed during the (D)–(E) section. During this process, the separation bubbles on the wall formed by the shock structure in the isolator were blown off. The detached bubbles develop into a locally low Mach number and high-pressure region. Figure 16, which illustrates a certain temporal period of section (E), shows that the blown-off bubble entered the combustor region and caused instability in the flow field of the combustor. Most of the main flow remained supersonic, but the blown-off bubble significantly reduced its velocity, and this phenomenon occurred continuously throughout section (E).
The results of section (E) obtained at 27.12 ms in Figure 17 show that the local flow field perturbation induced a strong combustion instability near the fuel injection region, resulting in a maximum combustion pressure of 0.6 MPa. This dissipation progressed until most shock structures collapsed, except for the leading upstream-traveling shock wave. The leading upstream-traveling shock wave maintained a pressure level higher than the free stream pressure of 0.22 MPa until 27.29 ms. After that, the pressure level in the isolator gradually decreased due to the dissipation of the shock. Due to the combustion instability caused by the exhaustion process of the upstream-traveling shock wave, which was observed throughout section (D)–(E), the combustor could not switch to the cavity shear-layer stabilized combustion mode. After reaching section (F), the dissipation of shock waves in the insulator was completed. At the same time, the combustion mode was stabilized. Section (F) of Figure 17 shows the formation of a stabilized pressure field in the combustor. The pressure distribution of the stabilized flow field is consistent with that shown in section (A). However, a primary upstream-traveling shock wave was simultaneously formed and gradually propagated into the isolator.
The pressure history at the isolator and injector regions during combustion instability is shown in Figure 18. Probes 1 to 4 were located upstream of the isolator, probes 5 and 6 were located downstream of the isolator, and the other probes were located near the injector. The isolator inlet is at 0 cm, and probes 1 and 4 were located 5 and 15.5 cm from the isolator inlet, respectively. When the upstream-traveling shock waves do not propagate into the isolator, the pressure at probes 1–4 was equal to or up to 1.02 times the pressure level of the main flow. However, when the shockwave propagated into the isolator, the maximum pressure peak of probe 4 was approximately 1.2 times higher than the pressure level of the main flow. In particular, the pressure fluctuated greatly between 25.58 and 28.63 ms due to the rapid collapse of the upstream-traveling shock wave and the blow-off of the wall separation bubble. The pressure peak increased as it moved downstream, resulting in probe 9 showing a 3.5 times higher pressure peak than the freestream. These are significantly different from the pressure peak of the stabilized period, whose average pressure level was 1.3 times higher than the pressure level of the freestream. The pressure peaks shown in Figure 18 have a time interval of approximately 2.0 to 5.0 ms between each peak. This indicates that the upstream-traveling shock wave behaved as a cycle up to 5.0 ms in a region from the isolator to the combustor under the cavity shear-layer combustion mode. The supersonic combustor, which has inherently unsteady combustion characteristics, naturally exhibits high-frequency oscillations of several kHz. These suggest that the upstream-traveling shock waves, which behave like a few ms cycle, play a crucial role in generating the low-frequency supersonic combustion instability.

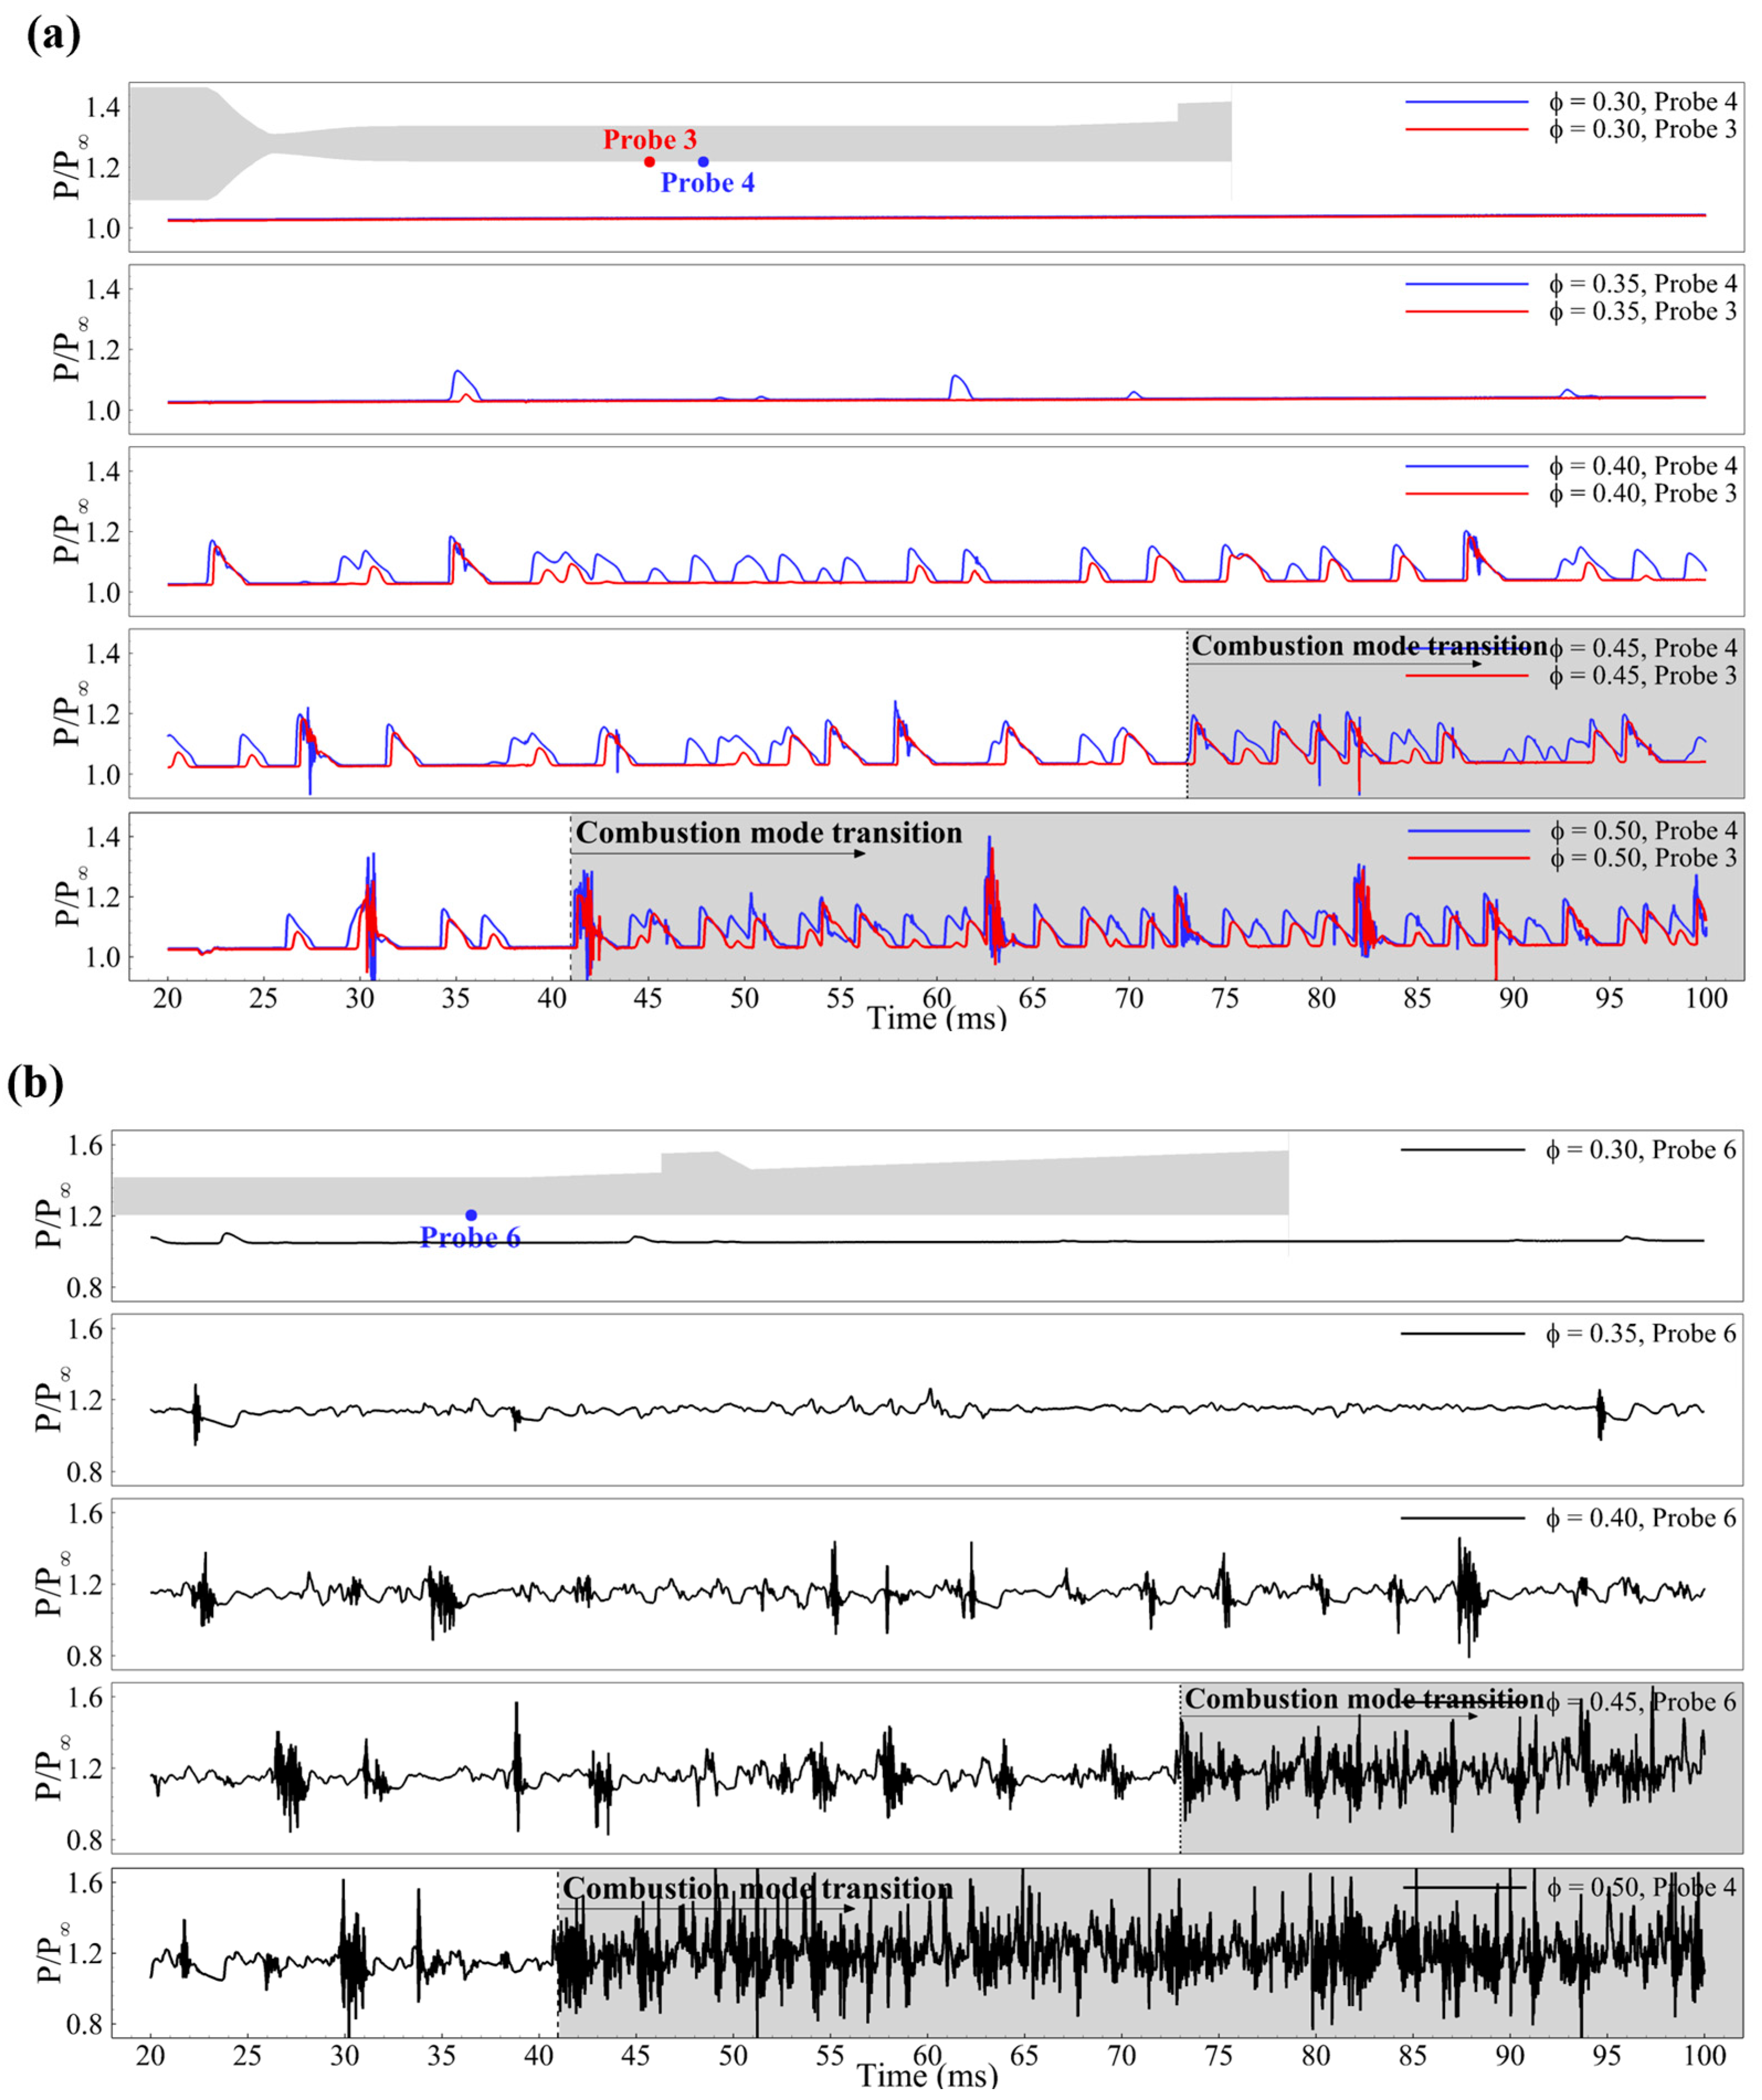
4.2. Transition in the Combustion Mode

At an equivalence ratio of 0.45, the flow field maintained a cavity shear-layer combustion mode until about 72 ms. However, with a further increase in the equivalence ratio, the combustion mode was changed into the jet-wake combustion mode. The transition in the combustion mode was accompanied by a complete change in the structure of the reactive flow field and a difference in the dynamics of the combustion instability. This section presents the investigation of the combustion mode transition process before identifying the combustion instability characteristics depending on the combustion mode.
Figure 19 shows the Mach number distribution of each combustion mode and transition state at an equivalence ratio of 0.45. At 72.0 ms, the injected fuel flowed into the cavity while maintaining the shape of a thin shear layer without mixing. After entering the cavity region, the fuel stream is subjected to a growth–mixing–burning process. Fuel injection caused continuous heat release in the combustor region, particularly at the cavity, which increased backpressure after the injector region. The increased backpressure resulted in flow separation on the top wall from the cavity side. The separation regions were extended toward the fuel injector side. With the growth of the separation region, the local subsonic combustion regime was also extended, resulting in the dominance of the subsonic combustion regime over the entire region of the injector.
As shown in Figure 20, the fuel stream, which flows with the shape of the shear layer maintaining approximately 0.22 MPa and 300 K, gradually increased the temperature and pressure fields as the expansion of the subsonic combustion regime was initiated from the cavity. When the subsonic combustion regime expanded and reached the fuel injector, the penetration length of the fuel increased significantly. The fuel was subjected to the mixing–burning process immediately after injection, resulting in an increase in the pressure and temperature, as shown in Figure 21. As a result, the subsonic combustion dominated the entire region from fuel injection to the cavity, and a complete change of the combustion mode to the jet-wake type occurred.
Therefore, at an equivalence ratio of 0.45, the combustion mode changed from the cavity shear-layer to the jet-wake combustion mode after 73 ms. With the transition in the combustion mode to the jet-wake combustion mode, the structure of the shock and flow fields by fuel injection was completely changed. Due to the large separation region, the fuel penetration length and fuel–air mixing performance are increased. The rapid combustion process resulted in a high-temperature distribution in the region between the injector and the cavity. Thus, the temperature reached around 3000 K in the entire cavity region. However, even after the combustion mode transition, the scramjet mode is maintained with no thermal choking at an equivalence ratio of 0.45. The region of anchored maximum combustion pressure shifted from the cavity close-out region to the fuel injector side.

4.3. Dynamics of the Upstream-Traveling Shock Wave in the Jet-Wake-Type Combustion Mode

The transition in the combustion mode affects the dynamics of the upstream-traveling shock wave. The x–t diagram in Figure 10 highlights that the period of the upstream-traveling shock wave decreases during combustion mode transitions. The results between 82.54 to 84.57 ms under an equivalence ratio of 0.45 were utilized for a more detailed analysis. In the cavity shear-layer combustion mode, aside from combustion instability occurrences periods, the pressure distribution and shock structure appeared relatively uniform. Conversely, the jet-wake combustion mode displayed an inhomogeneous flow field and highly unsteady dynamic motion. However, a closer inspection, as shown in the middle of section B and the beginning of section C in Figure 22, reveals distinct characteristics in the pressure distribution during combustion instability events, indicating disturbance generation in the coherent structure.
In section (A), the upstream-traveling shock wave was formed with a much higher propagation velocity than the cavity shear-layer combustion mode. These shock waves were not anchored to a specific region in the isolator but were continuously propagated upstream. A new upstream-traveling shock wave was formed in section (B), but its downstream structure began to collapse simultaneously. The collapse of the newly formed shock and the dissipation of the upstream-traveling shock wave already propagated induces a disturbance in the fuel injector side. At the end of section (B), the upstream-traveling shock wave no longer propagated upstream of the isolator, and the pressure level also decreased. However, the disturbance of the fuel injector forms an additional upstream-traveling shock wave. This shock wave is also propagated to the isolator region. This process was observed repeatedly throughout the time domain result, corresponding to the jet-wave combustion mode. In addition, considering that the (A)–(C) section was approximately 2 ms, it can be confirmed that the period of combustion instability was in the order of 2 ms. In the cavity shear-layer combustion mode, a cycle only ended when the entire structure of the upstream-traveling shock wave was exhausted from the isolator. However, in the jet-wake combustion mode, as shown in Figure 22, a new upstream-traveling shock wave is formed and propagated with the start of a new cycle before the shock waves remaining in the isolator are completely exhausted.
The shock structure formed by the fuel injection, which is a key factor in the increase/decrease in the effective cross-sectional area, could not be generated in the jet-wake combustion mode. Figure 23 shows no significant change in the effective cross-sectional area in the jet-wake combustion mode. Similarly, there is no dramatic change in the pressure level at the time of cycle initiation and when the upstream-traveling shock wave begins to dissipate. In addition, the normalized jet momentum ratio was similar throughout the time range. To summarize, combustion oscillation or instability exists, but the pressure level and the effective cross-sectional area are not extremely changed. This indicates that the upstream-traveling shock waves inside the isolator were retained within the isolator rather than being completely exhausted during each cycle.
The period of combustion instability in the jet-wake combustion mode at an equivalence ratio of 0.45 can be distinguished using the pressure history shown in Figure 24. There are no pressure peaks in probe 1, which is located upstream of the isolator. The pressure peak caused by the upstream-traveling shock wave was first observed in probe 2. In addition, the reaching point of the upstream-traveling shock wave showed approximately the same tendency as that of the cavity shear-layer combustion mode shown in Figure 18. The pressure level of the peak in probes 3 and 4 (1.3–1.4 bar) is the same as the pressure history result under the cavity shear-layer combustion mode. The peak pressure level of probes 5 and 6 is identical to that of the cavity shear-layer combustion mode. These interesting results indicate that the change in combustion mode does not affect the peak pressure level of the upstream-traveling shock wave. However, the time interval between the pressure peaks of probe 4 was approximately 2.0–2.5 ms, significantly shorter than that of the cavity shear-layer combustion mode, with a maximum interval of around 5.0 ms. These results suggest that the combustion mode transition caused significant differences in the propagation velocity and occurrence interval of the upstream-traveling shock wave into the isolator but did not affect the pressure level and reaching point.

4.4. Factors Affecting the Dynamics of the Upstream-Traveling Shock Wave

The previous section confirmed that the combustion mode dominated the upstream-traveling shock wave’s propagation speed and occurrence intervals. This result was obtained by analyzing the results obtained under different combustion modes at the same equivalence ratio. Therefore, it is necessary to investigate whether these results are similar under other equivalence ratio conditions. The pressure history at all equivalence ratios is shown in Figure 25. The noted pressure histories are extracted from the several probes located upstream and downstream of the isolator. The transition to the jet-wake combustion mode was observed in the results obtained at equivalence ratios of 0.45 and 0.50, and this transition occurred at approximately 73 and 41 ms, respectively.
First, in probes 3 and 4, a stable state was observed during the entire time range at an equivalence ratio of 0.30. Several pressure peaks were observed at an equivalence ratio of 0.35 but presented as stable under most of the time range. This indicates that at equivalence ratios of 0.30 and 0.35, no upstream-traveling shock wave was formed and propagated to the isolator. At an equivalence ratio of 0.40, a pressure peak up to 1.2 times higher than the mainstream was observed, while at an equivalence ratio of 0.50, a pressure peak up to 1.4 times higher was measured. The interesting point is that there was no change in the pressure level of the peak point observed at equivalence ratios of 0.45 and 0.50 after the combustion mode transition. These results indicate that the pressure level accompanied by the upstream-traveling shock wave is controlled by the equivalence ratio rather than the combustion mode.
However, the occurrence interval of the upstream-traveling shock wave was not related to the equivalence ratio but to the combustion mode, which is consistent with the observation presented in the previous sections. With the transition in the combustion mode at an equivalence ratio of 0.45, the interval between the pressure peaks decreased from approximately 2.0–5.0 ms to 2.0–2.5 ms. At an equivalence ratio of 0.50, the interval decreased to under 1 ms. These results indicate that the combustion mode dominated the occurrence interval of the upstream-traveling shock waves.

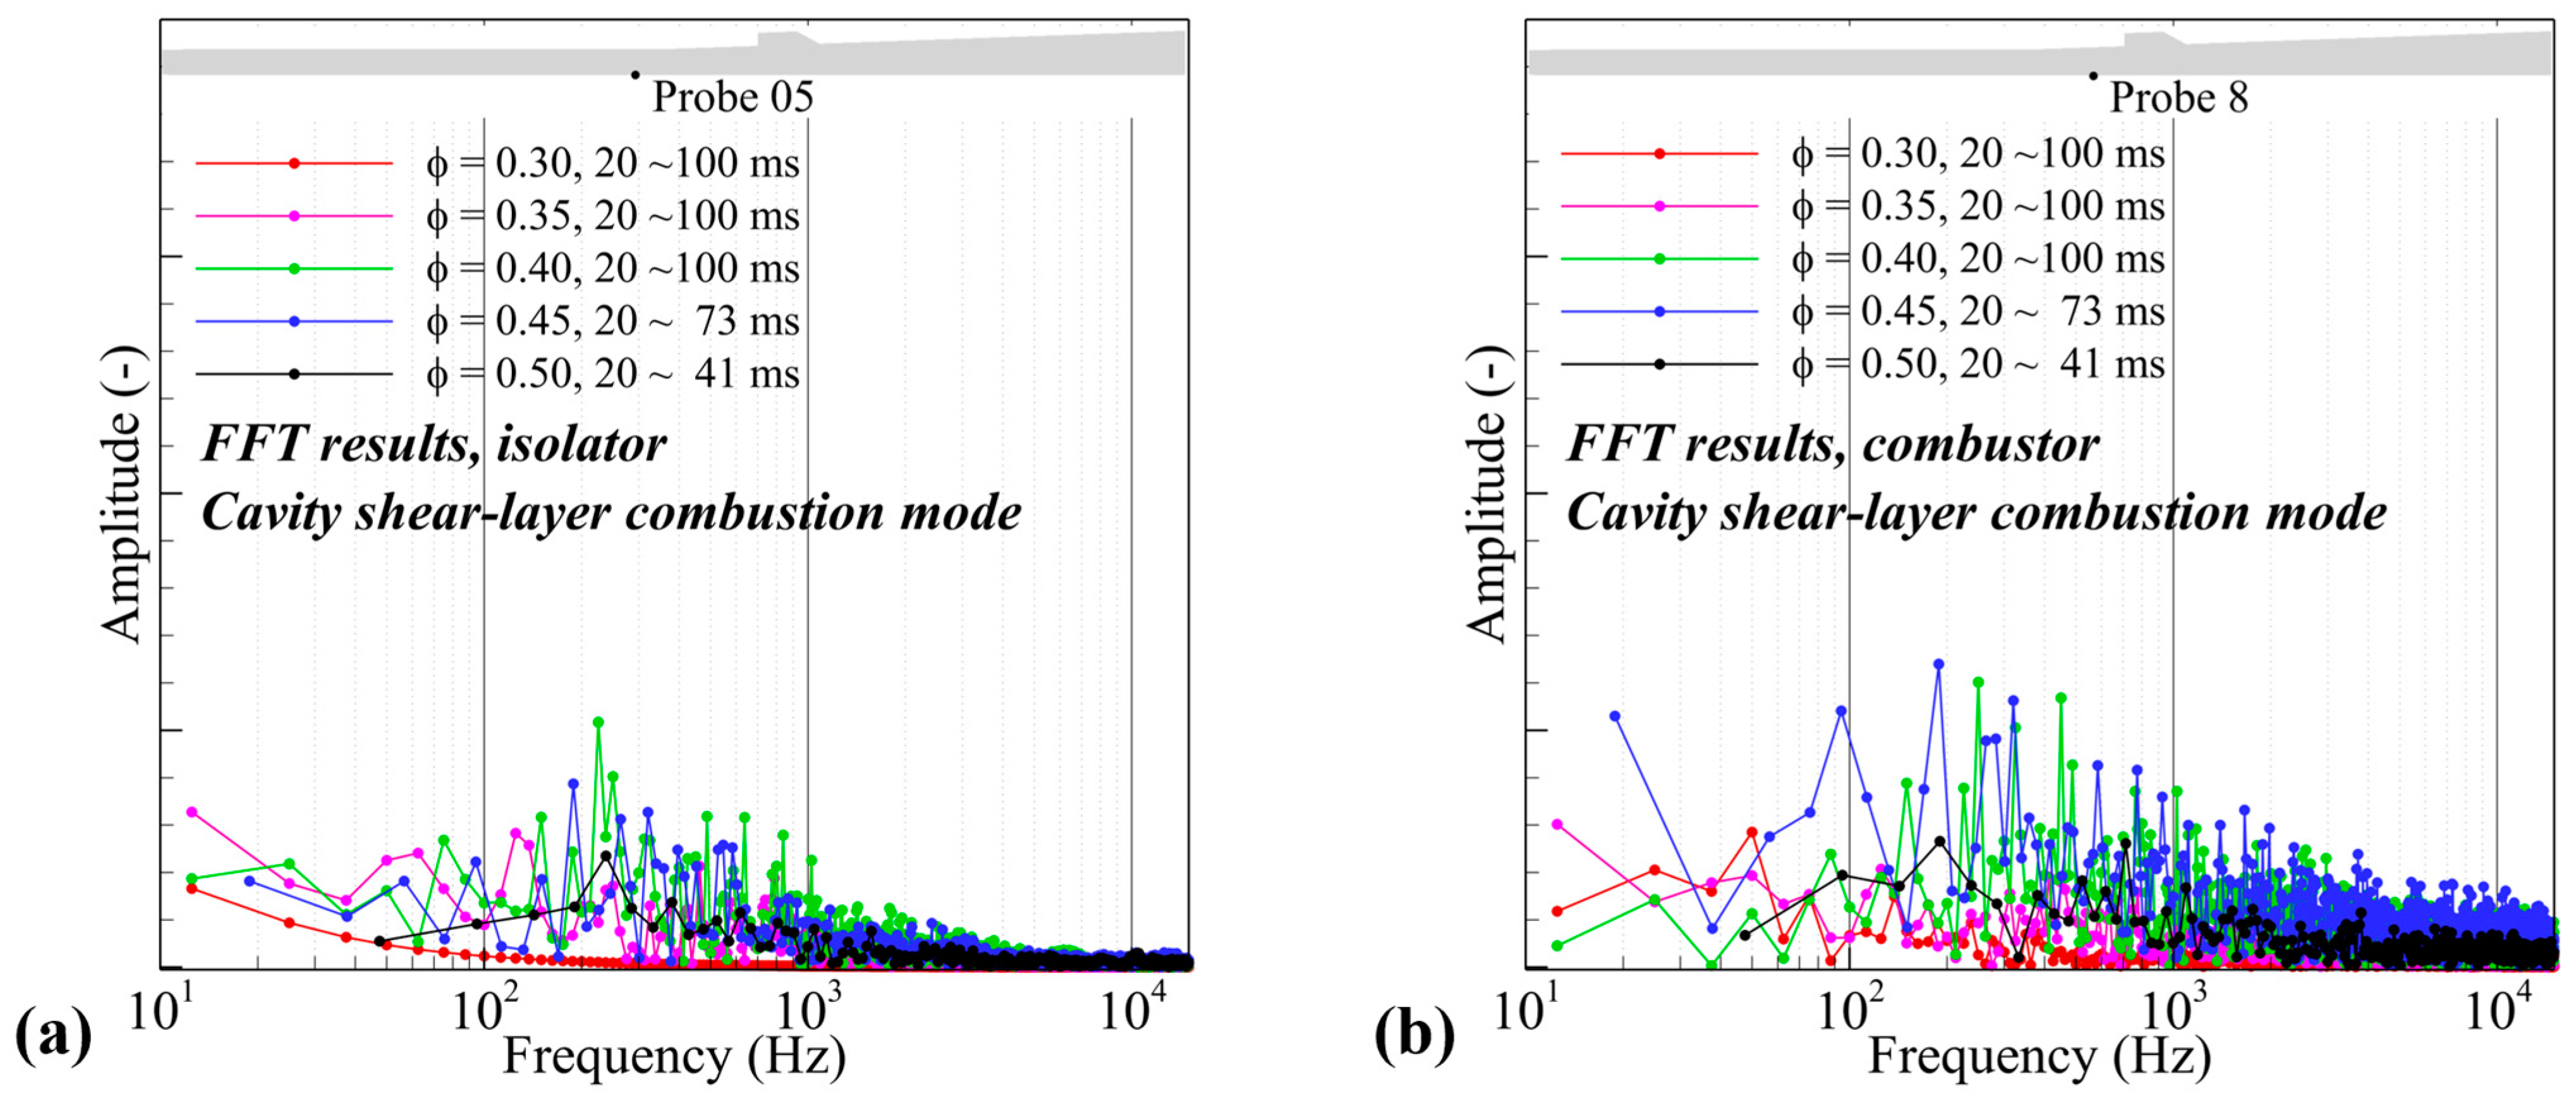
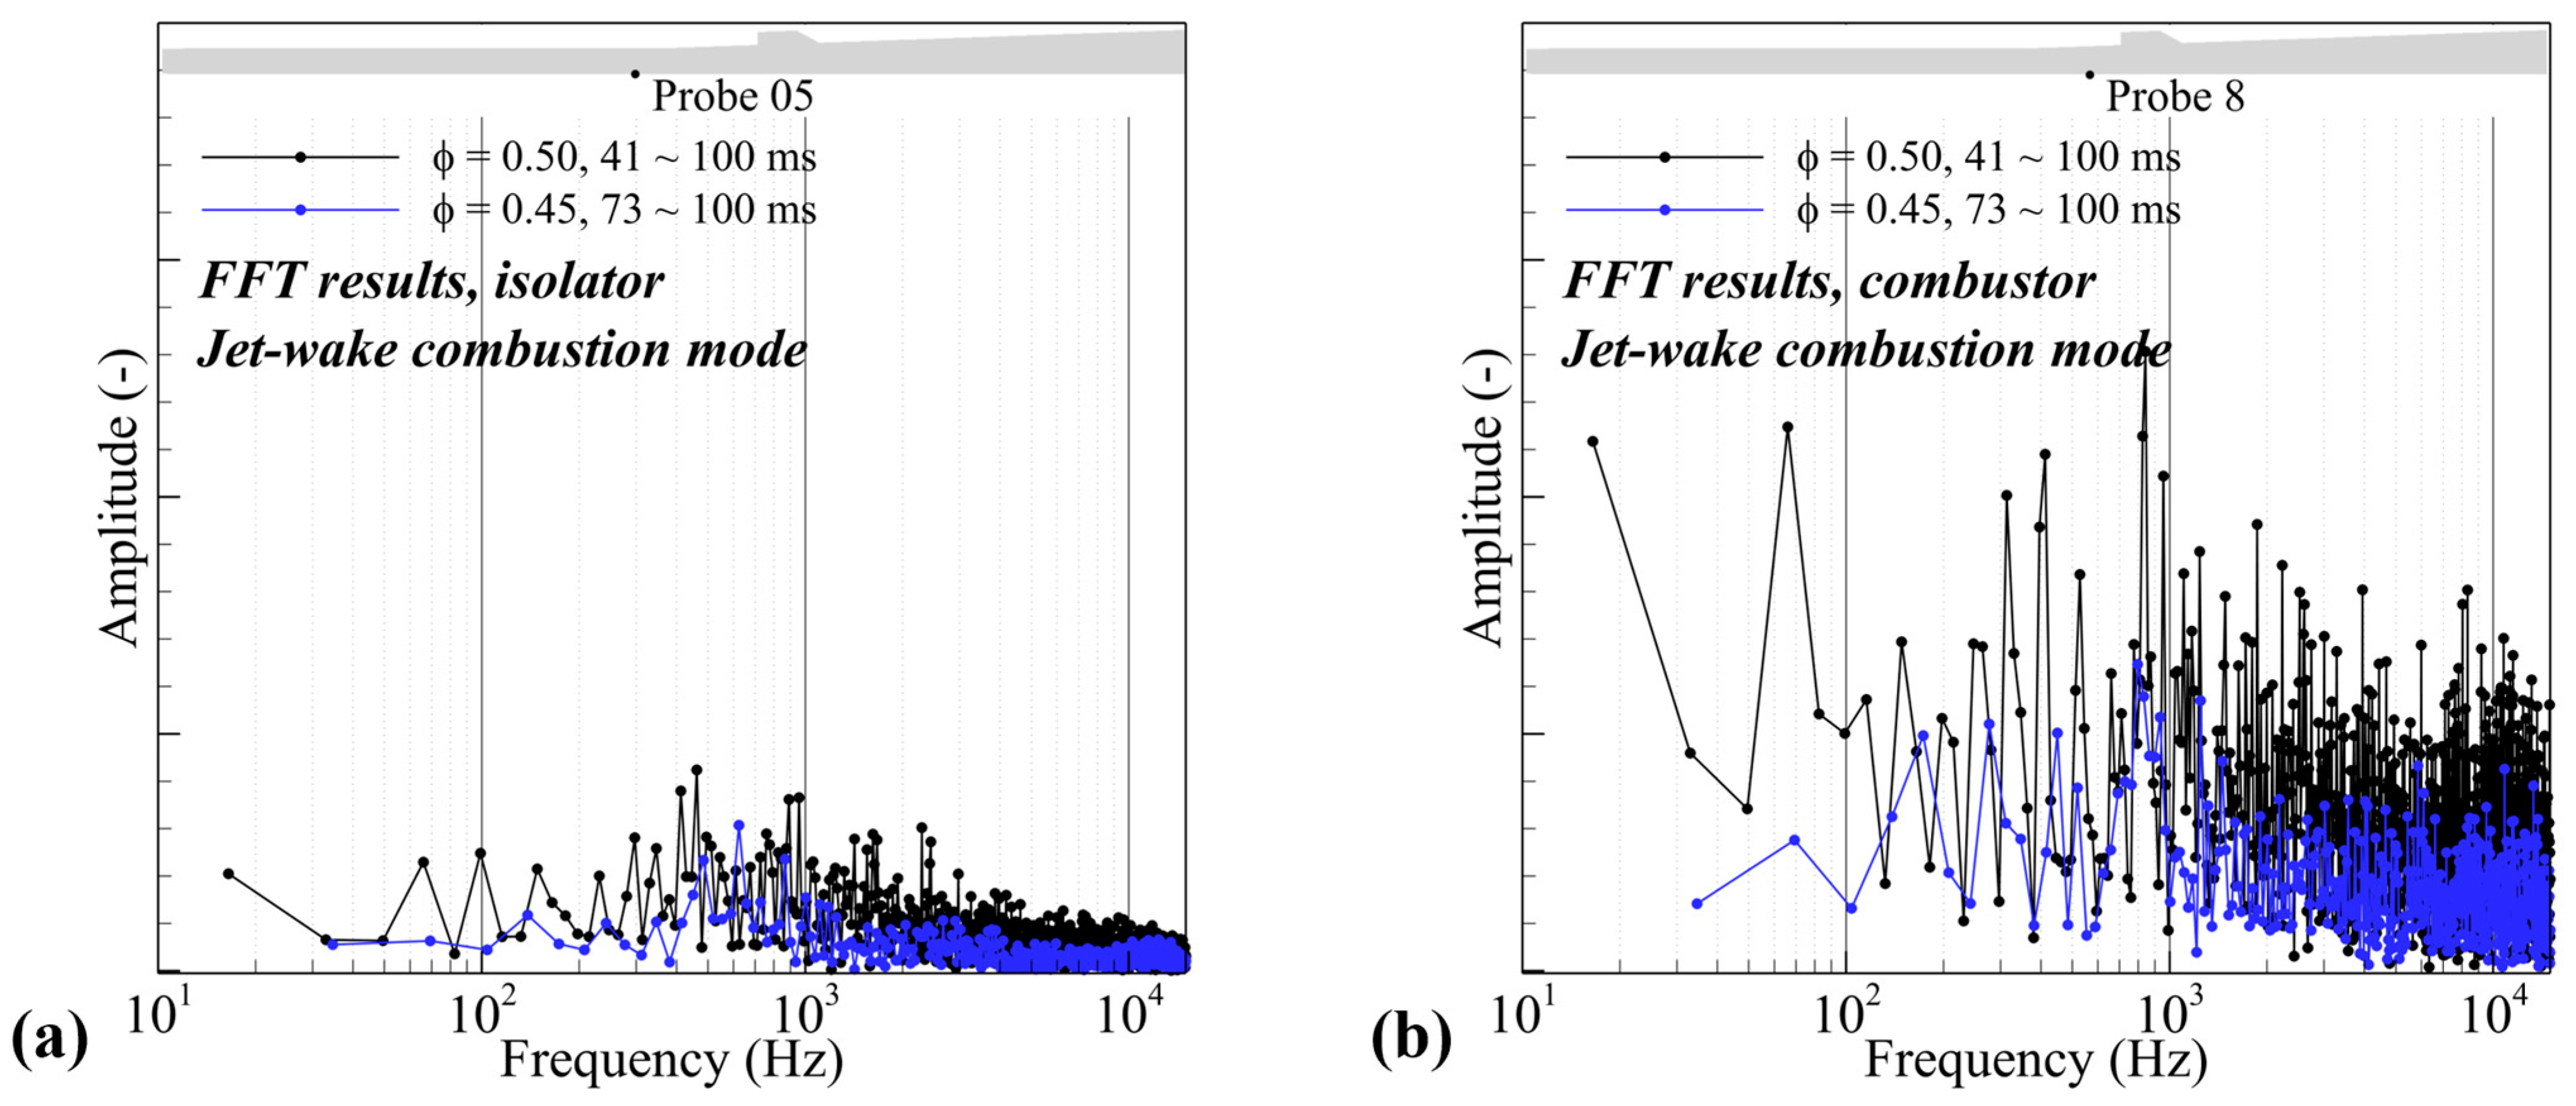
4.5. Characteristics of the Combustion Instability

In our previous study [26], frequency analysis was performed using the pressure data of the entire time domain. Therefore, the effect on the combustion mode transition could not be characterized. The frequency analysis results are illustrated in Figure 26 and Figure 27. The analysis utilized two distinct pressure histories: the results under the cavity shear-layer combustion mode and the results under the jet-wake combustion mode. As explained in previous sections, the transition in the combustion mode occurred at equivalence ratios of 0.45 and 0.50. Therefore, the FFT results of the cavity shear-layer combustion mode and the jet-wake combustion mode are depicted in Figure 26 and Figure 27, respectively. The top three instability frequencies for each combustion mode and each extraction point under the cases where the upstream-traveling shock wave and combustion instability were generated (i.e., ϕ 0.40, 0.45, 0.50) are presented in Table 2.
In the results of the cavity shear-layer combustion mode (Figure 26), first, at an equivalence ratio of 0.30, the instability frequency was not detected. With an increase in the equivalence ratio to 0.35, several frequencies were observed but were difficult to characterize. However, at equivalence ratios of 0.40 to 0.50, major instability frequencies were clearly detected. The frequencies of the major instability of all these three cases were observed in the 200~500 Hz range in the isolator. This instability frequency, with an approximately 200~500 Hz range, was also detected in the combustor region. At an equivalence ratio of 0.45, 0,50 of Figure 27 and Table 2, which shows the frequency analysis of the jet-wake combustion mode, the major peak instability frequencies of approximately 400~900 Hz and 800~900 Hz were observed in the isolator and the combustor, respectively.
We can find two interesting points in the characteristics of the instability frequency through these results. First, the dynamics of the combustion instability under the cavity shear-layer combustion mode are highly governed by the upstream-traveling shock waves. However, under the jet-wake combustion mode, this coupling is weakened. In the cavity shear-layer combustion mode, an identical instability frequency in both the isolator and the combustor is detected. Considering the characteristics of the cavity shear-layer combustion mode, where the mixing–combustion process in the fuel/air shear layer dominates the entire combustion dynamics of the combustor, the dynamics of the upstream-traveling shock wave within the isolator are expected to have a significant influence on the shear layer, thus resulting in the combustion instability of the combustor being governed by the upstream-traveling shock wave. However, in the jet-wake combustion mode, small-scale vortex and winkling near the injector side and enlarging the subsonic region affect the combustion characteristics. Due to such complex dynamics, even though there is a similarity, the instability frequencies of the combustor do not perfectly coincide with those in the isolator. Therefore, it can be determined that the influence of the upstream-traveling shock wave on the low-frequency combustion instability of the jet-wake combustion mode is weaker than that of the cavity shear-layer combustion mode.
Secondly, it can be noted that low-frequency combustion instability frequencies are determined by not only the equivalence ratio but also the combustion mode. This is evident from Table 2, which demonstrates how low-frequency characteristics change due to the combustion mode at the same equivalence ratio condition. Even at the same equivalence ratio, transition of the combustion mode resulted in shifts in the instability frequencies. For instance, at an equivalence ratio of 0.45, the instability frequencies changed from 187–321 Hz to 800–933 Hz, and at an equivalence ratio of 0.50, they transitioned from 192–522 Hz to 418–843 Hz. Typically, the combustion mode appears as the cavity shear-layer combustion mode under the low global equivalence ratio. The cavity shear-layer combustion mode can also be made up of relatively low-enthalpy incoming air conditions. And, as the equivalence ratio increases or the enthalpy of the inflow condition increases, it shows the jet-wake combustion mode. In a few experimental and numerical studies, it has been mentioned that the instability frequencies occurring in the low-frequency range in a scramjet combustor, which has a similar configuration to the present combustor, tend to transition depending on the operating condition or combustion mode. The characteristics of this instability frequency transition, so-called “instability frequency shifting,” vary depending on factors such as the incoming air’s enthalpy level, the fuel’s chemical composition, injector schemes, etc. Nevertheless, it has been consistently reported that when there was a low global equivalence ratio, the combustion instability was generated in a relatively low-frequency range. [5,9,10,71]
However, the interesting point is that the “instability frequency shifting” does not occur by increasing or decreasing the equivalence ratio, as depicted in Figure 26 and Figure 27 and Table 2. Also, Table 3, which arranges the information on the incoming air, fuel injection, and instability frequencies of several experimental studies, provides supporting evidence for this phenomenon. The experimental studies in Table 3 have similar configurations to the present combustor.
This instability frequency shifting according to the combustion mode of the present study is a consistent trend with other experimental studies noted in Table 3. Based on these experimental findings and the present results that the instability frequency of the isolator and the combustor are identical, and instability frequency shifting occurs under the same equivalence ratio, this reveals that the “instability frequency shifting” is governed by the combustion mode rather than the equivalence ratio. Also, the low-frequency combustion instability in a scramjet combustor is highly coupled with the upstream-traveling shock wave. Furthermore, considering that the formation/dissipation of the upstream-traveling shock wave is caused by being coupled with hydro-combustion dynamic behavior, it can be suggested that the combustion instability in scramjet engines is induced by hydrodynamics issues on a macroscopic scale of the entire combustor.

5. Conclusions

This study performed a high-resolution numerical simulation on a laboratory-scale gaseous hydrogen-fueled direct-connect scramjet combustor to investigate the low-frequency combustion instability in a scramjet combustor reported in several experimental studies. An enormous amount of sampling time over a repetitive cycle was accumulated in order to capture the dynamics of the low-frequency combustion instability and its characteristics. Field data of up to 100 ms were obtained under five global equivalence ratio conditions. In particular, the dynamics of the upstream-traveling shock wave, which occurred with periods of several ms, were successfully observed. The characteristics of the combustion instability depending on the equivalence ratio and combustion mode were analyzed using comprehensive numerical results, and the following conclusions were observed:
  • Two different types of “upstream-traveling shock waves” were sequentially formed and interacted under the cavity shear-layer combustion mode, resulting in the generation of combustion instability. The period of each cycle of combustion instability is approximately 2.0–5.0 ms. In the jet-wake combustion mode, the “upstream-traveling shock wave” with a strong pressure gradient and relatively higher propagation speed with a period of approximately 2.0–2.5 ms was formed. Each shock wave has not behaved sequentially but overlaps.
  • Combustion mode determined the propagation speed and occurrence interval of the “upstream-traveling shock wave,” and the equivalence ratio governed the location at which the shock reached the isolator and the accompanying pressure level.
  • The instability frequency is identical at the isolator and the combustor. This finding confirms that the “upstream-traveling shock wave” is a primary factor generating the combustion instability in a scramjet combustor. The formation/dissipation of the “upstream-traveling shock wave” is caused by the coupled fluid-combustion dynamics of the isolator and the combustor. This indicates that the combustion instability of the scramjet engine is a problem generated at a macroscopic scale throughout the entire combustor.
  • The range of the instability frequency was increased, even under the same equivalence ratio condition, once the combustion mode had changed from the cavity shear-layer mode to the jet-wake mode. These results reveal that the “instability frequency shifting” of the scramjet combustor is governed by the combustion mode rather than the increase/decrease in the equivalence ratio.
The numerical results revealed the factors that characterize the macroscopic dynamics of the upstream-traveling shockwave that caused combustion instability and its characteristics. The combustion mode transition in this study was based on the passage of time under the same fuel scheme and global equivalence conditions. Therefore, to characterize more clearly the upstream-traveling shock waves depending on the differences between the combustion mode and the global equivalence ratio, it is necessary to identify the characteristics of the combustion mode transition generated by various fueling schemes.

Author Contributions

Conceptualization, S.-M.J. and J.-Y.C.; methodology, S.-M.J. and J.-Y.C.; software, S.-M.J. and J.-Y.C.; validation, S.-M.J.; formal analysis, S.-M.J.; investigation, S.-M.J.; initial data resources, H.-S.H. and B.-K.S.; data curation, S.-M.J.; writing—original draft preparation, S.-M.J. and B.-K.S.; writing—review and editing, S.-M.J., H.-S.H., W.K. and J.-Y.C.; supervision, W.K. and J.-Y.C.; project administration, W.K. and J.-Y.C.; funding acquisition, J.-Y.C. All authors have read and agreed to the published version of the manuscript.

Funding

Present work was supported by the Basic Research Program (No. 08-201-501-014) of the Agency for Defense Development (ADD) funded by the Defense Acquisition Program Administration (DAPA) of the Republic of Korea Government. This work was also supported by the planning and advancement grant (KRIT-CT-22-058-00) of the Korea Research Institute for defense Technology (KRIT) funded by the Defense Acquisition Program Administration (DAPA) of the Republic of Korea Government.

Data Availability Statement

Data supporting the findings of this study are available from the corresponding author upon reasonable request.

Conflicts of Interest

The authors declare no conflict of interest.

Nomenclature

AUSMDVAdvection Upstream Splitting Method with flux Difference splitting and flux Vector splitting
CRST Circular-to-Rectangular Shape Transition
DCSCDirect-Connect Scramjet Combustor
DESDetached Eddy Simulation
DDESDelayed Detached Eddy Simulation
DMD Dynamic Mode Decomposition
EDCEddy Dissipation Concept
F/PVAFlamelet Progress Variable Approach
FTT Flow Through Time
GISGrid Induced Separation
HDCRHIFiRE Direct Connect Rig
LES Large Eddy Simulation
LU-SGSLower-Upper Symmetric Gauss-Seidel
MOCMethod Of Characteristics
MUSCLMonotonic Upstream-Centered Scheme for Conservation Laws
oMLPoptimized Multi-Dimensional Limiting Process
PaSRPartially Stirred Reactor
PNU-DCSCPusan National University’s Direct-Connect Scramjet Combustor
PODProper Orthogonal Decomposition
PNURPL Pusan National University Rocket Propulsion Labortory
PPM Piecewise Parabolic Method
SODStanding Oblique Detonation
UV’a SCFUniversity of Virginia’s scramjet combustion facility
RCM-1Rocket Combustor Model-1
VAH Vitiation Air Heater
WENOWeighted Essentially Non-Oscillatory

References

  1. Ma, F.; Li, J.; Yang, V.; Lin, K.-C.; Jackson, T. Thermoacoustic Flow Instability in a Scramjet Combustor. In Proceedings of the 41st AIAA/ASME/SAE/ASEE Joint Propulsion Conference & Exhibit, Tucson, AZ, USA, 10–13 July 2005. [Google Scholar]
  2. Li, J.; Ma, F.; Yang, V.; Lin, K.-C.; Jackson, T. A Comprehensive Study of Combustion Oscillations in a Hydrocarbon-fueled Scramjet Engine. In Proceedings of the 45th AIAA Aerospace Sciences Meeting and Exhibit, Reno, NV, USA, 8–11 January 2007. [Google Scholar]
  3. Choi, J.-Y.; Ma, F.; Yang, V. Dynamic Combustion Characteristics in Scramjet Combustors with Transverse Fuel Injection. In Proceedings of the 41st AIAA/ASME/SAE/ASEE Joint Propulsion Conference & Exhibit, Tucson, AZ, USA, 10–13 July 2005. [Google Scholar]
  4. Choi, J.-Y.; Ma, F.; Yang, V. Combustion Oscillations in a Scramjet Engine Combustor with Transverse Fuel Injection. Proc. Combust. Inst. 2005, 30, 2851–2858. [Google Scholar] [CrossRef]
  5. Lin, K.-C.; Jackson, K.; Behdadnia, R.; Jackson, T.A.; Ma, F.; Yang, V. Acoustic Characterization of an Ethylene-fueled Scramjet Combustor with a Cavity Flameholder. J. Propuls. Power 2010, 26, 1161–1170. [Google Scholar] [CrossRef]
  6. Micka, D.J.; Driscoll, J.F. Combustion Characteristics of a Dual-mode Scramjet Combustor with Cavity Flameholder. Proc. Combust. Inst. 2009, 32, 2397–2404. [Google Scholar] [CrossRef]
  7. Micka, D.J.; Knaus, D.A.; Temme, J.; Driscoll, J.F. Passive Optical Combustion Sensors for Scramjet Engine Control. In Proceedings of the 51st AIAA/SAE/ASEE Joint Propulsion Conference, Orlando, FL, USA, 27–29 July 2015. [Google Scholar]
  8. Wang, Z.; Sun, M.; Wang, H.; Yu, J.; Liang, J.; Zhang, F. Mixing-related Low Frequency Oscillation of Combustion in an Ethylene-fueled Supersonic Combustor. Proc. Combust. Inst. 2015, 35, 2137–2144. [Google Scholar] [CrossRef]
  9. Nakaya, S.; Kinoshita, R.; Lee, J.; Ishikawa, H.; Tsue, M. Analysis of Supersonic Combustion Characteristics of Ethylene/Methane Fuel Mixture on High-Speed Measurements of CH* Chemiluminescence. Proc. Combust. Inst. 2019, 37, 3749–3756. [Google Scholar] [CrossRef]
  10. Nakaya, S.; Yamana, H.; Tsue, M. Experimental Investigation of Ethylene/air Combustion Instability in a Model Scramjet Combustor using Image-based Methods. Proc. Combust. Inst. 2021, 38, 3869–3880. [Google Scholar] [CrossRef]
  11. van der Lee, J.; Yokev, N.; Michaels, D. Combustion Instability Due to Combustion Mode Transition in a Cavity-Stabilized Scramjet. J. Propul Power 2022, 38, 945–956. [Google Scholar] [CrossRef]
  12. Zhao, G.; Sun, M.; Wu, J.; Cui, X.; Wang, H. Investigation of Flame Flashback Phenomenon in a Supersonic Crossflow with Ethylene Injection Upstream of Cavity Flameholder. Aerosp. Sci. Technol. 2019, 87, 190–206. [Google Scholar] [CrossRef]
  13. Jiang, Z.; Zhang, Z.; Liu, Y.; Wang, C.; Luo, C. Criteria for Hypersonic Airbreathing Propulsion and its Experimental Verification. Chin. J. Aeront. 2021, 34, 94–104. [Google Scholar] [CrossRef]
  14. Zettervall, N.; Nordin-Bates, K.; Ibron, C.; Fureby, C. LES of Combustion Dynamics in an Ethylene-Hydrogen-Air Ramjet. In Proceedings of the 33rd Congress of the International Council of the Aeronautical Science, Stockholm, Sweden, 4–9 September 2022. [Google Scholar]
  15. Wang, H.; Wang, Z.; Sun, M.; Qin, N. Combustion Characteristics in a Supersonic Combustor with Hydrogen Injection Upstream of Cavity Flameholder. Proc. Combust. Inst. 2013, 34, 2073–2082. [Google Scholar] [CrossRef]
  16. Bermejo-Moreno, I.; Larsson, J.; Bodart, J.; Vicquelin, R. Wall-modeled Large-eddy Simulations of the HIFiRE-2 Scramjet. Cent. Turbul. Res. Annu. Res. Briefs. 2013, 3–19. [Google Scholar]
  17. Johan, L.; Stuart, L.; Iván, B.-M.; Julien, B.; Sebastian, K.; Ronan, V. Incipient Thermal Choking and Stable Shock-train Formation in the Heat-release Region of a Scramjet Combustor. Part II: Large eddy simulations. Combust. Flame 2015, 162, 907–920. [Google Scholar]
  18. Potturi, A.S.; Edwards, J.R. Large-eddy/reynolds-averaged Navier–stokes Simulation of Cavity-stabilized Ethylene Combustion. Combust. Flame 2015, 162, 1176–1192. [Google Scholar] [CrossRef]
  19. Lacaze, G.; Vane, Z.P.; Oefelein, J.C. Large Eddy Simulation of the HIFiRE Direct Connect Rig Scramjet Combustor. In Proceedings of the 55th AIAA Aerospace Sciences Meeting, Grapevine, TX, USA, 9–13 January 2017. [Google Scholar]
  20. Nordin-Bates, K.; Fureby, C.; Karl, S.; Hannemann, K. Understanding Scramjet Combustion using LES of the HyShot II Combustor. Proc. Combust. Inst. 2017, 36, 2893–2900. [Google Scholar] [CrossRef]
  21. Ruan, J.L.; Domingo, P.; Ribert, G. Analysis of Combustion Modes in a Cavity Based Scramjet. Combust. Flame 2020, 215, 238–251. [Google Scholar] [CrossRef]
  22. Hash, C.A.; Drummond, P.M.; Edwards, J.R.; Kato, N.; Lee, T. Numerical Simulation of Stable and Unstable Ram-mode Operation of an Axisymmetric Ethylene-fueled Inlet-isolator-combustor Configuration. Combust. Flame 2022, 242, 112157–112173. [Google Scholar] [CrossRef]
  23. Cao, D.; Brod, H.E.; Yokev, N.; Michaels, D. Flame Stabilization and Local Combustion Modes in a Cavity-based Scramjet using Different Fuel Injection Schemes. Combust. Flame 2021, 233, 111562–111574. [Google Scholar] [CrossRef]
  24. Peterson, D.M.; Hassan, E.; Bornhoft, B. Improved Delayed Detached-eddy Simulation of a Round Supersonic Combustor with and without Periodic Boundary Conditions. In Proceedings of the AIAA SCITECH 2022 Forum, San Diego, CA, USA, 3–7 January 2022. [Google Scholar]
  25. Peterson, D.M. Simulation of a Round Supersonic Combustion using Wall-modeled Large-eddy Simulation and Partially Stirred Reactor Model. Proc. Combust. 2022, 39, 3137–3145. [Google Scholar] [CrossRef]
  26. Jeong, S.-M.; Lee, J.-H.; Choi, J.-Y. Numerical Investigation of Low-frequency Combustion Instability and Frequency Shifting in a Scramjet Combustor. Proc. Combust. 2022, 39, 3107–3116. [Google Scholar] [CrossRef]
  27. Hinterberger, C.; Fröhlich, J.; Rodi, W. Three-dimensional and Depth-averaged Large-eddy Simulations of Some Shallow Water Flows. J. Hydraul. Eng. 2007, 133, 857–872. [Google Scholar] [CrossRef]
  28. Norris, J.W.; Edward, J.R. Large-eddy Simulation of High-speed, Turbulent Diffusion Flames with Detailed Chemistry. In Proceedings of the 35th Aerospace Sciences Meeting and Exhibit, Reno, NV, USA, 6–9 January 1997. [Google Scholar]
  29. Edwards, J.R.; Boles, J.A.; Baurle, R.A. Large-eddy/Reynolds-averaged Navier–Stokes Simulation of a Supersonic Reacting Wall Jet. Combust. Flame 2021, 159, 1127–1138. [Google Scholar] [CrossRef]
  30. Zhang, L.; Choi, J.-Y.; Yang, V. Supersonic Combustion and Flame Stabilization of Coflow Ethylene and Air with Splitter Plate. J. Propuls. Power 2015, 31, 1242–1255. [Google Scholar] [CrossRef]
  31. Garby, R.; Selle, L.; Poinsot, T. Large-Eddy Simulation of Combustion Instabilities in a Variable-length Combustor. Comptes Rendus Mécanique. 2013, 341, 220–229. [Google Scholar] [CrossRef]
  32. Jeong, S.-M.; Kim, J.-E.; Lee, J.-H.; Choi, J.-Y. Analysis on Flow-Field Characteristics of a Scramjet Combustor with respect to Equivalence Ratio using IDDES Simulation. In Proceedings of the AIAA SCITECH 2023 Forum, National Harbor, MD, USA, 23–27 January 2023. [Google Scholar]
  33. Won, S.-H.; Jeung, I.-S.; Parent, B.; Choi, J.-Y. Numerical Investigation of Transverse Hydrogen Jet into Supersonic Crossflow Using Detached-Eddy Simulation. AIAA J. 2010, 48, 1047–1058. [Google Scholar] [CrossRef]
  34. Pavalavanni, P.K.; Sohn, C.H.; Lee, B.J.; Choi, J.-Y. Revisiting unsteady shock-induced combustion with modern analysis techniques. Proc. Combust. 2019, 37, 3637–3644. [Google Scholar] [CrossRef]
  35. Choi, J.-Y.; Unnikrishnan, U.; Hwang, W.-S.; Jeong, S.-M.; Han, S.-H.; Kim, K.H.; Yang, V. Effect of Fuel Temperature on Flame Characteristics of Supersonic Turbulent Combustion. Fuel 2022, 329, 125310–125329. [Google Scholar] [CrossRef]
  36. Potturi, A.; Edwards, J.R. Investigation of Subgrid Closure Models for Finite-Rate Scramjet Combustion. In Proceedings of the 43rd AIAA Fluid Dynamics Conference, San Deigo, CA, USA, 24–27 June 2013. [Google Scholar]
  37. Fulton, J.A.; Edwards, J.R.; Cutler, A.; McDaniel, J.; Goyne, C. Turbulence/chemistry interactions in a ramp-stabilized supersonic hydrogen–air diffusion flame. Combust. Flame 2016, 174, 152–165. [Google Scholar] [CrossRef]
  38. Li, Z.; Ferrarotti, M.; Cuoci, A.; Parente, A. Finite-rate chemistry modelling of non-conventional combustion regimes using a Partially-Stirred Reactor closure: Combustion model formulation and implementation detail. Appl. Energy 2018, 225, 637–655. [Google Scholar] [CrossRef]
  39. Wang, N.; Yang, T.; Ren, Z. Active Subspace Variation and Modeling Uncertainty in a Supersonic Flame Simulation. AIAA J. 2021, 59, 1798–1807. [Google Scholar] [CrossRef]
  40. Boukharfane, R.; Techer, A.; Er-raiy, A. LES of Reacting Flow in a Hydrogen Jet into Supersonic Crossflow Combustor Using a New Turbulent Combustion Model. Int. J. Aeronaut. Space Sci. 2021, 25, 115–128. [Google Scholar] [CrossRef]
  41. Gonzalez-Juez, E.D.; Kerstein, A.R.; Ranjan, R.; Menon, S. Advances and Challenges in Modeling High-speed Turbulent Combustion in Propulsion Systems. Prog. Energy Combust. Sci. 2017, 60, 26–67. [Google Scholar] [CrossRef]
  42. Chemical-Kinetic Mechanisms for Combustion Applications, San Diego Mechanism, Combustion Research Group, UC San Diego. Available online: http://web.eng.ucsd.edu/mae/groups/combustion/index.html (accessed on 26 June 2014).
  43. Spalart, P.R.; Jou, W.H.; Strelets, M.; Allmaras, S.R. Comments on the Feasibility of LES for Wings, and on a Hybrid RANS/LES Approach. In Proceedings of the First AFOSR International Conference on DNS/LES, Ruston, LA, USA, 4–8 August 1997. [Google Scholar]
  44. Menter, F.R. Two-equation Eddy-viscosity Turbulence Models for Engineering Applications. AIAA J. 1994, 32, 1598–1605. [Google Scholar] [CrossRef]
  45. Abe, K. A Hybrid LES/RANS Approach using an Anisotropy-resolving Algebraic Turbulence Model. Int. J. Heat Fluid. Flow. 2005, 26, 204–222. [Google Scholar] [CrossRef]
  46. Strelets, M. Detached Eddy Simulation of Massively Separated Flows. In Proceedings of the 39th AIAA Aerospace Sciences Meeting and Exhibit, Reno, NV, USA, 8–11 January 2001. [Google Scholar]
  47. Menter, F.R.; Kuntz, M.; Langtry, R. Ten Years of Industrial Experience with the SST Turbulence Model. Turbul. Heat Mass. Transf. 2003, 4, 625–632. [Google Scholar]
  48. Gritskevich, M.S.; Garbaruk, A.V.; Schutze, J.; Menter, F.R. Development of DDES and IDDES Formulations for the k-ω Shear Stress Transport Model. Flow. Turbul. Combust. 2012, 88, 431–449. [Google Scholar] [CrossRef]
  49. Harten, A. High Resolution Schemes for Hyperbolic Conservation Laws. J. Comput. Phys. 1997, 135, 260–278. [Google Scholar] [CrossRef]
  50. Liu, X.-D.; Osher, S.; Chan, T. Weighted Essentially Non-oscillatory Schemes. J. Comput. Phys. 1994, 115, 200–212. [Google Scholar] [CrossRef]
  51. Jiang, G.-S.; Shu, C.-W. Efficient Implementation of Weighted ENO Schemes. J. Comput. Phys. 1996, 126, 202–228. [Google Scholar] [CrossRef]
  52. Balsara, D.S.; Shu, C.-W. Monotonicity Preserving Weighted Essentially Non-oscillatory Schemes with Increasingly High Order of Accuracy. J. Comput. Phys. 2000, 160, 405–452. [Google Scholar] [CrossRef]
  53. Kim, K.H.; Kim, C. Accurate, Efficient and Monotonic Numerical Methods for Multi-dimensional Compressible Flows Part II: Multi-dimensional Limiting Process. J. Comput. Phys. 2005, 208, 570–615. [Google Scholar] [CrossRef]
  54. Kim, S.; Lee, S.; Kim, K.H. Wavenumber-extended High-order Oscillation Control Finite Volume Schemes for Multi-dimensional Aeroacoustic Computations. J. Comput. Phys. 2008, 227, 4089–4122. [Google Scholar] [CrossRef]
  55. Wada, Y.; Liou, M.-S. A Flux Splitting Scheme with High-resolution and Robustness for Discontinuities. In Proceedings of the 32nd Aerospace Science Meeting & Exhibit, Reno, NV, USA, 10–13 January 1994. [Google Scholar]
  56. Jang, K.-J.; Kim, J.-K.; Cho, D.-R.; Choi, J.-Y. Optimization of LU-SGS Code for the Acceleration on the Modern Microprocessors. Int. J. Aeronaut. Space Sci. 2013, 14, 112–121. [Google Scholar] [CrossRef]
  57. Marshall, W.; Pal, S.; Woodward, R.; Santoro, R. Benchmark Wall Heat Flux Data for a GO2/GH2 Single Element Combustor. In Proceedings of the 41st AIAA/ASME/SAE/ASEE Joint Propulsion Conference & Exhibit, Tucson, AZ, USA, 10–13 July 2005. [Google Scholar]
  58. Sung, B.-K.; Choi, J.-Y. Design of a Mach 2 Shape Transition Nozzle for Lab-scale Direct-connect Supersonic Combustor. Aerosp. Sci. Technol. 2021, 117, 106906–106918. [Google Scholar] [CrossRef]
  59. Evans, J.S.; Schexnayder, C.J. Influence of Chemical Kinetics and Unmixedness on Burning in Supersonic Hydrogen Flames. AIAA J. 1979, 18, 188–193. [Google Scholar] [CrossRef]
  60. Möbus, H.; Gerlinger, P.; Brüggemann, D. Scalar and Joint Scalar-velocity-frequency Monte Carlo PDF Simulation of Supersonic Combustion. Combust. Flame. 2003, 132, 3–24. [Google Scholar] [CrossRef]
  61. Koo, H.; Donde, P.; Raman, V. A Quadrature-based LES/transported Probability Density Function Approach for Modeling Supersonic Combustion. Proc. Combust. Inst. 2011, 33, 2203–2210. [Google Scholar] [CrossRef]
  62. Wang, H.; Wang, Z.; Sun, M.; Wu, H. Combustion Modes of Hydrogen Jet Combustion in a Cavity-based Supersonic Combustor. Int. J. Hydrog. Energy 2013, 38, 12078–12089. [Google Scholar] [CrossRef]
  63. Wang, Z.; Wang, H.; Sun, M. Review of Cavity-stabilized Combustion for Scramjet Applications. Proc. Inst. Mech. Eng. Part. G. J. Aerosp. Eng. 2014, 228, 2718–2735. [Google Scholar] [CrossRef]
  64. Li, F.; Sun, M.; Zhu, J.; Cai, Z.; Wang, H.; Zhang, Y.; Sun, Y. Scaling Effects on Combustion Modes in a Single-side Expansion Kerosene-fueled Scramjet Combustor. Chin. J. Aeronaut. 2021, 34, 684–690. [Google Scholar] [CrossRef]
  65. Yokev, N.; Brod, H.E.; Cao, D.; Michaels, D. Impact of Fuel Injection Distribution on Flame Holding in a Cavity-Stabilized Scramjet. J. Propuls. Power. 2021, 37, 584–594. [Google Scholar] [CrossRef]
  66. Barnes, F.W.; Segal, C. Cavity-based Flameholding for Chemically-reacting Supersonic Flows. Prog. Aerosp. Sci. 2015, 76, 24–41. [Google Scholar] [CrossRef]
  67. Yamashita, H.; Shimada, M.; Takeno, T. A Numerical Study on Flame Stability at the Transition Point of Jet Diffusion Flames. Symp. Inst. Combust. 1996, 26, 27–34. [Google Scholar] [CrossRef]
  68. Im, S.; Do, H. Unstart Phenomena Induced by Flow Choking in Scramjet Inlet-isolators. Prog. Aerosp. Sci. 2018, 97, 1–21. [Google Scholar] [CrossRef]
  69. Nichols, J.W.; Larsson, J.; Bernardini, M.; Pirozzoli, S. Stability and Modal Analysis of Shock/boundary Layer Interactions. Theor. Comput. Fluid Dyn. 2017, 31, 33–50. [Google Scholar] [CrossRef]
  70. Pasquariello, V.; Hickel, S.; Adams, N.A. Unsteady Effects of Strong Shock-wave/boundary-layer Interaction at High Reynolds Number. J. Fluid Mech. 2017, 823, 617–657. [Google Scholar] [CrossRef]
  71. Meng, Y.; Sun, W.; Gu, H.; Chen, F.; Zhou, R. Supersonic Combustion Mode Analysis of a Cavity Based Scramjet. Aerospace 2022, 9, 826. [Google Scholar] [CrossRef]
Figure 1. Configuration of the Pusan natl. University (PNU) direct-connect supersonic combustor (DCSC).
Aerospace 10 00932 g001
Figure 2. Specific size and grid configuration of the computational domain [26].
Aerospace 10 00932 g002
Figure 3. (a) Time-averaged results of static temperature and pressure field under the validation condition of PND-DCSC, (b) comparison between measured and calculated lower wall pressure.
Aerospace 10 00932 g003
Figure 4. Instantaneous result of (a) the concentration of the OH mass fraction, (b) temperature distribution, (c) pressure gradient, and (d) pressure field depending on the global equivalence ratio.
Aerospace 10 00932 g004
Figure 5. Time–averaged result of the (a) OH mass fraction distribution and density gradient and (b) temperature distribution according to the global equivalence ratio.
Aerospace 10 00932 g005
Figure 6. Time–averaged result of the Takeno flame index depending on the equivalence ratio.
Aerospace 10 00932 g006
Figure 7. Time–averaged result of the Mach number distribution at each equivalence ratio, (bottom) scatterplot at a global equivalence ratio of 0.50.
Aerospace 10 00932 g007
Figure 8. Scatterplot showing the instantaneous Mach number and pressure field distribution at 100 ms according to the global equivalence ratio.
Aerospace 10 00932 g008
Figure 9. x–t diagram (a) of the pressure distribution on the lower wall and (b) the temperature distribution on the upper wall of the combustor region according to the global equivalence ratio.
Aerospace 10 00932 g009
Figure 10. Instantaneous result of the chronologically illustrated pressure field distribution; (a) 25.58–27.10 ms, (b) 27.11–28.63 ms.: (A) propagation of the primary upstream-traveling shock wave, (B–C) formation of the secondary upstream-traveling shock wave, (D–E) repropagation and dissipation of the upstream-traveling shock wave, (F–G) regeneration of the primary upstream-traveling shock wave.
Aerospace 10 00932 g010
Figure 11. Pressure field distribution on the upper wall at the region between stable state and propagation of secondary upstream-traveling shock wave.
Aerospace 10 00932 g011
Figure 12. Instantaneous result of the (a) density gradient and (b) pressure field distribution at the time range of the secondary upstream-traveling shock wave formation: (i) the state of cavity shear-layer stabilized combustion mode, (ii) formation of the reflected shock waves and the initiation of disturbance on the fuel stream, (iiiiv) increase in the pressure at the backside of the bow shock, (vvii) pressure propagation into the isolator, (viii) highly unstable state for fuel injection region.
Aerospace 10 00932 g012
Figure 13. The propagation and bifurcation process of the secondary upstream-traveling shock wave.
Aerospace 10 00932 g013
Figure 14. Pressure distribution on the lower wall at the region between the isolator upstream and cavity front wall: (a) section (C), (b) section (D).
Aerospace 10 00932 g014
Figure 15. (a) Instantaneous results of the normalized x-direction velocity component (iso-line: U/Uref = 0.1), pressure field (iso-line: Mach number = 1.0), and (b) normalized jet momentum ratio along the height direction.
Aerospace 10 00932 g015
Figure 16. Motion of the blowing-off separation bubble, which induces disturbance in the fuel injection at section (E).
Aerospace 10 00932 g016
Figure 17. Pressure distribution on the lower wall at the region between the isolator upstream and front wall of cavity: (a) section (E), (b) section (F).
Aerospace 10 00932 g017
Figure 18. Pressure history of each probe point on the lower wall of the computational region: (a) upstream and (b) downstream of the isolator, (c) fuel injection point.
Aerospace 10 00932 g018
Figure 19. (A) schematic of the combustion states according to the combustion mode [66], (B) Instantaneous result of the Mach number distribution on the fuel injection area.
Aerospace 10 00932 g019
Figure 20. Normalized (a) pressure and (b) temperature distribution on the upper wall in the cavity shear-layer combustion mode, transition state, and jet-wake combustion mode.
Aerospace 10 00932 g020
Figure 21. Instantaneous result of the (a) static temperature, (b) density gradient, (c) static pressure, and (d) OH mass fraction: (A–C) indicates the cavity shear–layer combustion mode, transition state, and the jet–wake combustion mode, respectively.
Aerospace 10 00932 g021
Figure 22. Instantaneous result of the chronologically–illustrated pressure field distribution; (a) 82.54~83.54 ms, (b) 83.57~84.57 ms.: In this time period, the combustion mode presents as the jet-wake type. (A) formation of the upstream-traveling shock wave, (B,C) formation and collision of the new upstream-traveling shock wave.
Aerospace 10 00932 g022
Figure 23. (a) Instantaneous results of the normalized x-direction velocity component (iso-line: U/Uref = 0.1), pressure field (iso-line: Mach number = 1.0), and (b) normalized jet momentum ratio along the height direction.
Aerospace 10 00932 g023
Figure 24. Pressure history of each probe point on the lower wall of the computational region: (a) upstream and (b) downstream of the isolator, (c) fuel injection point.
Aerospace 10 00932 g024
Figure 25. Pressure history according to the global equivalence ratio; probe point located at the isolator (a) upstream and (b) downstream.
Aerospace 10 00932 g025
Figure 26. FFT results of the pressure history extracted from the probe point at the isolator upstream (a) and the combustor (b) under the cavity shear-layer combustion mode.
Aerospace 10 00932 g026
Figure 27. FFT results of the pressure history extracted from the probe point at the isolator upstream (a) and the combustor (b) under the jet-wake combustion mode.
Aerospace 10 00932 g027
Table 1. Inflow, initial, and fuel injection condition on DCSC.
VAH
Downstream
Fuel Injection
ϕ 0.30 ϕ   0.35 ϕ   0.40 ϕ   0.45 ϕ   0.50
Mach number0.01Sonic condition
Temperature (T0)1675.0 K293.15 K
Pressure (P0)17.25 bar5.0 bar5.9 bar6.7 bar7.6 bar8.4 bar
Volume
[%]
H2-100
N260.5-
O221.1-
H2O18.4-
Table 2. Three major instability frequencies of each global equivalence ratio under the different combustion mode.
ϕCavity Shear-Layer Comb. Mode (Hz)Jet-Wake Comb. Mode (Hz)
IsolatorCombustorIsolatorCombustor
0.40222, 248, 492250, 326, 444-
0.45186, 266, 321187, 285, 321484, 615, 865800, 835, 933
0.50238, 384, 527192, 381, 522412, 460, 959843, 821, 418
Table 3. Several experimental cases of low-frequency combustion instability and frequency shifting, depending on the combustion mode which is formed by the incoming air and equivalence ratio.
Incoming Air
(T0, Mach#)
Instability
Frequency
Global ϕCombustion Mode
Lin et al.
[5]
1016.6 K, Mach# 2.2120 Hz0.62Did not mention
260, 292 Hz0.80
Micka et al.
[7]
< 1200 K, Mach# 2.2200~250 Hz0.60
0.60
Cavity shear-layer
> 1400 K, Mach# 2.21000 HzJet-wake
Nakaya et al.
[9]
1900   ± 50 K, Mach# 2.0100~500 Hz0.07Cavity shear-layer
100~1800 Hz0.15Jet-wake
100~1800 Hz0.25Jet-wake
Meng et al.
[71]
1249 K, Mach # 2.5150, 270, 480 Hz0.10Cavity shear-layer
180, 300, 459 Hz0.14Cavity shear-layer
300, 510 Hz0.20Jet-wake
Present1675 K, Mach# 2.0187~321 Hz0.45Cavity shear-layer
800~933 Hz0.45Jet-wake
Disclaimer/Publisher’s Note: The statements, opinions and data contained in all publications are solely those of the individual author(s) and contributor(s) and not of MDPI and/or the editor(s). MDPI and/or the editor(s) disclaim responsibility for any injury to people or property resulting from any ideas, methods, instructions or products referred to in the content.

