Abstract
During the COVID-19 pandemic, the question of how to reduce the risk of viral infection for international airline pilots without increasing the risk of fatigue was a novel and urgent theoretical and practical problem, which had never been encountered in the world civil aviation industry. A new scheduling method implemented by the Civil Aviation Administration of China (CAAC) is the extra augmented crew (EAC) schedule, which avoids crew layover in another country on international flights by extending the maximum duty time and adding two additional crew members to such long-haul flights. In this study, a multi-day flight crew fatigue assessment was conducted to evaluate the impact of EAC flight. We recruited 71 pilots as participants, and their fatigue during EAC flights was measured using a multimodality approach integrating a subjective fatigue report, a psychomotor vigilance task, sleep monitoring, and biomathematical model predictions. The results showed that the subjective fatigue level increased during duty time compared to off-duty time, but still with acceptable levels of under 7, as measured by the Karolinska Sleepiness Scale; objective secondary task performance, as measured by the classic psychomotor vigilance task, showed no differences; pilots were able to get around 6 h of sleep, although they slept less during duty time compared to off-duty time. Model fitting using the FAID biomathematical model of fatigue confirmed that the EAC scheduling was compliant with the FAID tolerance level 91.3% of the time. The results suggest that the EAC flight created some moderate level of increased fatigue but no severe fatigue to cross-continent long-haul flight crews. This research can inform current and future scheduling and fatigue risk control during the pandemic or for future time-sensitive periods.
1. Introduction
Crew fatigue has long been a contributing factor of aviation accidents [1]. The National Transportation Safety Board (NTSB) considers fatigue as a major risk to aviation safety [2], and this risk is even greater for flight crews working at non-standard times and across different time zones. It has been reported that around 4–8% of flight accidents were directly related to fatigue [3]. A survey including 1488 civil aviation pilots showed that 61% of pilots believe that fatigue occurs frequently during flights [4].
Fatigue has become an increasingly important and urgent problem during the COVID-19 pandemic [5]. In 2020, the global rampage of the new coronavirus severely disrupted international air transportation, and the question of how to minimize the risk of infection among pilots and ensure crew safety has become an urgent issue for the global civil aviation community. In response to the outbreak, the Civil Aviation Administration of China (CAAC) proposed a new scheduling method called extra augmented crew (EAC), which uses multiple sets of crews, continuous round-trip flights, and no rest/layover in the outbreak countries on international flights. According to international civil aviation regulations [6,7], no certificate holder may assign a crew member to a flight duty unless the crew member has received at least 10 consecutive hours of rest after the end of the previous flight duty period and before the start of the next flight duty period [8]. According to the EAC schedule, the maximum duty time is 35 h, and the maximum continuous flight time is 30 h, which deviates from ICAO regulations on the crew duty period and flight time limit for cross-continental flights. To reduce the risk of crew fatigue, EAC uses extra sets of crews (two additional members) on board to allow more shifts during a long duty period. However, there has been no fatigue assessment data to support it. With the development of the civil aviation industry, the demand for diversified flight crew fatigue risk management is also growing, and the requirement of integrating fatigue management into flight crew operation management is becoming increasingly urgent [9].
Fatigue is generally defined as a multifactorial construct involving psychological, physiological, and emotional aspects [10,11,12]. In aviation, ICAO defines flight crew fatigue as “a physiological state of reduced mental or physical performance capacity due to lack of sleep or prolonged wakefulness, circadian rhythms or workload (mental and/or physical activity)”. Fatigue impairs a person’s alertness and affects a pilot’s ability to maneuver and perform their duties [13]. Typical signs of fatigue include decreased motor coordination, slower reaction times, increased hesitation in decision making, and errors in judgment [14]. Although it is difficult to monitor pilot fatigue and quantitatively predict its impact on performance, researchers generally consider fatigue as a critical factor contributing to transportation incidents and accidents [15]. Statistics and investigation reports from the NTSB showed that fatigue contributed to about 4–8% of aviation incidents and accidents [16].
Crew fatigue is induced by several factors, including occupational, social, and personal factors. A survey of 739 civil pilots of all types showed that fatigue on long-haul flights was mainly triggered by the coincidence of working hours with circadian rhythms and sleep deprivation, while fatigue on short-haul flights was mainly associated with long periods spent awake due to multiple flight segments, sleep restriction, and frequent early take-offs [17]. Sleep deprivation and circadian rhythm disturbance are the main causes of fatigue in flight crews [18].
Two methods for the detection of crew fatigue are self-assessment and physiological tests [19]. The self-assessment method is easy to use, but it is subjective and may be affected by overconfidence, biases, and willingness to work to obtain payment. Physiological tests are objective, but they require advanced equipment such as electroencephalograms (EEG), eye-trackers, heart-rate monitors, functional magnetic resonance imaging (fMRI), or near infrared (NIR) optical imaging. This hardware requirement limits the application of many physiological tests in actual flights due to legal and regulative constraints [20].
The prediction of crew fatigue is usually implemented using biomathematical models (BMM), which describe the relationship between a theoretical fatigue value and sleep characteristics such as circadian rhythm, sleep deprivation, sleep recovery, and sleep inertia [18,21]. The following examples of biomathematical models have been used in the transportation industry—sleep, activity, fatigue and task effectiveness model (SAFTE) [22], biomathematical model of fatigue (FAID) [23], fatigue assessment system (SAFE) [24], dual process model [25], and circadian rhythm simulator (CAS) [26]. Most of the biomathematical models are based on the two-process model [27], which considers fatigue as a result of the interaction between sleep and circadian rhythms. Other models are based on the three-process model [28], which adds an additional process associated with sleep inertia after wake-up.
The goal of the current study is to examine pilots’ fatigue levels during international long-haul flights that have implemented EAC. Does the fatigue level exceed established threshold standards? We used multiple measures of fatigue, including subjective self-reported fatigue levels, objective reaction time measures, sleep quality measures, and fatigue prediction from a biomathematical model that is based on sleep–wake cycles. In addition, we also compared the pilots’ fatigue levels during the flights with the baseline fatigue from rest periods before the flights.
2. Methods
2.1. Participants
Seventy-one commercial airline pilots were recruited from China Eastern Airline and Shanghai Airline. The average age of the participants was 36.5 years (SD = 8.6 years). Their years of flight experience had an average of 14.5 years (SD = 8.6 years). Although we tried to recruit both males and females, all the participants were male due to the low number of female pilots in the aviation industry both in China and globally (less than 5%). All of them passed the CAAC pilot physical health examination and had no health problems such as sleep disorders.
2.2. Equipment, Measures, and Tasks
The hardware devices used included an iPad tablet (Apple Inc., Cupertino, CA, United States) and an ActiGraph activity monitor (ActiGraph LLC, Pensacola, FL, United States). The iPad (Air 2) was used for recording subjective reports of fatigue and running an application to collect reaction time measures of fatigue. The iPad was 23.9 cm high, 16.8 cm wide, 0.6 cm thick, and weighed 435.4 g. The sleep monitoring device was ActiGraph wGT3X-BT, which uses a three-axis gyroscope and a light sensor to monitor sleep quality. The ActiGraph was 3.3 cm high, 4.6 cm wide, 1.5 cm thick, and weighed 19 g.
The Karolinska Sleepiness Scale (KSS) was used to measure self-reported fatigue levels [21]. It is based on a 9-point scale (1 = extremely alert, 2 = very alert, 3 = alert, 4 = rather alert, 5 = neither alert nor sleepy, 6 = some signs of sleepiness, 7 = sleepy, but no effort to keep alert, 8 = sleepy, some effort to keep awake, 9 = very sleepy, great effort to keep alert, fighting sleep). KSS has shown good reliability, with a Kappa consistency coefficient of 0.73 [29]. It also significantly correlates with reaction time measures of fatigue (rs = 0.30–0.57) [30]. KSS scores < 7 are generally regarded as no fatigue or low fatigue [31], and KSS scores ≥ 7 are associated with the occurrence of microsleeps [21].
The psychomotor vigilance task (PVT) was used to collect reaction time measures of fatigue [32]. The PVT has been used in previous research studying sleep and fatigue among many tasks including piloting [33,34,35,36]. Each PVT session lasts for five minutes and has multiple trials. In each trial, the participant waits for the appearance of a visual stimulus signal and responds to it as soon as possible by pressing a button [37]. The reaction time in milliseconds is recorded and shown on the display as feedback. Figure 1 shows the task flow. From the raw data of the PVT response time (RT), five measures can be calculated, including median RT, reciprocal RT (i.e., 1/RT), the percentage of lapses, optimum RT, and the slowest 10% reciprocal RT. A lapse event is defined as an RT greater than 500 ms. The percentage of lapses is defined as the percentage of lapse events among all trials that happened in the five-minute session of the PVT. The optimum RT is defined as the median of the fastest 10% of RTs among all the trials in each PVT session. Because of individual differences and device differences (PC, tablet versus smartphone) in reaction time [35,38], there has been no established fatigue threshold regarding PVT measures. Fatigue is usually assessed by comparing PVT data during task operation with data from rest periods as the baseline [39].

Figure 1.
Psychomotor vigilance task (PVT) task flow.
The sleep quality data was calculated using the PyActigraphy library. The participants were also asked to complete a sleep diary. Time in bed (in hours) is used as the sleep quality measure. A large-scale sleep study based on an East Asian population found that sleep time is around 6 to 7 h per day, so time in bed < 6 h is assumed to be associated with fatigue [40].
The current study also used the fatigue assessment tool by InterDynamics (FAID) to assess fatigue risk. FAID was initially developed by David Darwent, Drew Dawson, and Greg Roach from the Appleton Institute, and it uses a biomathematical model to predict fatigue [41]. The FAID Quantum v1.1 software takes the actual sleep–wake data as the input. In the current study, the actual sleep–wake data were obtained from the Actigraphy hardware and verified using the sleep diary logged by the participants. The FAID tolerance level is a predetermined threshold value defined within the FAID software to determine whether a person is fit to perform a task based on their fatigue level. The FAID tolerance level can be set by users but is recommended to be between 80 and 100. A tolerance level between 80 and 100 is equivalent to the fatigue level after 21 to 24 h of continuous sleep deprivation [42] and comparable to the mental states experienced with a blood alcohol concentration of 0.05% [43]. In the current study, we used the default FAID tolerance level of 80. FAID has been successfully applied in various industries such as aviation, mining, railway, and healthcare. Previous research has shown that the FAID model provides a useful method for predicting cumulative fatigue [18].
2.3. Experimental Design and Procedure
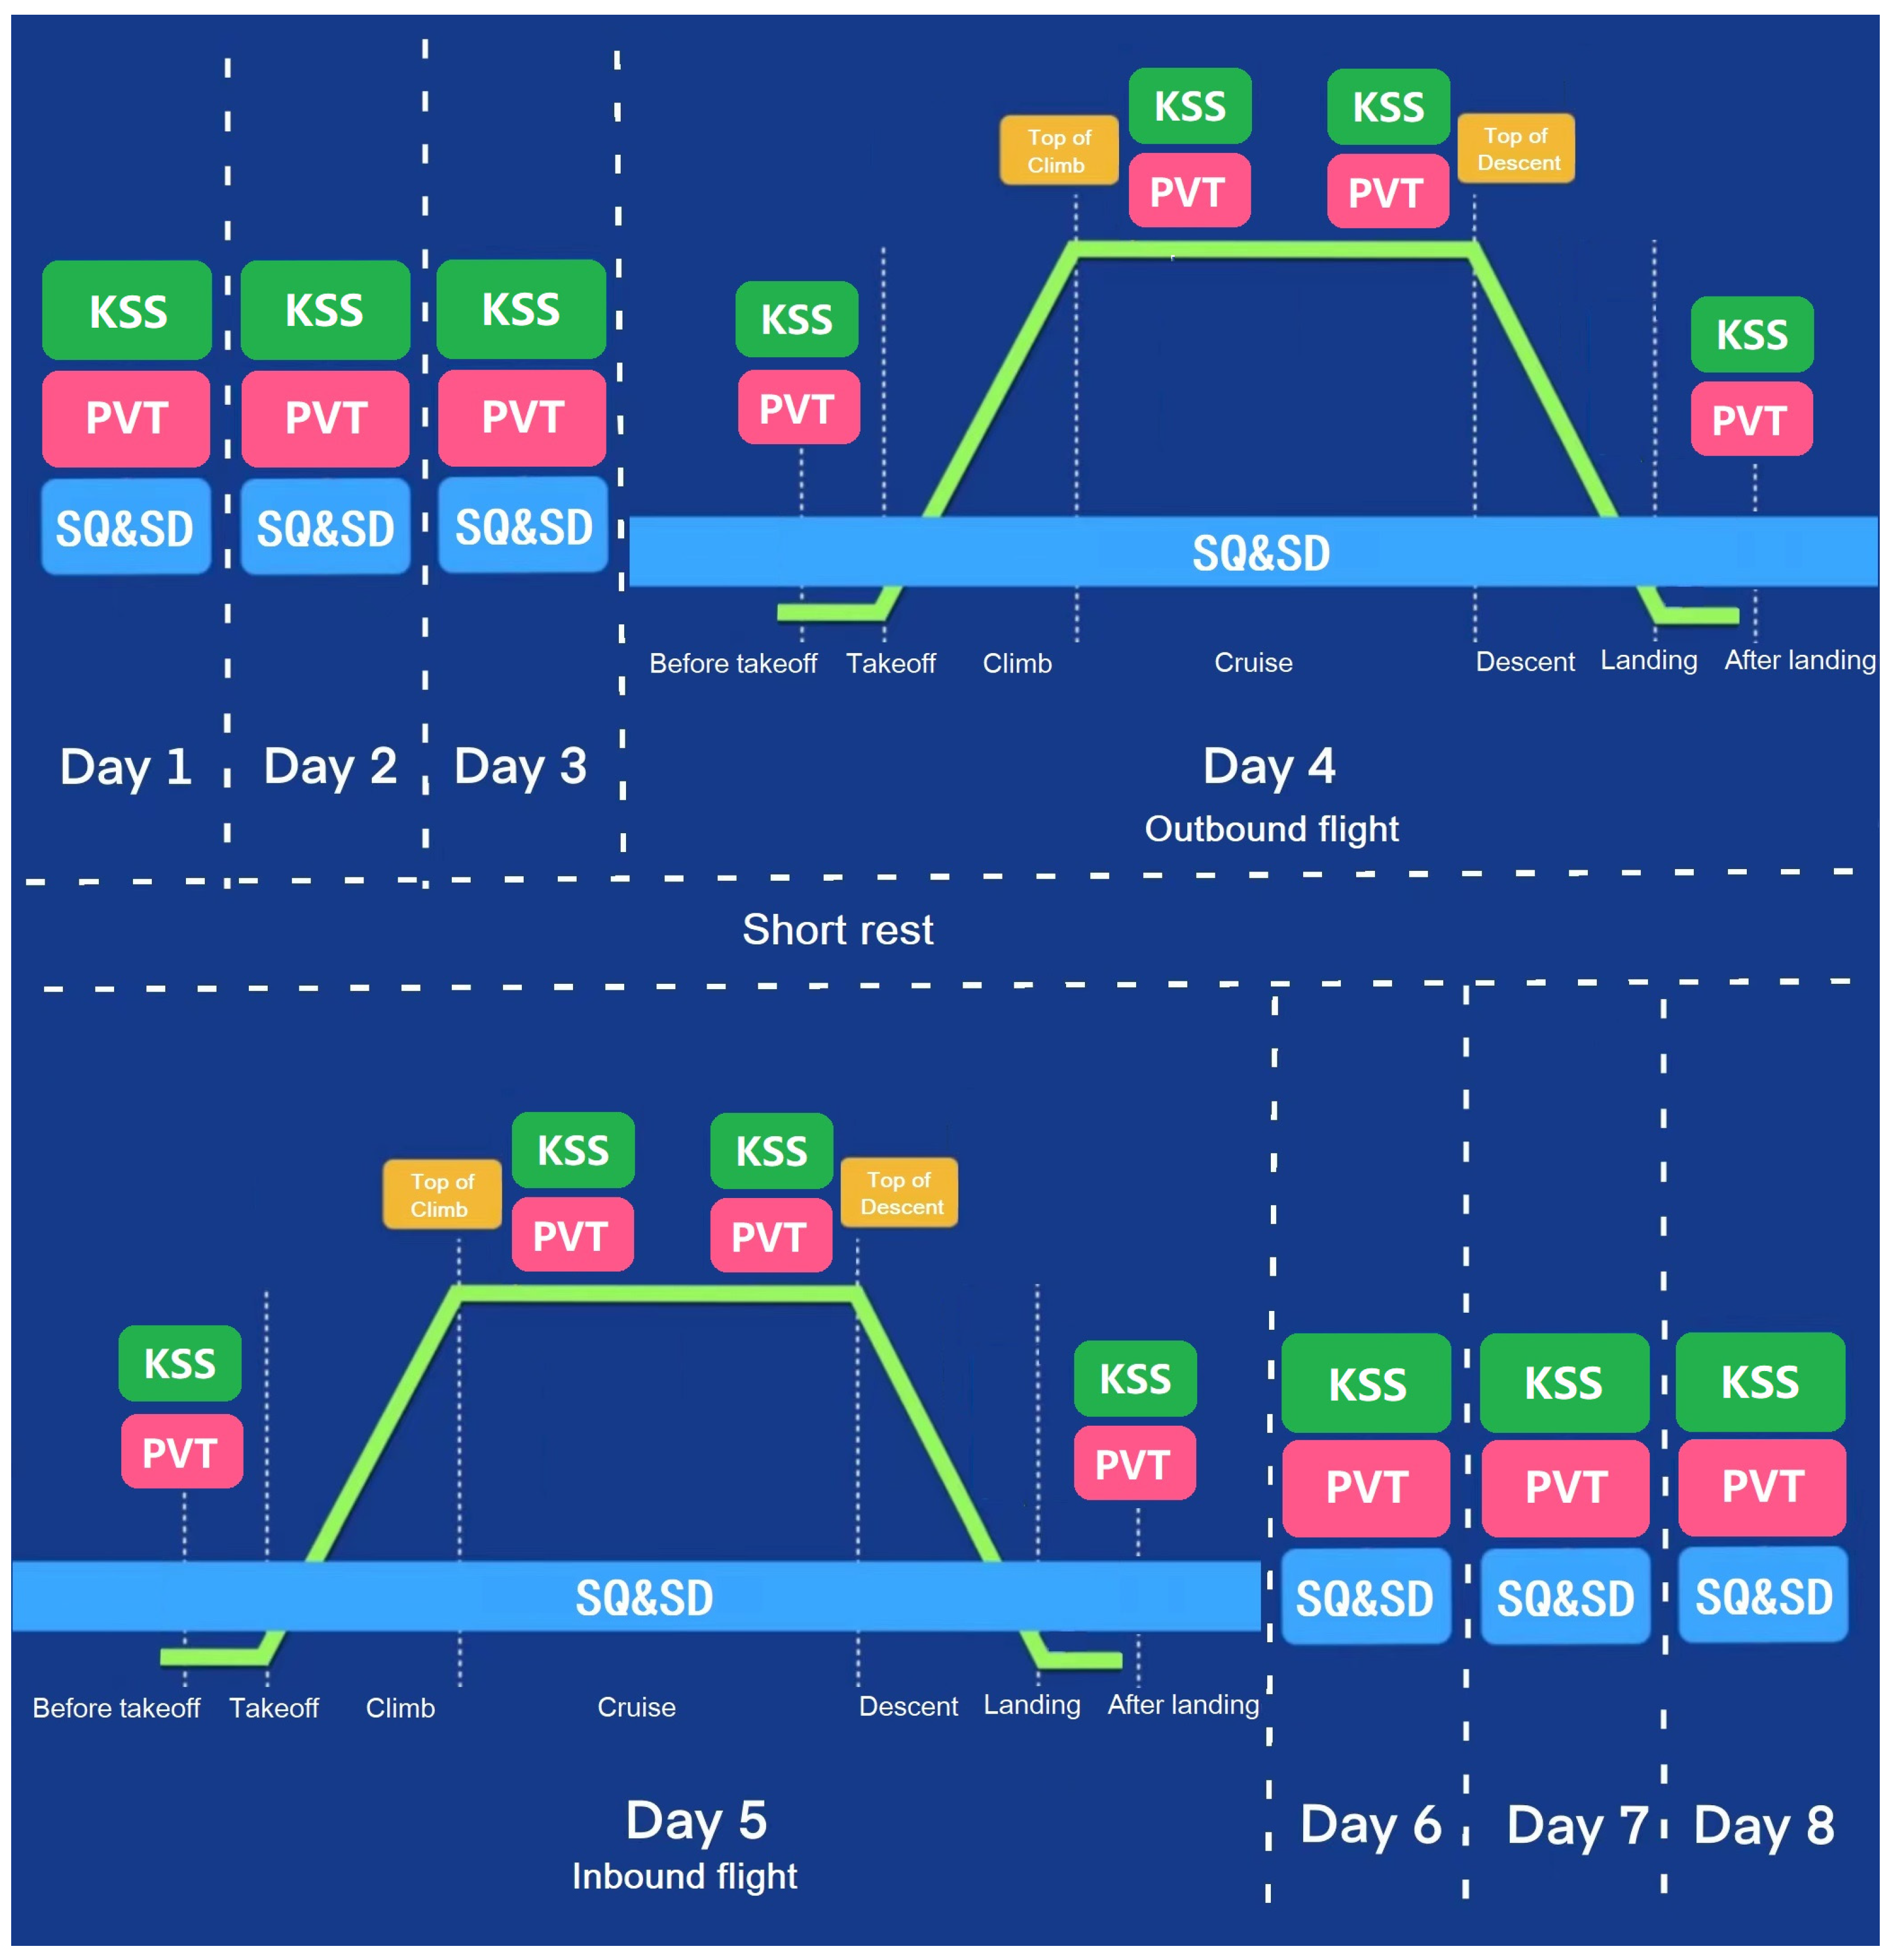
The experiment used a repeated measure within-subject design. Data were collected over an eight-day period, including pre-flight (three days before the flight), in-flight (two days during the round-trip flight without overlay), and post-flight (three days after the flight). Sleep quality and the sleep–wake cycle were measured for each day using the ActiGraph worn by the participants on their left wrist throughout the eight days. KSS and PVT measures were collected 14 times, including once per day during pre-flight and post-flight, four times during the outbound flight, and four times during the inbound flight. During each flight, the four moments of data collection included before takeoff preparation, after takeoff climb, before descent preparation, and after landing (Figure 2). Power analysis using G*Power 3.1 showed that given an estimated effect size f = 0.25 and alpha error probability = 0.05, a minimal sample size of 23 is needed to reach 0.95 power.
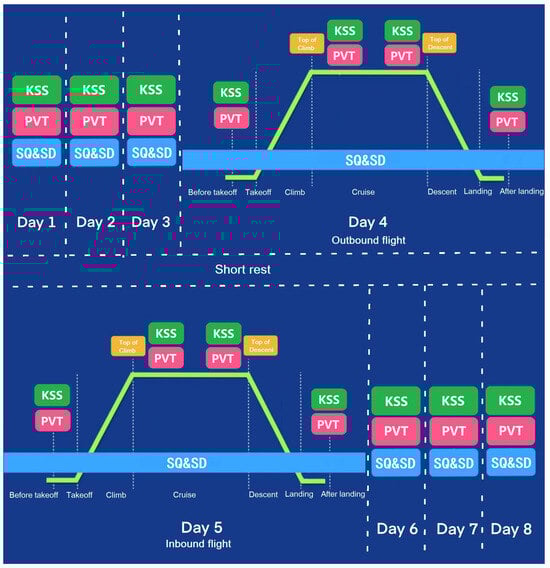
Figure 2.
Schedule for dependent variable measures during the eight days. (KSS: Karolinska Sleepiness Scale, PVT: psychomotor vigilance task, SQ: sleep quality, SD: sleep diary).
A total of six international long-haul routes (round-trip duration > 20 h) departing from Shanghai Pudong Airport were included in this study. There were four routes to the east (North America) and two routes to the west (Europe), as shown in Figure 3.
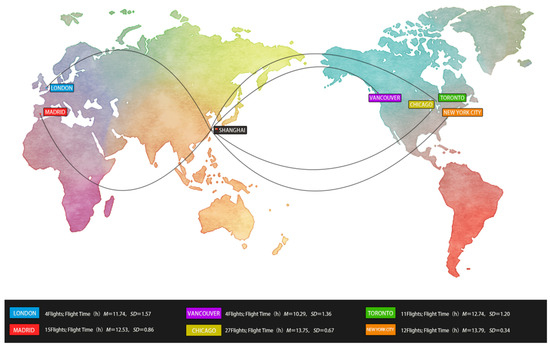
Figure 3.
Schematic diagram of the flight routes. (Note: the routes are only for illustrative purposes, and the lines do not represent the actual flight paths.)
2.4. Data Analysis
Data analysis was performed using SPSS for repeated measures ANOVA and t-tests. (partial eta squared), with 0.01, 0.06, and 0.14 representing small, medium, and large effect sizes, respectively [44]. Partial eta squared is a frequently used measure for effect size. In ANOVA, it is calculated as SSeffect/(SSeffect + SSerror). The SSeffect means the sum of squares associated with an effect in question, and SSerror means the sum of squares associated with the corresponding error in the effect.
For the KSS and PVT measures, the repeated measures ANOVA had one independent variable—measure time (14 levels). For sleep quality measures, the repeated measures ANOVA had one independent variable—night of sleep (7 levels).
One-sample t-tests were used to analyze whether the average fatigue measures during the flight duty periods (outbound and inbound flights) were significantly different from the fatigue threshold (i.e., KSS = 7, time in bed = 6 h).
3. Results
3.1. Subjective Karolinska Sleepiness Scale (KSS)
Repeated measures ANOVA showed that the main effect of measure time on KSS scores was significant, F (8.12, 568.30) = 6.01, p < 0.001, = 0.08 (Figure 4). Further, pairwise comparisons (using a significance level of 0.05) indicated that KSS from outbound before takeoff was significantly smaller than pre-flight day 1 and pre-flight day 2; KSS from outbound after climb was significantly greater than post-flight day 3; KSS from outbound before descent and outbound after landing was significantly greater than outbound before takeoff, post-flight day 2, and post-flight day 3; KSS from inbound before descent was significantly greater than post-flight day 2 and day 3; and KSS from inbound after landing was significantly greater than outbound before takeoff, post-flight day 2, and post-flight day 3. All other pairwise comparisons were not significant, ps > 0.05.
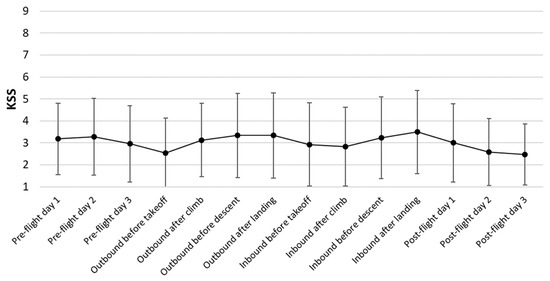
Figure 4.
Average results from KSS. Error bars represent standard deviation.
The KSS scores measured during the flight duty periods were compared to the threshold value using one-sample t-tests. As shown in Table 1, all of the average KSS values were significantly smaller than the threshold value of 7, t(70) values ≥ 15.65, ps < 0.001, which suggests that pilots flying using EAC were not overly fatigued. Shapiro–Wilk tests were performed and showed that the distributions of KSS scores departed significantly from normality (W ≥ 0.845, ps ≤ 0.001). According to the central limit theorem (Laplace, 1810), since the sample size is larger than 30, a t-test is generally regarded as robust, even when the normality assumption is violated. Nevertheless, we also conducted one-sample Wilcoxon tests, and the results were in accordance with the t-tests, showing that the median KSS scores were significantly lower than the threshold value of 7 (ps < 0.001).

Table 1.
KSS results during outbound and inbound flights.
3.2. Psychomotor Vigilance Task (PVT)
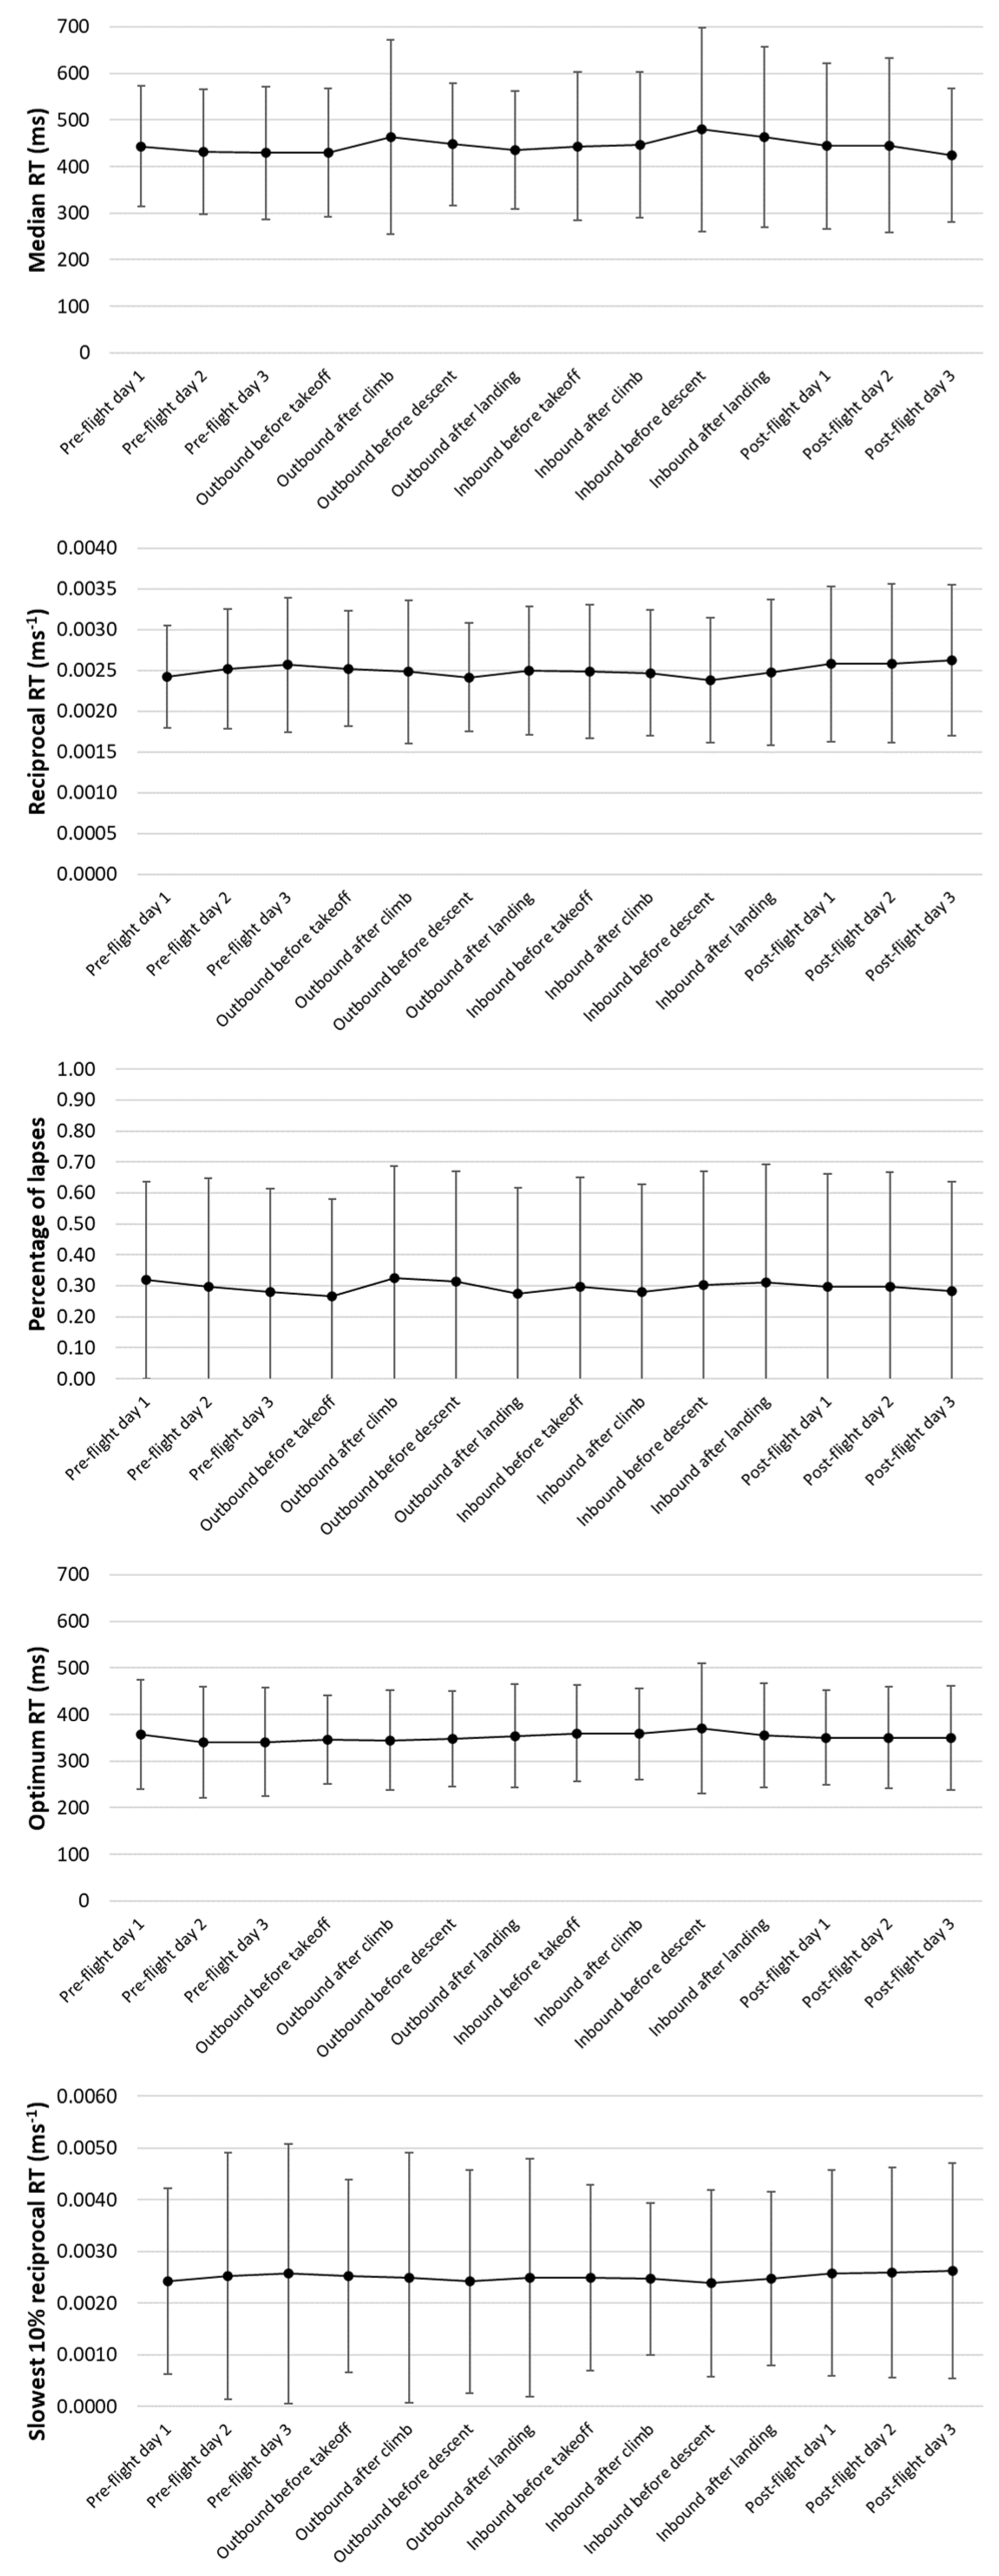
See Figure 5 for various measurements for PVT.

Figure 5.
Average results from PVT measures. Error bars represent standard deviation.
Regarding the median RT, repeated measures ANOVA showed that the main effect of measure time was not significant, F(6.33, 342.04) = 1.62, p = 0.14, = 0.03. All pairwise comparisons were not significant, ps > 0.10.
Regarding the reciprocal RT (1/RT), the main effect of measure time was not significant, F(3.96, 213.64) = 1.50, p = 0.21, = 0.03. All pairwise comparisons were not significant, ps > 0.10.
Regarding the percentage of lapses, the main effect of measure time was not significant, F(8.09, 436.62) = 0.91, p = 0.51, = 0.02. All pairwise comparisons were not significant, ps > 0.10.
Regarding the optimum RT, the main effect of measure time was not significant, F(4.63, 249.97) = 0.83, p = 0.53, = 0.02. All pairwise comparisons were not significant, ps > 0.10.
Regarding the slowest 10% reciprocal RT, the main effect of measure time was not significant, F(3.74, 202.12) = 0.58, p = 0.67, = 0.01. All pairwise comparisons were not significant, ps > 0.10.
Overall, the PVT results during the flight duty period were not significantly different from the pre-flight and post-flight baseline conditions.
3.3. Sleep Quality
Seven periods of sleep were recorded from the eight-day period of the study, as shown in Figure 6. The flight duty period happened around the time of sleep 4. Repeated measures ANOVA showed that time in bed on different nights was significantly different, F(4.55, 250.07) = 9.35, p < 0.001, = 0.15. Pairwise comparison further revealed that time in bed from sleep 4 (M = 5.7 h, SD = 2.4 h) was significantly shorter than the other conditions (M = 7.8 h, SD = 2.0 h), ps < 0.05. However, when age was included in the ANOVA as a covariate, there was no significant effect of night of sleep, F(4.52, 244.08) = 0.92, p = 0.46, = 0.02, no significant effect of age, F(1, 54) = 2.42, p = 0.13, = 0.04, and no significant interaction, F(4.52, 244.08) = 0.26, p = 0.92, = 0.01.
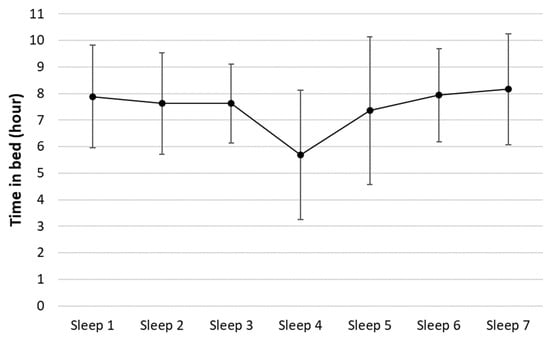
Figure 6.
Average time in bed for each night of sleep. Error bars represent standard deviation.
Since the sample size was larger than 30, one-sample t-tests were used to compare the time in bed results with the threshold value. The results showed that the time in bed of sleep 4 was not significantly different from 6 h, t(55) = 0.920, p = 0.36. The time in bed results from all the other nights were significantly longer than 6 h, t(55) values ≥ 3.66, ps ≤ 0.001. Shapiro–Wilk tests were performed and showed that the distributions of time in bed from four nights (sleeps 1, 2, 6, and 7) departed significantly from normality (W ≥ 0.13, ps ≤ 0.05). When the sample size is larger than 30, a t-test is generally regarded as robust even when the normality assumption is violated. Nevertheless, we also conducted one-sample Wilcoxon tests, and the results were in accordance with the t-tests for the four cases. Overall, these sleep results suggest that pilots flying using EAC may experience some moderate level of increased fatigue during the flight duty period.
3.4. Biomathematical Models
The FAID biomathematical model provides three fatigue compliance metrics, that is, KTL, FTL, and STL. KTL is the Karolinska sleepiness scale (KSS) tolerance level, usually a KTL greater than or equal to 7 is considered as an unacceptable fatigue level. FTL is the FAID tolerance level, which can be set to 80 to 100 depending on the risk factor of the task. STL is the sleep tolerance level. The recommended value of STL in the FAID software is 5 h of sleep in 24 h (previous 1 day), 12 h of cumulative sleep in 48 h (previous 2 days), and 50 h of cumulative sleep in 168 h (one week or 7 days). The compliance tests against the KTL and STL are reported in Section 3.1 and Section 3.3, respectively.
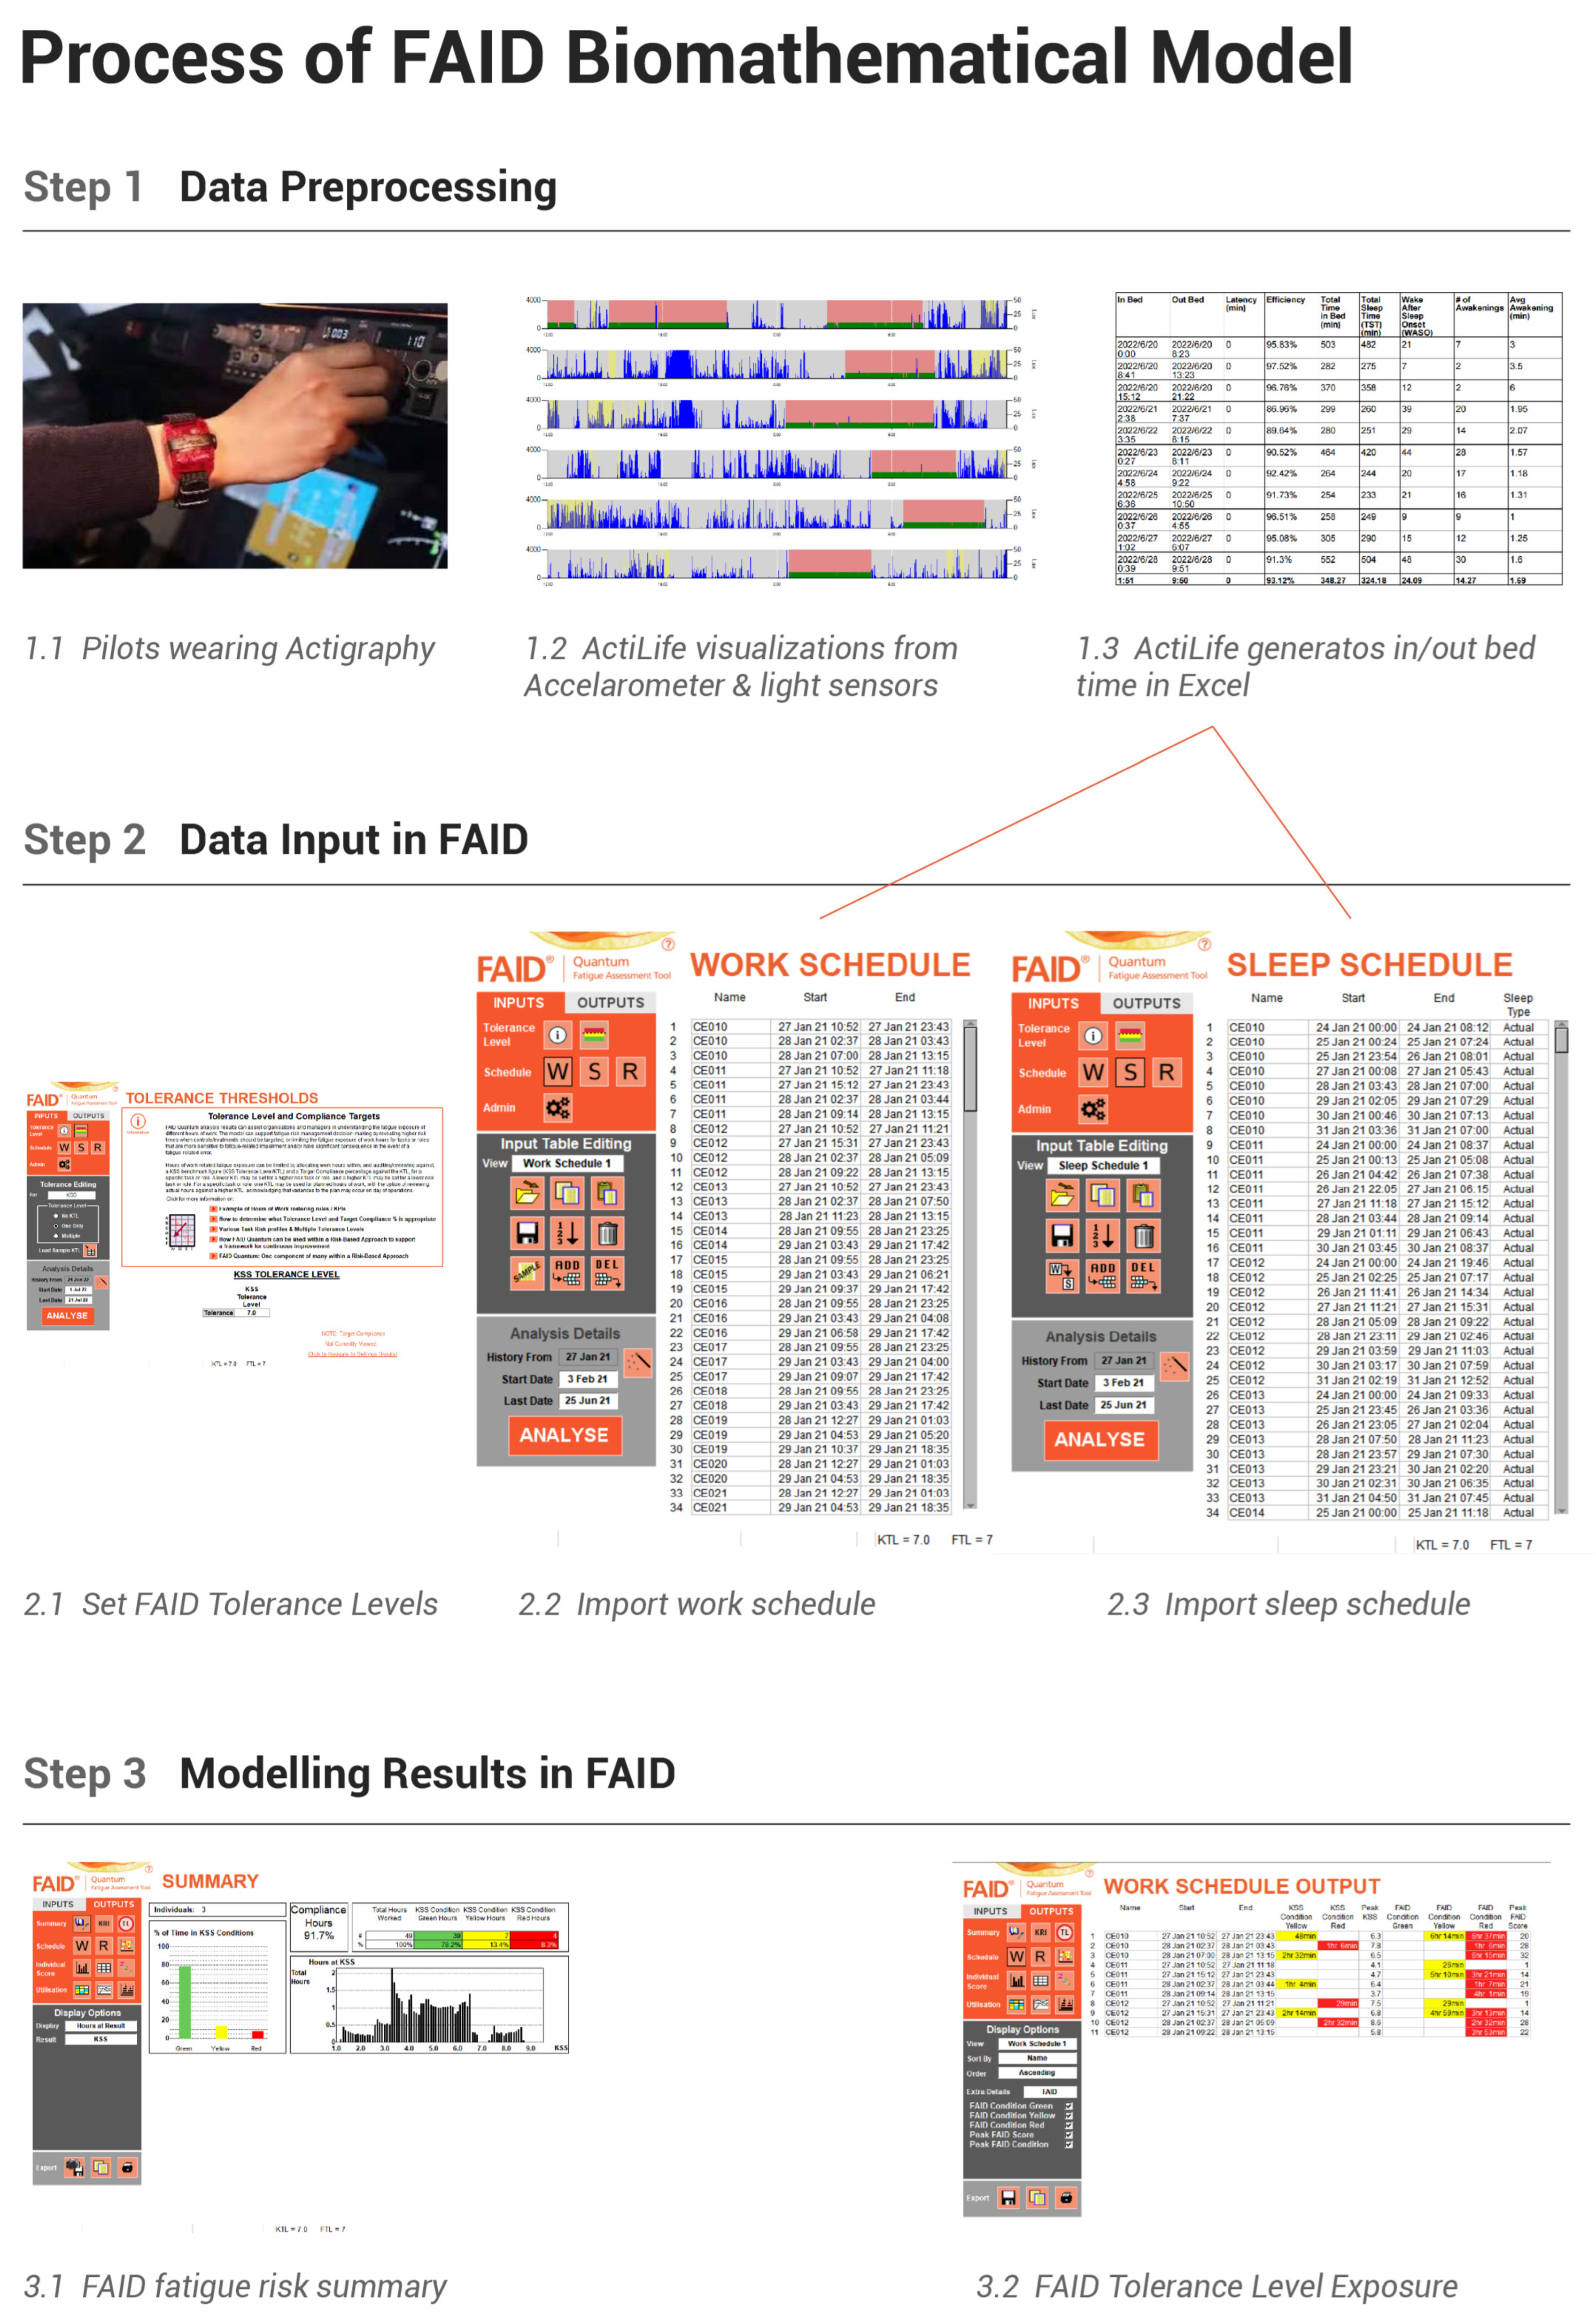
The process of the FAID biomathematical model (BMM) is visualized in Figure 7. The modeling takes three major steps: step 1, data preprocessing; step 2, data input into FAID software; and step 3, modeling the results in FAID. In step 1, participants’ hand motion data were collected by wearing the Actigraphy devices, then the data were retrieved and visualized in the accompanying ActiLife v6.13.4 software. Sleep periods were operationally defined as periods during which there were no large changes in the accelerometer sensors and dim light input for the light sensors. Next, the ActiLife generates in bed time and out of bed time in an Excel format. In step 2, the FAID software guides users to set the FAID tolerance levels (including FTL and KTL), then import the work schedule and sleep schedule based on the Excel file generated by the ActiLife. In step 3, the FAID software will provide a fatigue risk summary, which includes the percentage of time compliance reported in the next paragraph, and more detailed reports, such as the FAID tolerance level exposure.
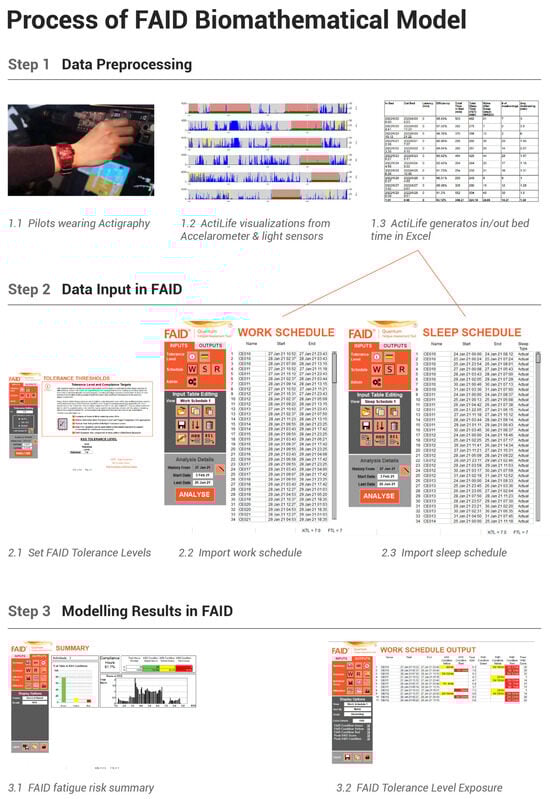
Figure 7.
Process of the FAID biomathematical model (BMM).
When using all of the following fatigue compliance criteria, including FTL = 100, KTL = 7, and STL of 6 h of sleep in 24 h and 13 h of cumulative sleep in 48 h, the FAID model predicted that the pilots were compliant with the fatigue risk requirement 91.3% of the time. If only using the KTL criterion or the STL criterion, the model predicted that the fatigue risk requirement would be met all of the time (100%). Using different criteria in the FAID software produced slightly different prediction results because the three criteria are not identical measurements. The KTL measures compliance using a 9-point scale with 7 as the tolerance level. The STL measures compliance in the previous one, two, and seven days. In contrast, the FTL examines compliance more frequently (every one hour by default). Thus, the FTL is a more sensitive measure of fatigue risk.
4. Discussion and Conclusions
During the COVID-19 epidemic, EAC scheduling was implemented as a temporary policy. In response to the need to assess fatigue levels from pilots in flights using EAC, we conducted this study and measured pilot fatigue using a multimodality approach including both subjective and objective measures of fatigue.
Overall, the results showed that EAC pilots experienced a moderate level of fatigue, especially near the end of both outbound and inbound flights, which is indicated by the KSS results from before descent and after landing (around 3.3 to 3.5 on the 9-point scale of KSS). Although this peak fatigue level is higher than the baseline of resting periods on post-flight day 2 and day 3, as shown in Figure 4, all of the average KSS values during flight duty periods were still significantly smaller than the threshold value of 7 on the KSS scale. The PVT results during the flight duty period, as shown in Figure 5, were not significantly different from pre-flight and post-flight baseline conditions. Time in bed during the flight duty period was reduced in comparison to pre-flight and post-flight baseline conditions, but not significantly different from the threshold of 6 h. The three criteria (KTL, FTL, and STL) provided by the FAID biomathematical model, as well as the “rule of thumb” 6 h for sleep quality in Section 3.3, are provided to the scientific community and worldwide aviation administrations as candidate factors for decisions on risk fatigue. In summary, the multimodal results and FAID modeling suggest that pilots flying under EAC scheduling experienced a moderate additional fatigue but were not excessively fatigued according to major sleep/fatigue criteria, such as subjective KSS, the psychomotor vigilance task, total sleep time, KTL, STL, and in some way the FTL too.
In additional to this scientific evidence of the fatigue risk, regulatory decisions on fatigue risk management systems (FRMS) also need to consider economic and political factors, especially during the COVID-19 situation. To allow communications, transportation, and economic activities to continue during the COVID-19 pandemic, the European Union Aviation Safety Agency, the Canadian Administration of Aviation, and the Federal Administration of Aviation of the United States allowed international flights from China using EAC scheduling to continue when these results were presented to them as evidence of potential fatigue risk. However, honestly speaking, scientific evidence on fatigue risk is only part of the evidence to make FRMS decisions, not the whole evidence.
The finding may be explained by the mechanism of sleep and the sleep strategy used by pilots to cope with flying across time zones. The new time zone’s light conditions and new sleep–wake patterns can alter a pilot’s original biorhythms [45,46]. For a traditional flight schedule, with one or two days of layover and rest at the destination, pilots have the option of either adhering to the departure sleep pattern or following the destination sleep pattern [47]. The majority of pilots prefer the destination sleep pattern, but this strategy was shown to be only moderately successful, scoring an average of 2.5 on a 5-point scale assessing sleep strategy effectiveness. The state of synchronization of the crew’s physiological clocks with the time zone in which they are located is called acclimatization [48]. Acclimatization usually takes at least 48 h, with full adaptation taking five to seven days [49,50]. Incomplete sleep adaptation can be counterproductive to sleep and alertness [47]. Therefore, if there is not enough time for pilots to acclimatize, it may be better for them to stick to the departure sleep strategy [51]. This type of direct return trip, without overnight overlay, is exactly what has been implemented in EAC. A previous example of the departure sleep strategy was the NASA fatigue program [52]. Their study found that for intercontinental flights across the meridian, from the U.S. West Coast to the United Kingdom, pilots who did not have a full two-day overnight rest, but instead just rested for one day and returned to their departure location the next day, still had their circadian rhythmic clocks synchronized with the U.S. West Coast clock. These pilots slept better and did not need more time to adjust to the sleep schedule after returning to the U.S. West Coast. This important result from the NASA technical report supports the EAC scheduling proposed by the Civil Aviation Administration of China (CAAC) [52].
It is necessary to assess fatigue using multimodal data combining subjective, objective, and physiological data, because each data type has its limitations. Regarding subjective fatigue self-report methods, they are susceptible to subjective factors such as individual differences, work motivation, overconfidence, and bias, making it difficult to develop a uniform standard. The correlation between self-assessment questionnaires and behavioral task performance is usually weak [19]. Due to the subjective nature of self-report measures, the assessment of pilot fatigue cannot rely on subjective fatigue measures alone. Although PVT is often used as an objective tool for fatigue detection (e.g., [53]), it also has its limitations, because PVT is a secondary task for pilots. As a secondary task, it does not directly measure pilots’ flight performance, and it may become a distraction when pilots are experiencing a high workload. Flight task performance is recorded by flight data recorders in many modern aircraft, but access to such data is usually strictly controlled due to data security and confidentiality. Sleep quality is a predictor of fatigue, because the most effective way to address fatigue is through sleep [50]. However, sleep quality measures are affected by many factors such as age, gender, and individual differences [54]. Therefore, it is difficult to establish a universal relationship between sleep quality and pilot fatigue [49]. Considering the advantages and disadvantages of the various fatigue measurements, the current study used a multimodality approach to achieve comprehensive measurement and assessment of pilot fatigue.
Biomathematical models are an important component of the multimodal assessment of civil aviation fatigue proposed by this study. Currently, the risk of flight crew fatigue is still managed by limiting flight crew duty and by rest time [6,7]. The research and application of individualized measures and psychological countermeasures for pilots’ fatigue status are weak, especially the lack of systematic fatigue management countermeasures [55]. Fatigue risk prediction based on biomathematical models can be a good solution for fatigue management practice [8].
However, the applicability of imported international biomathematical models to Chinese populations, especially Chinese civil flight crews, is questionable and has never been validated by real-world experimental data. The biomathematical models currently in use are based on experimental data from Westerners, and the application of Western biomathematical models to Chinese populations requires experimental validation due to the large differences in dietary structure, napping, and other sleep habits between the West and China. At the same time, most biomathematical models are based on sleep laboratory data, which are obtained by testing the objective behavioral performance and self-reporting of healthy participants under forced sleep deprivation [56]. To date, biomathematical models have rarely been validated for predictive effectiveness in realistic environments of aviation operations. Ideally, the validation of biomathematical models is achieved by comparing and analyzing large datasets of crew task performance [57,58]. However, in practice, the relatively low incidence of aviation accidents, as well as the confidentiality and cost of obtaining flight data, hinder the implementation of validity verification [7]. The most important contribution of this study, is that, in response to the conflict between the COVID-19 epidemic and international civil aviation policies, we provide multimodal data from the only large-scale study of fatigue in continuous international long-haul flights since the first human aircraft flight in 1903. This is of great value to aviation psychology, human factors, sleep science, and fatigue research.
Since the fatigue risk of the EAC is manageable and accepted by many civil aviation authorities, should this scheduling be continued in the future on international long-haul routes even after the COVID-19 era? Flight operating policies do not depend only on fatigue, but also on airline operating costs, as well as employee satisfaction and employee preferences. Extra augmented crew with continuous round-trip flights require more pilots to be paid and makes it difficult to manage human resources, and airlines need more pilots to maintain these operations [59]. Thus, whether extra augmented crew can be extended after the COVID-19 pandemic is a decision up to the airlines after a full consideration of fatigue risks, human resources, and operation costs.
Although we strived to collect data from 71 pilots flying internationally during the COVID-19 pandemic and provide multimodality data as possibly, and hopefully, comprehensive evidence, the current study is not without limitations. A limitation of the current study is that we were not able to recruit any female pilots as participants due to the availability of female pilots, time constraints, and limited resources. Females are under-represented as commercial airline pilots, and future studies are needed to include more female pilots to ensure the generalizability of the research findings. Another limitation is that we cannot provide evidence on whether this new extra augmented crew scheduling is more fatiguing than the currently accepted traditional augmented crew scheduling, as the new CAAC’s regulations on COVID-19 and fatigue risk control did not allow us to collect data from pilots flying using the traditional augmented crew scheduling. All of the pilots were scheduled using this new extra augmented crew scheduling. Future studies should consider performing a comparison investigation of the extra augmented crew scheduling versus traditional augmented crew scheduling.
The research questions, multimodality assessment methods, and real cross-country flight data reported in this study, while important, are not perfect. Future research can be considered to improve the study in several ways. First, this study failed to consider the fatigue of flight attendants. Flight attendants are not just service personnel, as often misunderstood by the general public, but important crew in charge of cabin safety. Second, existing biomathematical models predict fatigue levels of the “average lay person” without considering occupational differences and the types of tasks or work environments involved. Third, current biomathematical models and risk decisions do not consider the workload and risks associated with the different jobs of captains, co-pilots, and flight attendants. Working in demanding positions makes them more likely to be fatigued [60], and higher risk positions require more conservative fatigue tolerance levels [56]. Third, we have tried our best to identify criteria of acceptable fatigue risk, such as a Karolinska sleepiness scale tolerance score of 7, total sleep time of 6 h, and FAID tolerance level of 80 to 100. Unfortunately, no criteria for the psychomotor vigilance task have been identified to the best of our knowledge and efforts. Future studies may consider recommending justifiable criteria for measurements of response time and lapses in the psychomotor vigilance task as an alert of fatigue.
Author Contributions
Conceptualization, Y.L., C.L. and J.H; methodology, J.Z., Y.L. and J.H.; software, J.Z., Y.L. and J.H.; validation, S.C., Y.D. and Y.L.; formal analysis, Y.L., S.C. and J.Z. investigation, Y.L., J.H. and X.L.; resources, Y.L., C.L., X.L. and J.H.; data curation, S.C., J.Z., Y.D., Y.L. and J.H.; writing—original draft preparation, Y.L., C.L. and J.H.; writing—review and editing, Y.L., J.H., C.L. and X.L.; visualization, S.C., J.H. and J.Z.; supervision, J.H., Y.L. and X.L.; project administration, Y.L., C.L., J.H. and X.L.; funding acquisition Y.L., C.L., J.H. and X.L. All authors have read and agreed to the published version of the manuscript.
Funding
This work is supported by the National Natural Science Foundation of China (grant no. T2192933), the Aviation Safety and Security Association (number ASSA2022234).
Institutional Review Board Statement
The study was conducted in accordance with the Declaration of Helsinki, and approved by the Institutional Review Board of Tsinghua University (protocol code #35 and approved on 15 January 2020).
Informed Consent Statement
Informed consent was obtained from all subjects involved in the study.
Data Availability Statement
Restrictions apply to the availability of these data for safety and privacy concerns. Data was obtained from China Eastern Airline and are available by contacting the First Author with the permission of China Eastern Airline.
Acknowledgments
We acknowledge Pei Wang for her transcription of the data; We acknowledge Xu Lei for his sharing of his actigraphy devices; We are also grateful for Yueqin Hu for her statistical advices.
Conflicts of Interest
The authors declare no conflict of interest.
Disclaimers
The concepts and ideas expressed in this manuscript only reflect the personal understanding of the first and the corresponding authors, with the comments and help from other authors. The ideas do not reflect any ideas, attitudes, and administrative policies from any civil aviation administrations, including the Civil Aviation Administration of China (CAAC), the European Union Aviation Safety Agency, the Canadian Administration of Aviation, the Federal Administration of Aviation of the United States, and China Eastern Airline.
Abbreviations
| ANOVA | Analysis of variance |
| BMM | Biomathematical models |
| CAAC | Civil Aviation Administration of China |
| CAS | Circadian rhythm simulator |
| COVID-19 | Coronavirus disease 2019 |
| EAC | Extra augmented crew |
| EEG | Electroencephalogram |
| FAID | Fatigue audit InterDyne |
| fMRI | Functional magnetic resonance imaging |
| FTL | FAID score tolerance level |
| ICAO | International Civil Aviation Organization |
| KSS | Karolinska Sleepiness Scale |
| KTL | KSS tolerance level |
| NIR | Near infrared |
| NREM | Non-rapid eye movement |
| NTSB | National Transportation Safety Board |
| PVT | Psychomotor vigilance task |
| REM | Rapid eye movement |
| RT | Response time |
| SAFE | Fatigue assessment system |
| SAFTE | Sleep, activity, fatigue and task effectiveness model |
| STL | Sleep tolerance level |
References
- Gander, P.H.; Mulrine, H.M.; van den Berg, M.J.; Smith, A.A.; Signal, T.L.; Wu, L.J.; Belenky, G. Effects of sleep/wake history and circadian phase on proposed pilot fatigue safety performance indicators. J. Sleep Res. 2015, 24, 110–119. [Google Scholar] [CrossRef]
- Hartzler, B.M. Fatigue on the flight deck: The consequences of sleep loss and the benefits of napping. Accid. Anal. Prev. 2014, 62, 309–318. [Google Scholar] [CrossRef] [PubMed]
- Caldwell, J.A. Fatigue in aviation. Travel Med. Infect. Dis. 2005, 3, 85–96. [Google Scholar] [CrossRef]
- Co, E.; Gregory, K.; Johnson, J.; Rosekind, M. Crew Factors in Flight Operations XI: A Survey of Fatigue Factors in Regional Airline Operations. 1999. Available online: https://www.researchgate.net/publication/244456816_Crew_Factors_in_Flight_Operations_XI_A_Survey_of_Fatigue_Factors_in_Regional_Airline_Operations (accessed on 15 December 2022).
- Aljaberi, M.A.; Alareqe, N.A.; Alsalahi, A.; Qasem, M.A.; Noman, S.; Uzir, M.U.H.; Mohammed, L.A.; Fares, Z.E.A.; Lin, C.Y.; Abdallah, A.M.; et al. A cross-sectional study on the impact of the COVID-19 pandemic on psychological outcomes: Multiple indicators and multiple causes modeling. PLoS ONE 2022, 17, e0277368. [Google Scholar] [CrossRef] [PubMed]
- International Air Transport Association (IATA). International Civil Aviation Organization (ICAO), and International Federation of Air Line Pilots’ Associations (IFALPA) “Fatigue Risk Management Systems (FRMS) Implementation Guide for Operators”; International Civil Aviation Organization: Montreal, QC, Canada, 2011. [Google Scholar]
- International Civil Aviation Organization (ICAO). Manual for the Oversight of Fatigue Management Approaches (Doc 9966); Civil Aviation Organization: Montreal, QC, Canada, 2020. [Google Scholar]
- Gander, P.; Hartley, L.; Powell, D.; Cabon, P.; Hitchcock, E.; Mills, A.; Popkin, S. Fatigue risk management: Organizational factors at the regulatory and industry/company level. Accid. Anal. Prev. 2011, 43, 573–590. [Google Scholar] [CrossRef]
- Cabon, P.; Deharvengt, S.; Grau, J.Y.; Maille, N.; Berechet, I.; Mollard, R. Research and guidelines for implementing Fatigue Risk Management Systems for the French regional airlines. Accid. Anal. Prev. 2012, 45 (Suppl. S), 41–44. [Google Scholar] [CrossRef]
- Avers, K.; Johnson, W.B. A review of federal aviation administration fatigue research. Aviat. Psychol. Appl. Hum. Factors 2011, 1, 87–98. [Google Scholar] [CrossRef]
- Fletcher, A.; Hooper, B.; Dunican, I.; Kogi, K. Fatigue management in safety-critical operations: History, terminology, management system frameworks, and industry challenges. Rev. Hum. Factors Ergon. 2015, 10, 6–28. [Google Scholar] [CrossRef]
- Shahid, A.; Shen, J.; Shapiro, C.M. Measurements of sleepiness and fatigue. J. Psychosom. Res. 2010, 69, 81–89. [Google Scholar] [CrossRef] [PubMed]
- Rosekind, M.R.; Neri, D.F.; Dinges, D.F. From Laboratory to Flightdeck: Promoting Operational Alertness. Fatigue and Duty Limitations? An International Review. The Royal Aeronautical Society: London, UK, 1997; pp. 7.1–7.14. Available online: https://www.eurocockpit.be/sites/default/files/Rosekind-Neri-Dinges-1997.pdf (accessed on 15 December 2022).
- Luna, T.D.; French, J.; Mitcha, J.L. A study of USAF air traffic controller shiftwork: Sleep, fatigue, activity, and mood analyses. Aviat. Space Environ. Med. 1997, 68, 18–23. [Google Scholar]
- Marcus, J.H.; Rosekind, M.R. Fatigue in transportation: NTSB investigations and safety recommendations. Inj. Prev. 2017, 23, 232–238. [Google Scholar] [CrossRef] [PubMed]
- Kharoufah, H.; Murray, J.; Baxter, G.; Wild, G. A review of human factors causations in commercial air transport accidents and incidents: From to 2000–2016. Prog. Aerosp. Sci. 2018, 99, 1–13. [Google Scholar] [CrossRef]
- Bourgeois-Bougrine, S.; Carbon, P.; Gounelle, C.; Mollard, R.; Coblentz, A. Perceived fatigue for short- and long-haul flights: A survey of 739 airline pilots. Aviat. Space Environ. Med. 2003, 74, 1072–1077. [Google Scholar]
- Mallis, M.M.; Mejdal, S.; Nguyen, T.T.; Dinges, D.F. Summary of the key features of seven biomathematical models of human fatigue and performance. Aviat. Space Environ. Med. 2004, 75 (Suppl. S3), A4–A14. [Google Scholar] [PubMed]
- Dang, J.; King, K.M.; Inzlicht, M. Why are self-report and behavioral measures weakly correlated? Sci. 2020, 24, 267–269. [Google Scholar] [CrossRef] [PubMed]
- Ministry of Transport of the People’s Republic of China. Decision on Amending CCAR121, C.A.A.C. 2021. Available online: http://www.caac.gov.cn/XXGK/XXGK/MHGZ/202104/P020210506533065323228.pdf (accessed on 20 December 2022).
- Akerstedt, T.; Gillberg, M. Subjective and objective sleepiness in the active individual. Int. J. Neurosci. 1990, 52, 29–37. [Google Scholar] [CrossRef]
- Hursh, S.R.; Raslear, T.G.; Kaye, A.S.; Fanzone, J. Validation and Calibration of a Fatigue Assessment Tool for Railroad Work Schedules, Final Report (No. DOT/FRA/ORD-08/04); United States, Department of Transportation, Federal Railroad Administration, Office of Research and Development: Washington, DC, USA, 2007. Available online: https://railroads.dot.gov/sites/fra.dot.gov/files/fra_net/2899/ord0804.pdf (accessed on 20 December 2022).
- Kandelaars, K.J.; Dorrian, J.; Fletcher, A.; Roach, G.D.; Dawson, D. A review of bio-mathematical fatigue models: Where to from here? Presented at the 6th International Conference on Fatigue Management in Transportation, Seattle, WA, USA, 11–15 September 2005; Available online: https://www.researchgate.net/publication/259010642_A_review_of_biomathematical_fatigue_models_Where_to_from_here (accessed on 20 December 2022).
- Belyavin, A.J.; Spencer, M.B. Modeling performance and alertness: The QinetiQ approach. Aviation Space Environ. Med. 2004, 75 (Suppl. 3), A93–A106. [Google Scholar]
- Achermann, P. The two-process model of sleep regulation revisited. Aviat. Space Environ. Med. 2004, 75 (Suppl. S3), A37–A43. [Google Scholar]
- Moore-Ede, M.; Heitmann, A.; Guttkuhn, R.; Trutschel, U.; Aguirre, A.; Croke, D. Circadian alertness simulator for fatigue risk assessment in transportation: Application to reduce frequency and severity of truck accidents. Aviat. Space Environ. Med. 2004, 75 (Suppl. S3), A107–A118. [Google Scholar]
- Borbély, A.A. A two process model of sleep regulation. Hum. Neurobiol. 1982, 1, 195–204. [Google Scholar]
- Akerstedt, T.; Folkard, S. Predicting duration of sleep from the three process model of regulation of alertness. Occup. Environ. Med. 1996, 53, 136–141. [Google Scholar] [CrossRef]
- Miley, A.Å.; Kecklund, G.; Åkerstedt, T. Comparing two versions of the Karolinska Sleepiness Scale (KSS). Sleep Biol. Rhythm. 2016, 14, 257–260. [Google Scholar]
- Kaida, K.; Takahashi, M.; Åkerstedt, T.; Nakata, A.; Otsuka, Y.; Haratani, T.; Fukasawa, K. Validation of the Karolinska sleepiness scale against performance and EEG variables. Clinical Neurophysiol. 2006, 117, 1574–1581. [Google Scholar] [CrossRef]
- Akerstedt, T.; Anund, A.; Axelsson, J.; Kecklund, G. Subjective sleepiness is a sensitive indicator of insufficient sleep and impaired waking function. J. Sleep Res. 2014, 23, 240–252. [Google Scholar] [CrossRef] [PubMed]
- Dinges, D.F.; Powell, J.W. Microcomputer analyses of performance on a portable, simple visual RT task during sustained operations. Behav. Res. Methods Instrum. Comput. 1985, 17, 652–655. [Google Scholar] [CrossRef]
- Arsintescu, L.; Kato, K.H.; Hilditch, C.J.; Gregory, K.B.; Flynn-Evans, E. Collecting sleep, circadian, fatigue, and performance data in complex operational environments. J. Vis. Exp. 2019, 150, e59851. [Google Scholar] [CrossRef]
- Arsintescu, L.; Kato, K.H.; Cravalho, P.F.; Feick, N.H.; Stone, L.S.; Flynn-Evans, E.E. Validation of a touchscreen psychomotor vigilance task. Accid. Anal. Prev. 2019, 126, 173–176. [Google Scholar] [CrossRef] [PubMed]
- Grant, D.A.; Honn, K.A.; Layton, M.E.; Riedy, S.M.; Van Dongen, H.P.A. 3-minute smartphone-based and tablet-based psychomotor vigilance tests for the assessment of reduced alertness due to sleep deprivation. Behav. Res. Methods 2017, 49, 1020–1029. [Google Scholar] [CrossRef]
- Roach, G.D.; Dawson, D.; Lamond, N. Can a shorter psychomotor vigilance task be used as a reasonable substitute for the ten-minute psychomotor vigilance task? Int. 2006, 23, 1379–1387. [Google Scholar] [CrossRef]
- Matsangas, P.; Shattuck, N.L. Hand-held and wrist-worn field-based PVT devices vs. the standardized laptop PVT. Aerosp. Med. Hum. Perform. 2020, 91, 409–415. [Google Scholar] [CrossRef]
- Khitrov, M.Y.; Laxminarayan, S.; Thorsley, D.; Ramakrishnan, S.; Rajaraman, S.; Wesensten, N.J.; Reifman, J. PC-PVT: A platform for psychomotor vigilance task testing, analysis, and prediction. Behav. Res. Methods 2014, 46, 140–147. [Google Scholar] [CrossRef]
- Gander, P.H.; Signal, T.L.; van den Berg, M.J.; Mulrine, H.M.; Jay, S.M.; Mangie, C.J. In-flight sleep, pilot fatigue and Psychomotor Vigilance Task performance on ultra-long range versus long range flights. J. Sleep Res. 2013, 22, 697–706. [Google Scholar] [CrossRef]
- Svensson, T.; Saito, E.; Svensson, A.K.; Melander, O.; Orho-Melander, M.; Mimura, M.; Rahman, S.; Sawada, N.; Koh, W.P.; Shu, X.O.; et al. Association of sleep duration with all- and major-cause mortality among adults in Japan, China, Singapore, and Korea. JAMA Netw. Open 2021, 4, e2122837. [Google Scholar] [CrossRef] [PubMed]
- Darwent, D.J.; Dawson, D.; Roach, G. A model of shiftworker sleep/wake behaviour. Accid. Anal. Prev. 2012, 45 (Suppl. S), 6–10. [Google Scholar] [CrossRef] [PubMed]
- Dawson, D.; Reid, K. Fatigue, alcohol and performance impairment. Nature 1997, 388, 235. [Google Scholar] [CrossRef] [PubMed]
- Fletcher, A.; Lamond, N.; Van Den Heuvel, C.J.; Dawson, D. Prediction of performance during sleep deprivation and alcohol intoxication using a quantitative model of work-related fatigue. Sleep Res. 2003, 5, 67–75. [Google Scholar]
- Cohen, J. Statistical power analysis and research results. Am. Educ. Res. J. 1973, 10, 225–229. [Google Scholar] [CrossRef]
- Bano-Otalora, B.; Martial, F.; Harding, C.; Bechtold, D.A.; Allen, A.E.; Brown, T.M.; Belle, M.D.C.; Lucas, R.J. Bright daytime light enhances circadian amplitude in a diurnal mammal. Proc. Natl. Acad. Sci. USA 2021, 118, e2100094118. [Google Scholar] [CrossRef]
- Meijer, J.H.; Schaap, J.; Watanabe, K.; Albus, H. Multiunit activity recordings in the suprachiasmatic nuclei: In vivo versus in vitro models. Brain Res. 1997, 753, 322–327. [Google Scholar] [CrossRef]
- Gander, P.H.; Rosekind, M.R.; Gregory, K.B. Flight crew fatigue VI: A synthesis. Aviat. Space Environ. Med. 1998, 69 (Suppl. S9), B49–B60. [Google Scholar]
- Mecham, J. Requirements Analysis and Architecture for an Operational Study of Fatigue in USAF Mobility Aircrew. Theses and Dissertations. 2021. Available online: https://scholar.afit.edu/etd/5099 (accessed on 15 December 2022).
- Belenky, G.; Wesensten, N.J.; Thorne, D.R.; Thomas, M.L.; Sing, H.C.; Redmond, D.P.; Russo, M.B.; Balkin, T.J. Patterns of performance degradation and restoration during sleep restriction and subsequent recovery: A sleep dose-response study. J. Sleep Res. 2003, 12, 1–12. [Google Scholar] [CrossRef] [PubMed]
- Rupp, T.L.; Wesensten, N.J.; Bliese, P.D.; Balkin, T.J. Banking sleep: Realization of benefits during subsequent sleep restriction and recovery. Sleep 2009, 32, 311–321. [Google Scholar] [CrossRef] [PubMed]
- Roach, G.D.; Petrilli, R.M.A.; Dawson, D.; Lamond, N. Impact of Layover Length on Sleep, Subjective Fatigue Levels, and Sustained Attention of Long-Haul Airline Pilots. Chraonobiol. Int. 2012, 29, 580–586. [Google Scholar] [CrossRef]
- Gander, P.H.; Graeber, R.C.; Foushee, H.C.; Lauber, J.K.; Connell, L.J. Crew Factors in Flight Operations II: Psychophysiological Responses to Short-Haul Air Transport Operations (NASA-TM-108856). 1994. Available online: https://ntrs.nasa.gov/citations/19950009235 (accessed on 20 December 2022).
- Lee, I.S.; Bardwell, W.A.; Ancoli-Israel, S.; Dimsdale, J.E. Number of lapses during the psychomotor vigilance task as an objective measure of fatigue. J. Clinical Sleep Med. 2010, 6, 163–168. [Google Scholar] [CrossRef]
- Gander, P.H.; Marshall, N.S.; Harris, R.; Reid, P. The Epworth Sleepiness Scale: Influence of age, ethnicity, and socioeconomic deprivation. Epworth Sleepiness scores of adults in New Zealand. Sleep 2005, 28, 249–253. [Google Scholar] [CrossRef]
- International Air Transport Association. Fatigue Risk Management Systems: Implementation Guide for Operators, 1st ed.; International Air Transport Association: Montréal, QC, Canada, 2011. [Google Scholar]
- Dawson, D.; Noy, Y.I.; Härmä, M.; Akerstedt, T.; Belenky, G. Modelling fatigue and the use of fatigue models in work settings. Accid. Anal. Prev. 2011, 43, 549–564. [Google Scholar] [CrossRef] [PubMed]
- Federal Aviation Administration. Fatigue Risk Management Systems for Aviation Safety Circular 120-103A; US Department of Transportation: Washington, DC, USA, 2013. [Google Scholar]
- European Union Aviation Safety Agency. European Union Aviation Safety Agency J.K. Effectiveness of Flight Time Limitation (FTL). 2019. Available online: https://www.easa.europa.eu/document-library/general-publications/effectiveness-flight-time-limitation-ftl-report (accessed on 20 December 2022).
- Wingelaar-Jagt, Y.Q.; Wingelaar, T.T.; Riedel, W.J.; Ramaekers, J.G. Fatigue in aviation: Safety risks, preventive strategies and pharmacological interventions. Front. Physiol. 2021, 12, 712628. [Google Scholar] [CrossRef]
- Morris, C.H.; Leung, Y.K. Pilot mental workload: How well do pilots really perform? Ergonomics 2006, 49, 1581–1596. [Google Scholar] [CrossRef]


Disclaimer/Publisher’s Note: The statements, opinions and data contained in all publications are solely those of the individual author(s) and contributor(s) and not of MDPI and/or the editor(s). MDPI and/or the editor(s) disclaim responsibility for any injury to people or property resulting from any ideas, methods, instructions or products referred to in the content. |
© 2023 by the authors. Licensee MDPI, Basel, Switzerland. This article is an open access article distributed under the terms and conditions of the Creative Commons Attribution (CC BY) license (https://creativecommons.org/licenses/by/4.0/).