Article

Heat Transfer and Flow Structure Characteristics of Regenerative Cooling in a Rectangular Channel Using Supercritical CO2

Research Institute of Aerospace Technology, Central South University, Changsha 410012, China
*
Author to whom correspondence should be addressed.
Aerospace 2023, 10(6), 564; https://doi.org/10.3390/aerospace10060564
Submission received: 12 May 2023 / Revised: 3 June 2023 / Accepted: 14 June 2023 / Published: 16 June 2023
(This article belongs to the Special Issue Heat Transfer, Combustion and Flow Dynamics in Propulsion Systems)

Abstract

:
At an extremely high Mach number, the regenerative cooling of traditional kerosene cannot meet the requirement of the heat sink caused by aerodynamic heating and internal combustion in a scramjet propulsion system. As a supplement of traditional regenerative cooling, supercritical CO2 is regarded as an effective coolant in severe heating environments due to its excellent properties of heat and mass transportation. In this paper, the heat transfer and flow structure characteristics of regenerative cooling in a rectangular channel using supercritical CO2 are analyzed numerically using a validated model. The effect of heat flux magnitude, nonuniform heat flux, acceleration and buoyancy and flow pattern are considered to reveal the regenerative cooling mechanism of supercritical CO2 in the engine condition of a scramjet. The results indicate that the heat transfer deterioration phenomenon becomes obvious in the cooling channel loaded with relatively high heat flux. Compared with the cooling channels loaded with increased heat flux distribution, the maximum temperature increased for the channel loaded with decreased heat flux distributions. When larger acceleration is applied, a relatively lower wall temperature distribution and higher heat transfer coefficients are obtained. The wall temperature distribution becomes more uniform and the high-temperature region is weakened when the coolants in adjacent channels are arranged as a reversed flow pattern. Overall, the paper provides some references for the utilization of supercritical CO2 in regenerative cooling at an extremely high Mach number in a scramjet.

1. Introduction

Due to its sharply varied thermophysical properties including density, thermal capacity, thermal conductivity and viscosity near the critical point, supercritical CO2 has superior heat and mass transfer capabilities [1,2,3]. In addition, as a type of nontoxic and harmless working medium, its accessible and low-cost characteristics make it widely used in power plants and nuclear reactors, as well as in many industrial and engineering applications [4,5]. In recent years, the complex thermal and hydraulic phenomena for supercritical CO2 flowing in the channels have attracted a lot of attention [6,7]. The pressure–temperature diagram of supercritical CO2 is shown in Figure 1.
Many researchers have carried out fundamental investigations in simplified tubes to analyze the flow and heat transfer characteristics of supercritical CO2 [8,9,10,11,12,13,14,15,16,17,18]. Yan et al. [8] numerically investigated the convective heat transfer characteristics of supercritical CO2 in vertical tubes loaded with uniform and nonuniform heat flux. They found that by adopting nonuniform heat flux, the wall temperature is reduced due to smaller thermal resistance which can be explained by pseudo-phase transition theory. Khalesi et al. [9] numerically studied the flow and heat transfer characteristics of supercritical CO2 in a rectangular microchannel loaded with uniform heat flux. They pointed out that the Nusselt number was not affected by the Reynold number in the laminar regime at high operating pressures. Pandey et al. [10] improved the two-layer model for the heat transfer of supercritical CO2 in a heated pipe by taking acceleration and buoyancy effects into consideration. Additionally, the results were refined and validated using direct numerical simulation data and experimental data. It was found that thermal conductivity and viscosity have a limiting effect on heat transfer. Zhang et al. [11] numerically investigated the mechanisms for the heat transfer behaviors of supercritical CO2. They analyzed the formation mechanism of the heat-transfer-enhanced phenomenon for low mass flux cases and heat transfer deterioration (HTD) phenomenon for normal mass flux cases. The results indicated that the heat conduction process of the boundary layer played an important role in the overall heat transfer of supercritical CO2.
In addition to fundamental research, many researchers also performed investigations of supercritical CO2 applied in heat exchangers [19,20,21], heat sinks [21,22,23] and other industrial devices [24,25,26]. Chu et al. [21] carried out experiments based on a supercritical CO2–water experiment platform to test the thermohydraulic performance of a printed circuit heat exchanger. The results indicated that the supercritical CO2 had better heat transfer ability than water and the printed circuit heat exchanger had better heat transfer performance under a higher pressure condition. Awais et al. [23] employed supercritical CO2 as a coolant to enhance the heat transfer performance of minichannel heat sink instead of water fluid. The results revealed that using supercritical CO2 as a coolant brought about better performance and lower pressure loss compared with water. Cheng et al. [24] experimentally investigated the heat transfer performance of a precooler for the supercritical CO2 Brayton cycle. The effects of the inlet Reynold numbers and temperature on thermal–hydraulic characteristics and pressure loss were analyzed. The effectiveness of the precooler was also attained. Muto and Kato [26] optimized a cycle scheme of a direct cycle using a dual-expansion supercritical CO2 gas turbine cycle for nuclear power generation. Evan P. et al. [25] conducted a numerical study of a high-temperature regenerator within a supercritical CO2 recompression Brayton cycle.
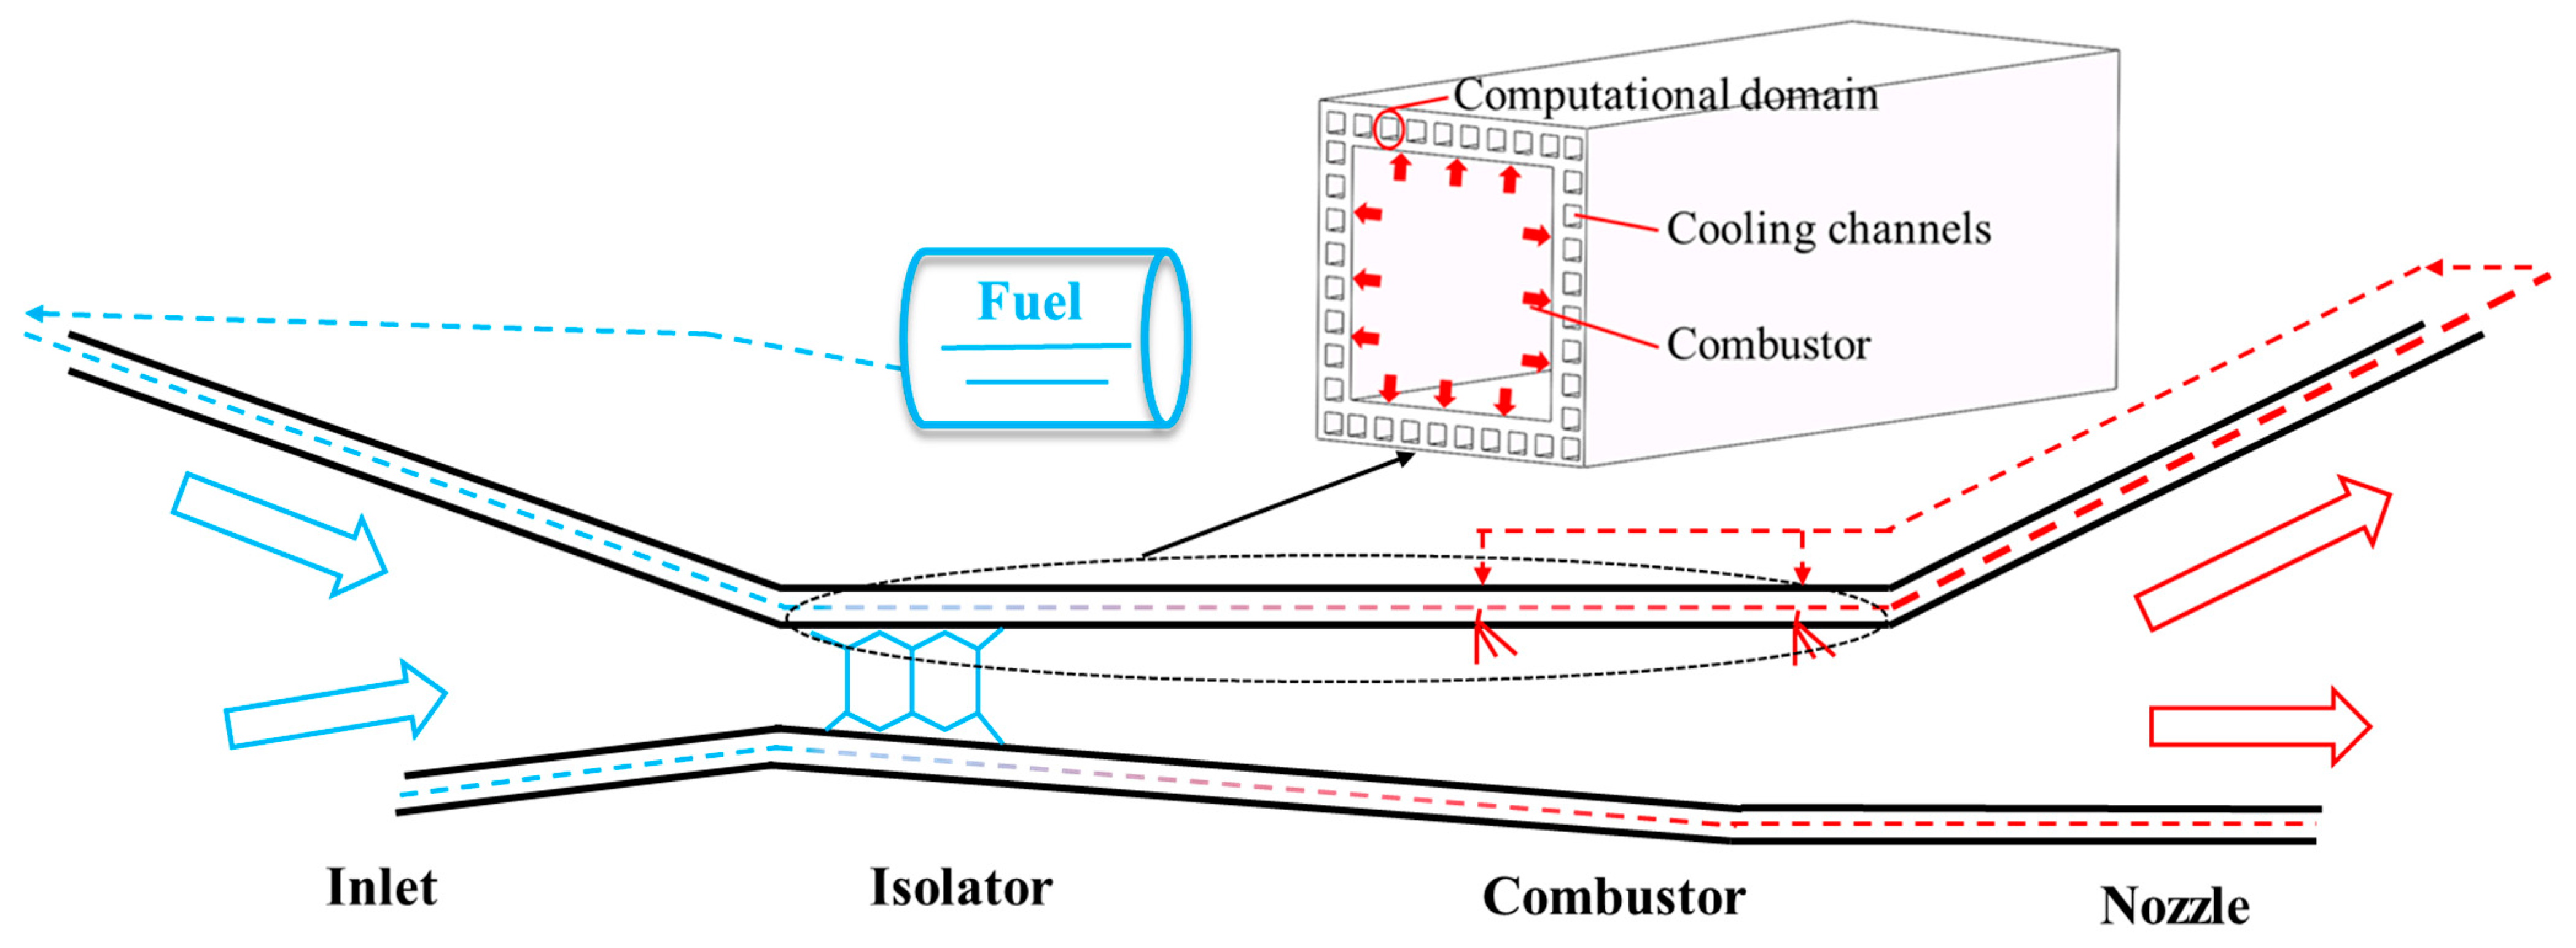
As the main component of a hypersonic vehicle, the scramjet operates in severe thermal environments [27]. Using fuel as the coolant, regenerative cooling is regarded as being an effective and reliable cooling method with a lot of channels arranged inside the combustor wall [28,29], as shown in Figure 2. The fuel flows through the channels absorbing excess heat from combustion chambers and then enters the chamber to proceed with the combustion process [30]. Many works have been conducted to investigate the cooling performance of regenerative cooling using supercritical hydrocarbon fuel in terms of effects of nonuniform heat flux [30,31,32], flow pattern [33] and acceleration and buoyancy [34,35,36,37,38]. Liu et al. [30] investigated the heat transfer performance and flow structure of supercritical n-decane in a rectangular channel under nonuniform heat flux. The results revealed that the wall temperature distribution was sensitive to the heat flux distribution while the outlet temperature was not affected by nonuniform heat flux. Zhang et al. [33] proposed a bi-directional flow pattern in order to optimize the cooling performance of supercritical hydrocarbon fuel. They compared the temperature distribution of the bi-directional flow pattern with that of the traditional co-directional flow pattern and found that the adoption of a bi-directional flow pattern can improve the cooling performance whilst maintaining simple structures. Jia et al. [35] investigated the effects of gravity on the flow characteristics of supercritical n-decane in a rectangular channel. By observing the streamlines perpendicular to the flow direction, they found that the induced small recirculation zones which indicated the buoyancy played an important role in the mixing of hot and cold fluids.
However, at extremely high Mach numbers, high-efficiency active cooling technology is urgently needed for a scramjet propulsion system [39,40,41]. Traditional hydrocarbon fuel cannot supply enough heat sink for the heat load produced by Mach numbers > 8, and supercritical CO2 is promising to act as an additional coolant for regenerative cooling.
In this work, the flow structure and heat transfer characteristics of supercritical CO2 under 8 MPa in a regenerative cooling channel with a rectangular cross-section are analyzed. To study the effects of uniform and nonuniform heat flux distribution on flow structure and heat transfer characteristics, different kinds of heat flux magnitudes ranging from 1.5 to 6 MW/m2 and linearly changed (increased and decreased) heat flux distributions with the same average value of 1.5 MW/m2 are imposed on the bottom wall for a single channel. Considering the different real flight states of regenerative cooling channels, the effects of acceleration and buoyancy on flow structure and heat transfer characteristics are considered at different magnitudes and direction with values ranging from −3 g to 3 g. In addition, the effects of flow patterns on heat transfer characteristics are analyzed by adopting two adjacent channels with the same and reversed flow directions.

2. Model Description

2.1. Geometry Description and Grid Conditions

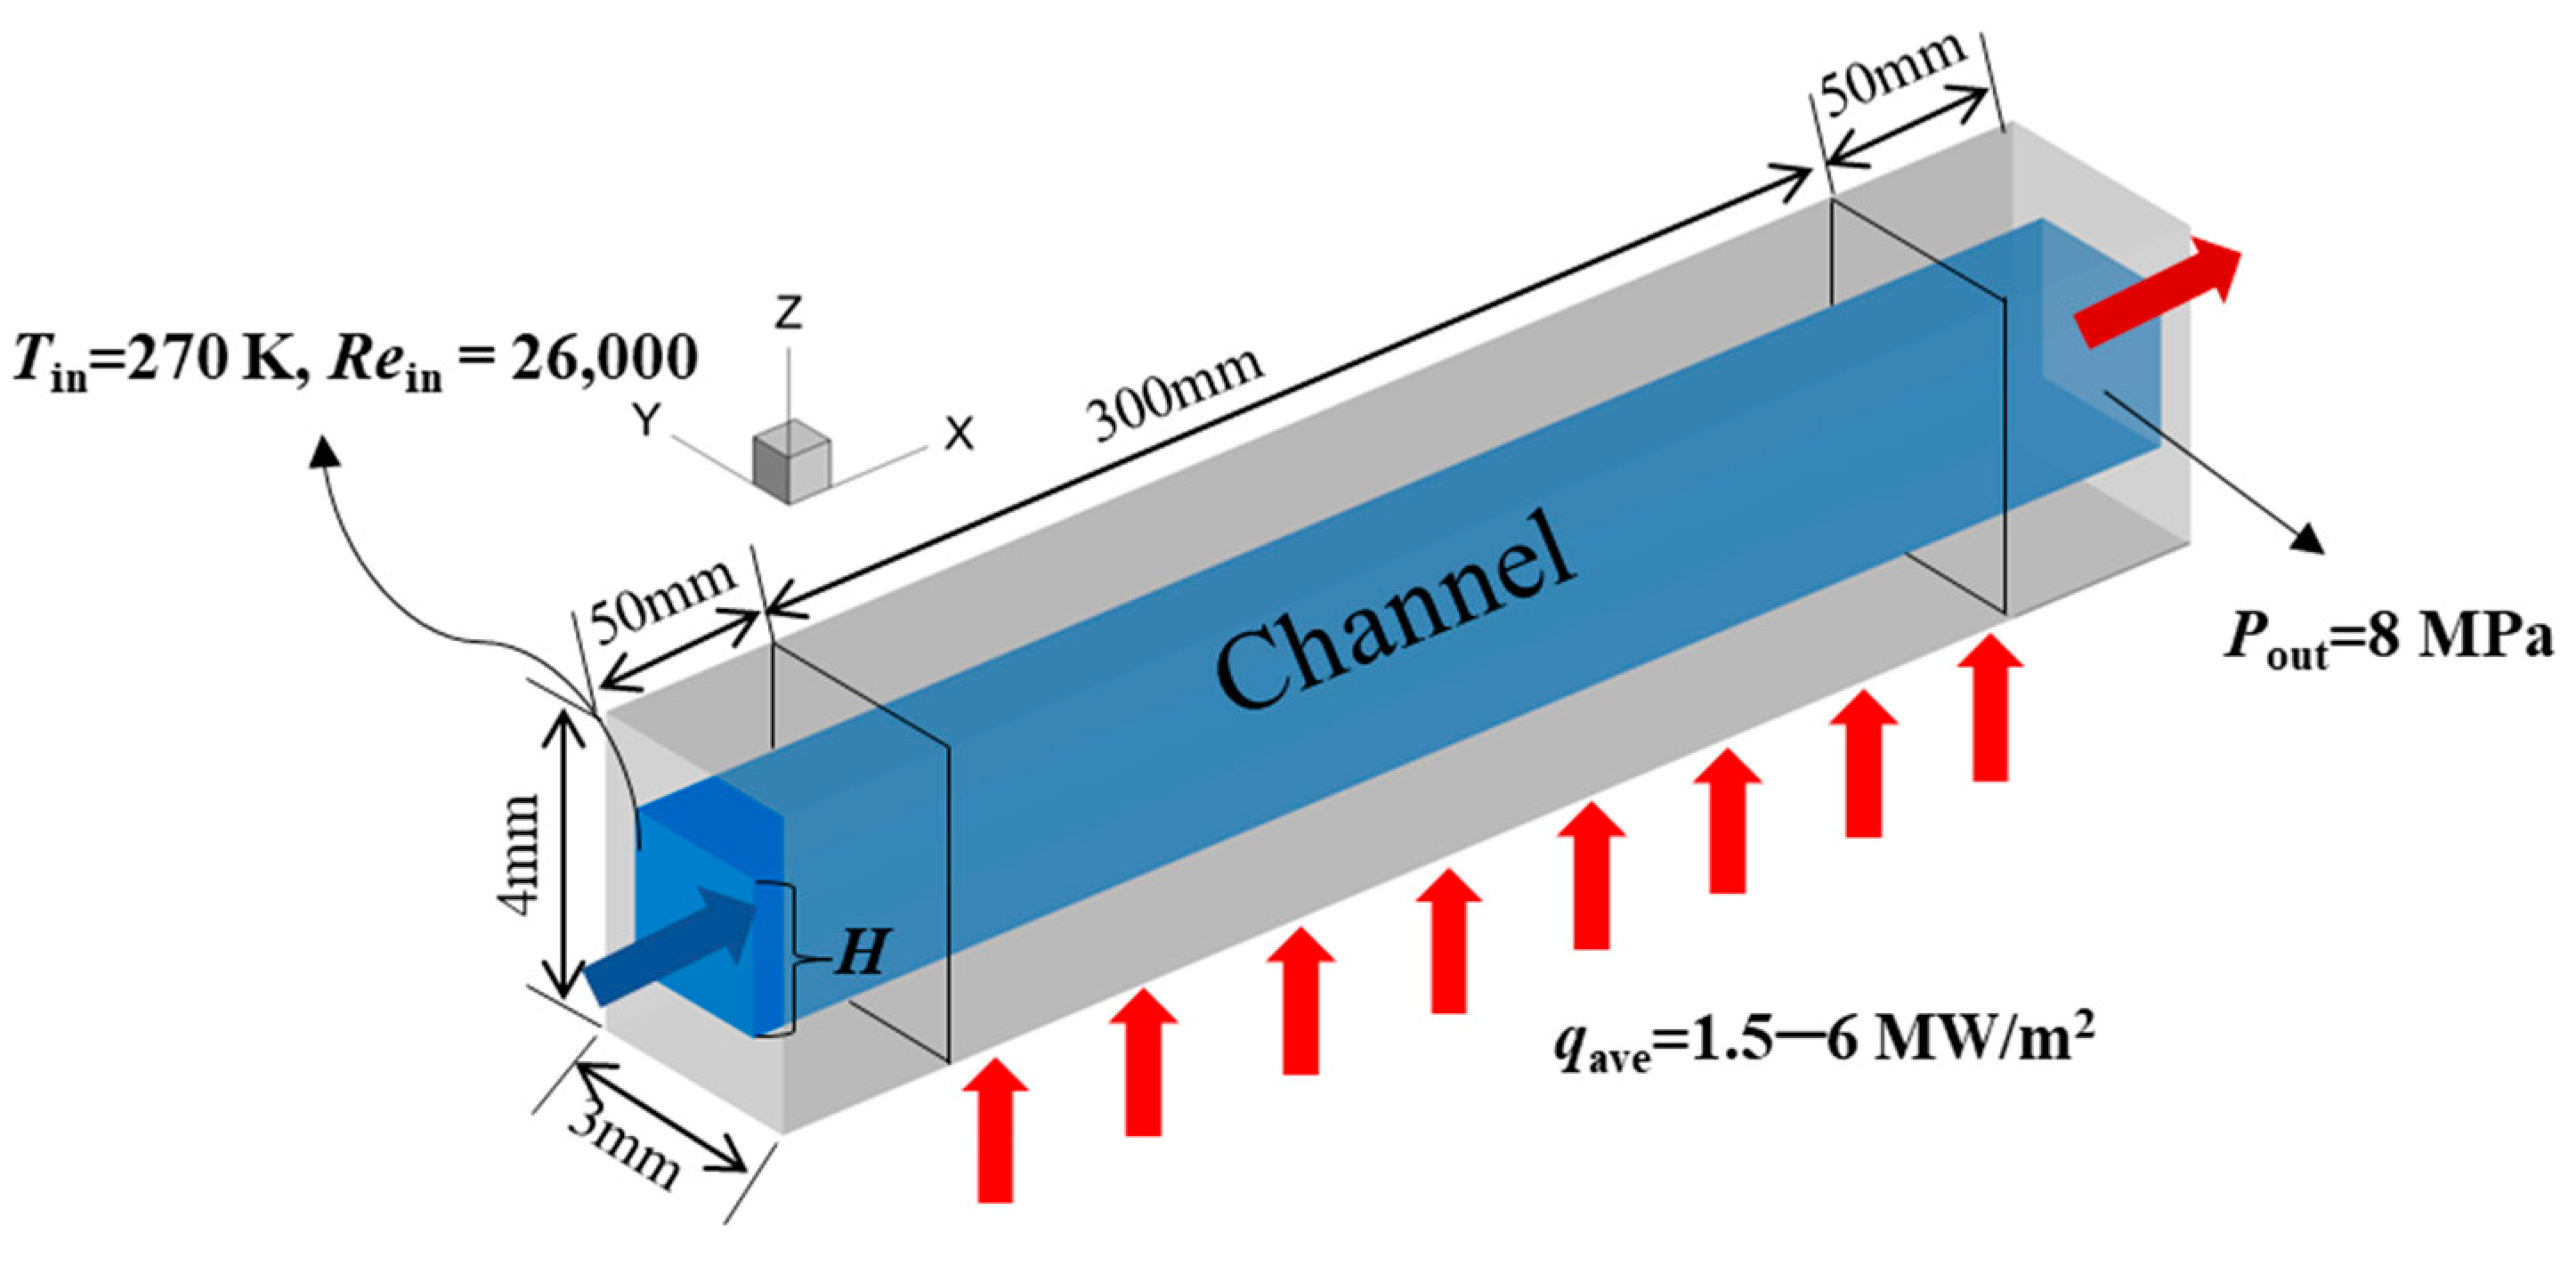
For a typical regenerative cooling process, there are a lot of cooling channels set inside the combustor wall to absorb excess heat from the combustion chambers. Considering that each cooling channel is heated equally, a single cooling channel with a rectangular cross-section was selected as the computational domain for convenience. Uniform and nonuniform heat flux boundaries were imposed on the bottom wall of the channel to study the effect of axial heat flux on flow structures and heat transfer performance in the cooling channel. The cross-section size of the fluid region was 2 mm × 2 mm. The length of the heated section was 300 mm. Additionally, two 50 mm extended sections without heat flux loaded were, respectively, set at the beginning and the end of the channel to ensure a fully developed flow process. Taking the influence of fluid–solid coupling and the actual geometry of the regenerative cooling channel into account, there were four solid walls placed around the fluid region, with a height of 1 mm (z-axis) and width of 0.5 mm (y-axis), as shown in Figure 3.
Structural grids were used to discretize the computational domain, and the cross-section is shown in Figure 4. To meet the accurate and reliable requirement, the size of the first layer and the growth rate of the system were set as 0.01 mm and 1.1, respectively. Additionally, the corresponding wall y+ of the simulation was below 1 to meet the requirement of the k-ω SST turbulence model.

2.2. Solution Methods and Convergence Criterion

The commercial software ANSYS FLUENT 19.2 was employed to carry out the simulations. The governing equations included mass, momentum and energy conservation equations. The finite volume method was adopted to discretize the governing equations. A double-precision pressure-based steady solver was applied to obtain the flow and heat transfer performance of supercritical CO2 in the cooling channel. In addition, the second-order upwind scheme was adopted for spatial discretization. The SIMPLEC algorithm was used to couple the velocity and pressure.
The simulations were regarded as being converged when the residuals of the continuity equation, velocity components, turbulent kinetic energy and specific energy dissipation rate items were less than 10−5 and the residual of the energy equation was less than 10−8. It took about 10,000–20,000 iterations before reaching convergence.

2.3. Boundary Conditions and Thermophysical Properties

Three-dimensional flow and heat transfer was performed in the rectangular channel introduced in Section 2.1. The mass flow rate of the inlet was set as 0.0032 kg/s (Reinlet = 26,000) with an initial temperature of 270 K. The gauge pressure of the outlet was set as 8 MPa and the effect of pressure variations on thermophysical properties was neglected. The average heat flux was imposed on the bottom heated with a value of 1.5 MW/m2–6.0 MW/m2 and the other walls were set as adiabatic walls. To better analyze the flow structure in the passage, gravity and acceleration were considered in the streamwise–normal section (x-z section). Additionally, the basic case was named Case A1. Four kinds of influence factors including heat flux magnitude, nonuniform heat flux distribution, acceleration and buoyancy effects and flow patterns under engine-like conditions were studied in this paper.
To study the effect of heat flux magnitude and distribution on flow structures and the heat transfer characteristics of supercritical CO2 in regenerative cooling channels, different kinds of heat flux magnitudes (Cases A1–A3), increased heat flux distribution (Cases B1–B3) and decreased heat flux distribution (Cases B4–B6) were imposed on the bottom wall for a single channel. The heat flux magnitude ranged from 1.5 to 6 MW/m2 for Case A1 to Case A3. For nonuniform heat flux distributions, with the same average heat flux of 1.5 MW/m2, the linear variation ratios for the heat flux distribution function were different. Under the consideration of different real flight environments, the effects of acceleration and buoyancy were considered at different magnitudes and directions with values ranging from −3 g to 3 g, named as Cases C1 to C7, respectively. Finally, the effects of flow patterns on the temperature distribution and heat transfer characteristics were analyzed by adopting two adjacent channels with the same (Case D1) or reversed (Case D2) flow directions. The details of the heat flux distribution, acceleration values and flow pattern of all of the cases are listed in Table 1.
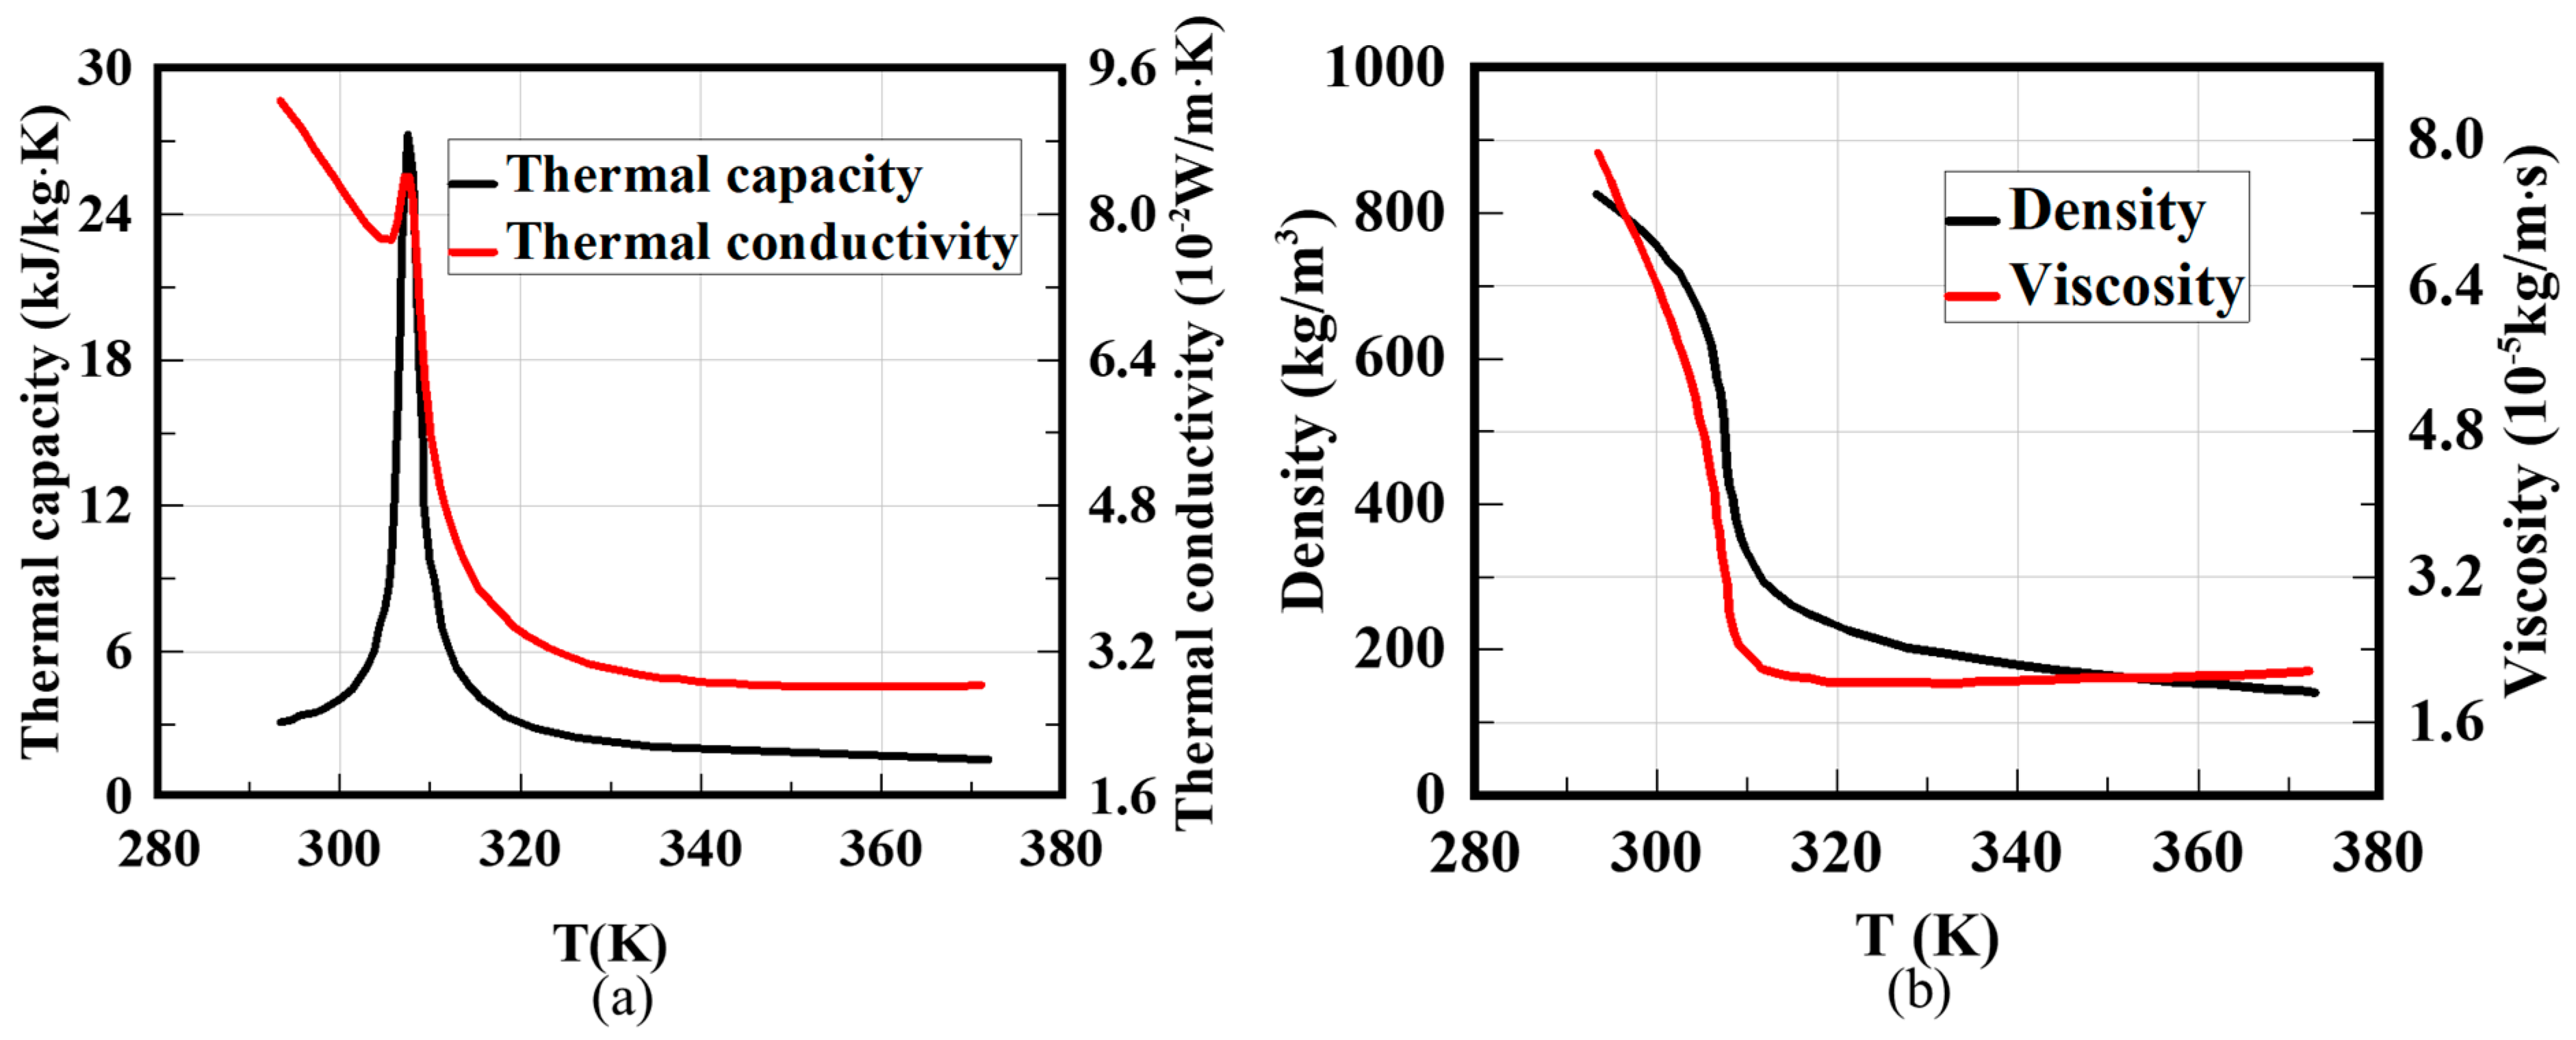
The thermophysical properties of supercritical CO2 including density, thermal capacity, thermal conductivity and viscosity near the supercritical point change sharply, which may cause complex flow and heat transfer performance. The corresponding property data were from SUPERTRAPP software developed by the National Institute of Standards and Technology, the United States [42]. The piecewise linear interpolation method was applied to input the thermophysical properties, including thermal capacity, thermal conductivity, density and viscosity. More than 100 piecewise linear functions were used for interpolations in the range of the temperature variations. Additionally, the details of the thermophysical properties of supercritical CO2 under 8 MPa are shown in Figure 5.
The material of the solid walls was Steel 304. The density and the thermal capacity are 7930 kg/m3 and 500 J/(kg·K). The linear correction of the thermal conductivity of Steel 304 is 16.3 W/(m·K) at 373 K and 21.5 W/(m·K) at 773 K.

2.4. Model Validation and Mesh Independence Study

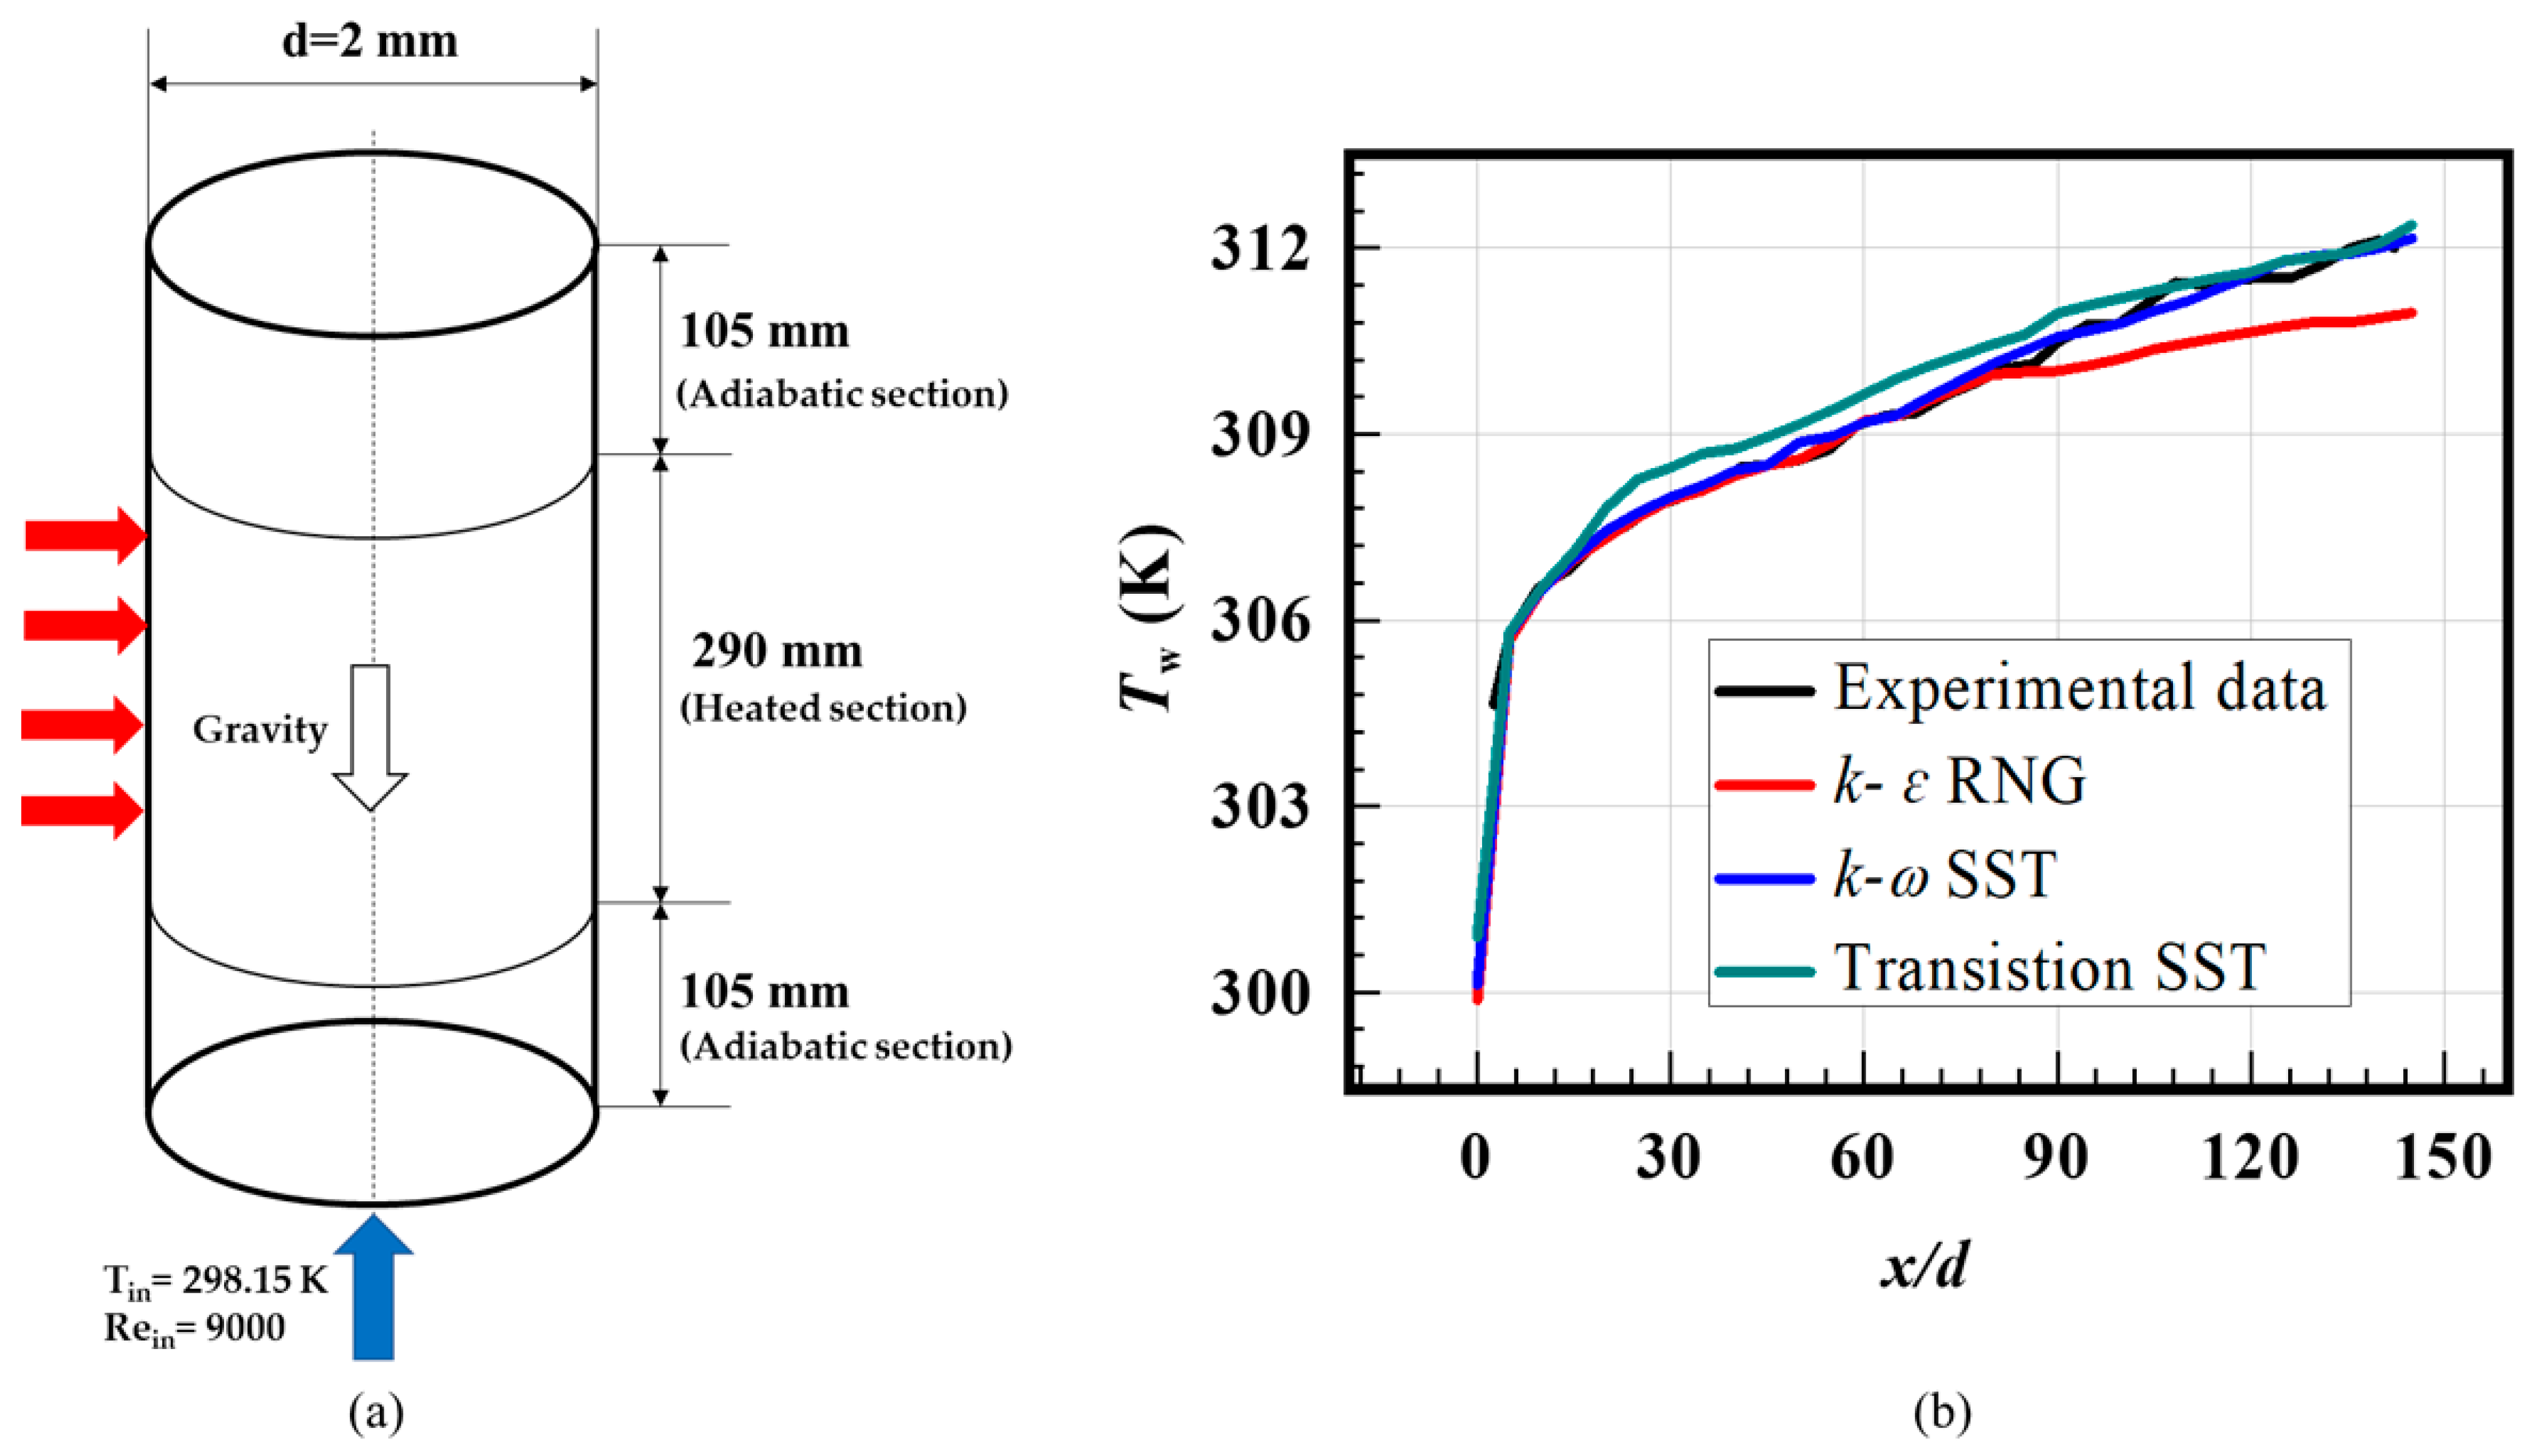
It is significant to verify the reliability of the turbulence model and determine the sensitivity of the mesh systems for a turbulence flow calculation. To verify the reliability of the turbulence model, the experimental results in the previous work [43] were used for comparisons, which used supercritical CO2 as the working fluid in a circular tube. A circle tube with a diameter of 2 mm and a heated section of 290 mm was adopted to perform verification, as shown in Figure 6a. The inlet temperature and Re were 298.15 K and 9000, respectively. The heat flux was uniform with a value of 13,626 W/m2. Three kinds of turbulence models, i.e., k-ε RNG, k-ω SST and Transition SST, were selected to carry out numerical simulations. Additionally, the values of the wall temperature along the streamwise direction were obtained as shown in Figure 6b.
As seen in Figure 6b, the wall temperature predicted by the k-ω SST turbulence model has good agreement with the experimental results obtained by Li et al. [43] compared with the other turbulence models. The prediction error of the k-ω SST model is within ±0.13%. Larger error is found at the beginning of the heated region due to the different boundary effects in the experiment and simulation. In addition, the k-ω SST turbulence model has shown great advantages in dealing with the transmission of turbulent shear force and wall bounded flow. Overall, the k-ω SST turbulence model provided enough accuracy in the simulations. Therefore, k-ω SST turbulence was selected for the simulations below.
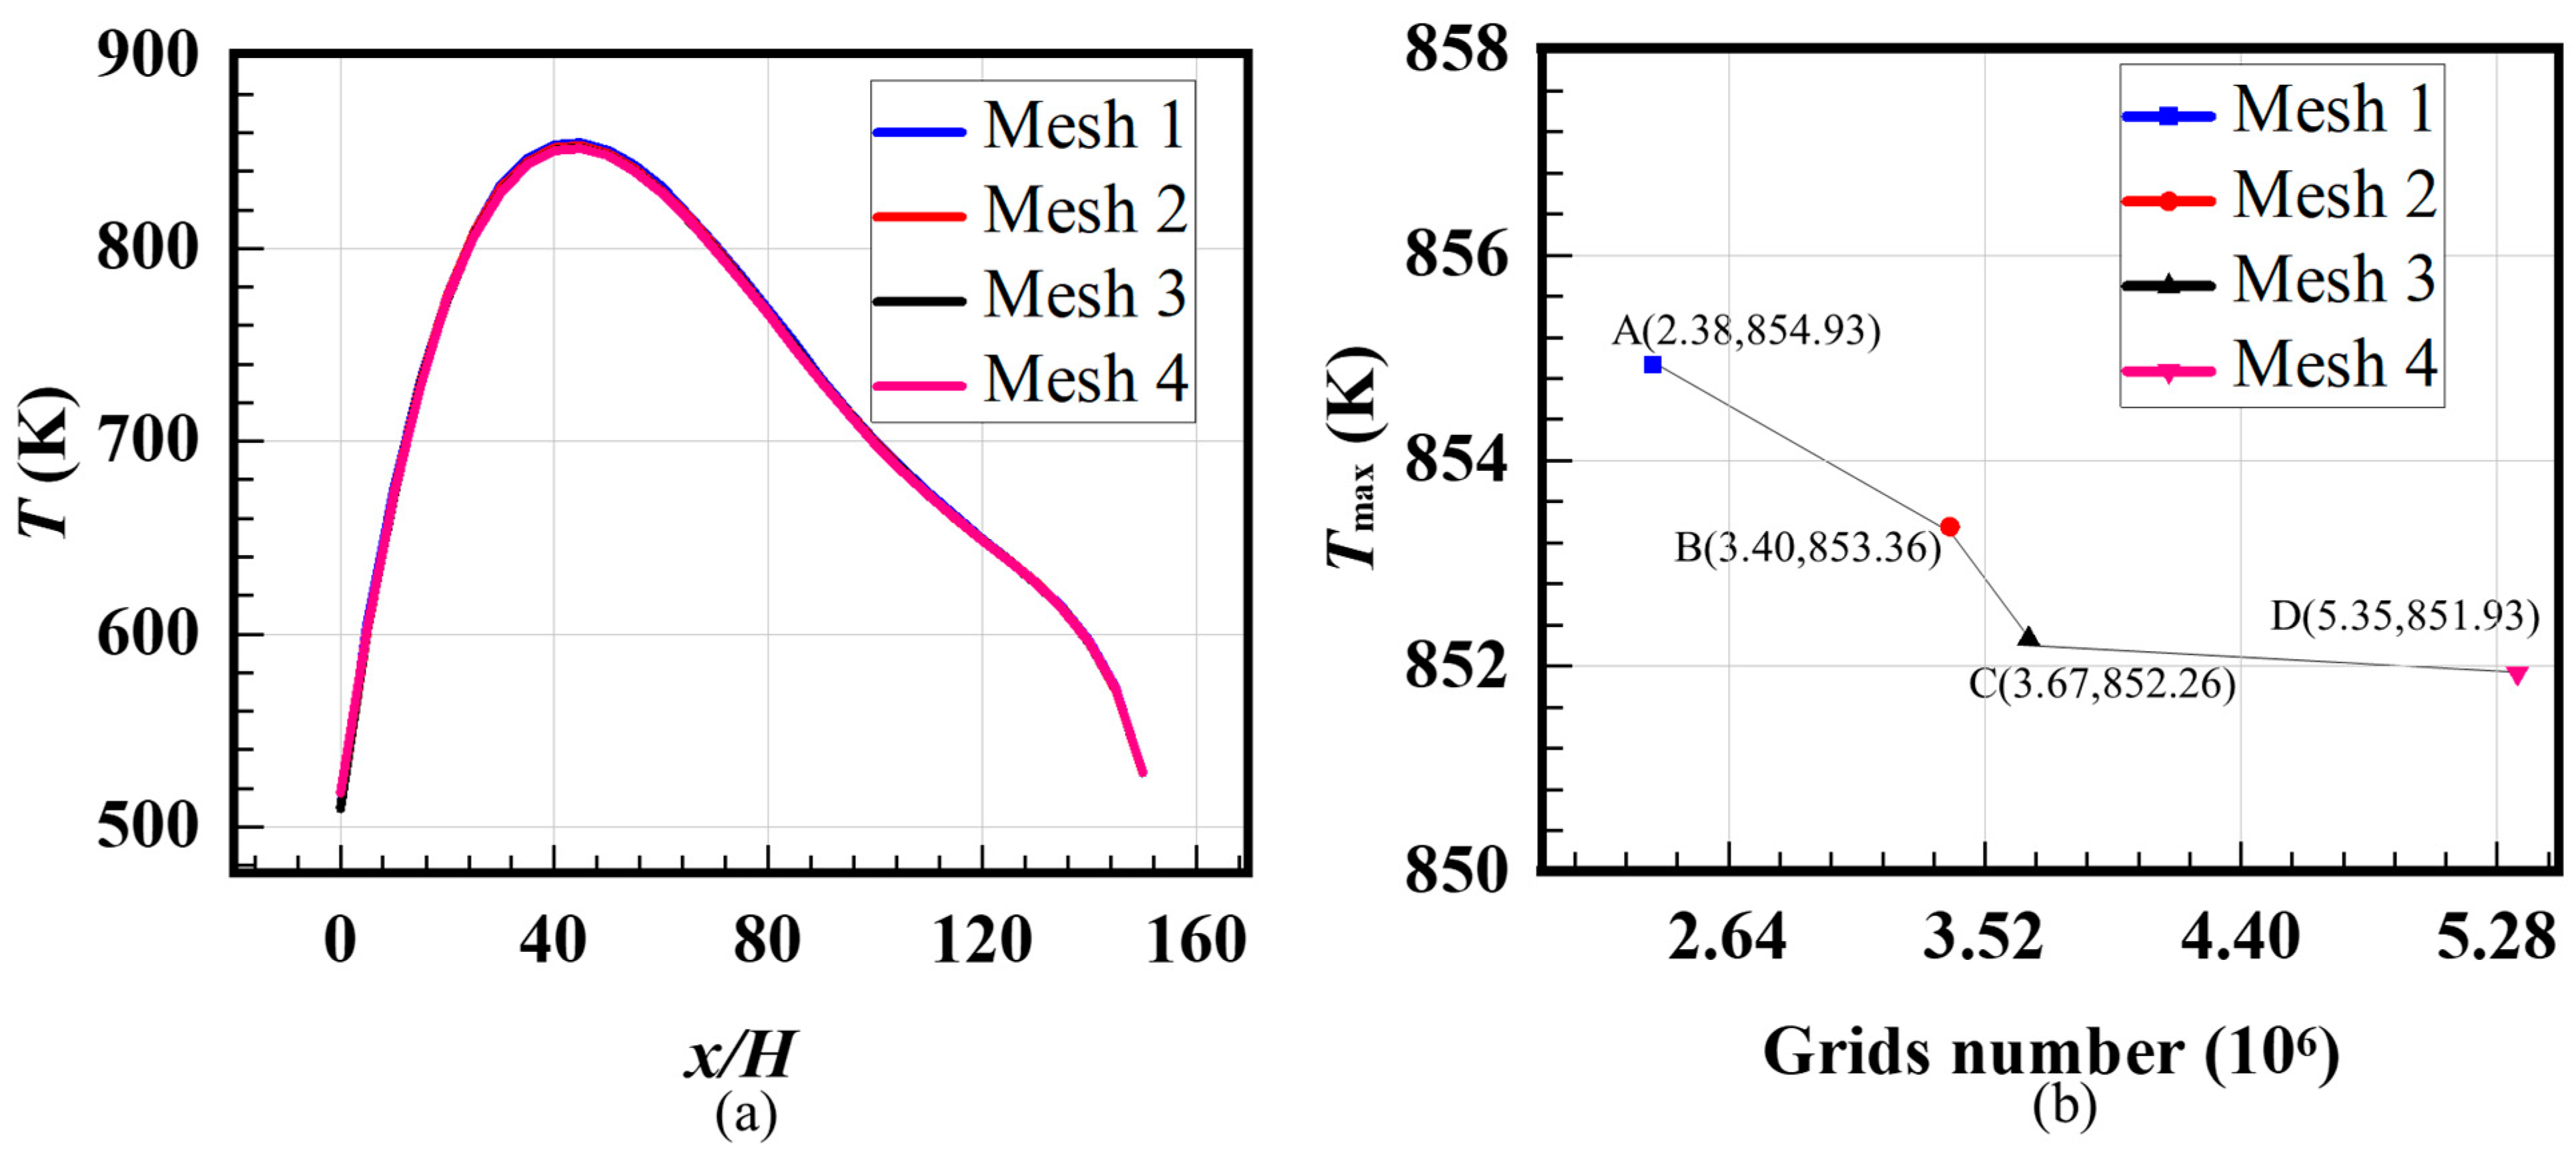
Mesh independence was performed using the k-ω SST turbulence model, and Case A was selected to evaluate the mesh sensitivity. Four kinds of mesh regimes were built, respectively, with grid numbers of 2.38, 3.30, 3.67 and 5.35 million. They were named Mesh 1, Mesh 2, Mesh 3 and Mesh 4, respectively. Thirty points were built on the center line of the heated surface along the streamwise direction and the area-weighted average temperature distribution was obtained, as shown in Figure 7a. As shown in Figure 7a, the center line temperature distributions overlap together. Therefore, the maximum temperatures on the center line for all of the meshes are extracted and compared in Figure 7b, i.e., Point A, Point B, Point C, Point D. They have relatively close values especially for Mesh 3 and Mesh 4. When the grid numbers increase from 3.67 M to 5.35 M, the maximum temperature has no changes. Comprehensively considering the simulation accuracy and computational effort, Mesh 3 was selected.

3. Results and Discussions

For the convenience of analysis, the HTC is defined as follows:
h = q T w T f
where Tf is the bulk fluid temperature and is calculated as follows:
T f = A ρ u C p T d A A ρ u C p d A
where A is the area of the fluid cross-section, and ρ, u, Cp and T are the local density, velocity, thermal capacity and temperature of supercritical CO2 in the same region, respectively.

3.1. Effect of Heat Flux Magnitude

Figure 8 shows the temperature and HTC distributions along the x-axis for the cases loaded with different heat flux magnitudes. To display the distributions, a total of 61 y-z sections of solid and fluid regions were created along the streamwise direction from x/H = 0 to x/H = 150, respectively, and each data point was obtained by area-weighted averaging all of the results in the section. As shown in Figure 8a, the bulk fluid temperature almost always rises with flow developing in the channel. It is noted that with an increased heat flux value, the increased trend of fluid temperature becomes strong in the downstream region. There is a relatively “weakened” region in Figure 8a in the region of 40 < x/H < 80, where the fluid temperature increases much more slowly along the cooling channel. The “weakened” region is caused by the core part of the mainstream which is close to the critical point, although the average temperature is much larger than the critical temperature which is mainly determined by the high-temperature regions close to the heated bottom wall. As shown in Figure 5a, when fluid temperature is near the critical point, supercritical CO2 possesses a high thermal capacity. It takes more heat for the core part of the fluids to increase the temperature; so, the temperature of the whole cross-section increases much more slowly. The phenomenon is much clearer for the cases with the increased heat flux magnitude, from Case A1 to Case A3. As seen in Figure 8b, a phenomenon of HTD is observed with the increased wall temperature in the region of 80 < x/H < 120. The HTD becomes obvious for the case with the largest heat flux magnitude, i.e., Case A3. The HTC firstly decreases and then increases, as shown in Figure 8c. Additionally, when the flow is near the end of the heated section, the HTC increases strongly. In a certain range of heat flux from 1.5 MW/m2 to 3 MW/m2, the HTC increased with the increased heat flux. However, with the heat flux increased to 6 MW/m2, the HTC decreases. The phenomenon of HTD is also clearly presented in Figure 8c, especially in the case with the largest heat flux (Case A3).

3.2. Effect of Nonuniform Heat Flux Distributions

To present the nonuniform distribution more clearly, a diagram of nonuniform heat flux distribution about x/H is shown in Figure 9, which is consistent with Table 1. Among them, Cases B1–B3 are loaded with increased heat flux distributions with different increase rates, while Cases B4–B6 are loaded with decreased heat flux distributions.
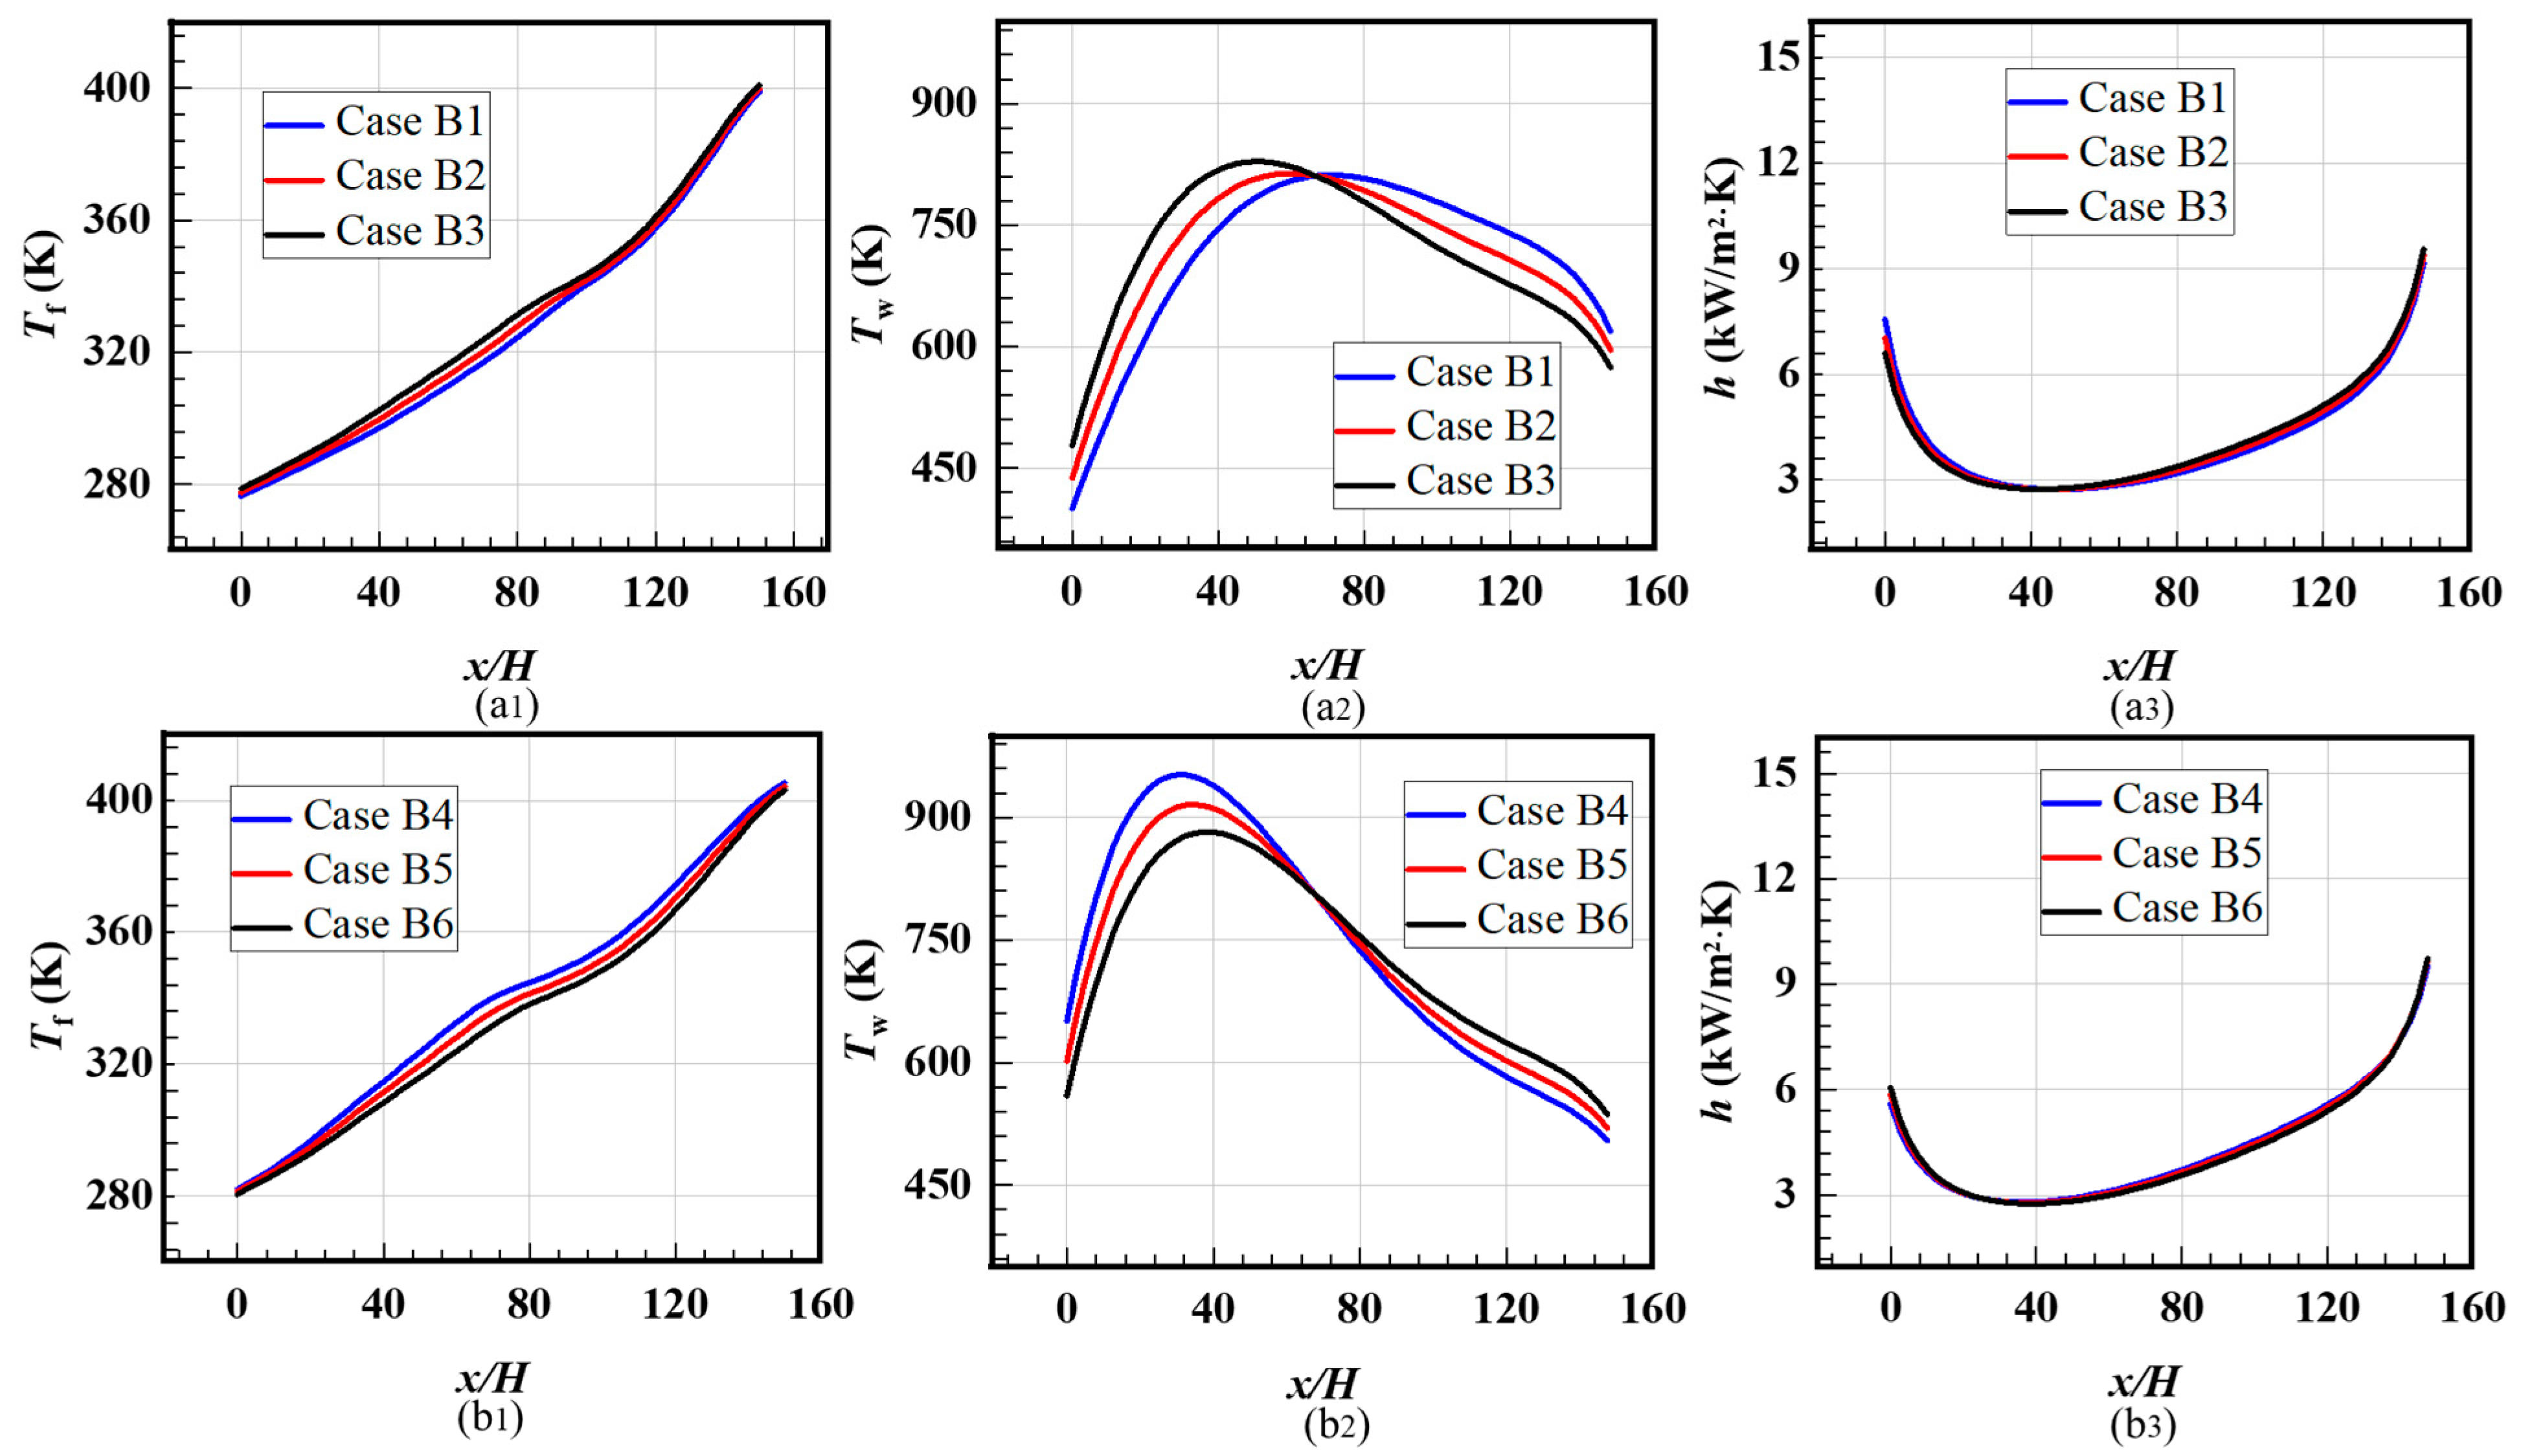
Figure 10 displays the temperature and HTC distributions along the streamwise direction for the cases loaded with nonuniform heat flux (Cases B1–B6). From Cases B1 to B3, the increased heat transfer flux distributions are loaded with the gradually weakened variations while keeping the same average heat flux. Additionally, for Cases B4 to B6, the decreased heat transfer distributions are loaded with the gradually weakened variations. As shown in Figure 10(a1), the bulk fluid temperature displays an overall increased trend except for a “weakened” region of 80 < x/H < 120 where the core part of the fluid approaches the critical point. If the inclination ratio of the increased heat flux distribution decreases, i.e., the variations weaken, the bulk fluid temperature in the upstream region increases and that in the downstream region decreases. The cases with increased heat flux distribution reduce the “weakened” region which decrease the overall heat transfer. The wall temperature distributions increase sharply and then decrease slowly after reaching the maximum value, as shown in Figure 10(a2). With the inclination ratio of heat flux decreasing, the maximum wall temperature increases and occurs earlier in the channel. For the cases loaded with the decreased heat flux distributions, the bulk fluid temperature demonstrates a relatively fast increase and then a relatively slow decrease followed by a relatively slow increase, as presented in Figure 10(b1), which enlarges the effect where the fluid approaches the critical point. Comparing Figure 10(a2,b2), the maximum wall temperature for the cases with decreased heat flux distributions is higher than that for the cases with increased heat flux distributions.
According to the energy principle of energy conservation, the fluid temperature at the outlet remains the same regardless of the different heat flux distributions for Case B1–Case B6. As shown in Figure 10(a3), the HTC firstly decreases quickly and then increases relatively slowly for the cases loaded with increased heat flux distributions. HTC increases quickly in the region of 120 < x/H < 150, which is more obvious in cases with decreased heat flux, as shown in Figure 10(b3). It is also indicated that the cases with the decreased heat flux distributions can improve the heat transfer in the downstream region.
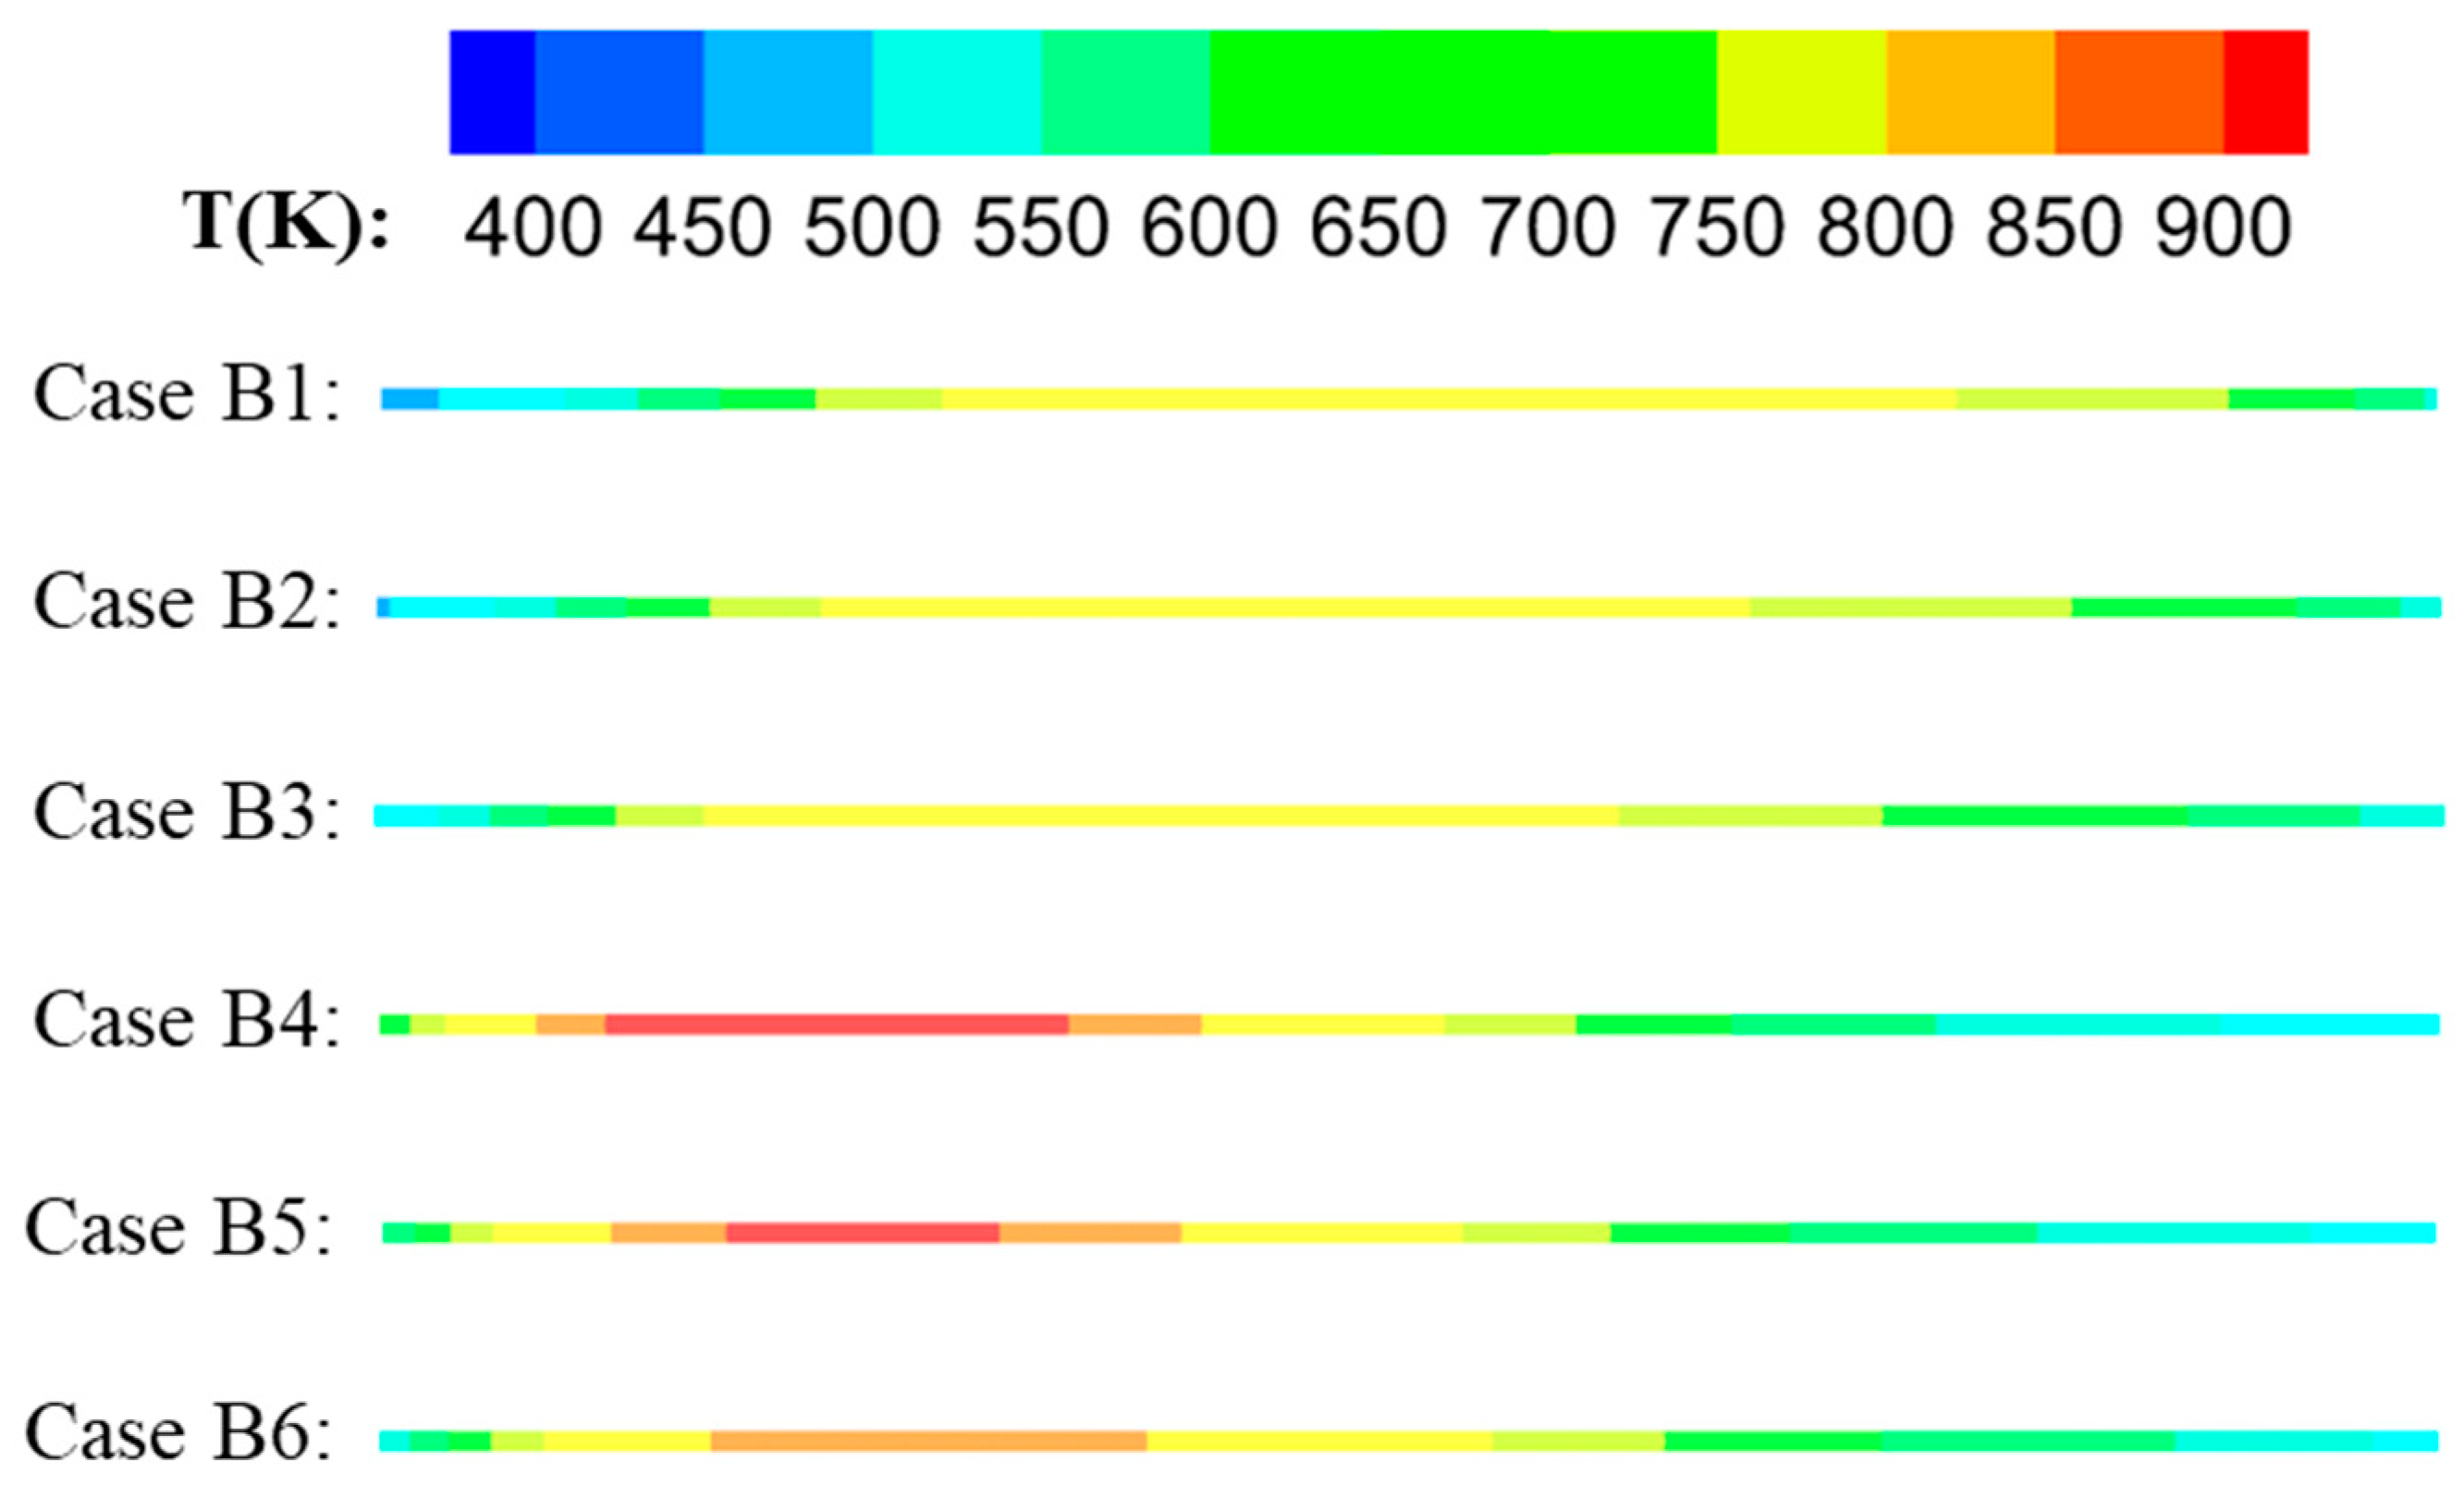
Figure 11 exhibits the temperature contours of the bottom heated wall loaded with nonuniform heat flux distributions. Obviously, all of the cases present a firstly increased and then decreased temperature distribution, which is consistent with Figure 10(a2,b2). Overall, the temperature distributions for Case B1–Case B3 are relatively more uniform than those for Case B4–Case B6. For Cases B1–B3, the gradually increased heat flux distributions delay the occurrence of the high-temperature regions. However, a much stronger high-temperature region is found in the upstream region for the cases loaded with the decreased heat flux distributions, due to the larger heat flux and the core part being far from the critical point.
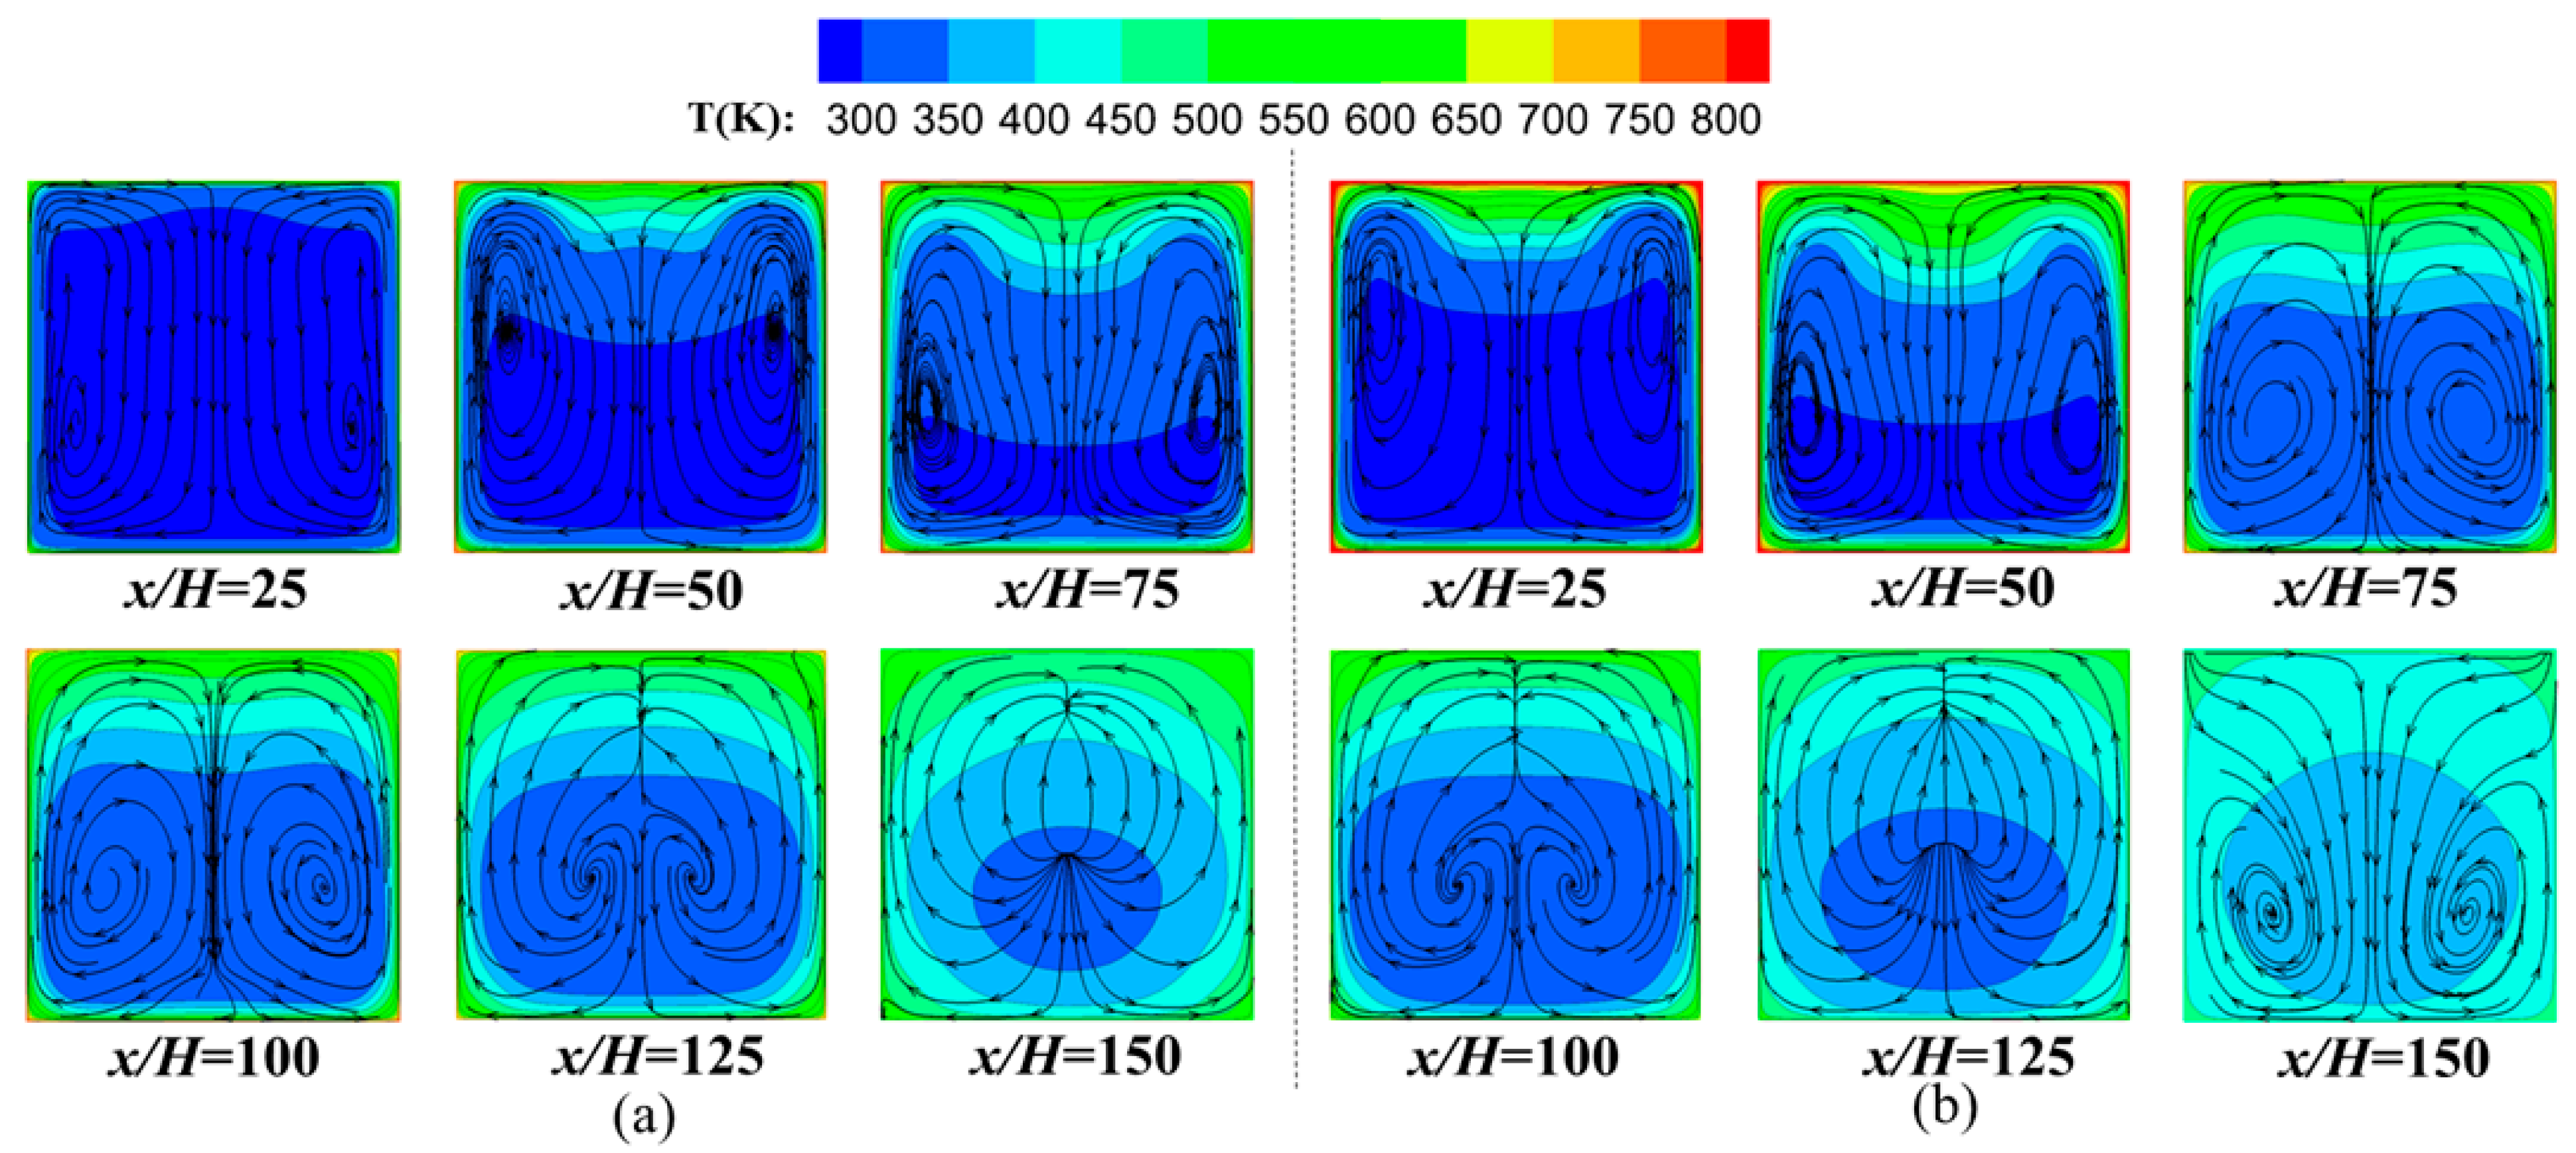
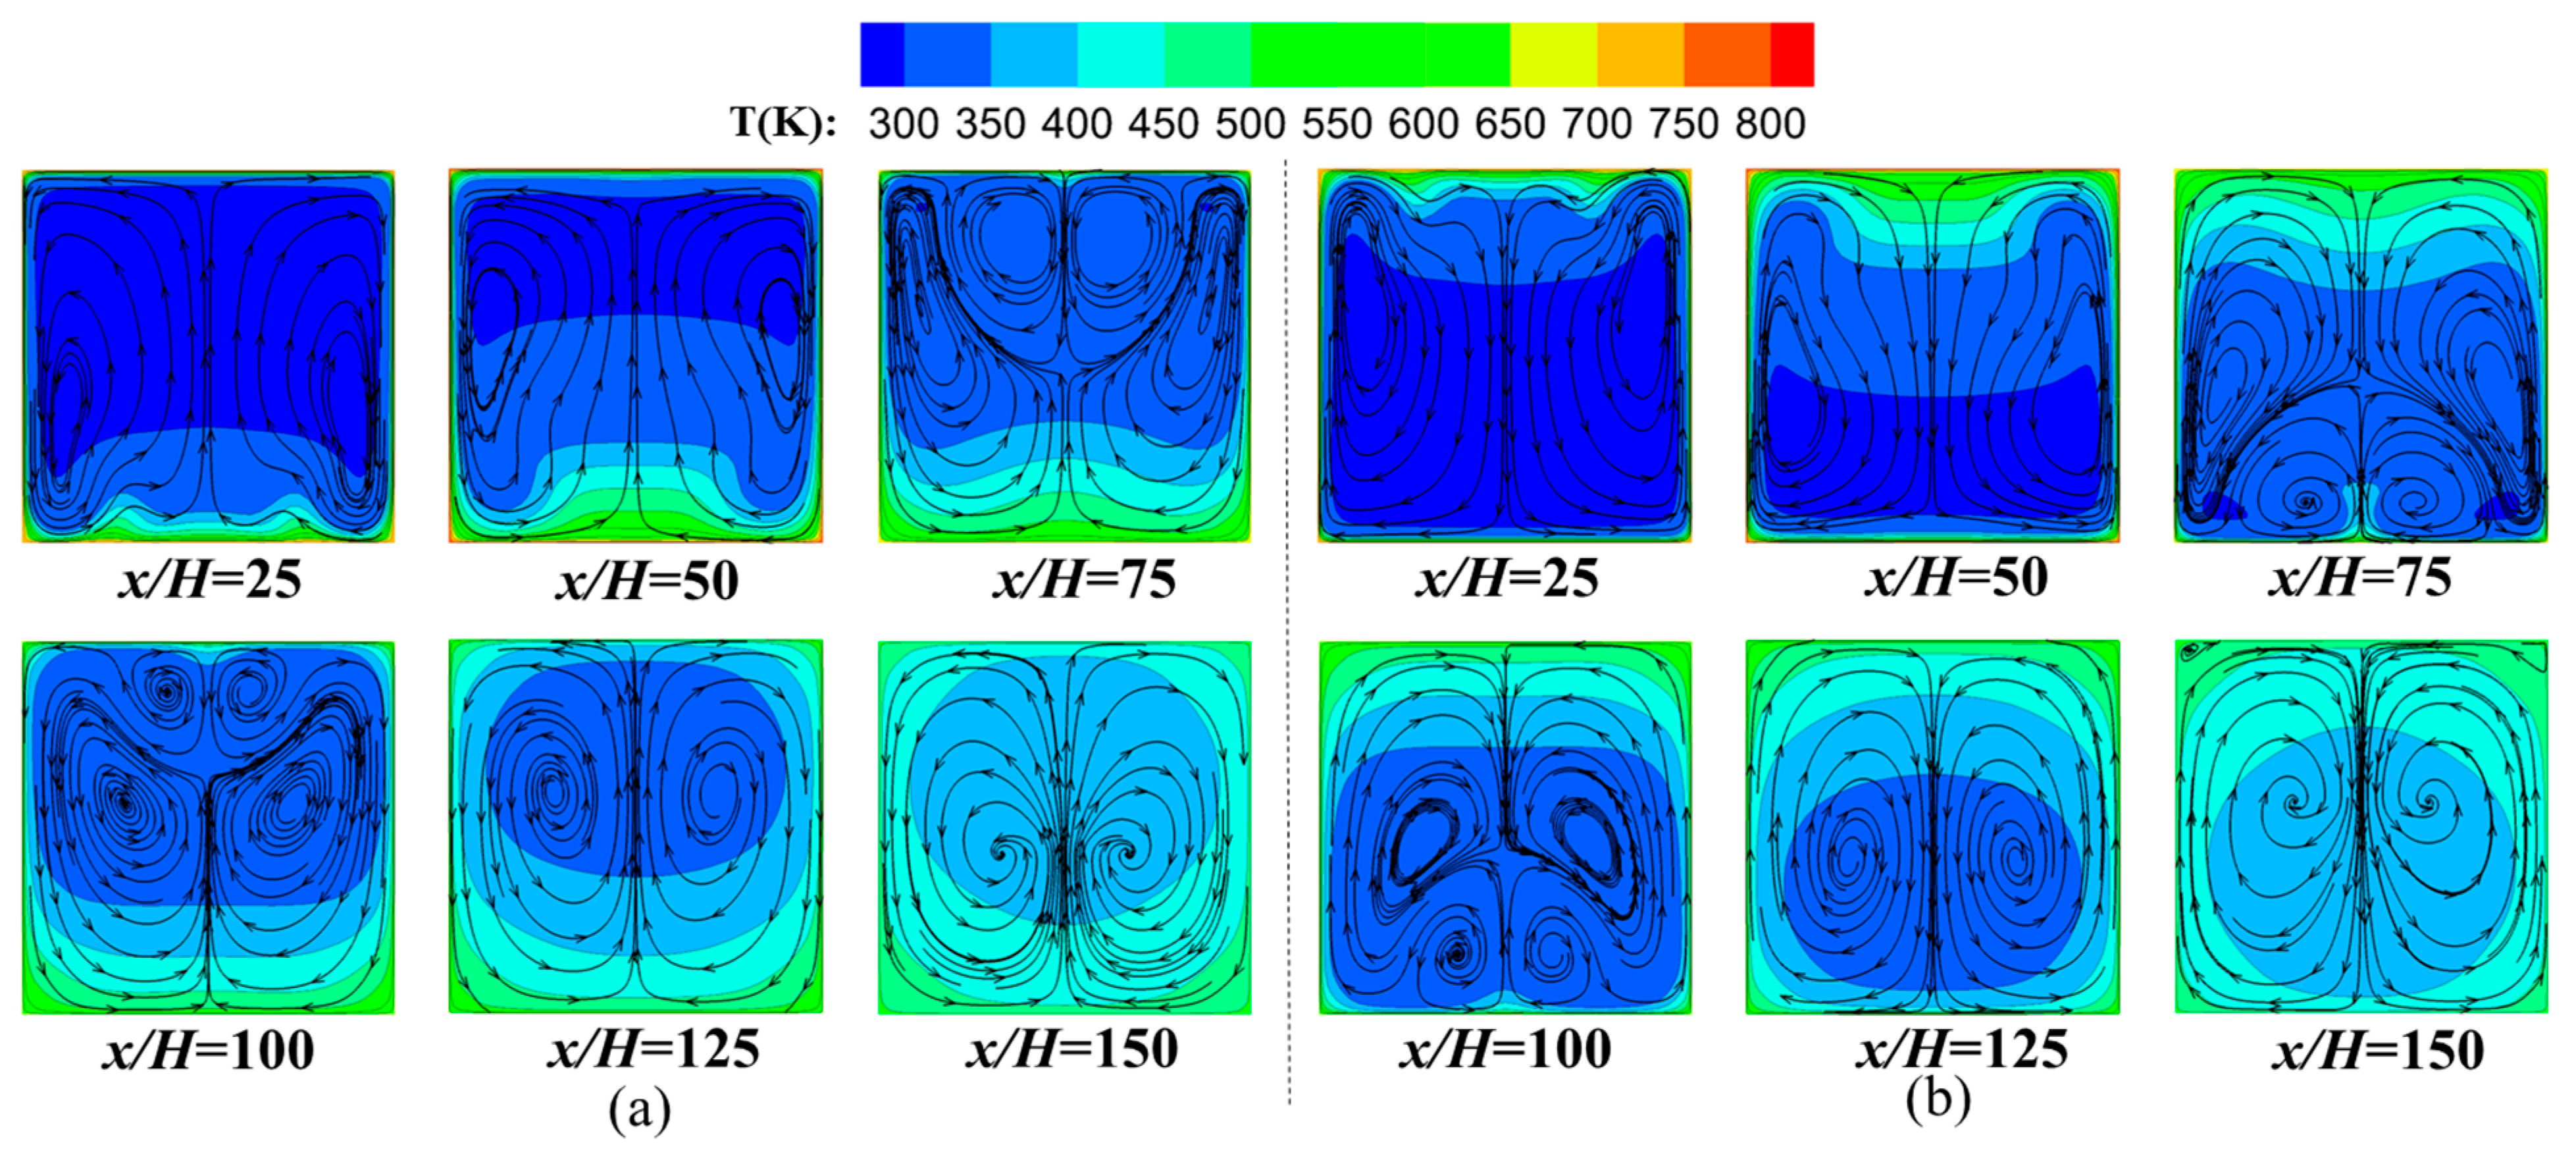
The streamlines and temperature contours on the y-z sections for Case B1 (loaded with increased heat flux distribution) and Case B4 (loaded with decreased distribution) are shown in Figure 12a and Figure 12b, respectively. The sections range from x/H = 25 to 150. As shown in Figure 12, the low-temperature regions are located in the core part of the mainstream and the temperature close to the walls is very high due to the high heat conduction from the solid materials. When the fluid in the core part of the mainstream approaches the critical point, large heat absorption happens to weaken the increased trend of the fluid temperature which corresponds with the “weakened” region in Figure 10(a1,b1). From the figure, when the flow develops along the channel at the section of x/H = 75, the core part is close to the critical point. A pair of counter-rotating vortices is found in most contours which are formed from the buoyancy effects. As seen in Figure 5, the density of the supercritical fluids decreases with increased temperature. In the presence of density difference, the vortices are driven by the gravity. It is observed that the mainstream is downward flow at the beginning, and the flow near the sidewalls is upward.
As shown in Figure 12a, the fluids near the solid walls are heated fast upstream which is related to the high wall temperature. However, the fluid temperature near the solid wall decreases downstream along the x-axis and the overall distribution becomes uniform. It is concluded that the wall temperature gradually decreases downstream but is always higher than that of the mainstream. The distribution in Case B4 (shown in Figure 12b) is roughly the same as that in Case B1, but the fluid is heated more quickly upstream due to the higher temperature difference between the mainstream and solid walls. Additionally, compared with Case B1, the temperature distribution for Case B4 is more uniform downstream. It is also noted that the scale of the vortices is related to the scale of the low-temperature region. The core of the vortices is more obvious in the section with a larger low-temperature region.

3.3. Effect of Acceleration and Buoyancy Effects

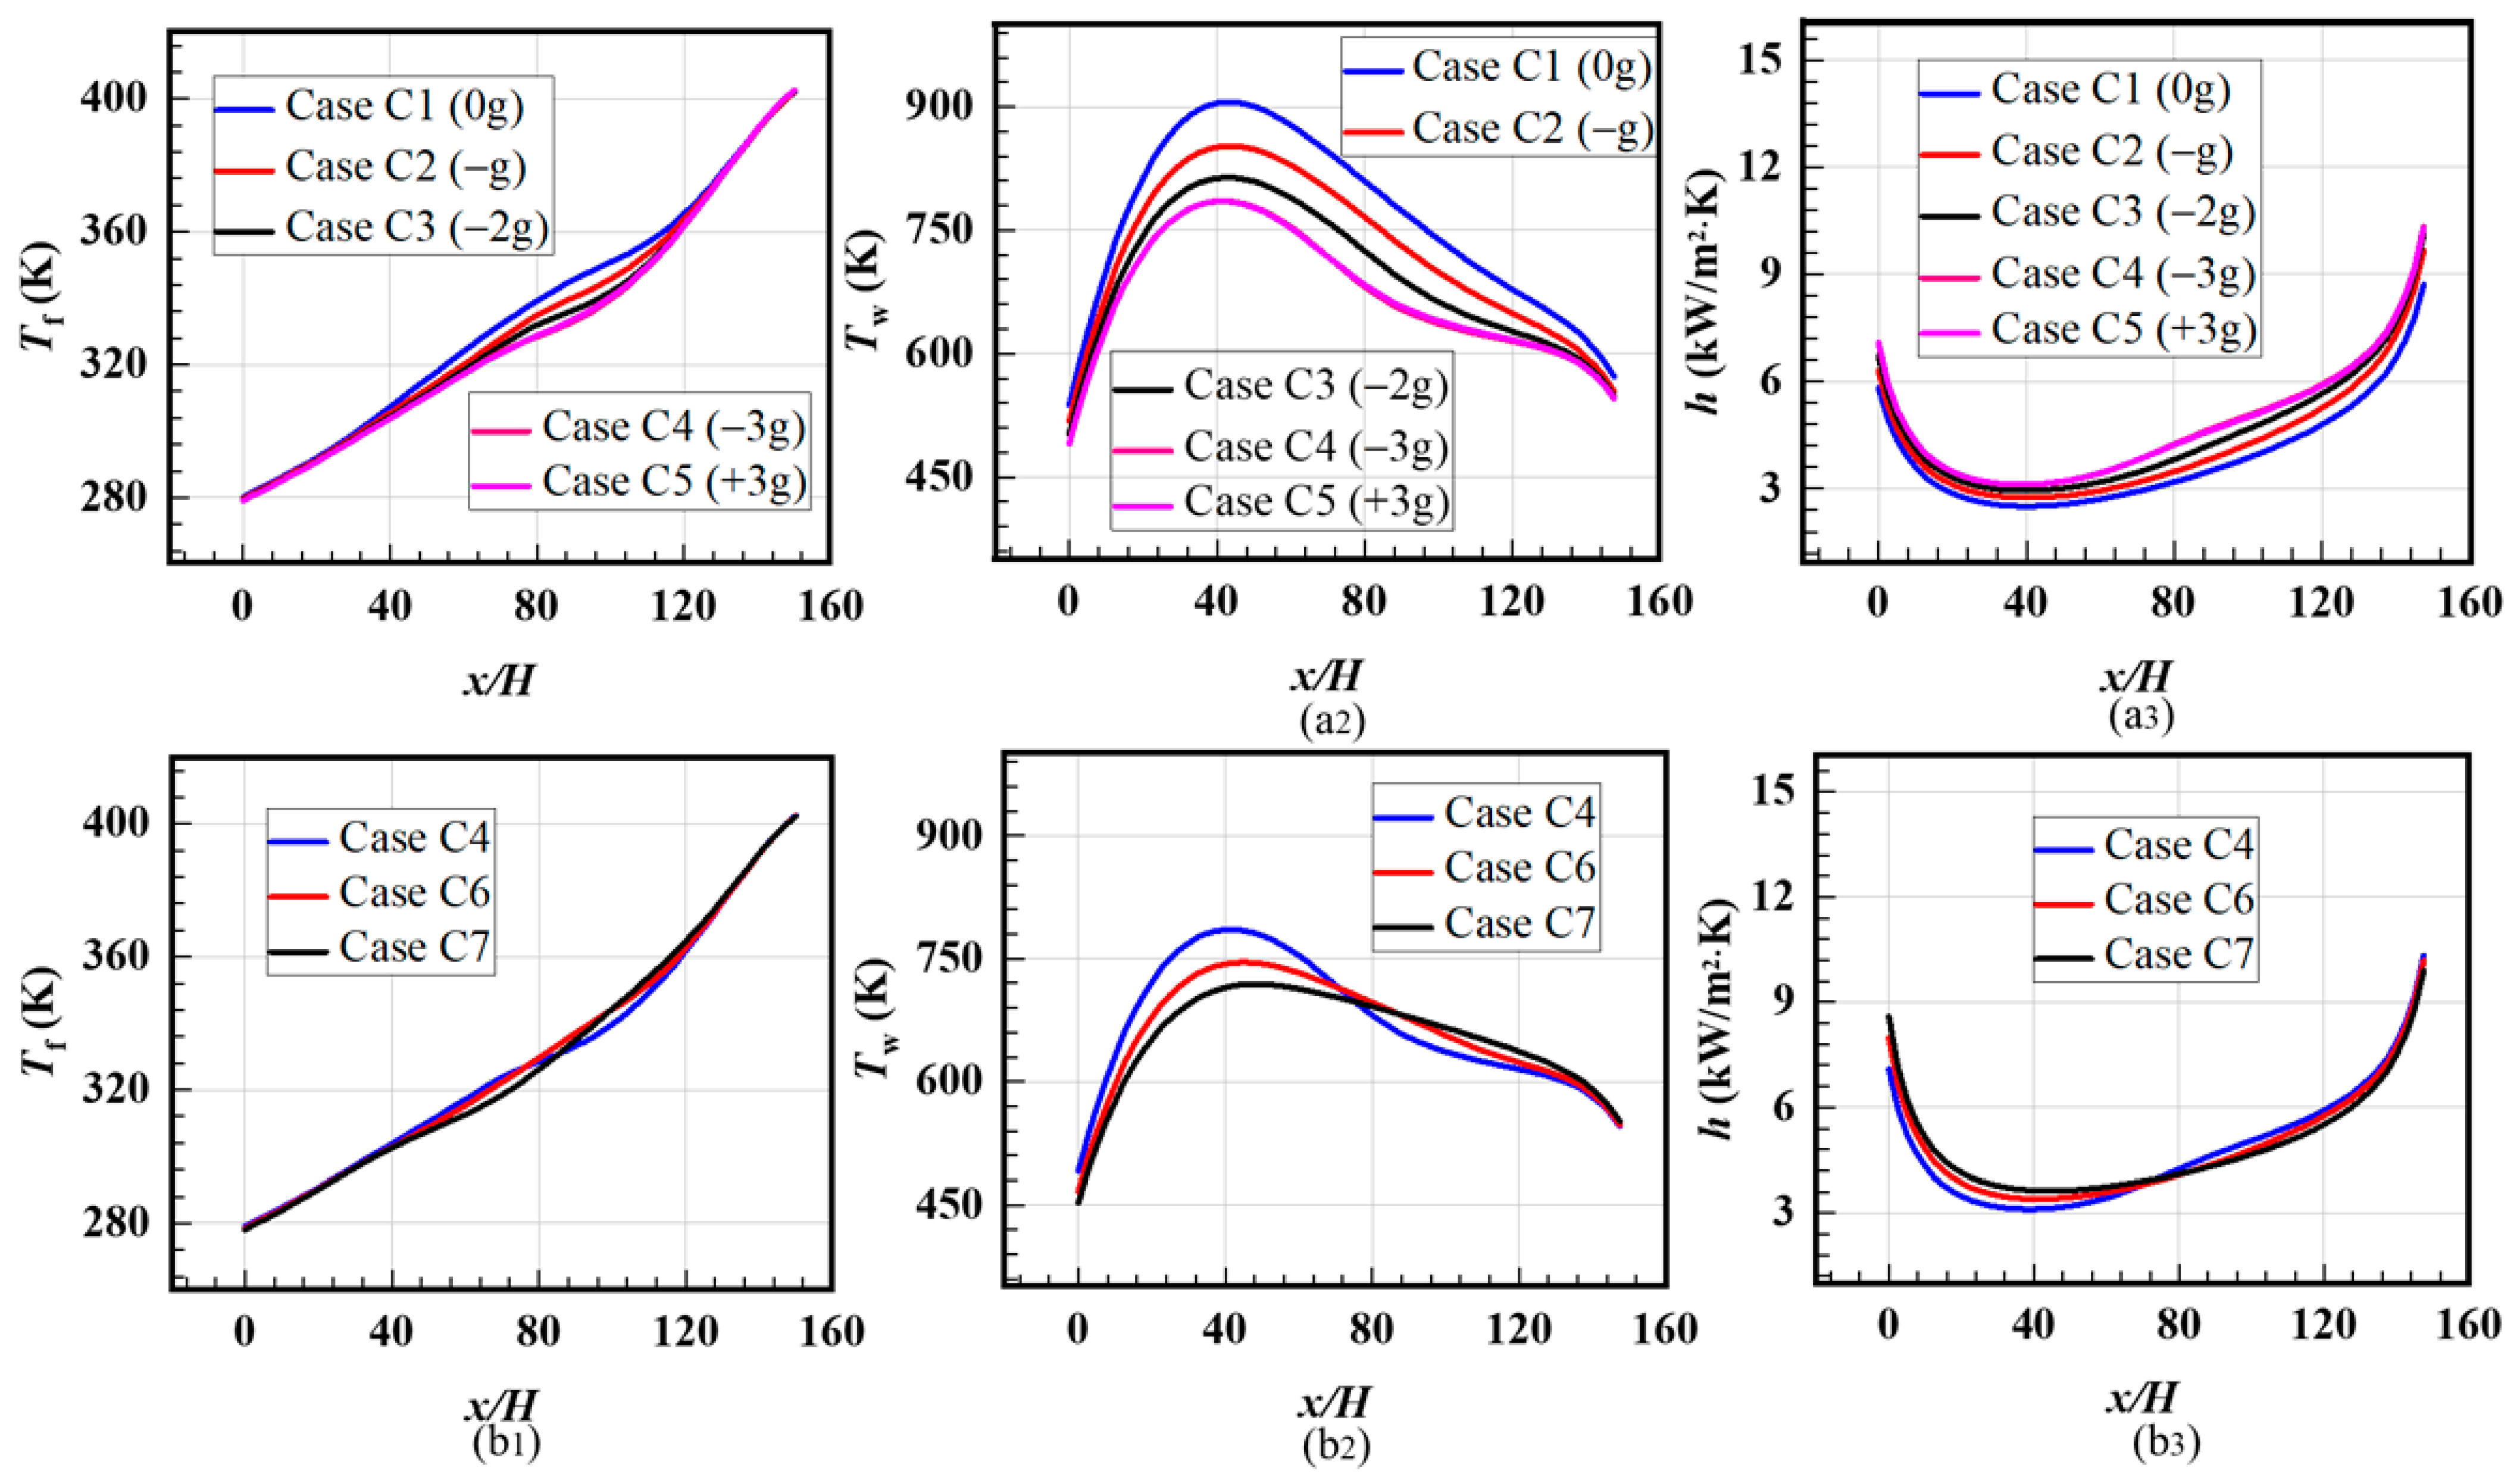
Figure 13 displays the temperature and HTC distributions for the cases loaded with accelerations at different magnitudes and directions. For Case C1 to Case C5, the magnitudes of the acceleration range from −3 g to 3 g along the normal direction including the states of overweight and weightlessness, respectively, 0 (Case C1), −g (Case C2), −2 g (Case C3), −3 g (Case C4) and +3 g (Case C5). As shown in Figure 13(a1), the average temperature of the fluid and solid decreases during the fluid approaching the critical point with increased accelerations. The phenomenon is more obvious in the distribution of the wall temperature distribution in Figure 13(a2). It is noted that the direction of accelerations along the z-axis have no significant influence on the fluid and wall temperature distributions by comparing the results in Case C4 and Case C5. The transverse accelerations along the streamwise direction are also considered in the work shown in Figure 13b. From the z-axis, the accelerations take effect in the directions of 0° (Case C4), 30° (Case C6) and 60° (Case C7), respectively, with the gradually increased transverse accelerations (ax). The transverse accelerations have no obvious influence on the fluid temperature distributions, as seen in Figure 13(b1). However, the wall temperature decreases with increased transverse accelerations in the upstream region, which has benefits for the heat transfer shown in Figure 13(b2). For HTC distribution, the variation becomes gentle when the uniform heat flux is loaded. Larger HTC distributions are obtained via the case with the larger acceleration, regardless of the acceleration direction. The transverse accelerations can reduce the wall temperature in the upstream region and increase the corresponding HTCs.
Figure 14a,b present the streamlines and temperature contours on the y-z sections for cases with accelerations in the states of overweight (Case C4) and weightlessness (Case C5). It is found that the temperature and streamline distributions for Case C4 and Case C5 are almost symmetrical along the acceleration directions, although the loaded accelerations show the reversed directions. This also indicates that the heating and temperature condition are similar for the bottom heated wall and the other three walls due to the quick heat conduction inside the solid material. Different from the streamlines in Figure 12, the second pair of vortices are formed from x/H = 75 and then gradually disappear at x/H = 125 due to the strengthened buoyancy effect at the larger accelerations. It is speculated that the mixing of cold and hot fluids becomes stronger at the larger accelerations.

3.4. Effect of Flow Pattern

To investigate the effect of flow pattern on heat transfer performance, adjacent channels with the same and reversed flow directions were designed to obtain the flow and heat transfer characteristics, i.e., Case D1 and Case D2. The computation domain contained two rectangular channels, as shown above. The total width was 6 mm and the height was 4 mm. Because the existence of extended sections may affect the temperature variations under the pattern of the two channels, the length of the channels was designed without upstream and downstream extended channels. The other boundary conditions were consistent with Case A1, including the mass flow rate, heat flux, operation pressure and inlet temperature. The gravity effect was also considered.
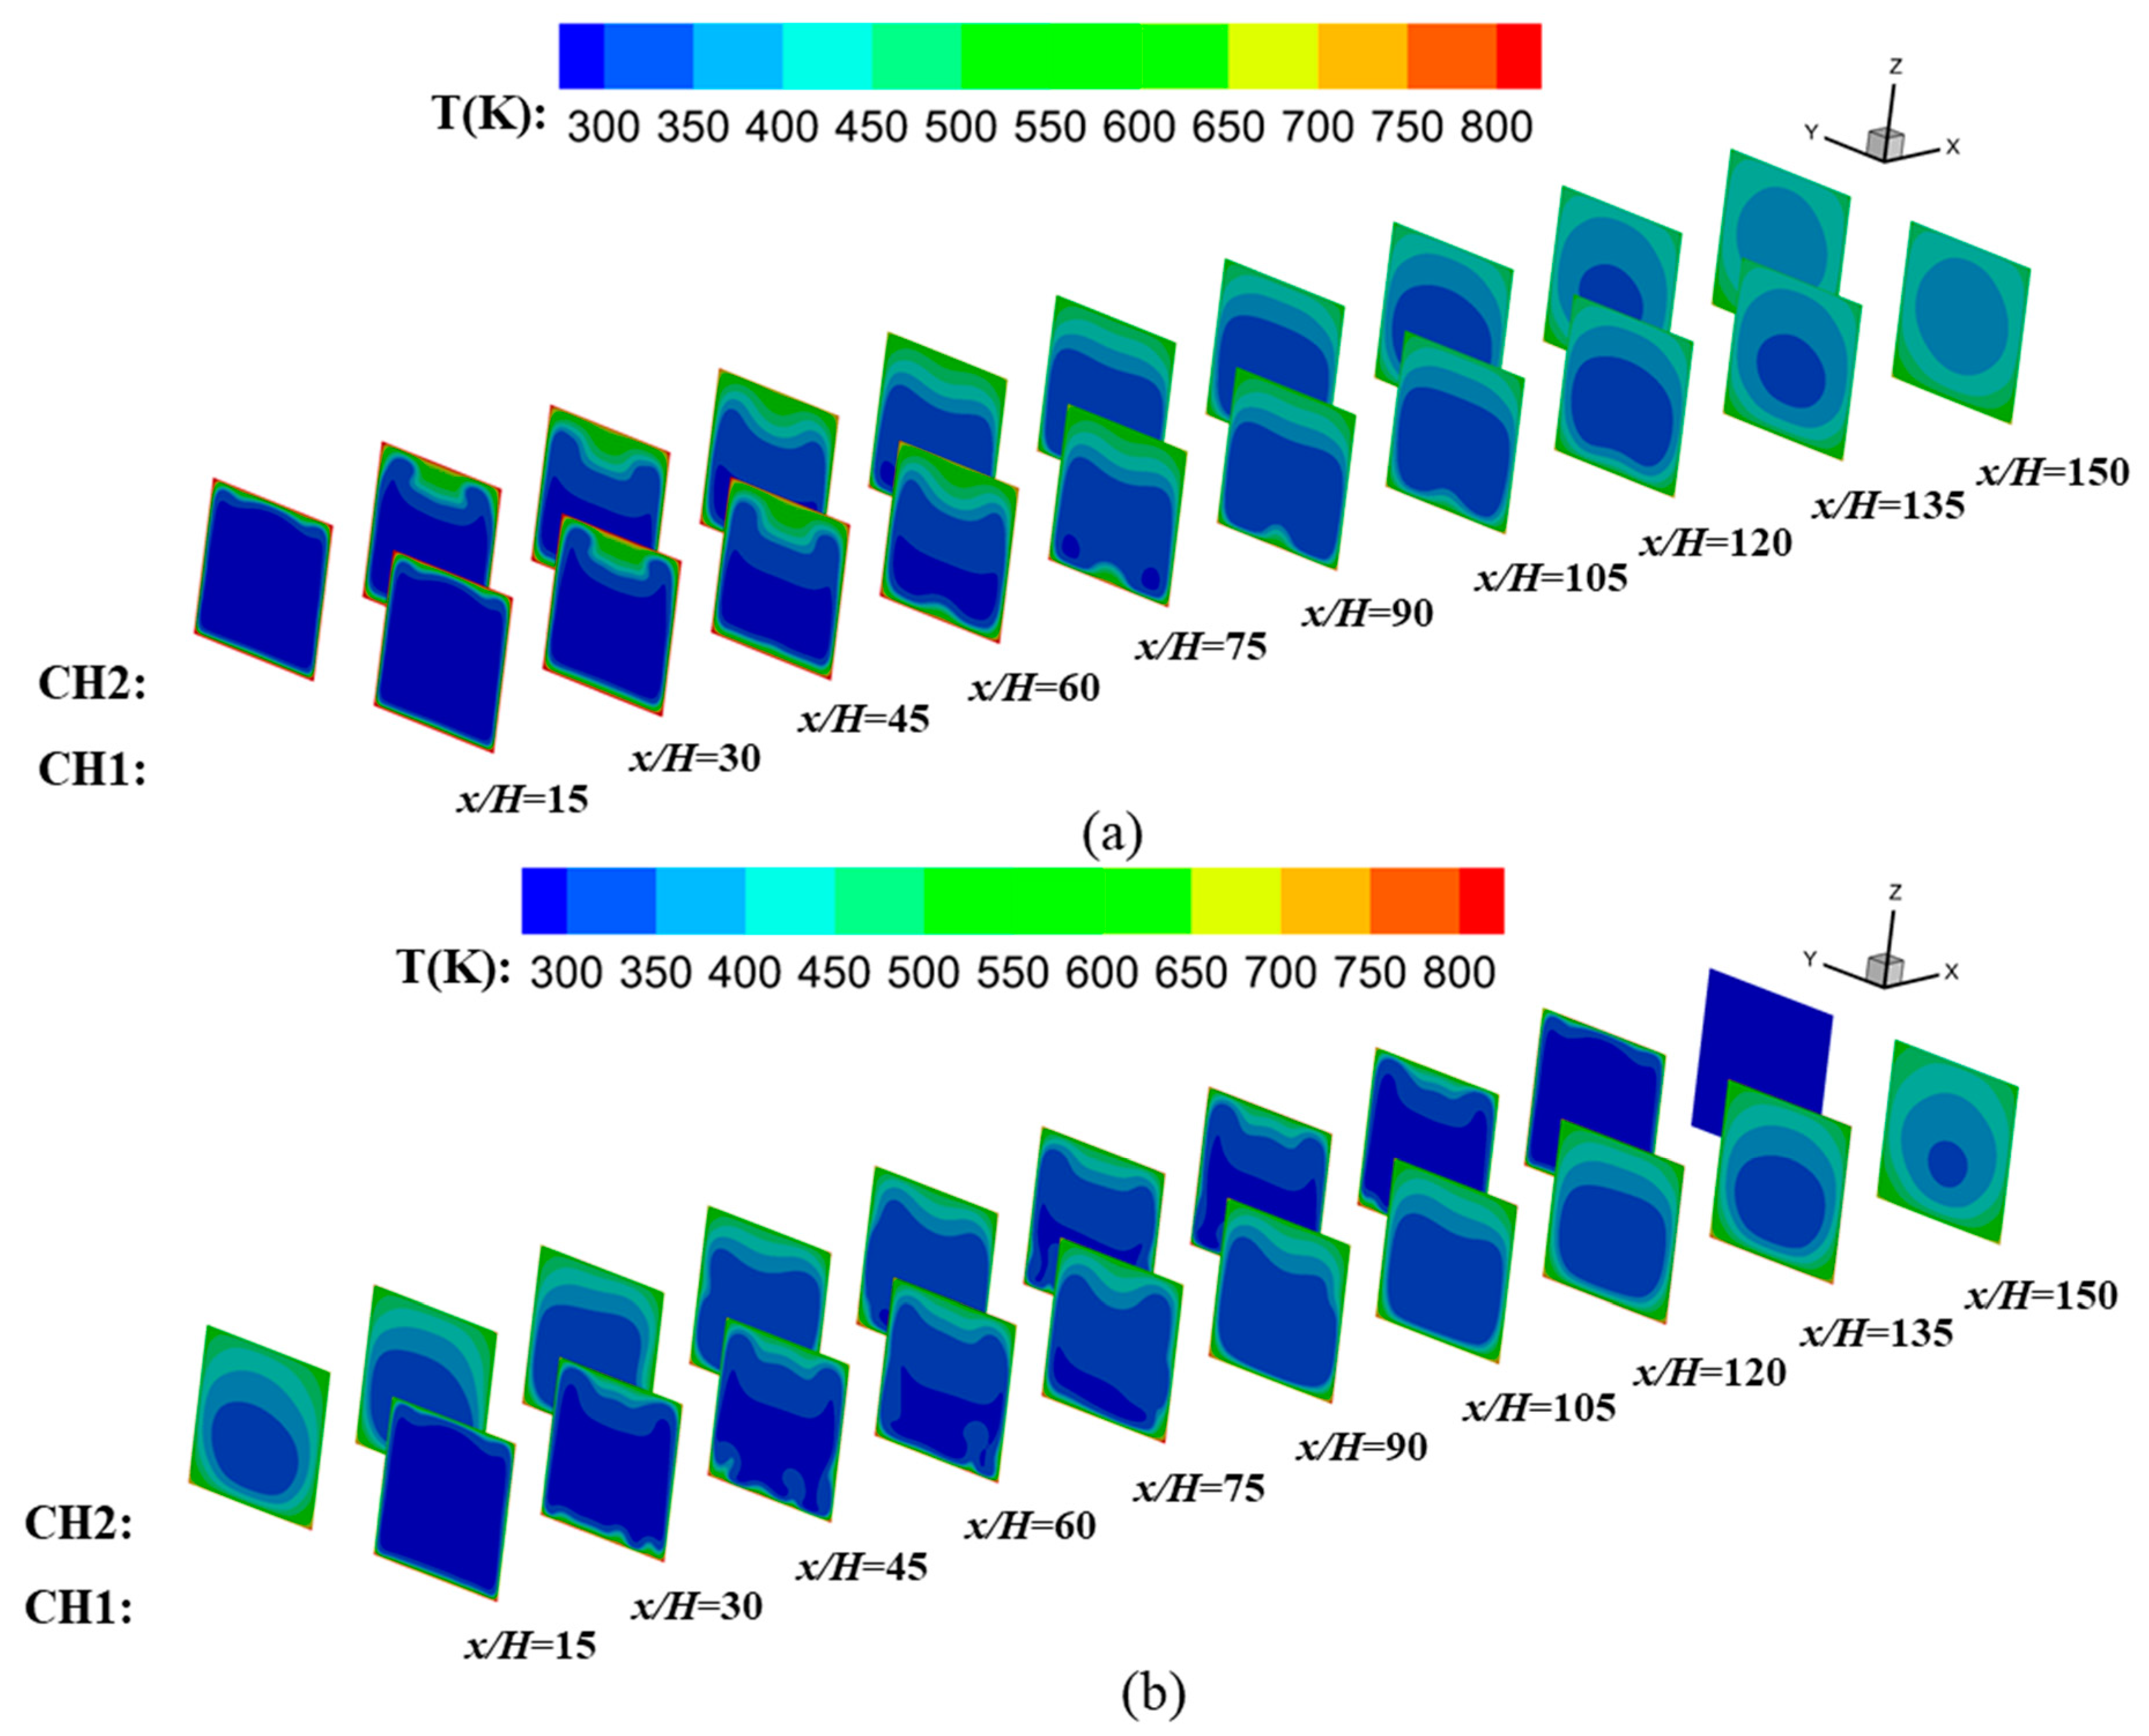
The fluid temperature contours in the spanwise–normal (y-z) sections for the cases with the same (Case D1) and reversed (Case D2) flow directions are shown in Figure 15 at an interval of x/H = 15 along the streamwise direction. Two identical fluid temperature distributions were obtained in Case D1, as shown in Figure 15a. From the fluid temperature distribution near the wall, it is indicated that the wall temperature firstly increases and then decreases, which also has agreement with Figure 12. It is observed that the fluid temperature approaching the bottom heated wall is higher than the fluid near the other sidewalls in the upstream region, and the difference gradually decreases in the downstream region. With flow developing along the channel, the fluid temperature becomes more uniform and a maximum average temperature is obtained at the outlet. Slightly different from Figure 15a, the fluid temperature distributions in Channel 1 (CH1) and Channel 2 (CH2) are symmetrical along the streamwise direction, as seen in Figure 15b. Compared with Figure 15a, the fluid temperature near the walls for the case with the reversed flow direction is lower, which indicates the decreased wall temperature for Case D2.
The temperature and HTC distributions along the x-axis in adjacent cooling channels with the same (Case D1) and reversed (Case D2) flow directions are presented in Figure 16. Due to the symmetrical distribution of Case D1, the results for one channel are plotted and shown in Figure 16a. Using the flow pattern of the reversed flow directions, the “weakened” region disappears due to the transverse heat conduction of two adjacent channels and the fluid increases along the streamwise direction more smoothly. The wall temperature distributions exhibit great differences in Figure 16b. For Case D1, the wall temperature first increases to the maximum value and then gradually decreases. However, for Case D2, the maximum temperature is much lower and the distributions become more uniform. It is indicated that heat conduction inside solid materials is more dominant in determining the wall temperature compared with the convective heat transfer from the fluid due to the excellent thermal conductivity of the steel. Overall, the pattern of reversed flow directions greatly promotes the heat transfer between the two adjacent solid channels and avoids local high-temperature regions in Case D1. For HTC, Case D1 exhibits a trend of firstly decreasing and then quickly increasing, as shown in Figure 16c. For the pattern with reversed flow directions, the fluctuations in HTC are relatively gentle, despite showing the same trend.
To further analyze the bulk fluid and average wall temperature distributions for Case D1 and Case D2, the maximum temperature, average temperature and distribution standard deviations of each channel were extracted from Figure 16 and compared in Table 2.
For bulk fluid temperature, the maximum temperatures in Case D1 and Case D2 are relatively close. The average temperature in Case D2 is lower than that in Case D1 by 2.09%, but the standard deviation is slightly higher than that in Case D1 by 8.33%. For average wall temperature, the maximum temperature in Case D2 reduces by 18.37% compared with Case D1. The standard deviation for Case D2 is much lower than that in Case D1 by 83.21%, which indicates the great improvements in wall temperature uniformity. It is concluded that the adoption of an adjacent channel with reversed flow direction can improve the uniformity of the wall temperature associated with the reduced maximum temperature.

4. Conclusions

In this paper, flow structures and heat transfer characteristics of supercritical CO2 in a rectangular cross-section regenerative cooling channel were investigated under engine-like conditions. The effects of heat flux magnitude, nonuniform heat flux, acceleration and buoyance and flow patterns were considered. The mechanism of heat transfer and three-dimensional flow structure were comprehensively analyzed. The paper provides a good insight into supercritical CO2 used as a coolant for regenerative cooling in a scramjet at an extremely high Mach number. Some significant conclusions from this study are listed as follows:
(1)
With the effect of sharply varied thermophysical properties of supercritical CO2, the wall temperature displays obvious fluctuations in the temperature variation range, especially regarding the core part of the fluid temperature close to the critical point. The phenomenon is more obvious in the case with a higher heat flux magnitude associated with the phenomenon of HTD in the downstream region of 80 < x/H < 120.
(2)
The cases with the linear decreased heat flux distributions enlarge the “weakened” region, which has benefits for heat transfer in the region of 70 < x/H < 90. HTC increases with the increased heat flux in the considered range of 0.75 MW/m2 to 2.25 MW/m2. Compared with channels loaded with increased heat flux, the maximum temperature increases for the cases loaded with decreased heat flux.
(3)
The average temperatures of the fluid and solid both decreased during the period of the fluid approaching the critical point with increased accelerations. Larger HTC distributions were obtained via the case with the larger acceleration, regardless of the acceleration direction. Transverse accelerations can reduce the wall temperature in the upstream region and increase the corresponding HTCs.
(4)
Compared with the case of adjacent channels arranged in the same direction, the wall temperature distribution becomes more uniform for the case arranged with reversed flow directions. It is indicated that heat conduction inside solid materials is more dominant in determining the wall temperature compared with convective heat transfer from the fluid, due to the excellent thermal conductivity of the steel. The maximum temperature decreased by 18.37% and the uniformity of the wall temperature field improved by 83.21%.

Author Contributions

Methodology, J.L. and W.X.; software, M.X. and P.L.; investigation, M.X.; original draft preparation, J.L. and M.X.; review and editing, P.L. and W.X. All authors have read and agreed to the published version of the manuscript.

Funding

This work was supported by the Key Laboratory Continuously Supporting Project (grant no. WDZC6142703202216), the National Natural Science Foundation of China (grant no. 12272133) and the Natural Science Foundation of Hunan Province (grant no. 2023JJ40733).

Data Availability Statement

All the results presented in this paper are available.

Conflicts of Interest

The authors declare no conflict of interest.

Nomenclature

Latin characters
a acceleration (m/s2)
Cp fluid thermal capacity (J/kg·K)
d diameter of the tube (m)
g gravity (m/s2)
h heat transfer coefficient (W/m2·K)
H height of the channel (m)
k turbulent kinetic energy (m2/s2)
P pressure (Pa)
q heat flux (W/m2)
T temperature (K)
x streamwise direction
y spanwise direction
z normal direction
Greek symbols
β thermal expansion coefficient (W/m·K)
λ thermal conductivity (W/m·K)
μ fluid dynamic viscosity (Pa·s)
ρ fluid density (kg/m3)
ω specific energy dissipation rate (s−1)
Subscripts
f fluid
s solid
Abbreviations
HTC heat transfer coefficient
HTD heat transfer deterioration
Re Reynolds number

References

  1. Ehsan, M.M.; Guan, Z.; Klimenko, A.Y. A comprehensive review on heat transfer and pressure drop characteristics and correlations with supercritical CO2 under heating and cooling applications. Renew. Sustain. Energy Rev. 2018, 92, 658–675. [Google Scholar] [CrossRef]
  2. Cabeza, L.F.; de Gracia, A.; Fernández, A.I.; Farid, M.M. Supercritical CO2 as heat transfer fluid: A review. Appl. Therm. Eng. 2017, 125, 799–810. [Google Scholar] [CrossRef] [Green Version]
  3. Liu, G.; Huang, Y.; Wang, J.; Liu, R. A review on the thermal-hydraulic performance and optimization of printed circuit heat exchangers for supercritical CO2 in advanced nuclear power systems. Renew. Sustain. Energy Rev. 2020, 133, 110290. [Google Scholar] [CrossRef]
  4. Lecompte, S.; Ntavou, E.; Tchanche, B.; Kosmadakis, G.; Pillai, A.; Manolakos, D.; De Paepe, M. Review of Experimental Research on Supercritical and Transcritical Thermodynamic Cycles Designed for Heat Recovery Application. Appl. Sci. 2019, 9, 2571. [Google Scholar] [CrossRef] [Green Version]
  5. Xie, J.; Liu, D.; Yan, H.; Xie, G.; Boetcher, S.K. A review of heat transfer deterioration of supercritical carbon dioxide flowing in vertical tubes: Heat transfer behaviors, identification methods, critical heat fluxes, and heat transfer correlations. Int. J. Heat Mass Transf. 2020, 149, 119233. [Google Scholar] [CrossRef]
  6. Xu, W.; Li, M.; Li, Y.; Zhao, J. A comprehensive review of the effect of lubricant on the flow characteristics of supercritical CO2 during cooling. Int. J. Refrig. 2022, 133, 145–156. [Google Scholar] [CrossRef]
  7. Fan, Y.; Tang, G.; Li, X.; Yang, D. General and unique issues at multiple scales for supercritical carbon dioxide power system: A review on recent advances. Energy Convers. Manag. 2022, 268, 115993. [Google Scholar] [CrossRef]
  8. Yan, C.; Xu, J.; Wang, S.; Liu, G. Numerical study of convective heat transfer to supercritical CO2 in vertical heated tubes. Int. Commun. Heat Mass Transf. 2022, 137, 106242. [Google Scholar] [CrossRef]
  9. Khalesi, J.; Sarunac, N.; Razzaghpanah, Z. Supercritical CO2 conjugate heat transfer and flow analysis in a rectangular microchannel subject to uniformly heated substrate wall. Therm. Sci. Eng. Prog. 2020, 19, 100596. [Google Scholar] [CrossRef]
  10. Pandey, S.; Laurien, E.; Chu, X. A modified convective heat transfer model for heated pipe flow of supercritical carbon dioxide. Int. J. Therm. Sci. 2017, 117, 227–238. [Google Scholar] [CrossRef]
  11. Zhang, Q.; Li, H.; Liu, J.; Lei, X.; Wu, C. Numerical investigation of different heat transfer behaviors of supercritical CO2 in a large vertical tube. Int. J. Heat Mass Transf. 2020, 147, 118944. [Google Scholar] [CrossRef]
  12. Li, W.; Yu, Z.; Wang, Y.; Li, Y. Heat transfer of supercritical carbon dioxide in a tube-in-tube heat exchanger—A CFD study. J. Supercrit. Fluids 2022, 181, 105493. [Google Scholar] [CrossRef]
  13. Ye, K.; Zhang, Y.; Yang, L.; Zhao, Y.; Li, N.; Xie, C. Modeling convective heat transfer of supercritical carbon dioxide using an artificial neural network. Appl. Therm. Eng. 2018, 150, 686–695. [Google Scholar] [CrossRef]
  14. Liu, Z.; He, Y.; Li, Y.; Qu, Z.; Tao, W. Heat transfer characteristics of supercritical CO2 flow in metal foam tubes. J. Supercrit. Fluids 2015, 101, 36–47. [Google Scholar] [CrossRef]
  15. Wang, J.; Guan, Z.; Gurgenci, H.; Hooman, K.; Veeraragavan, A.; Kang, X. Computational investigations of heat transfer to supercritical CO2 in a high horizontal tube. Energy Convers. Manag. 2018, 157, 536–548. [Google Scholar] [CrossRef]
  16. Zhang, G.; Hu, P.; Chen, L.; Liu, M. Experimental and simulation investigation on heat transfer characteristics of in-tube supercritical CO2 cooling flow. Appl. Therm. Eng. 2018, 143, 1101–1113. [Google Scholar] [CrossRef]
  17. Xu, W.; Li, Y.; Wang, Y.; Li, M.; Zhao, J.; Li, M.; Tian, H. Experimental investigations on cooling heat transfer of CO2-lubricant mixtures in horizontal tubes at supercritical pressure: A review. Int. J. Refrig. 2022, 139, 168–179. [Google Scholar] [CrossRef]
  18. Yuan, N.; Bi, D.; Zhai, Y.; Jin, Y.; Li, Z.; Wang, H. Flow and heat transfer performance of supercritical pressure carbon dioxide in pipes with discrete double inclined ribs. Int. J. Heat Mass Transf. 2020, 149, 119175. [Google Scholar] [CrossRef]
  19. Dong, X.; Zhang, C.; Wu, Y.; Lu, Y.; Ma, C. Thermodynamic Analysis and Optimization Design of a Molten Salt–Supercritical CO2 Heat Exchanger. Energies 2022, 15, 7398. [Google Scholar] [CrossRef]
  20. Wang, X.; Xu, W.; Xu, B.; Xiong, C.; Guo, S.; Chen, Z. Theoretical and numerical analysis of conjugate heat transfer for supercritical CO2 flowing in printed circuit heat exchanger. J. Supercrit. Fluids 2022, 189, 105717. [Google Scholar] [CrossRef]
  21. Chu, W.; Li, X.; Ma, T.; Chen, Y.; Wang, Q. Experimental investigation on SCO2-water heat transfer characteristics in a printed circuit heat exchanger with straight channels. Int. J. Heat Mass Transf. 2017, 113, 184–194. [Google Scholar] [CrossRef]
  22. Sarkar, J. Improving thermal performance of micro-channel electronic heat sink using supercritical CO2 as coolant. Therm. Sci. 2019, 23, 243–253. [Google Scholar] [CrossRef] [Green Version]
  23. Awais, A.A.; Saeed, M.; Kim, M.H. Performance enhancement in minichannel heat sinks using supercritical carbon dioxide (sCO2) as a coolant. Int. J. Heat Mass Transf. 2021, 177, 121539. [Google Scholar] [CrossRef]
  24. Cheng, K.; Zhou, J.; Zhang, H.; Huai, X.; Guo, J. Experimental investigation of thermal-hydraulic characteristics of a printed circuit heat exchanger used as a pre-cooler for the supercritical CO2 Brayton cycle. Appl. Therm. Eng. 2020, 171, 115116. [Google Scholar] [CrossRef]
  25. Reznicek, E.P.; Hinze, J.F.; Nellis, G.F.; Anderson, M.H.; Braun, R.J. Simulation of the supercritical CO2 recompression Brayton power cycle with a high-temperature regenerator. Energy Convers. Manag. 2021, 229, 113678. [Google Scholar] [CrossRef]
  26. Muto, Y.; Ksto, Y. Optimal Cycle Scheme of Direct Cycle Supercritical CO2 Gas Turbine for Nuclear Power Generation Systems. J. Power Energy Syst. 2008, 2, 1060–1073. [Google Scholar] [CrossRef] [Green Version]
  27. Jiang, J.; Zhang, R.; Le, J.; Liu, W.; Yang, Y.; Zhang, L.; Zhao, G. Regeneratively cooled scramjet heat transfer calculation and comparison with experimental data. Proc. Inst. Mech. Eng. Part G J. Aerosp. Eng. 2014, 228, 1227–1234. [Google Scholar] [CrossRef]
  28. Lee, S.H.; Lee, J.; Kim, D.; Kim, S.; Yang, I. Heat transfer characteristics of kerosene phase change based on fuel flow rates in the regenerative cooling heat exchanger of scramjet engines. J. Mech. Sci. Technol. 2021, 35, 2733–2741. [Google Scholar] [CrossRef]
  29. He, N.; Liu, C.; Pan, Y.; Liu, J. Progress of Coupled Heat Transfer Mechanisms of Regenerative Cooling System in a Scramjet. Energies 2023, 16, 1025. [Google Scholar] [CrossRef]
  30. Liu, J.; Xu, M.; Ma, K.; Liu, C.; Xi, W. Heat transfer and flow structures of supercritical n-decane in a regenerative cooling channel loaded with non-uniform heat flux. Front. Energy Res. 2022, 126, 16648714. [Google Scholar] [CrossRef]
  31. Zhang, J.; Zhou, Q.; Zhao, X.; Jiang, Y.; Fan, W. Numerical Investigation on the Heat Transfer of n-Decane in a Horizontal Channel with Axially Nonuniform Heat Flux under Supercritical Pressure. Aerospace 2022, 9, 326. [Google Scholar] [CrossRef]
  32. Zhang, T.; Jing, T.; Qin, F.; Sun, X.; Li, W.; He, G. Topology optimization of regenerative cooling channel in non-uniform thermal environment of hypersonic engine. Appl. Therm. Eng. 2023, 219, 119384. [Google Scholar] [CrossRef]
  33. Zhang, C.; Gao, H.; Zhao, J.; Zhou, J.; Wen, D. Cooling performance optimization of supercritical hydrocarbon fuel via bi-directional flow pattern. Appl. Therm. Eng. 2022, 212, 118563. [Google Scholar] [CrossRef]
  34. Yu, J.; Huang, L.; Sun, S.; Yu, J.; Li, Y. Flow and heat transfer of RP-3 aviation kerosene in horizontal tube at supercritical pressure under altered gravity levels. Appl. Therm. Eng. 2022, 207, 118162. [Google Scholar] [CrossRef]
  35. Jia, D.; Wang, N.; Pan, Y.; Liu, C.; Wang, S.; Yang, K.; Liu, J. Flow and Heat Transfer Characteristics of Supercritical N-Decane in Adjacent Cooling Channels with Opposite Flow Directions. Energies 2021, 14, 1071. [Google Scholar] [CrossRef]
  36. Wen, J.; Gu, X.; Liu, Y.; Wang, S.; Li, Y. Effect of surface tension, gravity and turbulence on condensation patterns of R1234ze(E) in horizontal mini/macro-channels. Int. J. Heat Mass Transf. 2018, 125, 153–170. [Google Scholar] [CrossRef]
  37. Tian, K.; Yang, P.; Tang, Z.; Wang, J.; Zeng, M.; Wang, Q. Effect of pyrolytic reaction of supercritical aviation kerosene RP-3 on heat and mass transfer in the near-wall region. Appl. Therm. Eng. 2021, 197, 117401. [Google Scholar] [CrossRef]
  38. Sun, F.; Li, Y.; Sunden, B.; Xie, G. The transport and thermodynamic characteristics of thermally oscillating phenomena in a buoyancy-driven supercritical fuel flow. Int. J. Therm. Sci. 2021, 159, 106550. [Google Scholar] [CrossRef]
  39. Gou, J.; Yan, Z.; Hu, J.; Gao, G.; Gong, C. The heat dissipation, transport and reuse management for hypersonic vehicles based on regenerative cooling and thermoelectric conversion. Aerosp. Sci. Technol. 2021, 108, 106373. [Google Scholar] [CrossRef]
  40. Zhu, Y.; Peng, W.; Xu, R.; Jiang, P. Review on active thermal protection and its heat transfer for airbreathing hypersonic vehicles. Chin. J. Aeronaut. 2018, 31, 1929–1953. [Google Scholar] [CrossRef]
  41. Zhang, S.; Li, X.; Zuo, J.; Qin, J.; Cheng, K.; Feng, Y.; Bao, W. Research progress on active thermal protection for hypersonic vehicles. Prog. Aerosp. Sci. 2020, 119, 100646. [Google Scholar] [CrossRef]
  42. Harvey, A.; Bell, I.; Huber, M.; Laesecke, A.; Lemmon, E.; Meyer, C.; Muzny, C.; Perkins, R. Thermophysical Properties of Carbon Dioxide and CO2-Rich Mixtures, Report to US Department of Energy. 2016. Available online: https://tsapps.nist.gov/publication/get_pdf.cfm?pub_id=919336 (accessed on 8 May 2023).
  43. Li, Z.; Jiang, P.; Zhao, C.; Zhang, Y. Experimental investigation of convection heat transfer of CO2 at supercritical pressures in a vertical circular tube. Exp. Therm. Fluid Sci. 2010, 34, 1162–1171. [Google Scholar] [CrossRef]
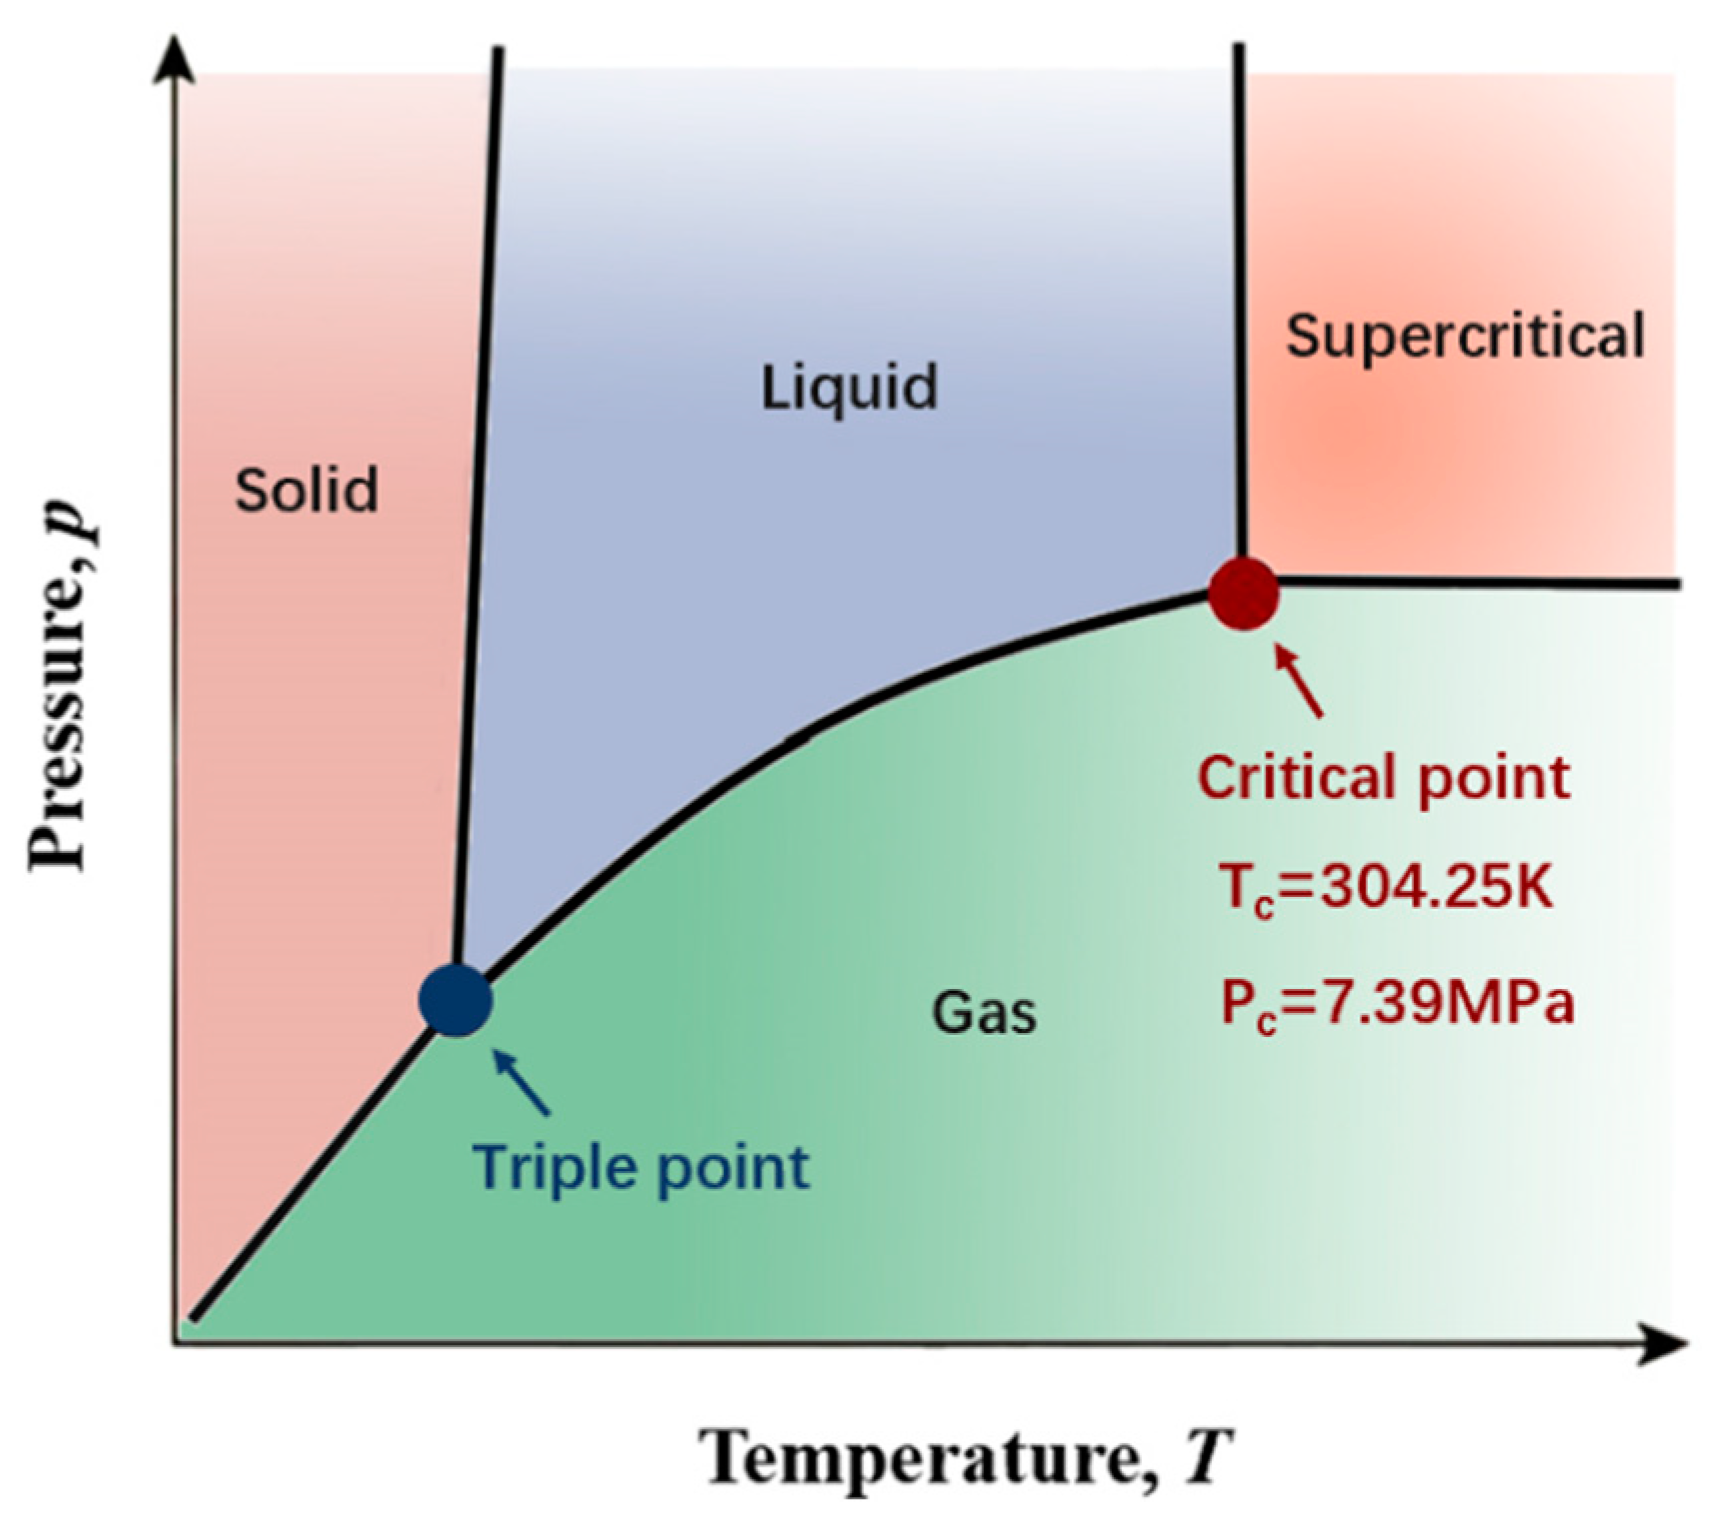
Figure 1. Pressure–temperature diagram of supercritical CO2.
Aerospace 10 00564 g001
Figure 2. Schematic diagram of regenerative cooling in a scramjet.
Aerospace 10 00564 g002
Figure 3. Schematic diagram of regenerative cooling channel used in this paper.
Aerospace 10 00564 g003
Figure 4. The cross-section of the grids’ systems.
Aerospace 10 00564 g004
Figure 5. Thermophysical properties of supercritical CO2 at 8 MPa. (a) Thermal capacity and thermal conductivity; (b) density and viscosity.
Aerospace 10 00564 g005
Figure 6. (a) The circular tube used for simulation; (b) Verification of the turbulence model.
Aerospace 10 00564 g006
Figure 7. Comparison of center line temperature for the heated wall calculated by four grid systems: (a) center line wall temperature distributions; (b) maximum wall temperature.
Aerospace 10 00564 g007
Figure 8. Temperature and HTC distributions for cases with uniform heat flux distributions. (a) Fluid temperature; (b) average wall temperature; (c) HTC.
Aerospace 10 00564 g008
Figure 9. Diagram of nonuniform heat flux distribution. (a) For Case B1–B3 (loaded with increased heat flux distributions); (b) For Case B4–B6 (loaded with decreased heat flux distributions).
Aerospace 10 00564 g009
Figure 10. Temperature and HTC distributions for cases with nonuniform heat flux distributions. (a1) Fluid temperature for cases with increased heat flux distributions; (a2) average wall temperature for cases with increased heat flux distributions; (a3) HTC for cases with increased heat flux distributions; (b1) fluid temperature for cases with decreased heat flux distributions; (b2) wall temperature for cases with decreased heat flux distributions; (b3) HTC for cases with increased heat flux distributions.
Aerospace 10 00564 g010
Figure 11. Temperature contours of the bottom wall for cases with increased and decreased heat flux distributions.
Aerospace 10 00564 g011
Figure 12. Streamlines and temperature contours on y-z sections for the cases with nonuniform heat flux distributions. (a) Case B1; (b) Case B4.
Aerospace 10 00564 g012
Figure 13. Comparison of temperature and HTC distributions for cases with different kinds of accelerations. (a1) Average fluid temperature for cases with different acceleration magnitudes; (a2) average wall temperature for cases with different acceleration magnitudes; (a3) HTC for cases with different acceleration magnitudes; (b1) fluid temperature for cases with different acceleration directions; (b2) wall temperature for cases with different acceleration directions; (b3) HTC for cases with different acceleration directions.
Aerospace 10 00564 g013
Figure 14. Streamlines and temperature contours on y-z sections for the cases with ±3 g accelerations. (a) Case C4 (−3 g); (b) Case C5 (+3 g).
Aerospace 10 00564 g014
Figure 15. Bulk fluid temperature contours along x-axials in adjacent cooling channels. (a) Case D1; (b) Case D2.
Aerospace 10 00564 g015
Figure 16. Temperature and HTC distributions along x-axials in adjacent cooling channels with the same and reversed flow directions: (a) fluid temperature; (b) average wall temperature; (c) HTC.
Aerospace 10 00564 g016
Table 1. All of the cases considered in the paper. A: Effect of heat flux magnitude; B: effect of heat flux distributions; C: effect of acceleration and buoyancy; D: effect of flow pattern.
Study
Variables
Case NameHeat Flux Function/
Correlation (MW/m2)
Channel Form and Flow PatternAcceleration Value (m/s2)
Uniform
heat flux
distribution
A1Uniform, q = 1.5Singleaz = −9.81
A2Uniform, q = 3Singleaz = −9.81
A3Uniform, q = 6Singleaz = −9.81
Nonuniform heat flux
distribution
B1Increased, q = 0.75 + 3.75x
Increased, q = 1 + 2.5x
Increased, q = 1.25 + 1.25x
Decreased, q = 2.25 − 3.75x
Decreased, q = 2 − 2.5x
Decreased, q = 1.75 − 1.25x
Singleaz = −9.81
B2
B3
B4
B5
B6
Acceleration and buoyancy effectsC1Uniform, q = 1.5Singleaz = 0
C2az = −9.81
C3az = −19.62
C4az = −29.43
C5az = 29.43
C6
C7
ax = 14.715, az = 25.487 (30°)
ax = 25.487, az = −14.715 (60°)
Flow patternD1Uniform, q = 1.5Adjacent,
same direction
az = −9.81
D2Adjacent,
reversed direction
Table 2. Maximum temperature, average temperature and distribution standard deviations of y-z sections in Case D1 and Case D2.
Temperature TypeCase NameMaximum
Temperature (K)
Average
Temperature (K)
Distribution Standard
Deviation (K)
Bulk fluid
temperature
Case D141133536
Case D2411 (0)328 (−2.09%)39 (+8.33%)
Average wall
temperature
Case D11192971137
Case D2973 (−18.37%)946 (−2.57%)23 (−83.21%)
Disclaimer/Publisher’s Note: The statements, opinions and data contained in all publications are solely those of the individual author(s) and contributor(s) and not of MDPI and/or the editor(s). MDPI and/or the editor(s) disclaim responsibility for any injury to people or property resulting from any ideas, methods, instructions or products referred to in the content.