Due to the small number of scenarios in which planetary gearboxes are used, they often have limited data problems, and there are almost no public data. In addition, compared to parallel gearboxes, their structure is more complex, and their signal composition is relatively complicated, making their diagnosis a difficult task. In contrast, parallel gearbox data are relatively easier to obtain, so in this paper, the unlabeled public University of Connecticut (UoC) parallel gearbox dataset [
32,
33] is used as the pre-training dataset. To verify the effectiveness and superiority of SBYOL, SBYOL first performs self-supervised signal representation learning on the unlabeled pre-training dataset; then, the learned feature extractor is transferred to the private Drivetrain Prognostics Simulator (DPS) planetary gearbox under limited data conditions and uses the public SEU planetary gearbox dataset [
34] for further validation. To further validate the robustness and generalizability of SBYOL, this paper further increases the difficulty by using the trained feature extractors for fault diagnosis in limited data cases on two public datasets, the Paderborn University (PU) bearing dataset [
35] and the Polytechnic University of Turin (PUT) aero-engine bearing dataset [
36], which are characterized by completely different types of equipment than the pre-training parallel gearbox data. The data distribution between the pre-training dataset and the target diagnostic object is significantly different, and thus, it can be effectively verified that SBYOL learns a universal feature extractor that can efficiently diagnose different types of rotating machines under limited data.
4.1. Self-Supervised on the Unlabeled Pre-Training Parallel Gearbox Dataset
In this paper, the UoC parallel gearbox fault dataset [
32,
33] provided by the University of Connecticut is used as the unlabeled pre-training dataset, which is the most difficult public dataset with different failure modes and degrees [
37]. The dataset is collected at 20 kHz and introduces nine different gear states for pinions on the input shaft, including health condition, missing tooth, root crack, spalling, and chipping tip with five different levels of severity, and they are labeled from 0 to 8, respectively. The test rig is shown in
Figure 5.
Our method selects the raw vibration signal as the input data without any signal pre-processing, and 4096 was chosen as the sample length to contain enough information. In addition, the overlap length between two adjacent samples is 3036 when using the sliding segmentation method to obtain training samples, thus greatly increasing the size of the pre-training dataset. This is also a data augmentation strategy that increases the consideration of temporal offset; however, the information capacity of the dataset does not increase. To mimic the phenomenon of intercepting a signal from a long sampling signal, this paper treats approximately 9.43 s of data as a long sampling signal with 175 samples intercepted from a single sampling signal, and finally, an unlabeled pre-training dataset containing nine classes with 350 samples per class is obtained.
Since this paper uses both time-domain and frequency-domain data for learning and even contains learning between different samples, the data distribution between them is quite different; the learning task is also more complicated, and 0.1 is chosen as the initial learning rate. In this study, we adopted the numerical values of Momentum and Weight decay from [
24], while the update parameter τ was derived from [
18]. Regarding data augmentation methods, using larger values can enhance the model’s noise resistance capability. However, it is essential to strike a balance and avoid excessive values that may lead to information overload. The specific hyperparameter values are shown in
Table 1. It is worth noting that all the data augmentation methods except TFC and SCC are implemented with a probability of 0.5 to increase the complexity of the pretext task. The learning rate is updated by the cosine learning rate scheduler with the following formula.
where
is the initial learning rate,
is the current learning rate,
is the maximum number of epochs, and
is the current epoch.
The model has a parameter count of 8.48 million and achieves a computational efficiency of 2.81 billion floating-point operations per second (GFLOPs). The experimental environment was PyTorch 1.11 under Windows 11, running on a computer with the following configuration: i5-12400F, NVIDIA RTX 3060, 16 GB RAM. The changes in the loss values during the training process are shown in
Figure 6, from which it can be found that the loss values become smooth in the later stages of training indicating that the model has reached the fitting state, and the total training time is about 6.5 h.
As a comparison, other self-supervised learning methods, SimSiam [
39], SimCLR, BYOL, MoCo, and SMoCo, are also used in this paper for self-supervised pre-training on the unlabeled pre-training dataset. In addition, to further demonstrate the powerful performance of SBYOL, this paper also uses the labeled pre-training dataset for supervised pre-training, called Labeled Pre-Training. To exclude the influence of other factors, the backbone network of all methods is ResNet-18, which is trained using time-domain signals. After training, the feature extractors of all methods, i.e., the convolutional layers of ResNet-18, are used to extract features from a portion of the pre-training dataset and downscale it to two dimensions using T-SNE for visualization; the results are shown in
Figure 7. Our method, SBYOL, achieves very good results with inter-class separation and intra-class aggregation, reaching the results of Labeled Pre-Training. In the face of such complex data, other self-supervised methods not only have no clustering within the class but also do not have an effective separation between classes, and only SMoCo performs better roughly achieving clustering of three classes of samples.
4.2. Application on Planetary Gearbox from Private DPS Test Rig
In this section, the pre-trained SBYOL feature extractor is used to perform fault diagnosis on the planetary gear from our Drivetrain Prognostics Simulator (DPS) test rig, which is characterized by a different device with different failure levels, different failure modes, and different working conditions compared with the unlabeled pre-training dataset.
The Drivetrain Prognostics Simulator is shown in
Figure 8a which is manufactured by Spectra Quest, U.S.A. The test rig is mainly composed of the following parts: driver (control cabinet), lubrication system, drive motor, testing planetary gearbox, three load parallel gearboxes, load motor and supporting torque transducer and force transducer, etc. The testing planetary gearbox of this test rig is a one-stage drive, compared with the parallel gearbox, it has a more complex structure, including the central fixed sun wheel, planetary frame, and gear ring, and also includes four planetary wheels that change with the sun wheel rotation center at all times; the signal composition is very complex, and therefore, fault diagnosis is a more difficult task. During the data collection, we collected gear data for five states, including wear, broken teeth, missing teeth, root crack, and healthy, where the four failure modes of the gears are shown in
Figure 9.
Two vibration sensors were used in the experiment, one is an end cap sensor shown in
Figure 8b, and the other is a three-phase sensor mounted on the box shown in
Figure 8c. The sampling frequency is 12.8 kHz. Due to the complex transmission path of the fault signal through the gear, shaft, bearing, and end cup to reach the box, the signal collected by the box vibration sensor will become weak. To verify the effectiveness of SBYOL in extreme cases, this paper selects the Z-axis box vibration signal, which is more in line with the complex environment in the actual diagnosis task. To reflect the extremely limited data situation in the actual diagnosis process, only 5 samples per class are used in the training set, and 50 samples per class are used in the testing set. The details of the DPS gear dataset are shown in
Table 2, which contains two working conditions, and the length of each sample is still 4096.
To demonstrate the performance of the feature extractors learned on the unlabeled pre-training dataset, this paper uses the pre-trained feature extractors to perform feature extraction on the DPS testing set without any training and visualizes the results using T-SNE as shown in
Figure 10. The features extracted by SBYOL without any adaptation of the target diagnostic object can be segmented between different classes and aggregated of the same class, far surpassing other self-supervised methods, and even Labeled Pre-Training. SMoCo also adopts the way of extracting features from the time and frequency domains simultaneously, and its feature extraction effect on the testing set data is relatively good, but it lacks unique SCC, and compared to SBYOL, labels 4, 8, and 9 are too close, so it is more prone to errors with very few training data.
To fully demonstrate the superiority of our method in the target diagnosis task, we also added MixMatch [
40], ResNet-18, and FFT + SVM as comparisons for the target diagnostic dataset. Among them, MixMatch is a powerful semi-supervised method that uses both an unlabeled pre-training dataset and labeled target diagnostic training set for training. ResNet-18 uses only the targeted diagnostic training set for supervised learning and does not use the unlabeled pre-training dataset as the baseline model. FFT + SVM is a classical and effective method for fault diagnosis under limited data. The method first performs FFT transformation on the original signal and then classifies the FFT transformed features using SVM. The diagnostic accuracy of each method is shown in
Table 3 and
Figure 11. In addition, to ensure the fairness of the experiments, other self-supervised learning methods also use fixed weights for feature extraction, and then SVM is used as the classifier. For Labeled Pre-Training, the training is performed in the standard pre-training plus fine-tuning manner, i.e., a linear projection is trained, and fine-tuning of the convolutional layers with a small learning rate is performed. The accuracy scores are averaged and calculated ten times to eliminate computational errors, and the corresponding standard deviation (STD) is calculated to verify their robustness.
As can be seen from
Table 3 and
Figure 11, SBYOL achieves the best results reaching an accuracy of 97.14% in the face of a complex planetary gearbox, which greatly surpasses other methods. This is also consistent with the feature visualization performance in
Figure 10, where SBYOL’s feature extractor can distinguish well between classes without training with the target diagnostic object. Consequently, only a small number of samples are required to construct a highly accurate classification boundary. Furthermore, the volatility of the feature extractor is relatively low, with a standard deviation of only 1.60. In addition, since SBYOL only acts as a fixed-weight feature extractor, its application to downstream diagnostic tasks is also very efficient, requiring only 2.43 s. For Labeled Pre-Training, although its diagnostic accuracy is improved compared to the baseline ResNet-18, its performance is far inferior to SBYOL for cross-device diagnostic problems under limited data because of its feature extractor obtained by supervised learning on the pre-training dataset. Other self-supervised learning methods perform poorly compared to SBYOL due to the lack of our unique TFST and gaps in the structure. For FFT + SVM, its performance is better than that of ResNet-18 in the case of limited data, which utilizes only time-domain features, but its diagnostic accuracy is not high in the face of complex diagnostic problems. MixMatch is trained with both target diagnostic data and unlabeled pre-training data, so it can adapt the pre-training data to the target diagnostic data to achieve good diagnostic accuracy. However, the accuracy of MixMatch is lower than SBYOL, and since it uses a large amount of unlabeled data for training at the same time, it is much slower than our method to apply it to the target diagnostic task.
This paper further explores the performance of SBYOL in the case of extremely limited target training samples and uses the other two best-performing methods, BYOL and SMoCo, as a comparison. A total of five sets of experiments are conducted with training data sizes between 1 and 5 for each class, and the results are shown in
Table 4 and
Figure 12. In all cases, SBYOL achieved the best results, even with only two samples per class to achieve the best performance of other methods with five samples per class. In the extreme case of one sample per class, the accuracy decreases more due to the deviation from the classification plane, but even so, the best performance is achieved. As can be seen in
Figure 12b, the stability of each method increases as the number of data increases, while SBYOL achieves the smallest STD in almost all cases. The results show that SBYOL has strong diagnostic performance and robustness against limited data conditions.
In addition, the noise interference immunity of SBYOL is further validated to demonstrate its robustness and effectiveness under different signal-to-noise ratio (SNR) conditions. The two best-performing methods BYOL and SMoCo are also selected for comparison. A total of six sets of experiments with an SNR from 0 to 10 are conducted for each method using the full training set, i.e., five samples per class, and the results are shown in
Table 5 and
Figure 13. Compared with the two methods, SBYOL achieves the best results; even in the case of strong noise at 0 dB, it can achieve approximately 94% accuracy, proving its robustness to noise. In addition, as shown in
Figure 13b, the overall standard deviation of SBYOL decreases as the noise diminishes, and is lower than the other two methods, which proves that SBYOL has good robustness to noise.
4.3. Verification on the Public Planetary Gearbox Dataset
To verify that the SBYOL pre-trained on parallel gearboxes can well solve the fault diagnosis of planetary gearboxes, the public SEU dataset is selected for further validation in this paper. The SEU dataset [
34] provided by Southeast University was obtained on the drivetrain dynamic simulator (DDS), which contains two operating conditions with the rotating speed system load set to 20 Hz—0 V and 30 Hz—2 V, respectively. The test rig is shown in
Figure 14. In each file, there are eight rows of vibration signals; in this paper, we use the second row of vibration signals, which means the x-axis vibration signal, and the length of each sample is still 4096. In addition, only 5 samples per class are used in the training set, and 50 samples per class are used in the testing set, and the specific information of the SEU dataset is shown in
Table 6.
Similarly, feature extraction was performed on the SEU testing set using the feature extractors obtained by pre-training on the UoC dataset with fixed weights and visualized using T-SNE, and the results are shown in
Figure 15. SBYOL can achieve excellent results in terms of extracted features without using any target diagnostic object for training, which is far better than other methods. SMoCo also achieves relatively good feature extraction results, but compared with SBYOL, the same category such as labels 5, 6, 7, 8, and 9 are not aggregated enough, and the two categories of labels 7 and 9 are too close to each other and are more prone to errors when there are limited training data.
The same methods were used for fault diagnosis on the SEU dataset, and the results are shown in
Table 7 and
Figure 16. The SBYOL method achieves the best diagnostic results in the face of a different device of the planetary gearbox, reaching an accuracy of 99.50%, which greatly exceeds other methods, and the STD of SBYOL is also only 0.47 because of its excellent feature extraction. Although SMoCo and MixMatch also achieve good diagnostic accuracy, they are still far inferior to SBYOL. In addition, since MixMatch needs to be retrained for each new diagnostic task, it is much slower than our method to apply it to the target diagnostic task.
This paper also further explores the performance of SBYOL in the case of extremely limited training samples and selects the two best-performing methods, SMoCo and MixMatch, for comparison, and the results are shown in
Table 8 and
Figure 17. The best results are obtained for SBYOL with different training sample sizes, even with an accuracy of 98.24% for three samples per class. MixMatch’s performance is greatly degraded under extremely limited labeled datasets due to the lack of our unique data augmentation method. As can be seen in
Figure 17b, the stability of each method increases as the number of data increases, while SBYOL achieves the smallest STD in all cases.
In addition, this paper further verifies the ability of SBYOL to resist noise interference. Since MixMatch does not have the unique data augmentation possessed by the self-supervised learning methods, its noise immunity is poor; two methods with good performance and stability, BYOL and SMoCo, are selected for comparison, and the results are shown in
Table 9 and
Figure 18. Compared to these two methods, SBYOL achieves the best results, even at 4 dB, to reach the performance of the best-performing SMoCo at 10 dB, and its volatility is also the best in most cases. Excessive noise has a greater impact on diagnostic accuracy, but even so, it can achieve an accuracy of about 92% in the case of strong noise at 0 dB.
4.4. Verification on the Bearing Dataset
From the above experiments, the feature extractor obtained by SBYOL pre-training on the parallel gearbox well solves the fault diagnosis problem of planetary gearboxes. Therefore, to further validate that the pre-trained SBYOL learns a universal feature extractor, this section uses the PU bearing data and the PUT aero-engine high-speed bearing data as target diagnostic objects, respectively. The bearing data used have the characteristics of completely different types of equipment from the pre-training gear data.
The bearing dataset of Paderborn University (PU) was presented by Christian Lessmeier et al. [
35] in 2016, and the experimental test rig is shown in
Figure 19. In this dataset, there are multiple bearings divided into three main groups: 6 healthy bearings, 12 artificially damaged bearings, and 14 bearings with natural operation generating faults. The vibration signals were obtained at a sampling rate of 64 kHz and included four working conditions. It is a very difficult dataset in common datasets, which can reflect the difficulty of real fault diagnosis [
37]. Ten types of real damaged bearings in the PU bearing dataset were selected as the target diagnostic dataset to better represent the actual problem, including one type of healthy bearings and two types of mixed faulty bearings. The operating condition is N15_M07_F04; specifically, the rotating speed is 1500 rpm, the loading torque is 0.7 NM, and the radial force is 400 N. The specific information is shown in
Table 10. To reflect the limited data problem faced in the actual diagnosis task, 5 samples are used for each class in the training set, and 50 samples are used for each class in the testing set.
Similarly, the pre-trained feature extractors are used to extract features from the PU bearing testing set with fixed weights and visualize them using T-SNE, and the results are shown in
Figure 20. The SBYOL proposed in this paper achieves amazing feature extraction results for completely different types of bearing devices without using any data of the target diagnostic object for training, which greatly surpasses other methods.
Next, fault diagnosis was performed on the PU dataset, and the results are shown in
Table 11 and
Figure 21. When faced with a diagnostic problem for a completely different type of product, SBYOL achieves a diagnostic accuracy of 99.54%, which greatly exceeds other methods. SBYOL is approximately 12 times faster than Labeled Pre-Training and ResNet18, which require training neural networks, and approximately 500 times faster than MixMatch, which uses both a pre-training dataset and a target diagnostic dataset, when applied to diagnostic tasks. While Labeled Pre-Training can still improve accuracy, it is far less effective than SBYOL when faced with a diagnostic problem on a completely different device and without sufficient data for fine-tuning. In addition, since SBYOL achieves very good feature extraction without further training, its std is small, as shown in
Figure 21b, proving its excellent stability even in the face of different types of bearing devices.
In this paper, the robustness of SBYOL is likewise verified for extremely limited data volumes and under different noises, and two other best-performing methods, MoCo and SMoCo, are selected for comparison; the results are shown in
Table 12 and
Table 13 and
Figure 22 and
Figure 23. SBYOL can achieve very high diagnostic accuracy even when facing the diagnostic problem of a completely different type of product such as a bearing, and it can achieve excellent accuracy in the case of extremely limited data and strong noise, greatly exceeding other methods. SBYOL can achieve a diagnostic accuracy of 94.52% with just one sample per class, and with only three samples per class, it can outperform other methods with five training samples per class. Although SBYOL can achieve good performance with one sample per class, it is prone to deviation from the classification plane in this case, and only two to three samples per class are needed to greatly improve the diagnostic accuracy of SBYOL. In addition, at 0 dB of strong noise, SBYOL even achieves the performance of other best-performing methods at 10 dB, greatly exceeding the performance of other methods. As shown in
Figure 22b and
Figure 23b, the overall stability of all methods continues to improve as the difficulty of diagnosis decreases, i.e., more training data and less noise.
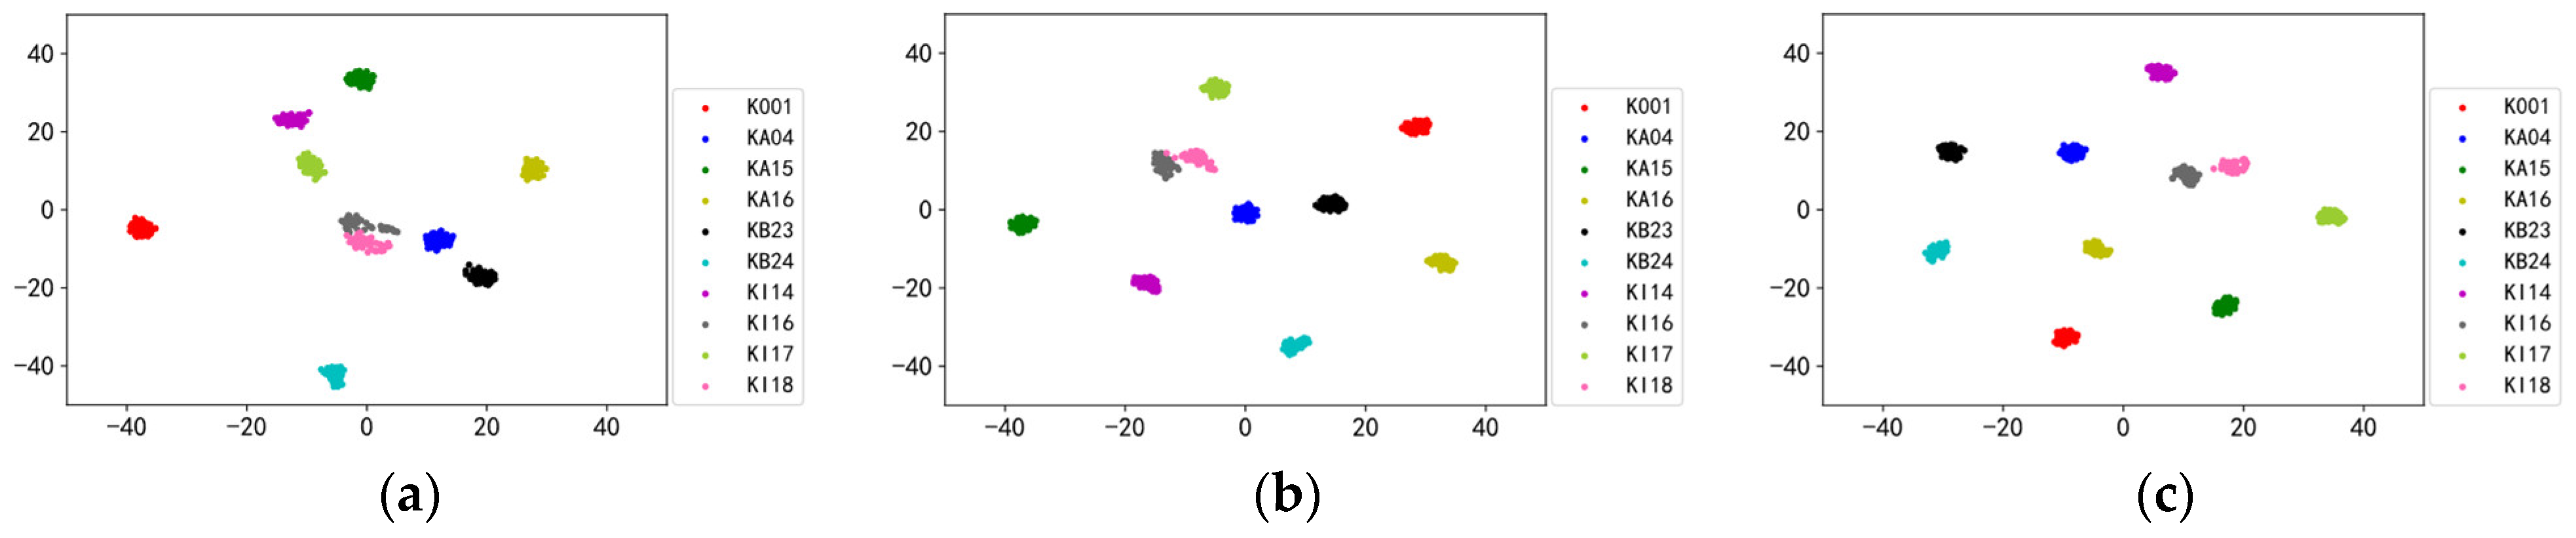
Since SBYOL can achieve extremely high accuracy in the case of strong noise even in the face of completely different types of bearing devices, we further explored the cases of 0 dB, 4 dB, and 8 dB noise, whose corresponding feature extraction results are shown in
Figure 24. With the enhancement of noise, the distance between categories keeps decreasing, and there is a gradual overlap between category KI16 and category KI18, so its diagnostic performance keeps decreasing. However, even with the strong noise of 0 dB, the categories are still well distinguished from each other, and the samples of the same category are aggregated, so it can achieve excellent and stable diagnostic accuracy.
To verify the effectiveness of SBYOL more fully for completely different types of equipment, this paper uses the aero-engine high-speed bearing dataset from the Department of Mechanical and Aeronautical Engineering of the Polytechnic University of Turin (PUT), whose test rig is shown in
Figure 25. For this dataset, we used the vibration acceleration data of aero-engine bearings at different speeds and different damage levels, with a sample length of 4096, and used the y-direction channel data at A1. To reflect the extremely limited data situation in the actual diagnosis process, only 3 samples per class were used in the training set, and 50 samples per class were used in the testing set. The specific dataset information is shown in
Table 14.
The pre-trained feature extractors are used to extract features from the PUT aero-engine high-speed bearing testing set and are visualized using T-SNE, and the results are shown in
Figure 26. The SBYOL method proposed in this paper can achieve such extremely high feature extraction results for the aero-engine high-speed bearing data without using any data of the target diagnostic object for training, which greatly surpasses other methods with large segmentation intervals between categories and the aggregation of data within classes. SMoCo has also achieved good performance, but it is less aggregated than SBYOL for the category labeled 9, and its two categories labeled 7 and 9 are too close together.
Similarly, the fault diagnosis is performed on the PUT aero-engine bearing dataset, and the results are shown in
Table 15 and
Figure 27. The robustness of SBYOL to the size of the training data and different levels of noise is further validated and compared with the two best-performing methods, and the results are shown in
Table 16 and
Table 17 and
Figure 28 and
Figure 29. SBYOL achieves the highest diagnostic accuracy and the smallest STD compared to other methods, even requiring only two samples per class to exceed the performance of SMoCo, which is the best performance among other methods. SBYOL also achieves the best performance in terms of noise immunity, with a diagnostic accuracy of 99.20% at 6 dB, which is comparable to the performance of SimSiam and SMoCo at 10 dB, proving that SBYOL is still robust to noise in the face of completely different devices. In addition, the STD of each method also shows a decreasing trend with the increase in data volume and the decrease in noise.
Table 15.
Comparison results on PUT aero-engine bearing dataset.
Table 15.
Comparison results on PUT aero-engine bearing dataset.
| Method | Accuracy (%) | Time (s) |
|---|
| SBYOL | 99.91 ± 0.12 | 2.59 |
| BYOL | 98.52 ± 1.03 | 2.59 |
| SimSiam | 99.12 ± 1.06 | 2.56 |
| SimCLR | 85.08 ± 2.83 | 2.63 |
| MoCo | 97.94 ± 1.00 | 2.62 |
| SMoCo | 99.60 ± 0.54 | 2.60 |
| MixMatch | 98.18 ± 0.84 | 794.63 |
| Labeled Pre-Training | 94.06 ± 2.09 | 34.12 |
| FFT + SVM | 94.86 ± 3.52 | 0.11 |
| ResNet18 | 82.83 ± 2.88 | 30.18 |
Figure 27.
Comparison results on PUT aero-engine bearing dataset. (a) Accuracy; (b) standard deviation.
Figure 27.
Comparison results on PUT aero-engine bearing dataset. (a) Accuracy; (b) standard deviation.
Table 16.
Comparison results on PUT aero-engine bearing dataset under different volumes of training data.
Table 16.
Comparison results on PUT aero-engine bearing dataset under different volumes of training data.
| Methods | Number of Samples per Class |
|---|
| 1 | 2 | 3 |
|---|
| SBYOL | 98.86 ± 0.21 | 99.82 ± 0.15 | 99.91 ± 0.12 |
| SimSiam | 95.82 ± 2.48 | 98.37 ± 1.35 | 99.12 ± 1.06 |
| SMoCo | 97.28 ± 1.88 | 98.85 ±1.23 | 99.60 ± 0.54 |
Figure 28.
Comparison results on PUT aero-engine bearing dataset under different volumes of training data. (a) Accuracy; (b) standard deviation.
Figure 28.
Comparison results on PUT aero-engine bearing dataset under different volumes of training data. (a) Accuracy; (b) standard deviation.
Table 17.
Comparison results on PUT aero-engine bearing dataset under different SNRs.
Table 17.
Comparison results on PUT aero-engine bearing dataset under different SNRs.
| Methods | SNR |
|---|
| 0 dB | 2 dB | 4 dB | 6 dB | 8 dB | 10 dB |
|---|
| SBYOL | 96.09 ± 0.71 | 97.83 ± 1.05 | 98.97 ± 0.55 | 99.20 ± 0.79 | 99.58 ± 0.26 | 99.78 ± 0.28 |
| SimSiam | 92.65 ± 1.31 | 95.98 ± 1.28 | 96.86 ± 1.55 | 98.09 ± 0.81 | 98.67 ± 0.51 | 98.91 ± 0.69 |
| SMoCo | 96.08 ± 1.26 | 97.71 ± 0.86 | 98.46 ± 0.77 | 98.74 ± 0.71 | 99.26 ± 0.61 | 99.46 ± 0.45 |
Figure 29.
Comparison results on PUT aero-engine bearing dataset under different SNRs. (a) Accuracy; (b) standard deviation.
Figure 29.
Comparison results on PUT aero-engine bearing dataset under different SNRs. (a) Accuracy; (b) standard deviation.
4.5. Robustness to Sampling Time and Data Size of the Pre-Training Dataset
To further explore the requirements of SBYOL for pre-training datasets, in addition to the pre-training dataset size, the sampling time is also an influencing factor due to the unique data augmentation method TFST used by SBYOL. Therefore, this section further explores the robustness of SBYOL to the sampling time and data size of the pre-training dataset. Eight sets of experiments are conducted in this paper including SBYOL-9.43s-350, SBYOL-0.42s-350, SBYOL-9.43s-175, SBYOL-0.42s-175, SBYOL-3.86s-70, SBYOL-0.42s-70, SBYOL-2.01s-35, and SBYOL-0.42s-35. Taking SBYOL-9.43s-350 as an example, 9.43s represents the single sampling time, and 350 represents the number of samples per class in the pre-training dataset. These eight sets of experiments are self-supervised learning on the corresponding UoC pre-training datasets, and the learned feature extractors are then transferred to the DPS dataset, SEU dataset, PU dataset, and PUT dataset, respectively, where the training sets in the DPS dataset, SEU dataset, and PU dataset are still five samples per class, and the training sets in the PUT dataset are three samples per class. In addition, we also used the best-performing SMoCo and MixMatch as a comparison, which used all unlabeled pre-training datasets, i.e., 350 samples per class, and the results are shown in
Table 18 and
Figure 30.
SBYOL still achieves good performance with a smaller sampling time and pre-training dataset size, and the average diagnostic accuracy of SBYOL-0.42s-175 even reaches 98.23% on the four datasets. In addition, SBYOL-0.42s-35 achieves an average diagnostic accuracy of 97.49%, surpassing SMoCo and MixMatch, the best performers among other methods, while only using 10% of the dataset size compared to SMoCo and MixMatch. From comparing SBYOL-9.43s-350 with SBYOL-0.42s-350, SBYOL-9.43s-175 with SBYOL-0.42s-175, SBYOL-3.86s-70 with SBYOL-0.42s-70, and SBYOL-2.01s-35 with SBYOL-0.42s-35, with the same amount of data, a longer sampling signal allows SBYOL to perform better on average over the four datasets. From the comparison of SBYOL-0.42s-350 with SBYOL-9.43s-175, SBYOL-0.42s-175 with SBYOL-3.86s-70, and SBYOL-0.42s-70 with SBYOL-2.01s-35, SBYOL can perform better with a larger amount of data even with shorter sampling time. The performance is closer in the case of 70 and 35 samples per class compared to the difference between 350, 175, and 70 samples per class, proving that it still requires a larger variation in data volume for a larger improvement in performance.
Therefore, from the above results, SBYOL is extremely robust to the pre-training dataset, longer sampling time and larger datasets can achieve better performance, and dataset size improves performance more than sampling time when there is a large difference in dataset size.


