Article

Analyzing the Indirect Effects of Lightning on Unmanned Aerial Vehicle Navigation Receivers

1
Institute of Science and Technology Innovation, Civil Aviation University of China, Tianjin 300300, China
2
Key Laboratory of Civil Aircraft Airworthiness Technology, Civil Aviation University of China, Tianjin 300300, China
3
College of Safety Science and Engineering, Civil Aviation University of China, Tianjin 300300, China
*
Author to whom correspondence should be addressed.
Aerospace 2024, 11(10), 810; https://doi.org/10.3390/aerospace11100810
Submission received: 15 August 2024 / Revised: 23 September 2024 / Accepted: 1 October 2024 / Published: 2 October 2024
(This article belongs to the Section Aeronautics)

Abstract

:
To investigate the interference effects of lightning on unmanned aerial vehicle (UAV) navigation receivers, an analytical approach for the evaluation of indirect lightning effects is suggested. The blocking mechanism of lightning pulses on the receiver is analyzed using the vector method. A behavioral-level simulation model of the receiver’s radio frequency (RF) front-end is constructed, and a lightning pulse injection simulation is performed based on the advanced design system (ADS). The simulation results indicate that lightning pulses induce blocking interference on the RF front-end of the navigation receiver, reducing its sensitivity and dynamic range. This interference is attributed to gain compression and degradation of the noise figure in the low-noise amplifier (LNA). To further validate the simulation results, a pin injection test is carried out to examine the influence of lightning pulses with different peak voltages on receiver sensitivity. The test results indicate a notable reduction in the receiver sensitivity when the lightning pulse peak reaches 250 V. The sensitivity trends across various test panels are consistent, and the damage thresholds are similar. These findings confirm the accuracy of the simulation results.

1. Introduction

Unmanned aerial vehicles (UAVs) are frequently utilized in dangerous and harsh environments as substitutes for manual labor, exposing them to various risks, including the indirect effects of lightning [1,2,3]. During lightning activity, time-varying electromagnetic fields generated by lightning currents can penetrate a UAV’s structure, inducing high voltages and currents in onboard cables and connectors, and potentially causing interference and damage to electronic equipment [4]. The extensive use of carbon fiber composites (CFCs) in UAVs poses an additional challenge; compared with traditional metals, CFCs are less effective at shielding and conducting electricity, increasing the vulnerability of UAVs to electromagnetic interference [5]. Given that the BeiDou Navigation System (BDS) provides high-precision positioning, navigation, and timing services for UAVs, it is particularly susceptible to electromagnetic interference. Such interference can severely disrupt navigation and positioning systems, thereby compromising flight safety [6].
Numerous researchers have investigated the effects of interference of strong electromagnetic pulses on navigation receivers using theoretical, simulation, and experimental methods. Wang et al. [7] analyzed the interference mechanisms of in-band signals on receivers using the power series method, finding that many higher-order terms must be retained to ensure accuracy when the interfering signals have high amplitude. However, this approach becomes computationally intensive for high-amplitude interference, limiting its practical application and making it less suitable for real-time analysis of strong electromagnetic disturbances. Zhang, Q et al. [8] employed the vector method to investigate the blocking interference mechanism on navigation receivers caused by out-of-band large-signal interference, constructing a mathematical model of the tracking loop.
Meng et al. [9] demonstrated that software-based behavioral modeling, such as Advanced Design System (ADS), can effectively assess the effects of interference on receivers, highlighting a notable decrease in the sensitivity during lightning events. However, these approaches often lack experimental validation and fail to address the underlying mechanisms by which indirect lightning effects lead to blocking interference in receivers. Fan et al. [10] simulated the tracking loop of a navigation receiver under continuous wave (CW) interference using MATLAB’s Simulink, version R2019b to evaluate the receiver’s ability to capture navigation signals. While this simulation provides valuable insights into receiver performance under CW interference, it does not consider transient events like lightning pulses and lacks experimental verification to substantiate the simulation results. Zhang, W. et al. [11] investigated the impact of lightning electromagnetic pulses on airborne Global Positioning System (GPS) modules through simulations and experiments. They identified damage thresholds and analyzed receiver behavior under varying interference levels. However, their study mainly addressed the physical damage caused by lightning without providing a comprehensive analysis of the interference process or a theoretical validation of the underlying mechanisms.
Huang et al. [12] utilized the satellite carrier-to-noise ratio as a sensitivity criterion to compare the effects of electromagnetic pulse (EMP) interference and CW interference. Their study examined the impact of pulse duration and repetition frequency on the ability of navigation receivers to acquire and track signals. Rimal et al. [13] utilized the pin injection method to introduce waveforms 4 and 5 A into a DC–DC pulse-width modulated boost converter, examining the effects of indirect lightning on converter functionality.
Despite extensive research, gaps and shortcomings remain in the literature. In studying the indirect effects of lightning on receivers, most current studies have primarily focused on simulations and experimental methods, often lacking theoretical analysis. Moreover, these simulation studies frequently do not provide detailed analysis of the simulation processes themselves. Additionally, much of the research has concentrated on examining the impact of electromagnetic interference on the tracking loops of navigation receivers. However, this narrow focus is inadequate for practical engineering applications, especially concerning the indirect effects of lightning. Electromagnetic interference can trigger various nonlinear effects in the radio frequency (RF) front end of a receiver, which can significantly affect tracking performance and overall receiver functionality. The existing studies often fail to provide a comprehensive analysis of the interference mechanisms, particularly the indirect effects of lightning that lead to blocking interference in receivers. Therefore, a thorough analysis that includes both theoretical and experimental validation of the interference mechanisms in the RF front end is essential for developing effective protection strategies for navigation receivers. The major contributions of our work are as follows:
  • Our analysis shows that lightning pulses can cause the receiver to become saturated or even stop functioning, thereby reducing its sensitivity and dynamic range.
  • To simulate the effects of lightning interference on a UAV navigation receiver, we developed a behavioral model. This model assesses the receiver’s response under various lightning pulse conditions, specifically examining the effects on the sensitivity and dynamic range.
  • To assess the UAV navigation receiver’s response to sudden electrical disturbances and its vulnerability to lightning-induced interference, we conducted tests by injecting signals directly into its input pins. These experiments established the thresholds at which interference occurs and the interference levels that cause damage.
The rest of this article is organized as follows. Section 2 analyzes the blocking interference mechanism caused by lightning pulses. Section 3 presents lightning pulse injection simulations to evaluate the receiver’s performance under different interference conditions. Section 4 describes the lightning pulse injection experiments performed to assess the receiver’s susceptibility to interference. Finally, Section 5 concludes this article by summarizing the main findings, discussing the limitations of the current work, and outlining future research directions. This research investigates the interaction mechanism of lightning pulses on navigation receivers, offering guidance and theoretical support for testing and protective measures against lightning’s indirect effects.

2. Lightning Pulse Blocking Interference Mechanism

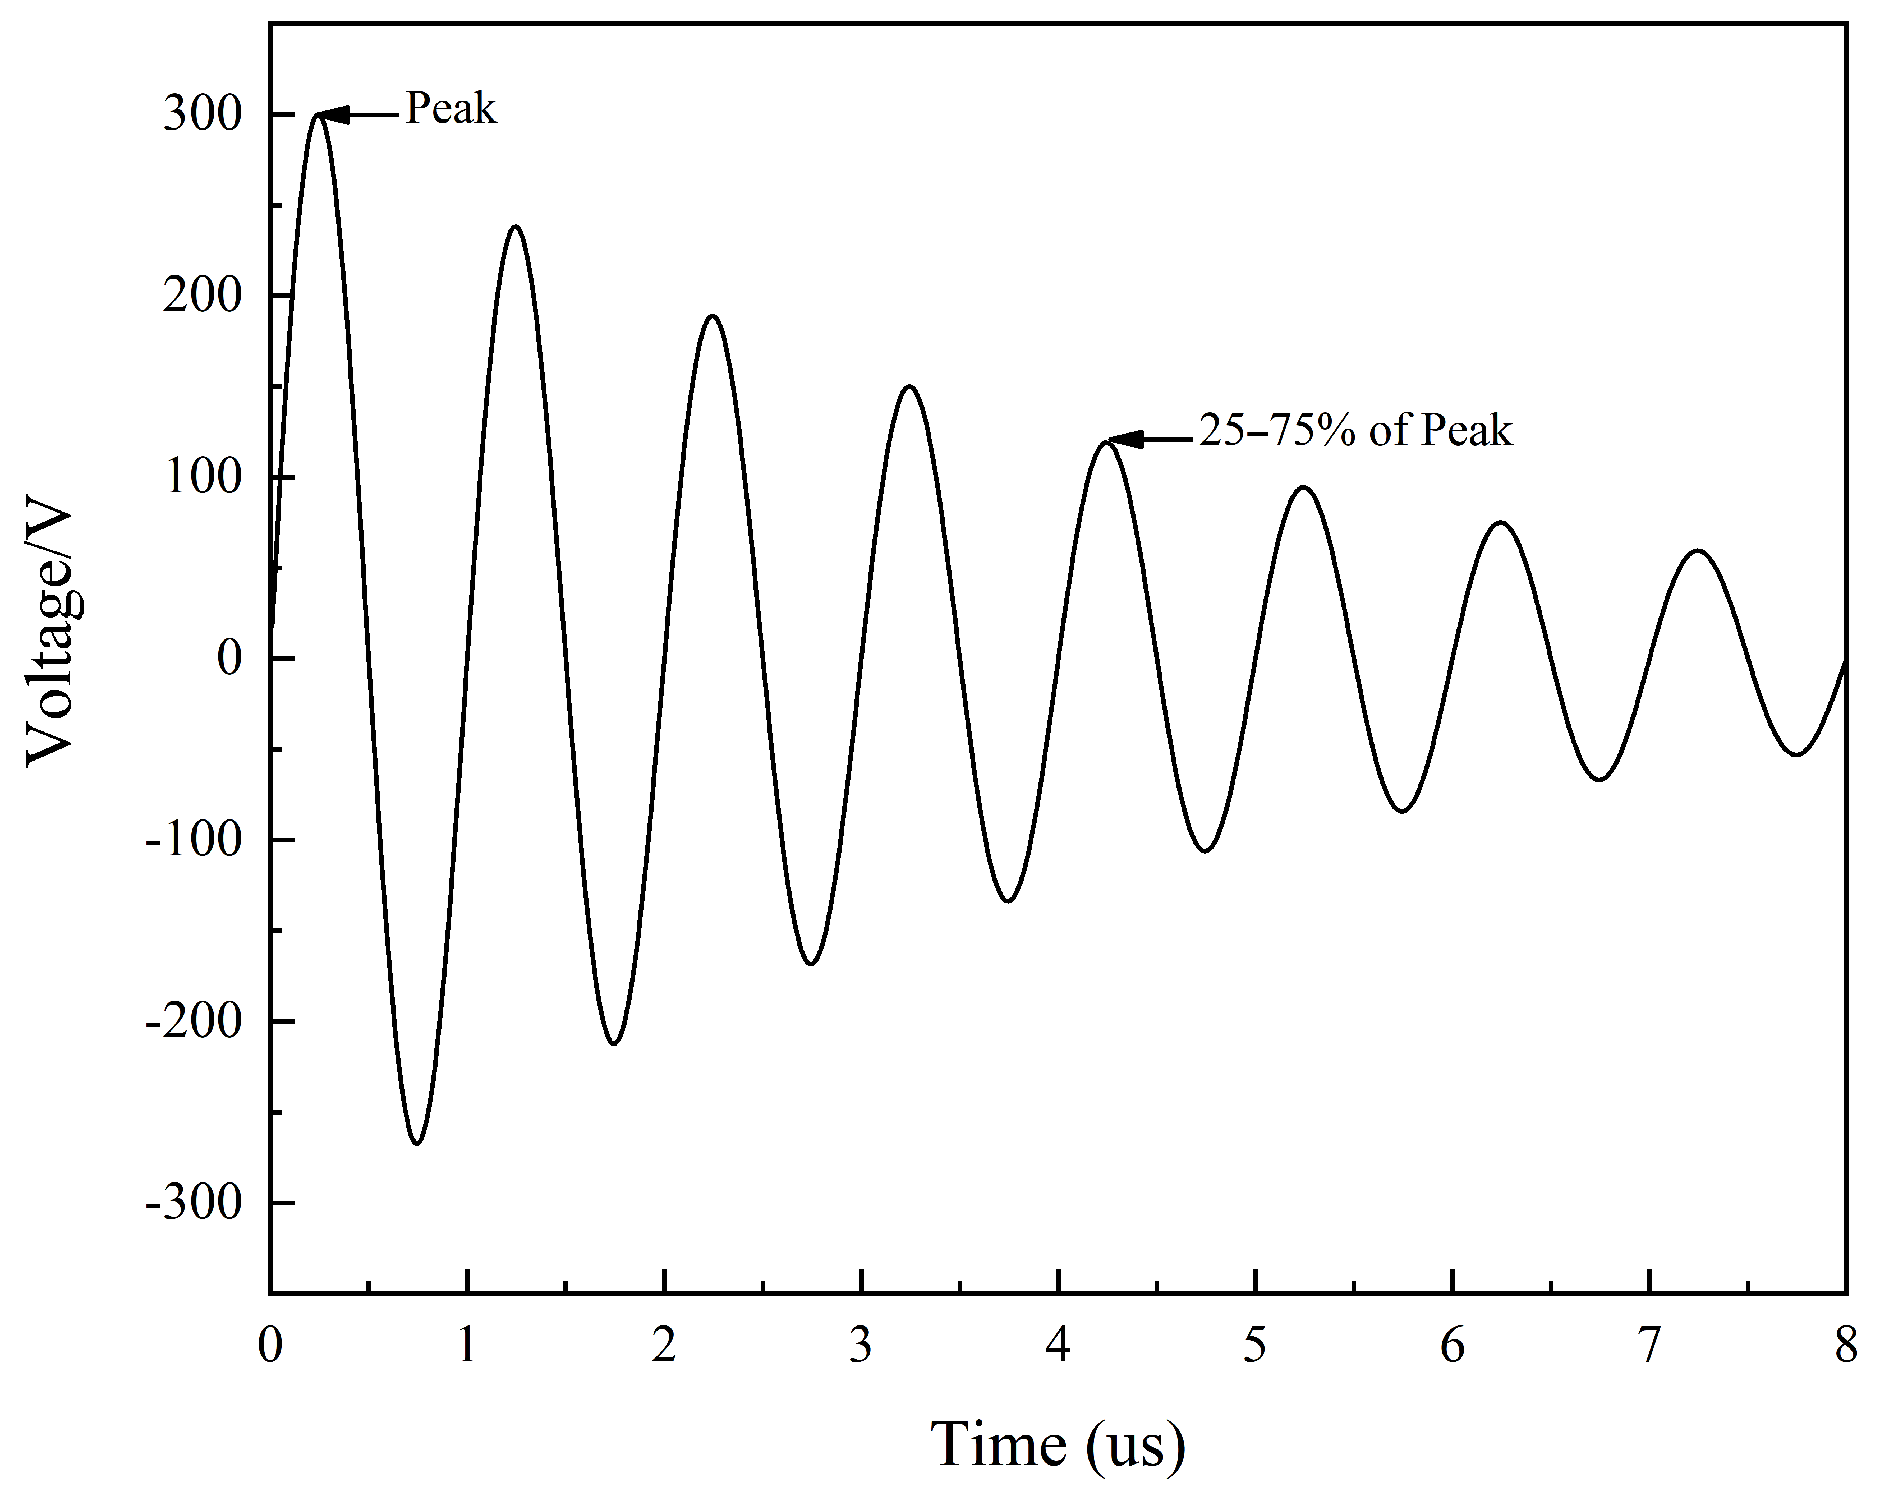
2.1. Standardized Lightning Pulse

The SAE ARP 5412B standard is commonly used to establish the airworthiness of aircraft during lightning strikes [14]. The above-cited standard specifies voltage and current waveforms, representing an external lightning environment and the transient voltages and currents expected in aircraft wiring harnesses and equipment ports. In this work, an attenuated sinusoidal waveform is used to simulate the transient response of a lightning pulse on a UAV BDS receiver. The analysis is conducted through simulations and tests. The damped sinusoid, illustrated in Figure 1, has a frequency of 1 MHz and a pulse width of 8 µs. This waveform represents the resonance of the electric or magnetic field at the aperture in the cable shielding, generating oscillatory voltages and currents. The damped sinusoidal signal can be calculated as:
F ( t ) = K 0 V 0 sin ( ω l t ) e α t
where K 0 is the peaking factor, V 0 is the peak voltage, and α is the damping factor. The parameters are defined as K 0 = 1.059, α = 0.231 f l , ω l = 2 π f l , and f l = 1 MHz.

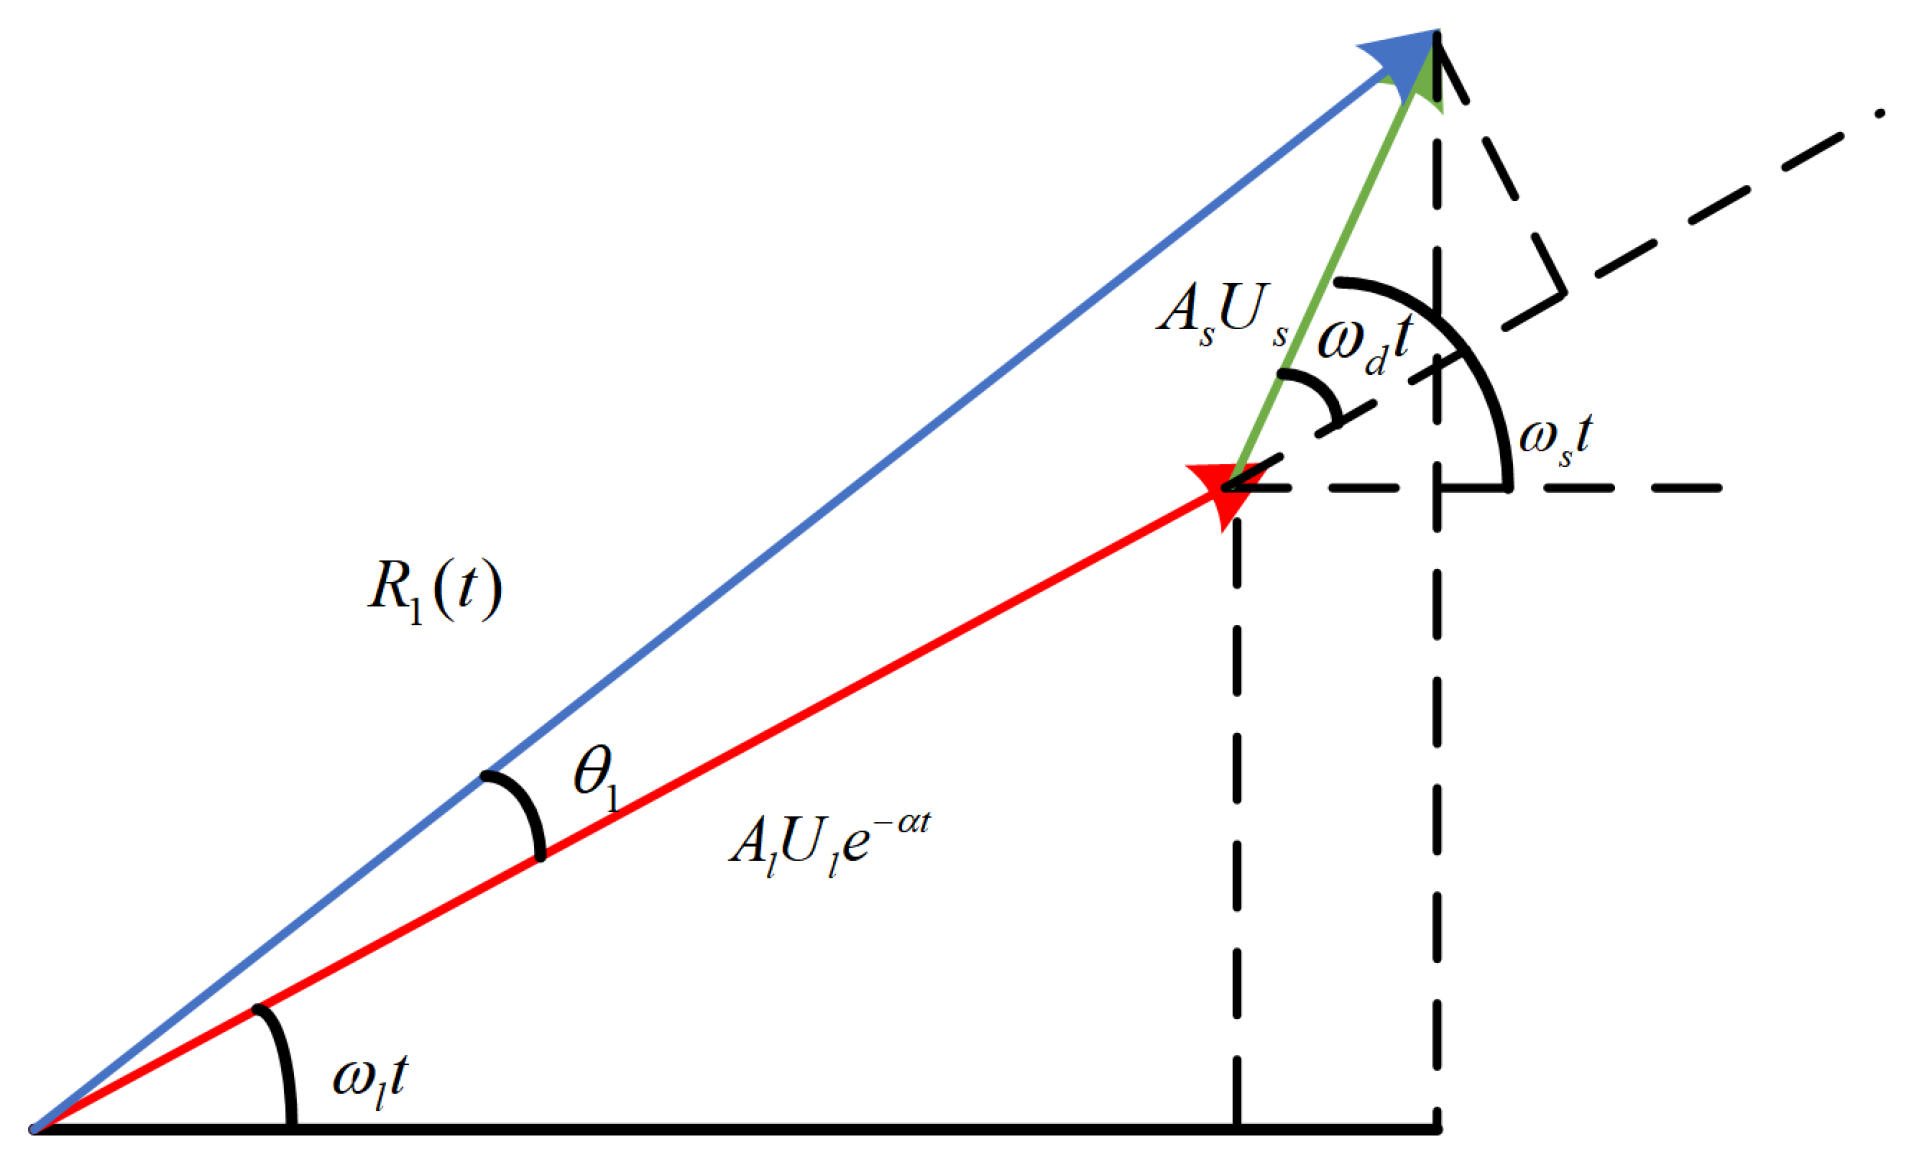
2.2. Analysis of the Blocking Interference Mechanism

Different types of electromagnetic disturbances have different effects on navigation receivers. Lightning pulses, a form of out-of-band large-signal interference, generally degrade the performance of the RF front end in navigation receivers [15]. Strong out-of-band signal interference can affect sensitive electronic components inside a receiver due to the limited selectivity of the receiver’s RF front end filters. If the power of the interfering signal exceeds the dynamic range of the components, it compels them to operate nonlinearly. This nonlinear operation reduces the receiver’s sensitivity, leading to additional performance degradation. The receiver may lose the ability to track a particular satellite if the navigation signal power falls below the receiver’s tracking sensitivity threshold. This loss may cause blocking interference at the RF front end [16].
The blocking effect should be analyzed via the vector method when the interference signal is strong enough to push the receiver circuit into a cutoff or saturation region or even cause component breakdown [17]. It is assumed that the lightning pulses and navigation signals are coupled through the antenna into the receiver input as follows:
u i n ( t ) = A l U l e α t sin ω l t + A s U s sin ω s t
Figure 2 illustrates the relationship described by Equation (3), with the lightning pulse and navigation signals represented as vectors. The red vector corresponds to the lightning pulse signal, and the green vector represents the navigation signal. The blue vector depicts the input signal at the antenna of the receiver. The length of each vector is determined by the product of the respective coupling coefficient ( A l for the lightning pulse and A s for the navigation signal) and the corresponding electric field strength ( U l for the lightning pulse and U s for the navigation signal). The resultant vector, R 1 ( t ) , indicates the magnitude of the input signal at the receiver, resulting from the vector sum of the lightning pulse and navigation signals. The angle ω d between the red and green vectors represents the phase difference between the two signals, where ω d = ω s ω l .
Since the lightning signal is an out-of-band large signal, its amplitude is significantly greater than that of the navigation signal, i.e., A l U l A s U s . The input signal can be derived from the vector analysis diagram shown in Figure 2:
u i n ( t ) = R 1 ( t ) sin ω l t + θ 1
The envelope R 1 ( t ) of the input signal is given by:
R 1 ( t ) = ( A s U s ) 2 + ( A l U l e a t ) 2 + 2 A s U s A l U l e a t cos ( ω d t ) 1 / 2
The initial phase angle θ 1 of the input signal is given by
θ 1 = arctan A s U s sin ω d t A l U l e α t + A s U s cos ω d t A s U s A l U l e α t sin ( ω s ω l ) t = β sin ω d t
The Equation (5) for θ 1 is simplified in two steps. First, since A l U l e α t is much larger than A s U s , the denominator of the arctangent function A l U l e α t + A s U s cos ( ω d t ) can be approximated by A l U l e α t alone, because the second term is negligible. Second, when the ratio A s U s sin ( ω d t ) A l U l e α t is small, the arctangent function arctan ( x ) can be approximated by x. Thus, θ 1 can be simplified to
θ 1 A s U s A l U l e α t sin ( ( ω s ω 1 ) t ) = β sin ( ω d t ) ,
where β = A s U s A l U l e α t . This approximation is valid under the condition where the interference signal dominates, allowing for these simplifications.
Assume that the receiver’s RF front end has a saturation level of U m and a gain of G. The output signal amplitude of an ideal linear circuit is G · R 1 ( t ) when the input signal amplitude is below the threshold. However, the output signal amplitude is limited to U m when the input signal amplitude exceeds the threshold. The output signal is calculated as follows:
u o ( t ) = U m sin ω l t + θ 1 = U m sin ω l t + β sin ω d t = U m sin ω l t cos β sin ω d t + cos ω l t sin β sin ω d t
According to Bessel function theory, the following expansion holds:
cos β cos ω d t = J 0 ( β ) cos 2 n ω d t sin β cos ω d t = 2 n = 1 J 2 n 1 ( β ) sin ( 2 n 1 ) ω d t
where J n ( β ) is the first kind of n-order Bessel function [18], J 0 ( β ) 1 and J 1 ( β ) 0.5 β . By using Equation (7), we expand the second term in Equation (6) and consider only the fundamental wave components, as shown in Equation (8):
U m cos ( ω l t ) sin ( β sin ( ω d t ) ) = 2 U m J 1 ( β ) cos ( ω l t ) sin ( ω d t ) = 0.5 U m β sin ( ω s t ) sin ( 2 ω l ω s ) t
It can be concluded that the first term in Equation (8) is the navigation signaling component, and further calculations provide the navigation signal gain as
K = 0.5 U m β sin ω s t A s U s sin ω s t = U m 2 A l U l e α t
From Equation (9), the gain of the useful signal under the interference of the lightning pulse signal depends on the lightning pulse amplitude and the saturation voltage of the circuit. The circuit outputs only half of the useful input signal when A l U l e α t is equal to U m . The useful signal is completely blocked when A l U l e α t greatly exceeds U m . Since the saturation voltage is intrinsic to the semiconductor device, the subsequent interference injection simulations investigate the impact of the peak lightning pulse on the gain of the receiver.

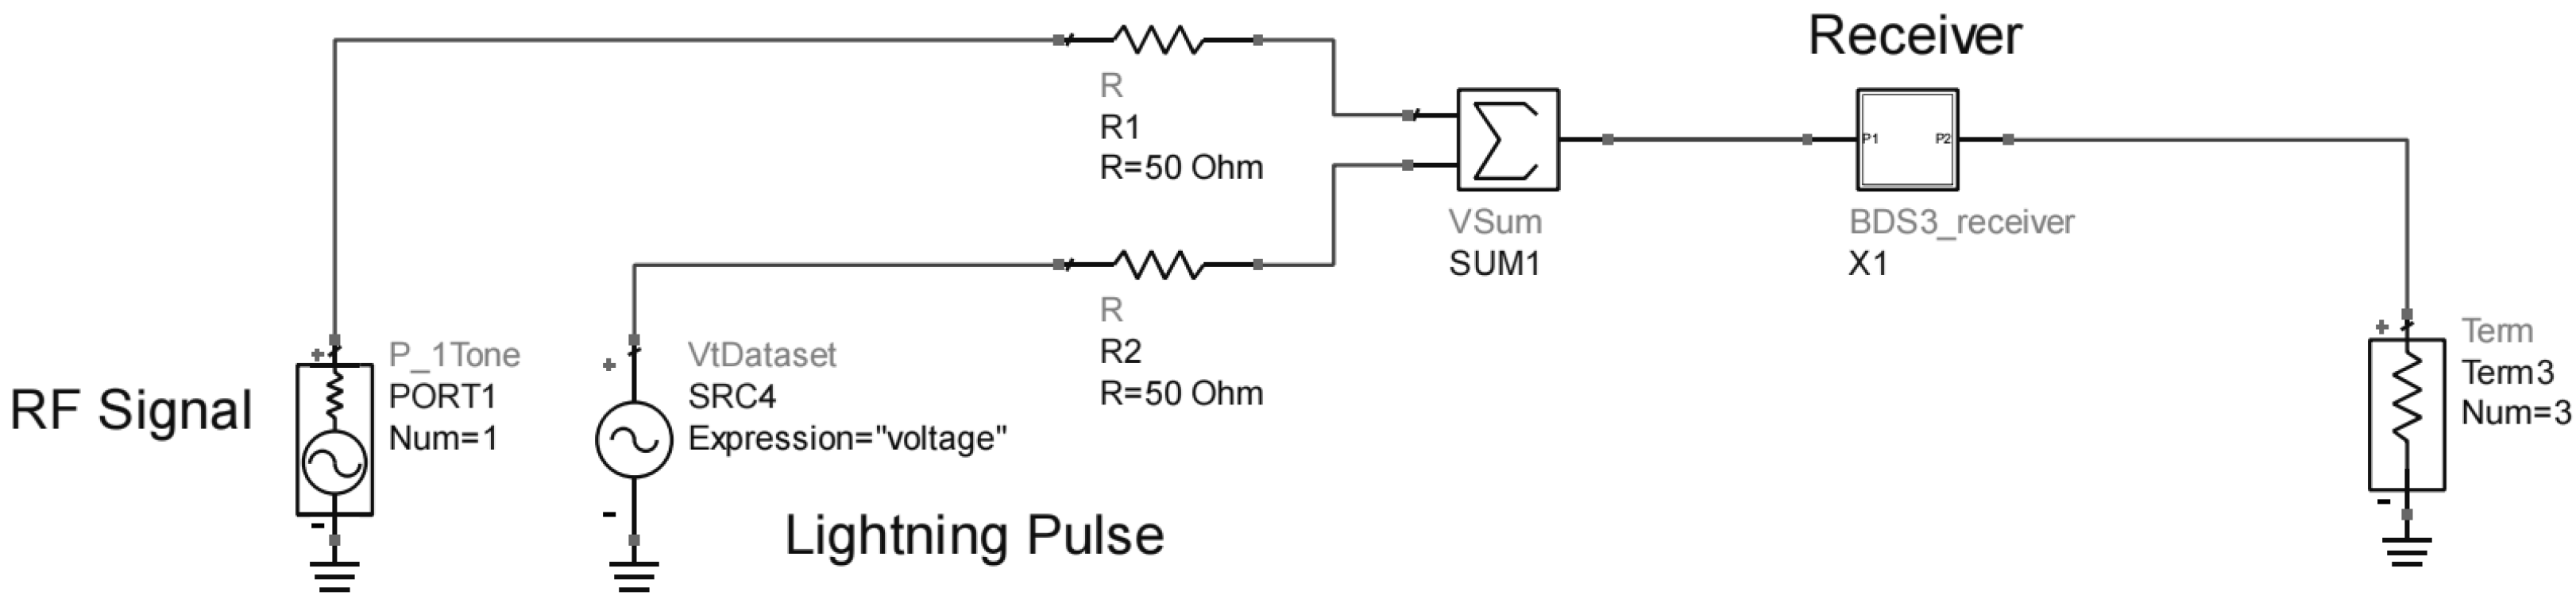
3. Lightning Pulse Injection Simulation

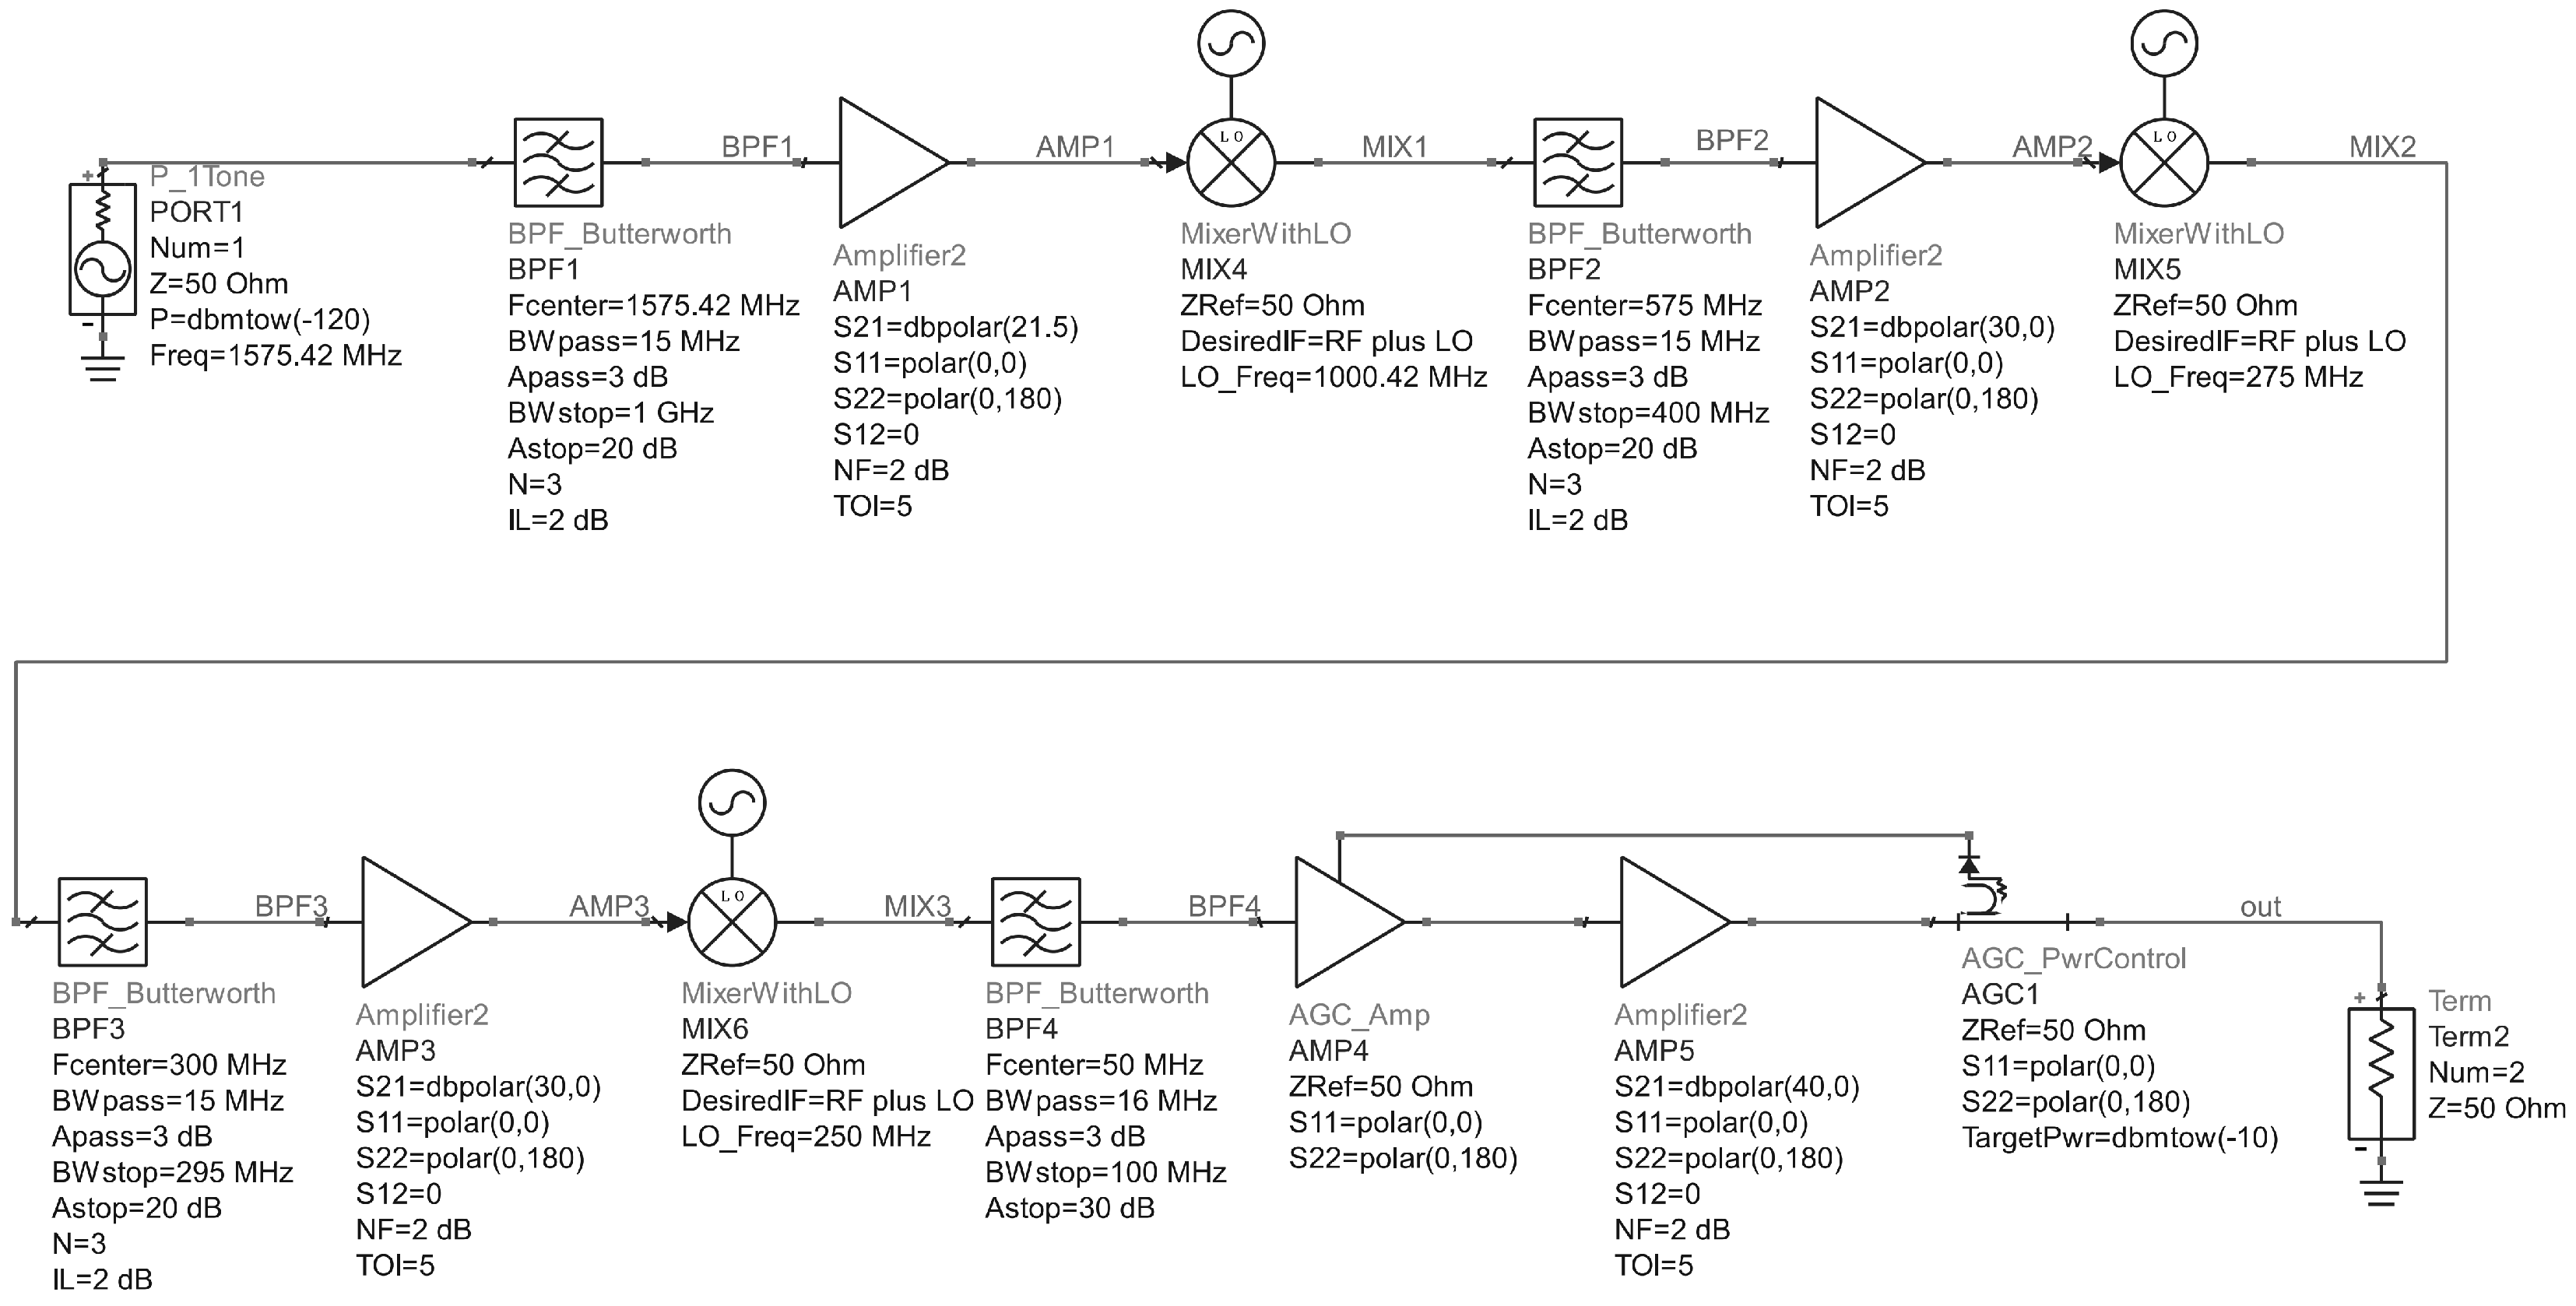
3.1. Modeling the RF Front-End Circuit of the BDS Receiver

As depicted in Figure 3, the receiver’s RF front end adopts a superheterodyne structure. A behavior-level simulation model of this RF front end is constructed using the ADS 2020. The P 1 T o n e component generates the RF signal at 1575.42 MHz, representing the navigation signal. Since the signals received by the receiver antenna consist of both environmental noise and navigation signals, the band-pass filter (BPF) components filter out the out-of-band interference along with the environmental noise. The filtered signal is subsequently amplified by the amplifier (AMP) components, which provide high gain and minimal noise, thereby influencing the overall noise figure of the system [19]. Low noise amplifiers (LNAs) are particularly critical, as they are vulnerable to EMP interference and damage due to their semiconductor transistor characteristics [20]. The mixer (MIX) components then downconvert the amplified signal to an intermediate frequency (IF) via local oscillators, preparing it for further processing. The subsequent interference simulations focus on the changes in the amplifier gain at each stage corresponding to the peak voltage of the lightning pulse.
The signal from the LNA is processed through a three-stage mixer. The first-stage mixer downconverts the BDS signal in the B1C band to 575 MHz. The second-stage mixer then downconverts this signal to 300 MHz. Finally, the third-stage mixer downconverts it to an output IF signal of 50 MHz. The local oscillator frequencies for the three mixers are 1000.42 MHz, 275 MHz, and 250 MHz.
To maintain a stable input signal level at the analog-to-digital converter (ADC), automatic gain control (AGC) is an effective solution [21]. When RF interference occurs, AGC promptly reduces the gain to maintain the ADC input at the specified level. This action helps to prevent the ADC from being overloaded by interference, thus maintaining the integrity of the subsequent signal processing.
The key technical indicators of the receiver RF front end circuit include the sensitivity, dynamic range, operating frequency band, IF output power, and IF output frequency. Among these indicators, the sensitivity and dynamic range are the most critical [22]. The technical indicators settings used in the simulation model are summarized in Table 1.
The receiver sensitivity is the minimum power level that a receiver’s antenna needs to detect for the system to function correctly. This sensitivity directly influences the coverage area and communication quality of the system. In engineering practice, receiver sensitivity can be calculated using the following formula [23]:
S in dBm = N F dB + K T B n dBm + E b N 0 dB G p dB
where S in represents the receiver sensitivity, N F is the receiver noise figure, K T B n denotes the noise power before despreading, E b N 0 is the ratio of bit energy to noise power spectral density, and G p represents the processing gain of the despreading code. Equation (10) helps explain the difference between the sensitivity of the RF front end and the receiver sensitivity. The sensitivity of the BDS receiver is primarily determined by two factors: the noise performance of the receiver front end, such as the output signal-to-noise ratio or noise figure, and the baseband processing capabilities, including the digital modulation scheme and despreading gain.
The dynamic range (DR) of a receiver can be expressed as the range of input signal strengths that the receiver can handle during normal operation. It can be defined using the following formula [24]:
D R = P max P min
where P max is the maximum power value of the signal that can be applied to the receiver and P min is the minimum input signal power required to ensure that the receiver can correctly detect and process the signal under normal operating conditions.

3.2. Interference Effect Simulation and Result Analysis

For realistic simulations of the coupling process of lightning and its interference on the RF front end, a combiner is used to inject both the lightning pulse and the RF signal into the receiver input. Figure 4 presents the receiver lightning pulse injection simulation model. During the simulation, the RF signal power is set at −130 dBm, while the peak voltage of the lightning pulse varies from 0 to 450 V in increments of 50 V. The analysis focuses on examining the changes in the spectrum and gain of the receiver output signal under different peak lightning pulse voltage injections.
Figure 5 and Table 2 show how the output spectrum and the receiver RF front-end technical indicators change with the peak value of the lightning pulse. In the absence of external interference, the IF output spectrum of the RF front end is depicted in Figure 5a. At this point, the RF front-end output power is −6.998 dBm, and the noise floor power is effectively limited to below −40 dBm. When the peak interference voltage reaches 200 V, the IF output spectrum, as shown in Figure 5b, shows a decrease in output power to −9.665 dBm. Simultaneously, there is an increase in noise floor power, which negatively impacts the quality of the front-end output signal. Figure 5c depicts the IF output spectrum when subjected to an interference voltage of 450 V. In this scenario, the output power decreases to −20.348 dBm, causing the IF signal to be lost in the noise floor. The simulation results indicate that the lightning pulse affects the output signal quality of the receiver front end in two ways. The system gain gradually decreases with increasing peak of the lightning pulse, as shown in Table 2. As the peak of the lightning pulse increases, the noise floor power also increases. When the lightning pulse peak reaches 450 V, the IF signal is completely overwhelmed by the noise floor.
Figure 6 depicts the variation in the amplifier gain at each stage of the navigation receiver in response to the peak of the lightning pulse. The results indicate that the degradation of system gain is directly linked to the reduction in LNA gain. When subjected to lightning interference, the system gain decreases from 123.002 dB to 109.651 dB. While the gains of the second- and third-stage amplifiers remain at approximately 30 dB, the LNA exhibits a significant decrease in gain. This reduction is due to the lightning pulse peak driving the LNA into a nonlinear operating region. At a peak lightning pulse of 450 V, the LNA gain drops to −0.184 dB, indicating damage. The high peak lightning pulse causes this damage by burning out the LNA gate metal strip and causing gate-source and gate-drain breakdowns [25].

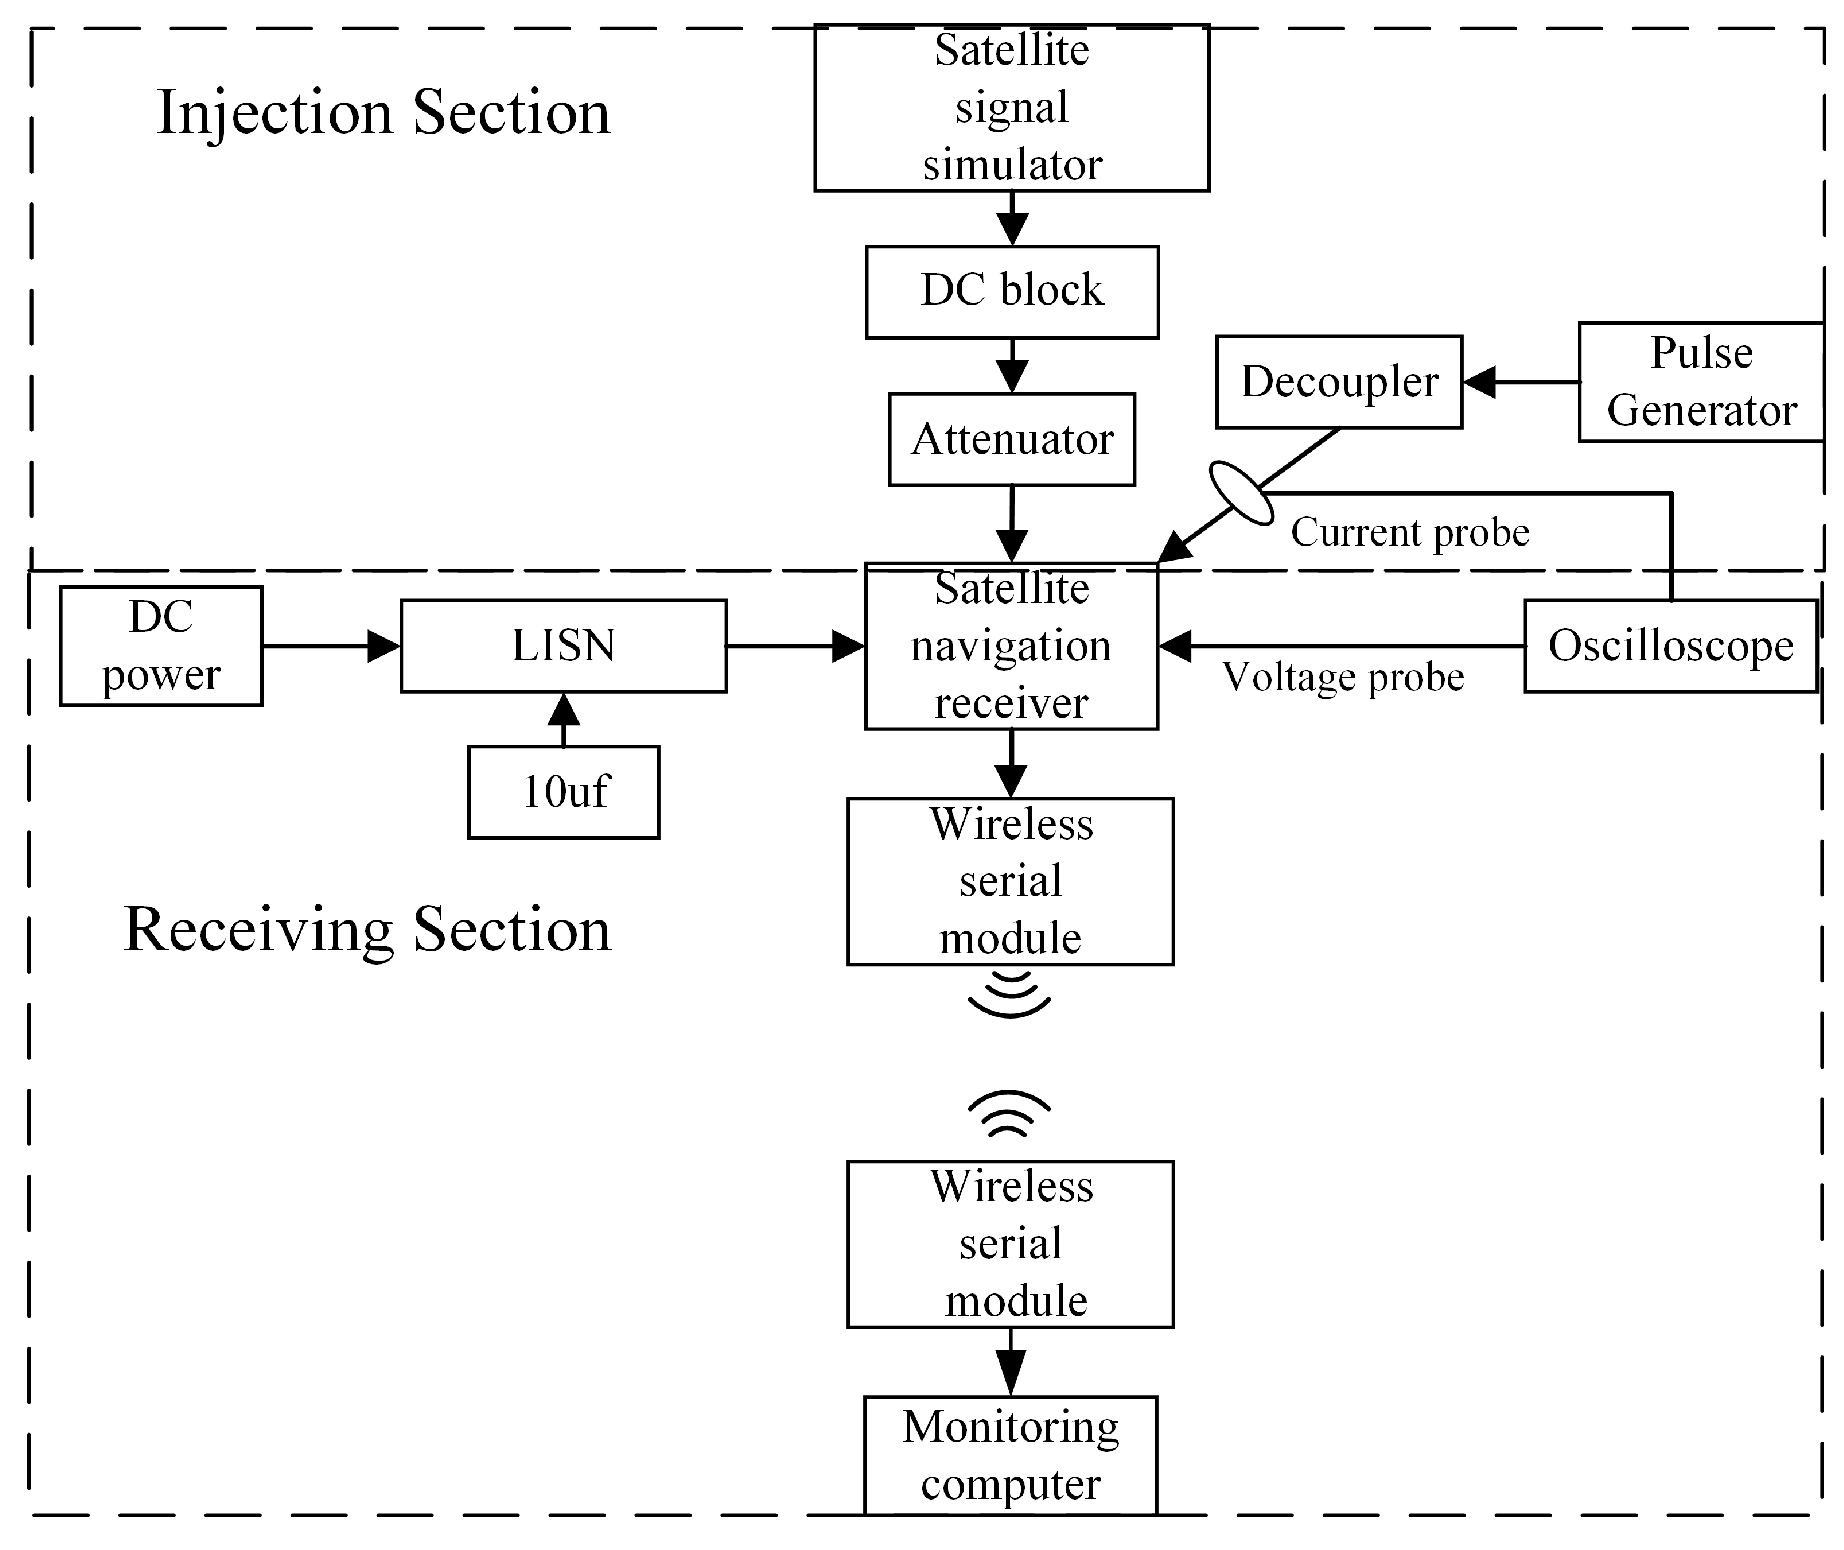
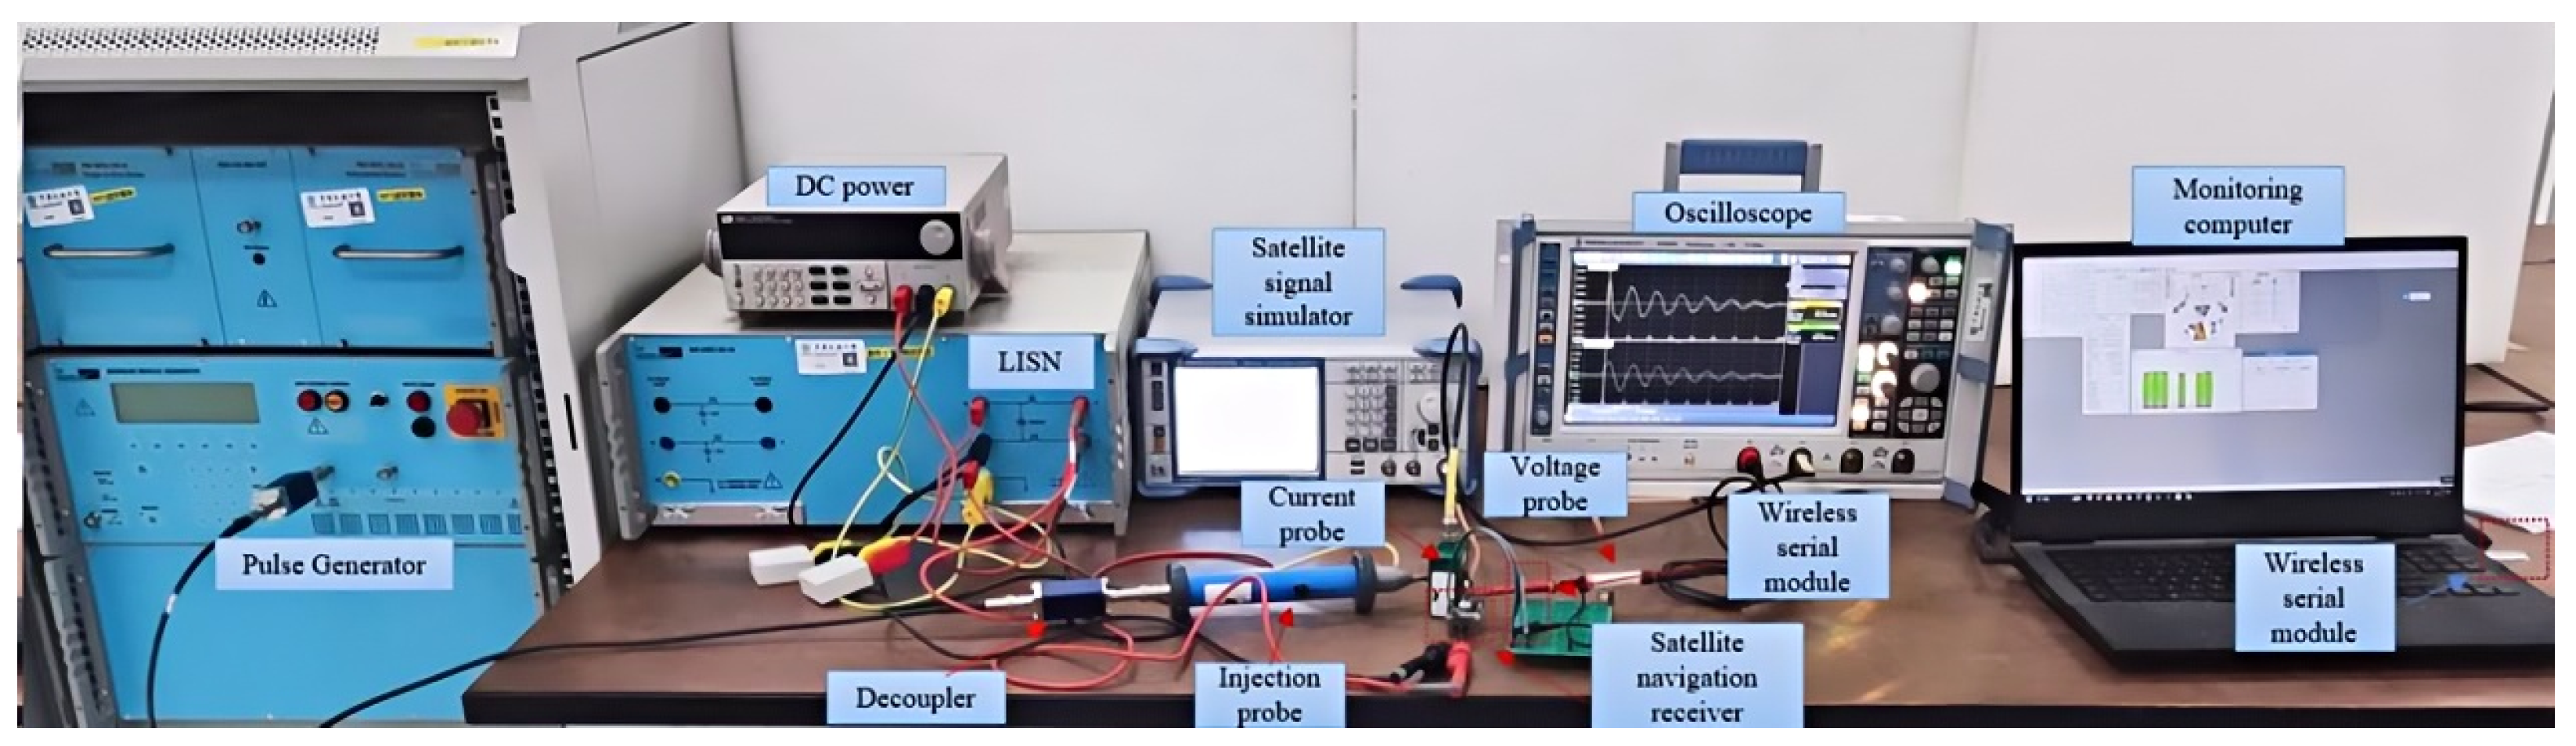
4. Lightning Pulse Injection Effect Test

4.1. Test Platform

To further investigate the indirect effects of lightning on the UAV BDS receiver, a pin injection test is conducted in accordance with the guidelines in RTCA DO-160G, Chapter 22, on lightning transient sensitivity [26]. The injected lightning pulse follows waveform 3, and Figure 7 compares the test waveform with the simulation waveform. The pin injection test evaluates the insulation withstand capability and destructive tolerance of a device port by directly applying a lightning pulse to the port or pin. The test block diagram and test platform construction are shown in Figure 8 and Figure 9.
The models of the test equipment and their functions are shown in Table 3. The object selected for this test is a specific type of BDS receiver for a UAV. To account for the influence of the number of satellites on the receiver’s positioning accuracy, the BDS signal generator is configured to produce eight satellite signals. This setting ensures the reproducibility of the test and is kept constant in subsequent tests. This setting is kept constant in the subsequent tests.
The test platform consists of two parts: the injection side and the reception side. The injection side includes a satellite signal simulator, a 20 dB attenuator, a direct current (DC)-block, a lightning signal generator, a decoupler, and an injection probe. The satellite signal simulator sends navigation signals to the receiver. The receiver combines the lightning and navigation signals via pin injection, transmitting them to the RF receiving port to enable the injection of mixed signals. The reception side consists of the receiver and the monitoring computer. The navigation receiver communicates with the monitoring computer via a wireless module, and the monitoring software displays its positioning and tracking status.
After the assessment test, the receiver’s sensitivity threshold voltage range is determined to be 250–400 V. Accordingly, the test adopts a variable step size method: when the voltage is below 250 V, the step size is set to 50 V; when the lightning pulse peak exceeds 250 V, the step size is reduced to 10 V.

4.2. Test Results Analysis

In accordance with the test configuration shown in Figure 8, a test platform for injecting lightning pulses into the BDS receiver was established. During the test, the power level of the navigation signal from the satellite signal simulator was set to −130 dBm, and the frequency was set to 1575.42 MHz. The acquisition sensitivity and tracking sensitivity of the receiver were tested after the completion of the injection test, and the test results are shown in Figure 10.
Figure 10 illustrates how the acquisition and tracking sensitivities of three samples of the same receiver model change with the peak amplitude of the lightning pulse. While minor variations in sensitivity among the samples may occur due to the differences in the manufacturing processes or component characteristics, the overall trend remains consistent under identical pulse conditions. The simulation results represent the performance of the RF front end, whereas the test results reflect the overall receiver performance, including both the RF front end and baseband processing. The observed discrepancy between the simulated and test results is primarily due to the influence of the baseband processing, as indicated by Equation (10). The change in sensitivity is minimal when the peak value of the lightning pulse is less than 250 V. However, when the peak value exceeds this threshold, the sensitivity decreases significantly. This decrease occurs because the lightning pulse reduces the dynamic range of the receiver’s LNA, forcing it to operate in the nonlinear region. This leads to a decrease in LNA gain and an increase in the LNA noise figure, resulting in reduced receiver sensitivity. In this scenario, the receiver’s LNA can be expected to enter a gain compression state. When comparing the simulation results with the experimental results, it is observed that the sensitivity variation in the simulation is more pronounced than in the test results when the lightning pulse peak value reaches 250 V. This discrepancy is primarily due to the influence of the baseband processing stage in the receiver. In the simulation, the model only considers the RF front-end components, leading to a more sensitive response to changes in the input signal. In contrast, the test results reflect the overall performance of the receiver, including the baseband processing, which introduces additional constraints on the receiver’s dynamic response. This difference is further supported by Equation (10), which explains the relationship between the RF front-end performance and the baseband processing effects. The damage thresholds of the various receivers in the experiments are generally comparable, although the damage threshold in the simulation is higher than that in the actual test. This can be attributed to the idealized nature of the simulation model, which does not account for the inherent limitations of the physical properties of the actual device. In practice, the device can be identified as damaged when the amplitude of the injected voltage exceeds the device’s voltage withstand value [27].

5. Conclusions

This paper investigates the effects of lightning pulses on a certain civil UAV BDS receiver, focusing on the RF front end blocking mechanism. The study includes simulations and tests, leading to the following conclusions:
(1)
By constructing a simulation model for lightning pulse injection and analyzing the interference mechanism, we elucidate the impact of lightning pulses on the BDS receiver. As the peak voltage of the lightning pulse increases, the LNA enters a state of gain compression. When the peak value reaches 450 V, the LNA’s gain becomes negative, indicating damage. This results in a decrease in the overall gain of the receiver and an increase in the noise floor, significantly affecting the receiver’s sensitivity and dynamic range.
(2)
The test results indicate that the sensitivity of the receiver decreases dramatically when the peak voltage of the lightning pulse coupled to the navigation receiver exceeds 250 V. This can be explained by the blocking interference mechanism and simulation results. The increase in the lightning pulse voltage causes the dynamic range of the LNA to become insufficient, so that LNA operates in the nonlinear region, thus decreasing the sensitivity of the receiver. When the peak voltage exceeds the damage threshold of the receiver, the receiver will no longer display positioning information, at which point the it can be considered damaged.
One of the main limitations of the current work is the inability to obtain another critical metric from the test, namely the dynamic range of the receiver. Due to equipment constraints, the navigation signal simulator can transmit only a maximum power of −10 dBm, which is insufficient to accurately determine the receiver’s maximum input power capacity. Consequently, the exact dynamic range of the receiver could not be measured. On the basis of these findings, future work will aim to develop and optimize a protection circuit for the receiver, utilizing the identified damage thresholds. The objective is to create an effective protection circuit that can prevent the detrimental effects of lightning pulses, thereby ensuring reliable performance of the receiver under lightning interference conditions.

Author Contributions

Conceptualization, Z.M. and Z.D.; methodology, J.L.; software, S.H.; validation, Z.M., S.H. and Z.D.; formal analysis, S.H.; investigation, S.H.; resources, J.L.; data curation, Z.M.; writing—original draft preparation, S.H.; writing—review and editing, Z.M.; visualization, J.L.;supervision, Z.D.; project administration, Z.M.; funding acquisition, J.L. All authors have read and agreed to the published version of the manuscript.

Funding

This research was funded by the Natural Science Foundation of Tianjin under Grant 21JCZDJC00860.

Data Availability Statement

The data presented in this study are available on request from the corresponding author.

Conflicts of Interest

The authors declare no conflicts of interest. The funders had no role in the design of the study; in the collection, analyses, or interpretation of data; in the writing of the manuscript; or in the decision to publish the results.

References

  1. Yin, Y.; Wang, Z.; Zheng, L.; Su, Q.; Guo, Y. Autonomous UAV Navigation with Adaptive Control Based on Deep Reinforcement Learning. Electronics 2024, 13, 2432. [Google Scholar] [CrossRef]
  2. Cabello, M.R.; Fernández, S.; Pous, M.; Pascual-Gil, E.; Angulo, L.D.; López, P.; Riu, P.J.; Gutierrez, G.G.; Mateos, D.; Poyatos, D.; et al. SIVA UAV: A case study for the EMC analysis of composite air vehicles. IEEE Trans. Electromagn. Compat. 2017, 59, 1103–1113. [Google Scholar] [CrossRef]
  3. Ni, H.; Zhu, Q.; Hua, B.; Mao, K.; Pan, Y.; Ali, F.; Zhong, W.; Chen, X. Path Loss and Shadowing for UAV-to-Ground UWB Channels Incorporating the Effects of Built-Up Areas and Airframe. IEEE Trans. Intell. Transp. Syst. 2024, 1–12. [Google Scholar] [CrossRef]
  4. Cooray, V. An Introduction to Lightning; Springer: Berlin/Heidelberg, Germany, 2015; Volume 201, pp. 247–280. [Google Scholar]
  5. Kim, Y.; Jo, J.; Kim, D.; Lee, H.; Myong, R. Effects of lightning on UAM aircraft: Complex zoning and direct effects on composite prop-rotor blade. Aerosp. Sci. Technol. 2022, 124, 107560. [Google Scholar] [CrossRef]
  6. Haohan, H.; Hangfan, Z.; Junhai, L.; Kuanrong, L.; Biao, P. Automatic and intelligent line inspection using UAV based on beidou navigation system. In Proceedings of the 2019 6th International Conference on Information Science and Control Engineering (ICISCE), Shanghai, China, 20–22 December 2019; pp. 1004–1008. [Google Scholar]
  7. Wang, Y.p.; Wei, G.h.; Li, W.; Pan, X.d.; Shang, Z.f.; Wan, H.j. Mechanism modeling and verification of receiver with in-band dual-frequency blocking jamming. Trans. Beijing Inst. Technol. 2018, 38, 709–714. [Google Scholar]
  8. Zhang, Q.; Wang, Y.; Cheng, E.; Ma, L.; Chen, Y. Investigation on the Effect of the B1I Navigation Receiver Under Multifrequency Interference. IEEE Trans. Electromagn. Compat. 2022, 64, 1097–1104. [Google Scholar] [CrossRef]
  9. Meng, Y.; Cai, S.; Li, Y.; Su, D.; Shang, X.; Li, C.; Yao, W. Modeling of Airborne Ultrashort Wave Radio Receiver and Analysis of Lightning Interference Effect. In Proceedings of the 2022 Asia-Pacific International Symposium on Electromagnetic Compatibility (APEMC), Beijing, China, 1–4 September 2022; pp. 575–577. [Google Scholar] [CrossRef]
  10. Fan, Y.; Cheng, E.; Wei, M.; Zhang, Q.; Chen, Y. Effects of CW interference on the BDS receiver and analysis on the coupling path of electromagnetic energy. IEEE Access 2019, 7, 155885–155893. [Google Scholar] [CrossRef]
  11. Zhang, W.; Shi, Y.; He, Y.; Shen, J.; Pan, X.; Fang, Z.; Chen, H. Study on damage effects of lightning electromagnetic pulse on typical airborne GPS module. High Power Laser Part. Beams 2021, 33, 22–28. [Google Scholar]
  12. Huang, X.; Wang, Y.; Chen, Y. Analysis of electromagnetic interference effect of the pulse interference on the navigation receiver. Int. J. Antennas. Propag. 2022, 2022, 3049899. [Google Scholar] [CrossRef]
  13. Rimal, H.P.; Reatti, A.; Corti, F.; Lozito, G.M.; Antonio, S.Q.; Faba, A.; Cardelli, E. Protection from indirect lightning effects for power converters in avionic environment: Modeling and experimental validation. IEEE Trans. Ind. Electron. 2020, 68, 7850–7862. [Google Scholar] [CrossRef]
  14. SAE ARP 5412B:2013; Aircraft Lightning Environment and Related Test Waveforms. SAE International: Warrendale, PA, USA, 2013.
  15. Zhang, Q.; Wang, Y.; Cheng, E.; Chen, Y.; Ma, L.; Zhang, Z. Investigation on prediction method of electromagnetic interference in the tracking loop of navigation receiver. J. Electron. Inf. Techn. 2021, 43, 3656–3661. [Google Scholar]
  16. Zhao, H.; Zhang, S. Electronic Warfare Theory and Methods; National Defense Industry Press: Beijing, China, 2010; pp. 124–184. [Google Scholar]
  17. Li, W.; Wei, G.; Pan, X.; Sun, S. Blocking jamming effect prediction method under multi-frequency in-band radiation environment for spectrum-dependent equipment. J. Beijing Univ. Aeronaut. Astronaut. 2021, 47, 715–723. [Google Scholar]
  18. Korsch, H.J.; Klumpp, A.; Witthaut, D. On two-dimensional Bessel functions. J. Phys. A Math. Gen. 2006, 39, 14947. [Google Scholar] [CrossRef]
  19. Ma, Z.; Liu, J.; Duan, Z.; Shi, C.; He, S. Analysis of Indirect Lightning Effects on Low-Noise Amplifier and Protection Design. Electronics 2023, 12, 4912. [Google Scholar] [CrossRef]
  20. Mansson, D.; Thottappillil, R.; Backstrom, M.; Lundén, O. Vulnerability of European rail traffic management system to radiated intentional EMI. IEEE Trans. Electromagn. Compat. 2008, 50, 101–109. [Google Scholar] [CrossRef]
  21. Fan, Y.; Cheng, E.; Wei, M.; Cheng, Y. Simulation Research on GPS RF Front-End Receiving Circuit with Super-Heterodyne Structure. J. Ordnance Equip. Eng. 2020, 41, 117–122. [Google Scholar]
  22. Fan, L.; Pi, Y.; Li, J. Principle and System of Beidou Satellite Navigation; Publishing House of Electronics Industry: Beijing, China, 2021. [Google Scholar]
  23. Rohde, U.; Whitaker, J.; Zahod, H. Communications Receivers: Principles and Design; McGraw Hill: New York, NY, USA, 2018; pp. 239–258. [Google Scholar]
  24. Xu, X. ADS2011 RF Circuit Design and Simulation Example; Publishing House of Electronics Industry: Beijing, China, 2014; pp. 424–455. [Google Scholar]
  25. Liu, L.; Du, Z. Influence of Microwave Pulse Power on the Burnout Effect of the AlGaN/GaN HEMT in a LNA. In Proceedings of the 2019 IEEE 6th International Symposium on Electromagnetic Compatibility (ISEMC), Nanjing, China, 1–4 November 2019; pp. 1–5. [Google Scholar]
  26. RTCA/DO-160G; Environmental Conditions and Test Proceduresfor Airborne Equipment. RTCA: Washing, DC, USA, 2010.
  27. Mao, Q.; Huang, L.; Xiang, Z.; Zhu, D.; Meng, J. High-power microwave pulse induced failure on InGaP/GaAs heterojunction bipolar transistor. Microelectron. Reliab. 2022, 139, 114848. [Google Scholar] [CrossRef]
Figure 1. Damped sinusoidal voltage waveform 3.
Aerospace 11 00810 g001
Figure 2. Vector illustration of signals.
Aerospace 11 00810 g002
Figure 3. Behavior model of BDS receiver.
Aerospace 11 00810 g003
Figure 4. Lightning pulses injection simulation model.
Aerospace 11 00810 g004
Figure 5. The out spectrum curve of BDS receiver: (a) interference-free voltage; (b) the peak interference voltage is 200 V; (c) the peak interference voltage is 450 V.
Aerospace 11 00810 g005
Figure 6. Gain varies with peak voltage.
Aerospace 11 00810 g006
Figure 7. Simulated and measured voltage for the waveform 3 (300 V).
Aerospace 11 00810 g007
Figure 8. Schematic diagram of the receiver pin injection test.
Aerospace 11 00810 g008
Figure 9. Pin injection experiment platform.
Aerospace 11 00810 g009
Figure 10. The sensitivity of the BDS receiver varies with the peak voltage: (a) acquisition sensitivity; (b) tracking sensitivity.
Aerospace 11 00810 g010
Table 1. The primary indicators of the RF front end circuit.
ParameterValue
Sensitivity≥−137 dBm
Dynamic Range131 dB
Operating Frequency BandB1C
Intermediate Frequency Output Frequency50 MHz
Intermediate Frequency Output Power−10 to 0 dBm
Intermediate Frequency Output Bandwidth16 MHz
Table 2. Indicators vary with peak voltage.
Voltage PeakSensitivityDynamic RangeOut PowerSystem Gain
0 V≥−137 dBm132 dB−6.998 dBm123.002 dB
200 V≥−130 dBm125 dB−9.665 dBm118.913 dB
450 V≥−116 dBm111 dB−20.348 dBm109.651 dB
Table 3. Types and functions of the test equipment.
Test EquipmentTypeFunction
DC power supplyE3631A (Agilent, Santa Clara, CA, USA)Power supply
Line impedance stabilization networkDN-LISN160 (EMC PARTNER AG, Laufen, Switzerland)Prevents interference
Satellite signal simulatorSMBV100A (Rohde Schwarz, Munich, Germany)Provides BD signal
OscilloscopeRTO2044 (Rohde Schwarz, Germany)Monitors currents and voltage
Pulse generatorAG-MIG-OS-MB (EMC PARTNER AG, Switzerland)Generates pulses
Injection probeCN-MIG-TT (EMC PARTNER AG, Switzerland)Injects pulses
Wireless serial moduleNRF24L01 (NiceRF, Shenzhen, China)Transmission data
Disclaimer/Publisher’s Note: The statements, opinions and data contained in all publications are solely those of the individual author(s) and contributor(s) and not of MDPI and/or the editor(s). MDPI and/or the editor(s) disclaim responsibility for any injury to people or property resulting from any ideas, methods, instructions or products referred to in the content.

