Article

An Autonomous Tow Truck Algorithm for Engineless Aircraft Taxiing

1
Institute of Aerospace Technologies, University of Malta, MSD 2080 Msida, Malta
2
Electronic Systems Engineering, Faculty of Engineering, University of Malta, MSD 2080 Msida, Malta
*
Author to whom correspondence should be addressed.
Aerospace 2024, 11(4), 307; https://doi.org/10.3390/aerospace11040307
Submission received: 26 February 2024 / Revised: 10 April 2024 / Accepted: 12 April 2024 / Published: 14 April 2024
(This article belongs to the Collection Air Transportation—Operations and Management)

Abstract

:
The aviation industry has proposed multiple solutions to reduce fuel consumption, air pollution, and noise at airports, one of which involves deploying electric trucks for aircraft towing between the stand and the runway. However, the introduction of tow trucks results in increased surface traffic, posing challenges from the perspective of air traffic controllers (ATCOs). Various solutions involving automated planning and execution have been proposed, but many are constrained by their inability to manage multiple active runways simultaneously, and their failure to account for the tow truck battery state of charge during assignments. This paper presents a novel system for taxi operations that employs autonomous tow trucks to enhance ground operations and address deficiencies in existing approaches. The system focuses on identifying conflict-free solutions that minimise taxi-related delays and route length while maximising the efficient use of the tow trucks. The algorithm operates at a strategic level and uses a centralised approach. It has the capacity to cater for multiple active runways and considers factors such as the tow truck battery state of charge and availability of charging stations. Furthermore, the proposed algorithm is capable of scheduling and routing tow trucks for aircraft taxiing without generating traffic conflicts.

1. Introduction

Currently, taxiing operations contribute to high fuel consumption, emissions, and economic costs for airlines and airports. In 2022, the average duration of the taxi-out and taxi-in phases of flight was 10.2% and 5.1%, respectively, of the duration of intra-European flights [1]. Furthermore, the annual fuel consumption during taxiing is approximately five million tonnes [2]. The issue is worsened by the fact that aircraft engines are optimised for high-altitude cruise operations, leading to inefficiencies while taxiing, particularly in high-traffic airports like Dallas/Fort Worth International Airport. In 2008, 18% of ground operation fuel at DFW was consumed by stop-and-go situations, primarily caused by congestion [3]. Similarly, at Heathrow airport in 2011, taxi operations were responsible for generating 56% of the total NOx emissions [4].
Taxiing is a significant contributor of pollution and noise at airports [5]. The European Commission has recognised these effects and set strict targets for emission reduction through initiatives such as “Flight Path 2050” [6] and the European Green Deal [7]. Carbon neutrality for all taxiing procedures will be required by 2050. Besides environmental impact, taxiing also has an economic impact on airlines due to the associated fuel costs, which constitute a substantial portion of airlines’ operating expenses [8,9,10]. Inefficient taxi operations cause delays and affect air traffic efficiency, incurring additional costs for airlines and airports.
To address the challenge of reducing emissions during the taxi phase, the aviation industry is considering two main technologies [3]: electric motors installed in the landing gear (such as Wheel Tug [11] and Electric Green Taxiing System [12]) and tow trucks (such as TaxiBot [13]). The use of tow trucks for moving aircraft on the ground offers significant environmental benefits, including reduced fuel consumption and lower carbon emissions. This method minimises the need for aircraft to use their engines for taxiing, leading to a decrease in noise pollution around airports. Additionally, it helps in conserving aviation fuel, a critical step towards sustainable aviation. By reducing the aircraft’s carbon footprint and noise impact, tow trucks contribute to greener airport operations. However, the presence of tow trucks leads to an increase in the number of vehicles on the airfield, potentially resulting in congestion and an increase in air traffic controller (ATCO) workload.
ATCOs are pivotal in managing the safe and efficient taxiing of aircraft on the ground. Their responsibilities encompass coordinating with pilots and ground personnel to navigate aircraft along designated taxi routes while maintaining safe distances from other entities. This involves providing pilots with specific taxi instructions, including routes and conditions of taxiways or runways. ATCOs utilise both visual monitoring and technological aids like surface movement radar (SMR) to track aircraft movements accurately, ensuring adherence to planned paths and safe separation. Additionally, they issue clearances for runway crossings to prevent conflicts and maintain continuous communication with ground personnel, ensuring awareness of aircraft locations and movements. Monitoring meteorological conditions is also crucial, as visibility, wind, and precipitation significantly affect taxiing safety. Through these measures, ATCOs play a critical role in safeguarding airport operations, facilitating the seamless movement of aircraft from the gate to the runway and vice versa.
ATCOs are also responsible for the selection of a runway for departing and landing aircraft. This selection is governed by factors such as wind speed and direction, prevailing weather conditions, runway availability, and traffic flow. This crucial aspect of air traffic management aims to maximise safety and operational efficiency. By prioritising runways that provide favourable wind conditions and minimise crosswind effects, ATCOs enhances flight safety and airport throughput. These decisions ensure the effective integration of ground and airborne phases of flight operations, maintaining the overall harmony and safety of airport activities.
This work focuses on the use of electric tow trucks for taxi operations. It proposes a scheduling and routing algorithm which can assign tow trucks to aircraft, and determine conflict-free routes for all vehicles. Operating at a strategic level and using a centralised approach, the algorithm pre-establishes all routes, adjusts aircraft schedules, and sets tow truck schedules before taxi operations begin.
Moreover, the algorithm offers the flexibility to either prioritise taxi delays or fuel consumption, depending on the chosen approach: Time-Wise Approach or Fuel-Wise Approach. Additionally, it can be configured to assign tow trucks to aircraft using either Static Allocation, requiring them to be parked in a depot, or Dynamic Allocation, allowing assignment from any location within the airport. Importantly, the algorithm’s scalability and adaptability to diverse taxiing environments are ensured through rigorous testing across various scenarios. The test outcomes confirm that the algorithm’s solutions remain conflict-free, even under conditions of high traffic volumes.
The rest of this paper is organised as follows. Section 2 explores previous work to identify the strengths and limitations of solutions proposed in different contexts. Section 3 describes the proposed algorithm. Section 4 defines the performance metrics and test scenarios, and then presents the results. Section 5 discusses the results and, finally, Section 6 outlines the key conclusions of this paper and highlights areas for future research.

2. Literature Review

The significant fuel and economic savings achievable through fuel-saving strategies during taxiing have been thoroughly documented and emphasised in recent studies [14]. These strategies include the adoption of single-engine taxiing and the utilisation of electrically powered tow trucks. In the case of tow truck deployment, devising an efficient assignment method is crucial to maximising these benefits while also ensuring solutions that prevent congestion. In general, the solutions proposed in the literature follow two distinct optimisation strategies, namely the centralised and decentralised approaches [15]. Centralised approaches involve a central authority that is responsible for making decisions regarding the assignment of electric towing trucks to aircraft. This strategy aims to find the global optimum, but requires comprehensive knowledge of all the vehicles on the airport’s surface, which might be challenging to obtain in real-time scenarios [16,17]. Decentralised approaches, on the other hand, distribute the decision-making authority among various agents, including individual vehicles or groups of vehicles [18]. These agents make local decisions based on their own information and communicate with each other to achieve a coordinated assignment of electric towing trucks to aircraft. Given the complexity and dynamic nature of airport operations, decentralised approaches are possibly more suitable for practical implementation, but can suffer from local optima, where suboptimal solutions are reached due to individual agents optimising their decisions without considering the global context.
Several studies have proposed different algorithms and heuristics to address the general assignment problem in the field of robotics. In their work, Gawrilow et al. [19] studied the routing problem for Automated Guided Vehicles (AGV) used in large-scale production systems. Their system, resembling the Dijkstra algorithm, manages to avoid conflict, deadlocks, and livelocks during route computation. Specifically, it uses a quickest path with time windows to ensure adequate separation between the AGVs. Soon after, Ibrahim et al. [20] presented a Genetic Algorithm (GA) tailored for robot path planning in dynamic environments. In this system, each gene within a chromosome represents a step towards the robot’s subsequent location, with the chromosome’s length reflecting the minimum number of steps required to reach the destination. This algorithm identifies optimal paths for robots by navigating around both static and dynamic obstacles, which makes it suitable for real-time scenarios. However, the model’s application to aircraft taxiing introduces complexities since, in an airport environment, the movements are strictly limited to predefined taxiways and runways, and therefore poses a significant challenge. This problem has been addressed by Zhang et al. [21] who proposed a multi-objective optimization method for aircraft taxiing on an airport surface, considering both environment constraints of the airport and aircraft conflicts. The method employs multi-objective GAs and aims to achieve a Pareto-optimised taxiing scheme in terms of taxiing time, fuel consumption, and pollutant emissions. The algorithm offers two distinct taxiing schemes: one prioritising time savings and another emphasising fuel savings. However, the optimisation process primarily focuses on reducing aircraft waiting time during taxiing when potential conflicts arise, rerouting affected aircraft when two or more need to cross the same taxiway or intersection. Notably, other solutions, such as postponing aircraft departures, are not considered within this framework.
Notably, the SAFETug project carried out by NASA [22,23] proposed a fully autonomous, centralised taxiing system approach, which includes a surface scheduler, an automated route planning system, and a Human Machine Interface (HMI) to assist ATC, pilots, and ground crew during tow truck-based taxi operations, by making tactical decisions to ensure safe and efficient procedures. The system is based on the Floyd–Warshall All-Pairs Shortest Path Optimiser (SPO) for finding the shortest path between tugs and aircraft, and a greedy algorithm to assign the tow trucks to the aircraft based on their location and availability. The system has been tested at Dallas/Fort Worth International Airport and has been instrumental in addressing issues such as the logistical challenges associated with autonomous engines-off taxiing, the precision of navigation of the autonomous tow trucks and the situation awareness of ATCOs. Certain areas that require additional investigation include the added delays introduced by the use of tow trucks and optimization of vehicle routing in scenarios characterised by heavy traffic.
Mixed-Integer Linear Programming (MILP) applications for addressing the multiple-route taxi scheduling problem have also been proposed by various authors [24,25,26]. The formulations of [24,25] aim to minimise multi-objective costs, typically encompassing taxiing time, fuel consumption, and resulting delays, whilst adhering to operational constraints. Such mathematical programmes can solve the vehicle routing problem and provide conflict-free taxi routes.
Simplification assumptions are commonly integrated to simplify the formulation of such models. For instance, Ref. [26] assumes that tow trucks, specifically the ones not engaged in towing operations, are never subject to conflicts with other vehicles, potentially leading to oversimplified solutions which can cause disruptions during operations. Furthermore, the exclusion of tow truck charging times and battery energy considerations simplifies the operational complexity of using electric-powered tow tractors, potentially leading to unrealistic scheduling and resource allocation. Lastly, the study’s focus on a single airport scenario limits its applicability across different airport environments with varying size, geometry, and operational demands.
Recent advancements [27] have begun to refine the assumptions of previous works by incorporating a partial battery recharging strategy for the tow trucks into the problem statement. One common concern related to the MILP formulations is the execution speed at which the global optimum is identified for real-time applications. To address this, most of the works trade off the optimality conditions for improved execution speed by solving iteratively on predefined time windows [27] and in some cases by providing additional MILP models to adjust for the tactical shifts occurring in the short-term time frame, which addresses real-time operational challenges [28]. If execution speed is crucial, basic greedy algorithms can be adopted instead of the MILP formulation for assigning tow trucks to aircraft. Such comparison was carried out in [28] where a greedy algorithm was evaluated against the optimal solutions, demonstrating a 5% optimality gap alongside a remarkable reduction in computation time by fiftyfold.
Adacher et al. [29] introduced a graph-based method for scheduling surface movements, utilising an autonomous multi-agent framework to mitigate air traffic congestion in real-time. Their approach models air traffic as a graph divided into sectors, each overseen by a decision-making agent responsible for traffic control within their sector to ensure adherence to timetables and capacity constraints. In scenarios of anticipated congestion, aircraft schedules are recalculated and assessed repeatedly until capacity constraints are satisfied and congestion is resolved. Two specific SPO techniques—Generalised Dijkstra and Bi-directional Search—are applied to each aircraft involved in congestion scenarios. A notable limitation of this work is the handling of conflicts after they have emerged, with both affected aircraft already in motion. The challenge here is the difficulty in delaying or rerouting aircraft due to the scarcity of alternative pathways, potentially leading to knock-on effects that amplify conflicts in nearby sectors.
Li et al. [30] adopt a directed graph model to represent the layout of a fictitious airport, introducing a multi-factor constrained optimization approach for determining aircraft taxiing paths based on the Dijkstra algorithm. This method considers various elements such as runway changes, potential aircraft conflicts and engine failures during taxiing. These factors influence the selection of taxi paths by determining the weights assigned to the edges of the graph. However, the model does not account for key operational metrics such as taxi time, fuel consumption, and potential taxi delays in its optimisation process. This omission makes the algorithm more suitable for real-time (tactical) decision-making rather than for long-term (strategic) planning.
After analysing the solutions described in the literature, several limitations were identified as follows:
  • In order to speed up the results, some studies permit solutions that may result in vehicle conflicts during the strategic planning phase.
  • Many tow truck-based taxiing strategies prioritise identifying conflict-free routes and schedules, without considering the efficient allocation of tow trucks, such as minimising taxi delays or maximising fuel savings.
  • Current performance metrics predominantly focus on taxi delays and the number of potential vehicle conflicts, neglecting the incorporation of fuel consumption and fuel saving metrics which could underscore the environmental advantages of utilising tow trucks.
  • The proposed taxiing solutions are often only tested on one airport layout, leaving their effectiveness on airports of different sizes and layouts unverified.
  • Performance evaluations of taxiing algorithms are frequently conducted using a single medium-level traffic scenario. This approach, while useful for initial testing, fails to assess the system’s robustness across different traffic levels.
  • Such evaluations often employ a fixed number of tow trucks, discarding potential variations in the number of available tow trucks.
  • The scheduling process frequently overlooks the state of charge of tow truck batteries, potentially distorting tow truck efficiency estimates, and underestimates the number of tow trucks for effective taxi operations.
  • Several strategies do not continuously monitor for potential conflicts with other vehicles during the entire cycle of the operations, particularly for tow trucks when they are not actively towing. This leads to oversimplified solutions which, in reality, can be hazardous, failing to account for potential safety risks.
To overcome these limitations, the following methodologies were integrated into this study:
  • The proposed algorithm is designed to prevent vehicle conflicts during the strategic phase for all simulated scenarios, ensuring safer and more efficient operations.
  • A tow truck scheduling algorithm has been developed, which factors in the distance between the tow truck and the aircraft, battery charge level, potential route conflicts, and tow truck utilisation history during the simulated period.
  • A more comprehensive set of performance metrics has been adopted, including fuel consumption, fuel savings, and tow truck utilisation.
  • The algorithm underwent rigorous testing across four diverse airport layouts, encompassing a variety of sizes and geometries, to validate its broad applicability. These tests included simulations with a wide range of traffic levels and tow truck numbers.
  • The simulations now consider the state of charge of the tow trucks, ensuring a more accurate depiction of tow truck availability and operational capabilities.
  • The proposed system features continuous conflict checks for both aircraft and tow trucks, whether they are actively towing or not. This allows for the detection of potential conflicts with other vehicles throughout the entire cycle of operations, enhancing safety and system reliability.

3. Description of Algorithm

The algorithm’s primary objective is to determine conflict-free taxi routes for multiple aircraft and to allocate electric tow trucks to these aircraft to minimise fuel consumption. In addition, the algorithm aims to reduce the aircraft taxi delays and maximise the utilisation of the available tow truck fleet. To achieve this, the algorithm is divided into two main parts. Firstly, the Flight Dispatcher sub-module assigns conflict-free routes to each aircraft, adjusting their schedules within specified boundaries if no route is identified. Secondly, the Tug Dispatcher sub-module allocates tow trucks to the aircraft, identifying conflict-free tow truck routes and generating a tow truck schedule. A control flow diagram of the algorithm is shown in Figure 1.

3.1. Airport Modelling and Assumptions

The efficiency of the airport’s taxi operations relies heavily on the flight schedules, which dictate the timing of arrivals and departures. Each departing aircraft is assigned a planned Off-Block Time (OBT), indicating when they should leave their parking position to begin taxiing towards a runway. However, actual departures may occur later than the planned OBT due to various factors such as cargo and passenger loading delays or deliberate pilot decisions to wait before taxiing. Similarly, arriving aircraft have a planned Time of Arrival (TOA), specifying when they are expected to land. Upon landing, aircraft are expected to promptly vacate the runway without delay to avoid disrupting subsequent arrivals and departures. Any delay in runway vacation may lead to complications, potentially necessitating go-arounds for following landing aircraft.
Implementing autonomous electric tow trucks for taxi operations requires the establishment of one or more depots within the aerodrome. These depots act as parking and recharging hubs for the tow trucks. Currently, most airports do not utilise electric tow trucks and hence no tow truck depots are designated for this specific scope. In view of this, for this study, the locations of the depots were manually defined for each airport that was considered. The selection criteria for depot locations included the absence of other facilities in the selected location, easy connectivity to nearby taxiways and service roads, and proximity to one or more aprons. Each tow truck depot is linked to the airport’s road network via one or more connections, designated as service roads, which were manually defined.
The number of parking slots available per depot is a design choice and can vary from one airfield to another. To ensure an adequate number of free charging points, the total number of parking slots, denoted as ( S b ), at each depot b is given by:
S b = 1.5 × R / B  
where the following are defined:
  • R is the total number of tow trucks;
  • B is the total number of depots in the airfield.
Using this equation, the total number of charging points is always greater than the number of tow trucks and scales in proportion to the size of the tow truck fleet.
Furthermore, a simplifying assumption of this work is that each runway has a fixed takeoff point (ToP) and a fixed landing point (LEP) (in practice, the exact takeoff/landing point depends on multiple factors such as the takeoff/landing distance required, wind speed and direction, runway conditions, etc.). In addition, it is assumed that an aircraft can take off from (or land on) any of the airport’s runways.
The airport environment is represented as a directed graph that connects the airport’s roads, stands and tow truck depots. The graph consists of nodes and edges, where nodes denote relevant points such as aircraft stands, Taxi-Out Points (ToPs), Landing End Points (LEPs), tow truck depots, and road intersections (i.e., runways, taxiways, or service roads). Edges, connecting pairs of nodes symbolises the airport’s roads (including taxiways, runways, and service roads). An edge between two nodes indicates a physical connection via a road. Figure 2 shows a graphical depiction of Malta International Airport (MLA) together with the corresponding directed graph. All graph edges are deemed bi-directional.
In this work, time is discretised into uniform time intervals known as Time Windows, each lasting 10 s. No acceleration or deceleration is modelled for the vehicle’s motion. It is assumed that the vehicles, including aircraft and tow trucks, are either stationary (i.e., with a velocity of 0 m/s) or travelling at a constant speed. The Average Vehicle Velocity ( v a v ) is set to 10 m/s (19.4 Knots), a value within the typical range of aircraft taxi speeds [31].
To ensure safety and avoid conflicts between vehicles, including aircraft and tow trucks, several rules and minimum separation distances are enforced. To this effect, taxiways and runways do not allow simultaneous bi-directional traffic flow of aircraft. Additionally, a minimum separation distance between two taxiing aircraft is mandated to prevent potential hazards. This distance cannot be less than 50 m due to aircraft jet blast and ideally should range between 100 m and 300 m, depending on the aircraft type [32]. In this work, a conflict is defined as occurring when the geometric centres of two vehicles, at least one of which is either an aircraft or a tow truck towing an aircraft, come closer than 200 m. To implement this, circular buffer areas ( A b ) with a radius of 100 m (defined as Buffer Distance, d b ) centred on each vehicle’s geometrical centre, are defined. A conflict is registered if the circular buffer areas of two vehicles intersect. However, when both vehicles are unloaded tow trucks (i.e., not towing aircraft), no minimum separation distance is imposed. Therefore, tow trucks are permitted to cross each other’s path or travel alongside each other on all the types of airport roads, including service roads. Thus, conflicts between tow trucks are assumed to be non-existent, and the circular buffer area is not applicable in such cases. These rules are applicable regardless of whether the vehicles are travelling in opposite directions or in the same direction with one vehicle trailing another.

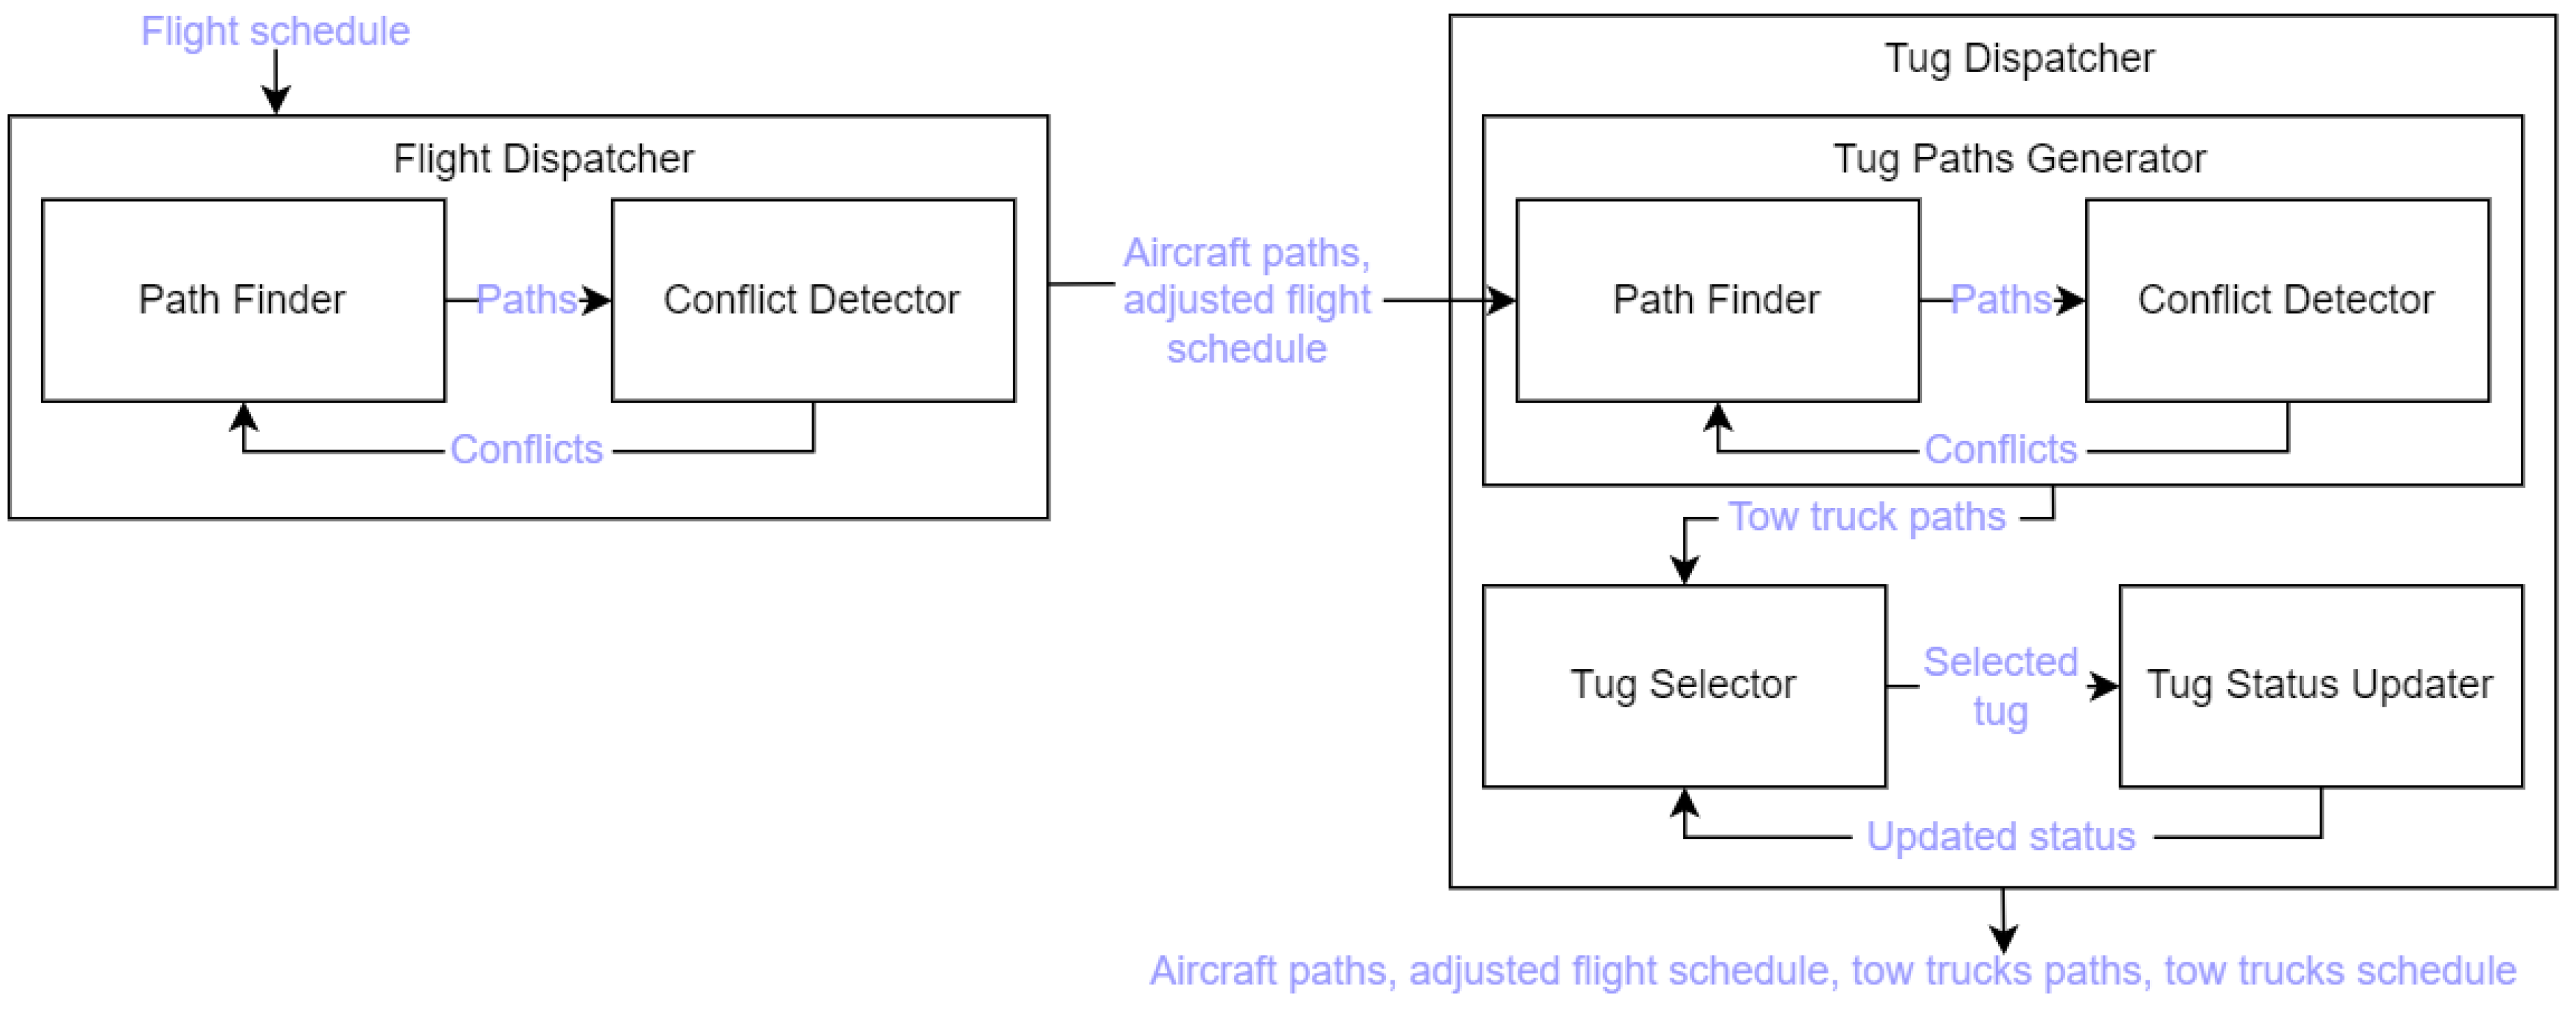
3.2. Flight Dispatcher

The Flight Dispatcher sub-module utilises the Dijkstra Shortest Path Optimisation (SPO) technique to determine conflict-free routes for each aircraft in the flight schedule, aiming to minimise their delays. For each aircraft, denoted by a , the Flight Dispatcher assigns a path consisting of nodes and edges, connecting its initial position, denoted as n s t a , to its final position, n e n d a , along with a designated start time for taxiing t a s .
For departing aircraft, n s t a corresponds to the aircraft stand assigned by a predefined flight schedule, while n e n d a aligns with one of the takeoff points (ToPs). Conversely, for arriving aircraft, n s t a corresponds to one of the landing entry points (LEPs), while n e n d a aligns with the aircraft stand assigned in the flight schedule.
To maintain conflict-free paths, the Flight Dispatcher assesses each path for potential traffic conflicts and adjusts the path if a conflict is anticipated. For this work, two strategies have been incorporated to address predicted traffic conflicts. For the first strategy, the conflict is resolved by modifying the aircraft’s taxi path, while the second strategy involves adjusting the start time for taxiing (in the case of arrivals, it is assumed that the aircraft waits at a runway holding point). Both strategies can resolve identified conflicts but may result in delays to the aircraft’s arrival time at the intended end point. Additionally, a combination of these strategies is feasible and has been implemented accordingly.
To achieve this objective, the Flight Dispatcher aims to minimise the Total Delay Δ t d t o t for each aircraft, which is calculated follows:
Δ t d t o t = Δ t d s + Δ t d t  
where Δ t d s is the delay experienced by an aircraft while waiting next to the runway (for arrivals) or at the stand (for departures), and Δ t d t is the delay accumulated by an aircraft during taxiing.
The module calculates a flight’s Δ t d t o t for all the LEPs (in case of arrival) or all the ToPs (in the case of departures) to determine the appropriate runway for aircraft landing or takeoff (In this work, the available runways are randomly selected for each simulation). Aircraft are analysed sequentially, based on their arrival or departure time in the flight schedule, and solutions are explored for each LEP (for arrivals) or each ToP (for departures), as follows:
  • n s t a and n e n d a are input to the module Path Finder, which finds the ideal (i.e., shortest) path and the ideal (i.e., shortest) taxi distance. This distance is then divided by v a v to find an ideal taxi time Δ t i t .
  • The module attempts to find a conflict-free solution. First, the ideal path is forwarded to the Conflict Detector module. This module checks if the path is conflict-free; produces a Vehicle Occupation Table (VOT), which stores all the time windows during which the edges of the path are occupied by the vehicle; and, if potential conflicts are detected, stores them in the Edges in Conflict List (ECL), which contains a list of edges that need to be excluded from the next iteration of Path Finder.
  • If potential conflicts are detected, Path Finder calculates a new path, excluding the edges listed in ECL, and the feasibility of the path—indicating whether the module found a feasible path (i.e., n s t a and n e n d a are connected by a number of edges)—is checked. If the path is not feasible, the solution is discarded and the process restarts with an incremented Δ t d s (see point 5); otherwise, the feasible path is sent again to the Conflict Detector to check for the presence of conflicts. This process is repeated until a conflict-free path is identified or, as mentioned, until the path is flagged as not feasible. In case a conflict-free path is found, the module calculates and stores Δ t d t o t of the current iteration.
  • Δ t d s is incremented by a time interval equal to 10 s (i.e., with the same duration of a time window) and the process is repeated from point 2 for a new iteration.
  • New solutions are calculated until the Δ t d s of a new solution is greater than or equal to the Δ t d t o t of any solution, in which case the search for solutions is stopped for the analysed runway. The whole process is repeated for the next runway until all the LEPs (in case of an arrival) or all the ToPs (in case of a departure) are analysed.
  • In case no conflict-free solutions are found (meaning that all of the solutions are discarded because the corresponding paths are considered to be unfeasible), the whole set of solutions is marked as unfeasible and the algorithm stops the calculations for the selected simulation.
  • The solution with the lowest Δ t d t o t is selected, and the VOT of the selected solution is appended to the Global Occupation Table (GOT), which represents the combination of all the VOTs of the selected solutions of the previously analysed aircraft; therefore, when the first aircraft is analysed, the GOT is empty.

3.3. Tug Dispatcher

The Tug Dispatcher sub-module manages the assignment of tow truck to each flight, determining conflict-free routes for each tow truck from its position to the aircraft’s starting node, and from the aircraft’s end node to each tow truck depot. It also assigns a depot to a tow truck upon completing its towing mission and updates the status of assigned tow trucks and their destination depots.
The Tug Dispatcher aims to optimise the utilisation of available tow trucks, minimising reliance on conventional engine-driven taxiing for aircraft. It generates conflict-free routes for tow trucks that do not interfere with routes calculated by the Flight Dispatcher. Additionally, it ensures a balanced workload among tow trucks, allowing for recharging in depots when their battery level drops below a set threshold. As explained in Section 2, the Tug Dispatcher operates in two allocation modes: Static Allocation and Dynamic Allocation.
To achieve these objectives, the Tug Dispatcher assesses each aircraft sequentially, utilising sub-modules such as the Tug Paths Generator to generate conflict-free routes, the Tug Selector to assign a tow truck to a flight, and the Tug Status Updater to update the status of the assigned tow trucks and their destination depots.
The aim of the Tug Paths Generator is to produce conflict-free routes for all the tow trucks, ensuring timely arrival at aircraft or return to a depot. To accomplish this, the module operates twice for each flight: first, to identify viable paths from each tow truck to the aircraft’s attachment node ( n s t a ), and second, to find feasible paths from the aircraft’s detachment node ( n e n d a ) to the depots. While its operation resembles that of the Flight Dispatcher, adaptations are made to tailor the process to the unique requirements of tow truck dispatching.
The Tug Selector module plays a critical role in assigning tow trucks to aircraft and determining the depot to which the tow truck returns after its taxi mission. It evaluates various tow truck parameters, such as battery level and utilisation time, along with depot availability. In the case of Static Allocation, where tow trucks are assigned from depots, availability is determined by whether a tow truck is parked and sufficiently charged. However, under Dynamic Allocation, where tow trucks can be assigned from anywhere in the airport, availability extends to tow trucks not parked in depots. In either scenario, a tow truck must be unloaded, possess sufficient battery charge, and be without any ongoing mission to be considered for assignment.
After a tow truck is assigned to an aircraft, the Tug Status Updater module takes over, ensuring that the tow truck’s status—including its battery charge, assigned depot, and assigned aircraft—is updated for all time windows. Subsequently, the Tug Dispatcher proceeds to the next flight in the schedule, initiating the entire process.
Following this approach, paths for tow trucks are determined prior to selecting a specific tow truck by identifying possible routes from each depot to the aircraft’s location and from tow truck positions to the pickup point, especially in scenarios using Dynamic Allocation. This pre-selection process facilitates the efficient matching of tow trucks to tasks by evaluating all potential movement patterns in advance.
  • Static and Dynamic Allocation of Tow Trucks
The algorithm employs two distinct types of tow truck allocations: Static Allocation and Dynamic Allocation. In the case of Static Allocation, a tow truck needs to be parked in a depot to be eligible for assignment to an aircraft. After completing its mission, it must return to the same or different depot. Conversely, Dynamic Allocation allows a tow truck to be assigned to an aircraft from any location within the airport. Once the towing operation concludes, the tow truck either returns to a depot or it is reassigned to a new mission. Reassignment can also take place while the tow truck is en route to a depot.
2.
Tow Truck Allocation Criteria
To determine which tow truck should be allocated to an aircraft, the system first eliminates unavailable tow trucks, namely those already assigned to another mission or lacking sufficient battery charge. A minimum battery charge threshold ensures successful towing of an aircraft to its destination and is selected based on the typical expected duration of a single towing mission. In this study, an arbitrary value of 20% was selected for this purpose. In the event no trucks meet the required battery charge, the aircraft is permitted to taxi using its own engines, following conventional procedures. On the other hand, if at least one tow truck meets the battery charge criteria, the algorithm selects one based on the following three criteria, prioritised in the following order:
  • Availability of a conflict-free route from the tow truck’s location to the aircraft’s n s t that permits the tow truck to reach the aircraft exactly at the t a s of the aircraft;
  • If multiple tow trucks meet the first criterion, the tow truck with the lowest associated Total Mission Cost (given by Equation (3)) is chosen;
  • If more than one tow truck has the lowest associated cost as defined in the second criterion, the tow truck with the least utilisation time is selected to ensure a fair distribution of missions between the tow trucks.
Finally, if multiple tow trucks meet all the three criteria, an arbitrary tow truck is assigned to the aircraft.
The Total Mission Cost ( c t o t r ) for each tow truck r , is computed as follows:
c t o t r = c t o w r + c t o w . m a x c t o w . m a x b m a x b m i n × b r b m i n
where the following are defined:
  • c t o w r is the time that r needs to complete the towing mission;
  • c t o w . m a x is the maximum c t o w r over all the tow trucks;
  • b m a x is the maximum battery charge, equal to 100%;
  • b m i n is the minimum allowed battery charge, equal to 20%;
  • b r is the battery charge of r .
3.
Time-Wise and Fuel-Wise Approach
If no tow trucks meet the first criterion of Section 2. (i.e., availability of a conflict-free route for any tow truck), the Tug Dispatcher adopts one of the following two approaches to proceed:
  • Time-Wise Approach: In this approach, no tow trucks are assigned to the flight, and the aircraft is permitted to taxi with its own engines.
  • Fuel-Wise Approach: Alternatively, if the Fuel-Wise Approach is chosen, the algorithm seeks to delay the t a s of the aircraft by up to a maximum of 10 min. It then recalculates the aircraft schedule to determine if, under these adjusted conditions, (a) the aircraft route remains feasible (it should not be in conflict with the routes of the subsequent flights), and (b) at least one tow truck becomes available to satisfy the first criterion. If both conditions are met, the algorithm updates the aircraft schedule and assigns it a tow truck. However, if either condition is not met, the aircraft is instructed to taxi with its own engines.
4.
Depot Allocation Criteria
After the towing phase, the algorithm determines the destination depot for a tow truck based on three criteria:
  • A conflict-free route exists from the final position of the assigned aircraft, n e n d a , to the depot under consideration.
  • The depot under consideration has at least one available parking slot at the time the tow truck is scheduled to arrive.
  • The time required to return to the depot under consideration is shorter than the time needed to return to any other depot.
If no depots satisfy the first two criteria, no tow truck is assigned to the flight, and the aircraft is instructed to taxi with its own engines. Additionally, any potential update of the aircraft schedule with the Fuel-Wise Approach is cancelled.
This method of depot allocation is employed in both Static Allocation and Dynamic Allocation scenarios. However, in the case of dynamic allocation, during the final phase of its mission, the tow truck becomes available for a new assignment. Consequently, its route to the depot may be adjusted to redirect towards another aircraft.
5.
Battery Discharge Rates
The battery levels of all tow trucks are initially all set to 100%. The rates of battery discharge and recharge are assumed to be constant and are updated in the Tug Status Updater based on the following three parameters, which were arbitrarily selected for this study:
  • The Higher Battery Discharging Rate ( r b d h ) is the battery discharge rate applied when the tow truck is in motion and loaded and is set equal to 2%/min.
  • The Lower Battery Discharging Rate ( r b d l ) is the battery discharge rate applied when the tow truck is in motion and unloaded and is set equal to 1%/min.
  • The Battery Charging Rate ( r b c ) is the recharge rate applied when the tow truck is at a charging point in a depot and is set equal to 2%/min.
When a tow truck is stationary (but not connected into a charging point), its battery discharge rate is assumed to be negligible.

4. Testing and Results

The key test objectives were as follows:
  • To assess the performance of engineless taxiing with tow trucks across various dispatch approaches;
  • To analyse the size of the fleet of tow trucks that is necessary to cater for a certain level of airport traffic;
  • To explore the impact of tow truck battery performance on the efficacy of the algorithm.

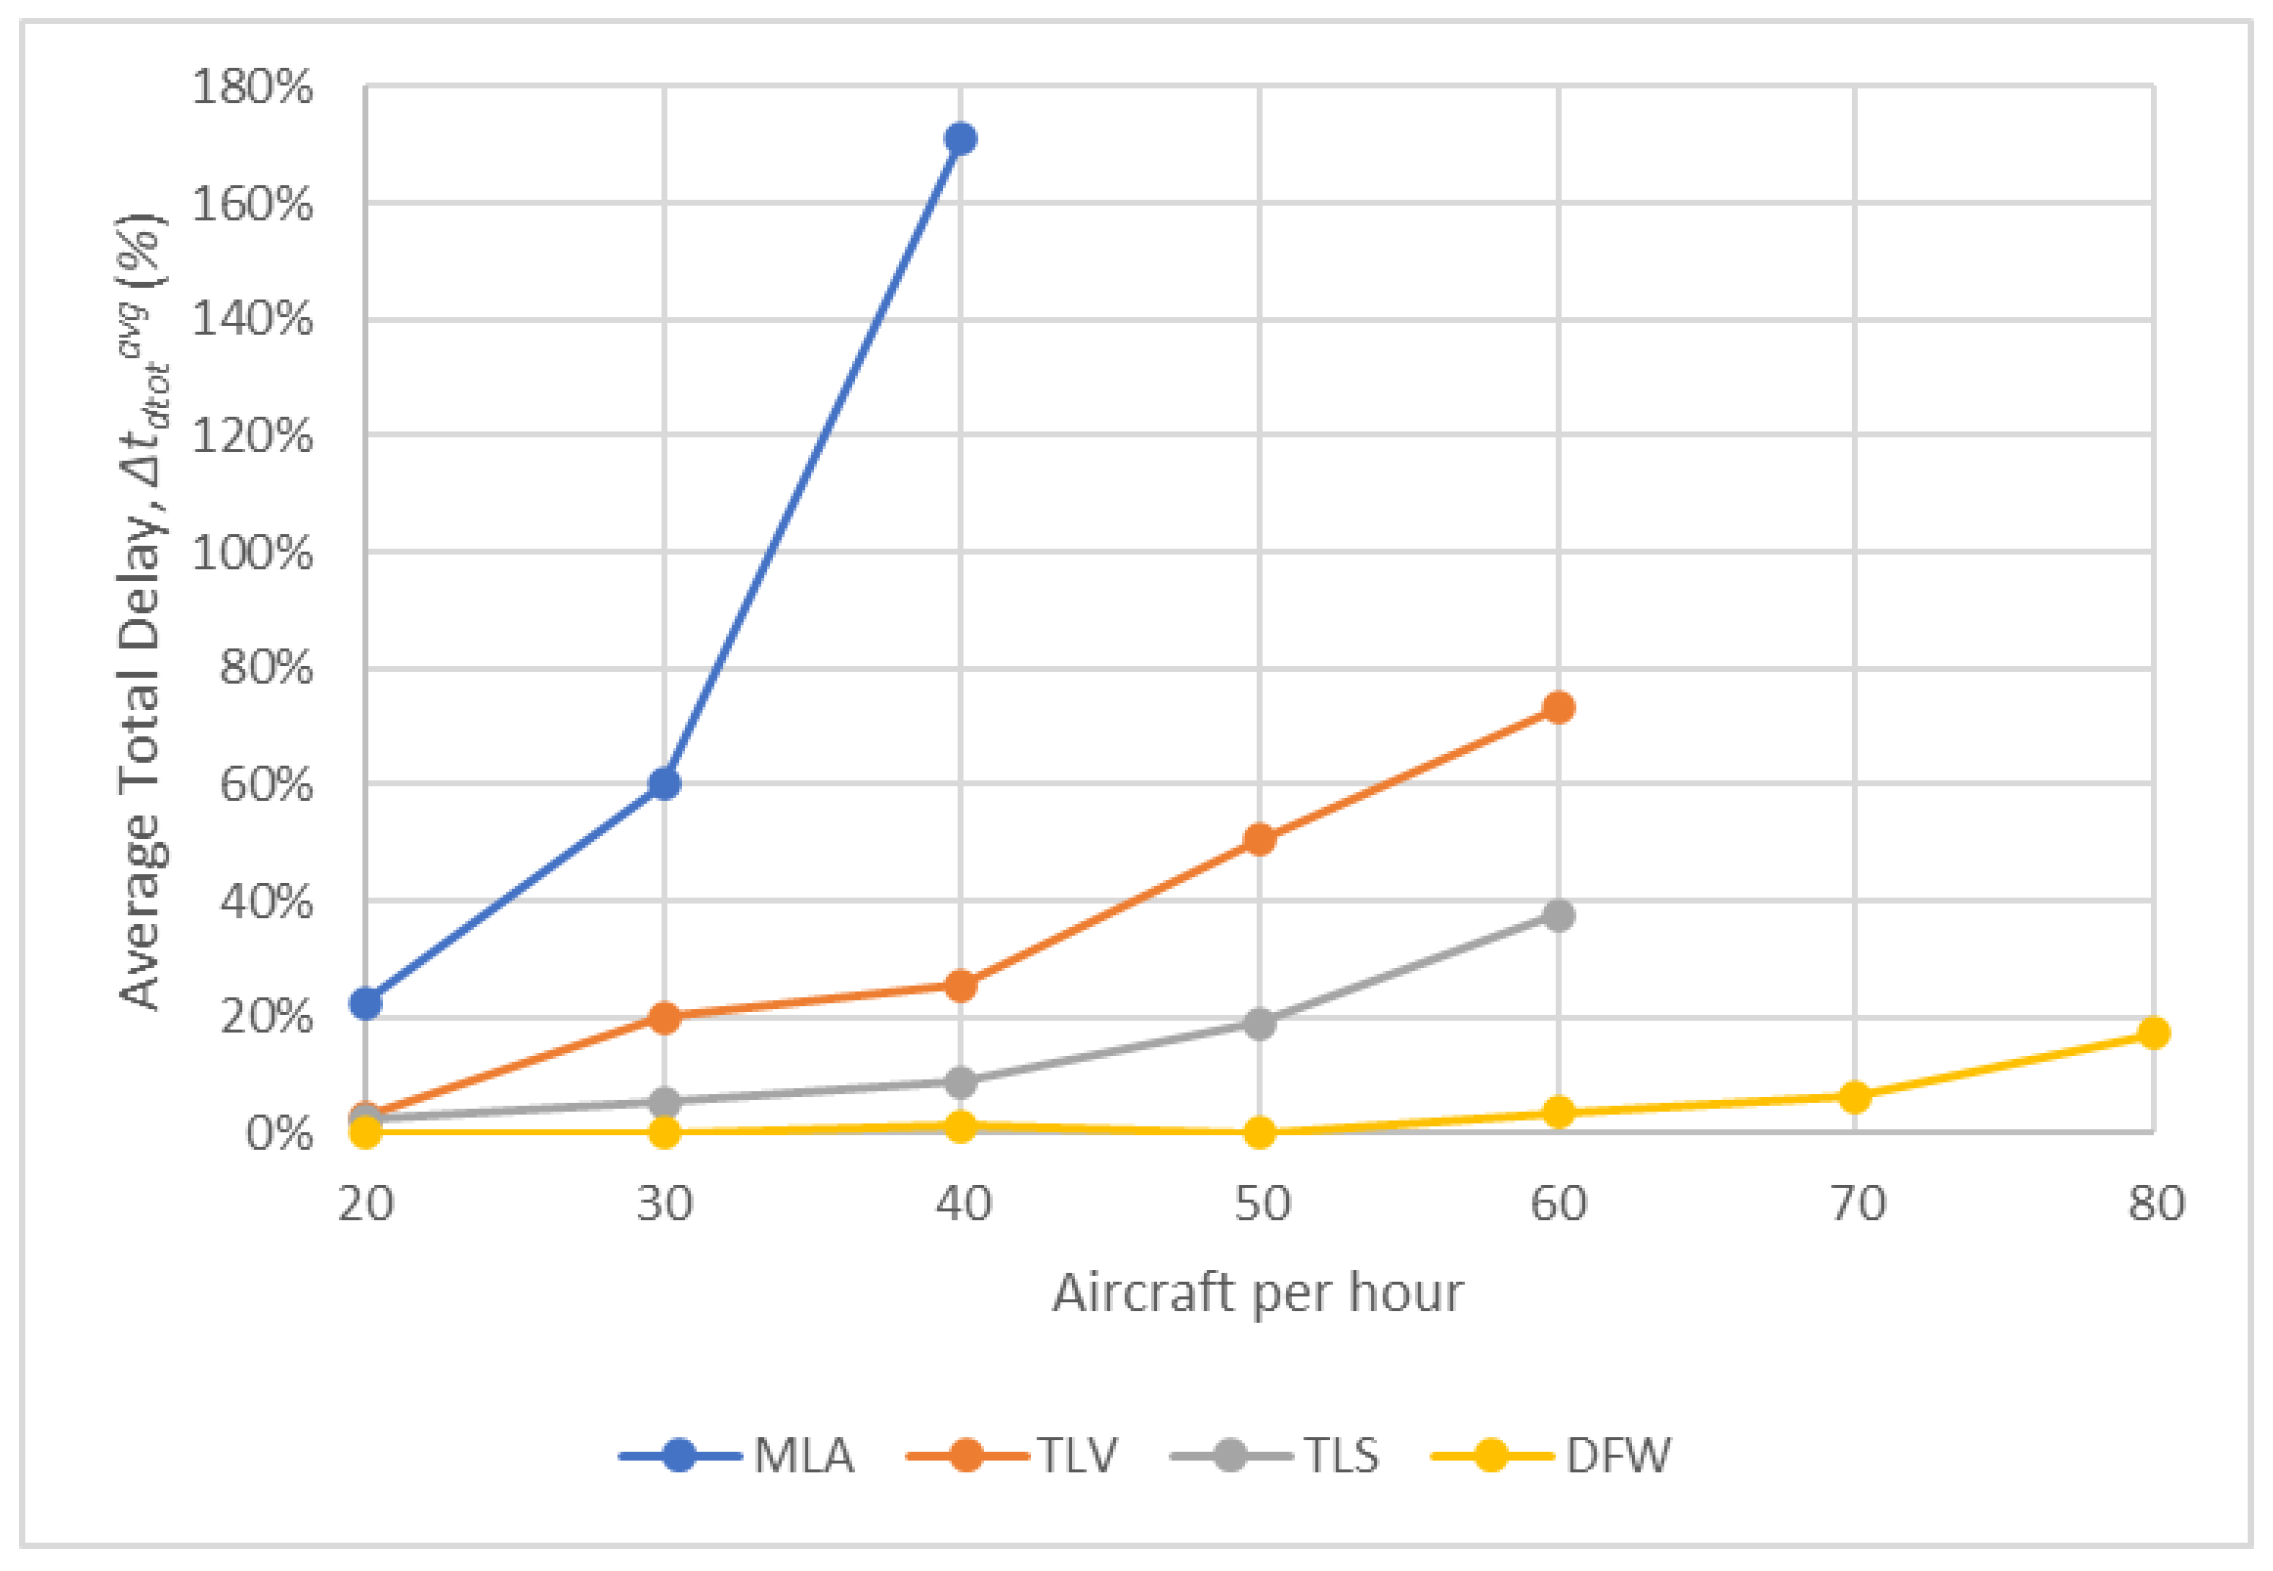
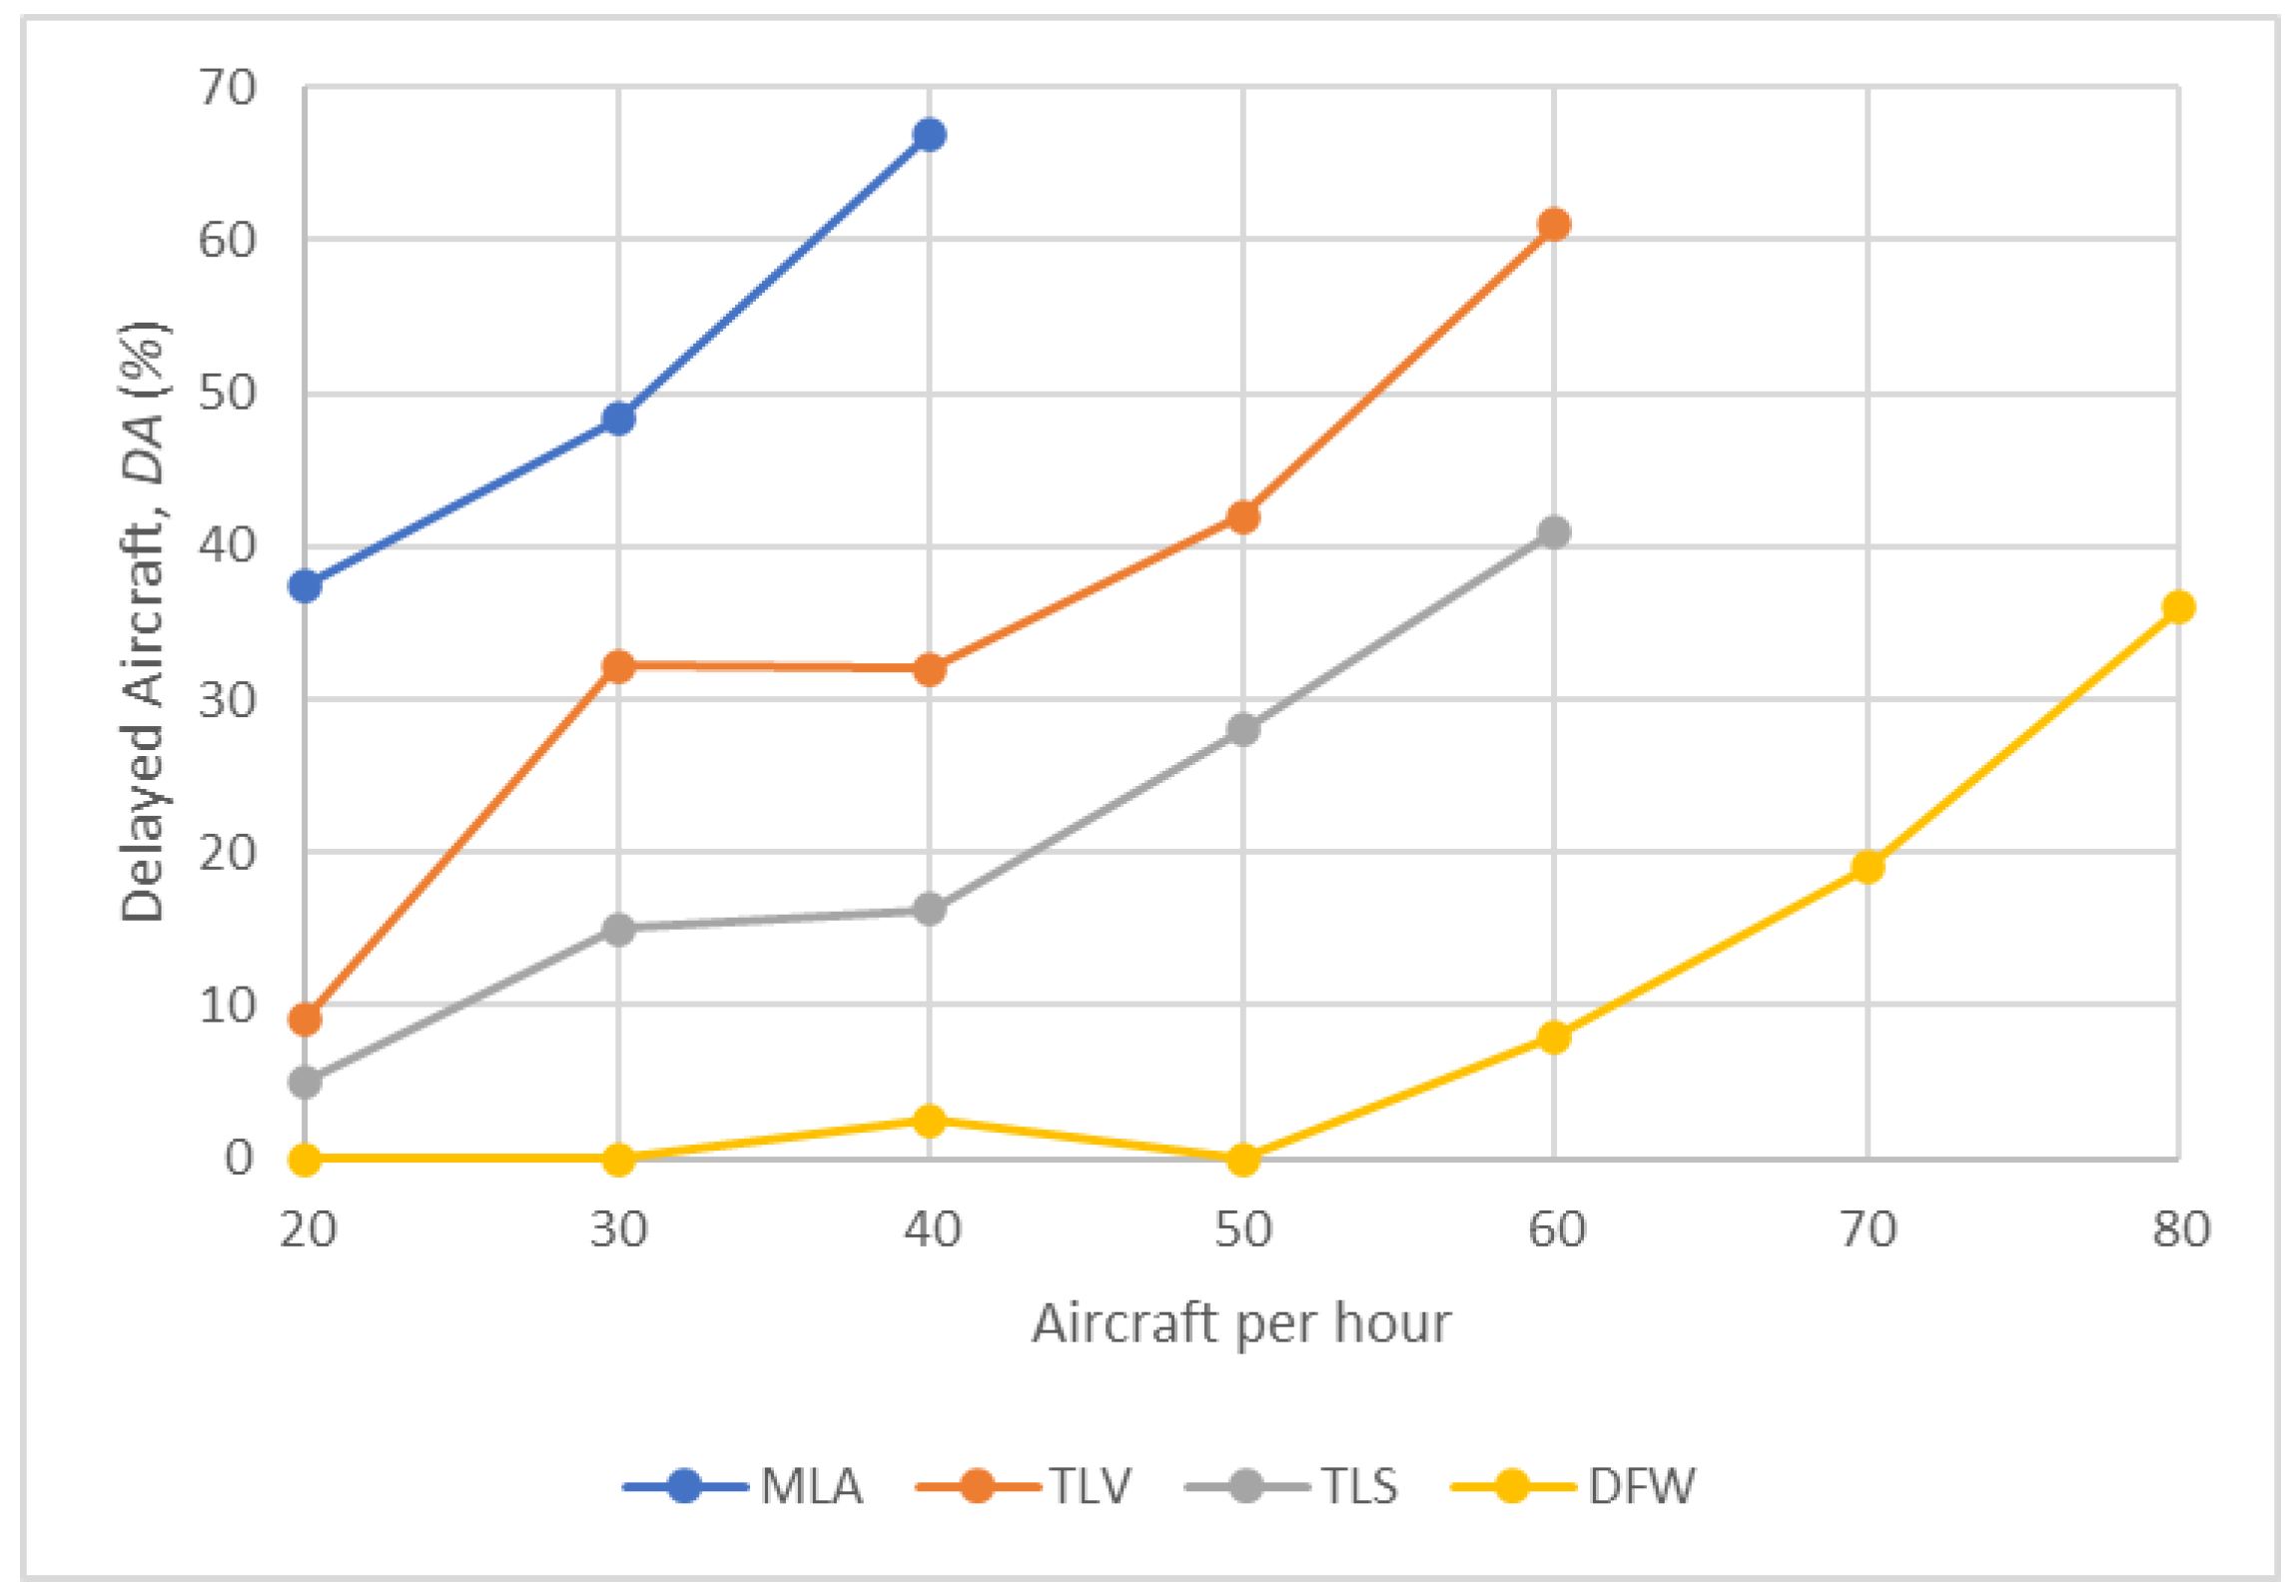
4.1. Performance Metrics

One of the objectives of testing is to quantify the average total delay and the percentage of delayed aircraft to ensure that, following the introduction of tow trucks, taxi operations adhere to the flight schedule timings. The Average Total Delay ( Δ t d t o t a v g , %) represents the average accumulated delay Δ t d t o t experienced by all aircraft, accounting for both towed and self-taxiing instances, compared to their ideal taxi time (i.e., the taxi time needed to cover the shortest route in the absence of conflicts). The Delayed Aircraft ( D A , %) metric denotes the percentage of aircraft whose start time is delayed (i.e., Δ t d s > 0 ).
In the case of the of tow trucks, testing should enable the prediction of the expected utilisation of the tow truck fleet across various levels of airport traffic and determine the necessary quantity of tow trucks required to manage the anticipated ground traffic levels. Therefore, it is important to quantify the percentage of aircraft that are towed rather than taxiing using their own engines and the amount of fuel saved during the tow truck operations. Additionally, to measure tow truck usage accurately, testing should assess the duration for which tow trucks are active throughout the simulation. The Towed Aircraft ( T A , %) metric represents the percentage of aircraft that are towed. The Average Fuel Savings ( Δ F s a v g , kg) is defined as the average fuel saved per aircraft when tow truck-based taxiing is used. Fuel consumption for a taxiing aircraft is calculated using a model developed by Khadilkar et al. [33], while the fuel consumption of a towed aircraft is assumed to be equal to zero. Finally, the Average Tow Truck Utilisation Time ( Δ t r u a v g , %) denotes the average duration for which each tow truck is active, expressed as a percentage of the total simulation time.

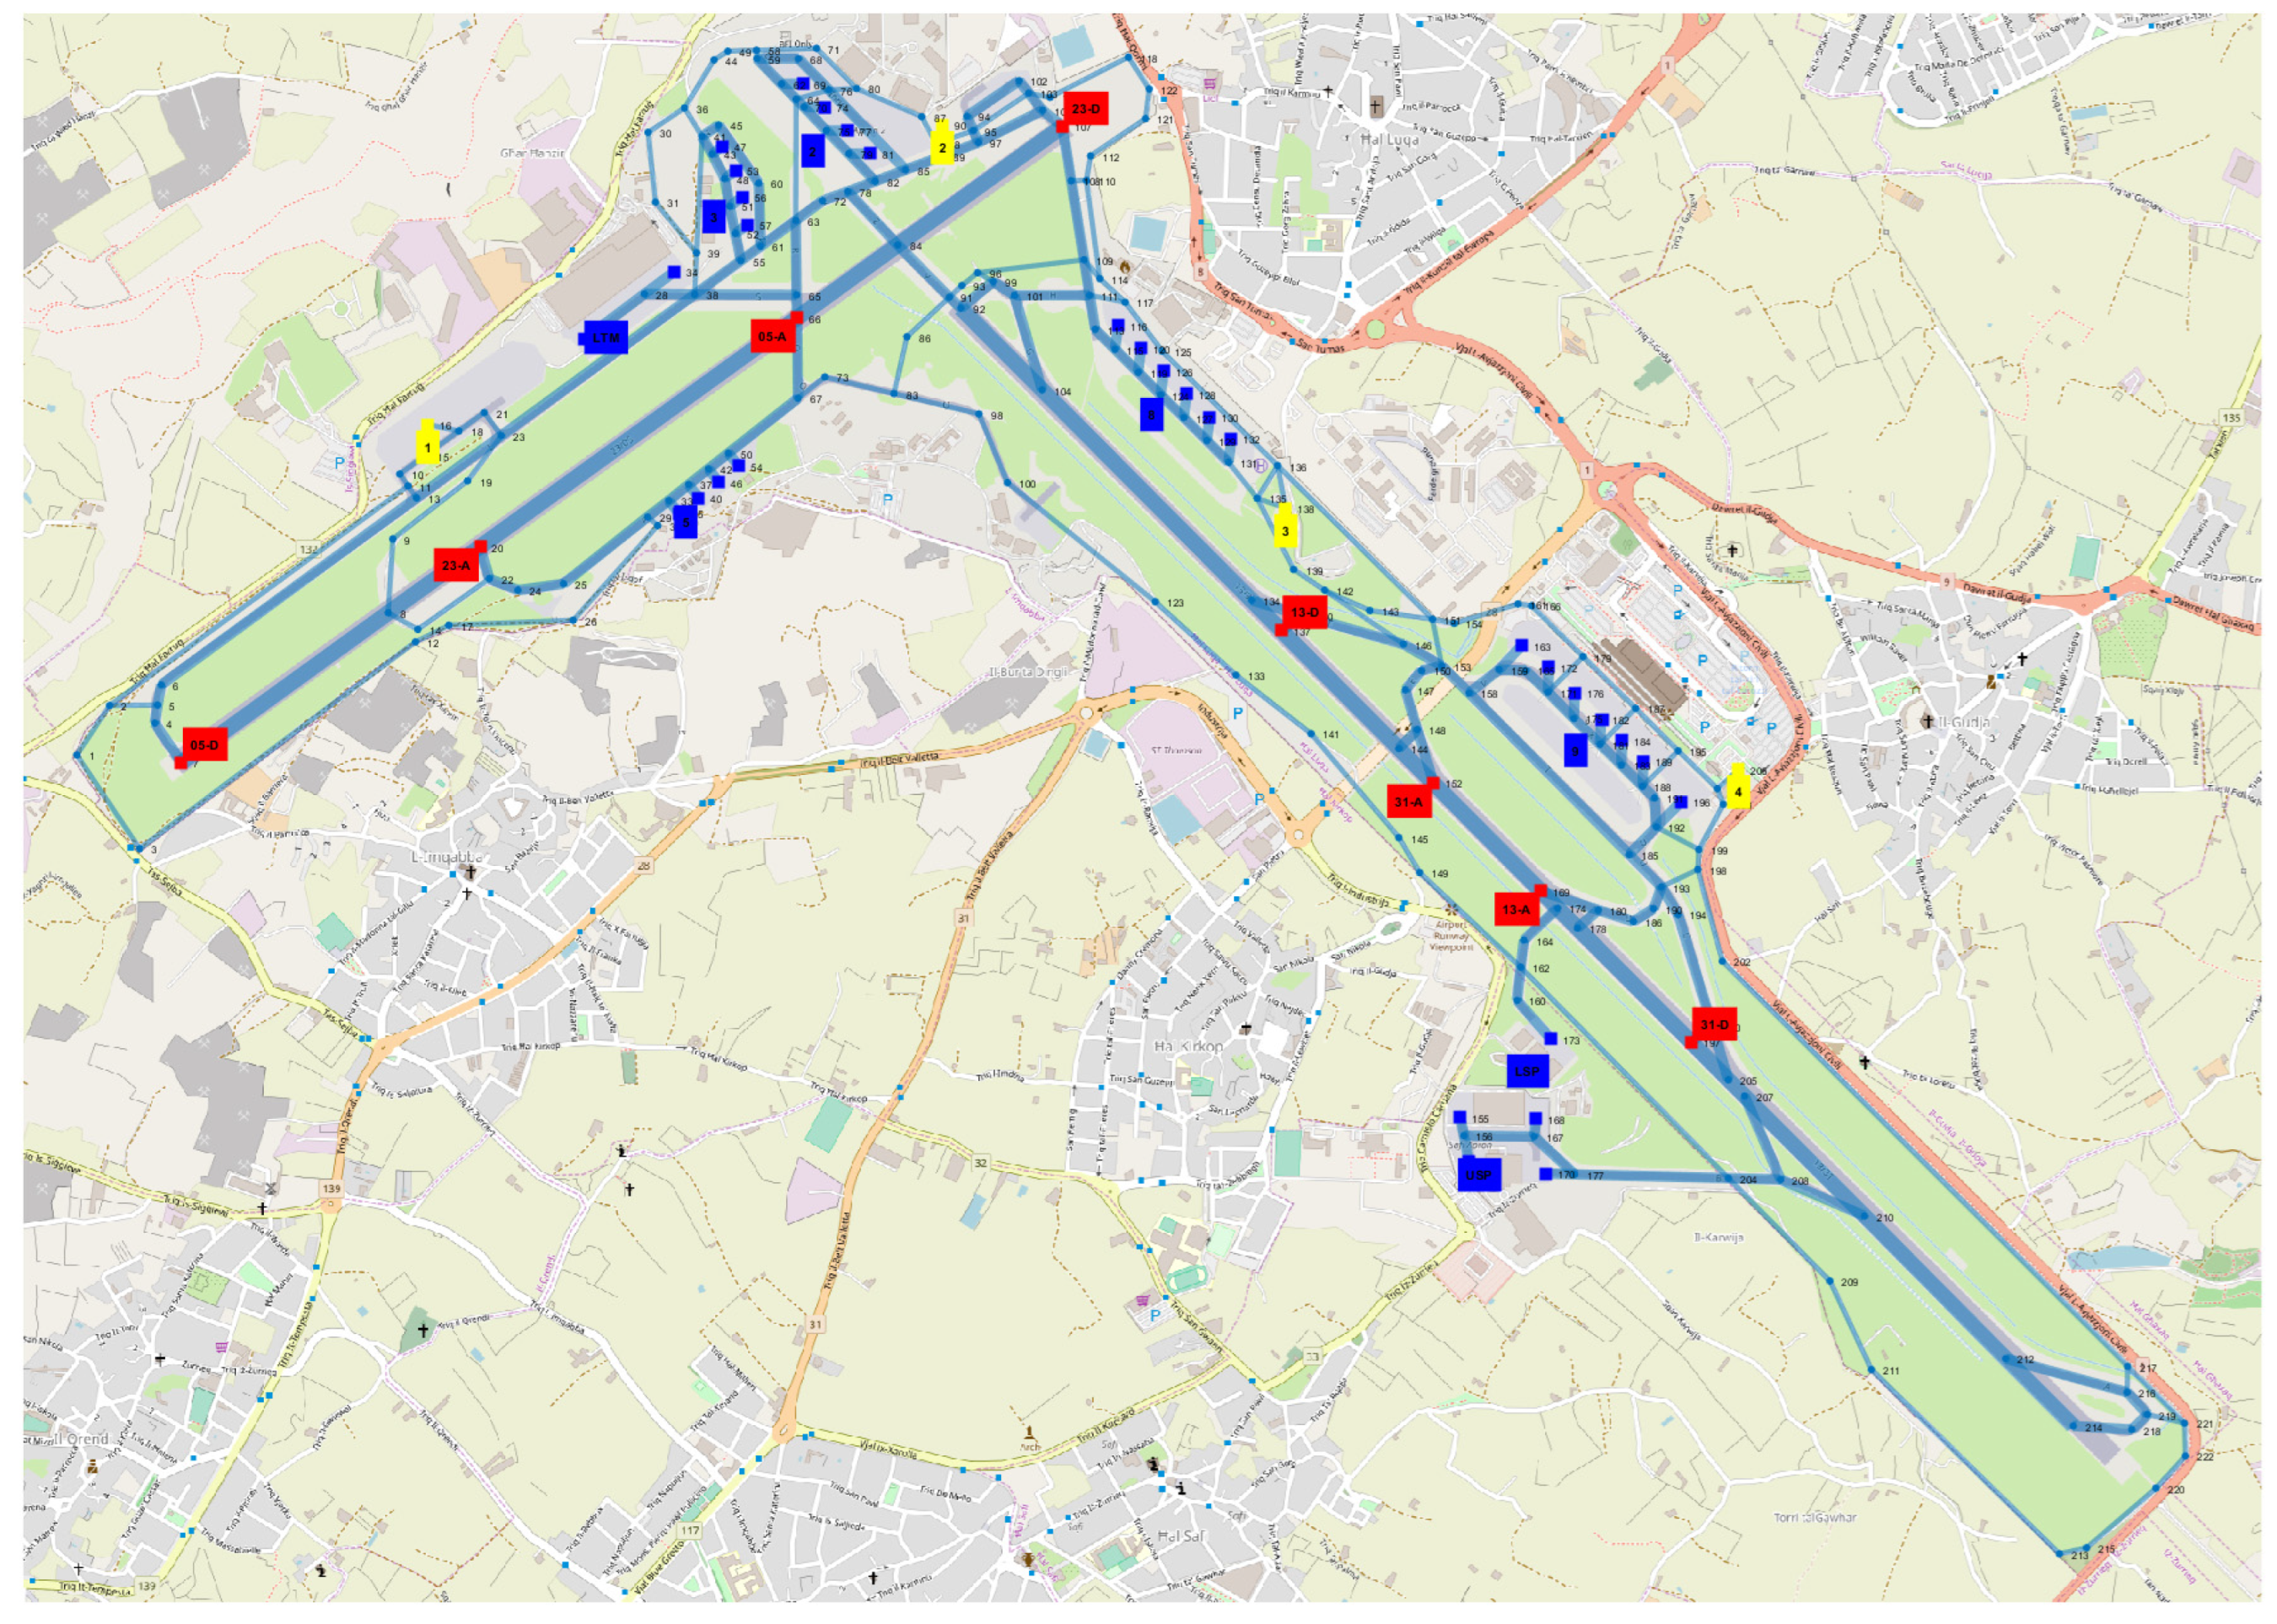
4.2. Airport Selection

An important aspect of the testing phase is to ensure that the algorithm can be fine-tuned and effectively implemented across airports of varying sizes and geometries. In practice, while the algorithm may perform well at a large airport with an extensive network of taxiways, its efficacy may not translate to a smaller airport characterised by frequent bottlenecks and a higher likelihood of conflicts even with low levels of traffic. On the other hand, if the algorithm is only tested for small- or medium-sized airports, its scalability of the solutions will remain uncertain. For these reasons, the algorithm was tested at four airports with different sizes and geometries as follows:
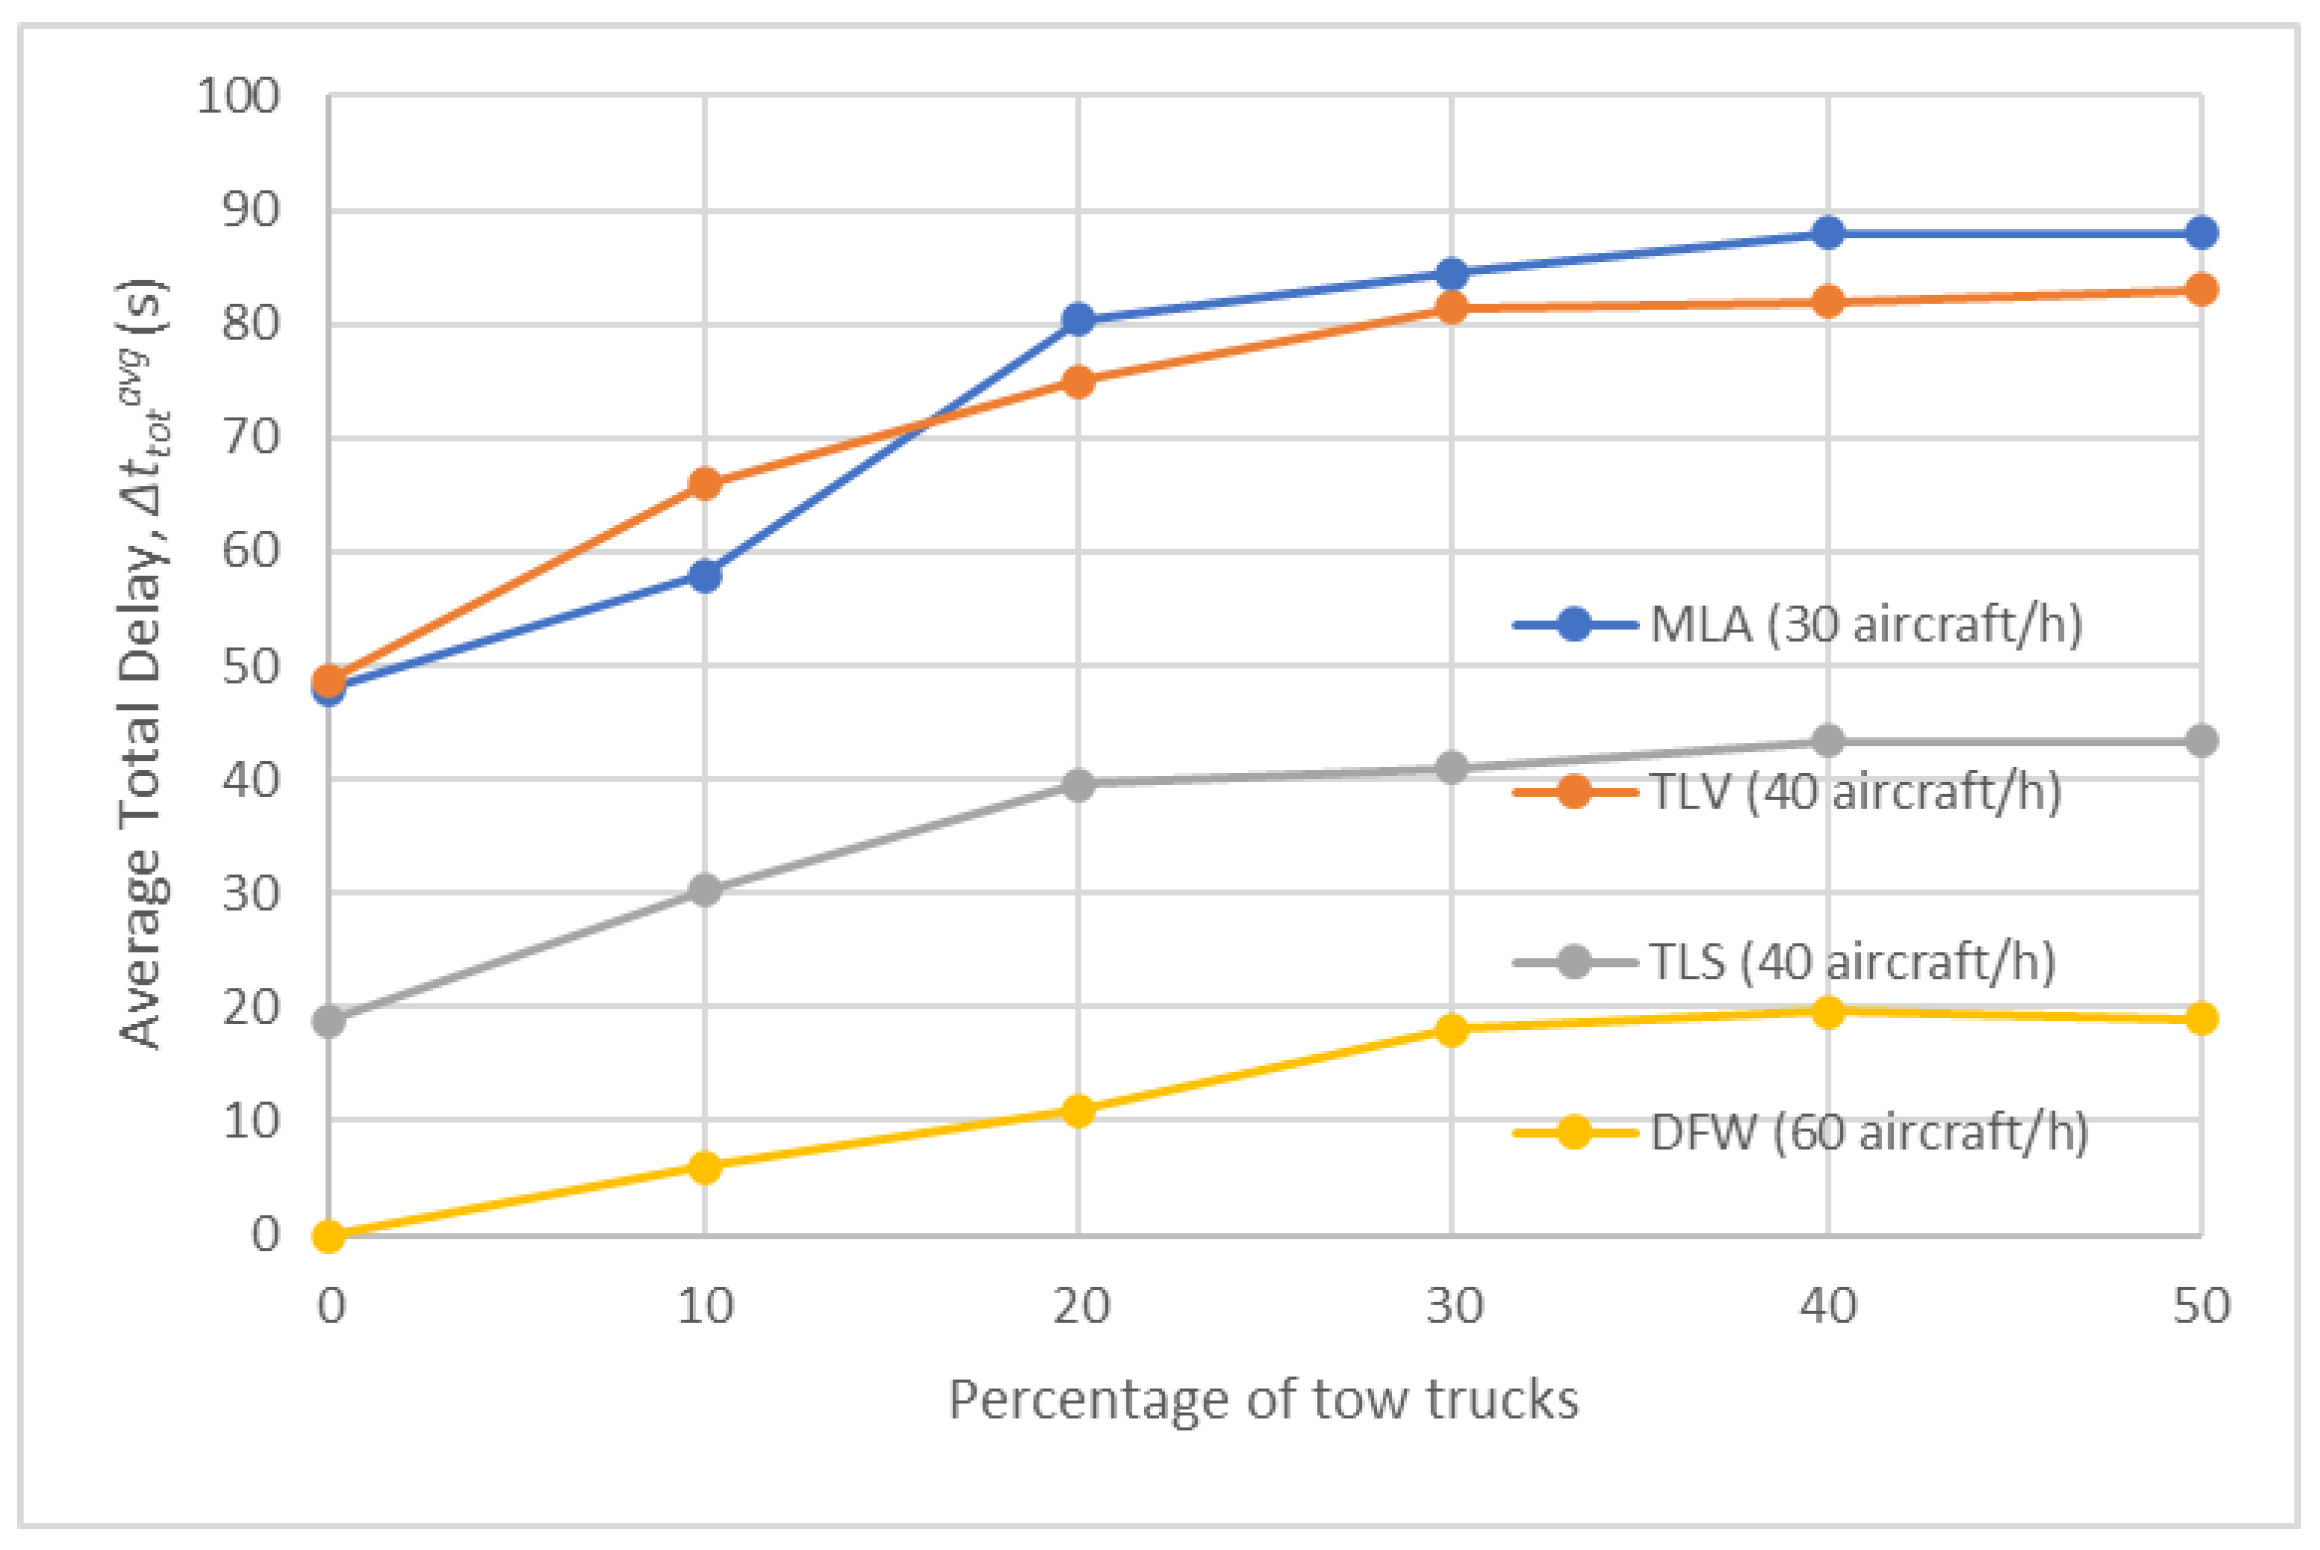
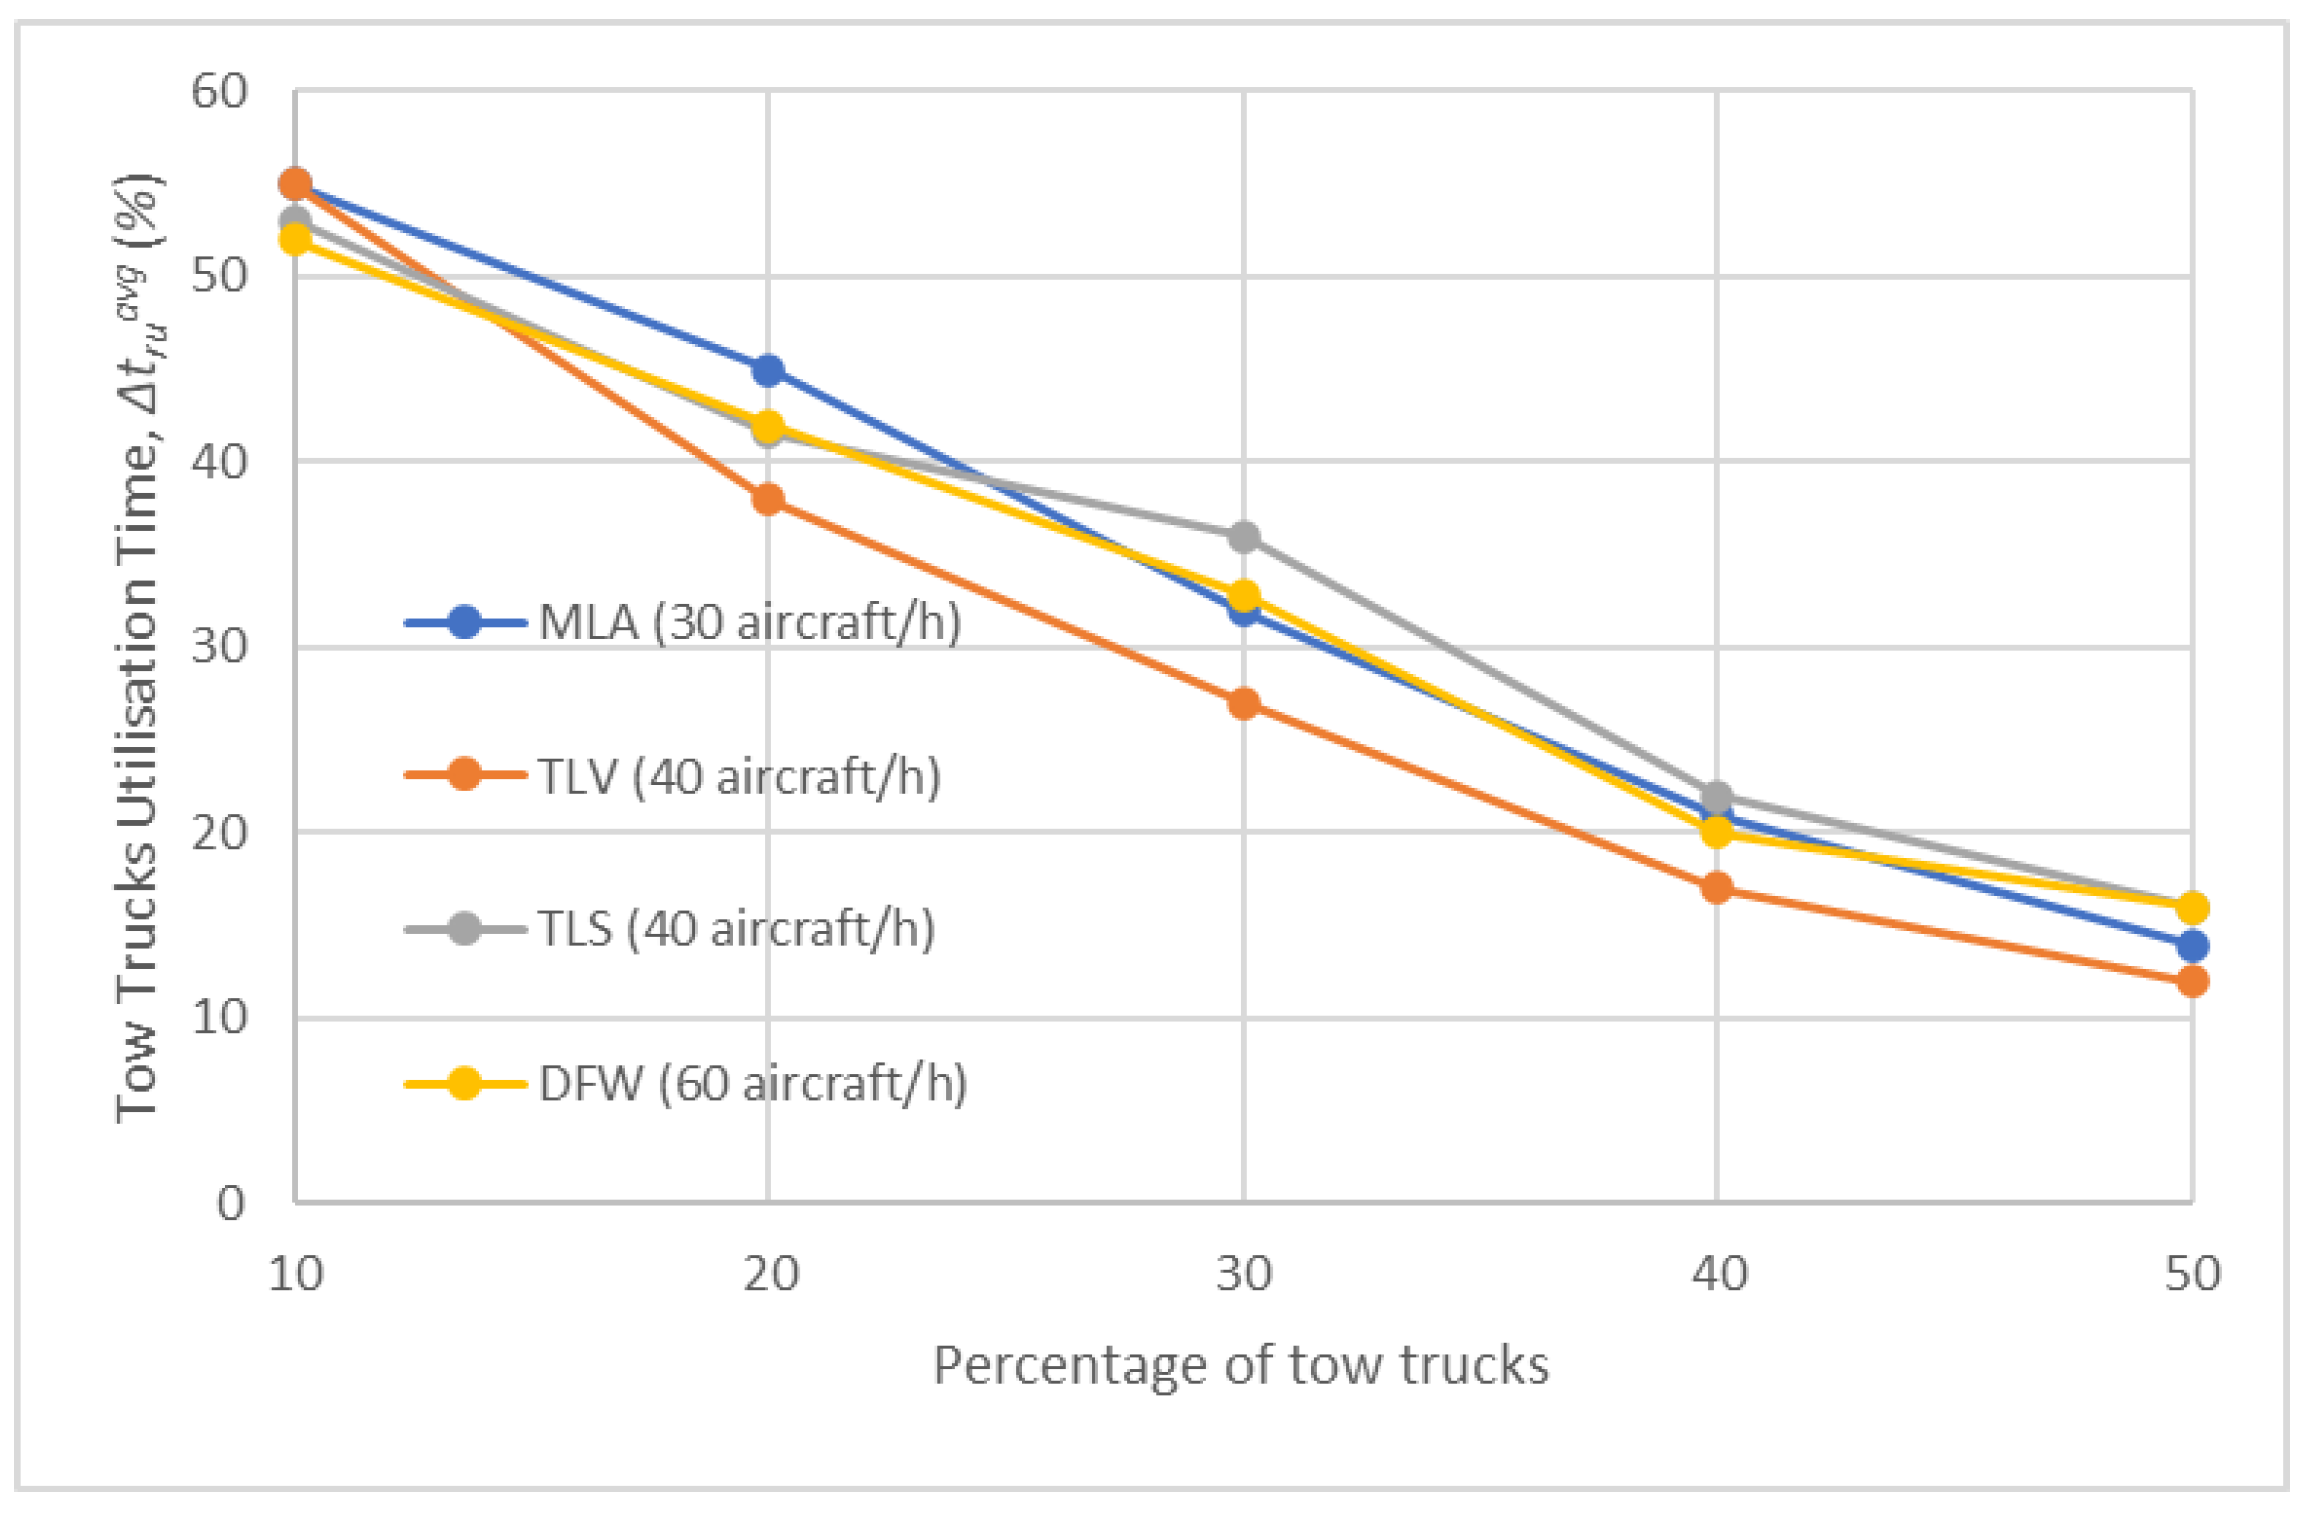
  • Malta International Airport (MLA): relatively small in size.
  • Ben Gurion Airport (TLV): medium-sized, featuring a unique layout of the runways.
  • Toulouse–Blagnac Airport (TLS): medium-sized, with a classic layout of runways.
  • Dallas/Fort Worth International Airport (DFW): one of the busiest airports in the world [34].

4.3. Test Scenarios

A set of six scenarios, each of which includes a number of simulations defined by various combinations of simulation settings, was used to assess the performance of the algorithm. The parameters which were used in different scenarios and the number of simulations for each scenario are shown in Table 1. While in Test Scenario 1, the results are expressed for different numbers of aircraft per hour, in Test Scenarios 2–5, the results are presented for different percentages of tow trucks, i.e., the number of tow trucks expressed as a percentage of the number of arriving and departing aircraft. In each scenario, all of the flight schedules were randomly generated (i.e., not based on historic data), with an equal number of arrivals and departures per schedule.

4.4. Test Results

  • Results for Test Scenario 1
Figure 3 illustrates the average total delay, Δ t d t o t a v g (%), for various traffic levels at each airport for Test Scenario 1. It can be noted that, for each airport, there is a gradual increase in Δ t d t o t a v g , which eventually escalates considerably with higher traffic volumes. It can be noted that the trend observed at each airport is influenced by the size and geometry. Due to MLA’s confined size, values considerably increase when traffic volume exceeds 30 aircraft per hour. TLS features two active runways and a simpler geometry compared to TLV, which has only one active runway at a time and a complex layout. This results in shorter average delays for TLS and a smaller percentage of delayed aircraft for the same volume of traffic. The values of Δ t d t o t a v g (%) are expressed as percentage and compared to the ideal taxi route, highlighting a progressive increase in the impact of delays for MLA. Conversely, at DFW, Δ t d t o t a v g (%) is negligible up to 50 aircraft an hour, and then gradually increasing up to a maximum of 20%.
Figure 4 shows the percentage delayed aircraft, D A (%), for various traffic levels at each airport for Test Scenario 1. The values exhibit a gradual increase with higher level of traffic, initially rising moderately before escalating sharply. However, the trend observed at each airport depends on the airport’s size and geometry. For instance, in the case of MLA, the small dimensions of the airport lead to a considerable increase in values for traffic levels exceeding 30 aircraft per hour. Conversely, TLV features a complex geometry with multiple taxiways crossing the runways, and operates only one active runway at a time. In contrast, TLS features a simpler geometry and accommodates two active runways, resulting in lower average start delays and a smaller percentage of delayed aircraft compared to TLV for similar traffic levels.
2.
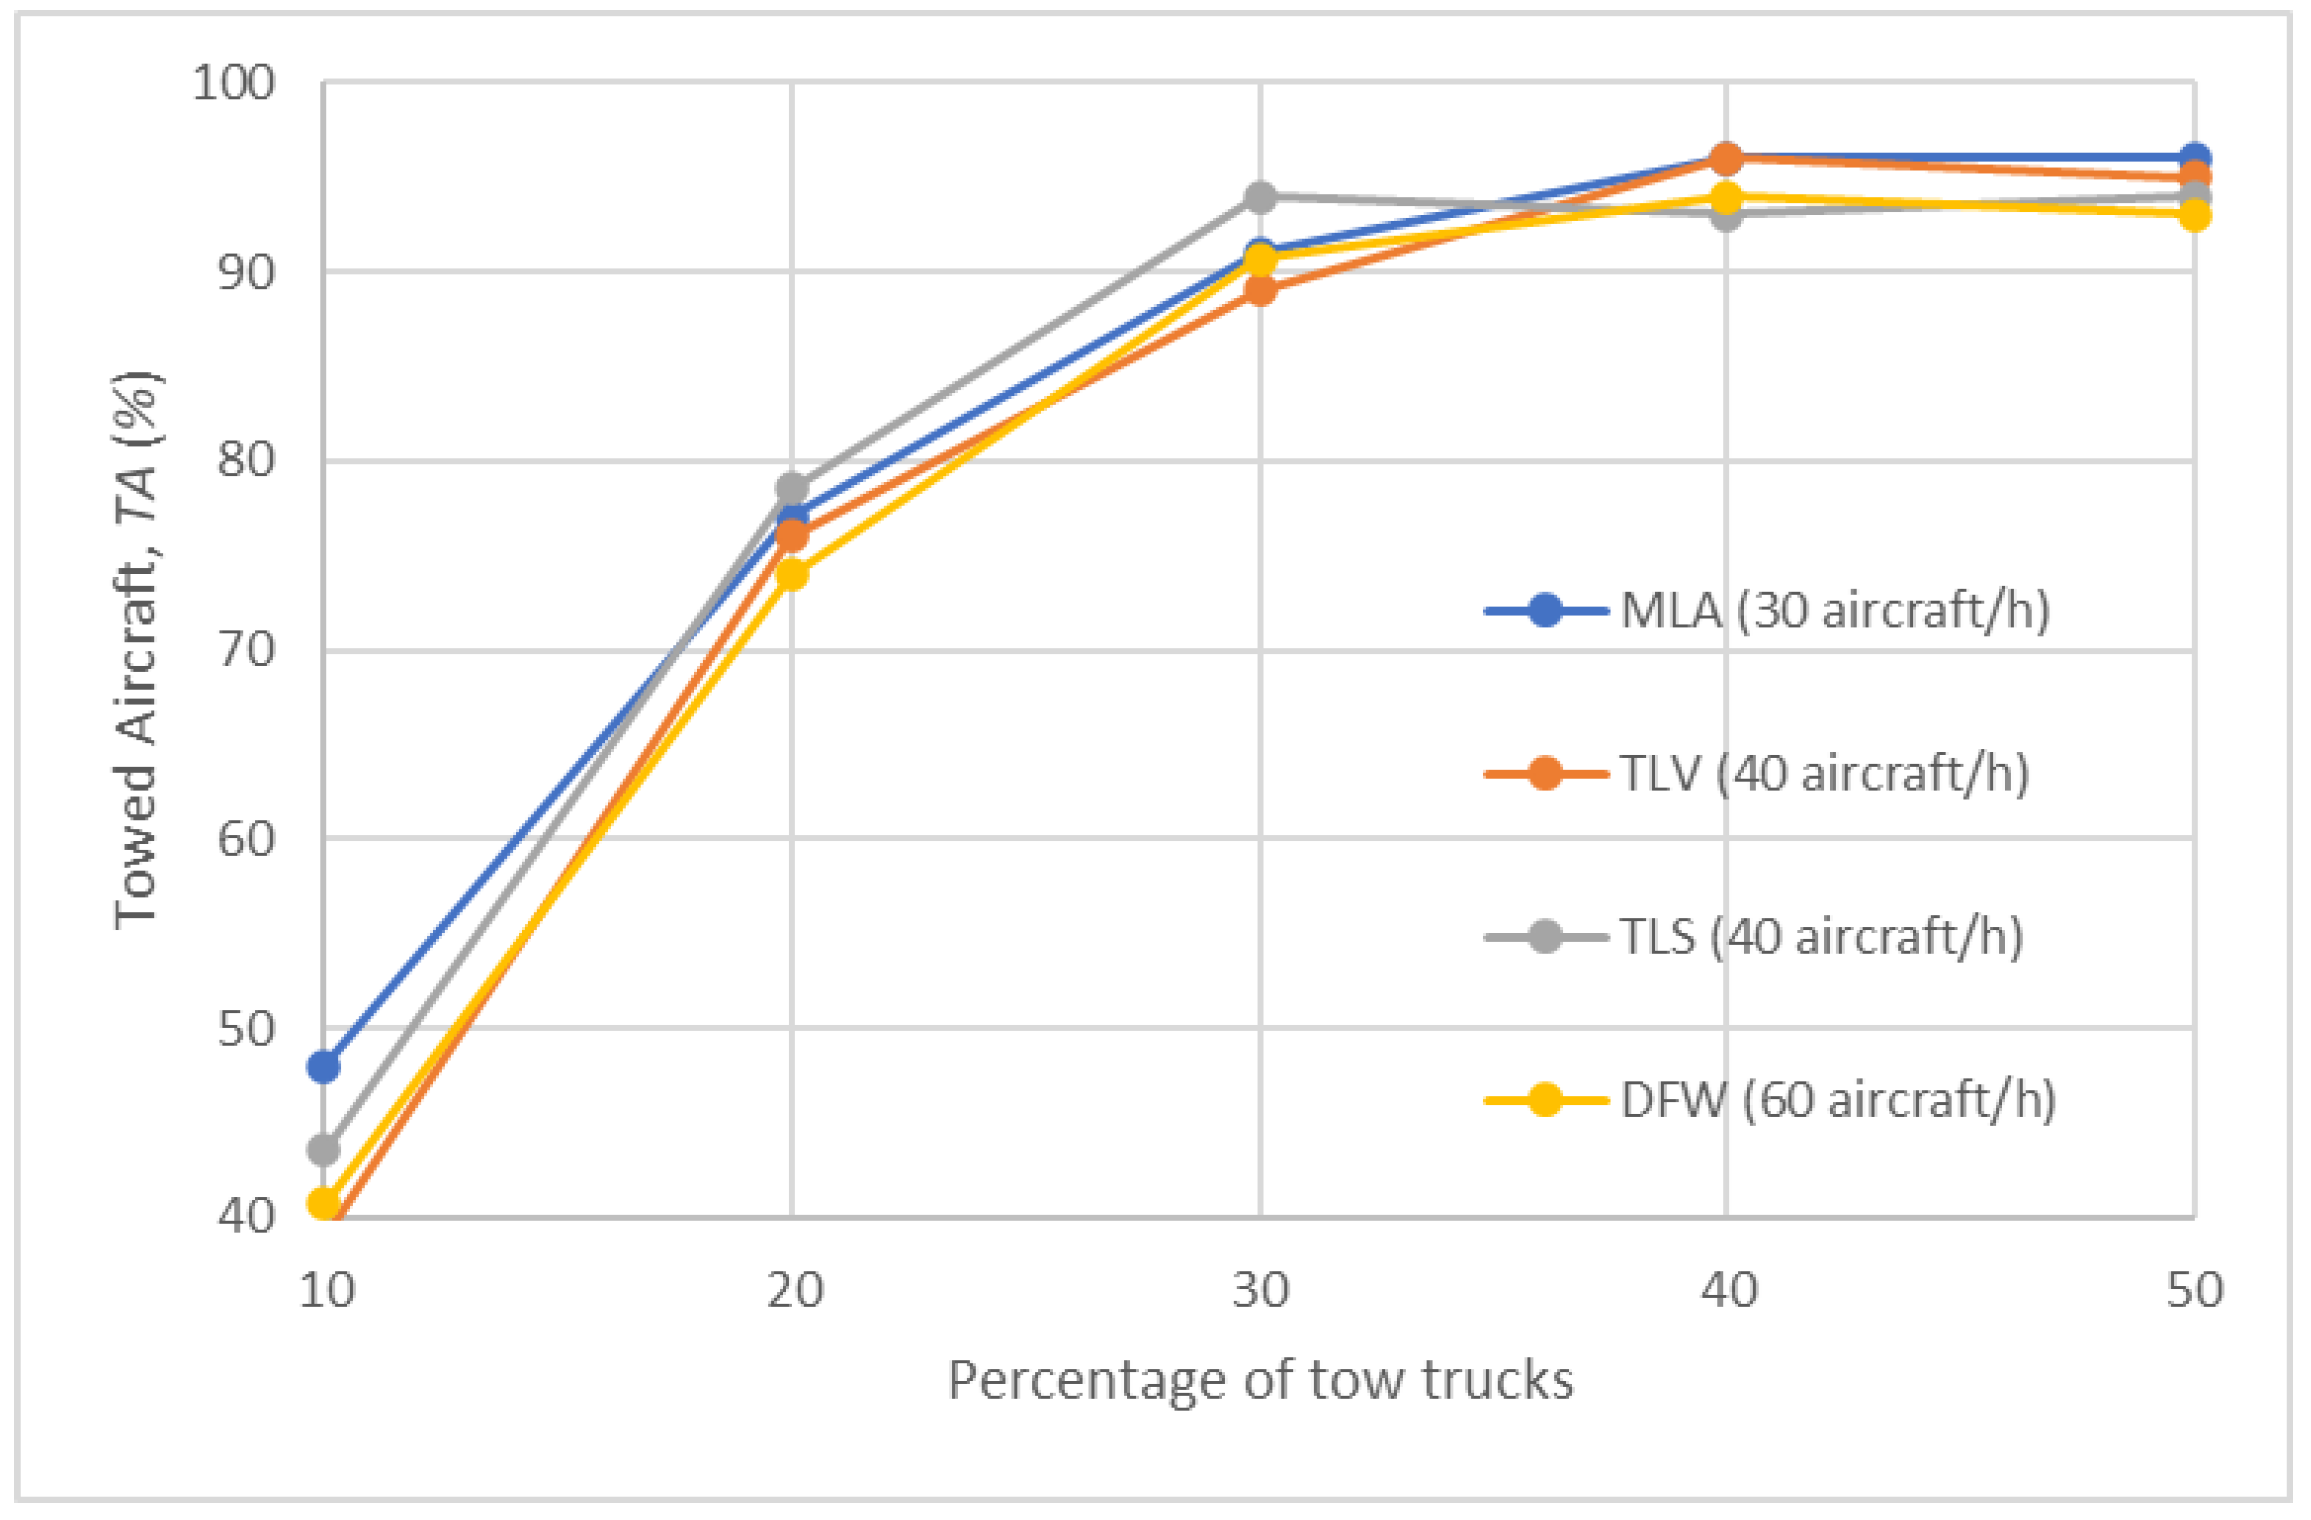
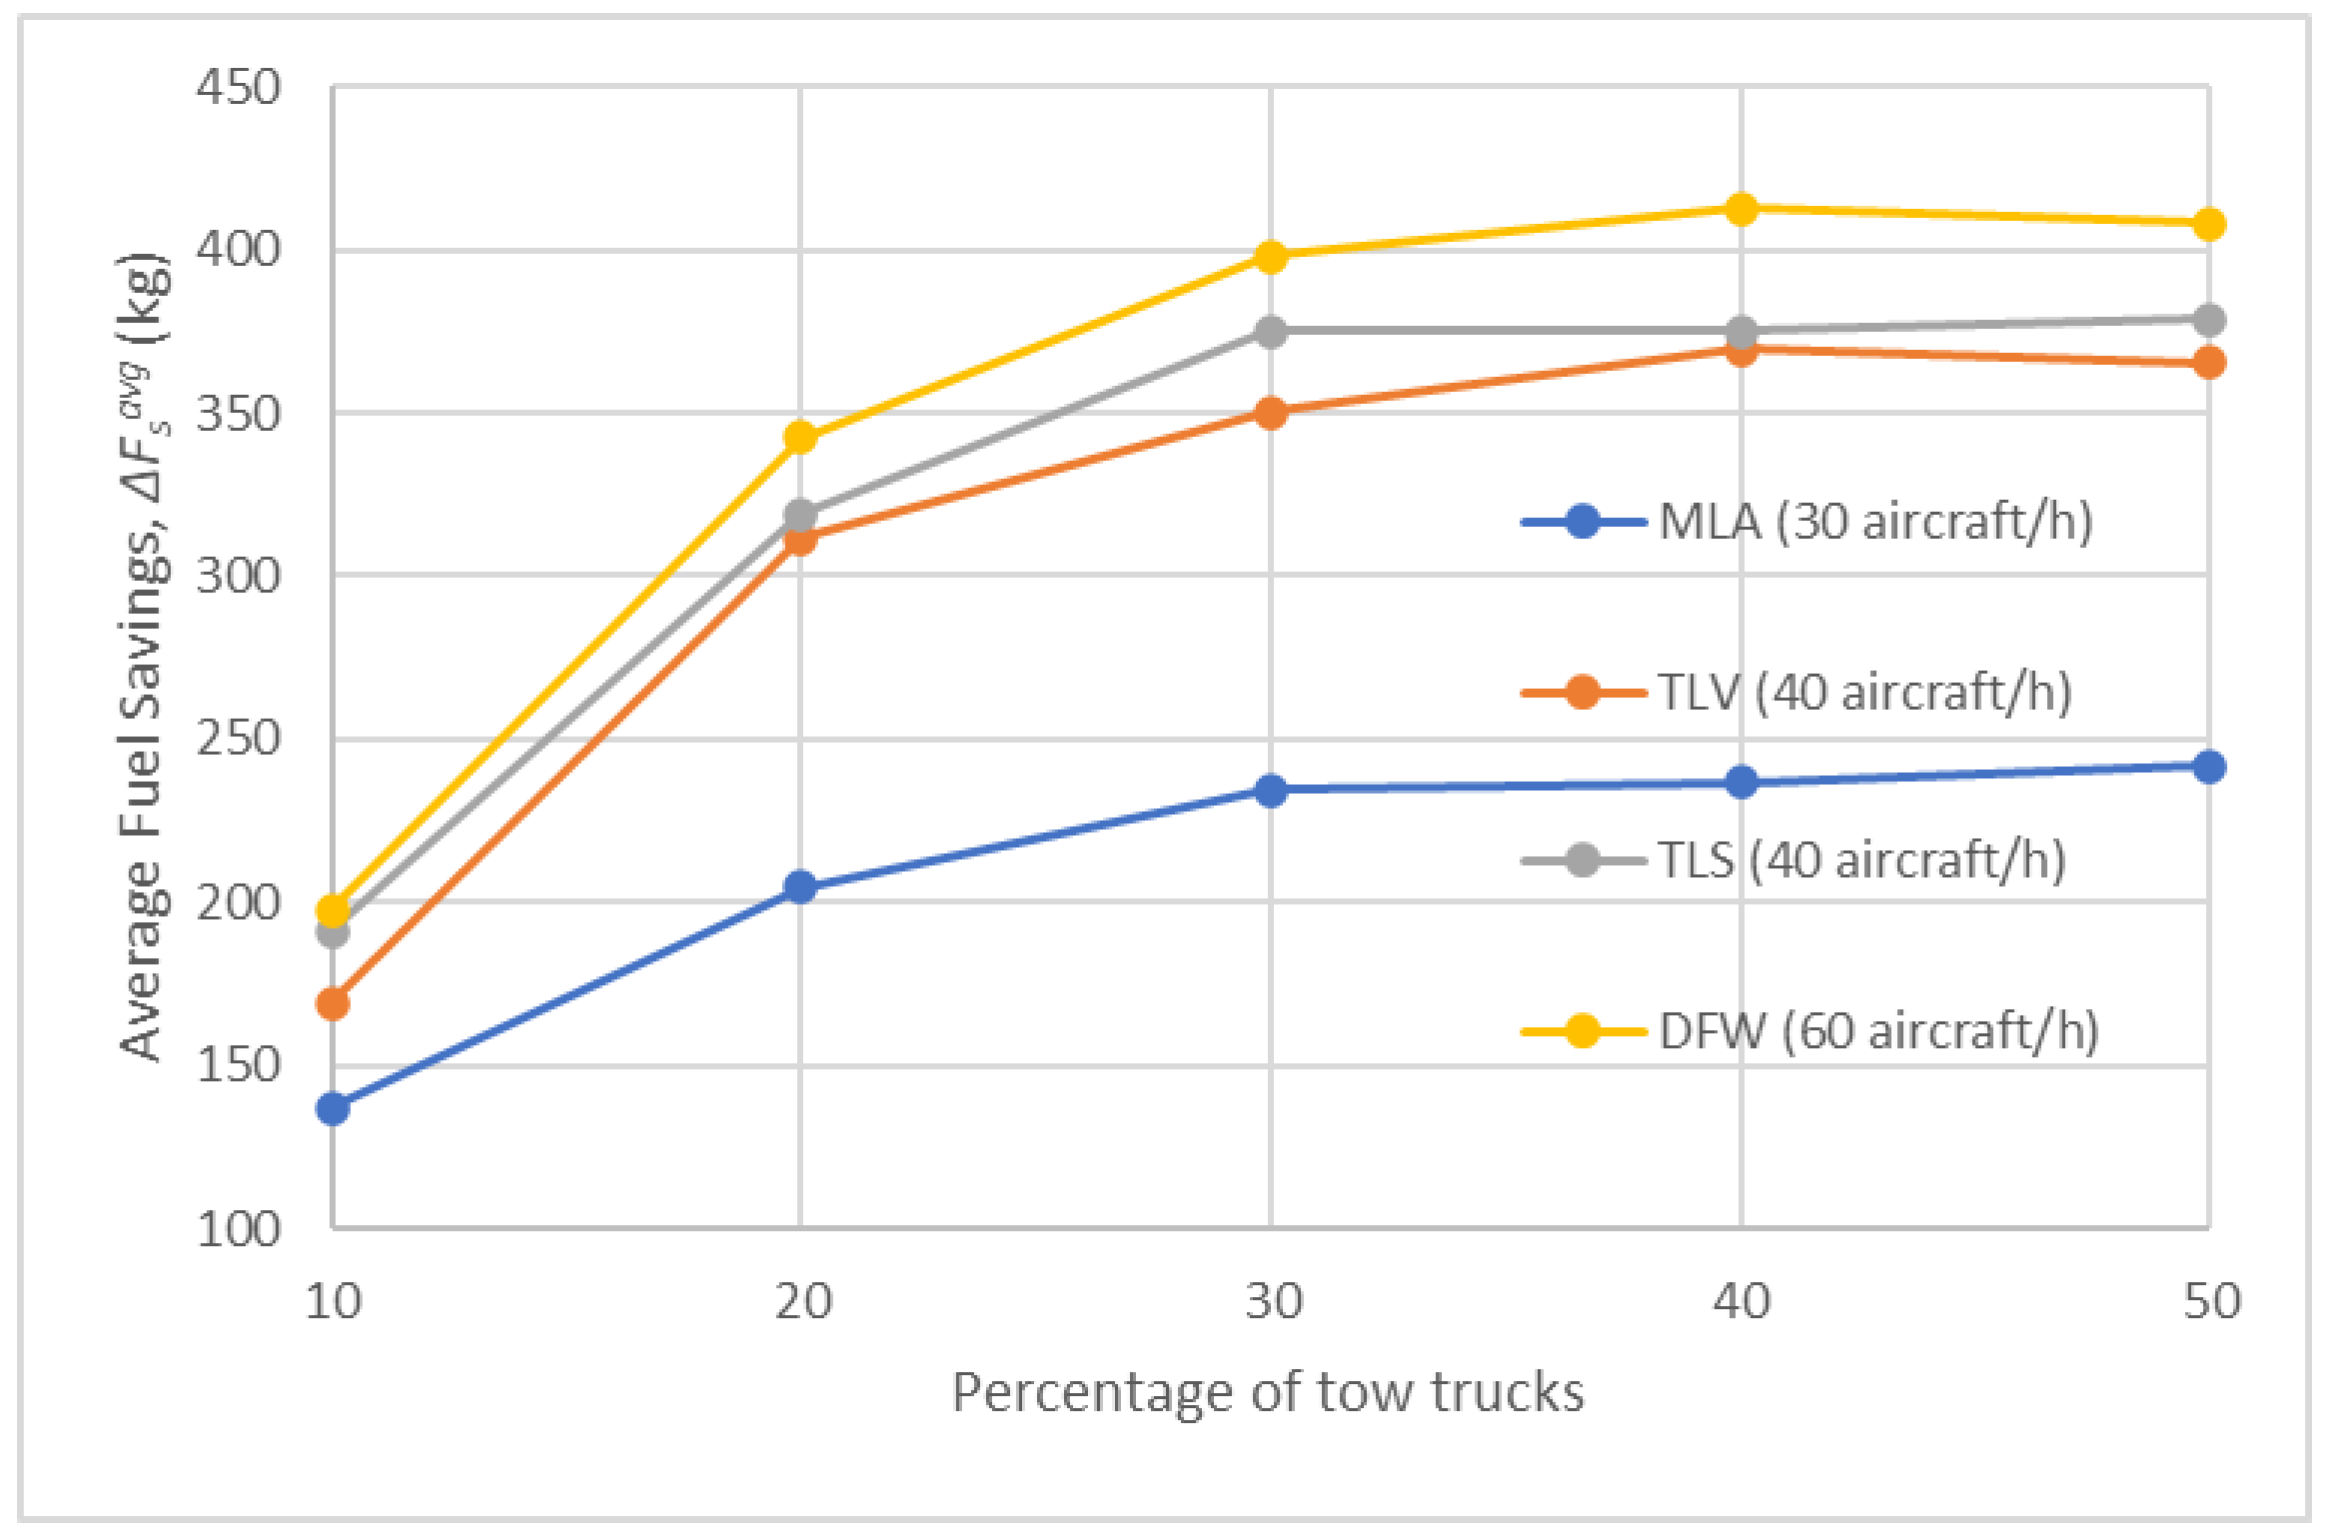
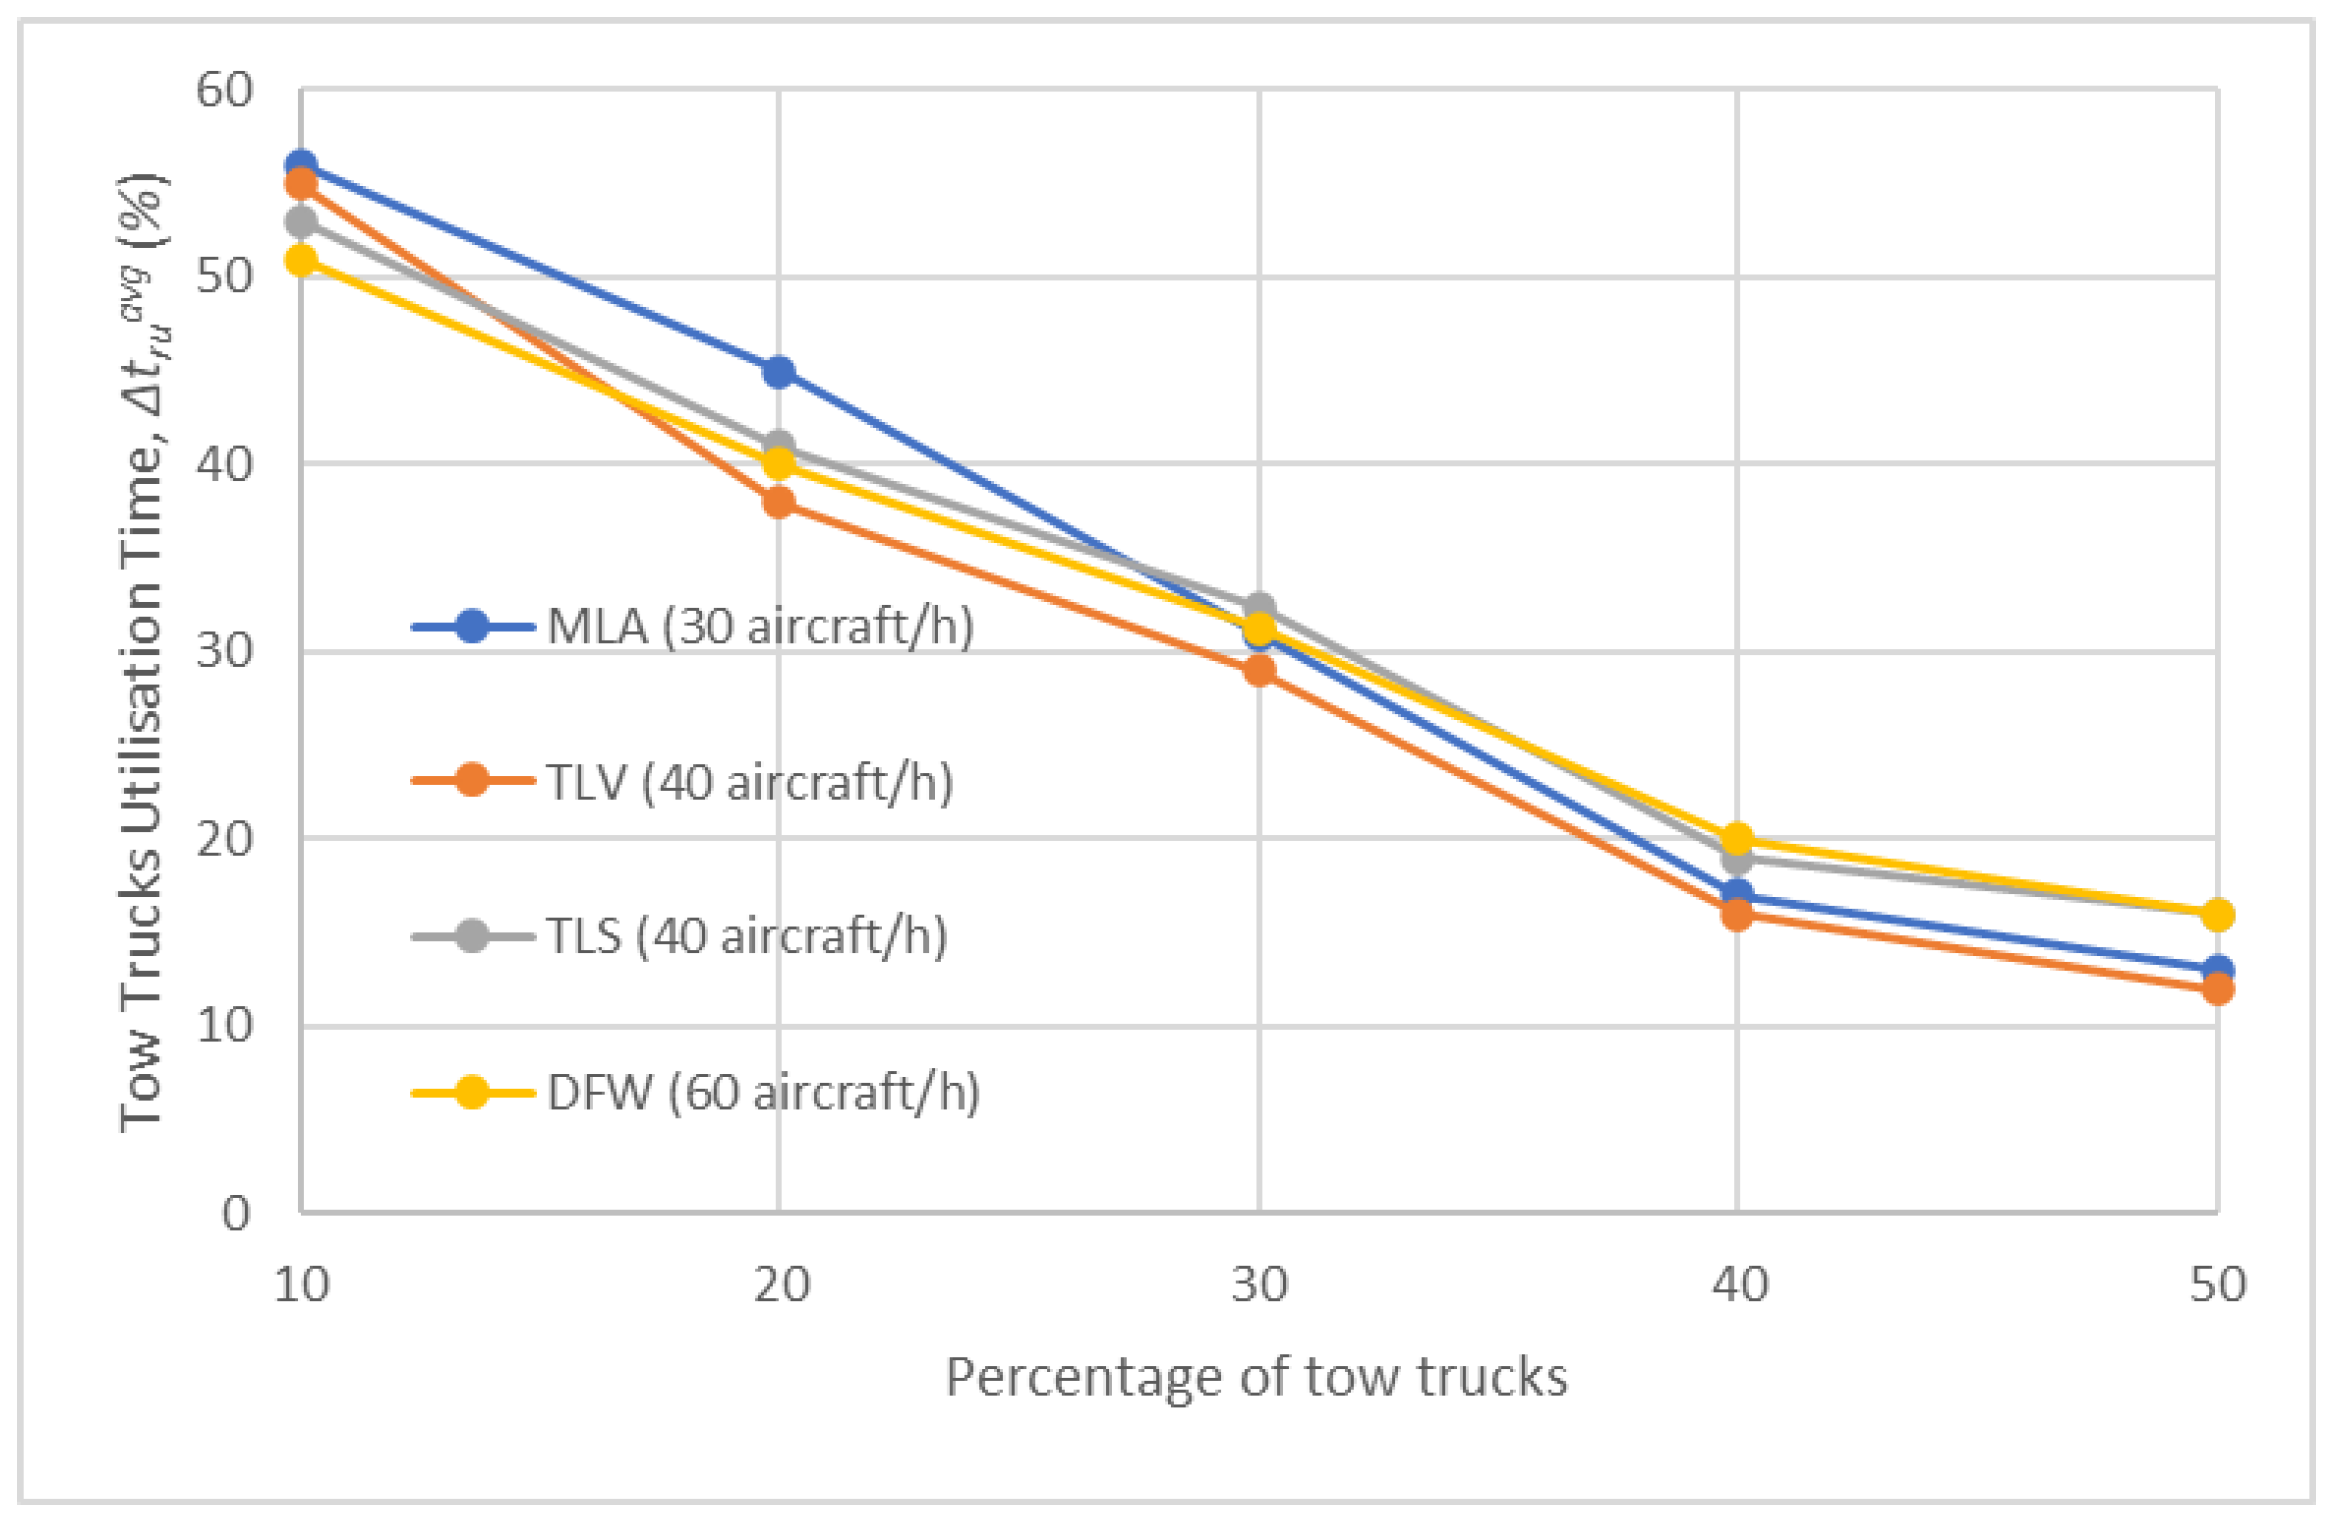
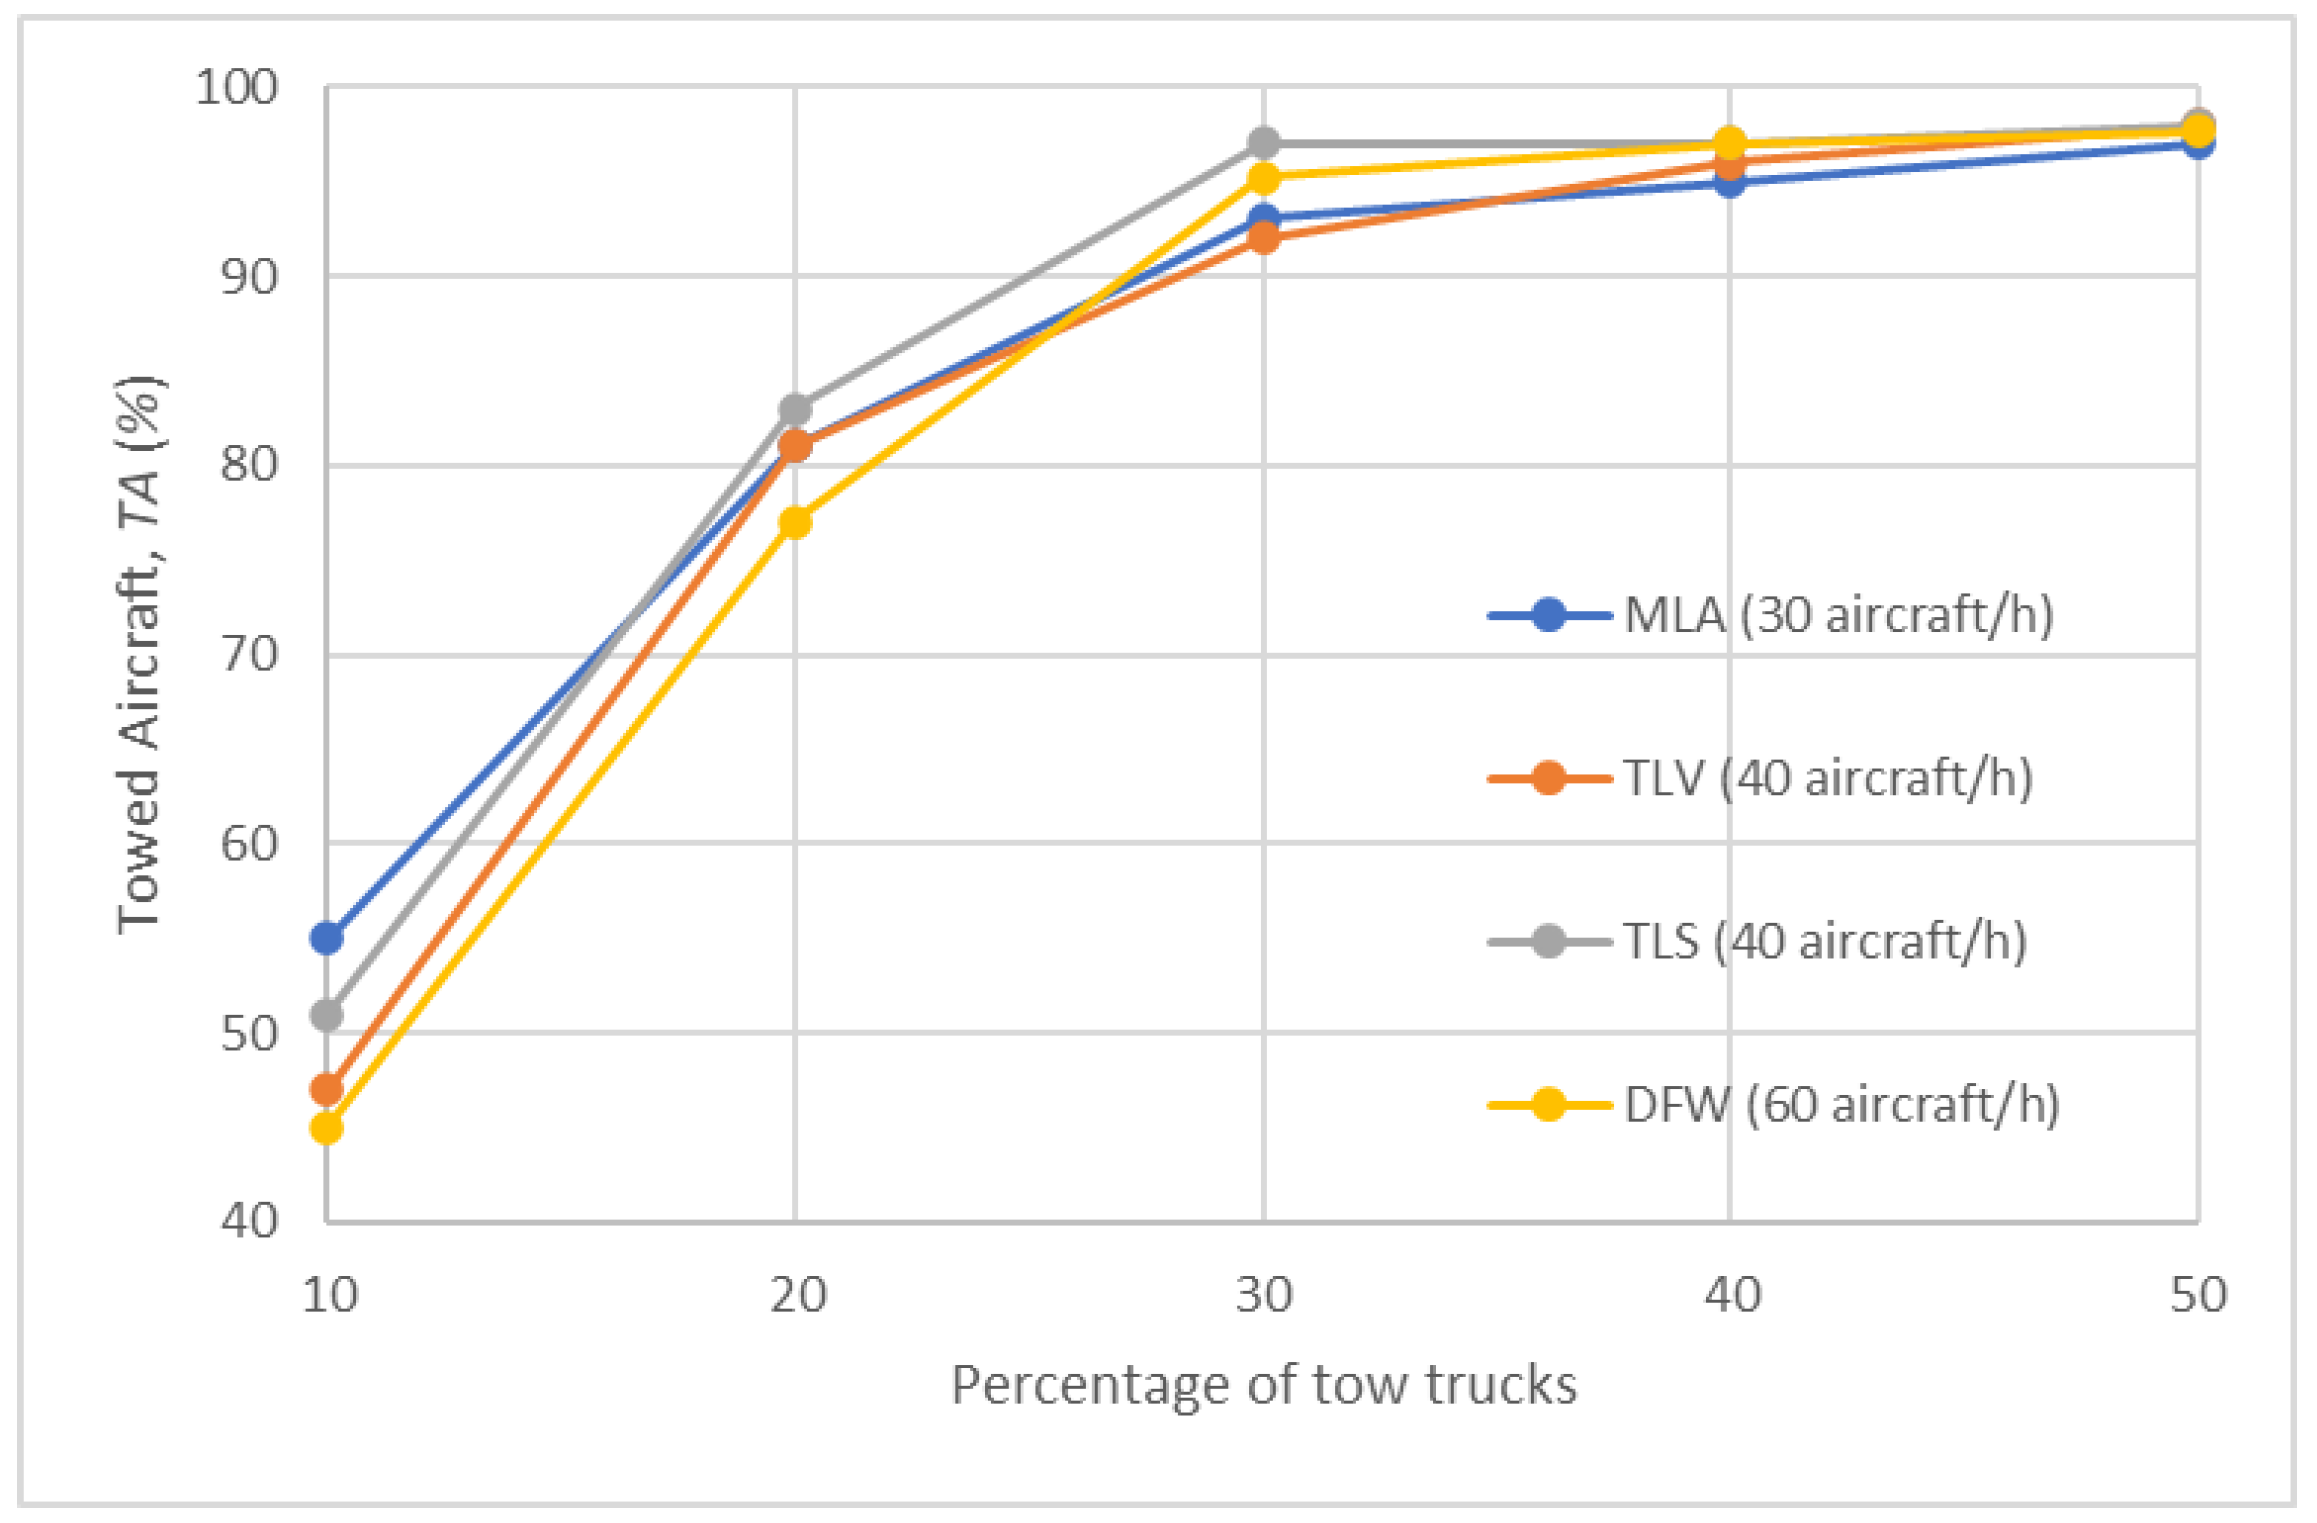
Results for Test Scenario 2
Figure 5 shows the percentage number of towed aircraft, T A (%), for various percentages of tow trucks at each airport for Test Scenario 2. Initially, both percentages increase with an increasing proportion of tow trucks but eventually levels off. Notably, when the percentage of tow trucks exceeds approximately 30%, over 90% of the traffic is managed by the tow trucks. Consequently, only 10% or less of the aircraft need to taxi using their main engines. Moreover, there is no substantial improvement observed when the percentage of tow trucks is increased beyond 30%.
As expected, the trend of the average fuel savings, Δ F s a v g (kg), observed for various percentages of tow trucks at each airport for Test Scenario 2 and shown in Figure 6, correlates strongly with the number of towed aircraft T A (%). Specifically, when the percentage of tow trucks surpasses approximately 30%, there is minimal additional improvement in fuel savings. Notably, the fuel saved at MLA is remarkably lower compared to the other airports. This discrepancy is likely attributed to the limited length of its taxiway infrastructure, as fuel savings are directly proportional to route length. Consequently, this suggests that tow truck-based taxiing yields greater benefits at larger airports with extensive taxiway networks.
Figure 7 shows the average tow truck utilisation time, Δ t r u a v g (%), for various percentages of tow trucks at each airport for Test Scenario 2. It is notable that Δ t r u a v g (%) steadily decreases for all airports as the percentage of tow trucks increases. Interestingly, the results are relatively consistent across all airports, suggesting that different airport geometries and sizes have minimal impact on this metric. Determining the optimal number of tow trucks is critical for efficient aircraft towing operations. Sufficient tow trucks must be available to tow as many aircraft as possible, while avoiding an excessive number of tow trucks to prevent them from being left idle, and maximising their utilisation. Interestingly, Δ t r u a v g (%) never exceeds 50% for any airport. One possible reason for this is the occasional need for tow trucks to recharge their batteries. Since the tow truck utilisation time is calculated as a percentage of the total simulation time, if a tow truck spends a considerable amount of time recharging, the value of this metric decreases. This clearly shows the importance of battery performance in tow truck-based electric taxi operations. In addition to utilising fast-charging tow trucks, the utilisation value can be enhanced by employing Dynamic Allocation (tested in Test Scenario 4), which assigns tow trucks not only when they are parked in a depot, but also while they are returning to a depot after completing a previous mission.
3.
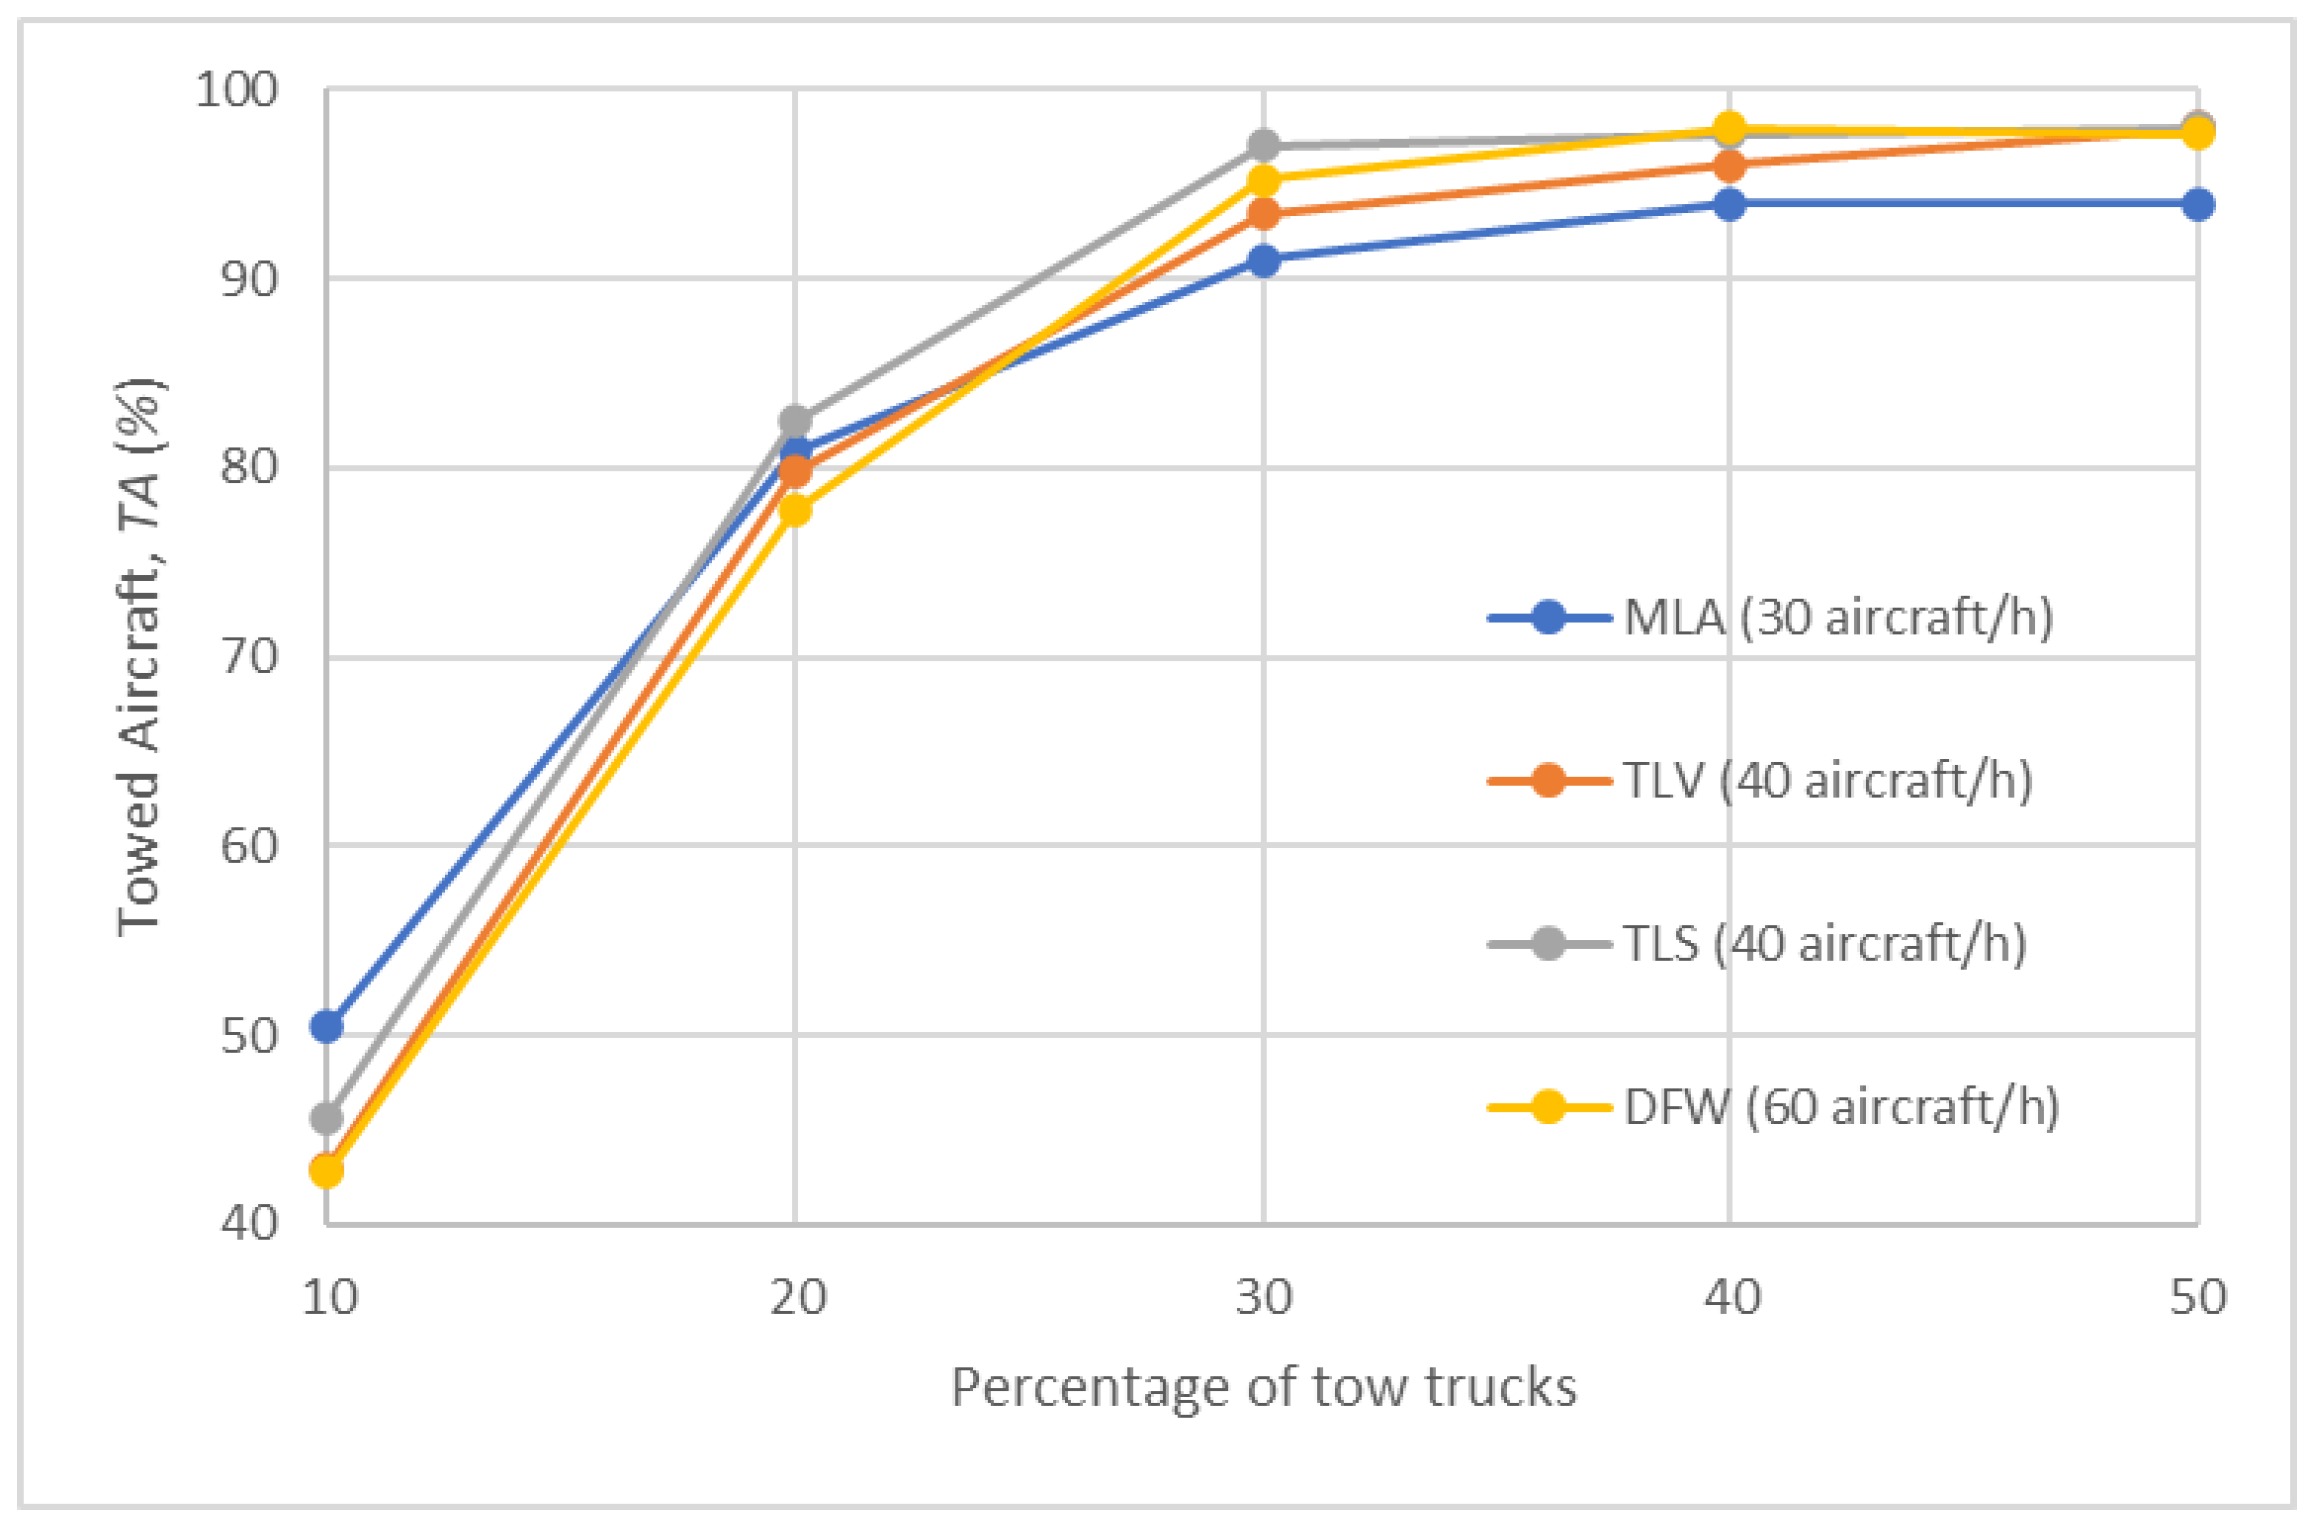
Results for Test Scenario 3
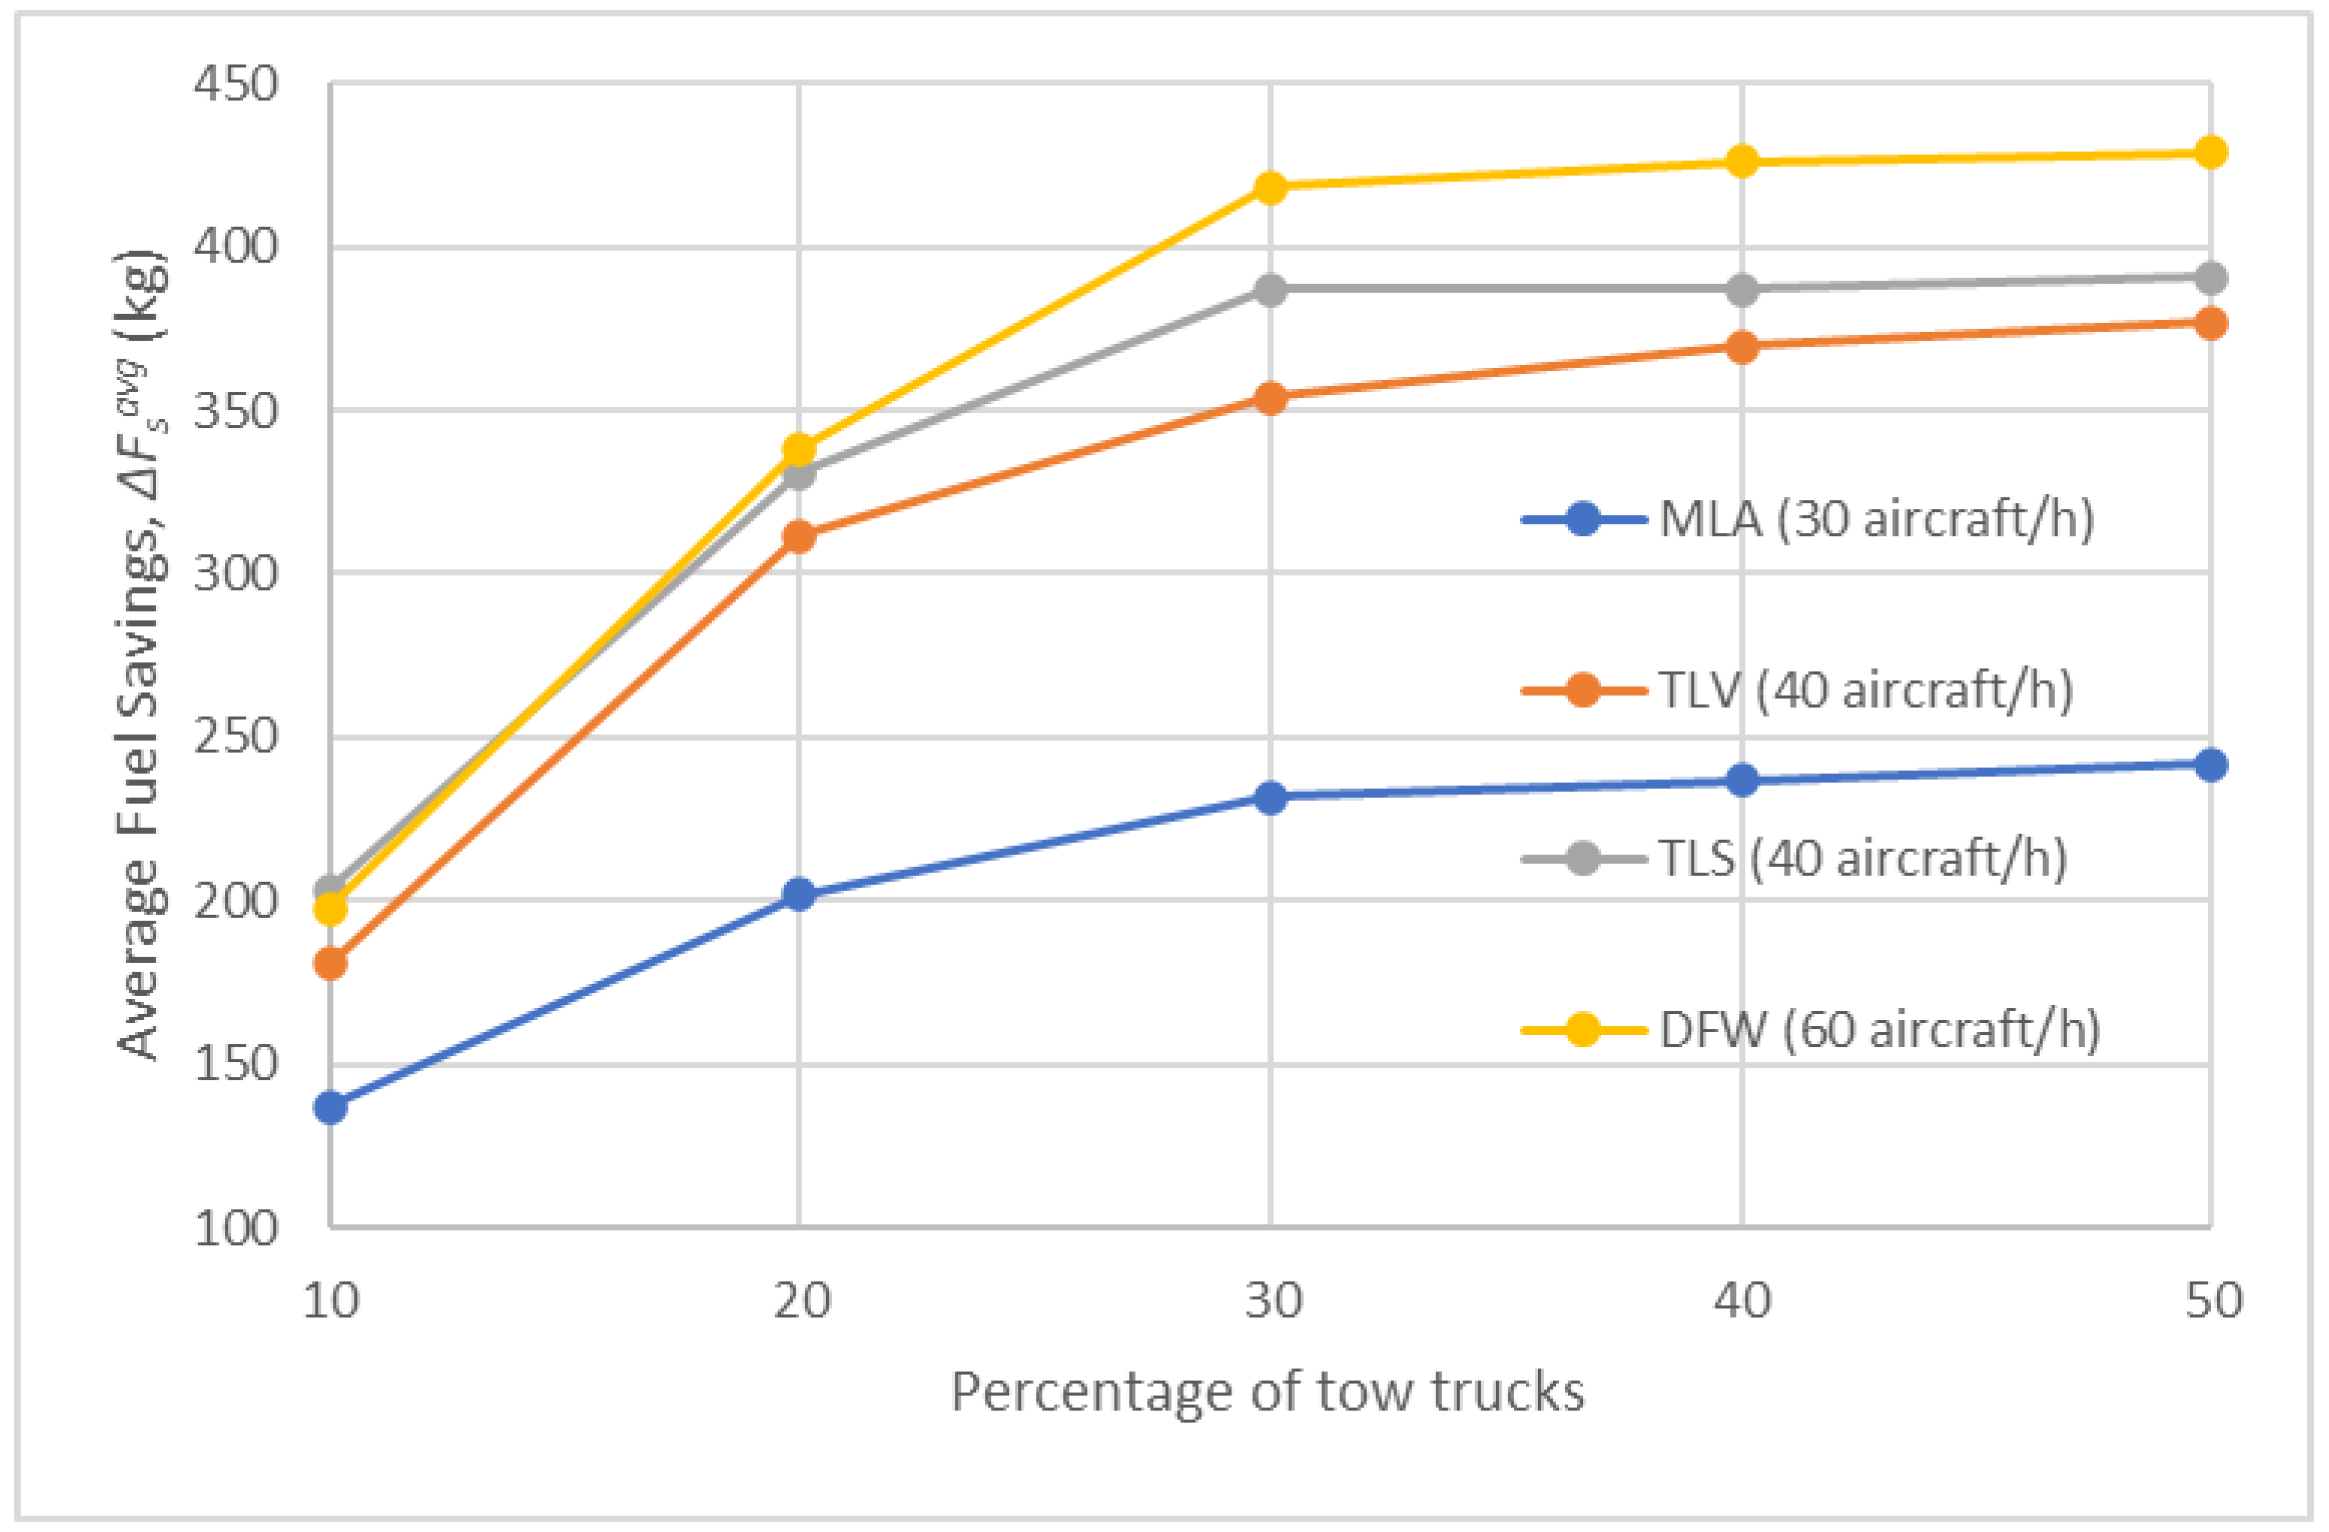
Figure 8 shows the percentage number of towed aircraft, T A (%), for various percentages of tow trucks at each airport for Test Scenario 3. Similarly to Test Scenario 2 (shown in Figure 5), the percentage initially increases with a rise in the percentage of tow trucks, but eventually levels off. Notably, when the percentage of tow trucks surpasses approximately 30%, over 90% of the traffic is managed by the tow trucks, resulting in only 10% or less of aircraft needing to taxi using their main engines. Consequently, the percentage of towed aircraft does not exhibit a considerable increase beyond this threshold. The higher values observed for this metric in Test Scenario 3, compared to the outcomes of Test Scenario 2, could be attributed to the utilisation of the Fuel-Wise Approach. With this approach, the algorithm prioritises maximising the number of towed aircraft, even at the expense of taxi delays. This strategic adjustment results in higher percentage of towed aircraft compared to Test Scenario 2.
Figure 9 and Figure 10 illustrate the trend of the average fuel savings, Δ F s a v g (kg), and the average total delay, Δ t d t o t a v g (s), respectively, observed for various percentages of tow trucks at each airport for Test Scenario 3. These results are closely related to the towing time T A (%). Indeed, for a percentage of tow trucks exceeding approximately 30%, fuel savings do not considerably improve, while delays do not increase any further. However, Δ F s a v g (kg) in this case is slightly higher for each airport (for instance, 20 kg on average for a traffic level of 30 aircraft per hour) than the fuel savings obtained in Test Scenario 2 (shown in Figure 6). On the other hand, Δ t d t o t a v g (s), which is represented by including the values obtained with 0% tow trucks in Test Scenario 1 (shown in Figure 3) increases with the percentage of tow trucks and levels off when the percentage of tow trucks exceeds 30%. This outcome was expected, as Test Scenario 2 was conducted using the Time-Wise Approach, whereas Test Scenario 3 employed the Fuel-Wise Approach, prioritising fuel savings over time delays.
Figure 11 displays the average tow truck utilisation time, Δ t r u a v g (%), for various percentages of tow trucks at each airport for Test Scenario 3. As expected, Δ t r u a v g (%) steadily decreases at all airports as the percentage of tow trucks increases. When compared to Test Scenario 2 (shown in Figure 7), Δ t r u a v g (%) exhibits slightly higher values. However, even in this case, it never exceeds 50%, reaffirming the significance of battery performance for tow truck utilisation. Furthermore, the need for better management of tow trucks is evident and employing Dynamic Allocation could be a valuable approach to improve this metric.
4.
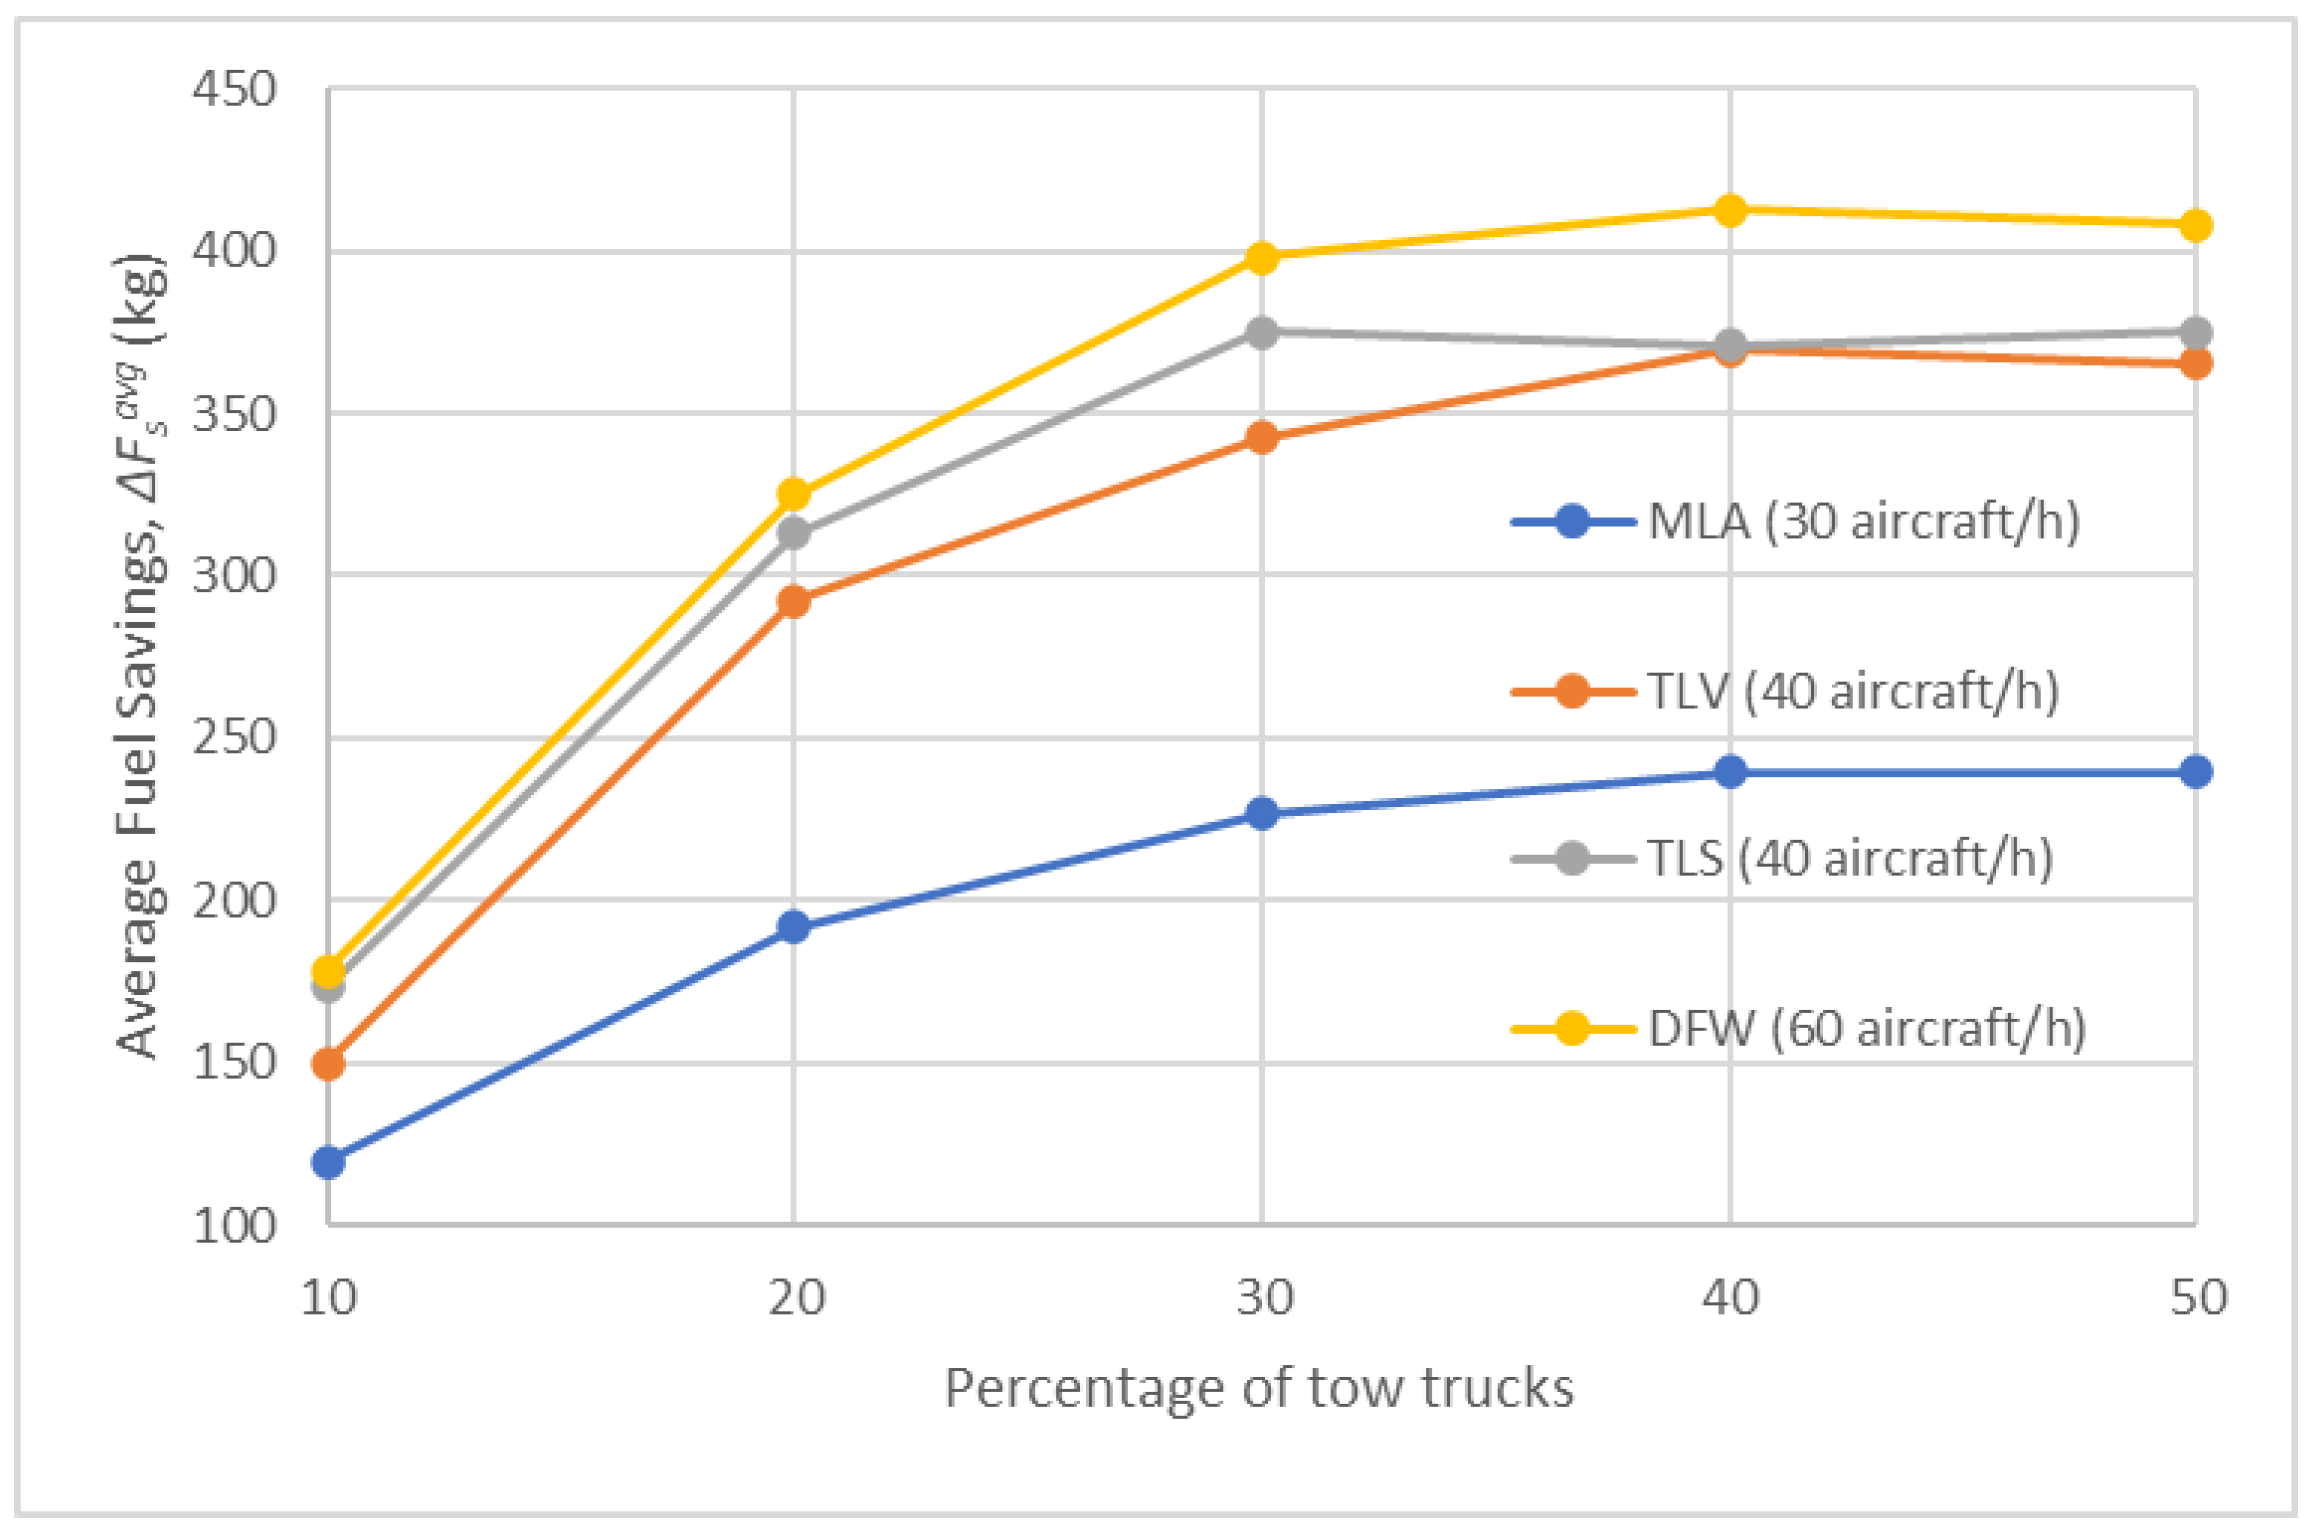
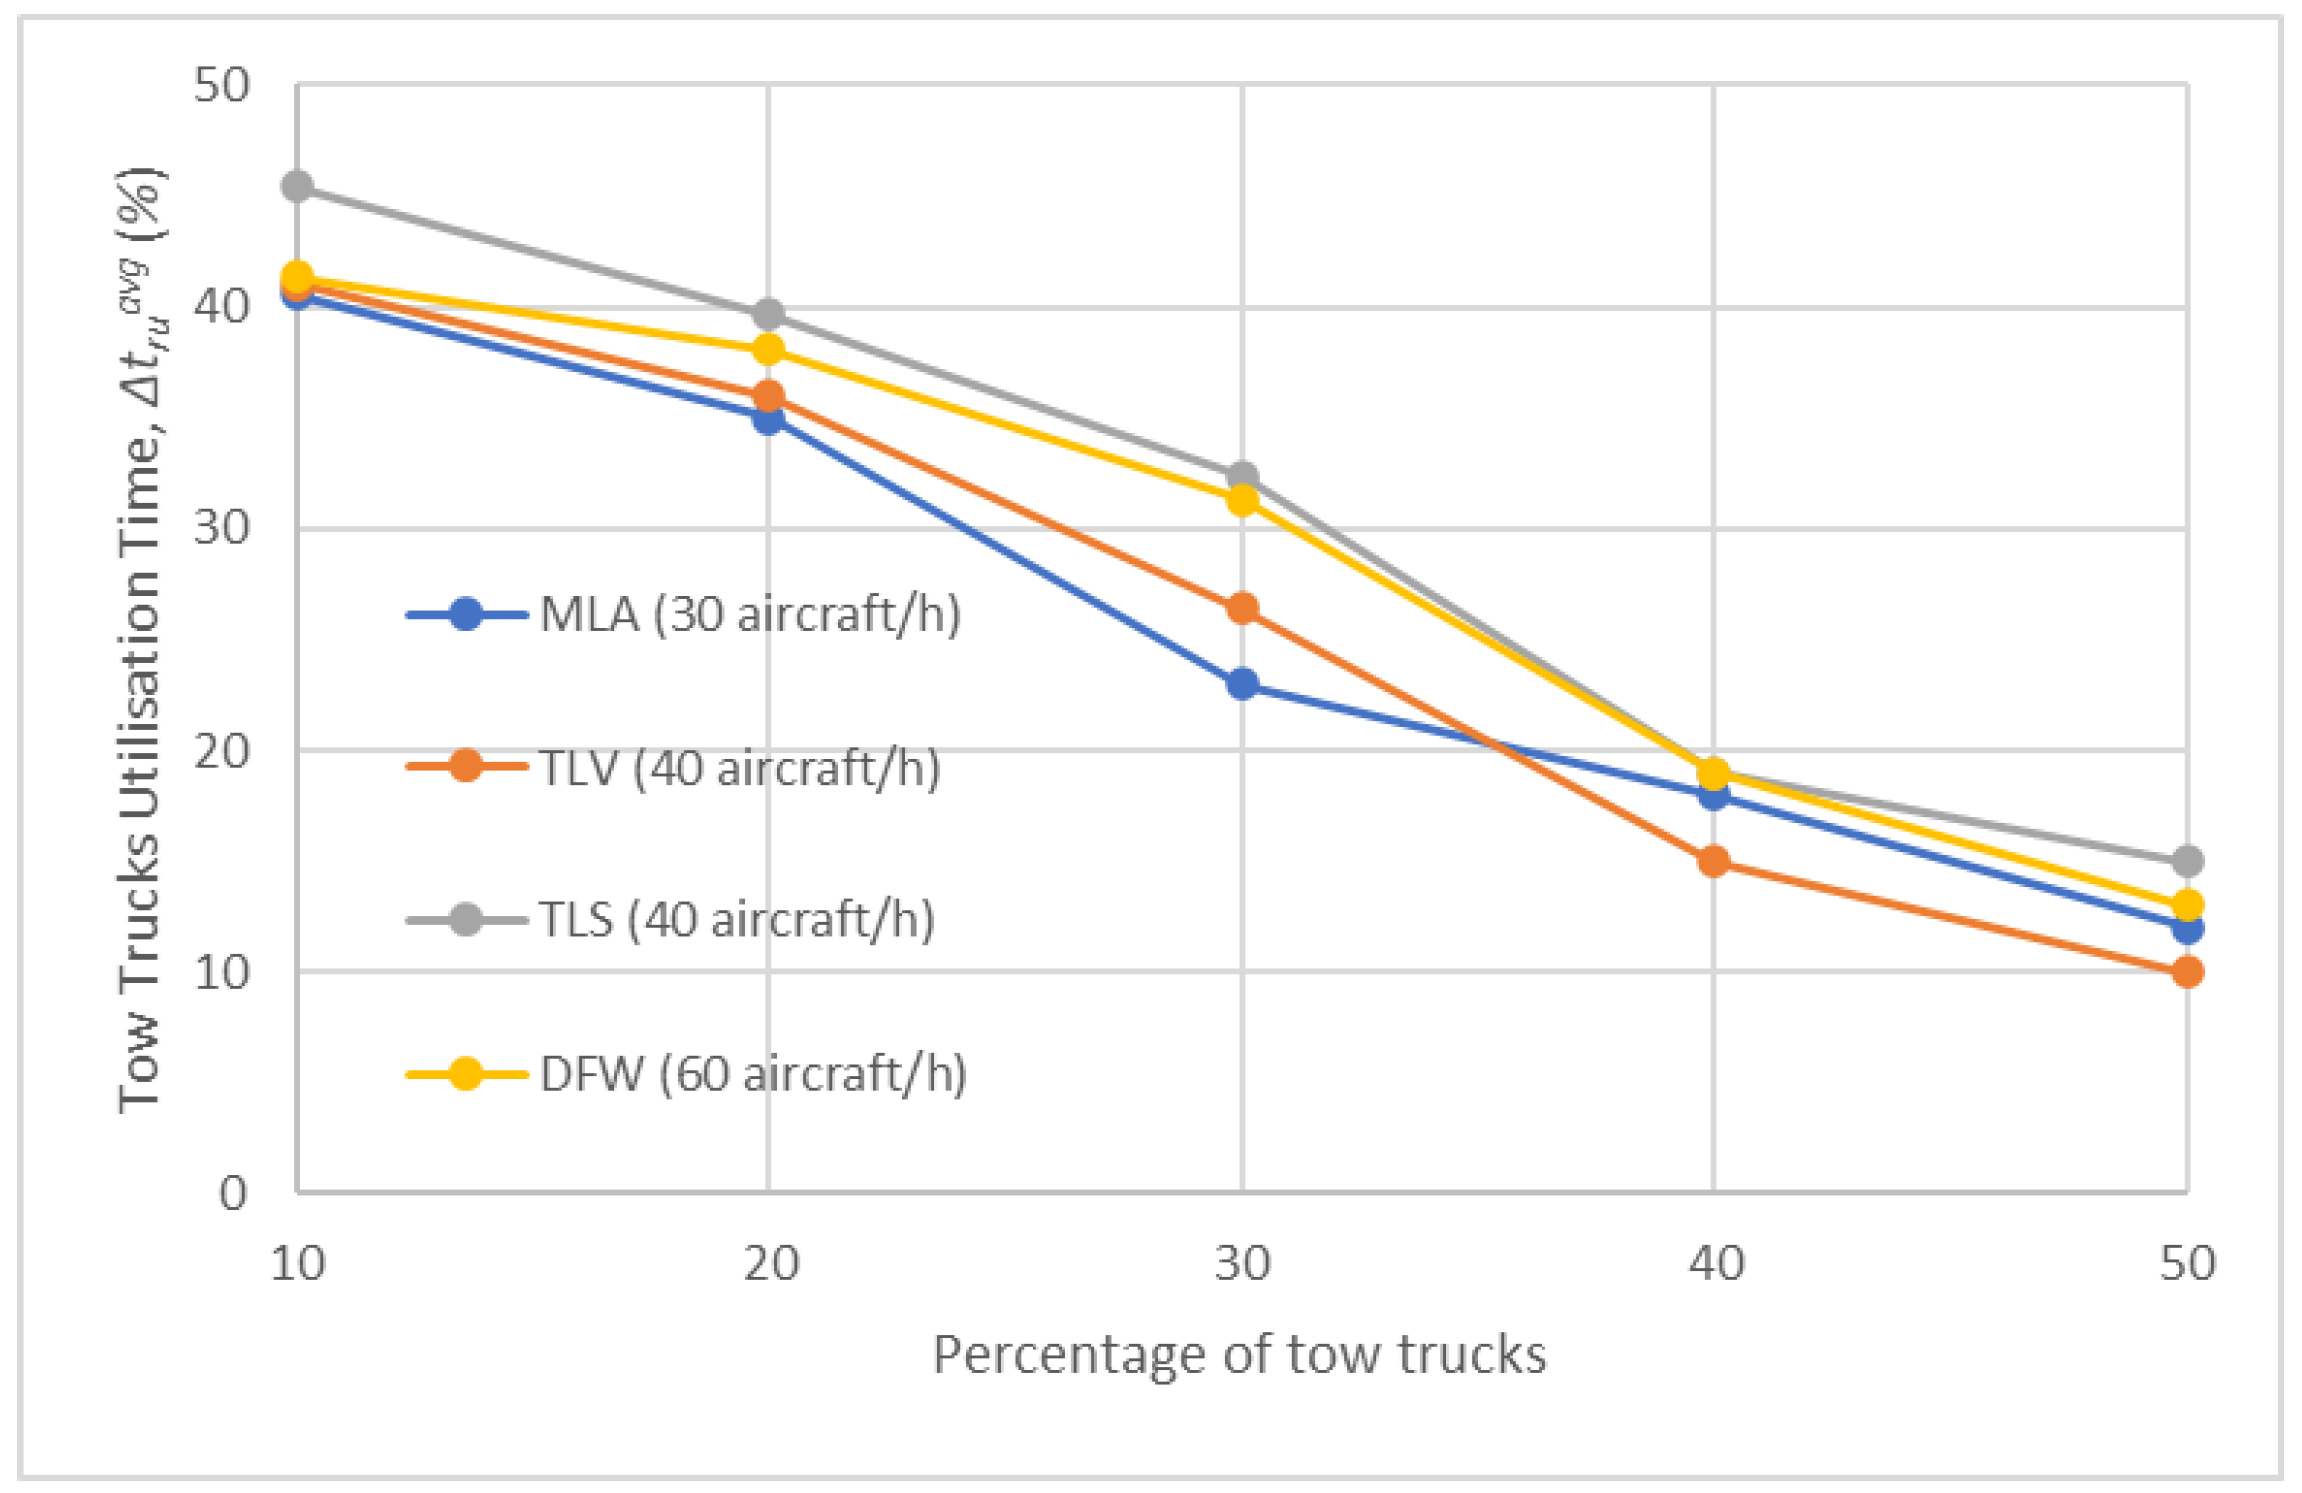
Results for Test Scenario 4
Figure 12 shows the percentage of towed aircraft, T A (%), for various percentages of tow trucks at each airport for Test Scenario 4. Initially, the values of the metric increase as the percentage of tow trucks rises, but eventually stabilise for a percentage of tow trucks exceeding approximately 30%, similarly to what was observed in the previous two scenarios. However, in this instance, the values are slightly higher than those observed in Test Scenario 3 (refer to Figure 8), and considerably higher than those ones observed in Test Scenario 2 (as shown in Figure 5). This is attributed to the enhanced efficiency of the algorithm when employing the Dynamic Allocation approach to assign tow trucks.
Figure 13 depicts the trend of the average fuel savings, Δ F s a v g (kg), observed for various percentages of tow trucks at each airport for Test Scenario 4. Similarly to the previous metric, Δ F s a v g does not considerably change for a percentage of tow trucks over 30%. However, in this instance, Δ F s a v g is slightly higher than the values recorded for Test Scenario 2 (shown in Figure 6) and similar to the values obtained in Test Scenario 3 (shown in Figure 9). This outcome underscores the superior performance of the Dynamic Allocation approach compared to Static Allocation when assigning tow trucks. With the Dynamic Allocation approach, the tow trucks are not required to return to a depot after each mission before being allocated to a new one. Consequently, they can complete a higher number of missions during the simulation, leading to increased average fuel savings.
Figure 14 illustrates the average tow truck utilisation time, Δ t r u a v g (%), for different percentages of tow trucks at each airport for Test Scenario 4. Consistently with the trend observed in the previous two scenarios (as seen in Figure 7 and Figure 11), Δ t r u a v g steadily decreases at all airports as the percentage of tow trucks increases. However, Δ t r u a v g exhibits higher values, exceeding 50%, when compared to the previous two cases. Nevertheless, Δ t r u a v g never surpasses 60%, reaffirming the significance of battery performance in tow truck utilisation.
5.
Results for Test Scenario 5
Figure 15 displays the percentage towed aircraft, T A (%), for different percentages of tow trucks at each airport for Test Scenario 5. Initially, the percentage shows a correlation with the number of tow trucks, but gradually levels out, similarly to the trend observed in Test Scenarios 2–4. When the proportion of tow trucks reaches around 30%, they can handle 90% (or more) of the traffic, indicating that only 10% (or fewer) of aircraft must taxi using their primary engines. Notably, for all percentages of tow trucks, the values of this metric for Test Scenario 5 are the highest among Test Scenarios 2–5. This improvement can be attributed to the combined use of the Fuel-Wise Approach, in which the algorithm prioritises maximising the number of towed aircraft at the expense of taxi delays), and the Dynamic Allocation, where tow trucks are not required to return to a depot after each mission before being allocated to a new one. This approach allows each tow truck to complete a higher number of missions during the simulation, leading to improved overall performance.
Figure 16 and Figure 17 present the results of the average fuel savings, Δ F s a v g (kg) and average total delay, Δ t d t o t a v g (s), respectively, observed for different percentages of tow trucks at each airport for Test Scenario 5. These metrics are closely related to T A (%). For a percentage of tow trucks exceeding approximately 30%, Δ F s a v g remains relatively stable, whereas the delay, Δ t d t o t a v g , does not considerably increase. This indicates that fuel savings do not considerably improve beyond this threshold, and delays do not increase accordingly.
However, Δ F s a v g in this scenario is slightly higher for each airport compared to the fuel savings obtained in Test Scenarios 2–4, likely due to the combined use of the Fuel-Wise Approach and Dynamic Allocation. On the other hand, Δ t d t o t a v g , which is represented by including the values obtained with 0% tow trucks in Test Scenario 1, as displayed in Figure 3, increases with the percentage of tow trucks and its values are comparable to the ones of Test Scenario 3 (shown in Figure 10). This result was expected as, while Test Scenario 2 was carried out using the Time-Wise Approach, Test Scenarios 3 and 5 were carried out using the Fuel-Wise Approach, thus favouring fuel savings over delays.
Figure 18 illustrates the average tow truck utilisation time, Δ t r u a v g (%), for different percentages of tow trucks at each airport for Test Scenario 5. Consistently with the three preceding scenarios, Δ t r u a v g steadily decreases as the percentage of tow trucks increases. However, when compared to Test Scenarios 2 and 3, Δ t r u a v g exhibits higher values, surpassing 50%, and slightly higher values when compared to Test Scenario 4. Nevertheless, the figure never exceeds 60%, highlighting once again the critical importance of battery performance for tow truck usage.
6.
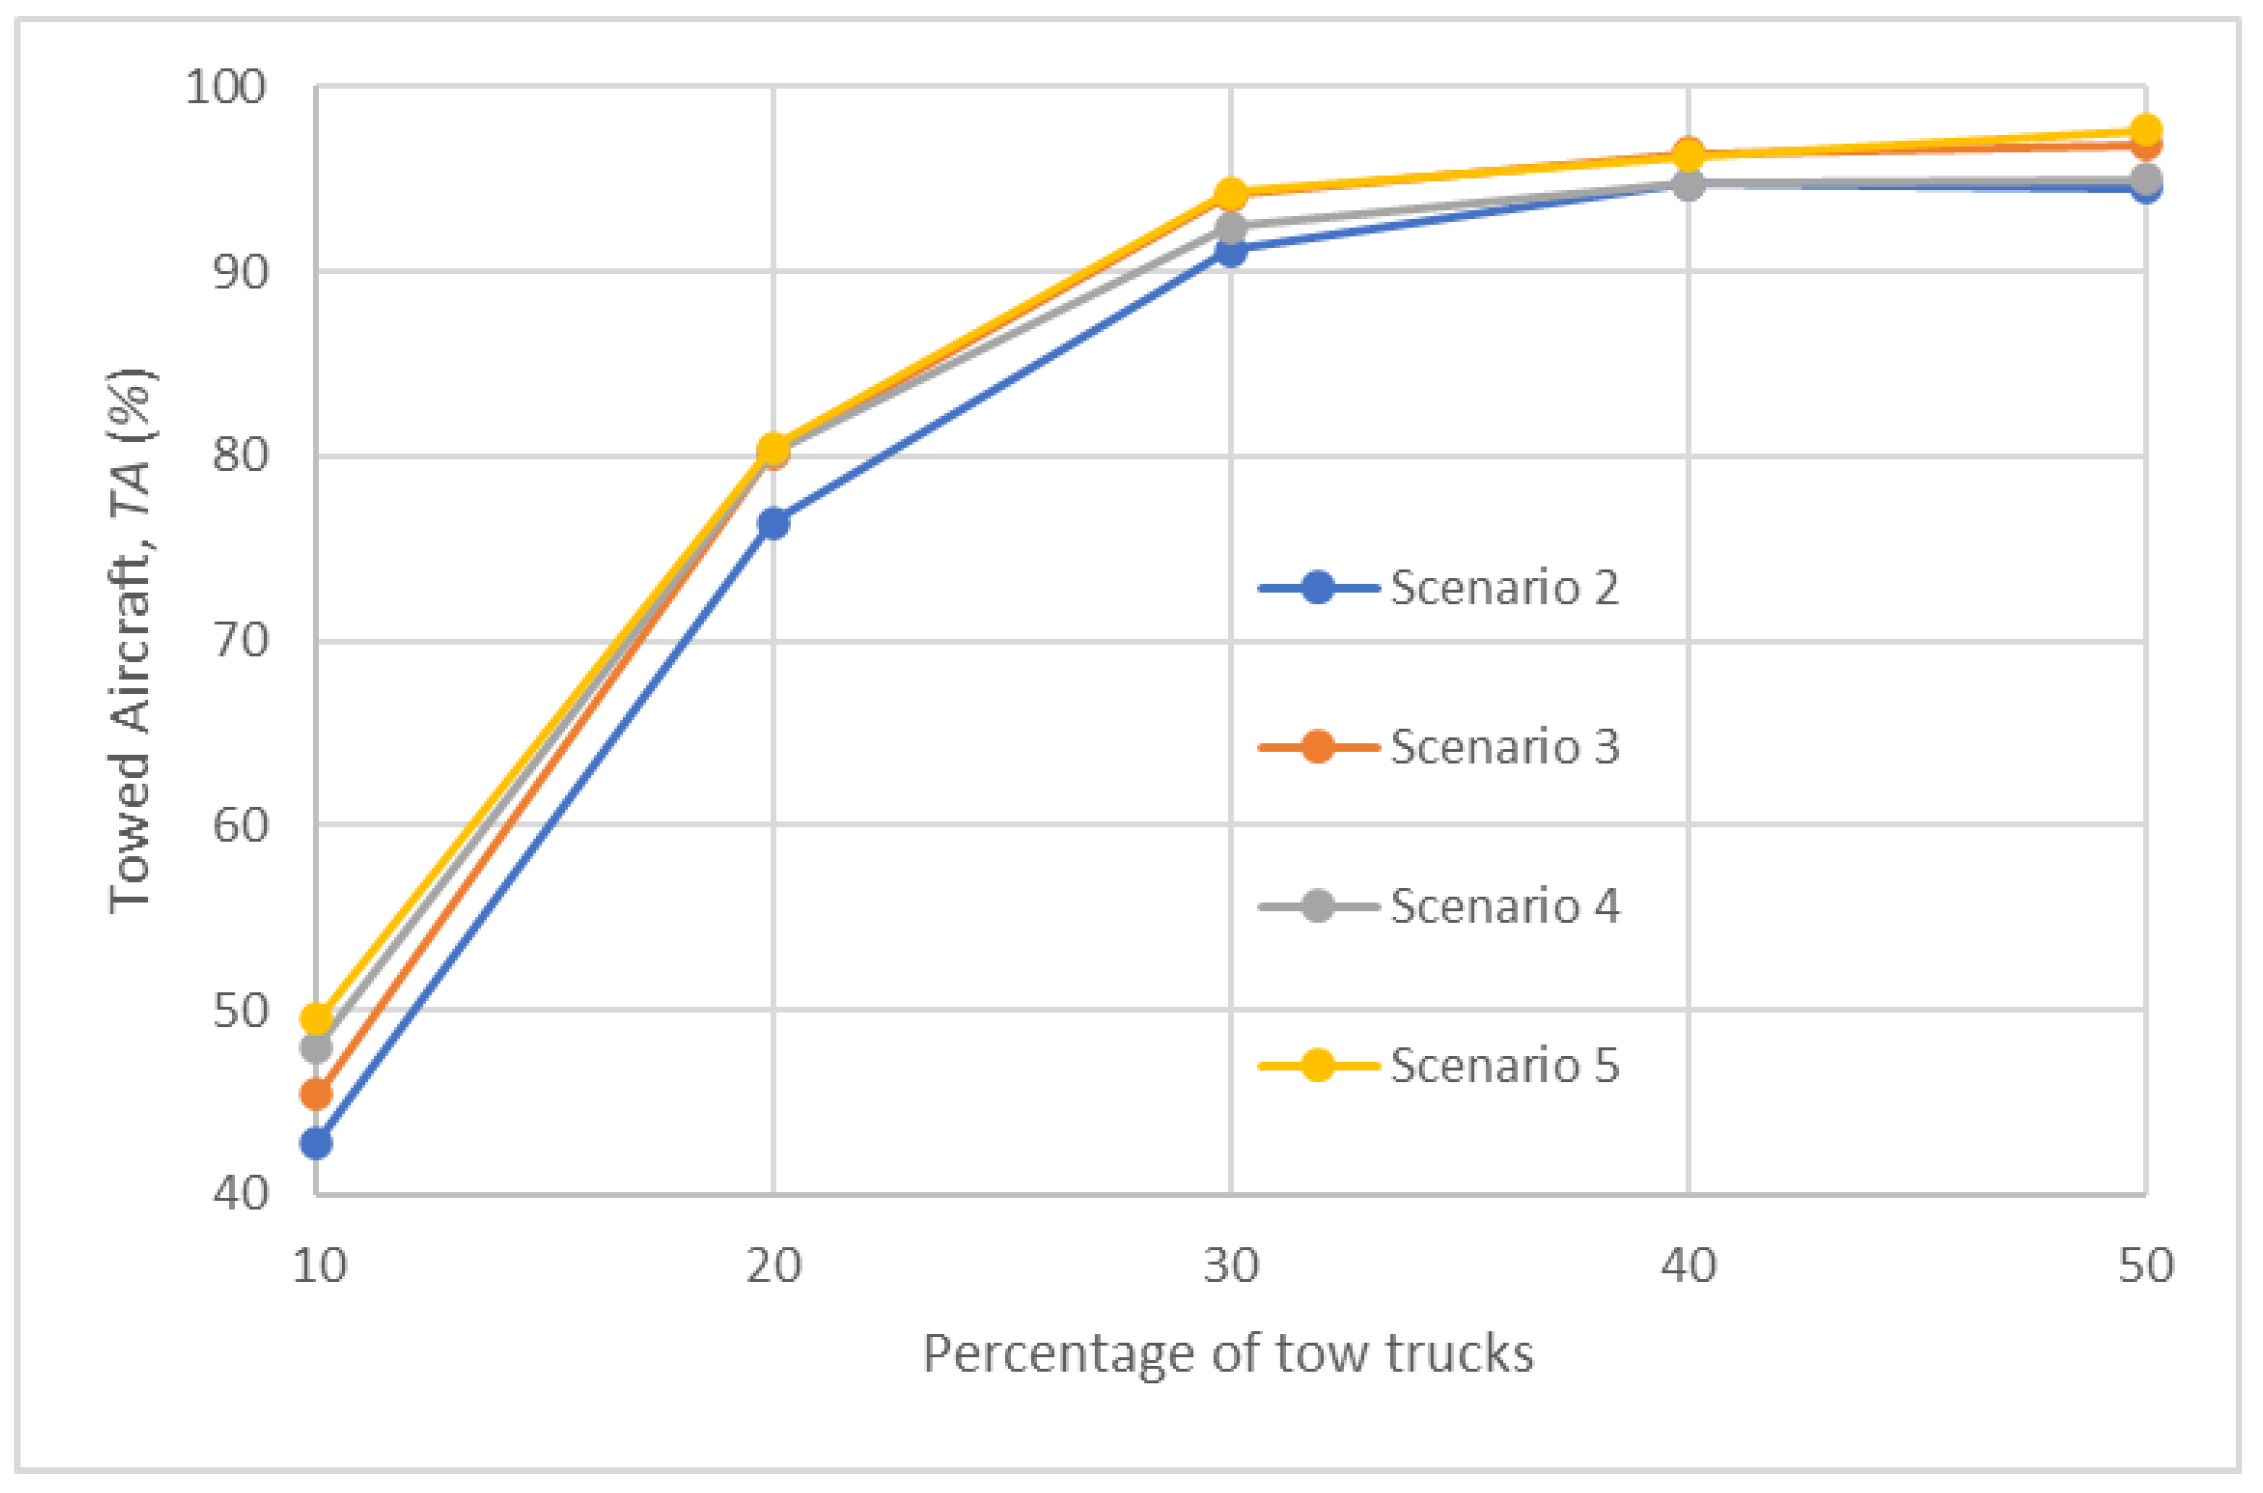
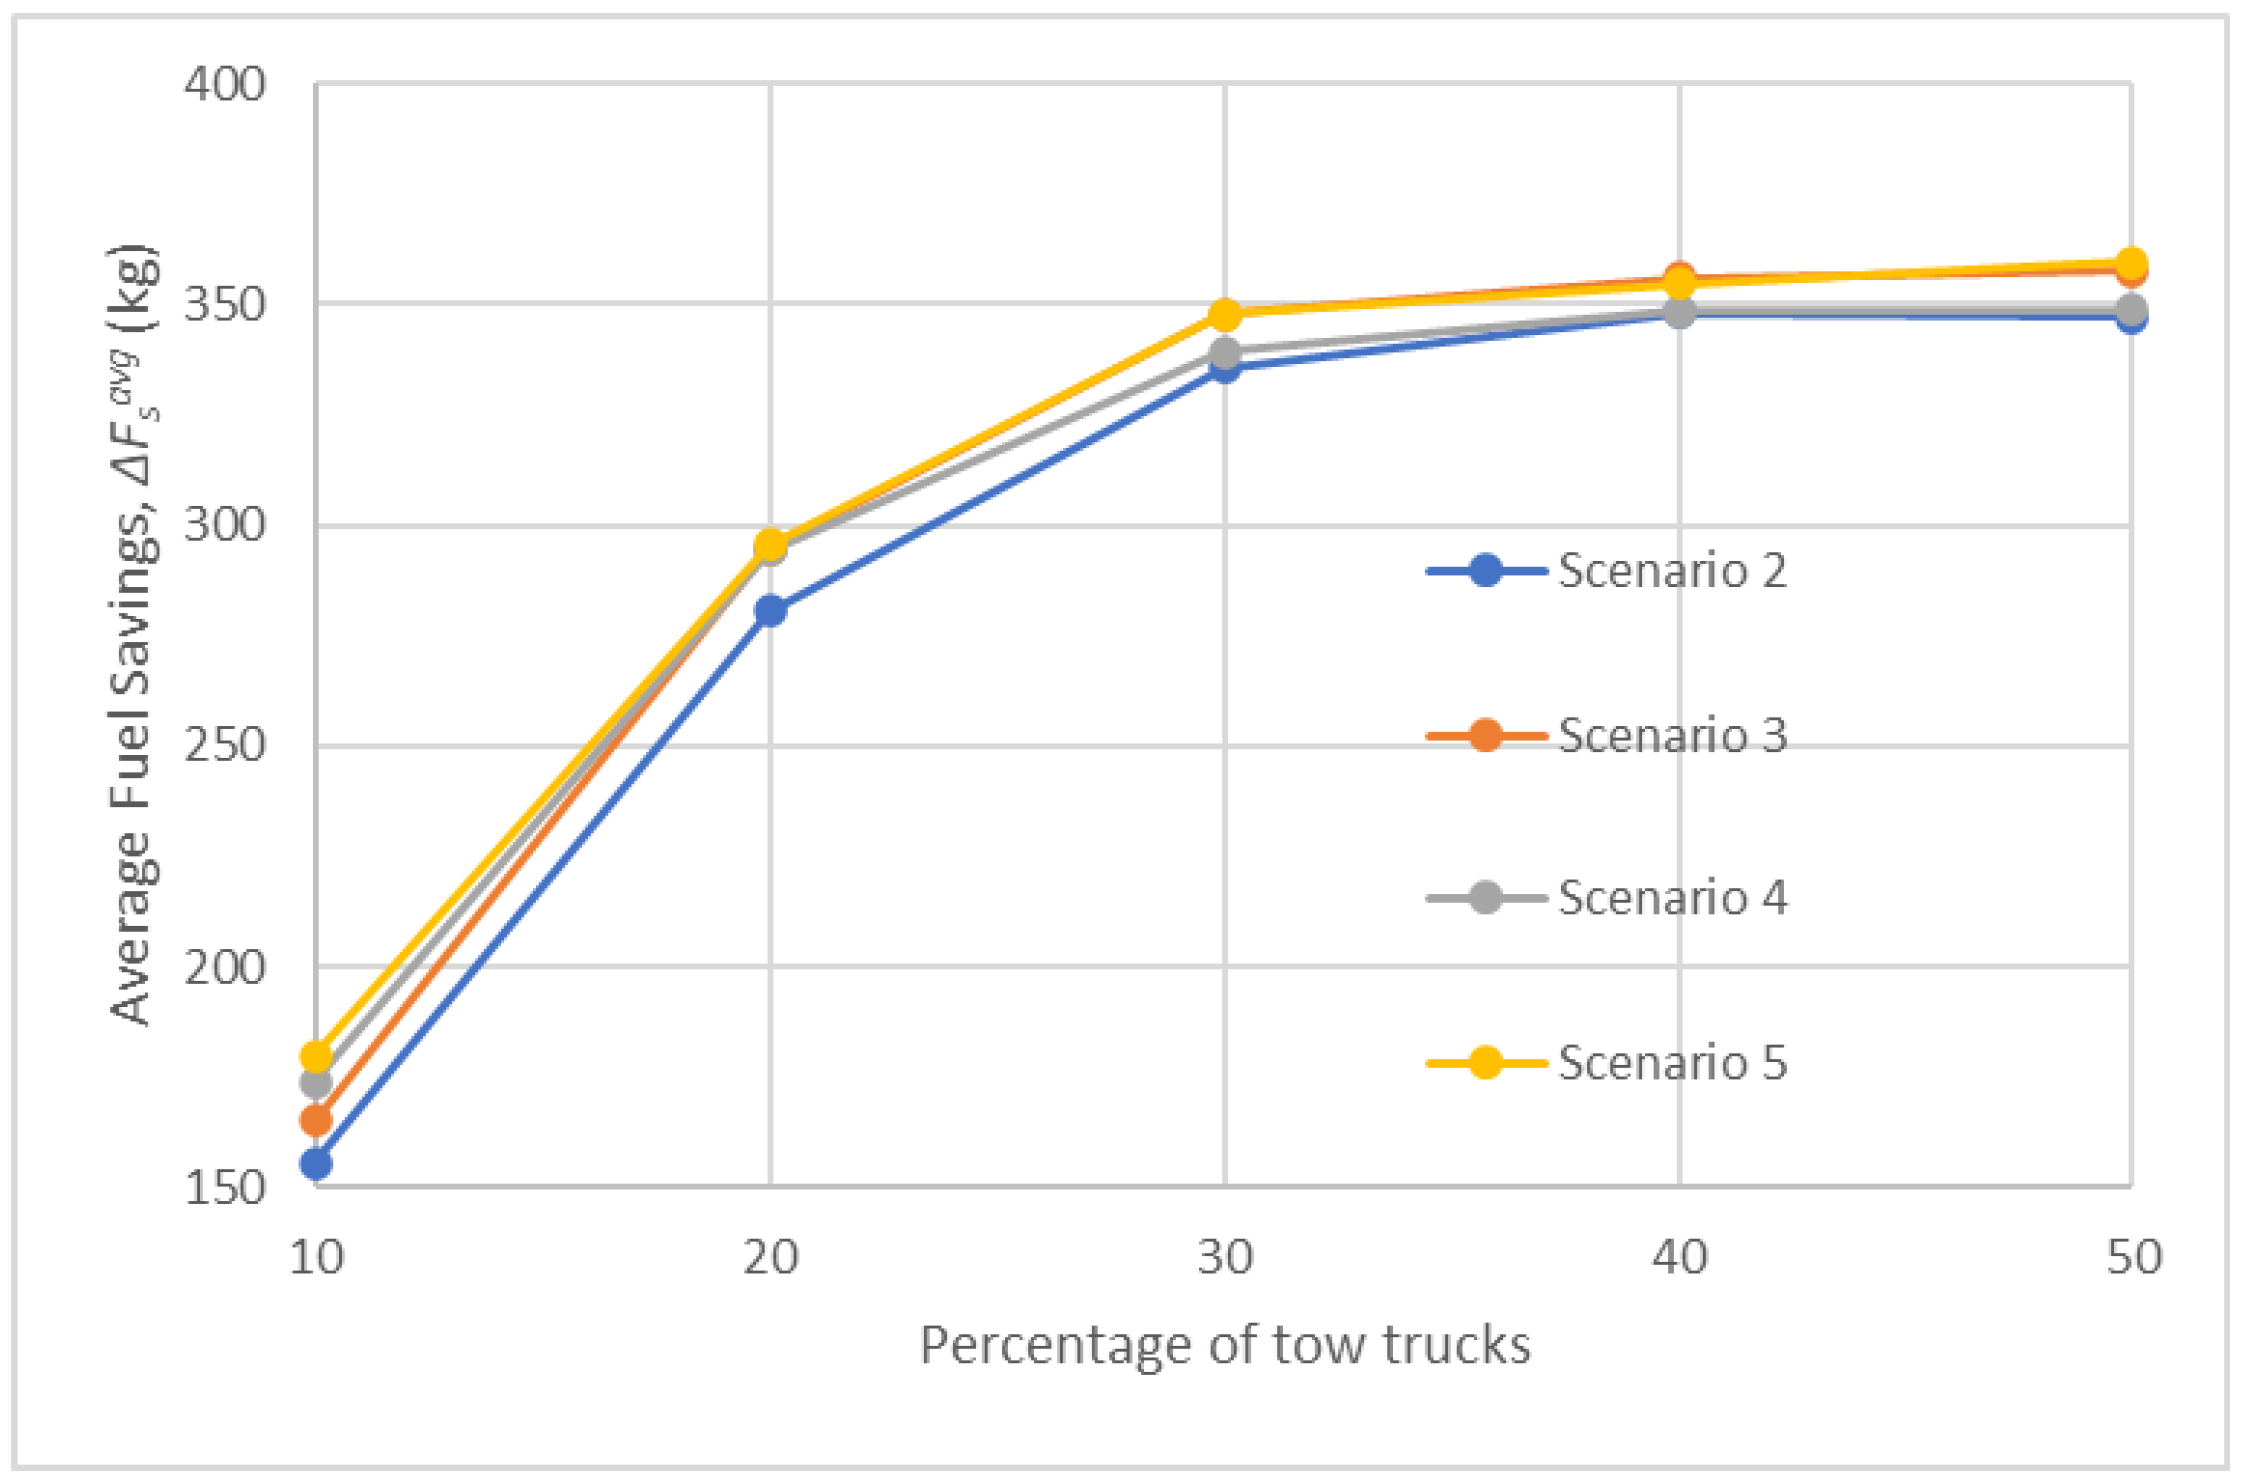
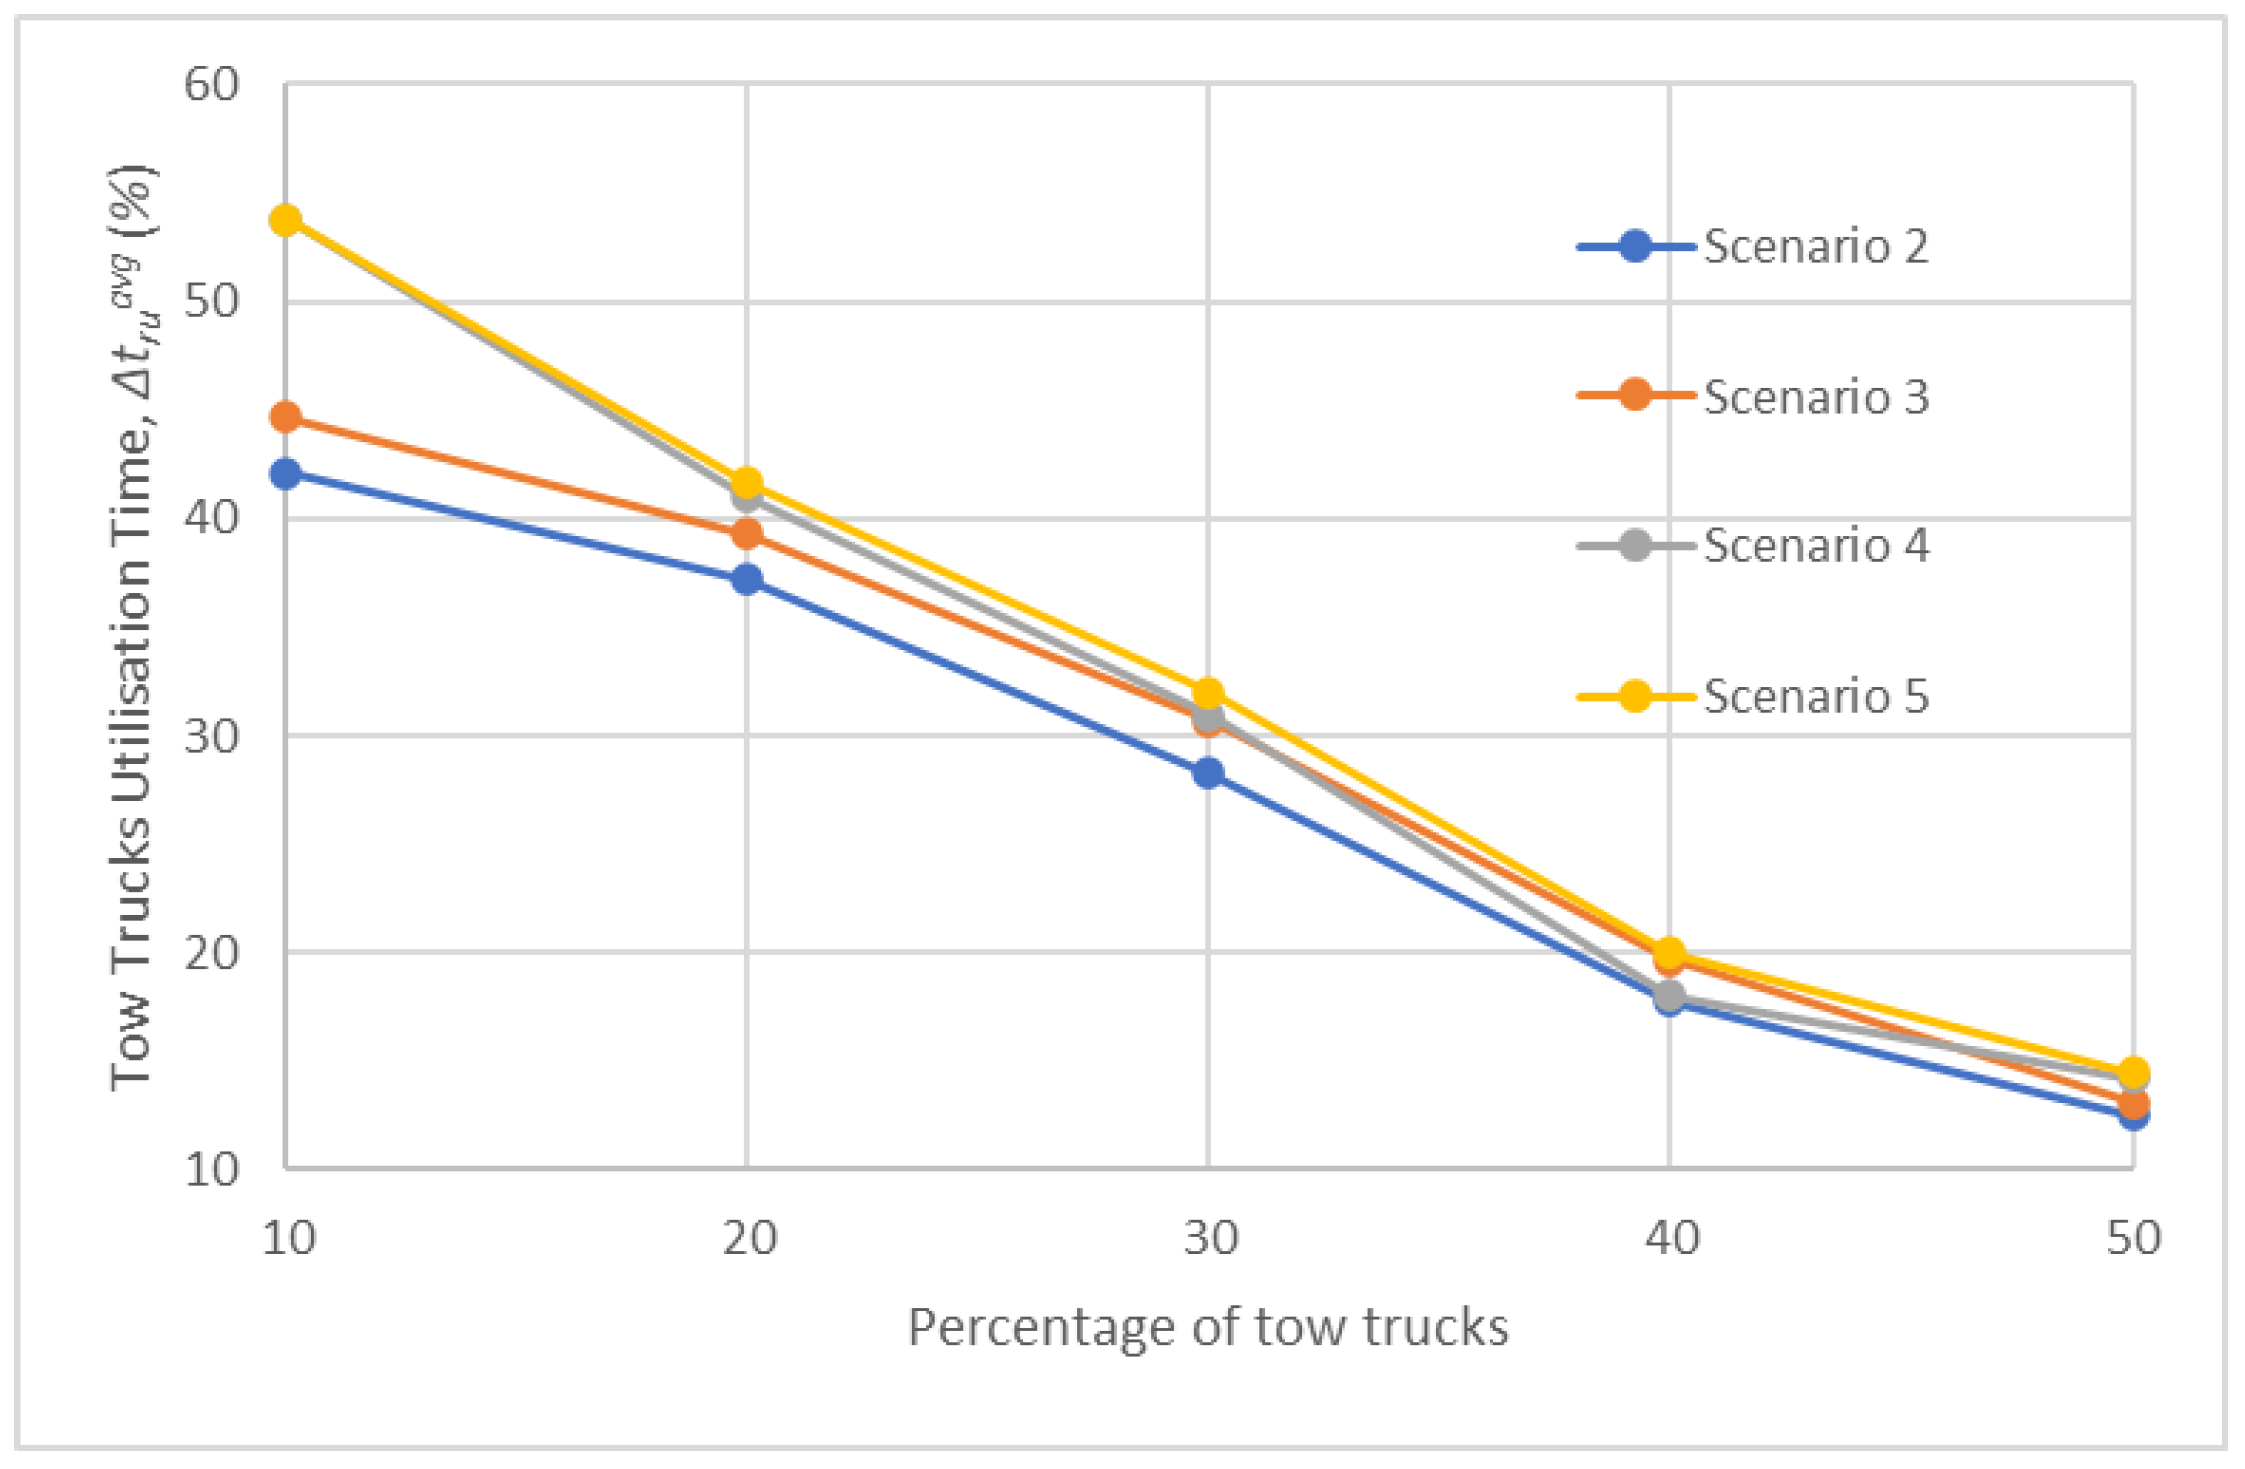
Comparison of results of Test Scenarios 2–5
To allow for a direct comparison between the four dispatch strategies, the results of Test Scenarios 2–5 were averaged and combined as shown in Figure 19, Figure 20 and Figure 21.
Figure 19 displays the percentage of towed aircraft, T A (%), for different percentages of tow trucks in Test Scenarios 2–5. The metrics related to Test Scenario 3 are higher than those of Test Scenario 2 and are likely the result of the fuel-wise strategy used in Test Scenario 3. The best metrics are obtained in Test Scenario 5 and reflect the synergy between a Fuel-Wise Approach—with an emphasis on maximising towed flights at the expense of taxi time—and a Dynamic Allocation strategy that allows tow trucks to undertake multiple missions without returning to a depot, thereby optimising overall operational efficacy.
Figure 20 presents the results of the average fuel savings, Δ F s a v g   (kg) observed for different percentages of tow trucks in Test Scenarios 2–5. The behaviour of this metric is closely aligned with that of T A (%) and it can be observed that the change in fuel savings diminishes beyond a 30% threshold of tow trucks. The figure shows that the best fuel savings are obtained in Test Scenario 5, which again reflects the benefit of using a Fuel-Wise Approach and Dynamic Allocation. This is because, under Dynamic Allocation, tow trucks do not need to return to a depot between missions, allowing more missions and thus higher fuel savings across scenarios.
Figure 21 shows the average tow truck utilisation time, Δ t r u a v g (%), for various percentages of tow trucks in Test Scenarios 2–5. In all test scenarios, as the percentage of tow trucks increases, Δ t r u a v g (%) tends to decrease, highlighting the importance of determining the optimal amount of tow trucks for efficient operations. Notably, in Test Scenarios 2 and 3, this metric does not exceed 50% for any airport, possibly due to tow truck recharging needs which affect the utilisation time. Test Scenarios 4 and 5, employing Dynamic Allocation, show enhancements in utilisation, surpassing 50%, but remaining below 60%. This underscores the impact of battery efficiency on overall tow truck performance.
7.
Results for Test Scenario 6
The purpose of Test Scenario 6 was to evaluate the relationship between tow truck performance and battery performance. This scenario was tested in TLS for 40 aircraft per hour and a percentage of tow trucks equal to 20%. As shown in Table 2, for lower discharge rates, T A (%), Δ F s a v g (kg) and Δ t r u a v g (%) have higher values. In particular, T A exceeds 80%, indicating a consistent improvement in tow truck performance compared to the base scenario (i.e., nominal values of r b d h and r b d l ). On the other hand, an increase in discharge rates results in a sharp decline in the value of the metrics. This decline may occur because the tow trucks are frequently not assigned to the aircraft due to their low battery level. Large variations in the metrics for relatively small percentage changes in discharge rates underscores the importance of battery performance for tow truck operations and for determining the appropriate number of tow trucks to deploy to meet demand corresponding to various traffic levels.

5. Discussion

Six scenarios were used to evaluate the algorithm—one of which examined the performance of the Flight Scheduler (Test Scenario 1), while the other five examined the performance of the Tug Dispatcher under various conditions (Test Scenarios 2–6). One of the key results of Test Scenario 1 is represented by the average delay of the aircraft. Generally, the algorithm prefers increasing the waiting time at the stand (for departing flights) or next to a runway (for arriving flights) as this results in fewer delays than selectin a different (longer) route to the destination, so in fact, the delays accumulated before starting to taxi are typically higher than the delays accumulated while taxiing. This is also beneficial for fuel consumption, because departing aircraft can start their engines later, while arriving aircraft use less fuel by waiting instead of taxiing.
It is interesting to examine how the Tug Dispatcher performs in Test Scenarios 2 and 4, which use the Time-Wise Approach, and Test Scenarios 3 and 5, which use the Fuel-Wise Approach. With the first approach, the algorithm attempts to minimise delays, whereas with the second approach, it aims to maximise fuel savings; the variation is modest both in terms of delays and fuel savings but, when added up across all flights, these variations might make a considerable difference. The small average difference between the two approaches may be explained by the fact that, in essence, minimising delays or maximising fuel savings will both result in an overall fuel saving. As a result, optimising one of these two objectives will inherently have a positive impact on the other.
Another comparison that can be made is between the Tug Dispatcher performance in Test Scenarios 2 and 3, with Static Allocation, versus that of Test Scenarios 4 and 5, with Dynamic Allocation. The algorithm is able to assign tow trucks to a higher number of flights because of Dynamic Allocation, which allows a tow truck that has just completed a mission to be reassigned straightaway to another mission instead of being required to first return to a depot; as a result, in Test Scenarios 4 and 5 the algorithm performs better for a wide range of metrics, such as the percentage of towed aircraft, the tow truck utilisation time, and the fuel savings.
In Test Scenarios 2–5, it was observed that the tow truck utilisation never surpasses 60% of the total simulation time. This may be partially due to the unavailability of conflict-free routes for the tow trucks in situations of high volumes of traffic, but another factor is the battery performance, since tow trucks need to occasionally recharge their batteries periodically. Furthermore, in Test Scenario 6, it was observed that relatively small variations in the tow truck battery discharge rates have a considerable impact on the tow truck performance. These results demonstrate the importance of battery performance for tow truck-based electric taxi operations. In addition to deploying rapid charging tow trucks, other ways to increase the efficiency of the tow trucks include expanding the number of depots, placing them in strategic locations around the airport, and increasing the number of charging points (i.e., parking slots) in each depot.

6. Conclusions and Future Work

6.1. Conclusions

This work introduced an algorithm aimed at automating and optimising taxi operations using autonomous electric tow trucks. Operating at a strategic level, the algorithm generates conflict-free routes for both aircraft and tow trucks whilst achieving multiple objectives; reducing taxi-related delays and fuel consumption whilst maximising the utilisation of tow trucks for taxi operations. Furthermore, the algorithm can be fine-tuned to target specific performance aspects. To facilitate engineless taxi operations, an appropriate airport environment was established, followed by the design and implementation of the algorithm. Numerous simulations were conducted for various algorithm configurations and test scenarios, leading to several performance metrics being defined. The results indicate that the algorithm effectively limits delays in relation to the flight schedule, even under high traffic volumes, optimally utilises tow trucks, and maximises fuel savings. Moreover, further improvements in performance aspects are expected through adequate tuning.
The algorithm consistently delivered conflict-free solutions, even under conditions of high traffic volumes. The test results show that approximately 70% of flights necessitated short delays of up to 3 min to ensure sufficient traffic separation at all times. Moreover, a tow truck fleet comprising 30% of the hourly aircraft traffic effectively towed over 90% of these aircraft. This finding offers a valuable insight into determining the appropriate number of tow truck for different traffic levels and airport types. Additionally, it could be utilised during the design phase to compare the required investment with the anticipated fuel savings.
Furthermore, the results of the tests underscore the scalability of the algorithm, its adaptability to diverse taxiing environments, and its resilience to unforeseen circumstances. This is evidenced by the extensive array of tests conducted, encompassing four airports with considerably different sizes and geometries, varying number of active runways at each airport, diverse rates of aircraft per hour, and different ratios of tow trucks to aircraft per hour. Additionally, the number of charging points per depot was adjusted in accordance with the number of tow trucks, further highlighting the algorithm’s robustness.

6.2. Potential Areas of Future Work

The proposed algorithm provides strategic solutions by pre-computing route and tug assignments. In practice, this approach may prove insufficient due to the inherent uncertainty in taxi operations, which can disrupt the predictions made by the strategic algorithm. Therefore, future efforts should prioritise the incorporation of tactical solutions alongside the strategic ones, enabling a real-time responsiveness to unexpected events.
Additionally, this work updated the tow truck battery discharge and recharge rates based on three predetermined parameters and were assumed to be constant. In the future, a more sophisticated battery charging and discharging model could be implemented. Furthermore, testing the algorithm with varying battery parameters would offer insights into their impact on performance, facilitating a more comprehensive understanding of the algorithm’s capabilities.

Author Contributions

Conceptualization, S.Z. and J.G.; Methodology, S.Z., J.G. and B.Z.; Software, S.Z.; Validation, S.Z., J.G. and B.Z.; Formal analysis, J.G. and B.Z.; Investigation, S.Z.; Data curation, S.Z.; Writing—original draft, S.Z.; Writing—review & editing, J.G. and B.Z.; Supervision, J.G. and B.Z. All authors have read and agreed to the published version of the manuscript.

Funding

This research received no external funding.

Data Availability Statement

The raw data supporting the conclusions of this article will be made available by the authors on request.

Conflicts of Interest

The authors declare no conflict of interest.

Nomenclature

OBTOff-Block Time (-)
TOATime of Arrival (-)
S b number of parking slots at a depot (-)
R total number of tow trucks (-)
B total number of depots (-)
ToPtakeoff point (-)
LEPlanding entry point (-)
v a v Average Vehicle Velocity (m/s)
A b buffer area (m2)
d b Buffer Distance (m)
a aircraft (-)
n s t a initial   position   of   aircraft   a (-)
n e n d a final   position   of   aircraft   a (-)
t a s time to start taxiing
Δ t d t o t total delay (s)
Δ t d s delay experienced by an aircraft while waiting (s)
Δ t d t delay accumulated by an aircraft while taxiing (s)
Δ t i t ideal taxi time (s)
VOTVehicle Occupation Table (-)
ECLEdges in Conflict List (-)
GOTGlobal Occupation Table (-)
c t o t r Total Mission Cost (s)
r tow truck (-)
c t o w r time   that   r needs to complete the mission (-)
c t o w . m a x maximum   c t o w r over all the tow trucks (s)
b m a x maximum battery charge (%)
b m i n minimum allowed battery charge (%)
b r battery   charge   of   r (%)
r b d h Higher Battery Discharging Rate (%)
r b d l Lower Battery Discharging Rate (%)
r b c Battery Charging Rate (%)
Δ t d t o t a v g 
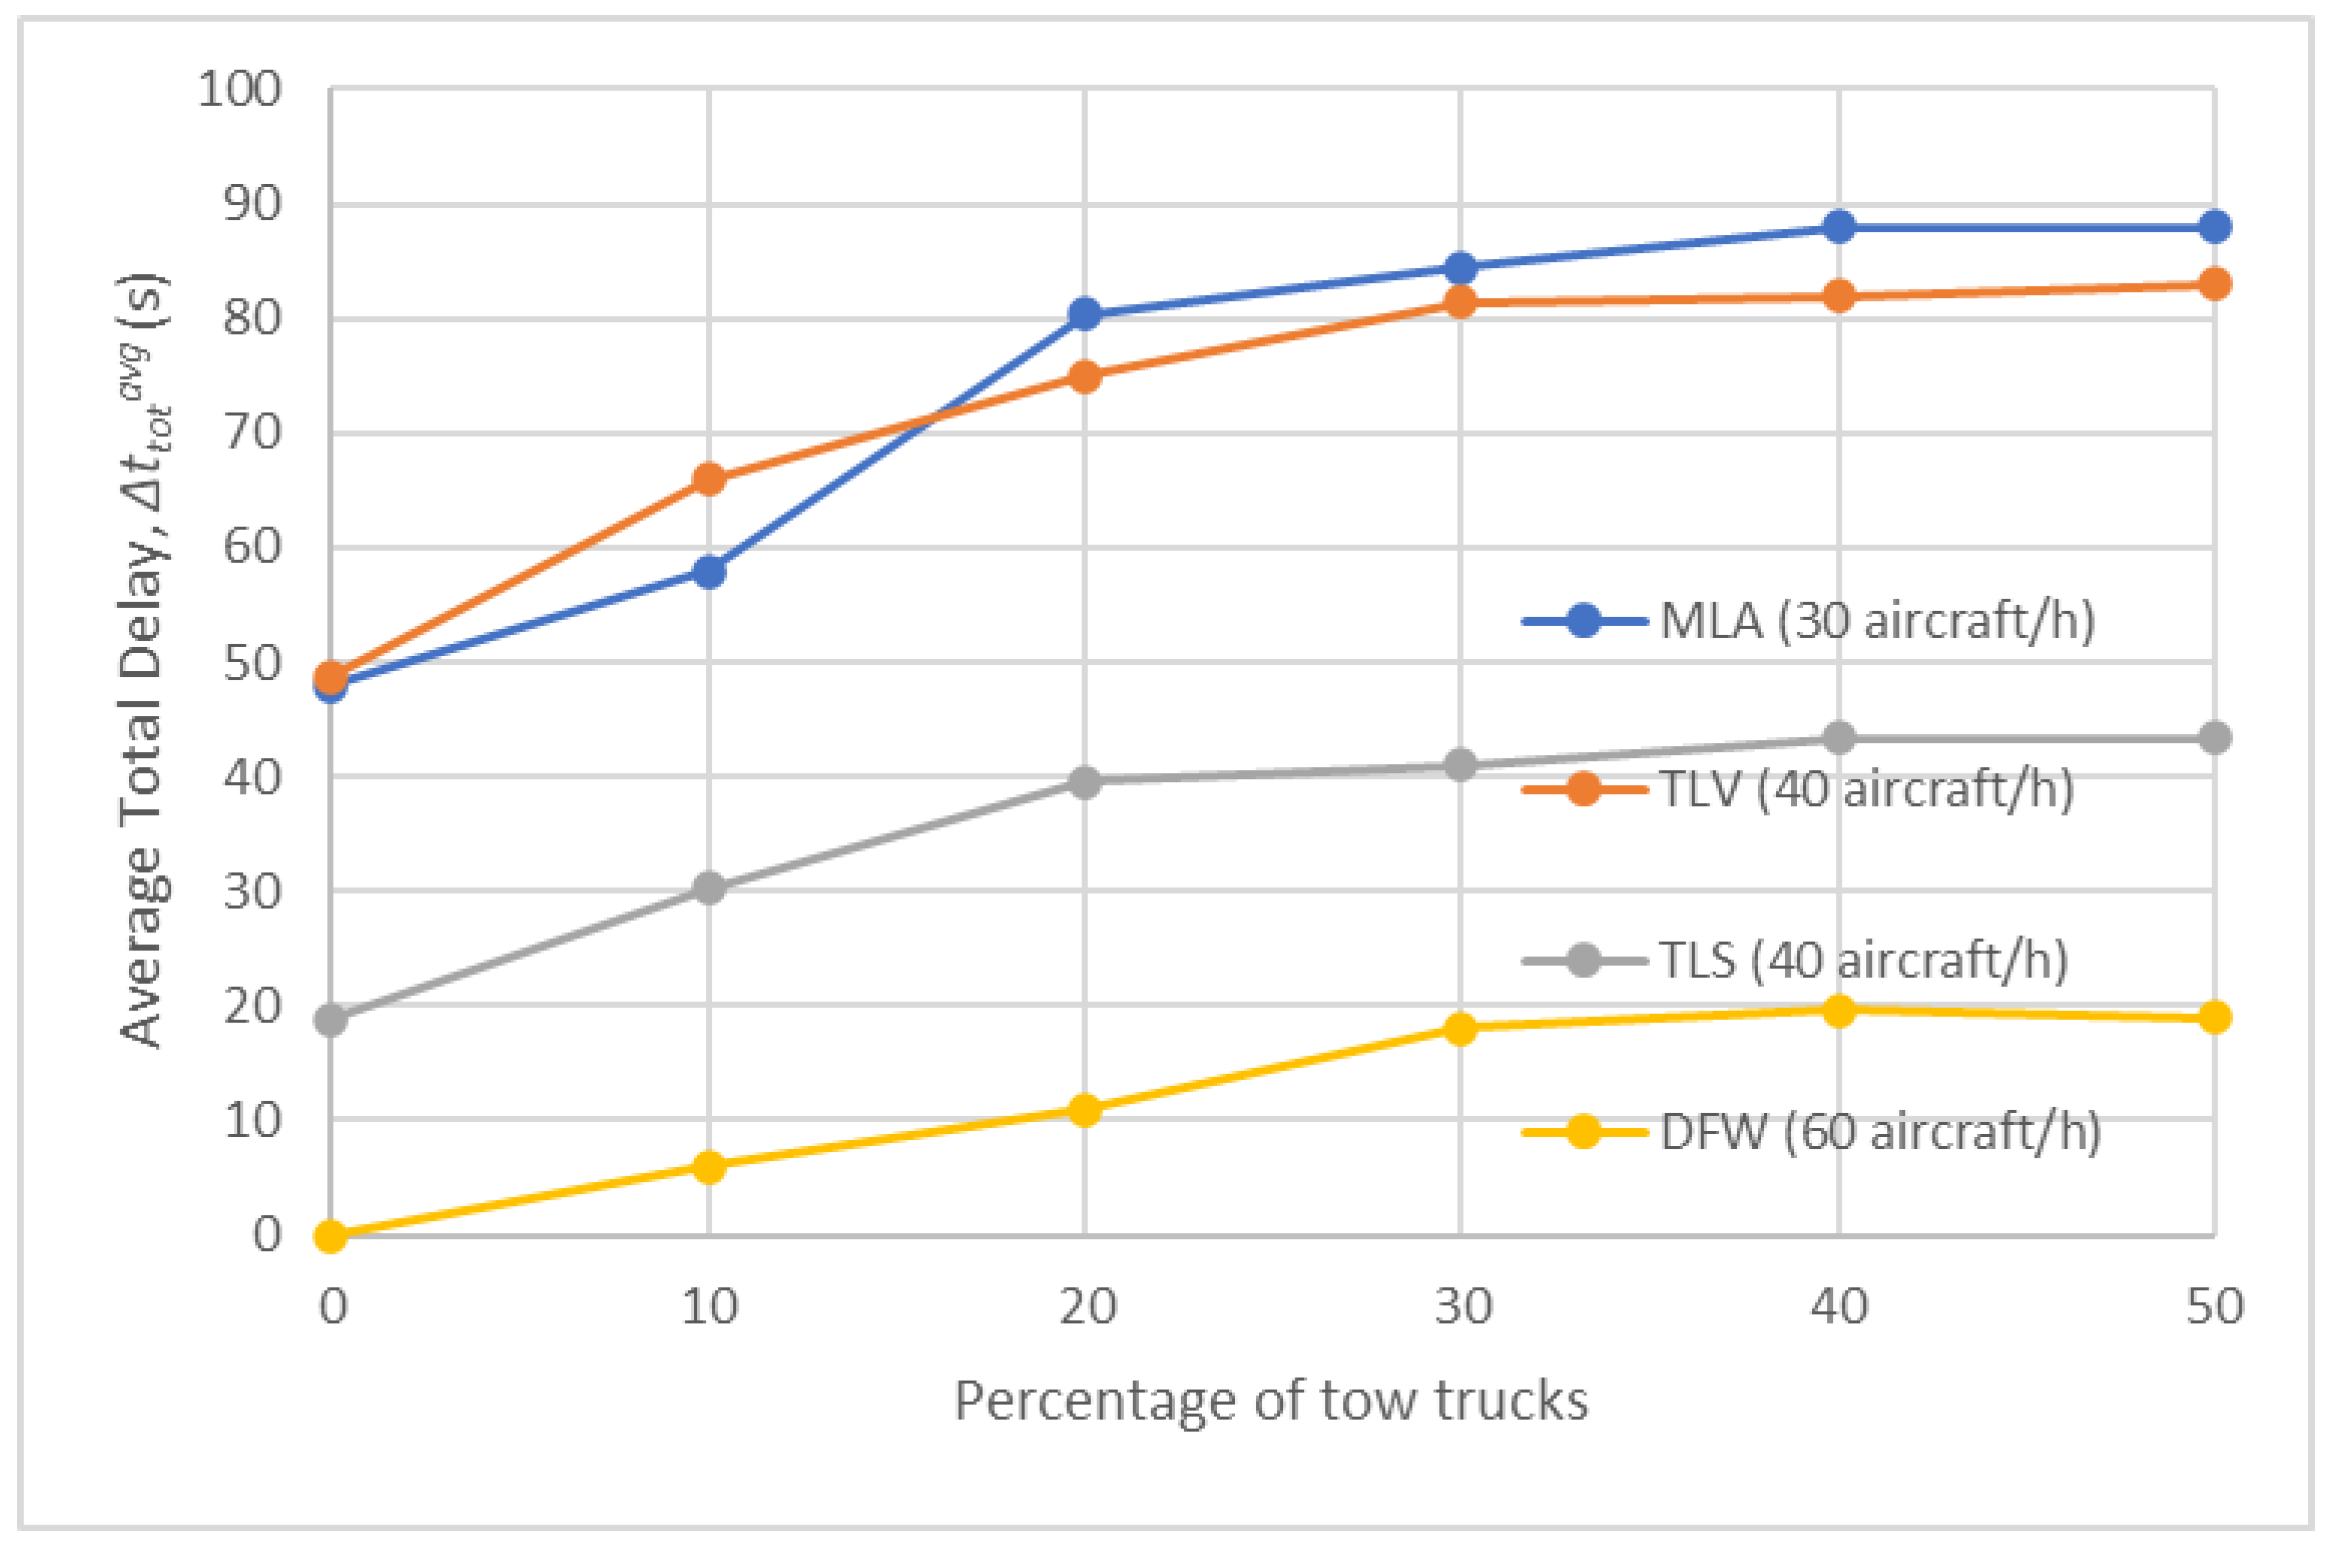
average total delay (s)
D A delayed aircraft (%)
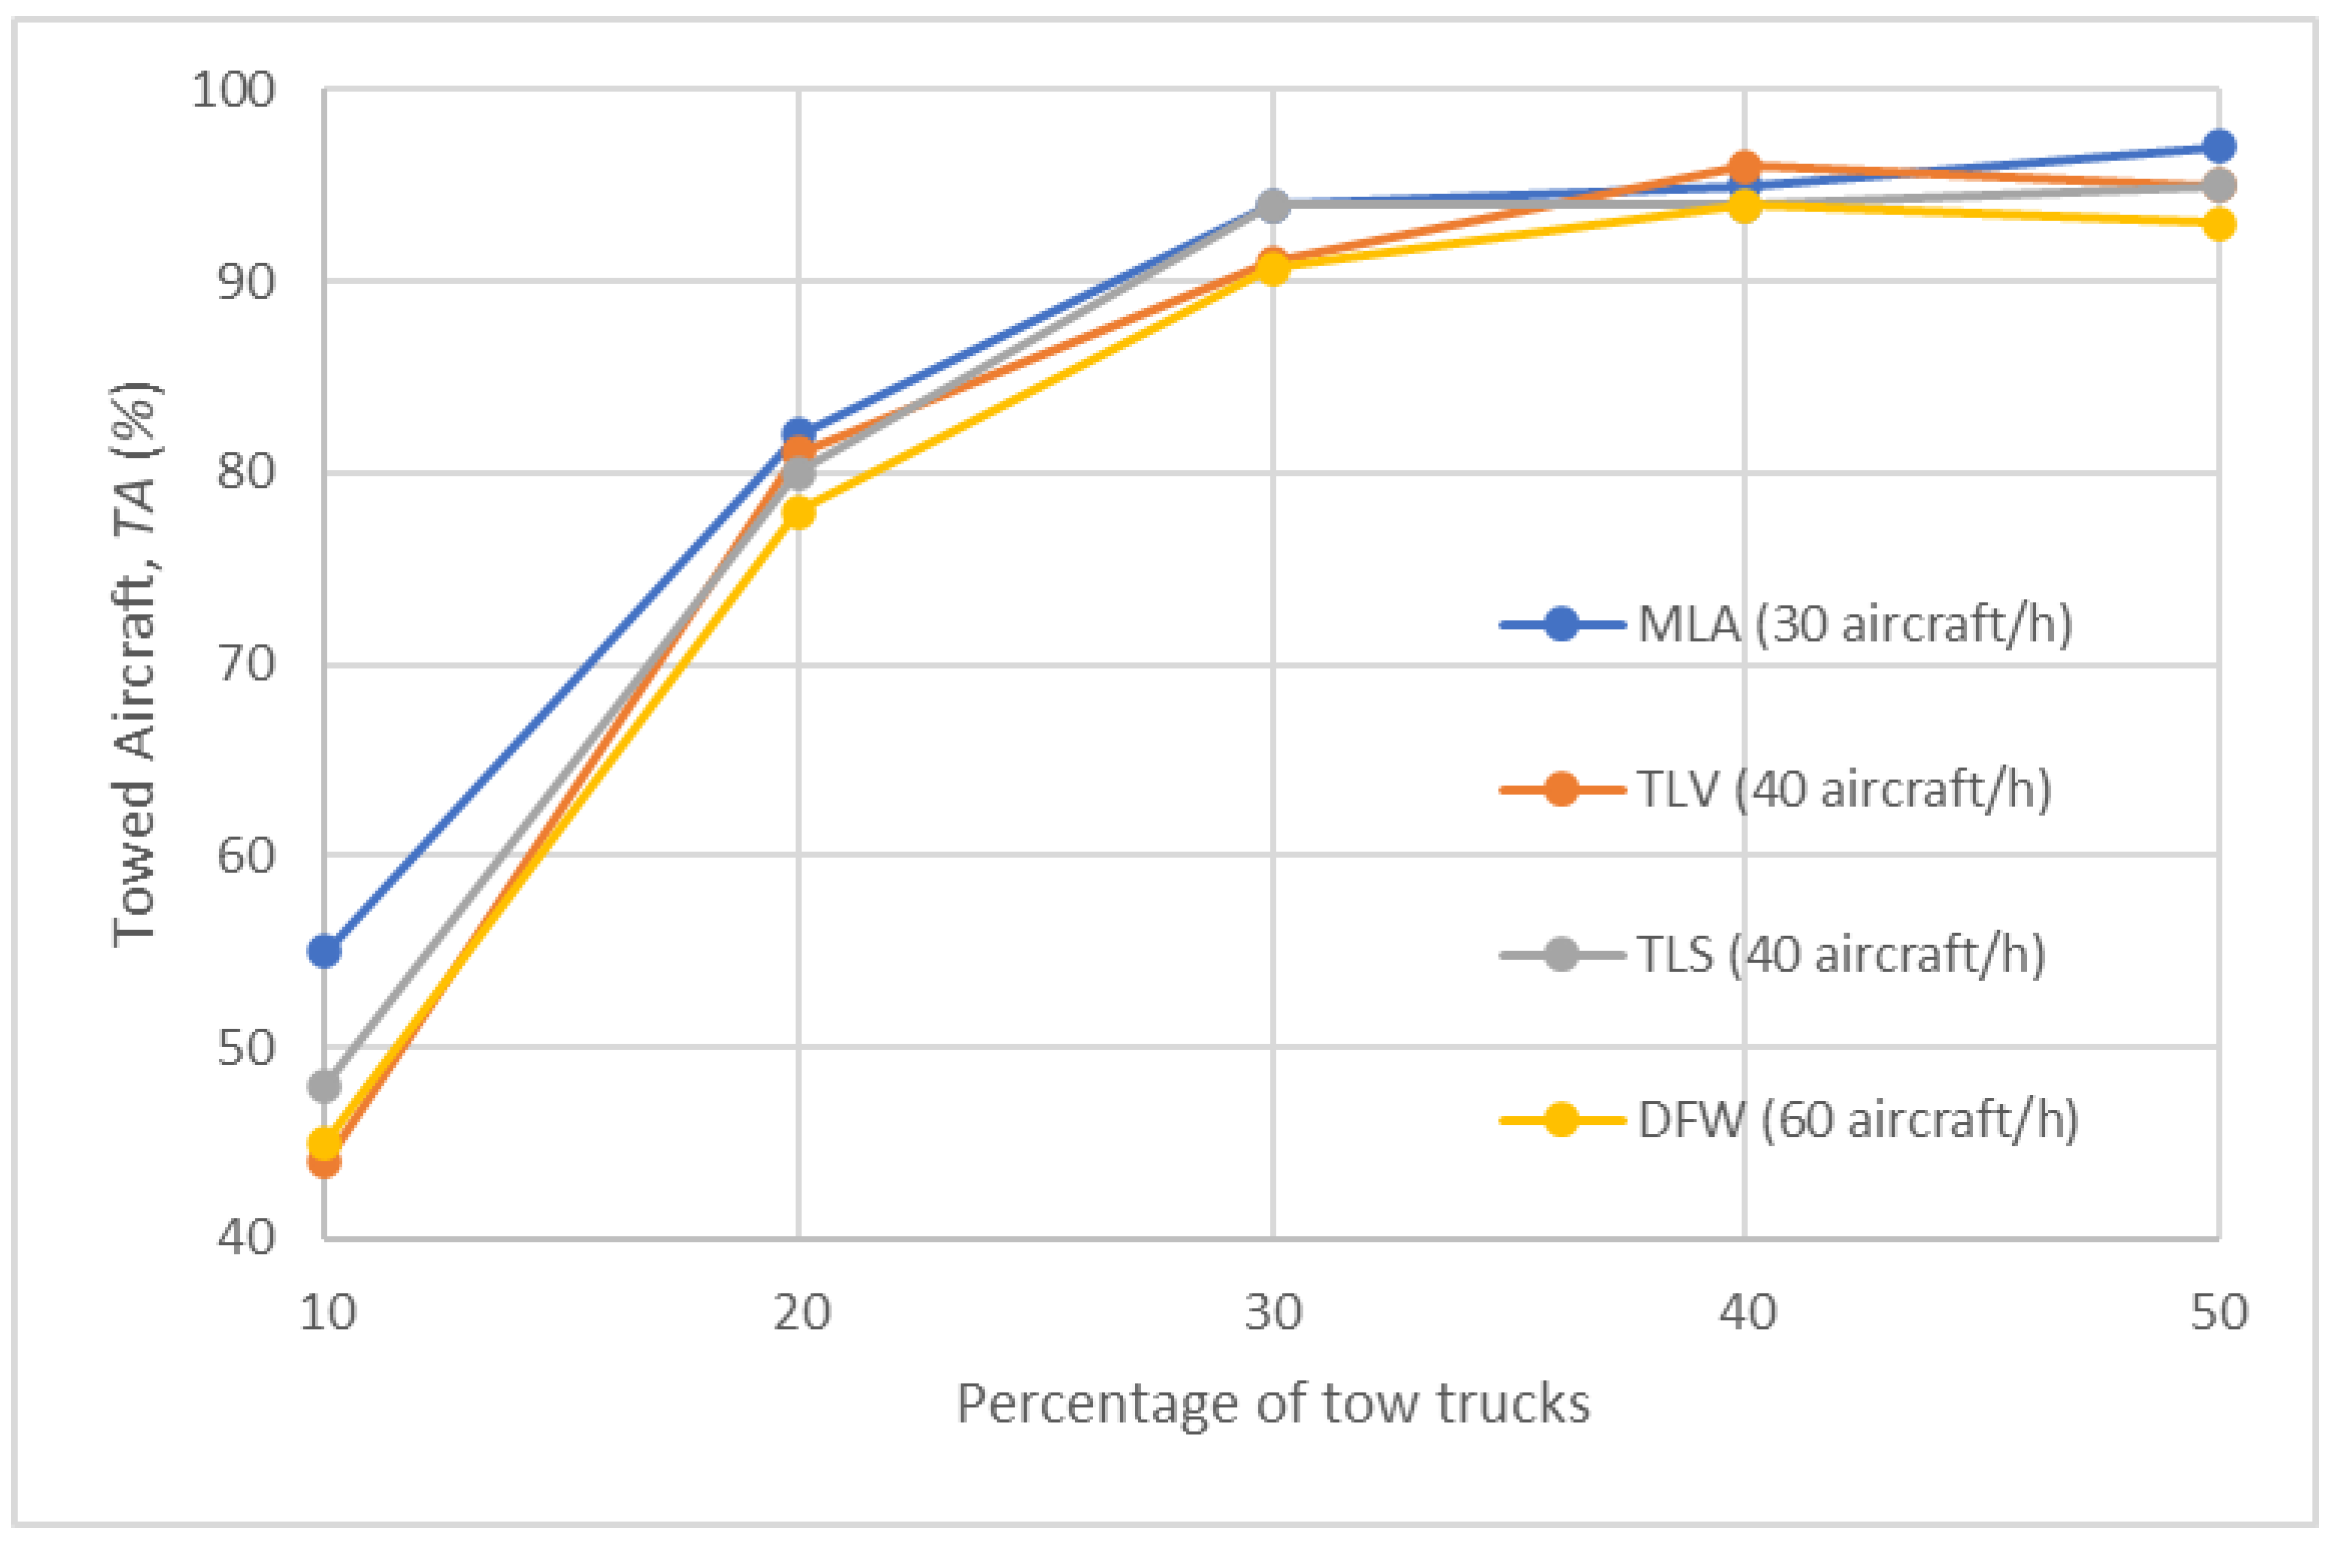
T A towed aircraft (%)
Δ F s a v g 
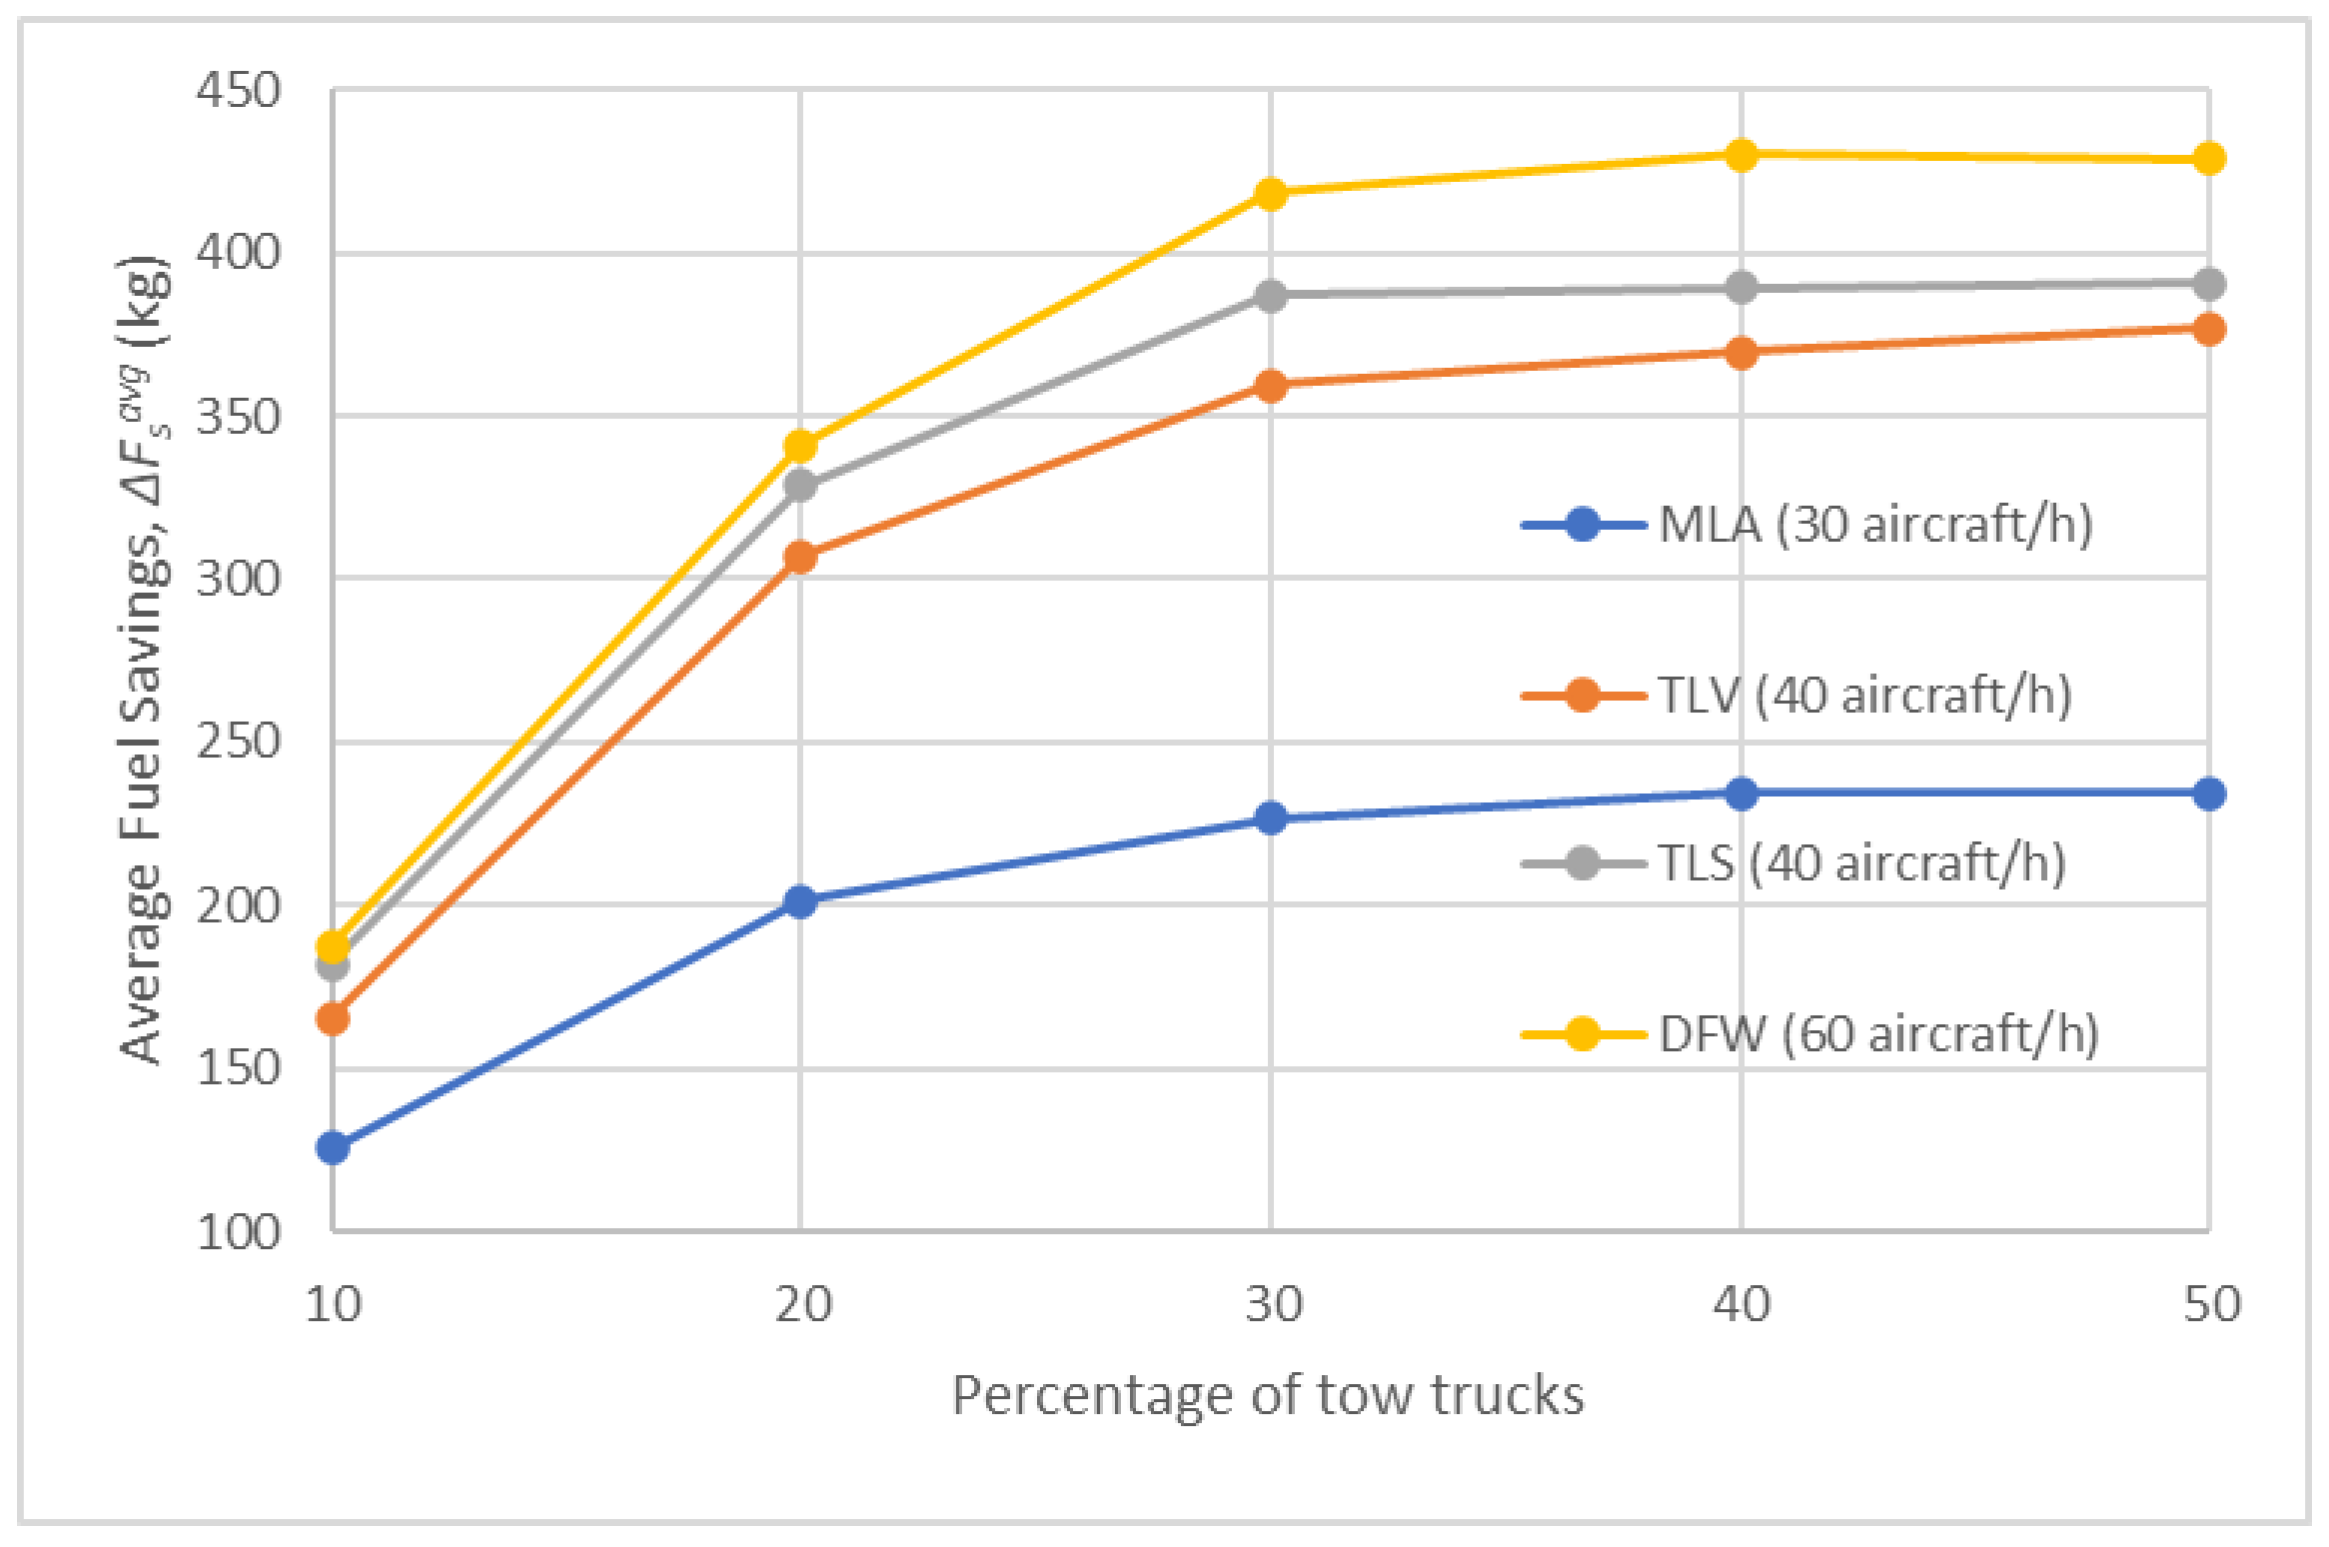
average fuel savings (kg)
Δ t r u a v g 
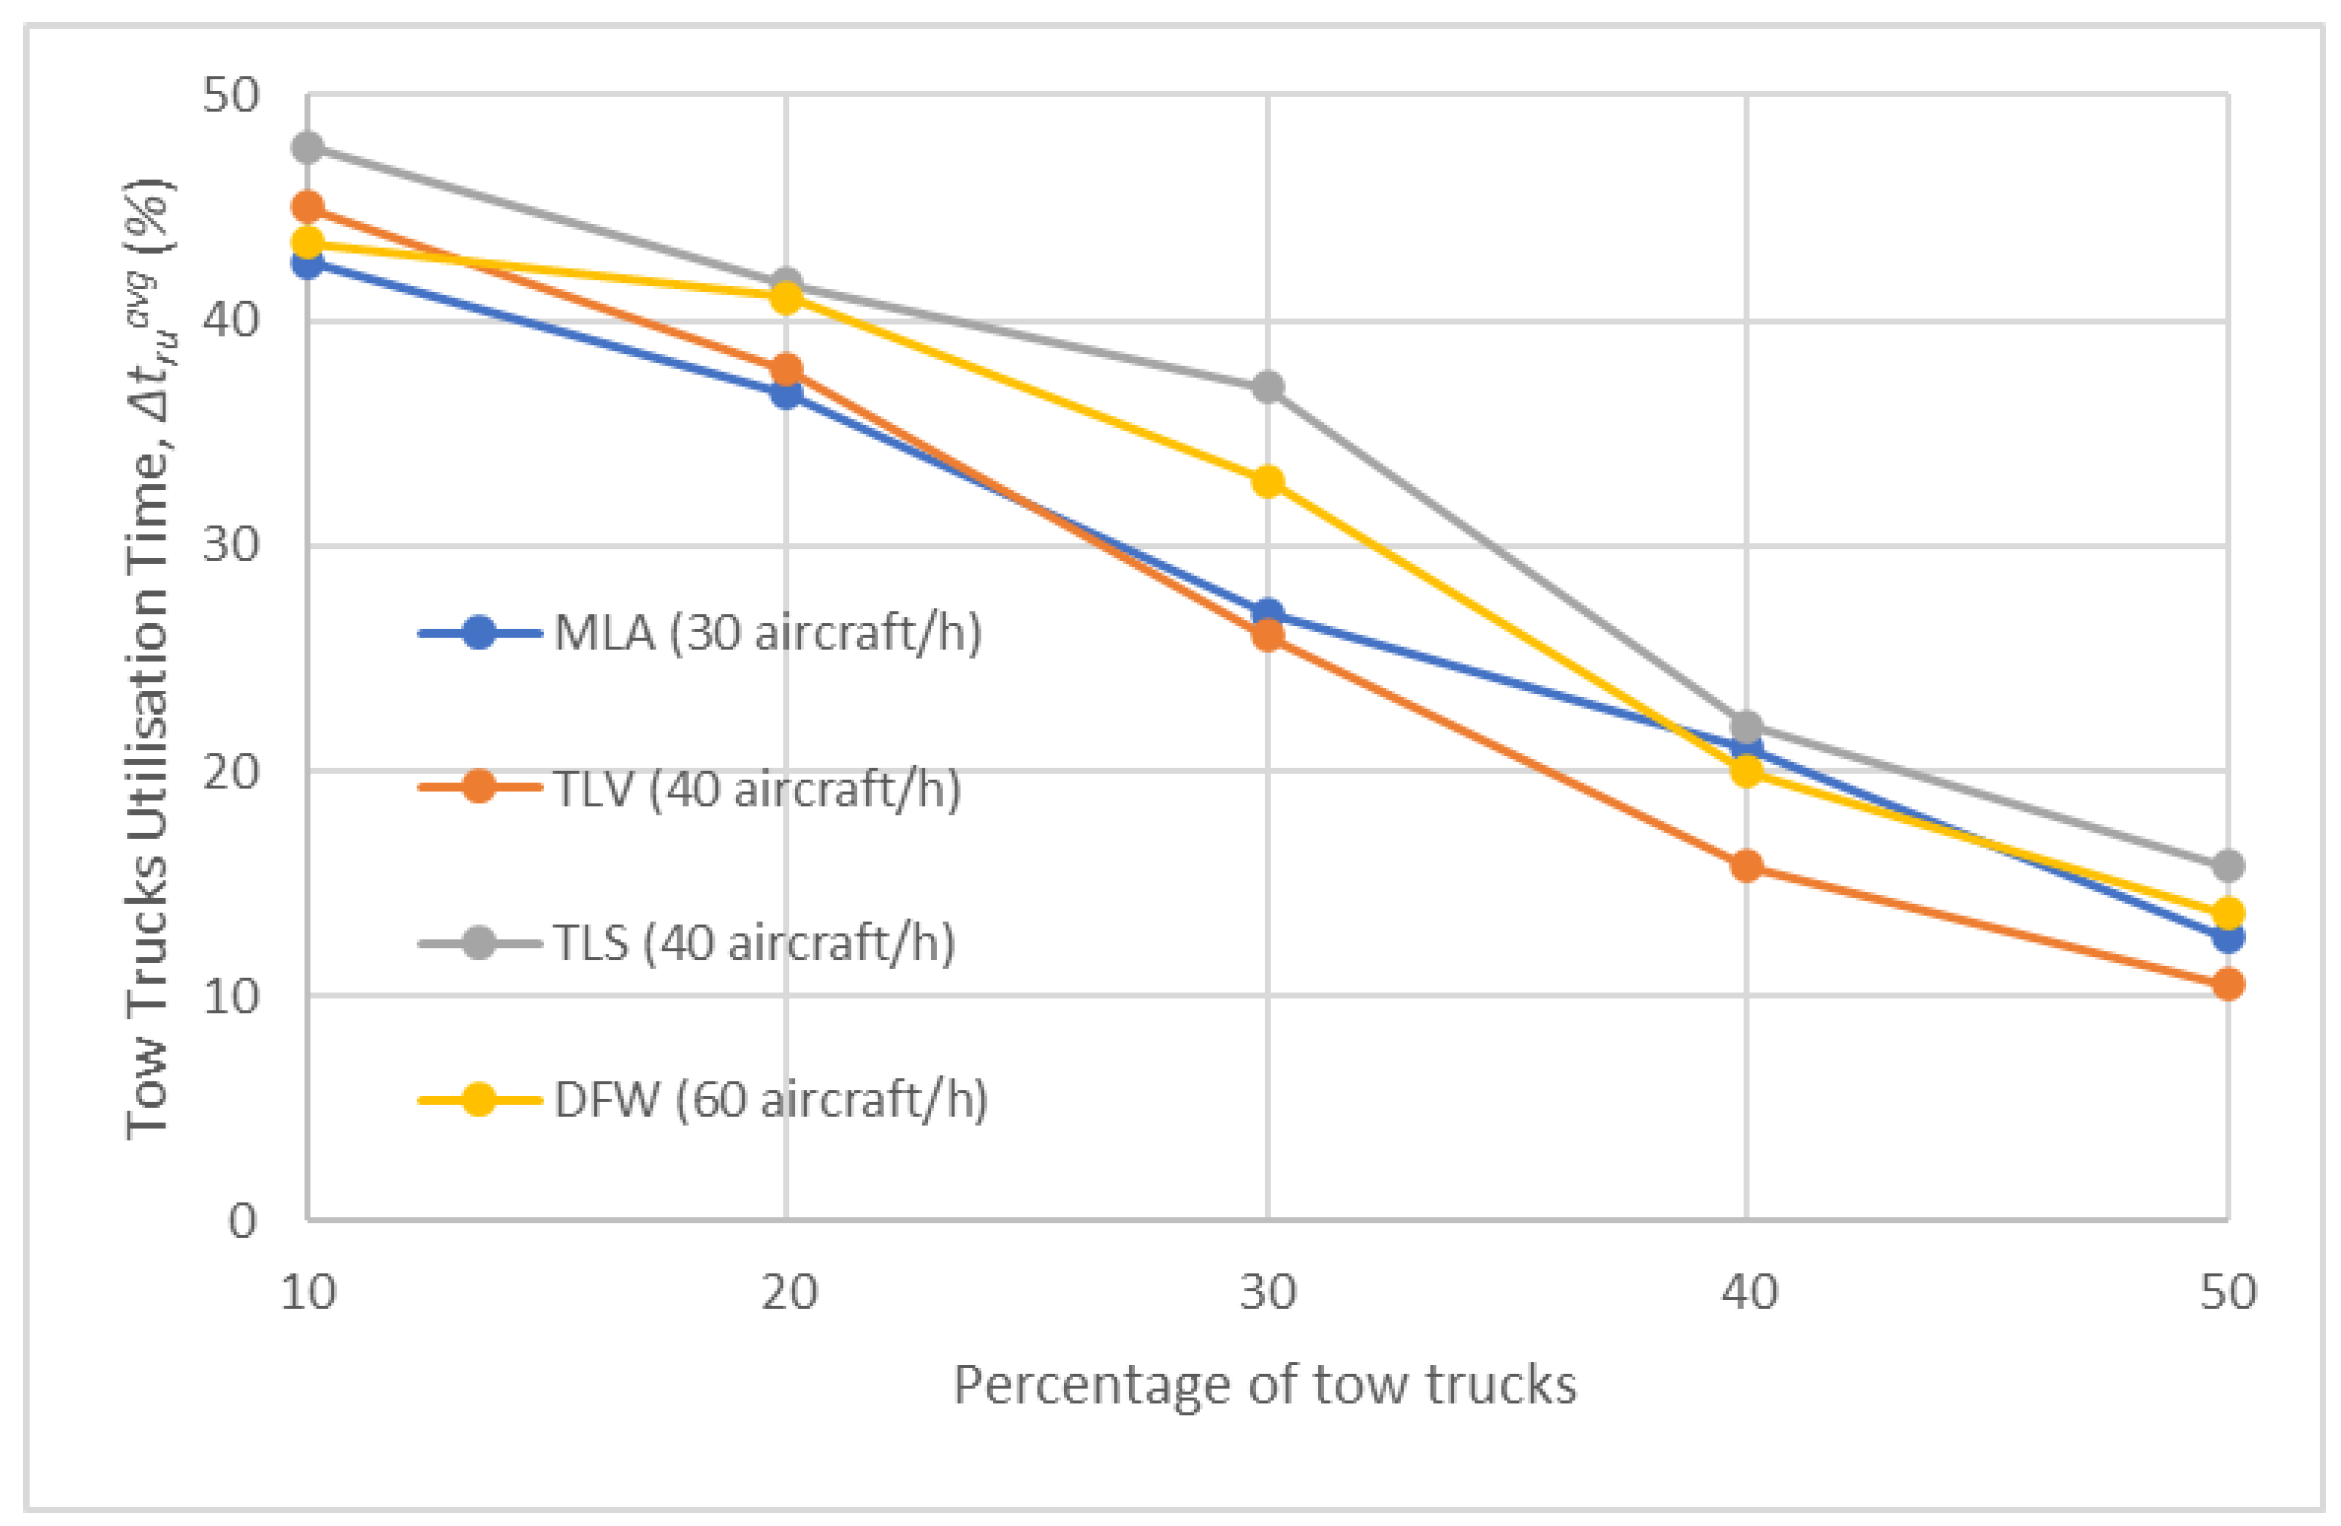
average tow truck utilisation time (%)

References

  1. www.eurocontrol.int. Eurocontrol, 10 March 2023. Available online: https://www.eurocontrol.int/publication/eurocontrol-data-snapshot-40-taxi-times#:~:text=Typically%2C%20flying%20from%20one%20of,time%20of%20over%2020%20minutes (accessed on 12 May 2023).
  2. Zhang, M.; Huang, Q.; Liu, S.; Li, H. Assessment Method of Fuel Consumption and Emissions of Aircraft during Taxiing on Airport Surface under Given Meteorological Conditions. Sustainability 2019, 11, 6110. [Google Scholar] [CrossRef]
  3. Nikoleris, T.; Gupta, G.; Kistler, M. Detailed estimation of fuel consumption and emissions during aircraft taxi operations at Dallas/Fort Worth International Airport. Transp. Res. Part D 2011, 16, 302–308. [Google Scholar] [CrossRef]
  4. Dzikus, N.; Fuchte, J.; Lau, A.; Gollnick, V. Potential for Fuel Reduction through Electric Taxiing. In Proceedings of the 11th AIAA Aviation Technology, Integration, and Operations (ATIO) Conference, Virginia Beach, VA, USA, 20–22 September 2011. [Google Scholar]
  5. Fleuti, E.; Maraini, S. Taxi-Emissions at Zurich Airport. 2017. Available online: https://www.flughafen-zuerich.ch//jssmedia/airport/portal/dokumente/das-unternehmen/politics-and-responsibility/environmental-protection/technische-berichte/2017_taxi_study_zurichairport.pdf?vs=1 (accessed on 15 March 2023).
  6. op.europa.eu. European Commission. 2011. Available online: https://op.europa.eu/en/publication-detail/-/publication/296a9bd7-fef9-4ae8-82c4-a21ff48be673 (accessed on 15 March 2023).
  7. ec.europa.eu. European Commission. 2020. Available online: https://ec.europa.eu/clima/policies/transport/aviation_en (accessed on 15 March 2023).
  8. www.iata.org. International Air Transport Association, December 2022. Available online: https://www.iata.org/en/iata-repository/pressroom/fact-sheets/fact-sheet---fuel/ (accessed on 4 April 2023).
  9. www.fitchratings.com. Fitch Ratings, 25 February 2022. Available online: https://www.fitchratings.com/research/corporate-finance/oil-price-shock-is-a-material-risk-for-us-european-airlines-25-02-2022 (accessed on 4 April 2023).
  10. www.statista.com. Statista. 2023. Available online: https://www.statista.com/statistics/591285/aviation-industry-fuel-cost/ (accessed on 4 April 2023).
  11. WheelTug. Available online: https://www.wheeltug.com/ (accessed on 15 March 2023).
  12. tec.ieee.org. IEEE TRansportation Electrification Community, 2014. Available online: https://tec.ieee.org/newsletter/march-april-2014/electric-green-taxiing-system-egts-for-aircraft (accessed on 15 March 2023).
  13. TaxiBot. 2020. Available online: https://www.taxibot-international.com/ (accessed on 15 March 2023).
  14. Di Mascio, P.; Corazza, M.V.; Rosa, N.R.; Moretti, L. Optimization of Aircraft Taxiing Strategies to Reduce the Impacts of Landing and Take-Off Cycle at Airports. Sustainability 2022, 14, 9692. [Google Scholar] [CrossRef]
  15. Abreu, P.H.; Oliveira, E. Comparing a Centralized and Decentralized Multi-Agent Approaches to Air Traffic Control. In Proceedings of the 28th European Simulation and Modelling Conference, Porto, Portugal, 22–24 October 2014. [Google Scholar]
  16. Chiang, Y.J.; Klotowski, J.T.; Lee, C.; Mitchell, J.S.B. Geometric algorithms for conflict detection/resolution in air traffic management. In Proceedings of the 36th IEEE Conference on Decision and Control, San Diego, CA, USA, 12 December 1997. [Google Scholar]
  17. Wang, X.; Peng, H.; Liu, J.; Dong, X.; Zhao, X.; Lu, C. Optimal control based coordinated taxiing path planning and tracking for multiple carrier aircraft on flight deck. Def. Technol. 2022, 18, 238–248. [Google Scholar] [CrossRef]
  18. Udluft, H. Decentralization in Air Transportation. Ph.D. Thesis, Delft University of Technology, Delft, The Netherlands, 2017. [Google Scholar]
  19. Gawrilow, E.; Köhler, E.; Möhring, R.H.; Stenzel, B. Dynamic Routing of Automated Guided Vehicles in Real-Time; Institut für Mathematik, Technische Universität Berlin: Berlin, Germany, 2007. [Google Scholar]
  20. Ibrahim, M.F.; Bakar, A.Z.A.; Hussain, A. Genetic Algorithm-Based Robot Path Planning; Department of Electrical, Electronics and Systems Engineering, Universiti Kebangsaan Malaysia: Bangi, Selangor, Malaysia, 2009. [Google Scholar]
  21. Zhang, M.; Huang, Q.; Li, H. Multi-Objective Optimization of Aircraft Taxiing on the Airport Surface with Consideration to Taxiing Conflicts and the Airport Environment. Sustainability 2019, 11, 6728. [Google Scholar] [CrossRef]
  22. Morris, R.; Chang, M.L.; Archer, R.; Cross, E.V.I.; Thompson, S.; Franke, J.L.; Garrett, R.C.; Malik, W.; McGuire, K.; Hermann, G. Self-Driving Aircraft Towing Vehicles: A Preliminary Report. In Proceedings of the Workshops at the Twenty-Ninth AAAI Conference on Artificial Intelligence, Austin, TX, USA, 25–30 January 2015. [Google Scholar]
  23. Morris, R.; Chang, M.L.; Archer, R.; Cross, E.V., II; Thompson, S.; Franke, J.; Garrett, R.C.; Pasareanu, C.; Malik, W.; Hemann, G. SafeTug Semi-Autonomous Aircraft Towing Vehicles; NASA: Washington, DC, USA, 2016. [Google Scholar]
  24. Montoya, J.; Wood, Z.; Rathinam, S.; Malik, W. A Mixed Integer Linear Program for Solving a Multiple Route Taxi Scheduling Problem. In Proceedings of the AIAA Guidance, Navigation, and Control Conference, Toronto, ON, Canada, 2–5 August 2010. [Google Scholar]
  25. Du, J.Y.; Brunner, J.O.; Kolisch, R. Planning towing processes at airports more efficiently. Transp. Res. Part E Logist. Transp. Rev. 2014, 70, 293–304. [Google Scholar] [CrossRef]
  26. Ahmadi, S.; Akgunduz, A. Airport operations with electric-powered towing alternatives under stochastic conditions. J. Air Transp. Manag. 2023, 109, 102392. [Google Scholar] [CrossRef]
  27. van Oosterom, S.; Mitici, M.; Hoekstra, J. Dispatching a fleet of electric towing vehicles for aircraft taxiing with conflict avoidance and efficient battery charging. Transp. Res. Part C 2023, 147, 103995. [Google Scholar] [CrossRef]
  28. Zoutendijk, M.; van Oosterom, S.J.; Mitici, M. Electric Taxiing with Disruption Management: Assignment of Electric Towing Vehicles to Aircraft. In Proceedings of the AIAA Aviation 2023 Forum, San Diego, CA, USA, 12–16 June 2023. [Google Scholar]
  29. Adacher, L.; Flamini, M.; Romano, E. Rerouting Algorithms Solving the Air Traffic Congestion; Università Degli Studi Roma Tre: Rome, Italy, 2017. [Google Scholar]
  30. Li, L.; Jiawei, G. Research on aircraft taxiing path optimization based on digraph model and Dijkstra algorithm. In Proceedings of the IOP Conference Series Materials Science and Engineering, Xi’an, China, 8–11 October 2020. [Google Scholar]
  31. Jordan, R.; Ishutkina, M.A.; Reynolds, T.G. A Statistical Learning Approach to the Modeling of Aircraft Taxi TIme. In Proceedings of the Digital Avionics Systems Conference, Salt Lake City, UT, USA, 3–7 October 2010. [Google Scholar]
  32. Yang, L.; Yin, S.; Han, K.; Haddad, J.; Hu, M. Fundamental diagrams of airport surface traffic: Models and applications. Transp. Res. Part B Methodol. 2017, 106, 29–51. [Google Scholar] [CrossRef]
  33. Khadilkar, H.; Balakrishnan, H. Estimation of Aircraft Taxi-out Fuel Burn using Flight Data Recorder Archives. Transp. Res. Part D Transp. Environ. 2012, 17, 532–537. [Google Scholar] [CrossRef]
  34. ACI World. Airports Council International, 2022. Available online: https://aci.aero/2022/04/11/the-top-10-busiest-airports-in-the-world-revealed/ (accessed on 27 April 2023).
Figure 1. Control flow of the algorithm.
Aerospace 11 00307 g001
Figure 2. Directed graph for Malta International Airport (MLA) superimposed on MLA graphical representation. The thickness of the lines represents the runways (thickest), taxiways (medium thickness) and service roads (thinnest). The blue nodes represent the aircraft stands, the red nodes mark the ToPs/LEPs and the yellow nodes show the position of the tow truck depots.
Aerospace 11 00307 g002
Figure 3. Average total delay, Δtdtotavg (%), in Test Scenario 1.
Aerospace 11 00307 g003
Figure 4. Delayed aircraft, DA (%), in Test Scenario 1.
Aerospace 11 00307 g004
Figure 5. Towed aircraft, TA (%), in Test Scenario 2.
Aerospace 11 00307 g005
Figure 6. Average fuel savings, ΔFsavg (kg), in Test Scenario 2.
Aerospace 11 00307 g006
Figure 7. Tow truck utilisation time, Δtruavg (%), in Test Scenario 2.
Aerospace 11 00307 g007
Figure 8. Towed aircraft, TA (%), in Test Scenario 3.
Aerospace 11 00307 g008
Figure 9. Average fuel savings, ΔFsavg (kg), in Test Scenario 3.
Aerospace 11 00307 g009
Figure 10. Average total time delay, Δtdtotavg (s), in Test Scenario 3.
Aerospace 11 00307 g010
Figure 11. Tow truck utilisation time, Δtruavg (%), in Test Scenario 3.
Aerospace 11 00307 g011
Figure 12. Towed aircraft, TA (%), in Test Scenario 4.
Aerospace 11 00307 g012
Figure 13. Average fuel savings, ΔFsavg (kg), in Test Scenario 4.
Aerospace 11 00307 g013
Figure 14. Tow truck utilisation time, Δtruavg (%), in Test Scenario 4.
Aerospace 11 00307 g014
Figure 15. Towed aircraft, TA (%), in Test Scenario 5.
Aerospace 11 00307 g015
Figure 16. Average fuel savings, ΔFsavg (kg), in Test Scenario 5.
Aerospace 11 00307 g016
Figure 17. Average total time delay, Δtdtotavg (s), in Test Scenario 5.
Aerospace 11 00307 g017
Figure 18. Tow truck utilisation time, Δtruavg (%), in Test Scenario 5.
Aerospace 11 00307 g018
Figure 19. Towed aircraft, TA (%), in Test Scenarios 2–5.
Aerospace 11 00307 g019
Figure 20. Average fuel savings, ΔFsavg (kg), in Test Scenarios 2–5.
Aerospace 11 00307 g020
Figure 21. Tow truck utilisation time, Δtruavg (%), in Test Scenarios 2–5.
Aerospace 11 00307 g021
Table 1. Overview of the test scenarios.
Test
Scenario
DescriptionNumber of Simulations
1No tow trucks66
2Tow trucks with Static Allocation and Time-Wise Approach210
3Tow trucks with Static Allocation and Fuel-Wise Approach210
4Tow trucks with Dynamic Allocation and Time-Wise Approach210
5Tow trucks with Dynamic Allocation and Fuel-Wise Approach210
6Modelling different battery discharge rates
with Dynamic Allocation and Time-Wise Approach
7
Table 2. Relationship between tow truck performance and battery performance in Test Scenario 6.
Discharge Rates Percentage Variation
(%/min)
rbdh
(%/min)
rbdl
(%/min)
TA
(%)
ΔFsavg
(kg)
Δtruavg
(%)
−0.751.250.258533745
−0.501.500.508332944
−0.251.750.758232542
02.001.007831540
+0.252.251.257530539
+0.502.501.507228837
+0.752.751.756525831
+1.003.002.005522127
Disclaimer/Publisher’s Note: The statements, opinions and data contained in all publications are solely those of the individual author(s) and contributor(s) and not of MDPI and/or the editor(s). MDPI and/or the editor(s) disclaim responsibility for any injury to people or property resulting from any ideas, methods, instructions or products referred to in the content.

