Article

Experimental Investigation of Lithium-Ion Batteries Thermal Runaway Propagation Consequences under Different Triggering Modes

1
Engineering Techniques Training Center, Civil Aviation University of China, Tianjin 300300, China
2
Key Laboratory of Technology and Equipment of Tianjin Urban Air Transportation System, Civil Aviation University of China, Tianjin 300300, China
3
College of Safety Science and Engineering, Civil Aviation University of China, Tianjin 300300, China
*
Author to whom correspondence should be addressed.
Aerospace 2024, 11(6), 438; https://doi.org/10.3390/aerospace11060438
Submission received: 18 April 2024 / Revised: 20 May 2024 / Accepted: 26 May 2024 / Published: 29 May 2024
(This article belongs to the Special Issue Electric Power Systems and Components for All-Electric Aircraft)

Abstract

:
In the stage of aircraft development and airworthiness verification, it is necessary to master the influence of lithium-ion battery (LIB) thermal runaway (TR) propagation. In this paper, the battery TR propagation behavior under different trigger positions and modes is studied experimentally, and the calculation and comparison are carried out from the parameters of real-time temperature, voltage, propagation speed, total energy released, and solid ejecta. When the two adjacent cells at the top corner, side, and center of the module are overheated, TR occurs at about 1000 s for the triggered cells, while the whole-overheating trigger mode takes a longer time. The latter’s transmission speed is extremely fast, spreading 2.67 cells per second on average. The heat generated by the solid ejecta of the whole-overheating trigger mode is 82,437 J, which is more destructive. The voltage of the triggered cell fluctuates abnormally in a precursor manner when the internal active substances in the cell undergo a self-generated thermal reaction. This work can provide a reference for the safety and economical design of system installations and the correct setting of airworthiness verification Method of Compliance (MoC) experiments to verify whether the aircraft can bear and contain the adverse effects caused by LIB TR.

1. Introduction

With the increasingly severe energy situation in the world, the development of green aviation has become a basic consensus, and “more electric aircraft (MEA)” and “all electric aircraft (AEA)” will be fully implemented [1,2,3,4]. According to the research of the National Aeronautics and Space Administration (NASA), electric aircraft can save energy by over 60% and reduce emissions by 90%. Electric aircraft will become the development trend and direction of aviation, especially the general aviation industry, in the new era [5,6]. At present, the development of electric aircraft is very active globally. The European VELIS Electro electric training aircraft achieved certification as a light sports aircraft in 2020. The airworthiness certification of the nine-seater eCaravan normal class aircraft is being carried out in the United States. The “Maxwell” X-57 electric aircraft developed by NASA has completed the high-voltage functional ground test. In May, 2022, Volocopter’s VoloConnect fixed-wing passenger aircraft in the United States completed its first flight. In July 2022, the electric vertical take-off and landing aircraft (eVTOL) of Joby Company of the United States formally applied to the United Kingdom to submit an airworthiness application. In September 2022, the “e-Sling” electric plane developed by the Federal Institute of Technology in Zurich, Switzerland completed its first flight. The China Navigation Research Institute RX1E series light sports aircraft was awarded the type certificate in 2020, and this year, the RX4E series normal aircraft is also undergoing model qualification examination. The EH-216 unmanned aerial vehicle (UAV) has obtained the first eVTOL airworthiness certificate globally. Xiaopeng Huitian, Volante Science and Technology, Shidi, and other aviation technology companies in China have also proposed development plans for electric aircraft. According to the General Aviation Manufacturers Association (GAMA) estimate, more than 30 electric aircraft will be awarded type certificates in the world before 2025 [7,8,9].
During the selection of electric aircraft energy storage power supply, the lithium-ion battery (LIB) has become the most promising high-efficiency secondary battery and the fastest-developing chemical energy storage device at present because of its advantages of high specific energy, low self-discharge, good cycle performance, no memory effect, and environmental protection [10,11,12,13]. However, whether aviation LIBs are used as backup power in traditional aircraft power supply systems or as propulsion energy in electric/hybrid aircraft, safety problems are of great concern. In October 2011, the fire of a CJ4 commercial airliner battery pack produced by the Cessna Aircraft Company prompted the FAA to ask Cessna to replace all 42 CJ4 LIBs with traditional nickel-cadmium batteries or lead-acid batteries. On 7 January 2013, after a B787 passenger plane of Japan Airlines flew to Boston, USA, the battery caught fire and the cabin smoked. On January 16th, the same year, a B787 passenger plane of All Nippon Airways had a battery failure, and smoke was emitted from the cockpit, forcing an emergency landing [14,15]. In January, 2020, the “Alice” electric plane developed by the Eviation Company was damaged by a LIB fire during a ground test. According to the research report of the Federal Aviation Administration (FAA), there were 265 accidents and unsafe incidents involving LIBs in the world during 20 March 1991 to 1 August 2019, and 28 incidents occurred since January 2019 [16]. The European Aviation Safety Agency (EASA) shows that even if the most reliable LIB cells are selected from the best suppliers and properly inspected and tested, the potential defects of the products cannot be completely avoided. The existence of these defects makes it possible for LIBs to run out of control due to many factors such as electricity, machinery, and environment [17,18,19].
It is worth noting that in the aircraft development stage, to design a safe and economical installation condition for the battery, it is first necessary to master the influence of the thermal runaway (TR) of the target LIB module, including temperature, propagation speed, and heat quantity, etc. In addition, in the airworthiness verification stage of the aircraft, in order to verify whether the aircraft can bear and contain the adverse effects after the failure of the battery pack under the condition of TR, it is also necessary to master the impact of the target LIB after TR, so as to benchmark the installation design conditions of the aircraft battery compartment [20]. The latest revision of RTCA DO-311A “Minimum Operational Performance Standards for Rechargeable Lithium Batteries and Battery Systems” by the American Radio Association describes two sets of different experimental methods for battery pack TR. One of them has been questioned by influential companies such as Boeing, Airbus, and SAFT, and the other alternative method has also not been recognized by the Federal Aviation Administration (FAA). MoC-3 SC-VTOL Propulsion Batteries Thermal Run Away, published by EASA in June 2023, also proposed a new alternative method, but it is reported that it has not been widely supported [21,22,23,24]. So far, the Civil Aviation Administration of China (CAAC) has also been continuously accelerating the development of aviation propulsion lithium battery airworthiness verification technology.
In recent years, there have been many related studies on LIB TR, which explain the TR behavior characteristics to some extent, but do not explain the differences of battery packs’ TR behavior under different triggering positions and modes. For example, one study [25] used a cone calorimeter under different incident heat fluxes to cause the cells to over-heat, and studied the characterization of behavior and hazards of fire and deflagration. Another study [26] revealed that an inner short circuit is the ultimate initiator of the fire. Reference [27] studied TR propagation due to its high complexity in unique low-pressure environments. Reference [28] conducted tests in a dynamic pressure chamber to study the effects of ambient pressure and heating power on TR characteristics. Reference [29] used a dynamic pressure chamber to study the effect of cycling aging and ambient pressure on the thermal safety features of LIBs.
In this paper, the representative 18,650 LIB was selected as the experimental object, and the TR behavior of two overheating trigger modes is analyzed. One mode is triggering two adjacent cells in different positions of the module, and the other one is overheating the whole module. The temperature change, voltage change, highest surface temperature, mass loss of a single cell, and the corresponding whole module energy release after TR are calculated and analyzed. The results of comparative analysis provide a reference for the evaluation of TR consequences, which can help the safety design of system installation conditions and the correct setting of airworthiness verification experiments to verify whether the aircraft can bear and contain the adverse effects caused by TR.

2. Construction of TR Trigger Experimental Platform

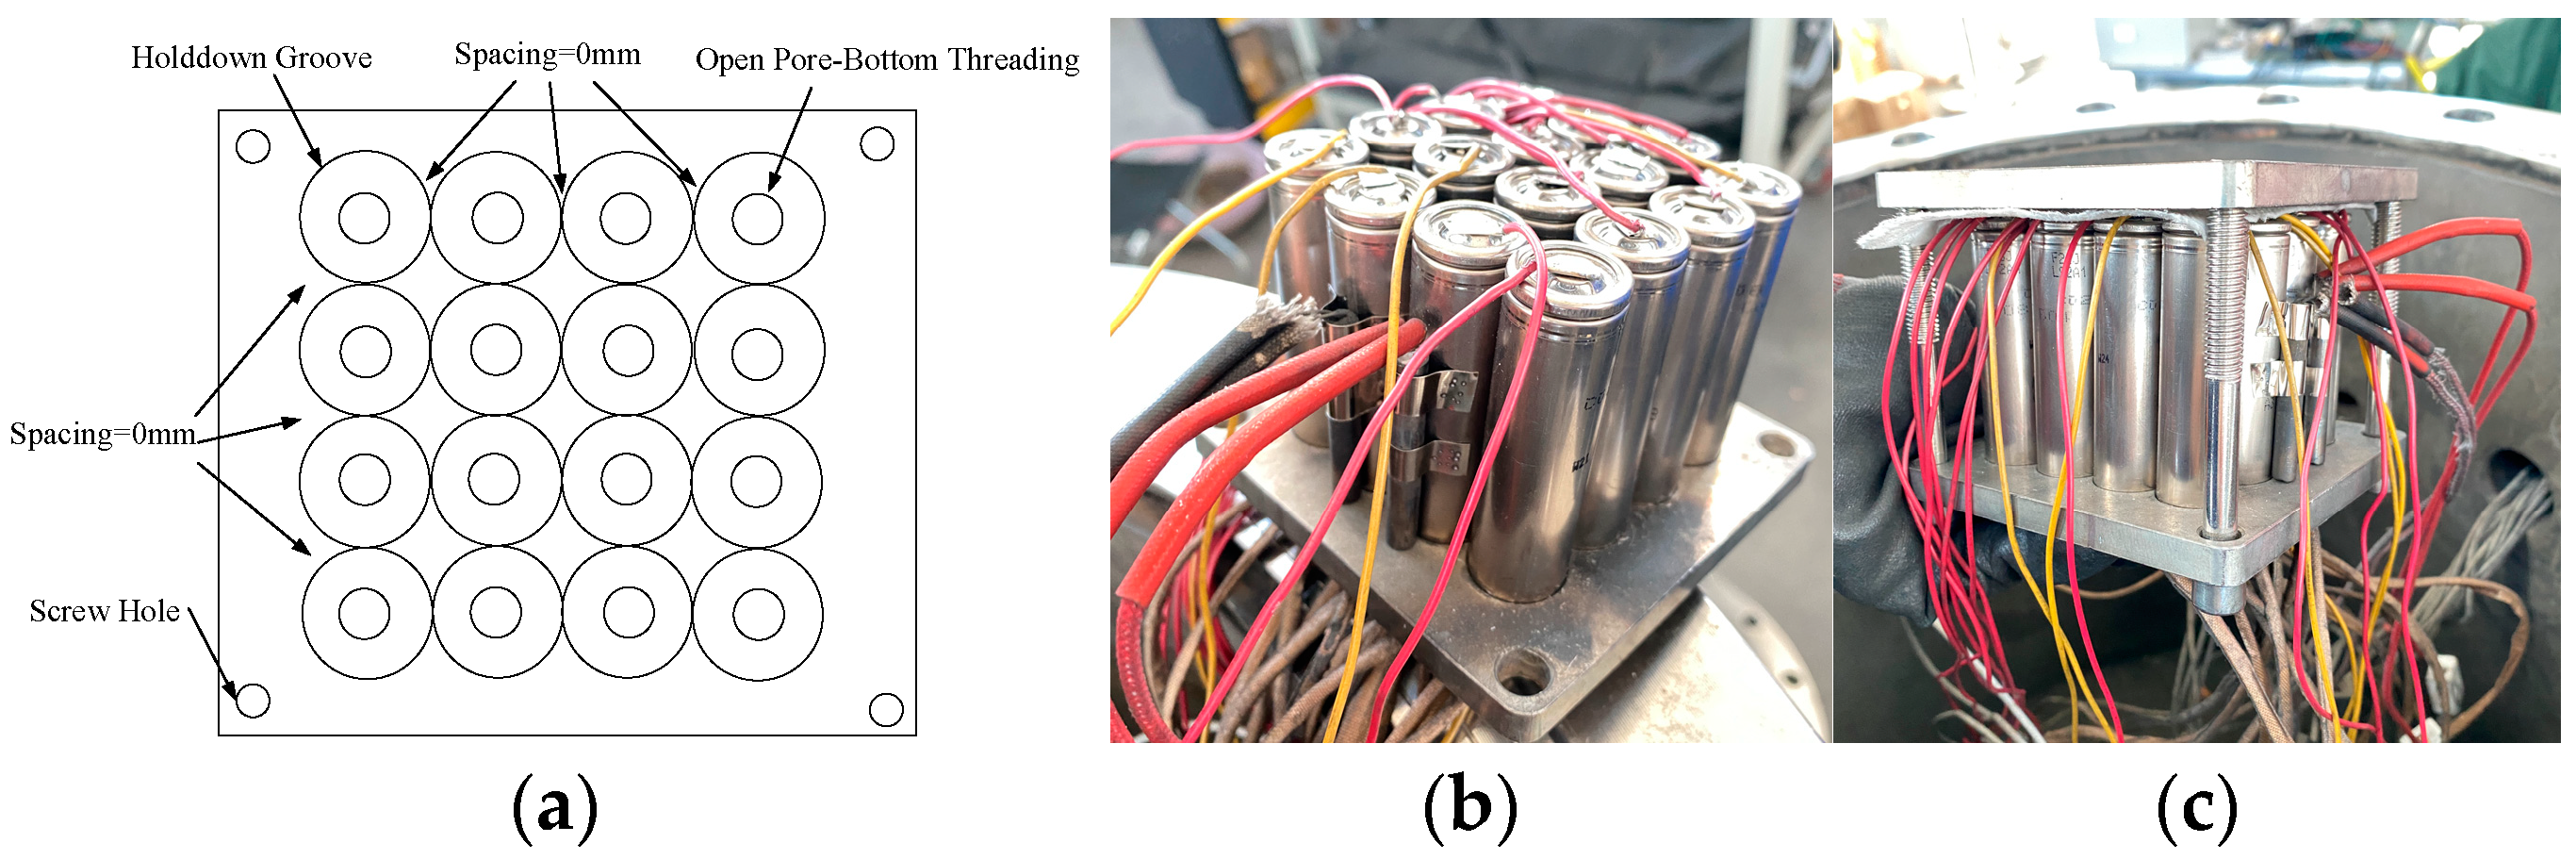
2.1. TR Reaction Chamber

A 60 L sealed experimental tank is used as the TR generating chamber, and a plurality of aviation plug interfaces are arranged around the tank, and the periphery is sealed. The circuit connection between the equipment and the tested parts is completed by aviation plugs, as depicted in Figure 1a. To ensure the safety of the TR experiment, the sealed tank is made of 1 cm stainless steel, as shown in Figure 1b.

2.2. LIB Material and Installation

The cell used in this work is the 18,650 26J lithium battery. The cathode material is lithium cobalt oxide, and the anode material is graphite. The electrolyte is composed of LiPF6 and organic solvents such as DMC, DEC, and EMC, etc. To investigate various representative triggering positions of the LIB module, this work selected 16 cells as a component and arranged them in a 4 × 4 array, so that cells in corner, side, and center positions can be selected. Other module architectures containing more cells can be regarded as the extension and combination of multiple 4 × 4 cells.
The installation of cells should consider spacing and heat transfer characteristics to maximize the potential for propagation of the other cells. Therefore, to characterize the most serious TR heat propagation, the cells are arranged in the closest way, as depicted in Figure 2a. Thus, the bottom plate with special size is customized as the base for installing the LIB unit, as shown in Figure 2b. According to previous research experience, if there are contents spraying out of a cell in large amounts during TR, it will take away more heat [30]. This situation means that the real scenario cannot be simulated. To prevent it from happening, a 2 cm thick stainless-steel plate is installed on the upper surface of the LIB module, and a layer of insulating fireproof cotton is placed between the LIB and the stainless-steel plate to prevent short circuits. Figure 2c illustrates how the upper and lower base plates are connected and fixed by four screws.

2.3. Experimental Setup

All the 16 cells are numbered in order from left to right and top to bottom. The cells were charged to 100% SOC before experiments. In this work, two kinds of trigger mode are used to test the LIB module TR. The first method is to select two adjacent cells in different positions as the trigger target of TR via overheating. We selected three different locations, namely corner, edge, and center of a side. Based on this consideration, the No. 1 and No. 2 cells representing the top corner position, No. 2 and No. 3 cells representing the side position, and No. 6 and No. 7 cells representing the center position are selected as trigger objects. Two heating rods or fins are attached to the target cells, and each of them is heated with a constant power of 100 W to trigger thermal runaway. The second method is to use a heating belt to wrap around the lithium battery module with a constant power of 200 W.
A thermocouple is mounted on the bottom of each cell to measure the temperature change of each cell in real time. The positive and negative poles of each cell are connected to wires separately to measure the voltage change of each cell in real time. The data logger is connected to the thermocouple and the other end of the wire to collect experimental data.

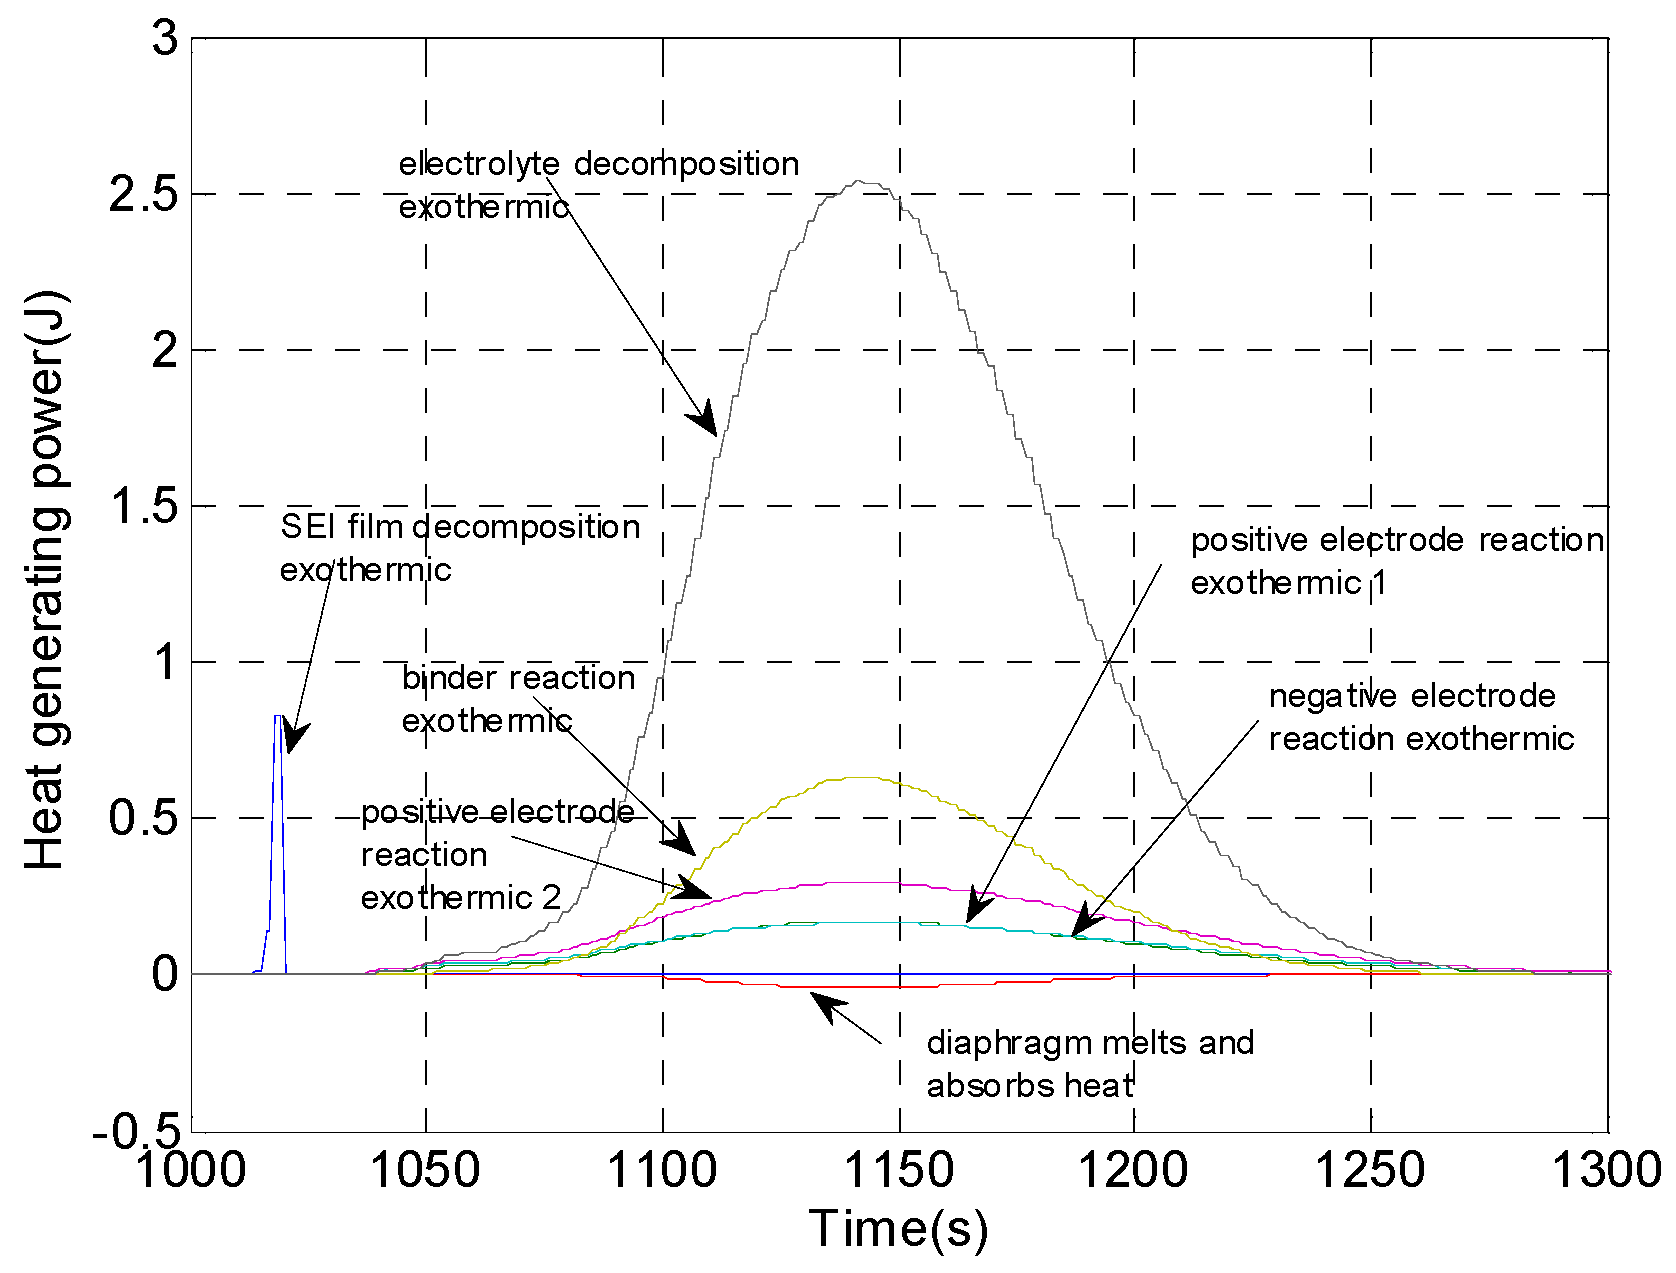
3. Calculation and Analysis of LIB TR Propagation

Because the active substances in the cell body are induced to a self-exothermic reaction under certain high-temperature conditions, the whole process undergoes several major processes, such as SEI film decomposition, negative electrode material and electrolyte solution reaction exothermic reaction, diaphragm melting and absorbing heat, positive electrode material and electrolyte solution exothermic reaction, binder exothermic reaction, and electrolyte decomposition exothermic reaction [31,32,33,34]. Among them, during the positive electrode material and electrolyte solution exothermic reaction, two exothermic reactions occurred in different temperature ranges, so two exothermic peaks appeared [35].
As the heat is released by successive reactions in each stage, the LIB temperature continues to rise. The self-generating heat process of LIBs follows the Arrhenius Law, and the calculation of reaction parameters in each stage can be expressed by Equations (1)–(3).
k 1 k 2 k 3 k 4 k 5 k 5 = A 1 A 2 A 3 A 4 A 5 A 6 T × e E a 1 / R T e E a 2 / R T e E a 3 / R T e E a 4 / R T e E a 5 / R T e E a 6 / R T × c 1 n 0 0 0 0 0 0 c 2 n 0 0 0 0 0 0 c 3 n 0 0 0 0 0 0 c 4 m ( 1 c 4 n ) 0 0 0 0 0 0 c 5 n 0 0 0 0 0 0 c 6 n × 1 0 0 0 0 0 0 e l / l r e f 0 0 0 0 0 0 1 0 0 0 0 0 0 1 0 0 0 0 0 0 1 0 0 0 0 0 0 1
q 1 q 2 q 3 q 4 q 5 q 6 = k 1 k 2 k 3 k 4 k 5 k 6 T × H 1 H 2 H 3 H 4 H 5 H 6 × m 1 0 0 0 0 0 0 m 2 0 0 0 0 0 0 m 3 0 0 0 0 0 0 m 4 0 0 0 0 0 0 m 5 0 0 0 0 0 0 m 6
q t o t a l = n = 1 6 q i
where the value of i is 1~6, which, respectively, represent six different stages, including SEI film decomposition, negative electrode and electrolyte solution reaction, binder reaction, positive electrode decomposition reaction, diaphragm decomposition reaction, and electrolyte decomposition reaction; k i is the reaction rate of each reaction stage; A i is the pre-exponential factor of each reaction stage; E a i is the activation energy of each reaction stage; R is the ideal gas constant; T is the real-time cell temperature; c i n is the normalized concentration of each reaction stage; l l r e f is the ratio of the regenerated thickness of SEI film to the initial thickness; q t o t a l represents the sum of chemical reaction heat of active substances in the cell; H i is the enthalpy of reaction of each reaction stage; q i represents the heat generation power of each reaction stage; the upper angle m and the upper angle n are the order of reaction.
The parameters in Equations (1)–(3) can be evaluated based on experience [36,37,38,39]. Temperature change becomes an important variable in the cell reaction kinetics equation and heat release equation. Figure 3 illustrates the thermal power generated at each stage of a single cell’s TR process.
The SEI film decomposition exothermic reaction occurs in the cell at 70 °C, and the cell begins to self-generate heat in stages [27]. With the continuous reaction and release of the activation energy inside the cell, each stage contributes a certain amount of heat generation driving force. When the time is about 1140 s, the electrolyte solution decomposition exothermic reaction, the binder exothermic reaction, and the cathode material decomposition reaction occur simultaneously to produce a large amount of heat, which makes the cell temperature rise sharply.
The chemical active material in the LIB can decompose or react under certain conditions and release heat power, which will lead to the self-sustained and uncontrollable temperature rise of the LIB and its spread to adjacent cells. This is the most undesirable failure mode in the onboard state. If improper protection conditions are installed, it may lead to aircraft failure or casualties.

4. Temperature Analyses of TR Triggered by Overheating Two Adjacent Cells

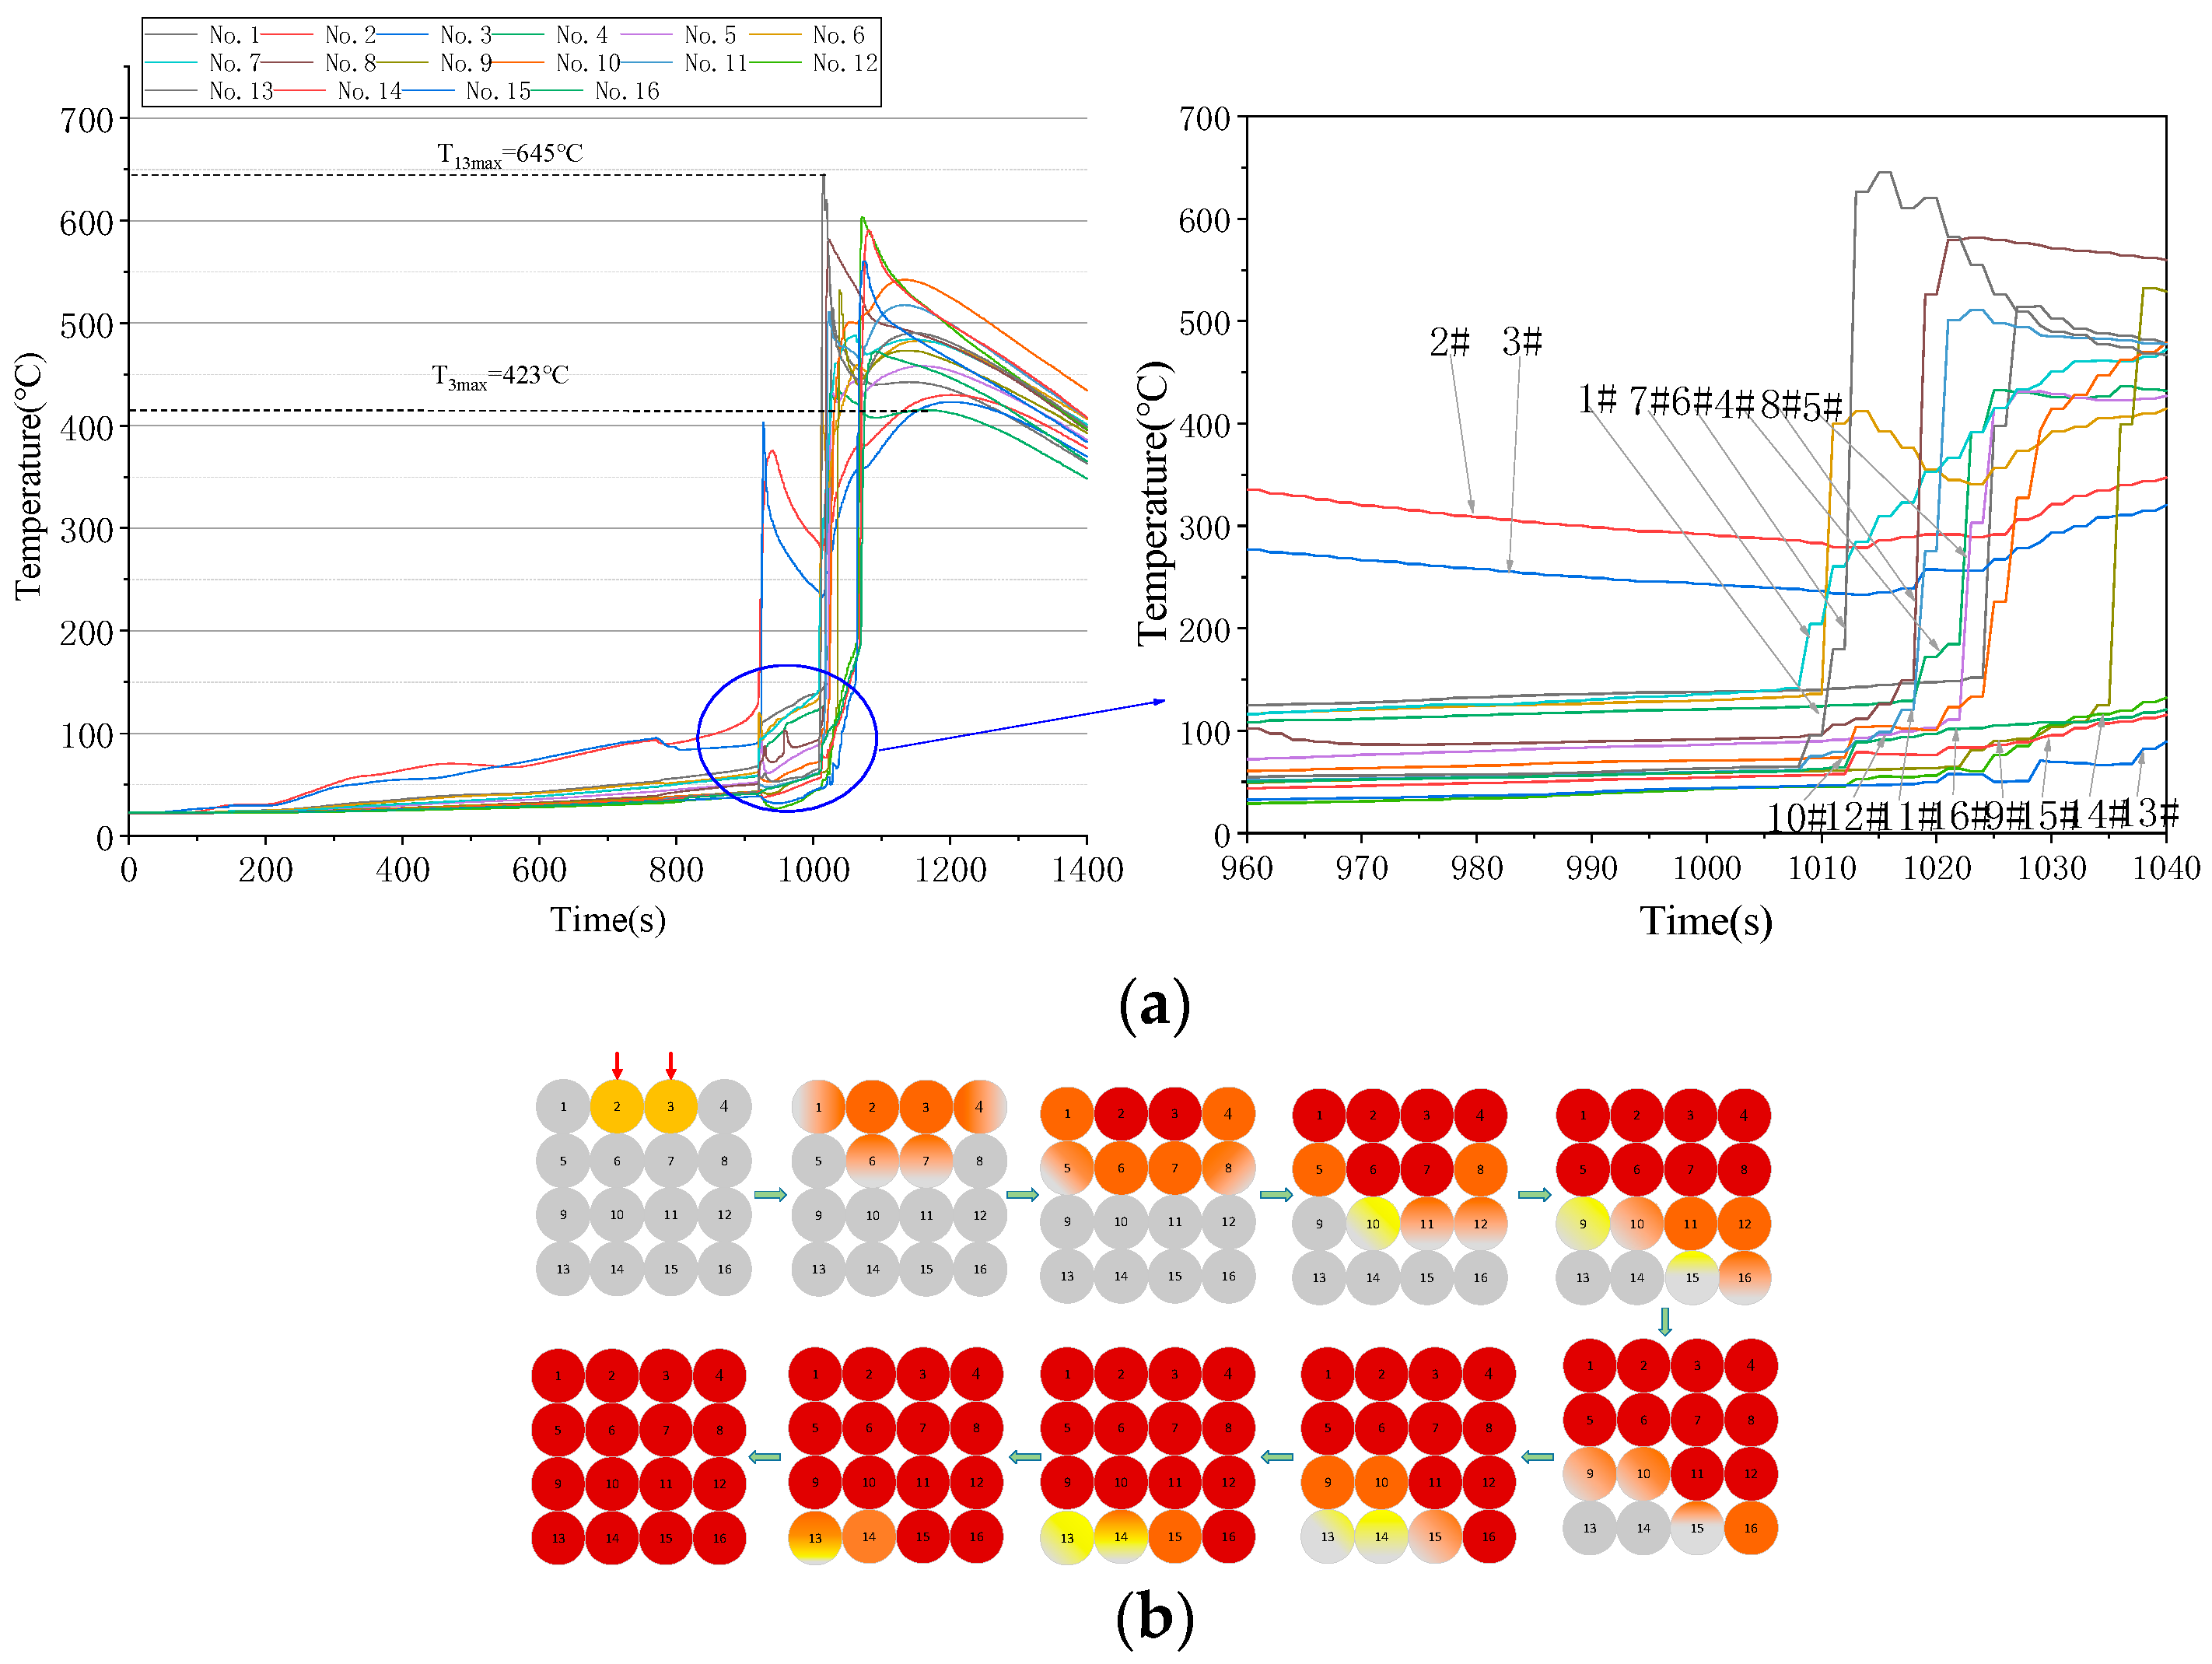
4.1. Trigger TR Simultaneously via Overheating Two Adjacent Cells at the Top Corner

The No. 1 and No. 2 cells represent the top corner position in the LIB module. If we overheat the No. 1 and No. 2 cells at the same time, Figure 4a illustrates the temperature change of each cell.
By the analyses in Figure 4a, all cells have entered the TR state, and the rising trend of temperature is basically the same. However, with the extension of the propagation path, the maximum surface temperature of the cell out of control gradually drops from 646 °C to about 424 °C. The cell with the highest temperature is not in the middle of the module but on the side edge of the module. The transmission diagram in Figure 4b intuitively reflects the TR transmission path after the battery cell at the corner of the LIB module is triggered, that is, the heat transmission path. It can be seen from Figure 4b that the TR propagation path is the outward extension of rays in a fixed direction.

4.2. Trigger TR Simultaneously via Overheating Two Adjacent Cells on the Side

The No. 2 and No. 3 two adjacent cells represent the side position in the LIB module. If we overheat the No. 2 and No. 3 adjacent cells at the same time, the temperature change curves of all cells are shown in Figure 5a.
By the analyses in Figure 5a, all cells have gone into the TR state after a certain period, but the TR is triggered from the side, and the time delay of outward propagation is obvious. The highest cell temperature is 645 °C of No. 13 cell, and this temperature appears in the late stage of TR propagation. In Figure 5b, the path of TR heat propagation is closer to the hierarchical advancing mode, which is triggered layer by layer.

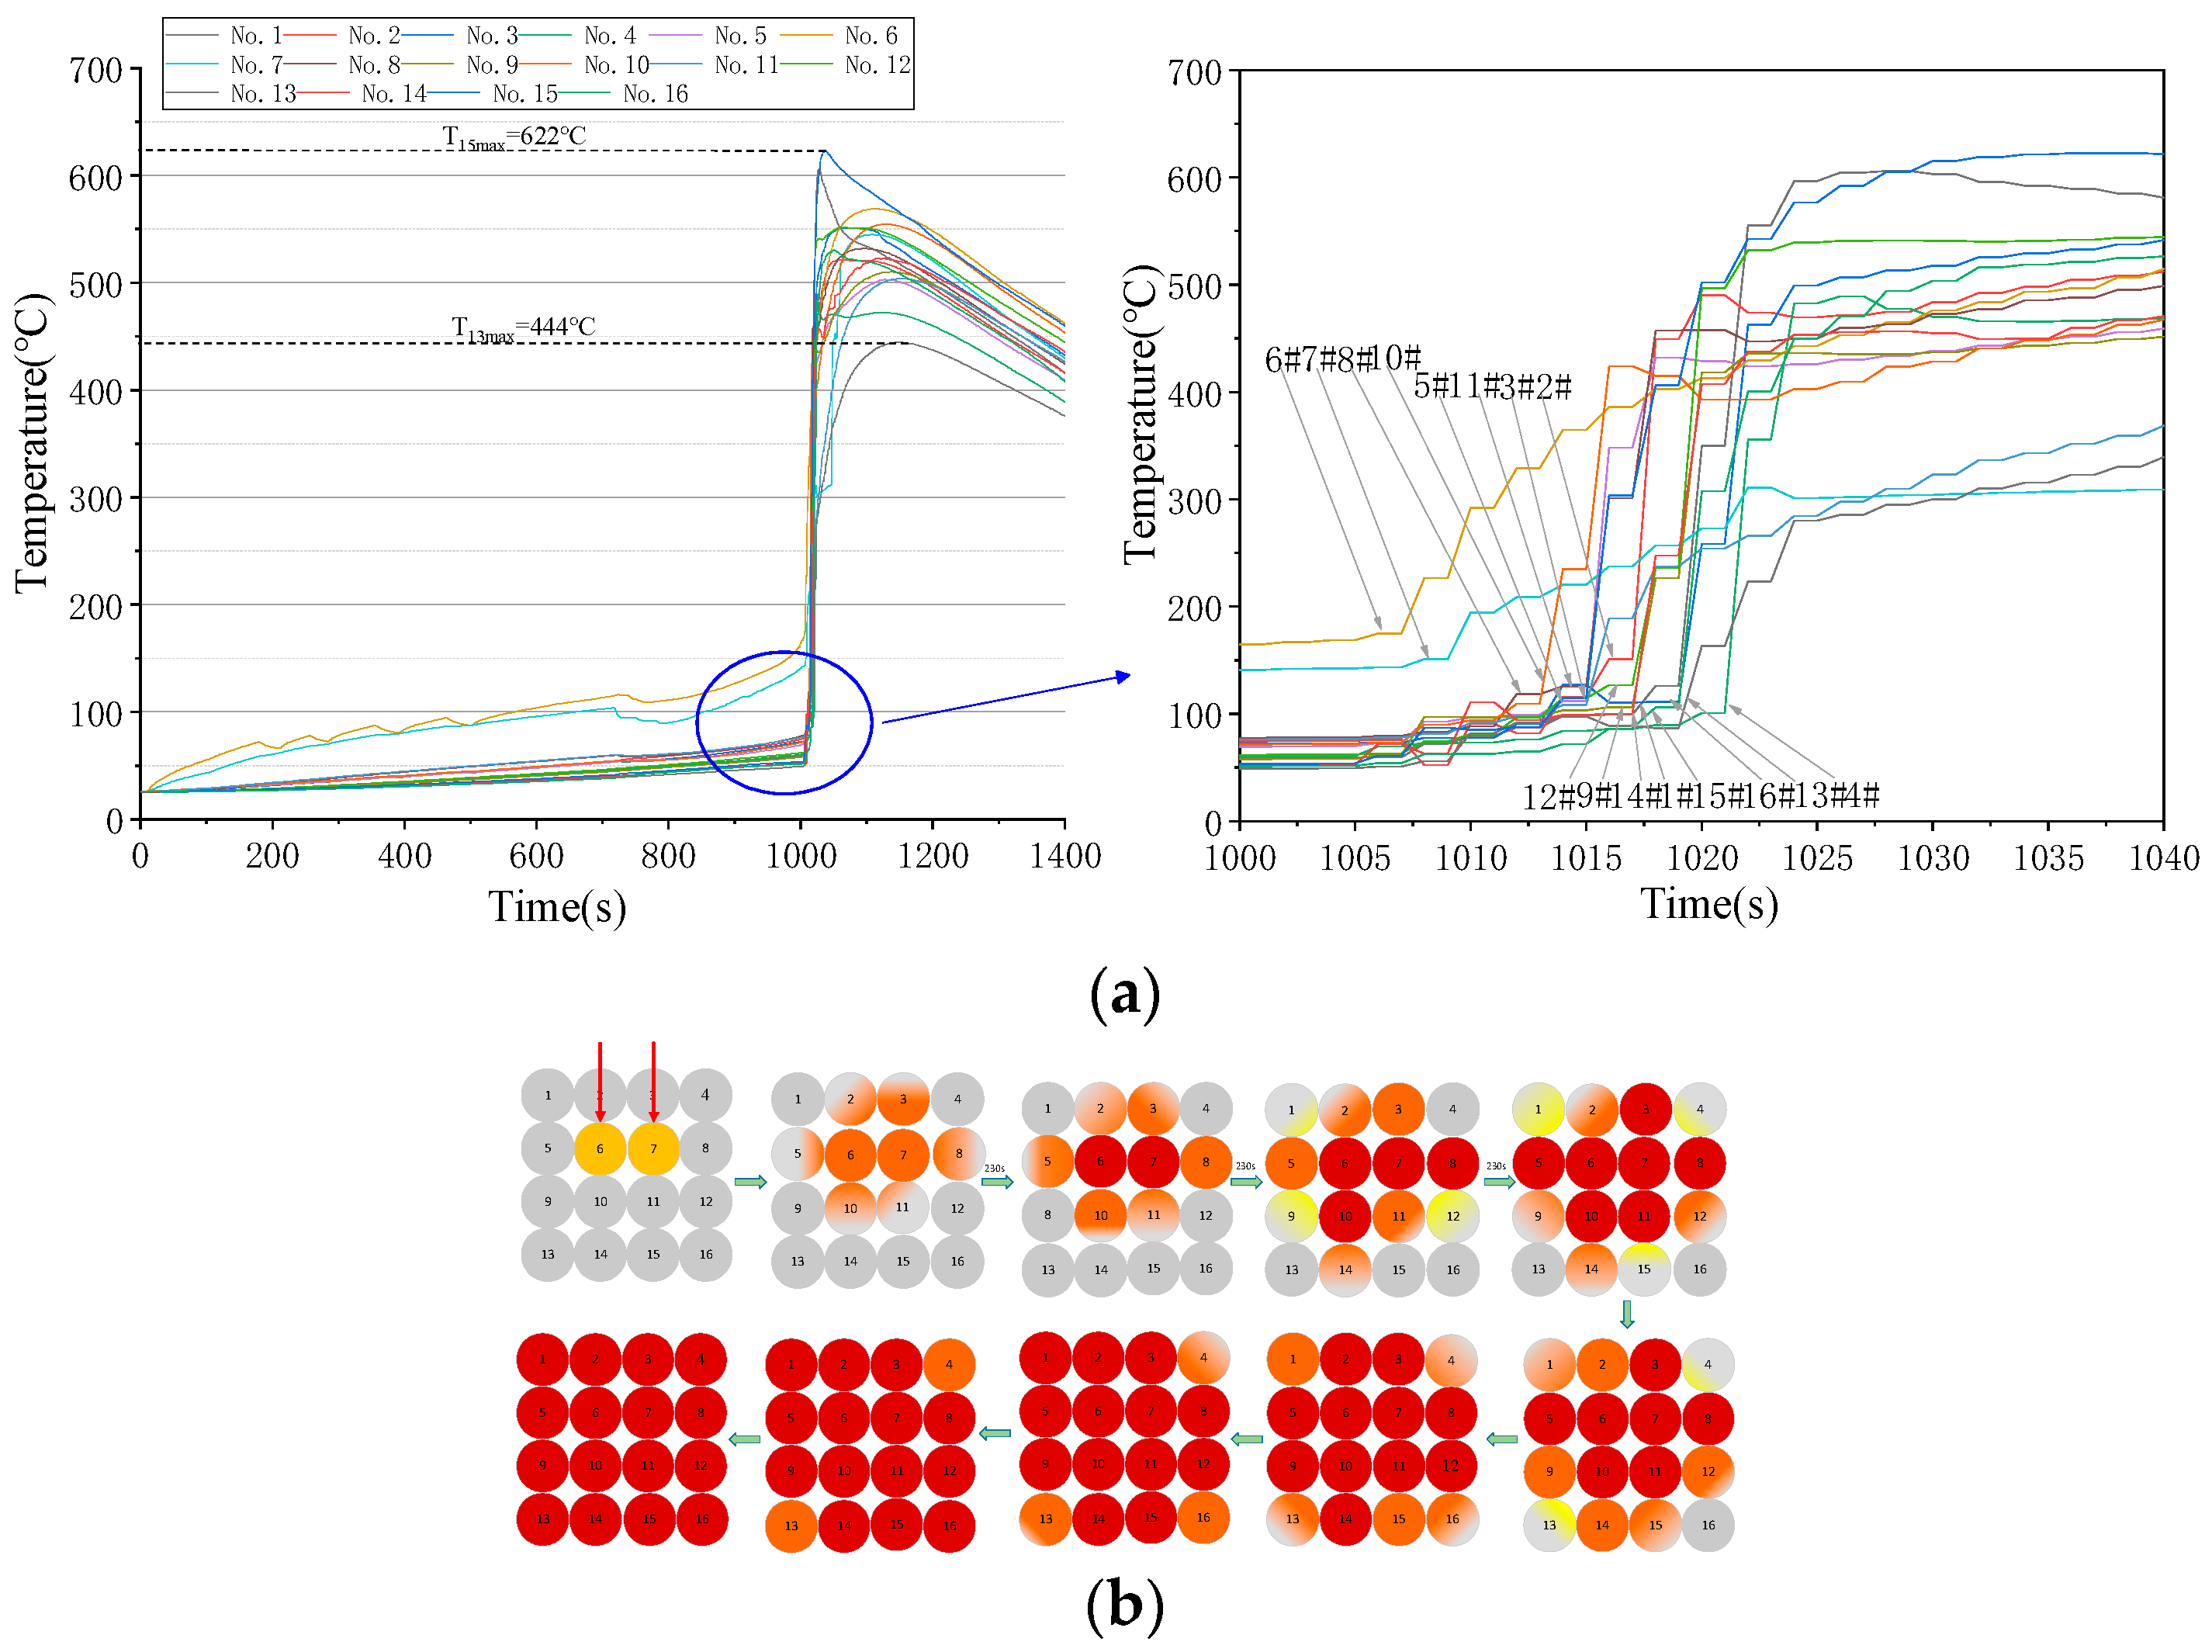
4.3. Trigger TR Simultaneously via Overheating Two Adjacent Cells in the Center

When triggered from the center of the module, the temperature change curves of all cells are shown in Figure 6a. The TR propagation mode takes the center as the origin and spreads all around at the same time. In this kind of trigger scenario, the maximum surface temperature of TR is about 622 °C and the minimum surface temperature is 444 °C. In Figure 6b, the path of TR heat spread is circular and spreads outward.
Comparing Figure 4, Figure 5 and Figure 6, it is easy to see that the time nodes of the inflection point of temperature rise of most cells are around 1000 s. Although there are differences in TR propagation paths, the processes of energy accumulation and explosion are similar. In addition, in the three experiments, the cells with the highest TR temperature among the 16 cells all appeared at the later stage of the whole TR propagation process; they are No. 14, No. 13, and No. 15 cells, respectively. The amount of heat transmitted does not alleviate or reduce due to the elongation of the propagation path. Therefore, in the design of aircraft LIB modules, it is advisable to reduce the size of the module appropriately, so that even if an independently packaged module has uncontrollable TR, the design can prevent the TR phenomenon from spreading on a larger scale through its own protection or isolation measures.

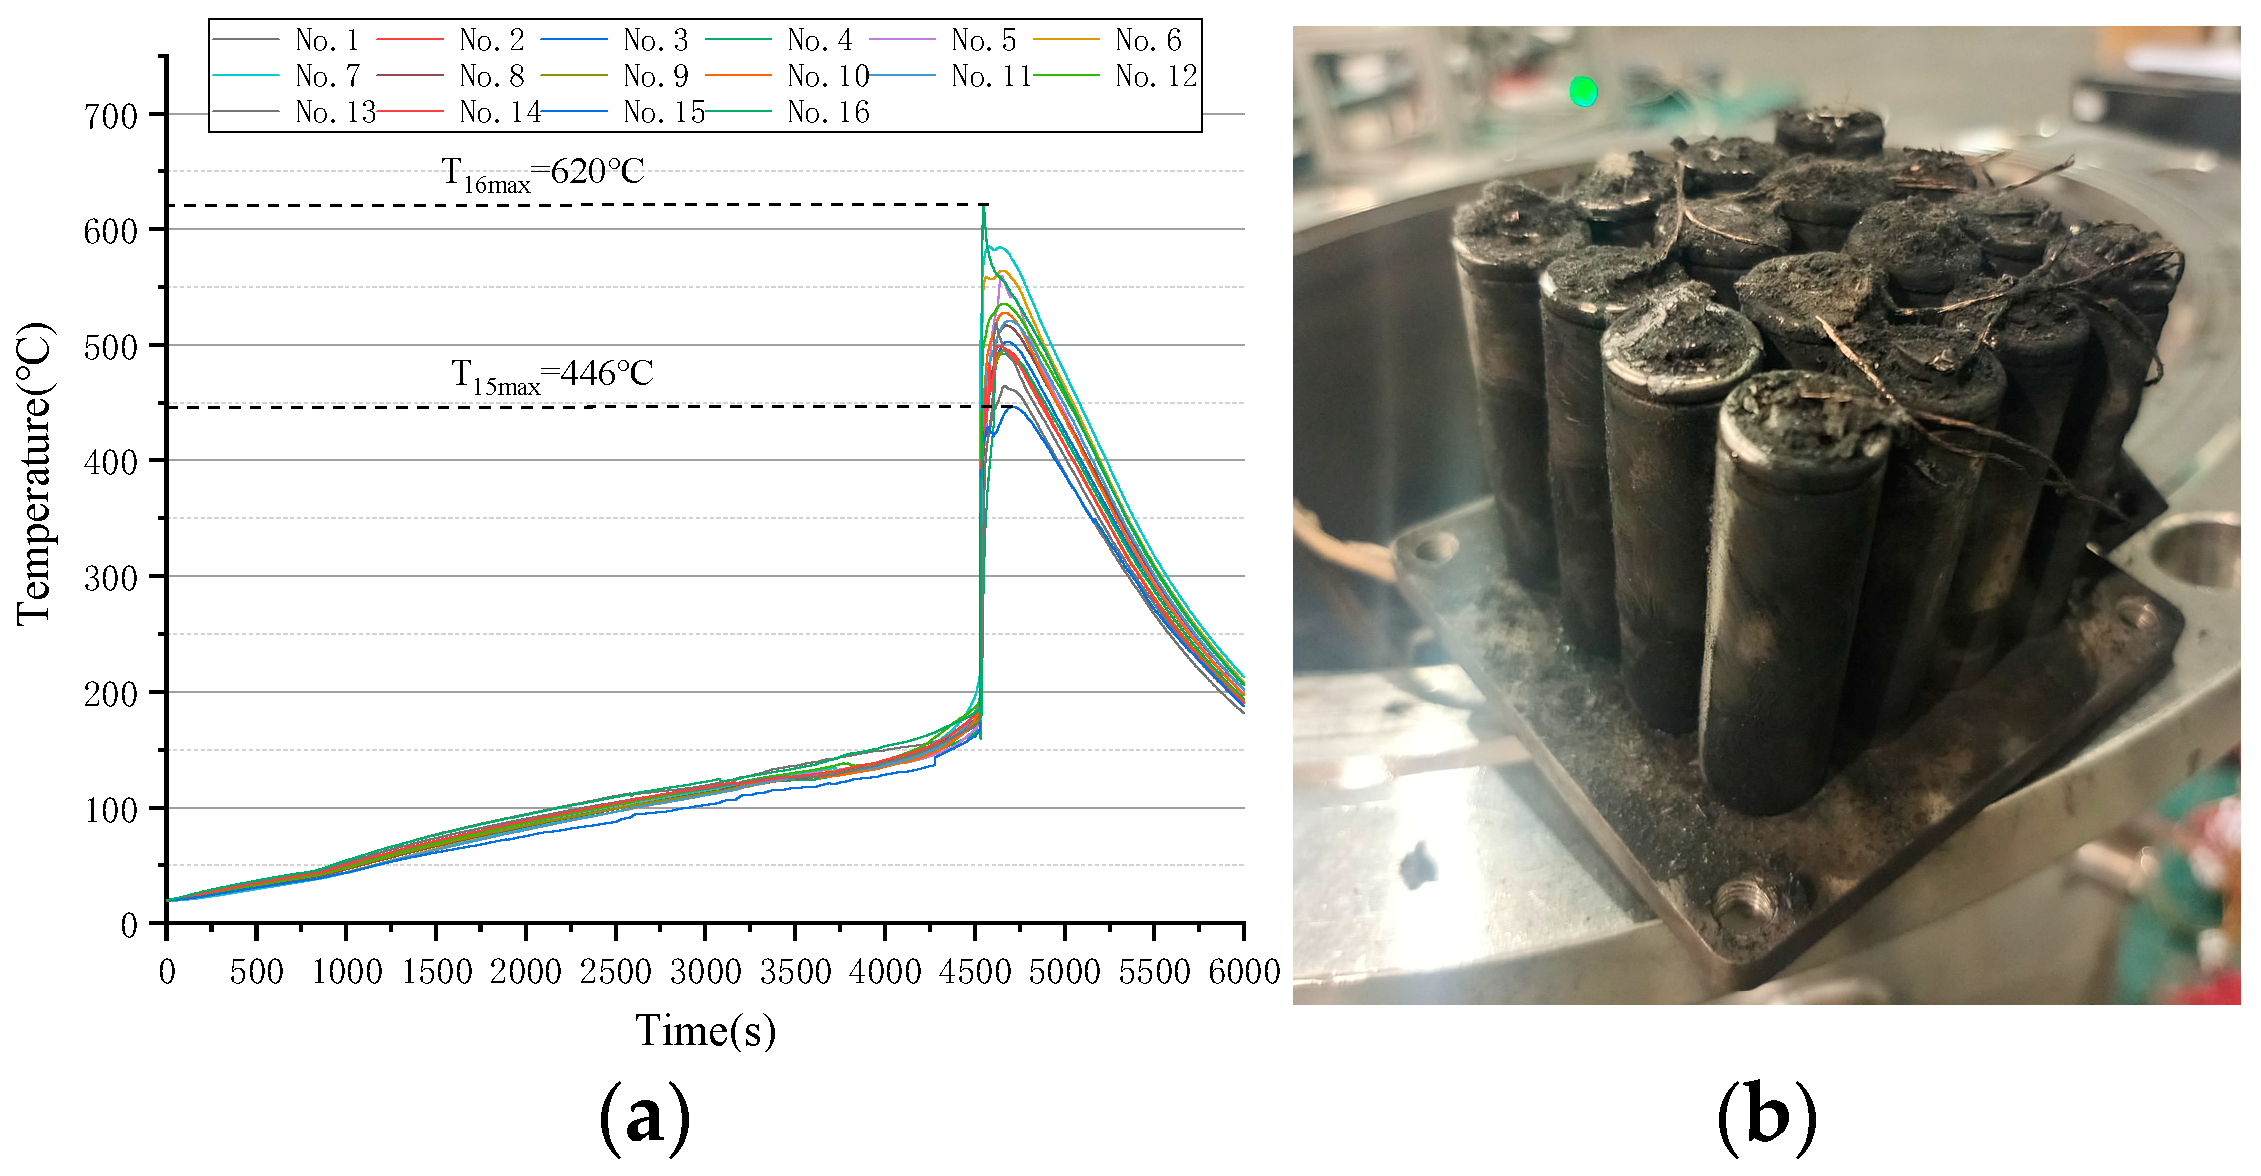
5. Temperature Analyses of TR Triggered by Overheating the Whole Module

Triggering TR by overheating the whole module simultaneously is simulating a failure phenomenon of multiple-battery TR caused by common-mode faults in the system. Although this failure mode is rare, it cannot be ruled out. Figure 7a illustrates the TR monitoring temperature curve of each cell.
Compared with overheating two adjacent cells, the initial temperature rise rate of the overall overheating module is significantly slower, and it takes about 2000 s of continuous overheating to excite the cells to reach the temperature of the self-generating heat stage. After that, the wait time for heat to accumulate until it is out of control is also significantly longer, and the inflection point of temperature rise appears at about 4500 s. The TR timing of all the 16 cells is almost synchronized. In terms of maximum temperature, the result of the overall overheating model is similar to the temperature curve of the simultaneous overheating trigger of two center adjacent cells (No. 6 and No. 7), ranging from 446 °C to 620 °C.
Furthermore, the damage state of the whole module after overheating is obviously more serious than that of the previous overheating cases. As shown in Figure 7b, the amount of solid ejecta obviously increases.

6. Comparing the Consequences of Overheating Two Adjacent Cells and Overheating the Whole LIB Module

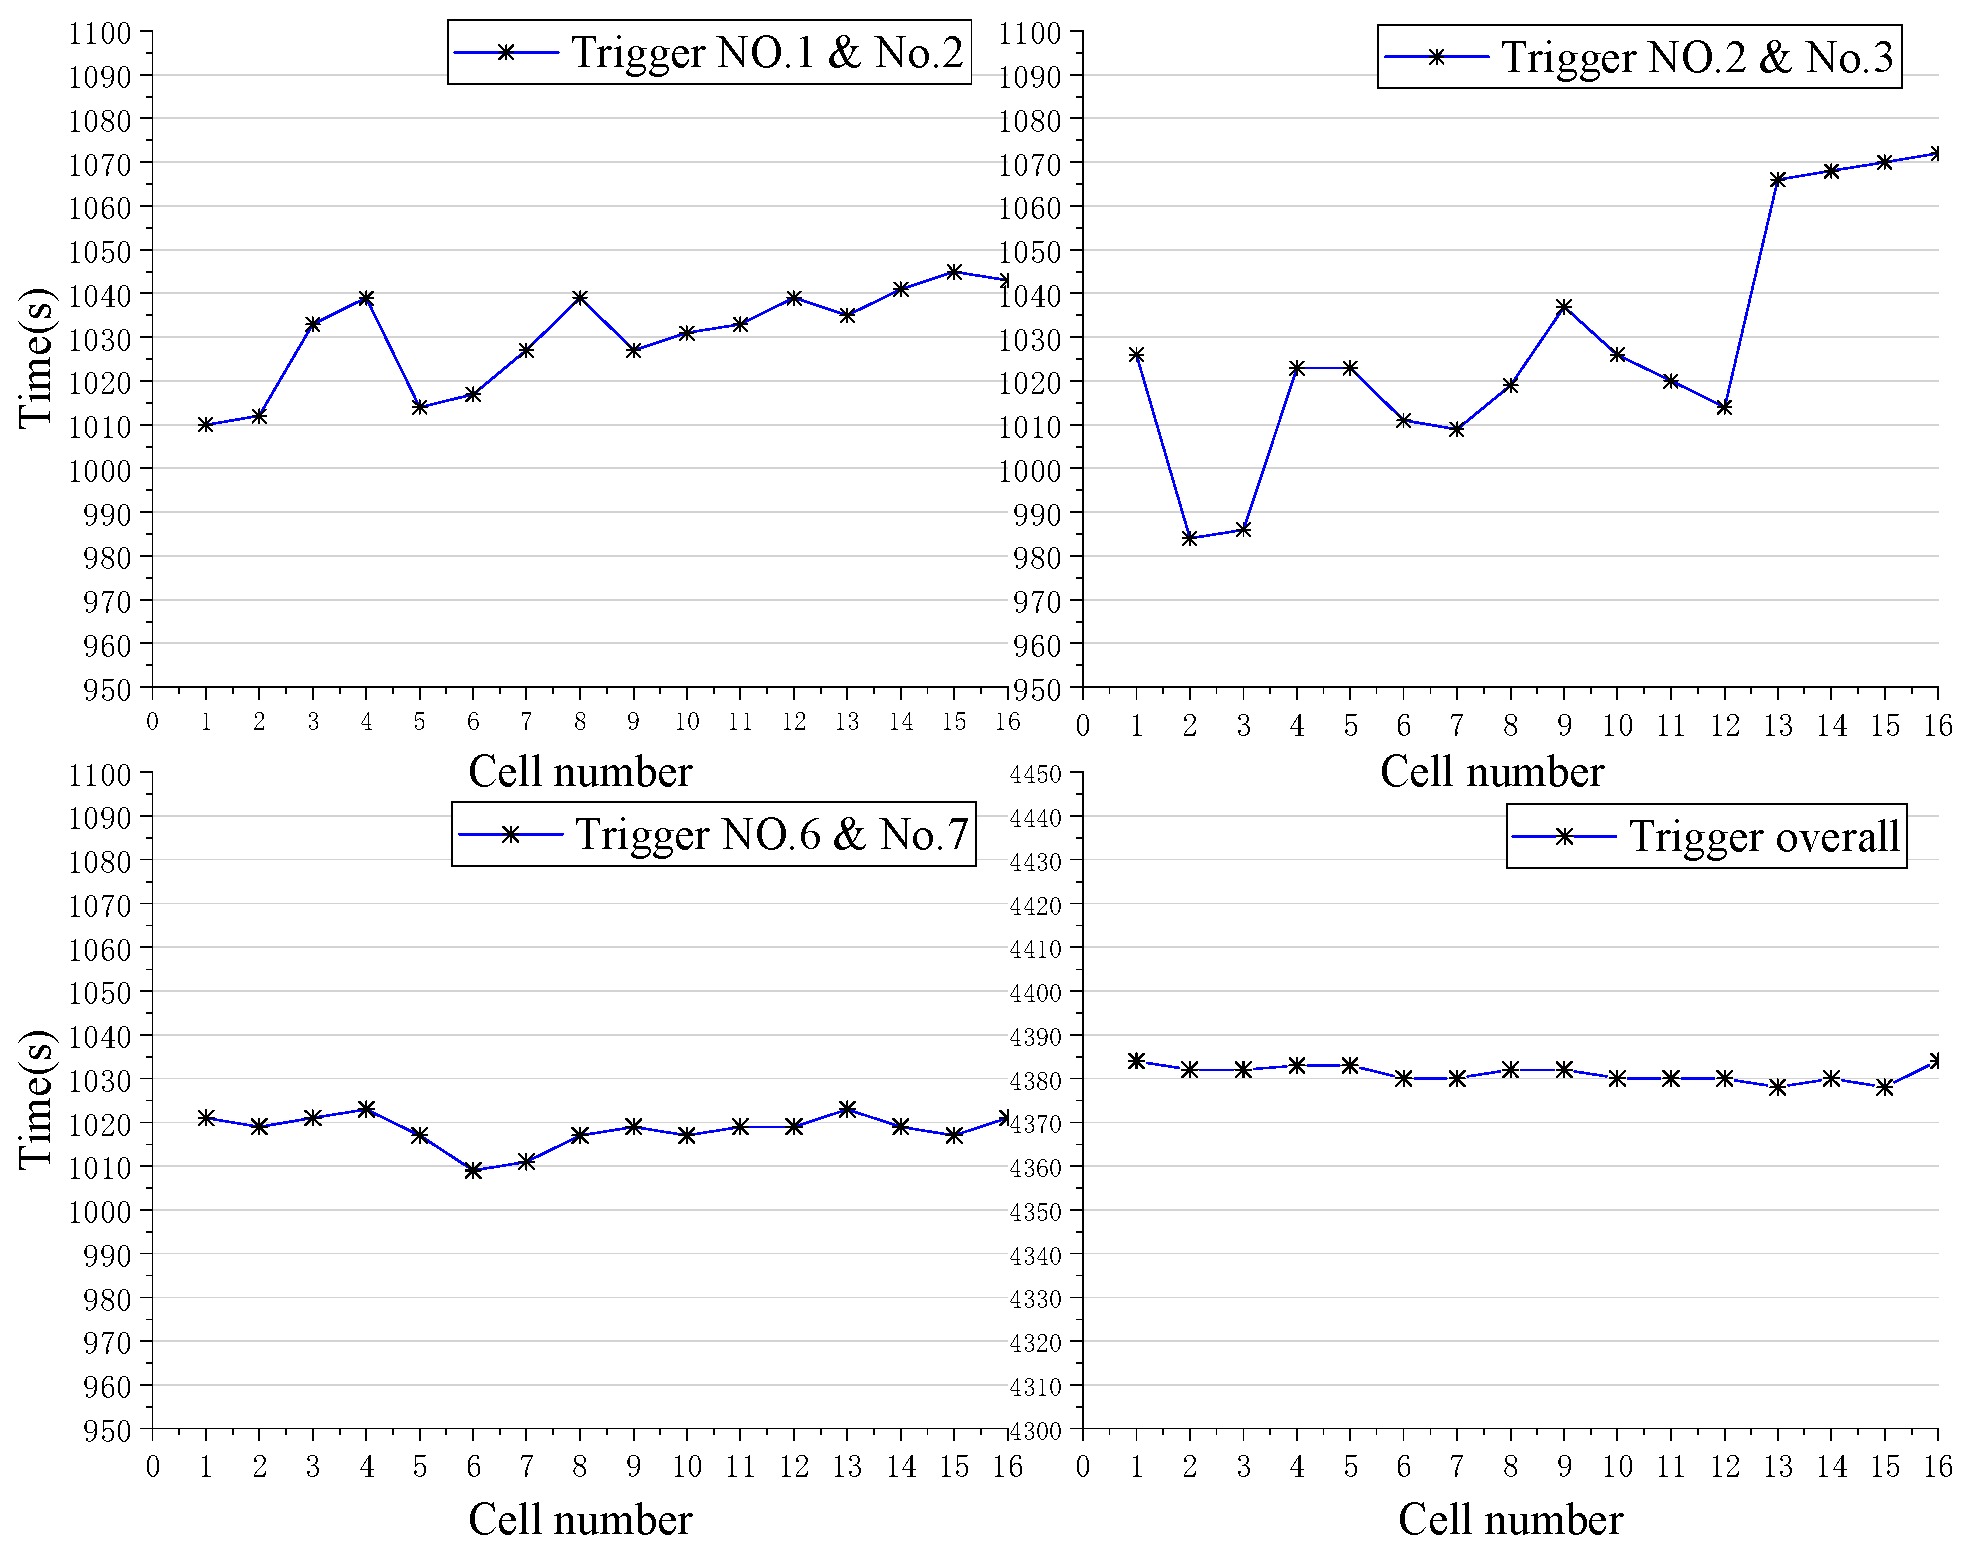
6.1. Propagation Speed

In the experiments of four different trigger positions and modes, the TR time curve of each cell is depicted in Figure 8. The TR trigger time of the whole overheating module is obviously later than the TR time curve of two adjacent cells, but its propagation speed is very fast. When triggered from the side, it takes 88 s for TR propagation, while once the whole overheating triggers TR, the whole propagation process can be completed within 6 s.
The calculation of TR propagation rate of the module is shown in Equation (4):
v = n Δ t
where n is the quantity of TR cells in the module; t is the TR propagation time of the module, that is, the time between the initial node of the TR propagation process and the time node of the last cell TR.
Table 1 illustrates the calculated values of TR propagation rate.
The TR propagation of the whole-overheating mode is the fastest, with a speed of 2.67 cells per second, although it starts later. The propagation speed of triggering two adjacent cells in the center is also obviously faster, second only to the whole-overheating trigger mode, and the TR starting time is earlier. The TR propagation speed when triggered from the side of the LIB module is the slowest, and the average number of cells per second is 0.18.

6.2. Maximum Temperature

Table 2 illustrates the maximum temperature of the outer surface of each cell in the four experiments during TR.
The total energy released by the whole LIB module in the whole TR process can be calculated using Equation (5) [32]:
H t o t a l = n = 1 16 M c o r e C p ( T i m a x T 1 )
where T i max is the maximum temperature of the outer surface of each cell; T 1 is the self-generating heat temperature for the cell, according to experience, T 1 = 70   ; C p is the specific heat capacity of the cell, C p = 1100   J k g 1 K 1 [40]; M c o r e is the core quality of the cell, and M c o r e = 36.5   g .
Table 3 illustrates the calculated value of total energy released by the LIB module in different trigger modes.
The four experiments caused all 16 cells to go into TR, which makes the module release the maximum energy. Although the total energy released under the two center adjacent cells triggering mode and the whole-module triggering mode are larger than the other two cases, it is not much different. The difference between the highest and lowest energy released by the module is 13,619.7 J, which is equivalent to the energy released by 0.76 cells in No. 1 and No. 2 position triggering mode. It can be considered that the external energy release value caused by the TR of 16 cells triggered from the center is equivalent to the energy release value of 16.76 cells triggered from the top corner.

6.3. Mass Loss

By cleaning the cells simply after every experiment, and weighing them one by one, we calculated the mass of solid ejecta loss caused by TR for each cell, as depicted in Figure 9.
The heat carried away by the ejecta can be calculated as Equation (6):
H l o s s = n = 1 16 M l o s s C p ( T i max T 1 )
where C p is the specific heat capacity of the cell solid ejecta, and C p = 800   J k g 1 K 1 .
Table 4 illustrates the calculated value of heat carried away by TR solid ejecta.
The positions of overheating two adjacent cells to trigger TR is different, but the mass loss is similar, and the energy loss is approximately equal, about 71,000 J. This value accounts for about 25% of the total heat released from LIB module TR.
When the whole overheating module triggers TR, the mass loss of solid ejecta is the largest, and the energy taken away is the highest, accounting for about 28% of the total heat released. This means that the harm caused by this triggering method is more obvious, because the solid ejecta will cause damage to the accessory parts and wires in the LIB, as well as to the other cells in a larger area around and even the aircraft installation environment.

6.4. Change of Voltage

Figure 10 illustrates the real-time voltage monitoring curve of each cell in the experiments of four different trigger positions and modes. For the mode of triggering two adjacent cells, only the voltage changes of the two triggered cells are complex, and the voltage value obviously drops to 2.0 V~2.5 V near 600 s, and then continues to drop until the final voltage value is 0 V. However, the voltage reduction trend of other peripheral cells in the LIB module is very consistent and there is no repetition.
Similar to the temperature curve, the voltage changes in the whole-overheating trigger mode are relatively late, and all of them begin to occur after 2000 s. Moreover, the voltage change of each cell is complex so it fluctuates for a long time, and the curve changes irregularly until TR occurs at 4500 s, and the voltage drops to 0 V.
Compared with the curve of the exothermic power of the cell in Figure 3, when the internal active substances in the cell undergo a self-generated thermal reaction due to external overheating, the voltage will fluctuate abnormally in a precursor manner. Therefore, in the design of system failure warning functions and health state prediction, the above law of voltage change can be fully utilized [41,42,43]. The voltage changes of each cell in the monitoring module can be implemented. When the voltage value fluctuates in the early stage, isolation measures can be taken to effectively isolate it, to avoid a larger-scale TR propagation phenomenon. Considering the difference in the time limit of abnormal voltage fluctuation due to different categories or capacity, the measured value of target LIBs should be considered in the real design process to set the threshold.

7. Conclusions

LIB TR is the most significant potential safety hazard to electric aircraft; therefore, LIB module thermal safety is crucial for the technical cluster required by airworthiness regulations. TR containment is used to characterize the ability of aircraft to withstand the harm caused by LIB TR. The airworthiness verification Method of Compliance (MoC) with the TR containment of aviation LIBs is the most controversial issue in the field of global electric aviation airworthiness verification [20,21,22,23,24]. During the MoC experiments, different trigger modes will cause different LIB TR consequences. Critical parameters such as temperature change, voltage change, the highest surface temperature, mass loss of the single cell, and total energy release after TR are calculated and analyzed. The conclusions can be summarized as follows:
(1) When the two adjacent cells at the top corner, side, and center of the module are overheated, TR occurs in the triggered cells at about 1000 s. On the other hand, the whole-overheating trigger mode takes a longer time to TR, which needs 4500 s. Although the time of activating TR in whole-overheating trigger mode will be several times longer, its propagation speed is obviously faster than that of the two adjacent cells trigger mode. The speed of TR propagation of the whole-overheating mode is 2.67 cells per second. The propagation speed triggered by two adjacent center cells is second only to the whole-overheating trigger mode. The TR propagation speed of triggering from the side of the module is the slowest, and the average number of cells per second is 0.18.
(2) During the two adjacent cells triggering mode experiments, the highest TR temperatures among the 16 cells all appeared at the later stage of the whole TR propagation process. The amount of heat transmitted does not alleviate or reduce due to the elongation of the propagation path.
Therefore, it is advisable for the designer to propose a properly modularized LIB system design with small modules/packs, so that even if an independently packaged module has uncontrollable TR, it can prevent the TR phenomenon from spreading on a larger scale through its own protection or isolation measures. In addition, a TR containment test during airworthiness verification MoC experiments can also be carried out at this miniaturized module level, which reduces the verification risk and implementation difficulty.
(3) The total energy released by the module is not much different when the location of the TR trigger is different, with a maximum value of 298,443.0 J (center trigger) and a minimum value of 284,827.3 J (top corner trigger), and the difference between them is 13,615.7 J, which is approximately equal to 4.56% of the total energy under the top corner overheating trigger mode. However, considering the rapid propagation speed of the whole-overheating trigger mode, the short-term impact force will be very prominent under the same release energy.
(4) Common-mode faults in the LIB system may cause a whole-module TR. Triggering TR by overheating the whole module simultaneously is simulating this failure phenomenon. Overheating the whole module results in more mass loss of solid ejecta; that undoubtedly causes more damage and high heat transfer to the surrounding environment and other cells. Therefore, in a certain sense, this verification method can more adequately test the aircraft’s containment of LIB TR.
Additionally, it is necessary to perform common mode analysis (CMA) on the aircraft propulsion system or power supply system with the batteries installed onboard to ensure the probability of common mode failure of the LIB system is reduced to the minimum and the failure probability value complies with airworthiness requirements, such as 10−7 or 10−9.
(5) Although the voltage of all the cells will drop like a cliff after TR finally, the experimental curve shows that in the initial stage of self-generated thermal reactions caused by the temperature rise due to external overheating, the voltage of the target triggered cells goes down and then goes up. And this process will last for several minutes. Therefore, this time can be used as an important window period for early warning design.

Author Contributions

Conceptualization, J.Y. and Q.Z.; methodology, J.Y.; validation, W.L.; formal analysis, H.Z.; investigation, J.Y.; resources, J.Y.; data curation, J.Y. and W.L.; writing—original draft preparation, J.Y.; writing—review and editing, Q.Z.; supervision, Q.Z.; project administration, J.Y.; funding acquisition, Q.Z. All authors have read and agreed to the published version of the manuscript.

Funding

This research was funded by the Key Natural Science Projects of Fundamental Research Funds for the Central Universities, grant number 3122024058.

Data Availability Statement

The data presented in this study are available on request from the corresponding author.

Acknowledgments

The authors would like to acknowledge all team-mates.

Conflicts of Interest

The authors declare no conflicts of interest.

References

  1. Saeva, R.; Sdott, R.G.; Tao, P.C.; Stefansson, H. Potential use of geothermal energy sources for the production of lithium-ion batteries. Renew. Energy 2014, 61, 17–22. [Google Scholar]
  2. Yang, J.; Xu, H.Y.; Yang, Z.G. An active control excitation method of three-stage brushless synchronous starter generator in electric starting mode for MEA. IEEE Access 2021, 9, 109763–109774. [Google Scholar]
  3. Gong, X.; Xiong, R.; Mi, C.C. Study of the characteristics of battery packs in electric vehicles with parallel-connected lithium-ion battery cells. IEEE Trans. Ind. Appl. 2015, 2, 1872–1879. [Google Scholar] [CrossRef]
  4. Yang, J.; Bao, X.W.; Yang, Z.G. Load Identification for the more electric aircraft distribution system based on intelligent algorithm. Aerospace 2022, 9, 350. [Google Scholar] [CrossRef]
  5. Cao, W. Overview of electric motor technologies used for more electric aircraft (MEA). IEEE Trans. Ind. Electron. 2012, 59, 3523–3531. [Google Scholar]
  6. Roboam, X.; Sareni, B.; Andrade, A. More electricity in the air: Toward optimized electrical networks embedded in more-electrical aircraft. IEEE Ind. Electron. Mag. 2012, 6, 6–17. [Google Scholar] [CrossRef]
  7. Cardone, M.; Gargiulo, B.; Fornaro, E. Modelling and experimental validation of a hybrid electric propulsion system for light aircraft and unmanned aerial vehicles. Energies 2021, 14, 3969. [Google Scholar] [CrossRef]
  8. Yang, F.T.; Fan, Z.W.; Xiang, S.; Liu, Y.; Zhao, W. Technical innovation and practice of electric aircraft in China. Acta Aeronaut. Astronaut. Sin. 2021, 42, 624619. [Google Scholar]
  9. Alexander, R.; Meyer, D.; Wang, J. A comparison of electric vehicle power systems to predict architectures, voltage levels, power requirements, and load characteristics of the future all-electric aircraft. In Proceedings of the 2018 IEEE Transportation Electrification Conference and Expo (ITEC), Long Beach, CA, USA, 13–15 June 2018. [Google Scholar]
  10. Lipu, M.H.; Hannan, M.A.; Hussain, A.; Hoque, M.M.; Ker, P.J.; Saad, M.H.M.; Ayob, A. A review of state of health and remaining useful life estimation methods for lithium-ion battery in electric vehicles: Challenges and recommendations. J. Clean. Prod. 2018, 205, 115–133. [Google Scholar] [CrossRef]
  11. Tariq, M.; Maswood, A.I.; Gajanayake, C.J.; Gupta, A.K. Aircraft batteries: Current trend towards more electric aircraft. IET Electro Syst Transp. 2017, 7, 93–103. [Google Scholar] [CrossRef]
  12. Gandoman, F.H.; Jaguemont, J.; Goutam, S.; Gopalakrishnan, R.; Firouz, Y.; Kalogiannis, T.; Omar, N.; Van Mierlo, J. Concept of reliability and safety assessment of lithium-ion batteries in electric vehicles: Basics, progress, and challenges. Appl. Energy 2019, 251, 113343. [Google Scholar] [CrossRef]
  13. Chombo, P.V.; Laoonual, Y. A review of safety strategies of a Li-ion battery. J. Power Sources 2020, 478, 228649. [Google Scholar] [CrossRef]
  14. Williard, N.; He, W.; Hendricks, C.; Pecht, M. Lessons learned from the 787 Dreamliner issue on lithium-ion battery reliability. Energies 2013, 6, 4682–4695. [Google Scholar] [CrossRef]
  15. Anon. Aircraft Incident Report: Auxiliary Power Unit Battery Fire, Japan Airlines Boeing 87-8, Ja829j; National Transportation Safety Board: Washington, DC, USA, 2014.
  16. Werfelman, L. Testing the limits: The NTSB calls for new tests to prove lithium-ion battery installations in aircraft can mitigate hazards tied to thermal runaway. Aerosaf. World 2014, 9, 41–43. [Google Scholar]
  17. Feng, X.; Ouyang, M.; Liu, X.; Lu, L.; Xia, Y.; He, X. Thermal runaway mechanism of lithium-ion battery for electric vehicles: A review. Energy Storage Mater. 2017, 10, 246–267. [Google Scholar] [CrossRef]
  18. Zhang, L.; Zhao, P.; Xu, M.; Wang, X. Computational identification of the safety regime of Li-ion battery thermal runaway. Appl. Energy 2019, 261, 114440. [Google Scholar] [CrossRef]
  19. Xu, B.; Lee, J.; Kwon, D.; Kong, L.; Pecht, M. Mitigation strategies for Li-ion battery thermal runaway: A review. Renew. Sustain. Energy Rev. 2021, 150, 111437. [Google Scholar] [CrossRef]
  20. FAA TSO-C179b; Rechargeable Lithium Batteries and Battery Systems. 2018. Available online: https://drs.faa.gov/browse/TSO/doctypeDetails?modalOpened=true (accessed on 25 May 2024).
  21. SAE. J2464; Electric and Hybrid Electric Vehicle Rechargeable Energy Storage System (RESS) Safety and Abuse Testing. 2009. Available online: https://www.sae.org/standards/content/j2464_200911/ (accessed on 25 May 2024).
  22. RTCA DO-311A; Minimum Operational Performance Standards for Rechargeable Lithium Batteries and Battery Systems. 2017. Available online: https://standards.globalspec.com/std/10270501/rtca-do-311 (accessed on 25 May 2024).
  23. RTCA DO-347; Certification Test Guidance for Small and Medium Sized Rechargeable Lithium Batteries and Battery Systems. 2013. Available online: https://standards.globalspec.com/std/1661419/rtca-do-347 (accessed on 25 May 2024).
  24. EASA Special Condition Doc. No: SC-VTOL-01, Vertical Take-Off and Landing (VTOL) Aircraft. 2019. Available online: https://www.easa.europa.eu/sites/default/files/dfu/SC-VTOL-01.pdf (accessed on 25 May 2024).
  25. Ping, P.; Kong, D.; Zhang, J.; Wen, R.; Wen, J. Characterization of behavior and hazards of fire and deflagration for high-energy Li-ion cells by over-heating. J. Power Sources 2018, 398, 55–66. [Google Scholar] [CrossRef]
  26. Ping, P.; Wang, Q.; Huang, P.; Li, K.; Sun, J.; Kong, D.; Chen, C. Study of the fire behavior of high-energy lithium-ion batteries with full-scale burning test. J. Power Sources 2015, 285, 80–89. [Google Scholar] [CrossRef]
  27. Jia, Z.; Huang, Z.; Zhai, H.; Qin, P.; Zhang, Y.; Li, Y.; Wang, Q. Experimental investigation on thermal runaway propagation of 18650 lithium-ion battery modules with two cathode materials at low pressure. Energy 2022, 251, 123925. [Google Scholar] [CrossRef]
  28. Chen, X.; Zhang, X.; Wang, H.; Jia, J.; Xie, S.; Zhi, M.; Fu, J.; Sun, Q. Influence of ambient pressure and heating power on the thermal runaway features of lithium-ion battery. J. Electrochem. Energy Convers. Storage 2020, 18, 021014. [Google Scholar] [CrossRef]
  29. Xie, S.; Ren, L.; Yang, X.; Wang, H.; Sun, Q.; Chen, X.; He, Y. Influence of cycling aging and ambient pressure on the thermal safety features of lithium-ion battery. J. Power Sources 2020, 448, 227425.1–227425.8. [Google Scholar] [CrossRef]
  30. Zhai, H.; Li, H.; Ping, P.; Huang, Z.; Wang, Q. An experimental-based Domino prediction model of thermal runaway propagation in 18,650 lithium-ion battery modules. Int. J. Heat Mass Transf. 2021, 181, 122024. [Google Scholar] [CrossRef]
  31. Feng, X.; He, X.; Ouyang, M.; Wang, L.; Lu, L.; Ren, D.; Santhanagopalan, S. A coupled electrochemical-thermal failure model for predicting the thermal runaway behavior of lithium-ion batteries. J. Electrochem. Soc. 2018, 165, A3748. [Google Scholar] [CrossRef]
  32. Wang, H.B.; Li, Y.; Wang, Q.Z.; Du, Z.M.; Feng, X.N. Experimental study on the thermal runaway and its propagation of a lithium-ion traction battery with NCM cathode under thermal abuse. Chin. J. Eng. 2021, 43, 663–675. [Google Scholar]
  33. Qi, C.; Kuang, N.N.; Zhang, Y.J. Simulation study on the thermal propagation behavior of high energy density lithium-ion battery module. High Volt. Eng. 2021, 47, 2633–2643. [Google Scholar]
  34. Zhang, M.; Feng, X.; Ouyang, M.; Lu, L.; Wang, F.; Fan, B. Experiments and modeling of nail penetration thermal runaway in a NCM li-ion power battery. Automot. Eng. 2015, 37, 743–751. [Google Scholar]
  35. Feng, X. Mechanism, Modeling and Prevention and Control of Thermal Runaway of Automotive Lithium Ion Power Battery. Ph.D. Thesis, Tsinghua University, Beijing, China, 2016. [Google Scholar]
  36. Kin, G.H.; Pesaran, A.; Spotnitz, R. A three-dimensional thermal abuse model for lithium-ion cells. J. Power Sources 2007, 170, 476–489. [Google Scholar]
  37. Hatchard, T.D.; MacNeil, D.D.; Basu, A.; Dahn, J.R. Thermal model of cylindrical and prismatic lithium-ion cells. J. Electrochem. Soc. 2001, 148, A755–A761. [Google Scholar] [CrossRef]
  38. Spotnitz, R.; Franklin, J. Abuse behavior of high-power, lithium-ion cells. J. Power Sources 2003, 113, 81–100. [Google Scholar] [CrossRef]
  39. Wang, H.Y.; Tang, A.D.; Huang, K.L. Oxygen evolution in overcharged LixNi1/3Co1/3Mn1/3O2 electrode and its thermal analysis kinetics. Chin. J. Chem. 2011, 29, 6. [Google Scholar] [CrossRef]
  40. Liu, Y.; Zhang, L.; Ding, Y.; Huang, X.; Huang, X. Effect of thermal impact on the onset and propagation of thermal runaway over cylindrical Li-ion batteries. Renew. Energy 2024, 222, 119910. [Google Scholar] [CrossRef]
  41. Yang, D.; Wang, Y.; Pan, R.; Chen, R.; Chen, Z. A neural network based state-of-health estimation of lithium-ion battery in electric vehicles. Energy Procedia 2017, 105, 2059–2064. [Google Scholar] [CrossRef]
  42. Yao, L.; Xu, S.; Tang, A.; Zhou, F.; Hou, J.; Xiao, Y.; Fu, Z. A Review of lithium-ion battery state of health estimation and prediction methods. World Electr. Veh. J. 2021, 12, 113. [Google Scholar] [CrossRef]
  43. Yang, J.; Niu, J.H.; Zhang, Q.S. In-situ explosion limit of thermal runaway gas explosion in cyclic aging lithium-ion batteries: Experimental analysis. Acta Aeronaut. Astronaut. Sin. 2023, 44, 290–299. [Google Scholar]
Figure 1. Schematic of the experimental setup: (a) the experimental apparatus; (b) physical drawing of experimental device.
Aerospace 11 00438 g001
Figure 2. Schematic of LIB module installation: (a) the installation position diagram; (b) bottom plate installation of LIB module; (c) upper and lower base plates installation of LIB module.
Aerospace 11 00438 g002
Figure 3. Thermal power generated at each stage of a single cell’s TR process.
Aerospace 11 00438 g003
Figure 4. TR behavior of LIB module when overheat top corner position cells: (a) temperature curve of No. 1~No. 16 cells; (b) schematic diagram of TR propagation of LIB module.
Aerospace 11 00438 g004
Figure 5. TR behavior of LIB module when overheat side position cells: (a) temperature curve of No. 1~No. 16 cells; (b) schematic diagram of TR propagation of LIB module.
Aerospace 11 00438 g005
Figure 6. TR behavior of LIB module when overheat center position cells: (a) temperature curve of No. 1~No. 16 cells; (b) schematic diagram of TR propagation of LIB module.
Aerospace 11 00438 g006
Figure 7. TR behavior of LIB module when overheat the whole module: (a) temperature curve of No. 1~No. 16 cells; (b) LIB module after TR.
Aerospace 11 00438 g007
Figure 8. Time curves of TR of all cells under different experimental conditions.
Aerospace 11 00438 g008
Figure 9. TR mass loss.
Aerospace 11 00438 g009
Figure 10. Voltage curve of No. 1~No. 16 cells: (a) Trigger No. 1 + No. 2 cells; (b) Trigger No. 2 + No. 3 cells; (c) Trigger No. 6 + No. 7 cells; (d) Trigger of the whole LIB module.
Aerospace 11 00438 g010
Table 1. TR propagation rate.
Calculated ValueTrigger Model
1 + 22 + 36 + 7Whole
TR quantity16161616
TR time (s)3488146
TR rate (s−1)0.470.181.1432.67
Table 2. Maximum surface temperatures of TR cells.
Temperature
(°C)
Trigger Model
1 + 22 + 36 + 7Whole
No. 1485.24514.56605.91464.26
No. 2459.15430.08521.24495.52
No. 3490.04423.28550.71502.75
No. 4486.0436.06489.00493.20
No. 5424.08458.31502.69559.53
No. 6543.88482.74568.61564.14
No. 7565.7488.22544.66585.08
No. 8491.67581.53531.61516.75
No. 9497.84532.27509.99495.18
No. 10542.82542.39554.30527.82
No. 11486.7517.73503.65520.99
No. 12498.04560.37551.35535.75
No. 13550.74645.25444.16518.90
No. 14646.82603.20522.55598.94
No. 15555.05590.78622.54446.45
No. 16490.31472.34530.23620.22
Table 3. Calculated value of total energy released by TR of the LIB module.
Trigger ModeCalculated Value
n = 1 16 ( T i max T 1 )
(°C)
Total Released
Energy (J)
Mean Released
Energy (J)
1 + 27094.08284,827.317,801.7
2 + 38279.11287,438.317,964.9
6 + 78553.2298,443.018,652.7
Whole8445.48294,118.018,382.4
Table 4. Heat carried away by TR solid ejecta of the LIB module.
Calculated ValueTrigger Model
1 + 22 + 36 + 7Whole
Total lost mass (g)215.53220.397198.261231.331
Total energy (J)71,502.071,946.271,871.982,437.8
Disclaimer/Publisher’s Note: The statements, opinions and data contained in all publications are solely those of the individual author(s) and contributor(s) and not of MDPI and/or the editor(s). MDPI and/or the editor(s) disclaim responsibility for any injury to people or property resulting from any ideas, methods, instructions or products referred to in the content.

