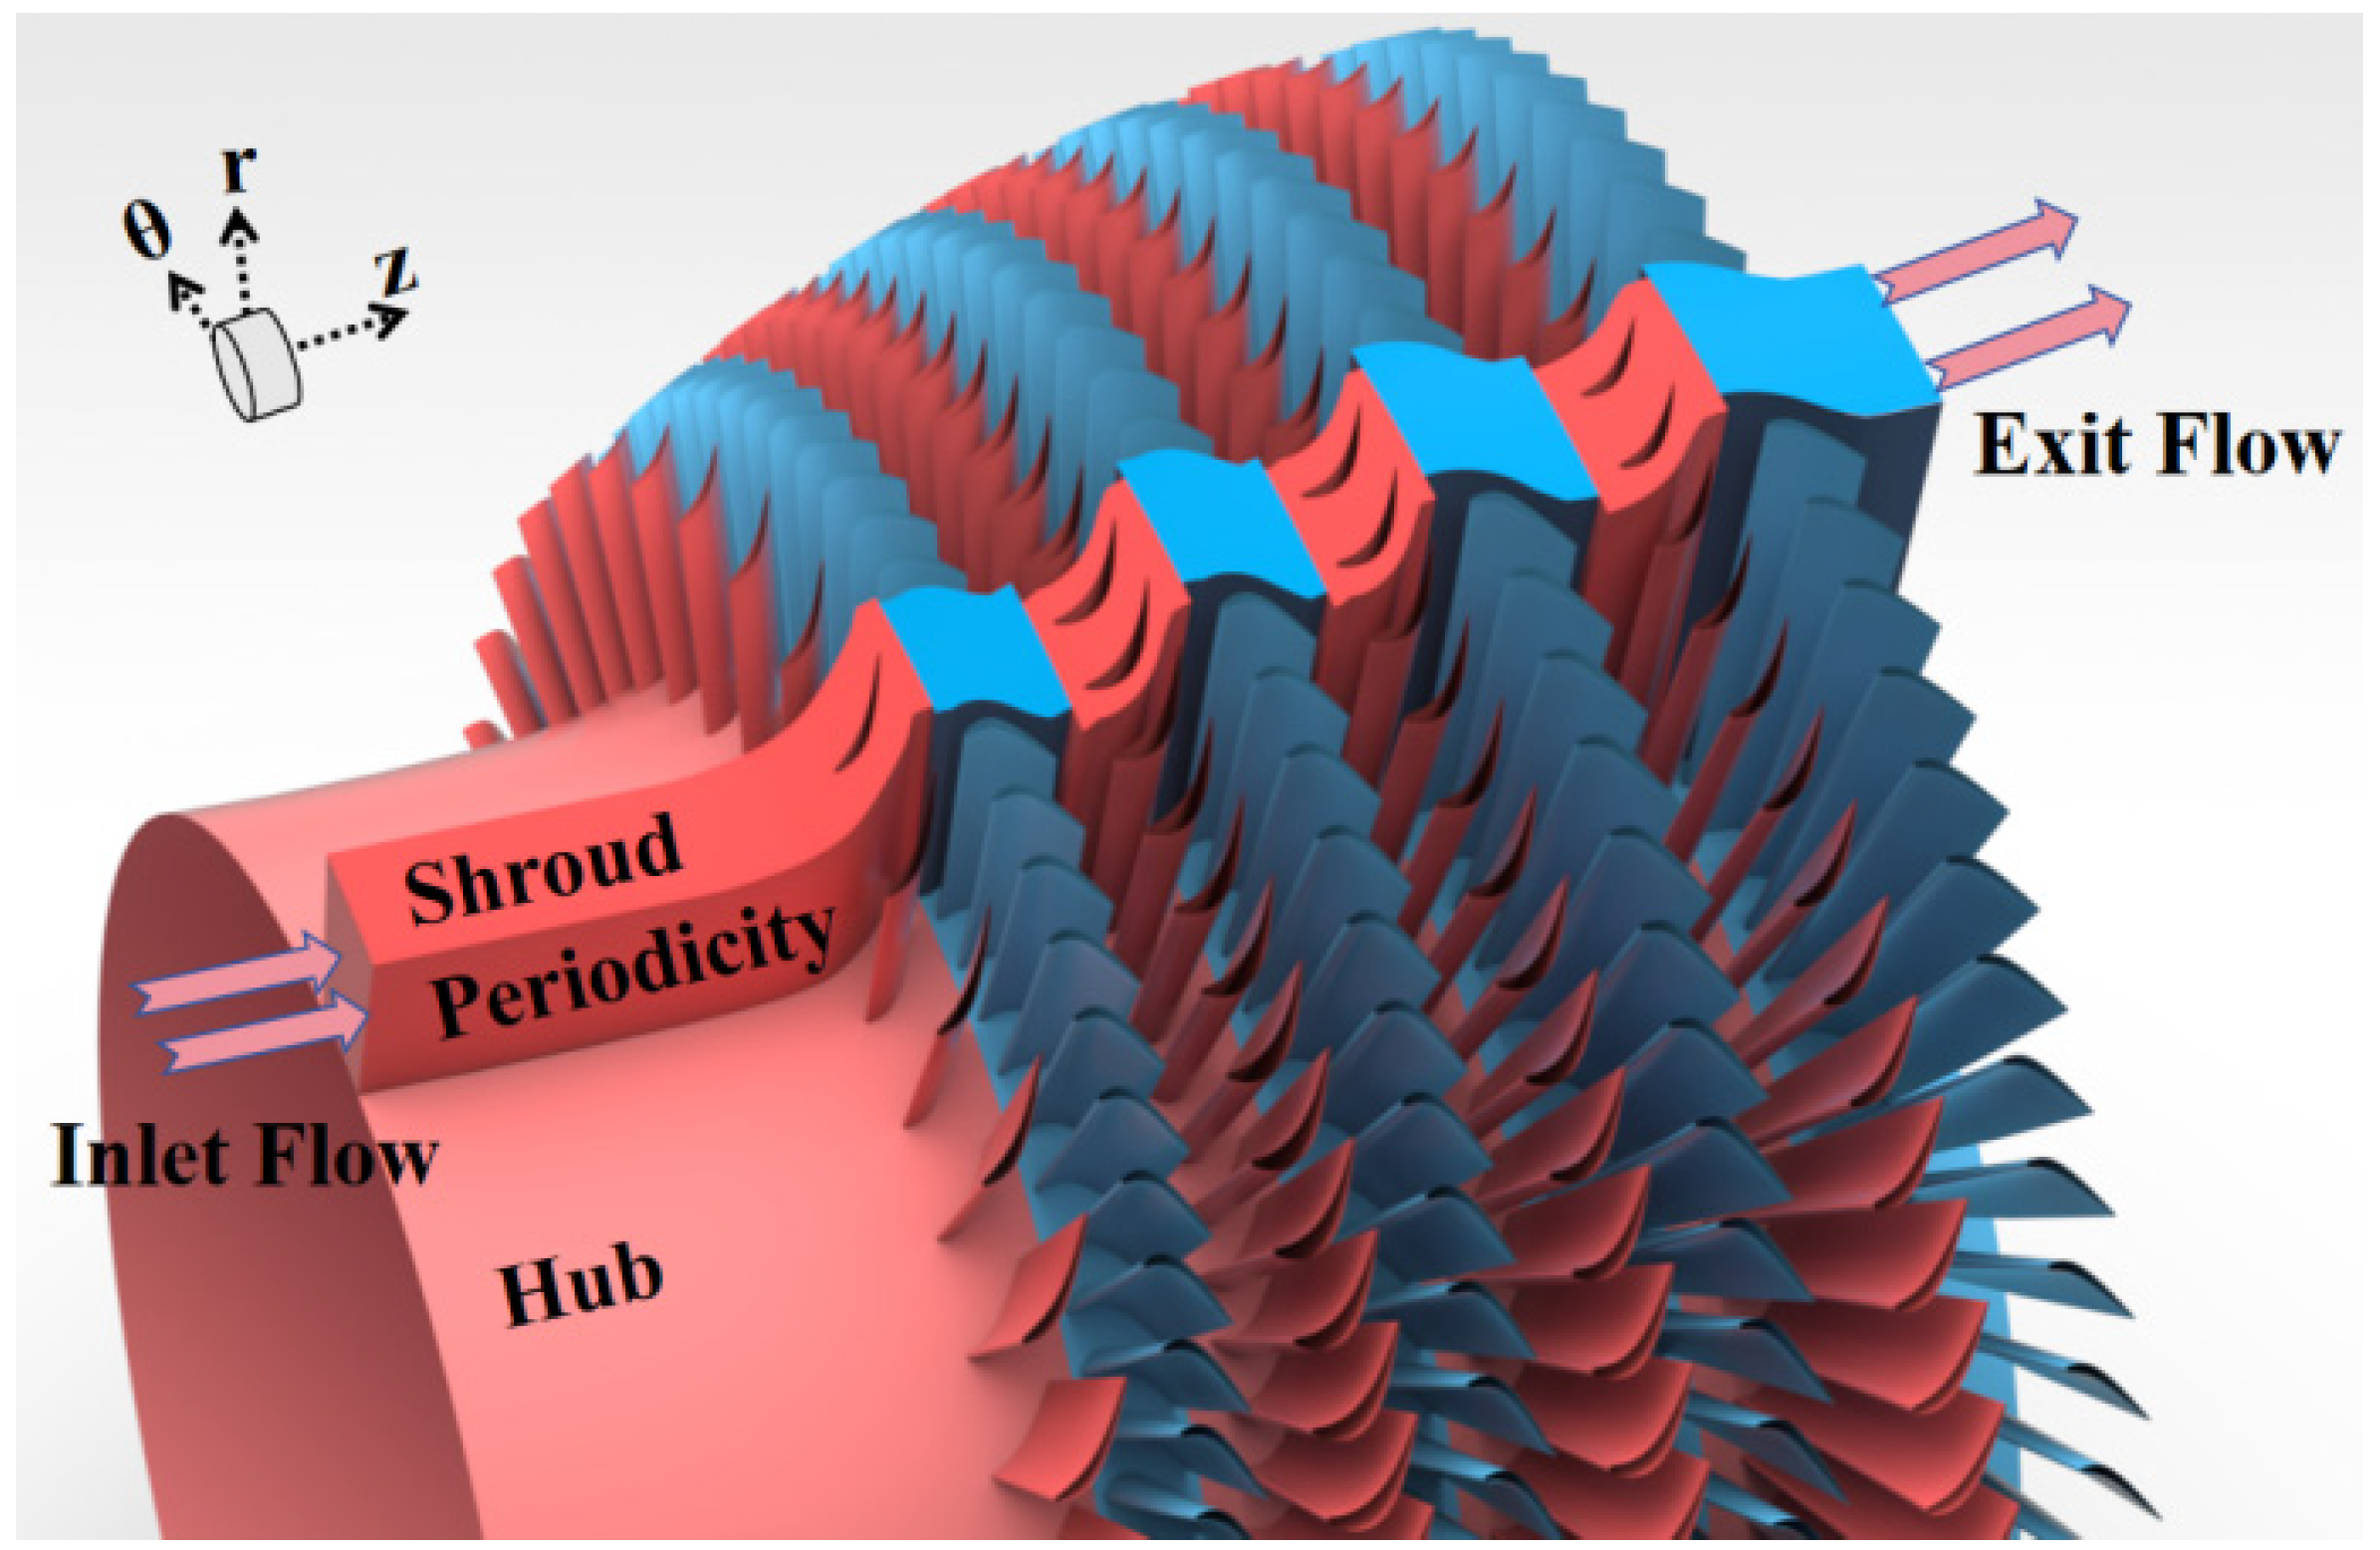
Figure 1.
Low-pressure turbine configuration.
Figure 1.
Low-pressure turbine configuration.
Figure 2.
The different blade gap conditions of the third stage: (a) AG-0.2, (b) AG-0.5, and (c) AG-0.8.
Figure 2.
The different blade gap conditions of the third stage: (a) AG-0.2, (b) AG-0.5, and (c) AG-0.8.
Figure 3.
Turbulence model validation.
Figure 3.
Turbulence model validation.
Figure 4.
Mesh configuration.
Figure 4.
Mesh configuration.
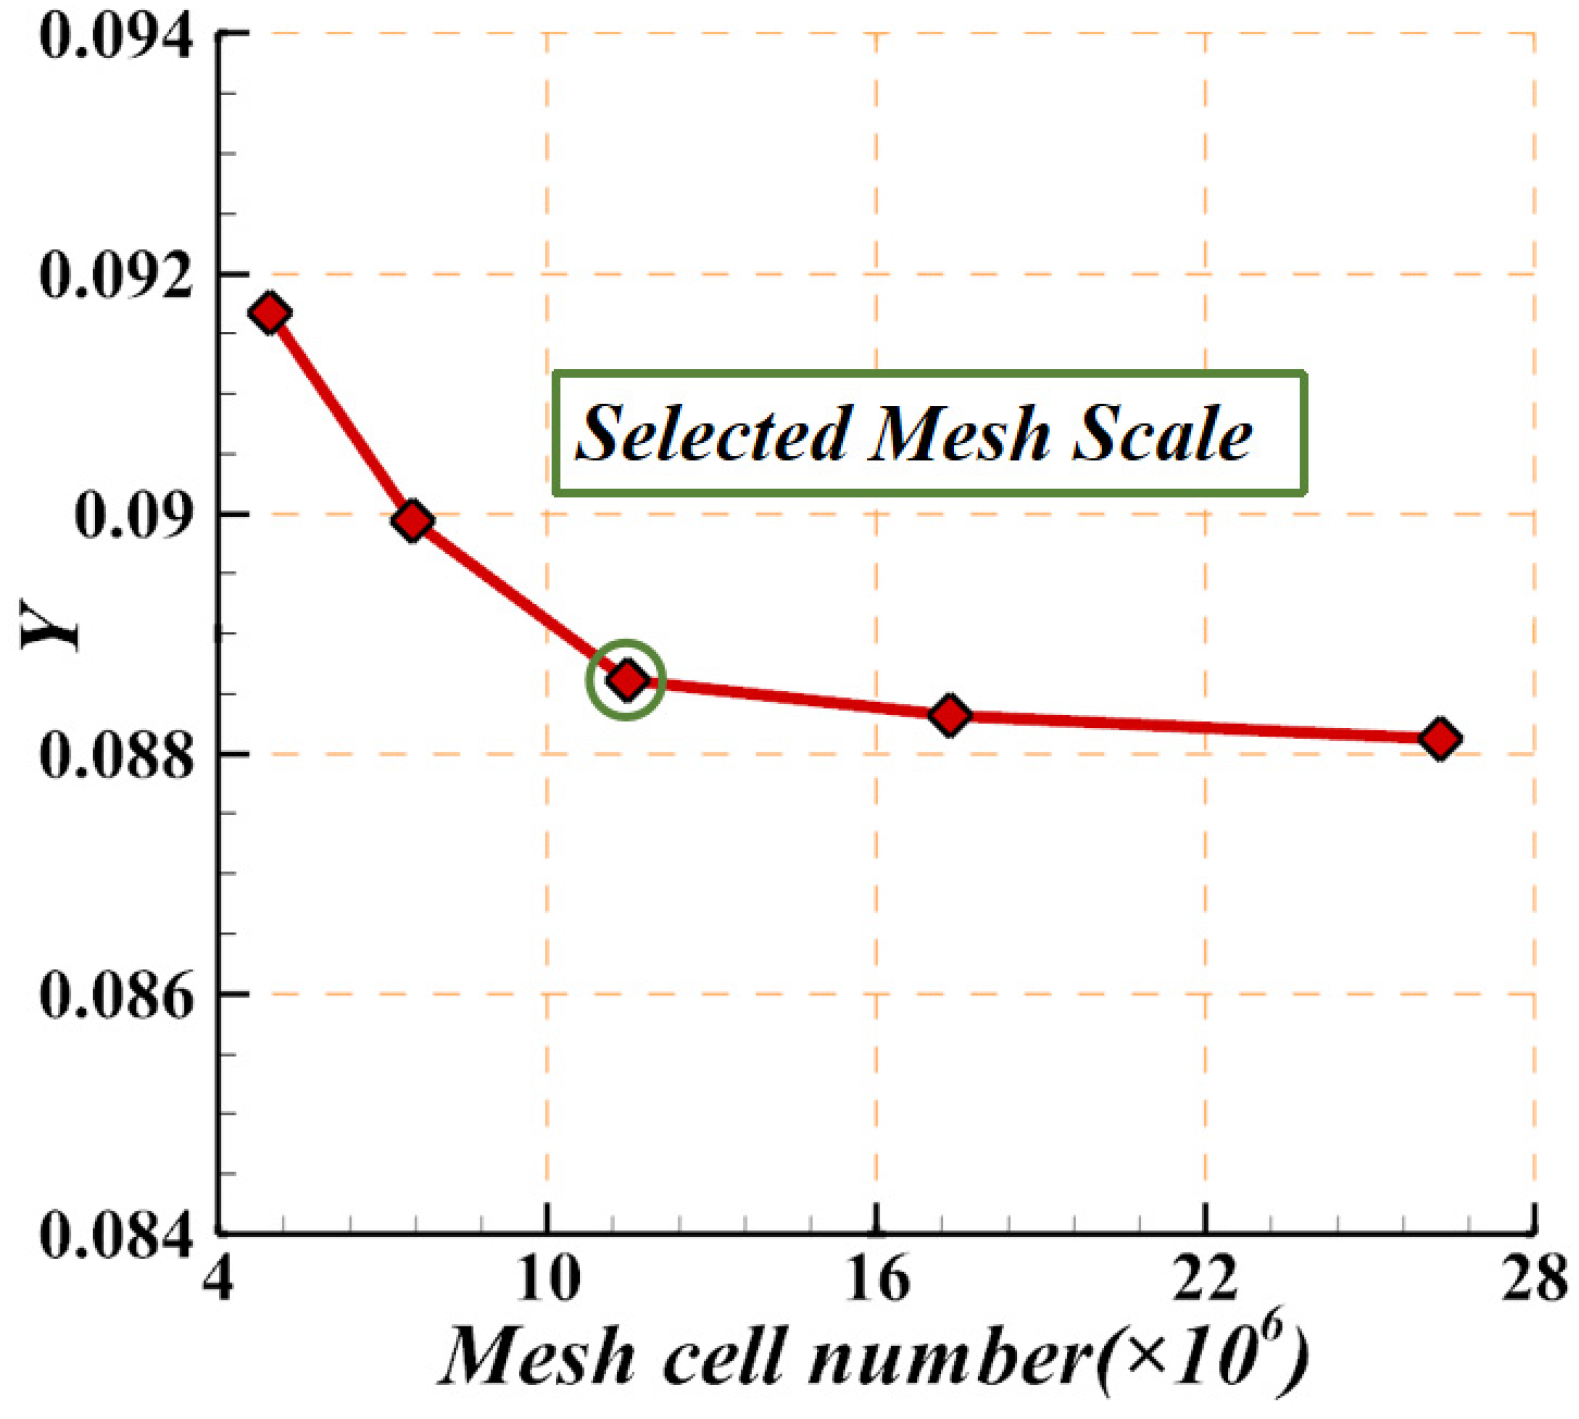
Figure 5.
Mesh sensitivity validation.
Figure 5.
Mesh sensitivity validation.
Figure 6.
Variation in efficiency with pressure ratio.
Figure 6.
Variation in efficiency with pressure ratio.
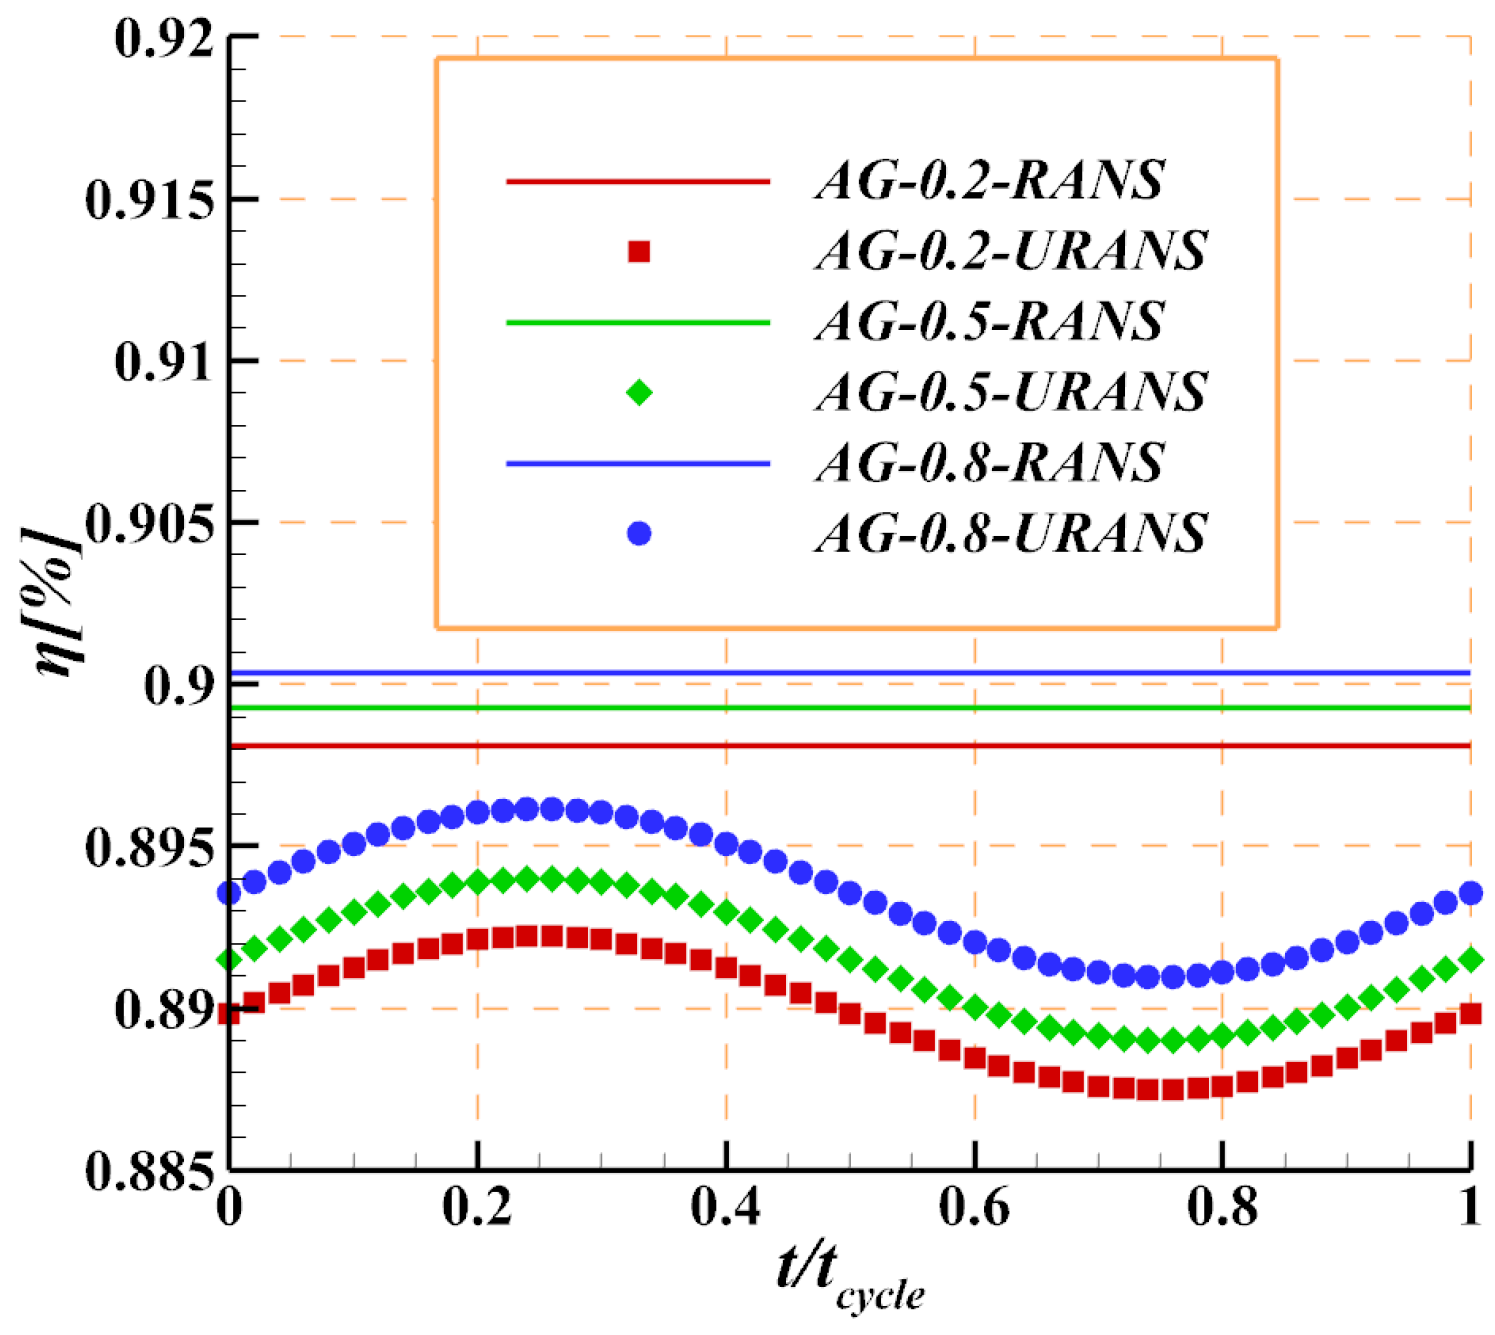
Figure 7.
Variation in efficiency in one cycle.
Figure 7.
Variation in efficiency in one cycle.
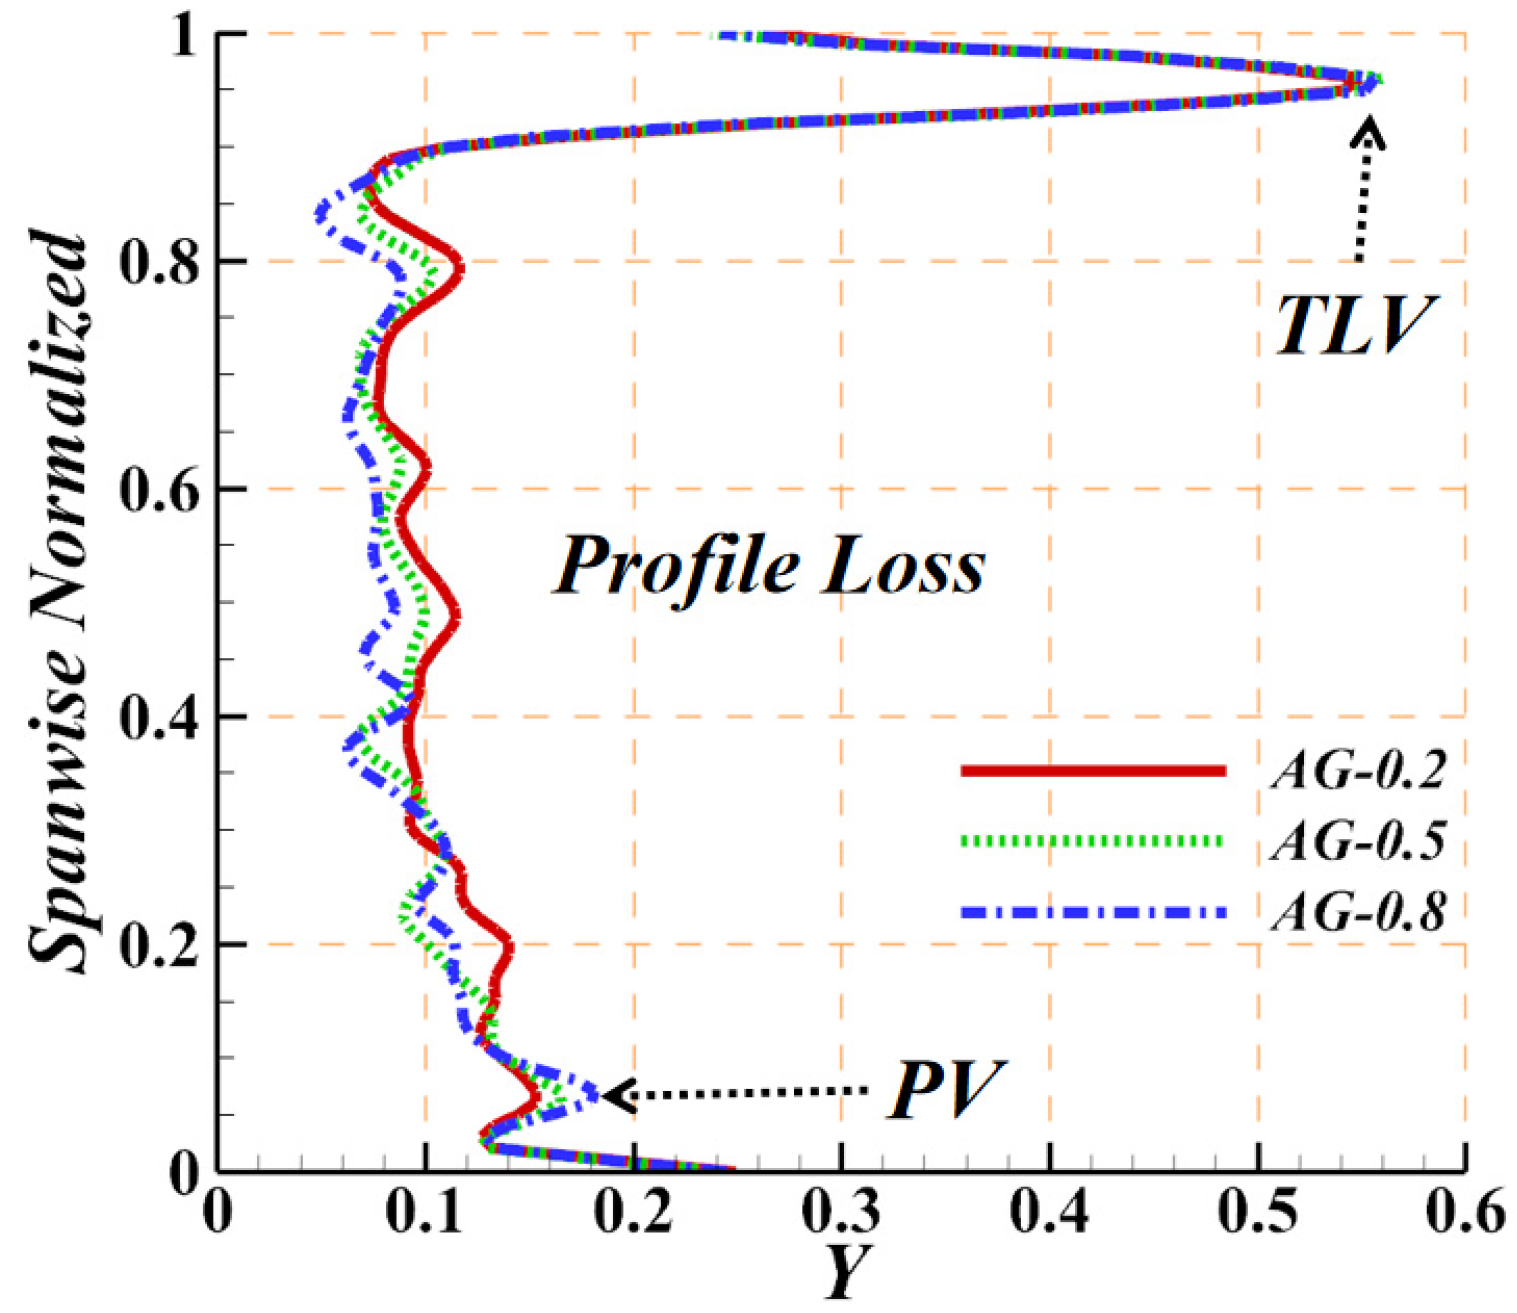
Figure 8.
Time-averaged radial distribution of circumferential Y at 0.3 times the axial chord length behind R3, corresponding to AG-0.2, AG-0.5, and AG-0.8.
Figure 8.
Time-averaged radial distribution of circumferential Y at 0.3 times the axial chord length behind R3, corresponding to AG-0.2, AG-0.5, and AG-0.8.
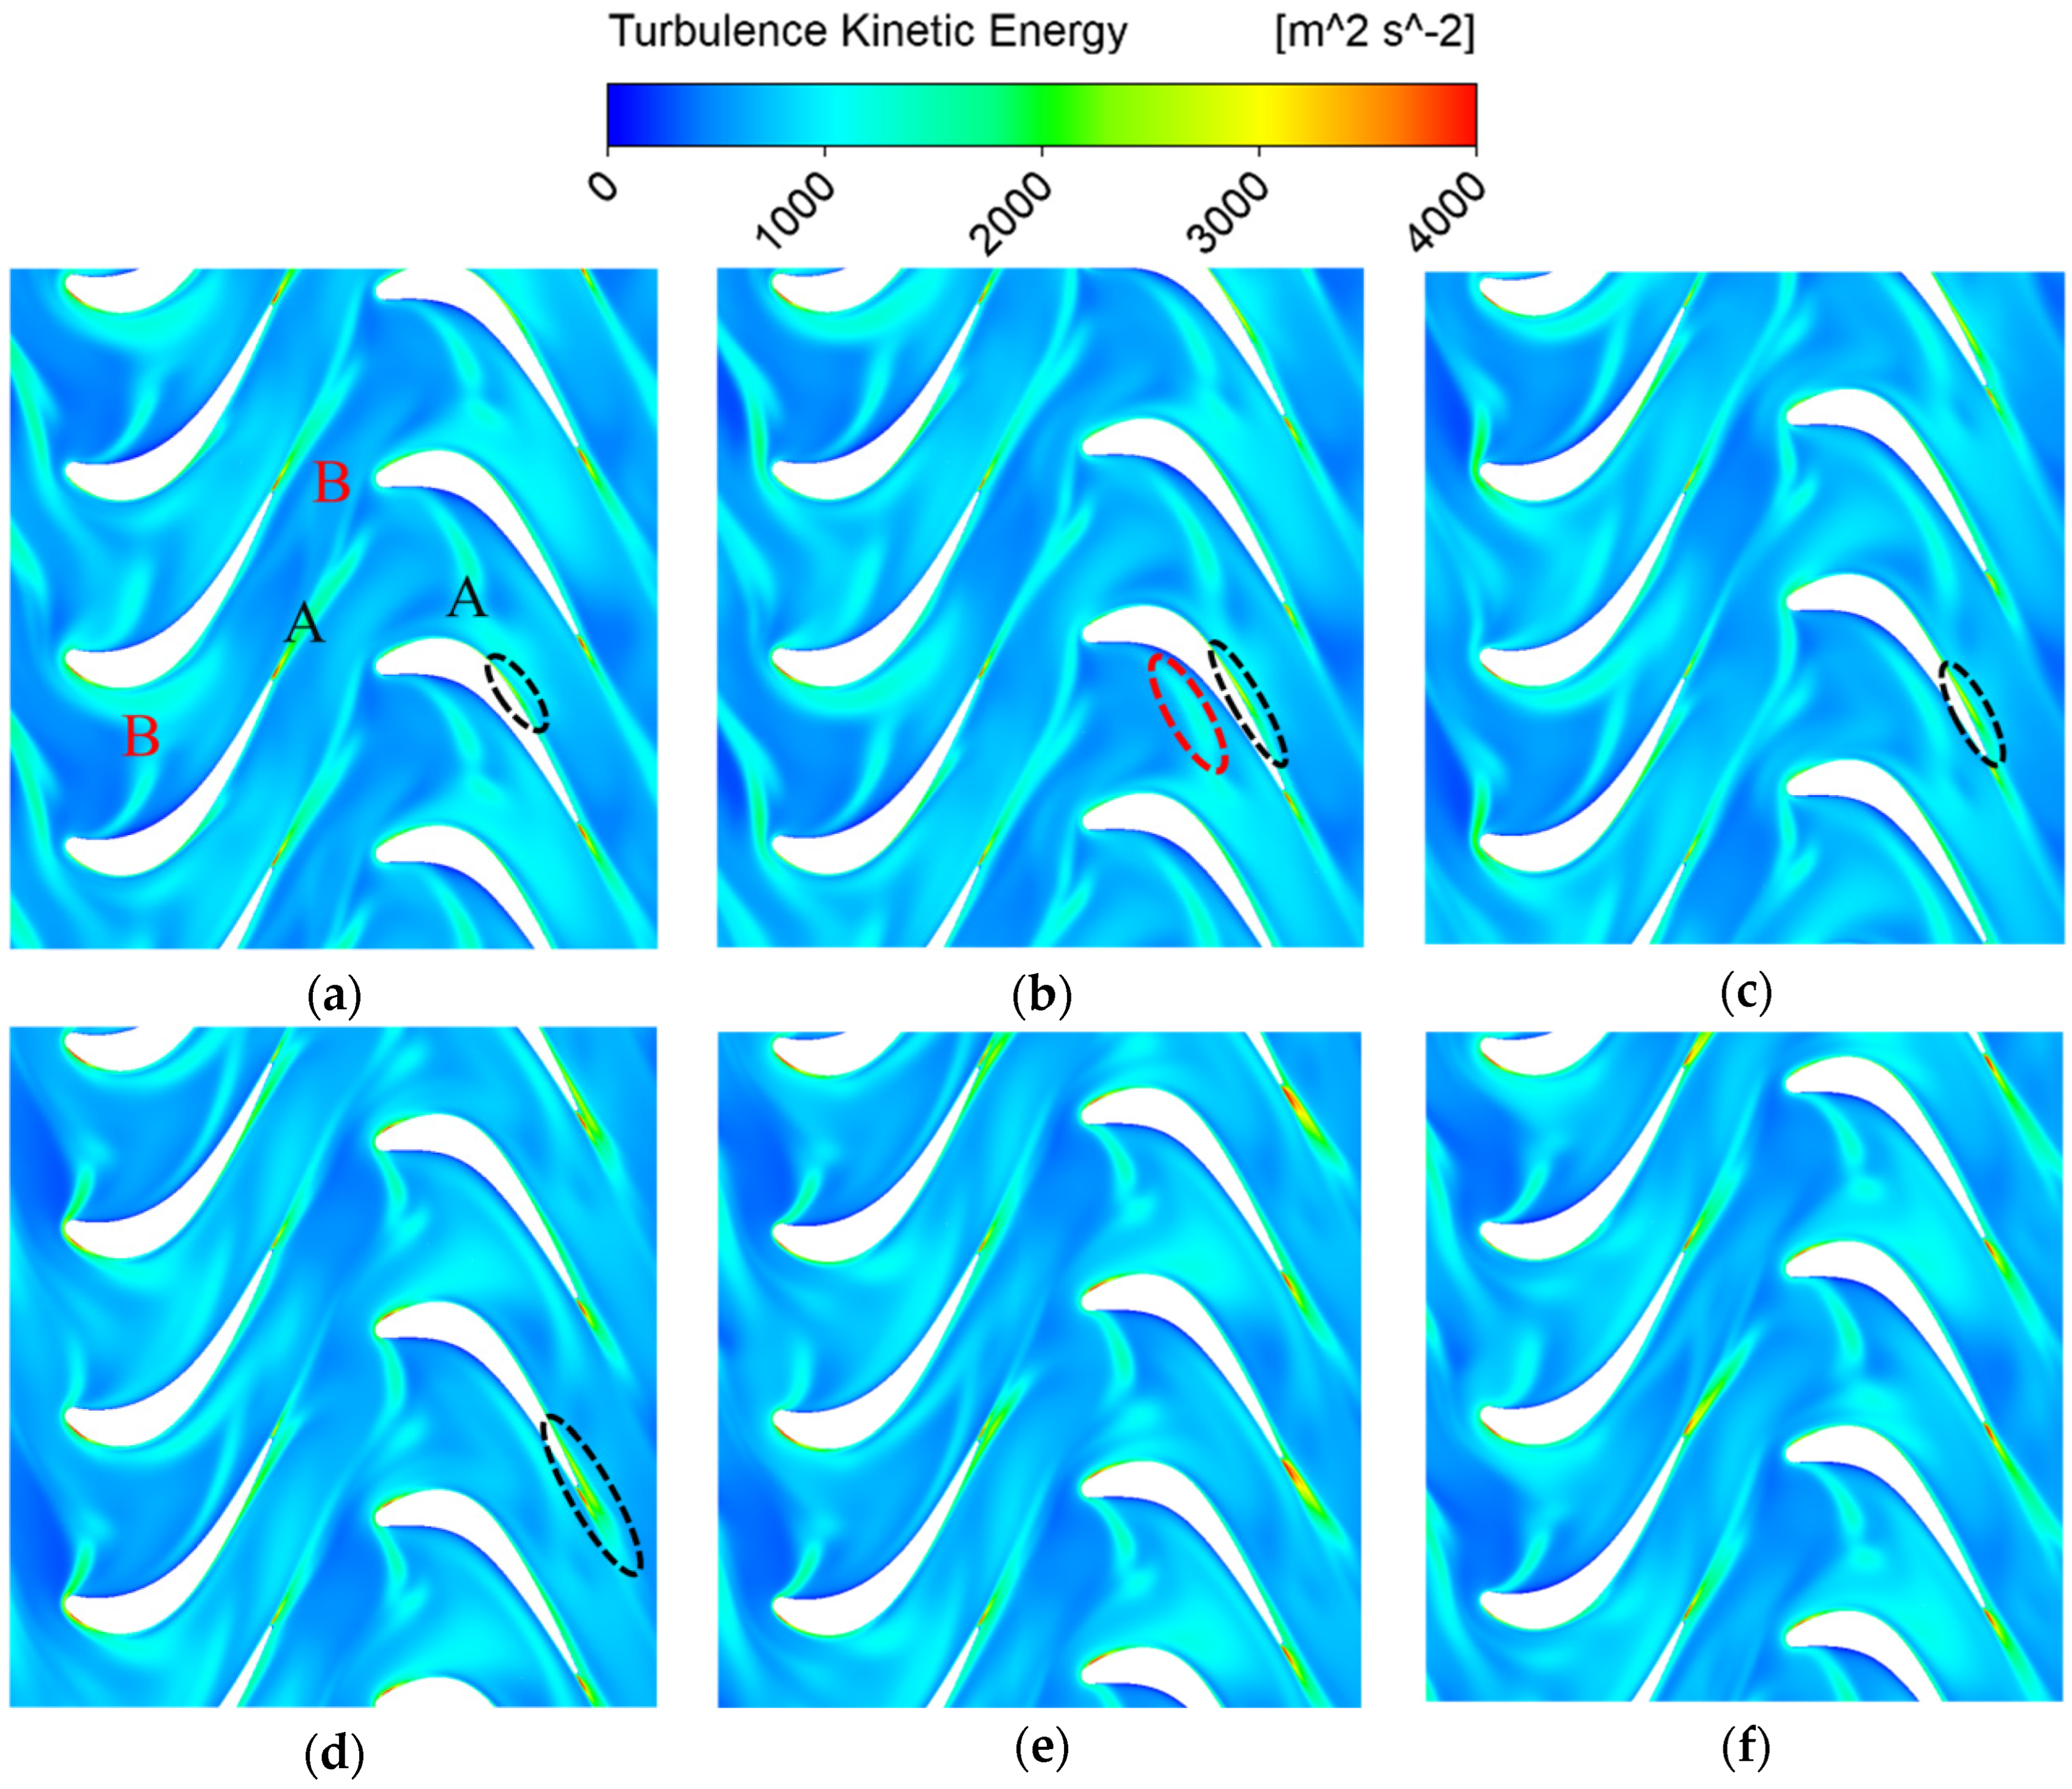
Figure 9.
TKE contours at different instants, (a) t/tcycle = 1/6, (b) t/tcycle = 2/6, (c) t/tcycle = 3/6, (d) t/tcycle = 4/6, (e) t/tcycle = 5/6, and (f) t/tcycle = 6/6, corresponding to the AG-0.5 simulation.
Figure 9.
TKE contours at different instants, (a) t/tcycle = 1/6, (b) t/tcycle = 2/6, (c) t/tcycle = 3/6, (d) t/tcycle = 4/6, (e) t/tcycle = 5/6, and (f) t/tcycle = 6/6, corresponding to the AG-0.5 simulation.
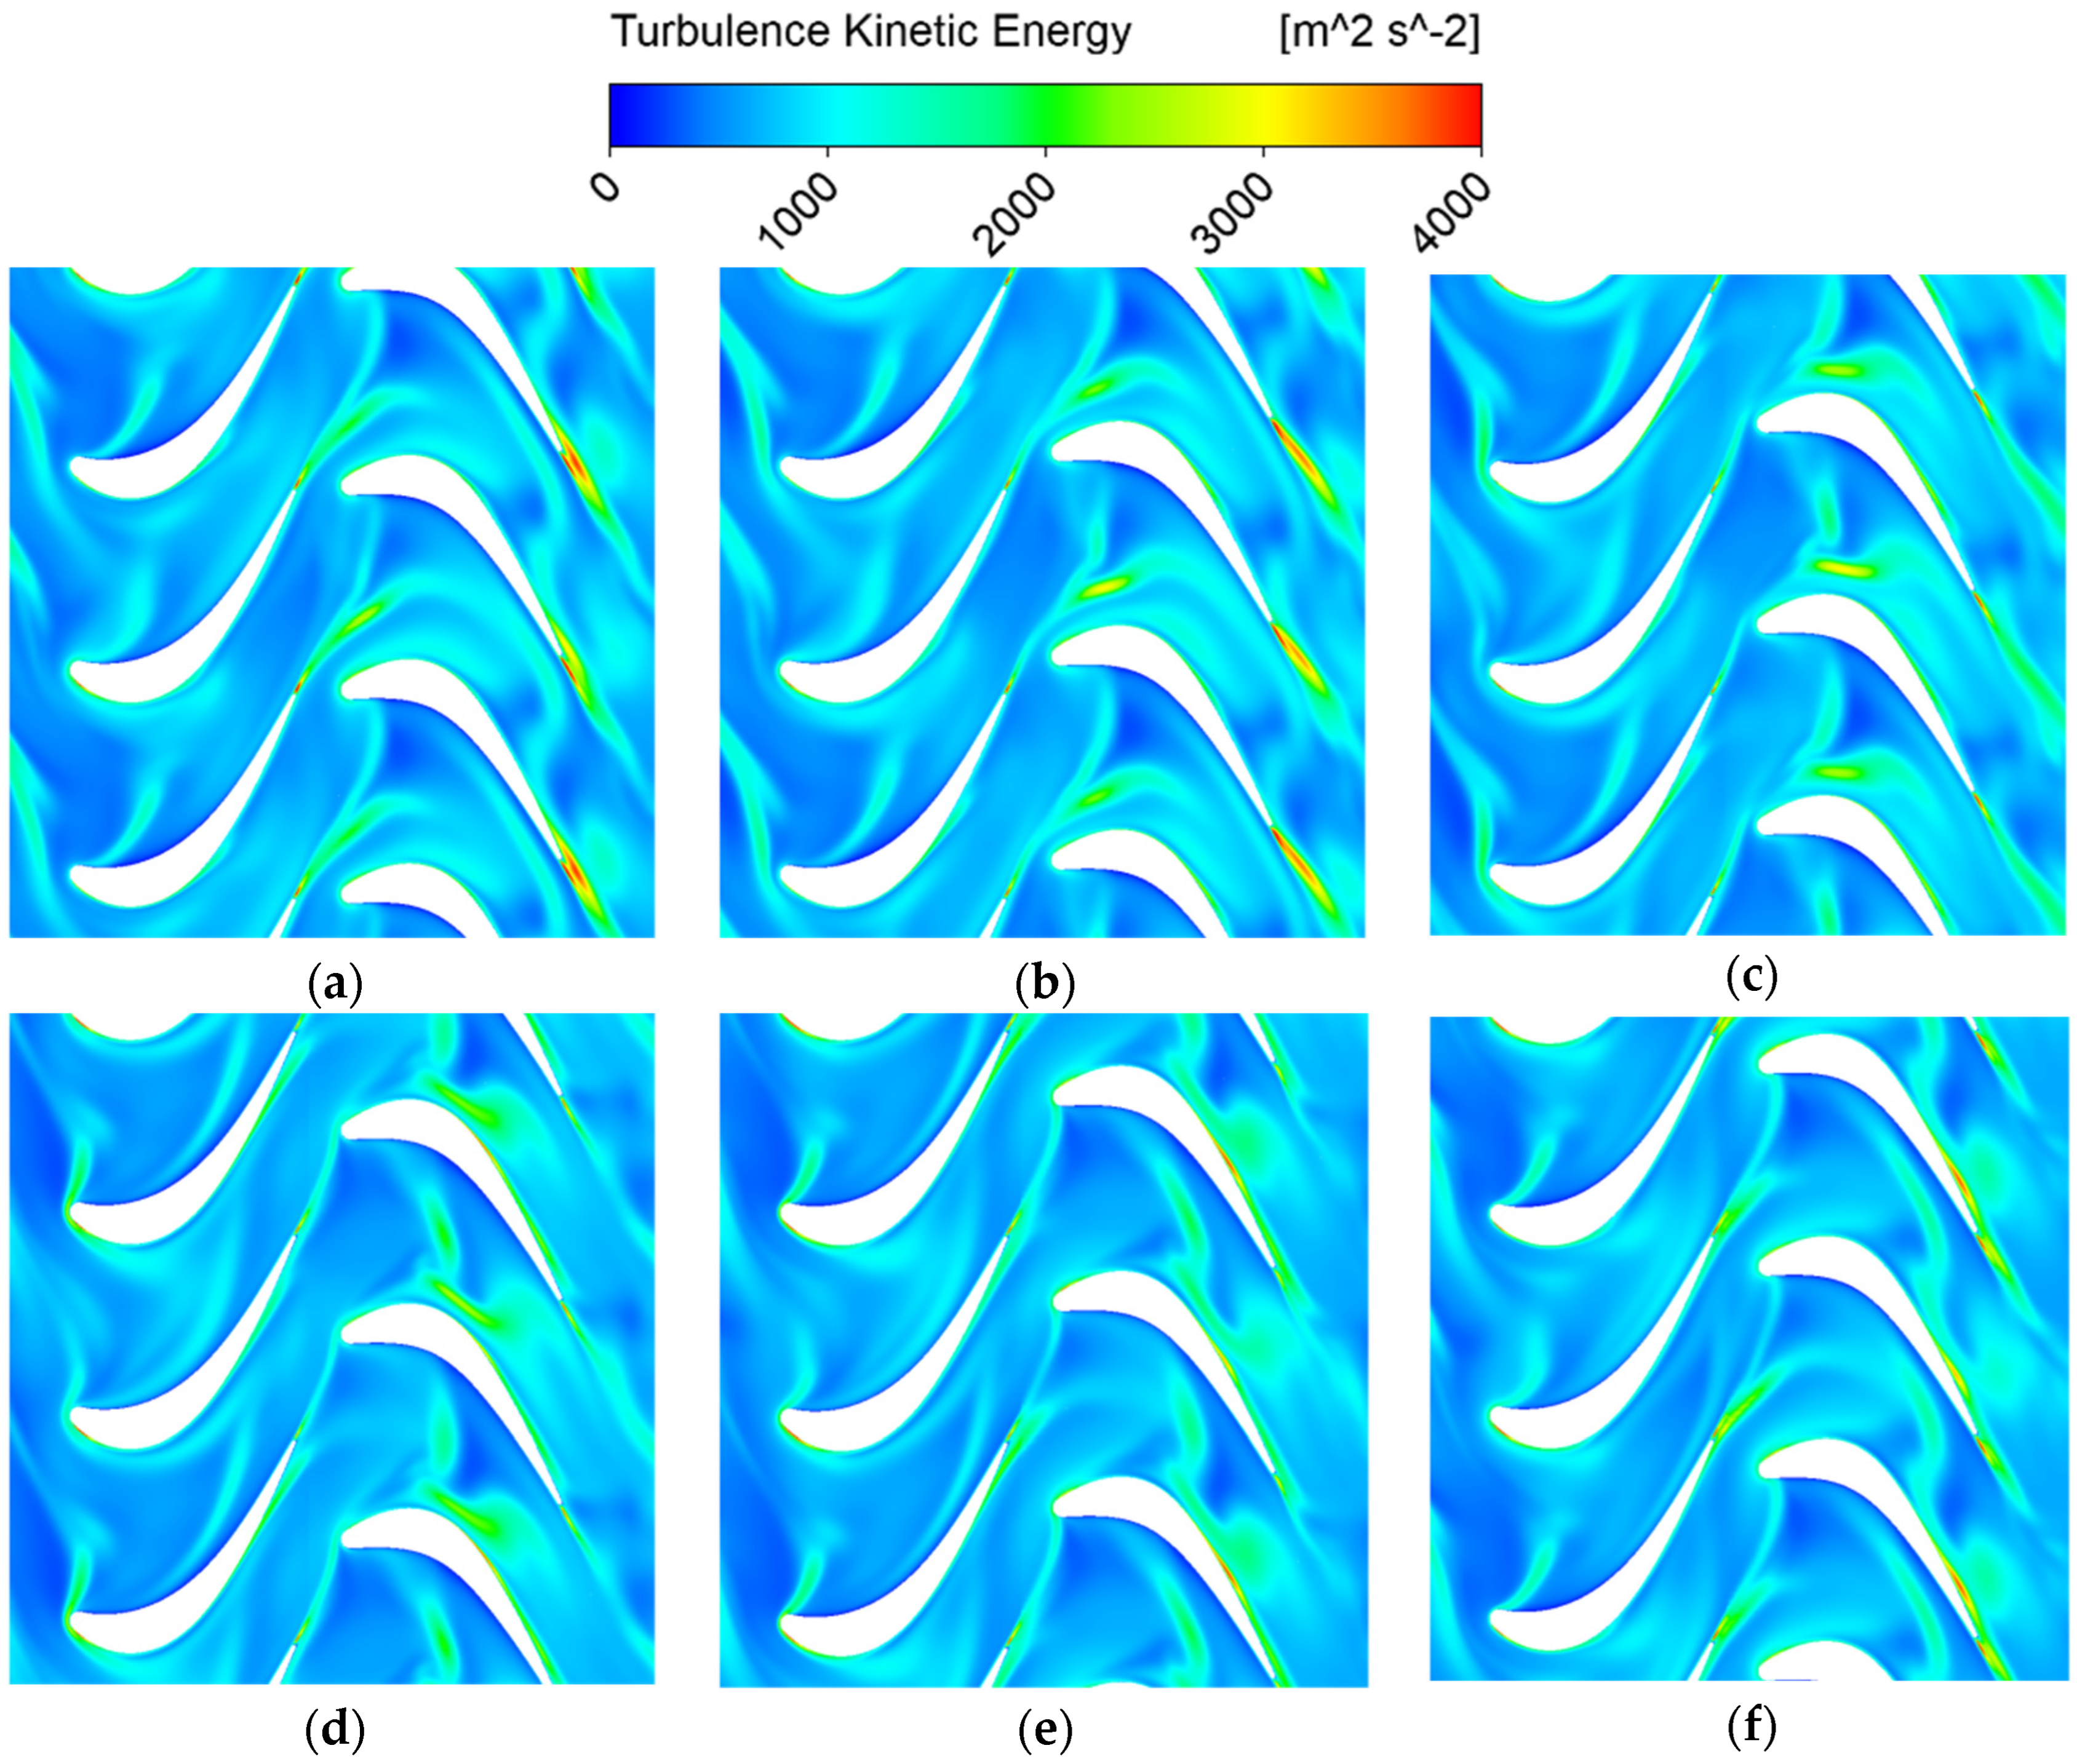
Figure 10.
TKE contours at different instants, (a) t/tcycle = 1/6, (b) t/tcycle = 2/6, (c) t/tcycle = 3/6, (d) t/tcycle = 4/6 (e), t/tcycle = 5/6, and (f) t/tcycle = 6/6, corresponding to the AG-0.2 simulation.
Figure 10.
TKE contours at different instants, (a) t/tcycle = 1/6, (b) t/tcycle = 2/6, (c) t/tcycle = 3/6, (d) t/tcycle = 4/6 (e), t/tcycle = 5/6, and (f) t/tcycle = 6/6, corresponding to the AG-0.2 simulation.
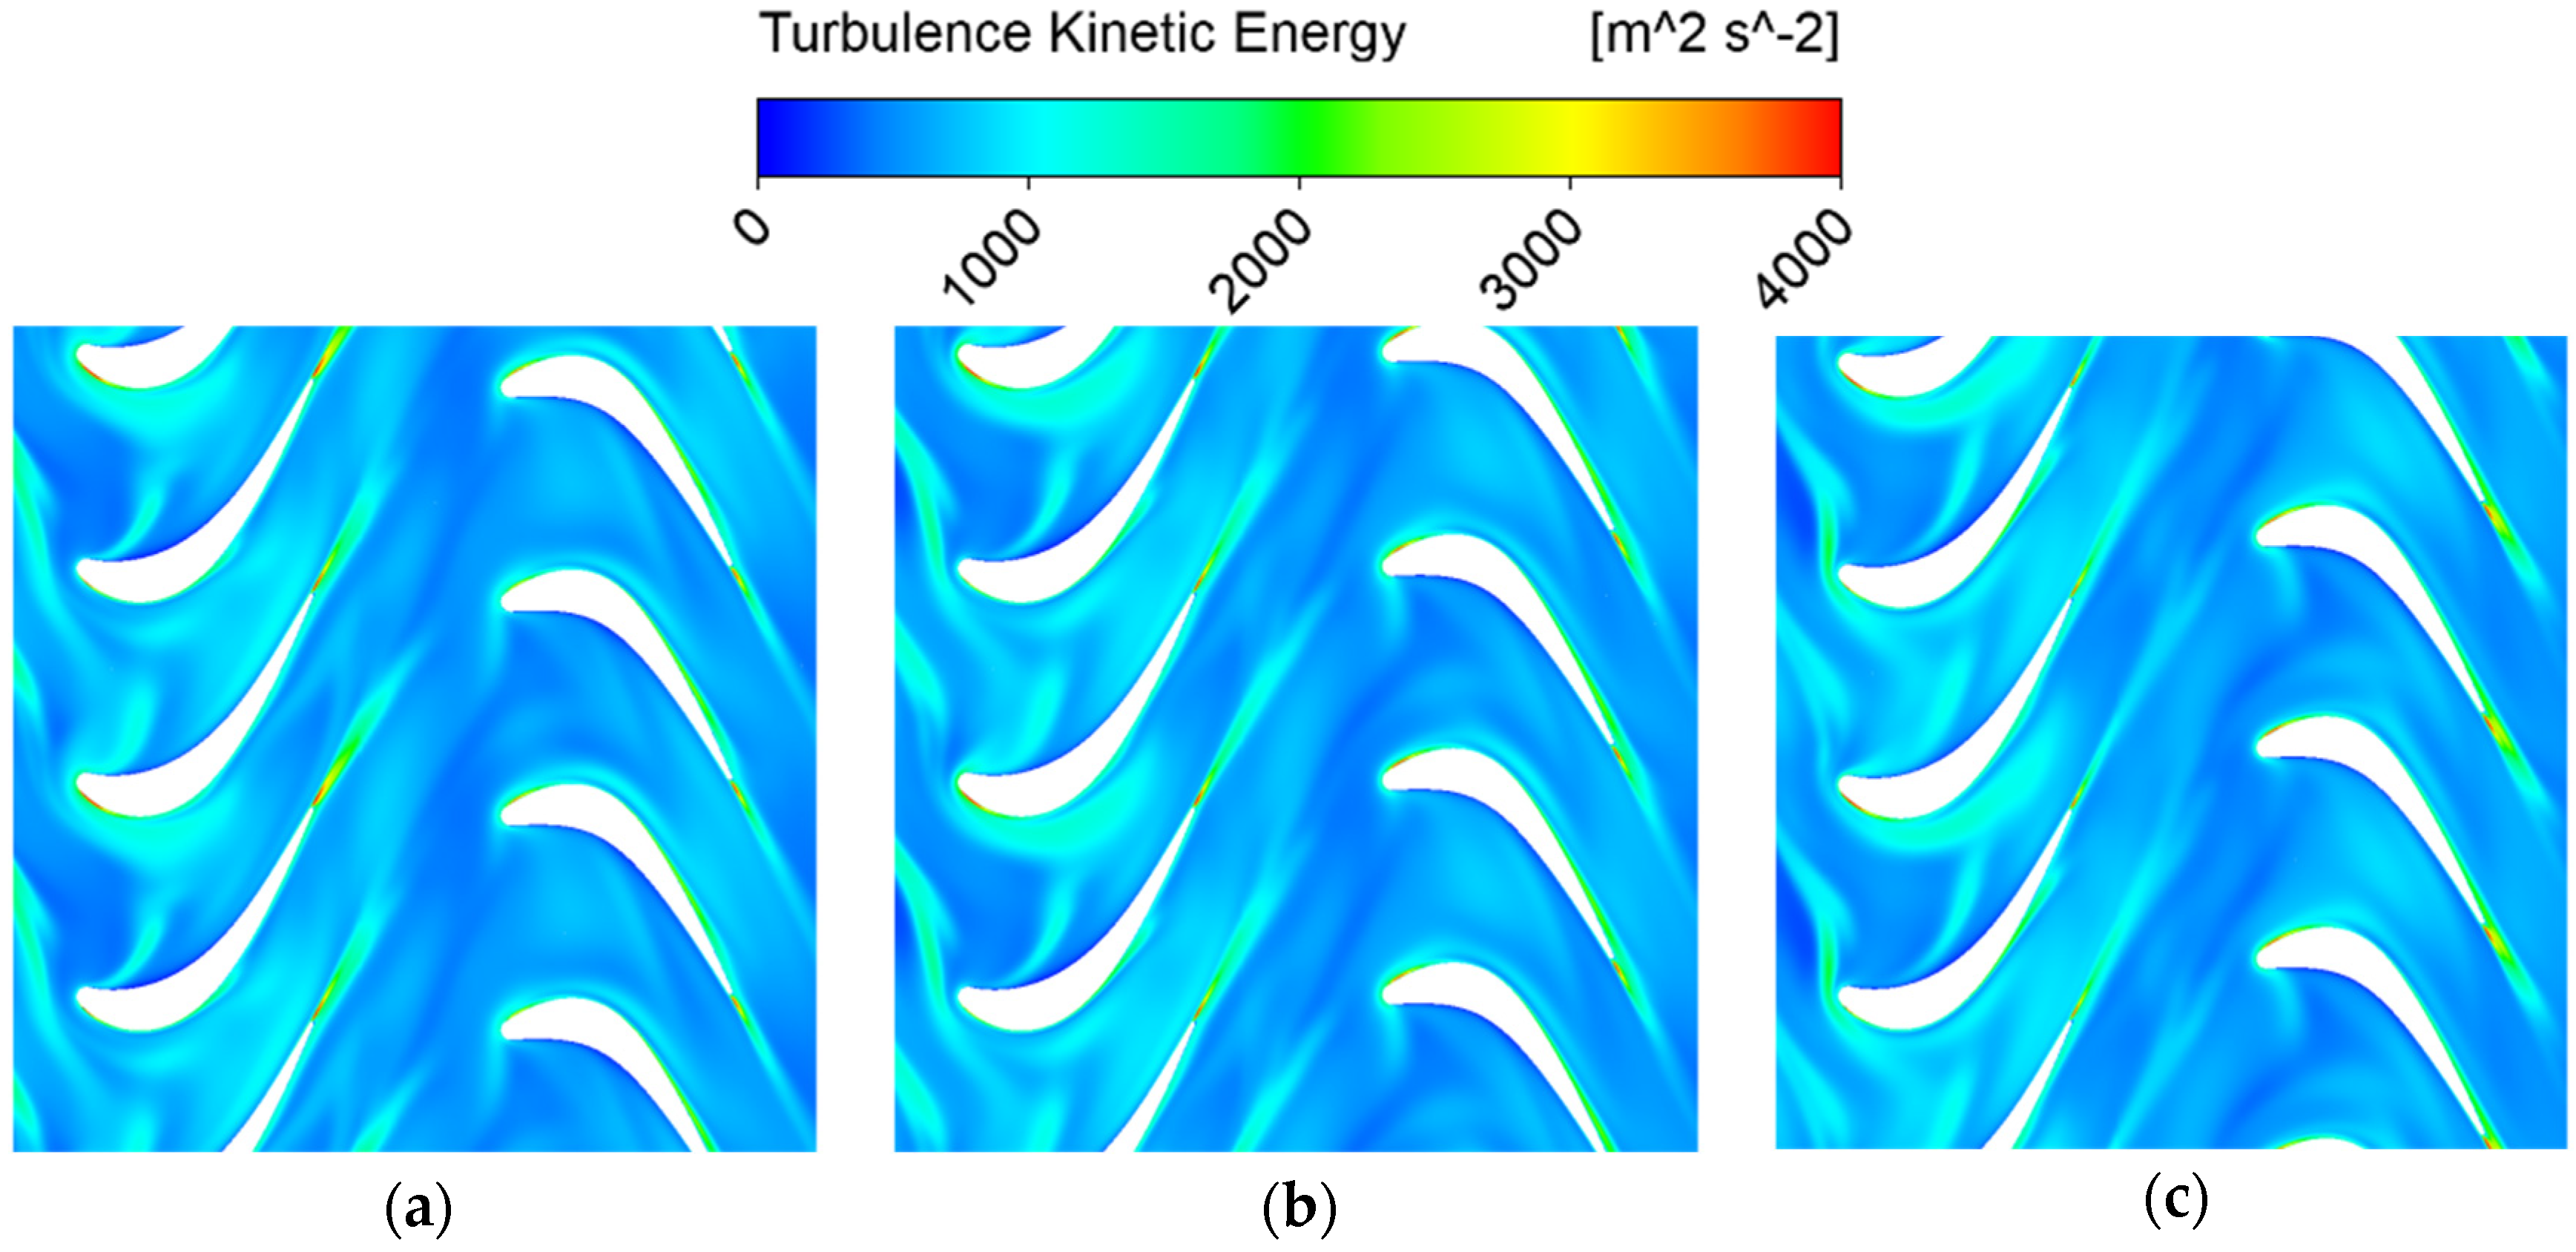
Figure 11.
TKE contours at different instants, (a) t/tcycle = 1/6, (b) t/tcycle = 2/6, (c) t/tcycle = 3/6, (d) t/tcycle = 4/6, (e) t/tcycle = 5/6, and (f) t/tcycle = 6/6, corresponding to the AG-0.8 simulation.
Figure 11.
TKE contours at different instants, (a) t/tcycle = 1/6, (b) t/tcycle = 2/6, (c) t/tcycle = 3/6, (d) t/tcycle = 4/6, (e) t/tcycle = 5/6, and (f) t/tcycle = 6/6, corresponding to the AG-0.8 simulation.
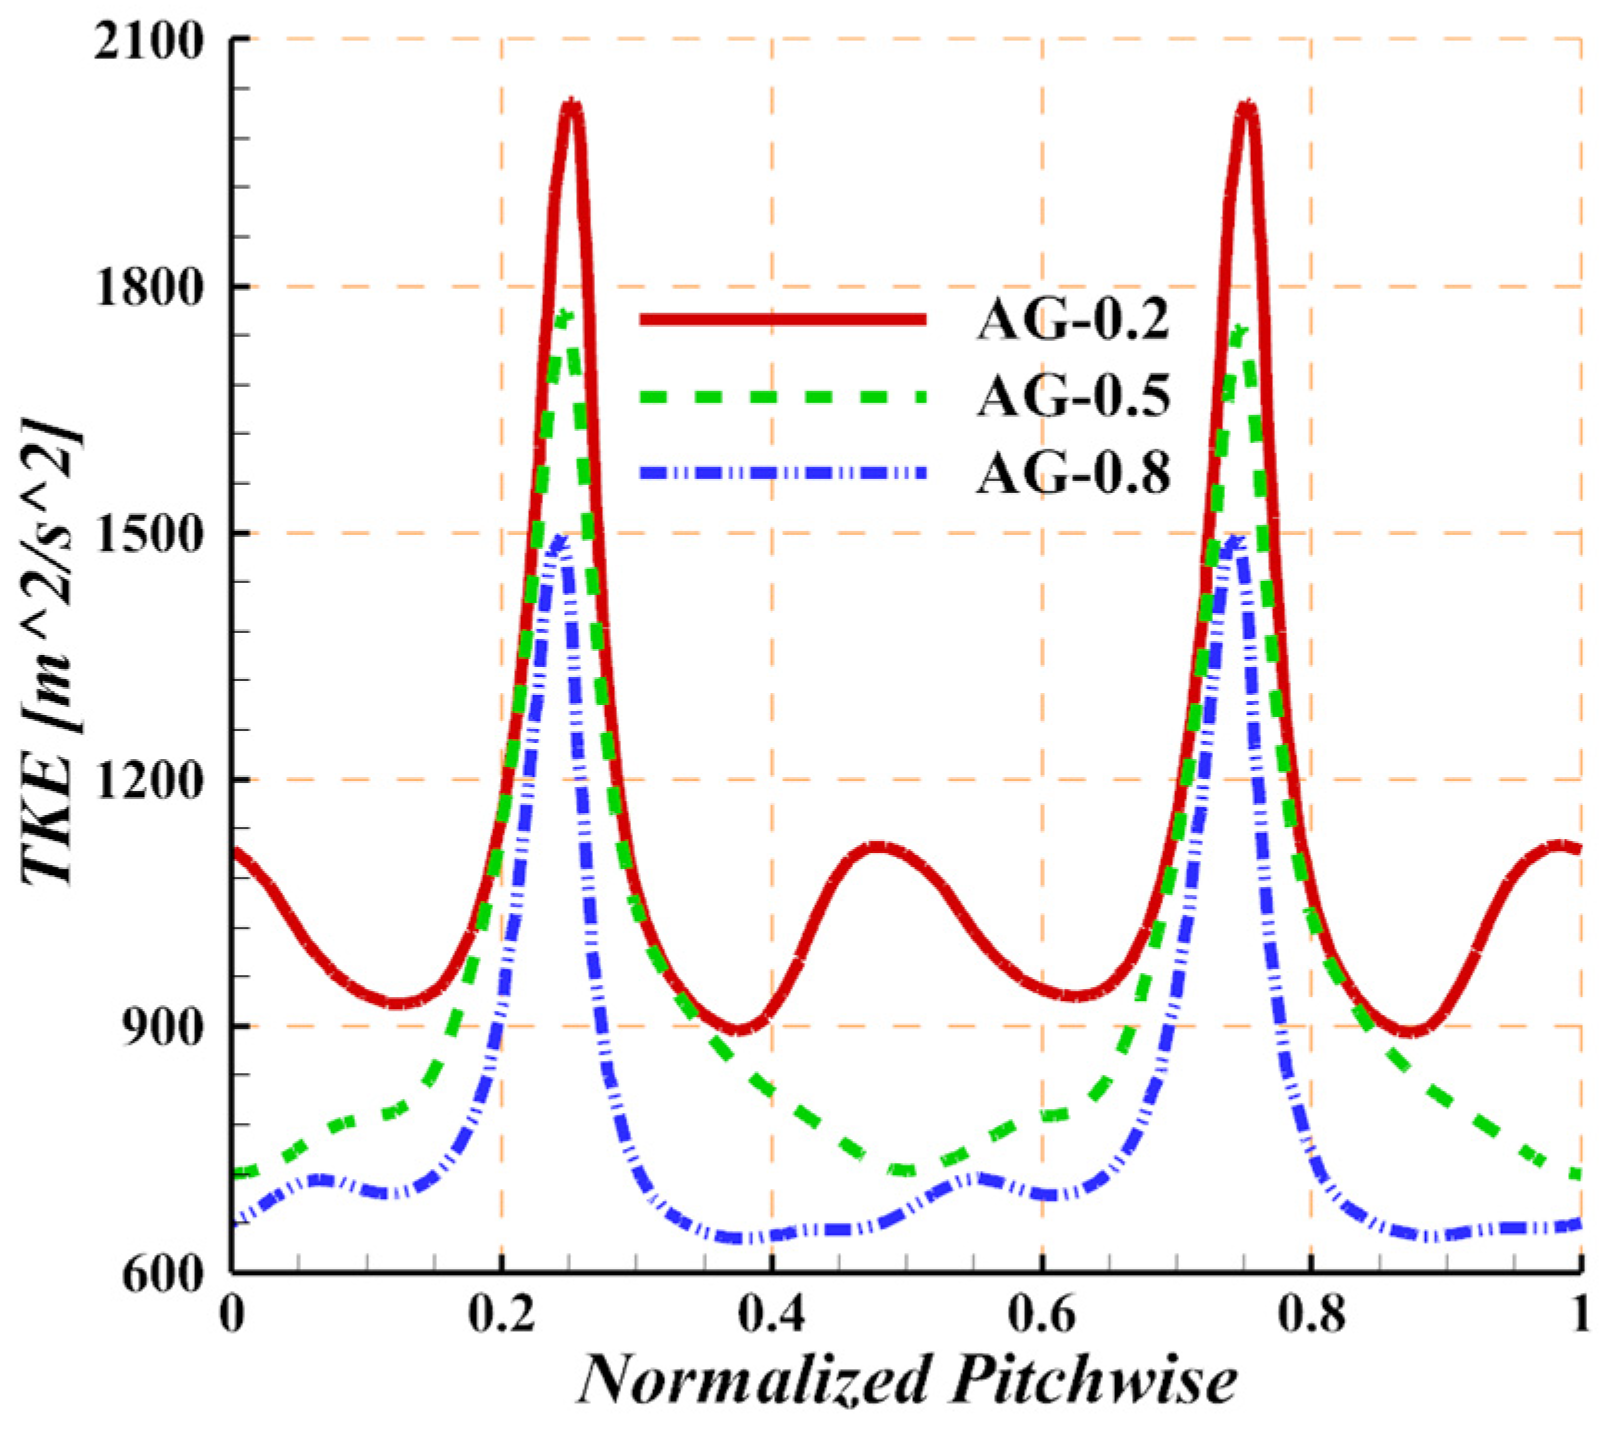
Figure 12.
Incoming wake intensity just upstream of the R3 leading edge.
Figure 12.
Incoming wake intensity just upstream of the R3 leading edge.
Figure 13.
Velocities at different time instants corresponding to (a) AG-0.2, (b) AG-0.5, and (c) AG-0.8.
Figure 13.
Velocities at different time instants corresponding to (a) AG-0.2, (b) AG-0.5, and (c) AG-0.8.
Figure 14.
Distribution of the pressure coefficient variation on the R3 midspan over one cycle corresponding to (a) AG-0.2, (b) AG-0.5, and (c) AG-0.8.
Figure 14.
Distribution of the pressure coefficient variation on the R3 midspan over one cycle corresponding to (a) AG-0.2, (b) AG-0.5, and (c) AG-0.8.
Figure 15.
Distribution of the time-averaged pressure coefficient on the R3 midspan.
Figure 15.
Distribution of the time-averaged pressure coefficient on the R3 midspan.
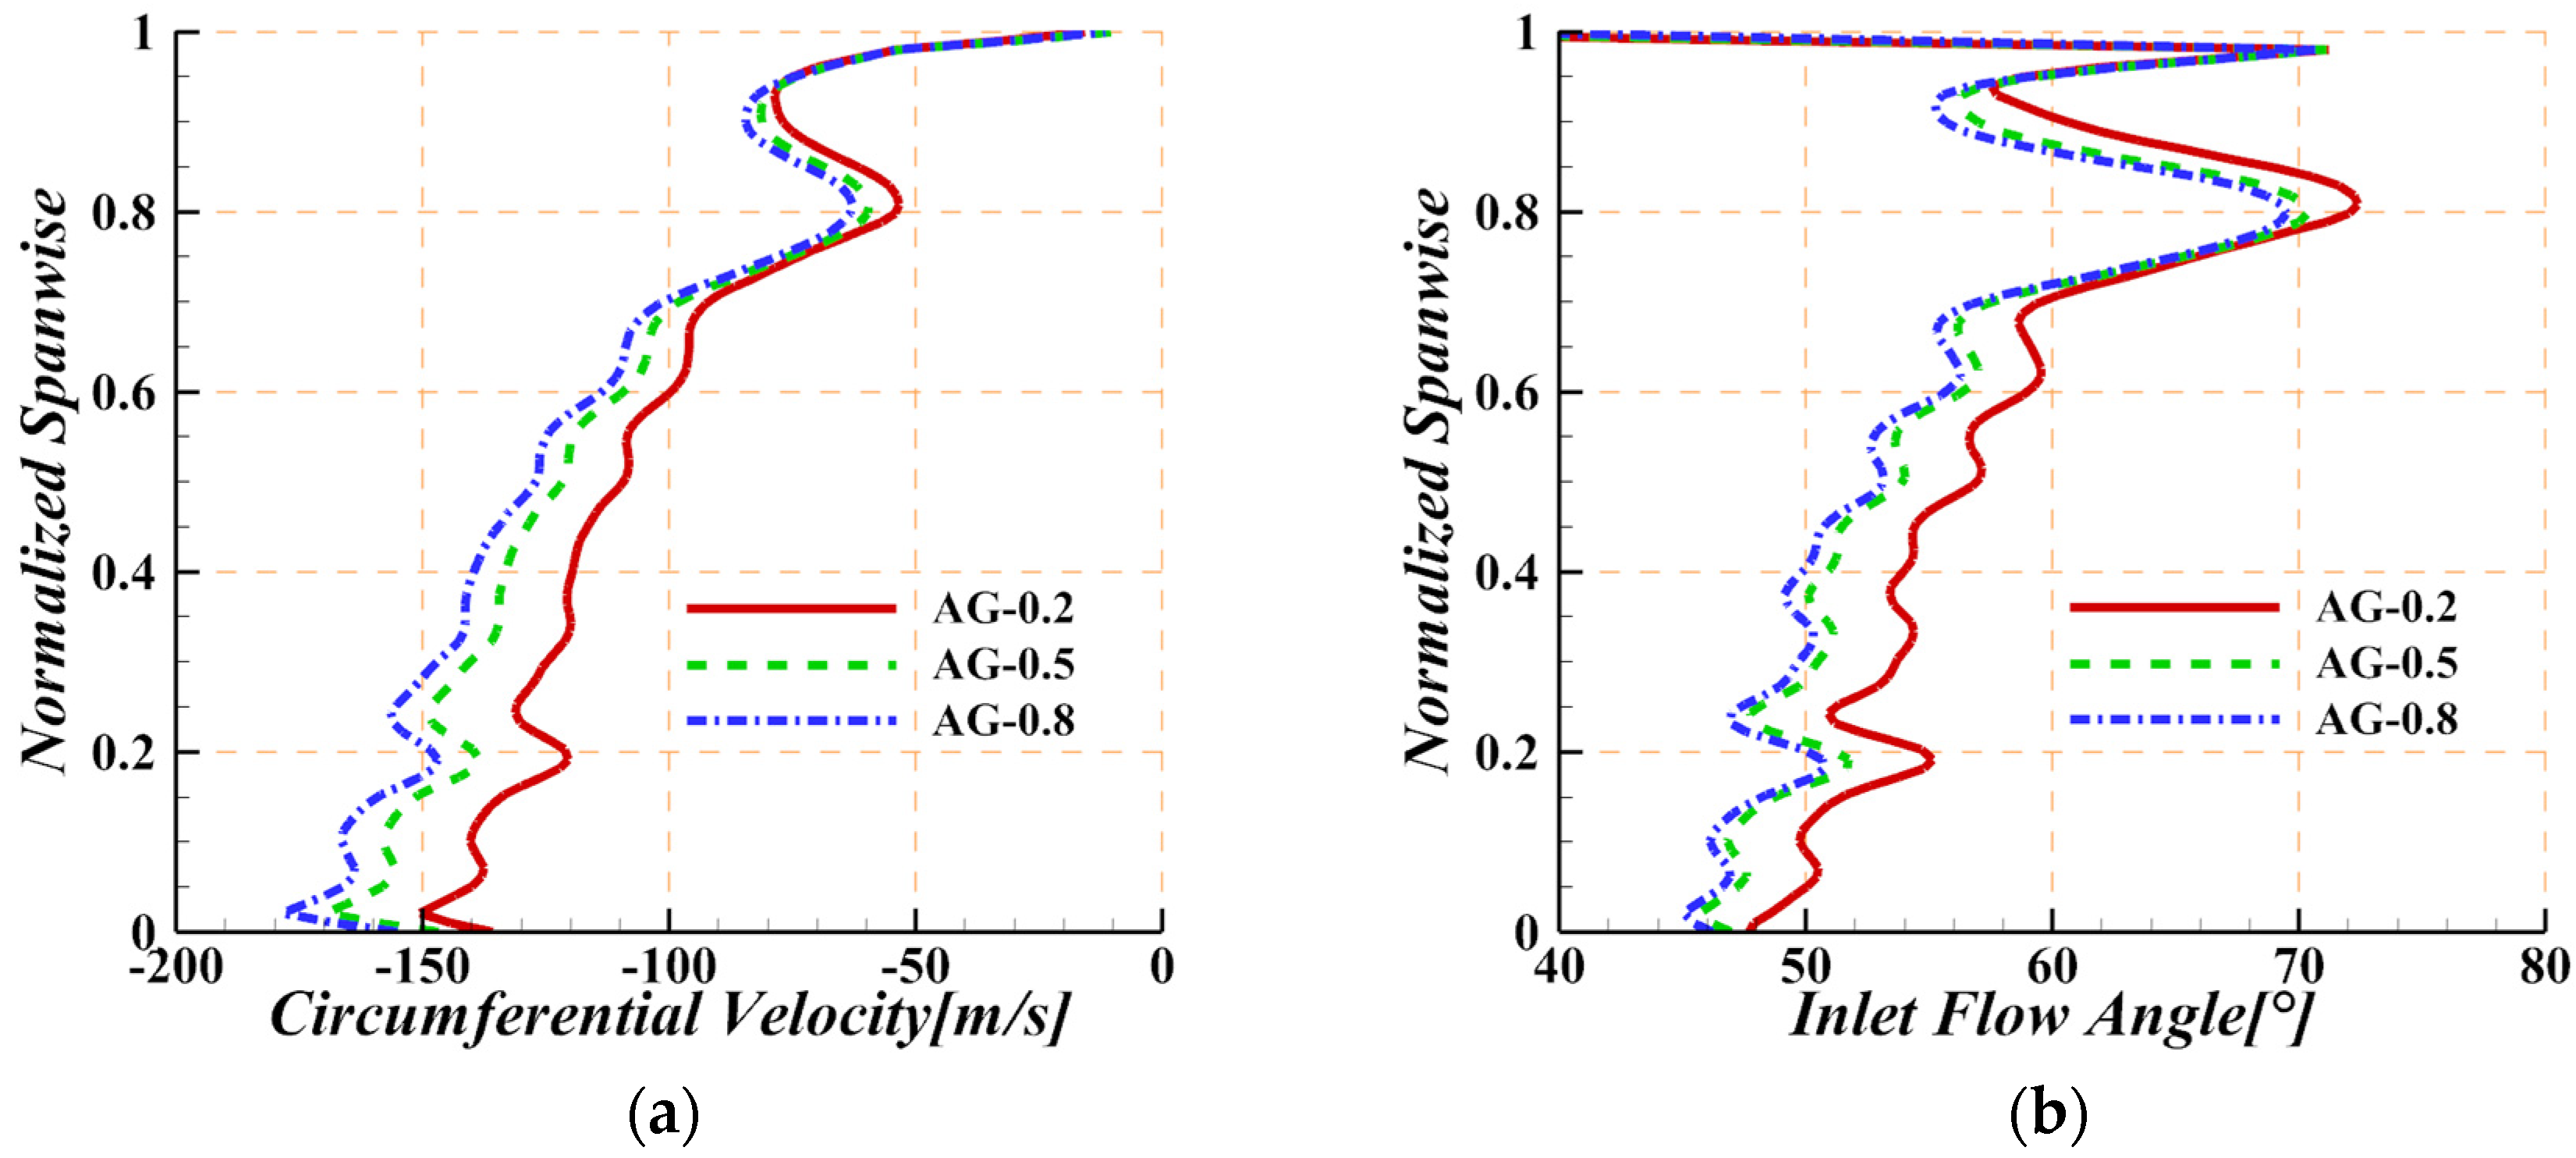
Figure 16.
Time-averaged (a) circumferential velocity and (b) inlet flow angle at the leading edge of the R3 blade.
Figure 16.
Time-averaged (a) circumferential velocity and (b) inlet flow angle at the leading edge of the R3 blade.
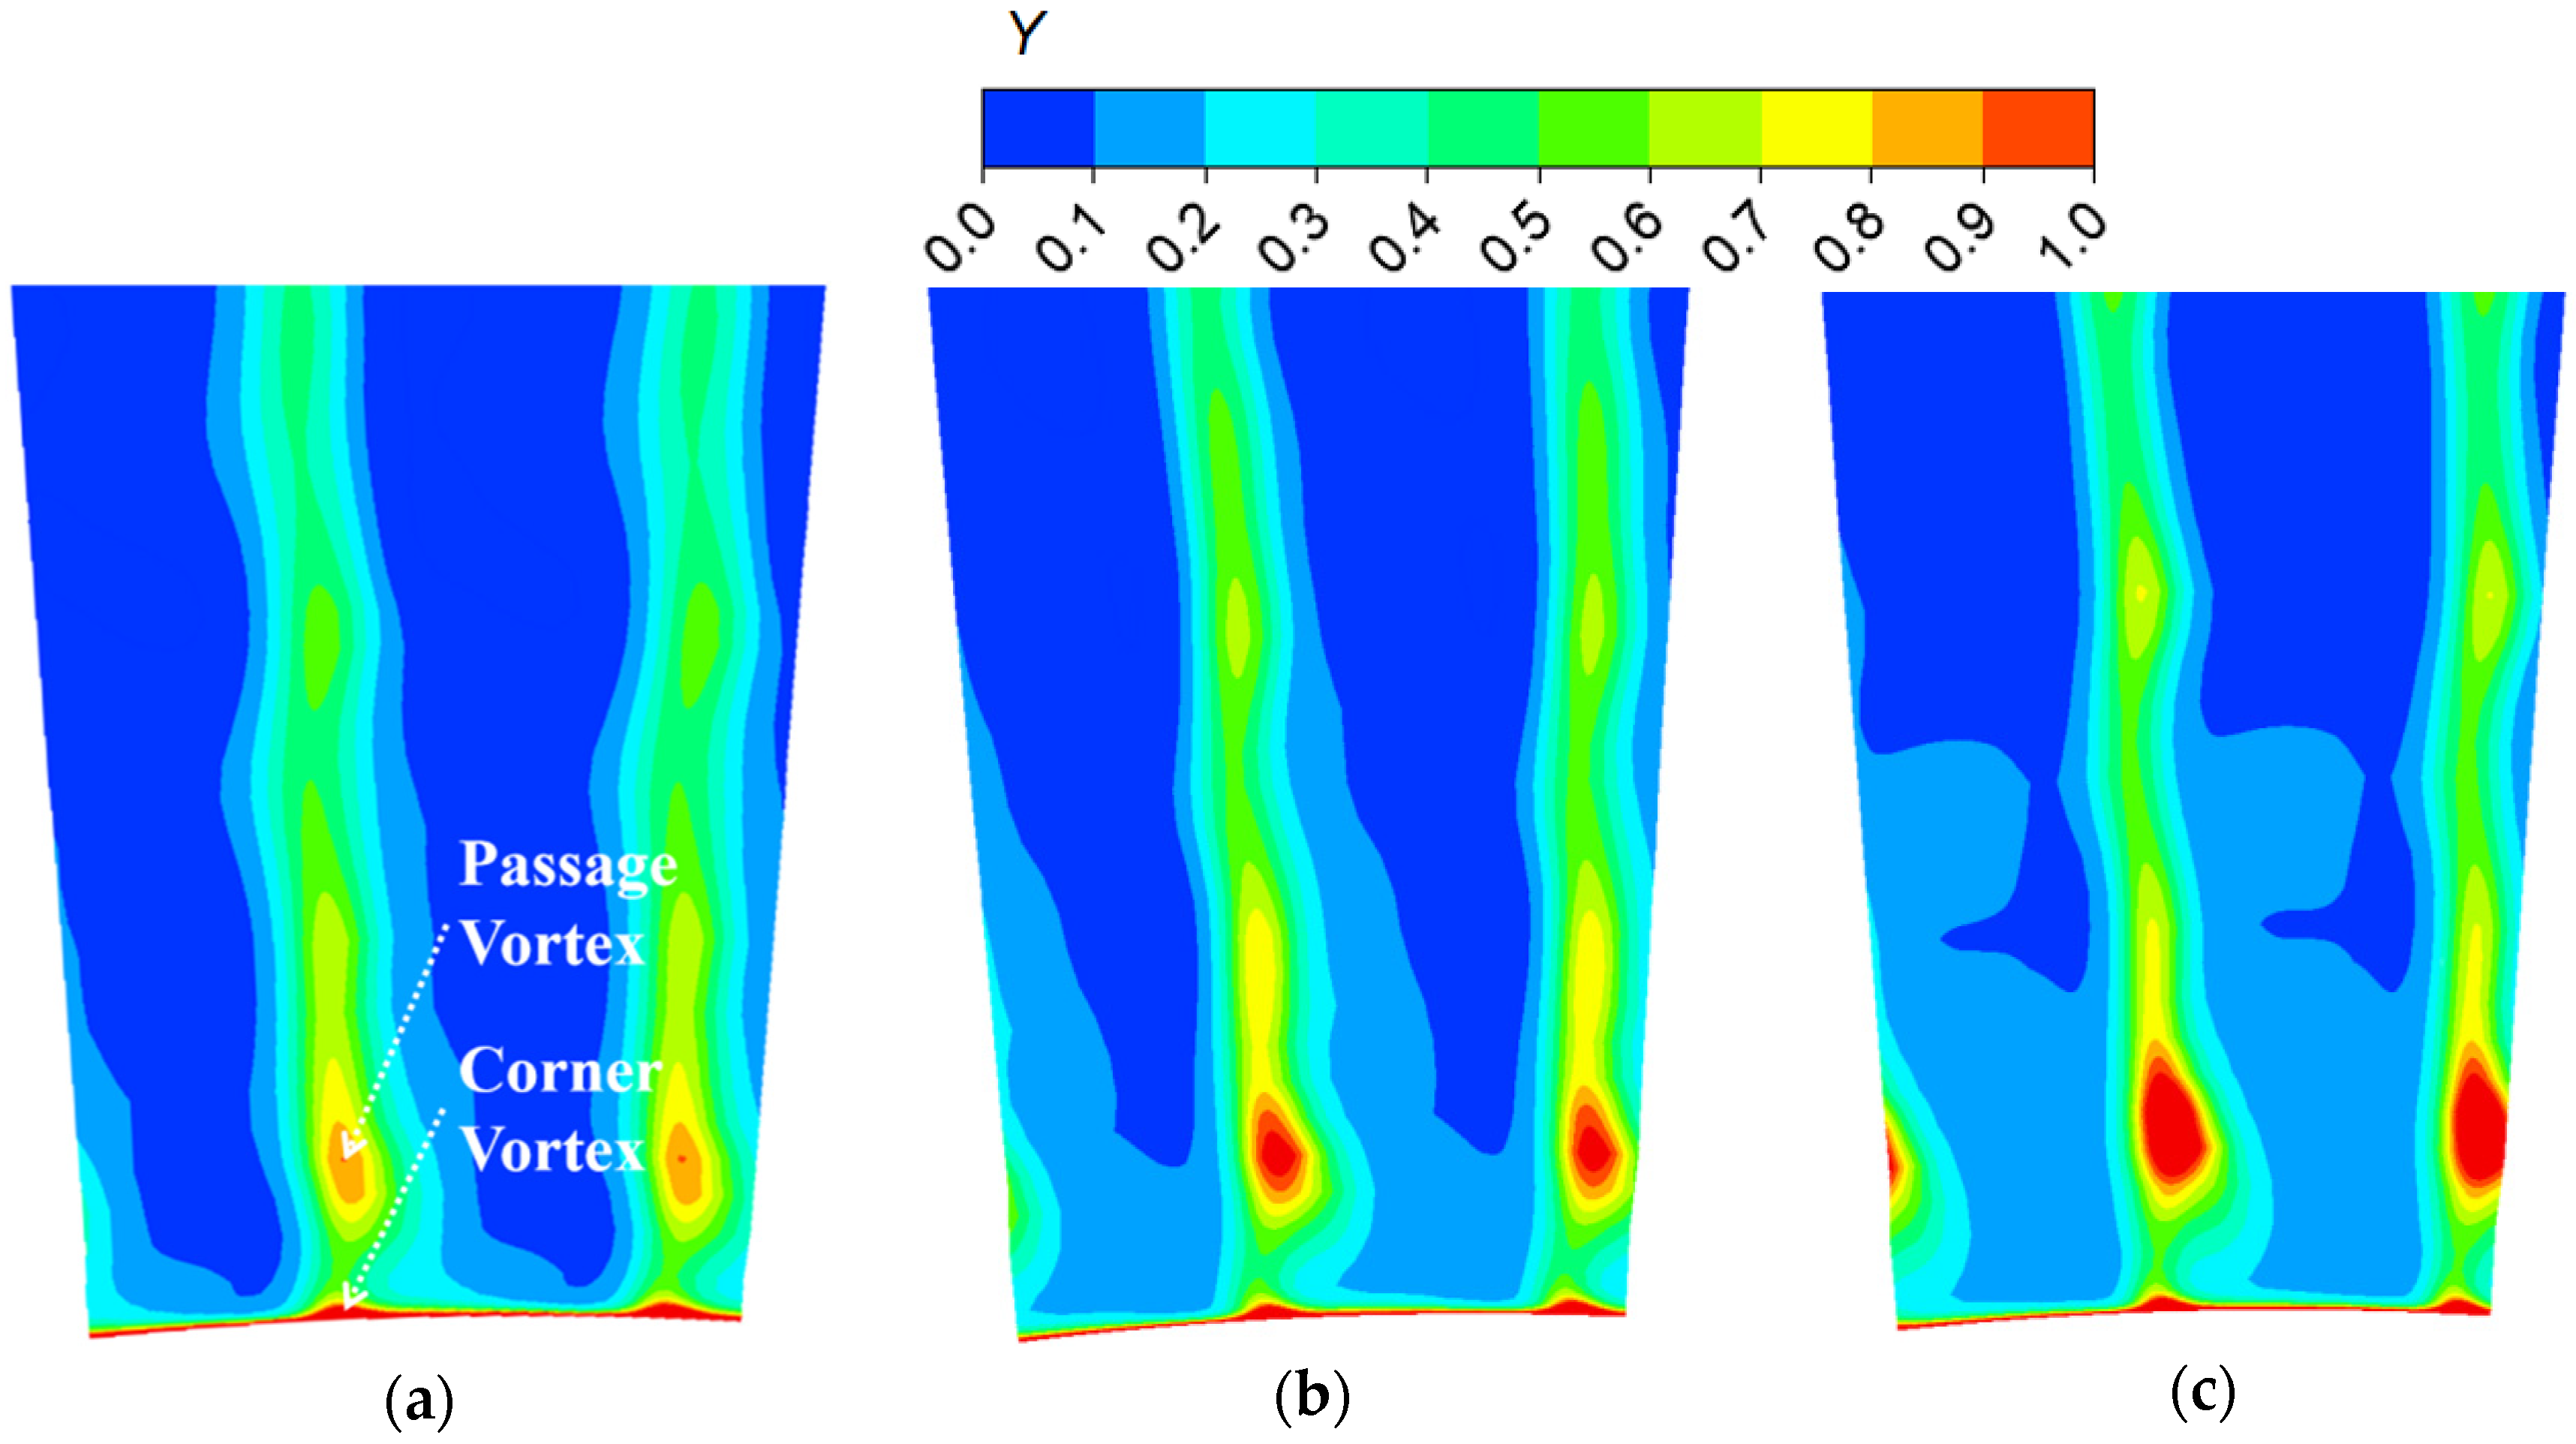
Figure 17.
Time-averaged distribution of Y near the hub at 0.3 times the axial chord length behind R3 corresponding to (a) AG-0.2, (b) AG-0.5, and (c) AG-0.8.
Figure 17.
Time-averaged distribution of Y near the hub at 0.3 times the axial chord length behind R3 corresponding to (a) AG-0.2, (b) AG-0.5, and (c) AG-0.8.
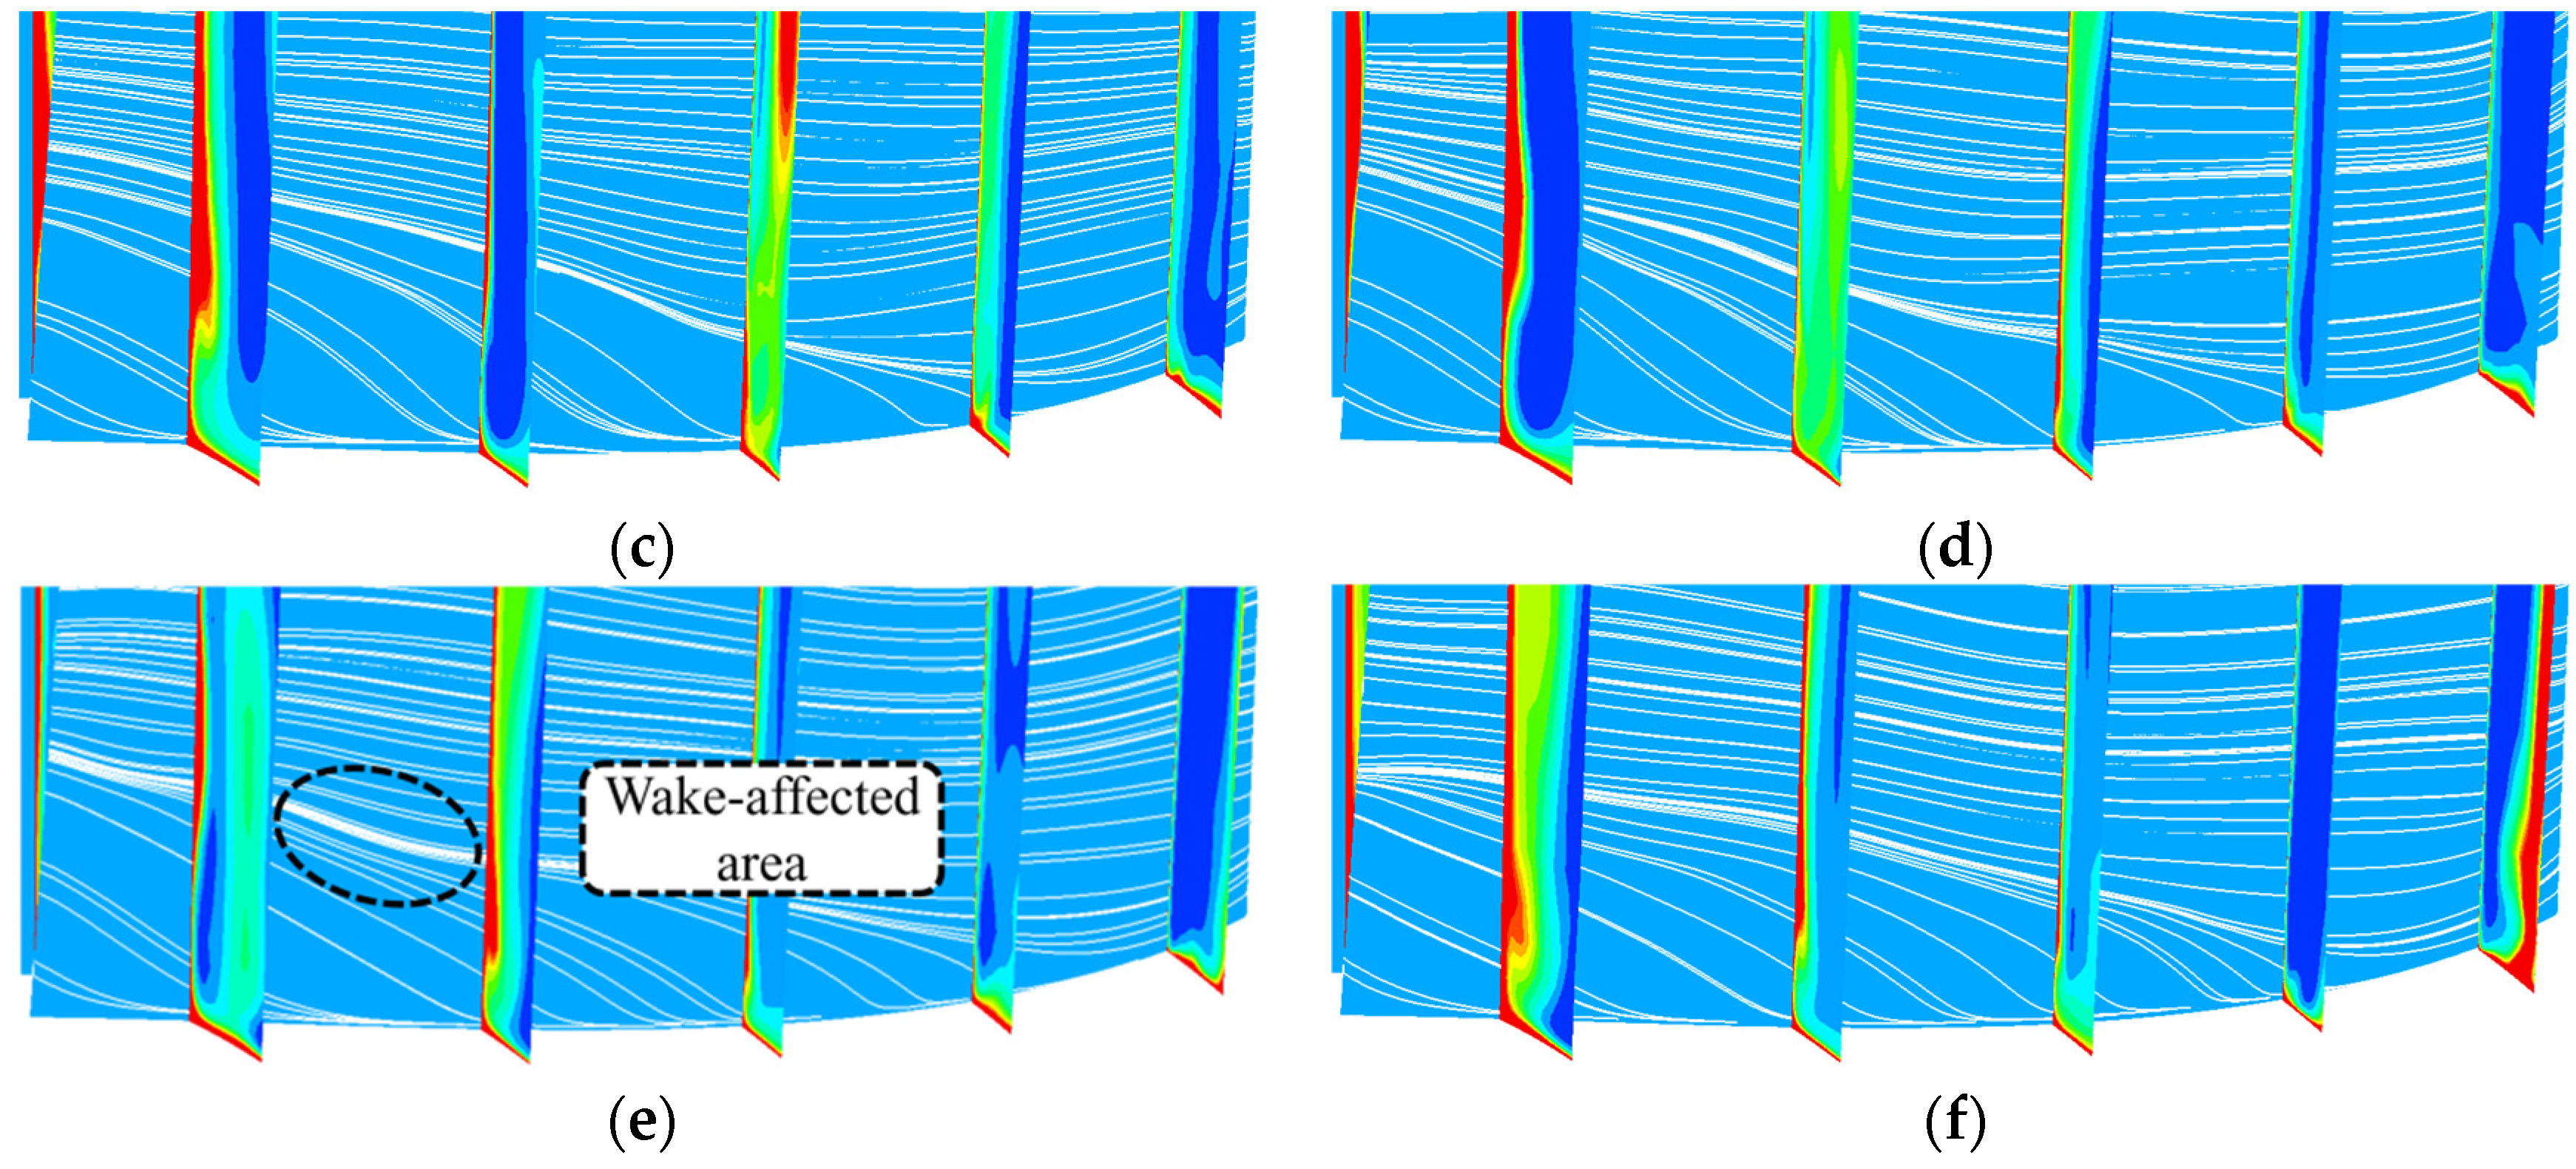
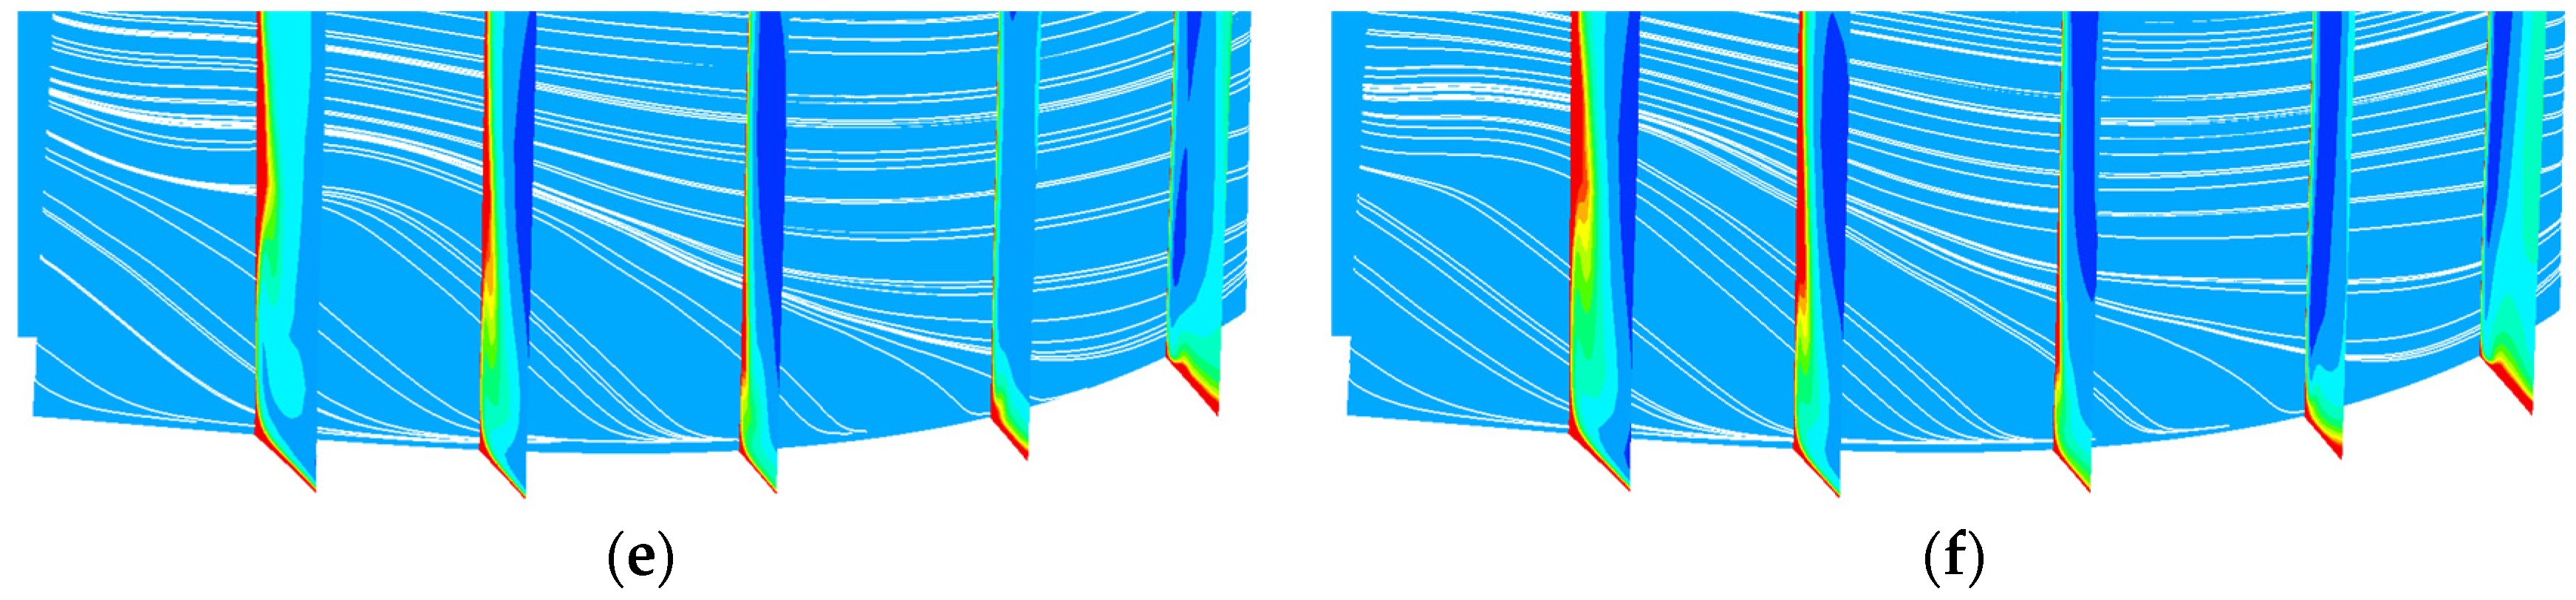
Figure 18.
Rotor-blade-limiting streamlines and Y at different instants, (a) t/tcycle = 1/6, (b) t/tcycle = 2/6, (c) t/tcycle = 3/6, (d) t/tcycle = 4/6, (e) t/tcycle = 5/6, and (f) t/tcycle = 6/6, corresponding to AG-0.2.
Figure 18.
Rotor-blade-limiting streamlines and Y at different instants, (a) t/tcycle = 1/6, (b) t/tcycle = 2/6, (c) t/tcycle = 3/6, (d) t/tcycle = 4/6, (e) t/tcycle = 5/6, and (f) t/tcycle = 6/6, corresponding to AG-0.2.
Figure 19.
Rotor-blade-limiting streamlines and Y at different instants, (a) t/tcycle = 1/6, (b) t/tcycle = 2/6, (c) t/tcycle = 3/6, (d) t/tcycle = 4/6, (e) t/tcycle = 5/6, and (f) t/tcycle = 6/6, corresponding to AG-0.8.
Figure 19.
Rotor-blade-limiting streamlines and Y at different instants, (a) t/tcycle = 1/6, (b) t/tcycle = 2/6, (c) t/tcycle = 3/6, (d) t/tcycle = 4/6, (e) t/tcycle = 5/6, and (f) t/tcycle = 6/6, corresponding to AG-0.8.
Table 1.
Blade numbers.
| Blade Row | Blade Numbers |
|---|
| S1 | 40 |
| R1 | 80 |
| S2 | 80 |
| R2 | 80 |
| S3 | 80 |
| R3 | 80 |
| S4 | 80 |
| R4 | 80 |
Table 2.
Calculation process of the physical time step.
Table 2.
Calculation process of the physical time step.
| Parameters | Values |
|---|
| Rotation speed (RPM) | 6210 |
| Rotation speed (RPS) | 103.5 |
| Stator blade numbers | 80 |
| Number of stationary blade passages passed by the rotor blades per second | 80 × 103.5 = 8280 |
| Time required for the rotor blades to traverse a stationary blade passage (s) | 1/8280 ≈ 1.21 × 10⁻⁴ |
| Selected time step (s) | 1 × 10⁻⁶ |
| Angle of rotor rotation for the blade passages passed by the rotor blades per second (°) | 360/80 = 4.5 |
| Angle of rotor rotation within a single time step (°) | 1 × 10−6 × 8280 × 4.5 = 0.03726 |
Table 3.
Inlet and outlet conditions.
Table 3.
Inlet and outlet conditions.
| Parameters | Values |
|---|
| Inlet total temperature (K) | 1098.3 |
| Inlet total pressure (kPa) | 217.9 |
| Turbulence intensity (%) | 5 |
| S1 incidence angle (°) | 10 |
| Outlet static pressure (kPa) | 37.9 |
Table 4.
E3 low-pressure turbine test parameters.
Table 4.
E3 low-pressure turbine test parameters.
| Parameters | Values |
|---|
| Inlet total temperature (K) | 416.7 |
| Inlet total pressure (bar) | 3.1 |
| Rotation speed (RPM) | 3208.7 |
| Inlet mass (kg/s) | 24.4 |
| PT1/PT2 | 4.37 |
| PT1/PS2 | 4.76 |
Table 5.
Mesh parameters.
Table 5.
Mesh parameters.
| Case | 1 | 2 | 3 | 4 | 5 |
|---|
| Cell numbers | 4,952,960 | 7,553,792 | 11,462,528 | 17,347,840 | 26,278,656 |
| Average mesh volume (v/m3) | 5.24 × 10⁻¹¹ | 7.93 × 10⁻¹¹ | 1.20 × 10⁻¹⁰ | 1.82 × 10⁻¹⁰ | 2.78 × 10⁻¹⁰ |
| Average mesh size (L/m) | 0.65 × 10⁻³ | 0.57 × 10⁻³ | 0.49 × 10⁻³ | 0.43 × 10⁻³ | 0.37 × 10⁻³ |
| Mean orthogonal quality | 0.897 | 0.906 | 0.909 | 0.911 | 0.913 |
| Mean determinant | 0.959 | 0.962 | 0.968 | 0.972 | 0.975 |
| Min determinant | 0.376 | 0.325 | 0.345 | 0.332 | 0.359 |
| Mean quality | 0.931 | 0.933 | 0.934 | 0.932 | 0.930 |


