Article

Pilot Assistance Systems for Energy-Optimized Approaches: Is It Possible to Reduce Fuel Consumption and Noise at the Same Time?

1
Empa, Swiss Federal Laboratories for Materials Science and Technology, 8600 Dübendorf, Switzerland
2
Thales AVS France SAS, 31100 Toulouse, France
3
Swiss Skylab Foundation, 8600 Dübendorf, Switzerland
4
DLR e.V., German Aerospace Center, Lilienthalplatz 7, 38108 Braunschweig, Germany
*
Author to whom correspondence should be addressed.
Aerospace 2024, 11(6), 450; https://doi.org/10.3390/aerospace11060450
Submission received: 23 April 2024 / Revised: 24 May 2024 / Accepted: 27 May 2024 / Published: 1 June 2024

Abstract

:
Air traffic has appreciable environmental impacts, especially regarding gaseous emissions and noise. Recent studies have shown that the energy management during approach is a driving factor regarding environmental impact and is especially challenging for pilots. In a previous project, a newly developed pilot assistance system called LNAS (Low Noise Augmentation System) showed the potential of energy-optimized approaches to reduce fuel consumption and noise. Within the SESAR Exploratory Research project DYNCAT, novel functions based on LNAS have been integrated in the flight management system. In this contribution, results from real-time simulations with the enhanced FMS are presented, and mitigation of the environmental impact is analyzed. It was shown that with DYNCAT, the energy management could be improved, resulting in a later configuration and engines mostly in idle. With DYNCAT, procedures were also flown more uniformly and the variability in noise and fuel outcomes was reduced. However, the results revealed a trade-off for optimizing noise and fuel consumption simultaneously, whereby both parameters can be improved along specific optimum curves. A perfect strategy to minimize noise would be to first reduce speed and only secondly height, as high speeds lead to higher levels of airframe noise and sound exposure increases with decreasing distance. In contrast, saving fuel might be achieved by reducing the flight time, as the engines consume fuel even when being in idle.

1. Introduction

Air traffic has appreciable environmental impacts, with noise and gaseous emissions as the most important ones. Against the background of the current climate change debate, CO2 emissions play a particularly important role. According to Burgueño Salas [1], commercial aviation emitted over 900 million metric tons of CO2 in 2019, which is 12% of all transportation sources [2]. The COVID-19 pandemic led to a sharp decrease in air traffic, which, at least in Europe, is likely to be fully recovered by 2025 [3]). Noise, on the other hand, is a major local factor for health impact around airports [4]. Noise exposure affects a range of health outcomes, from annoyance and sleep disturbance to increased risks for cardiovascular and metabolic diseases [5]. An estimate of the impact of noise on a global scale is challenging, as corresponding data are scarce. For the European region, the World Health Organization (WHO) estimated that some 1.0–1.6 million healthy life years were lost in total, with annoyance—apart from sleep disturbance—being particularly important, with a share of 654,000 [6]. In addition to the associated health costs, aircraft noise causes losses in value of houses and properties, which greatly extend beyond the health-impairing areas [7].
A major driver for reducing CO2 emissions of aircraft is the fact that engines have become increasingly fuel efficient in recent decades [8]. Substantial improvements in the development of aircraft engines were not only achieved regarding fuel consumption, but also for noise [9]. This has led to major reductions in the acoustic footprints of commercial aircraft, in particular during departure, as in this phase of the flight the engine noise is dominant. During approach, in contrast, not only the engine noise but also the airframe noise is relevant, often even dominating for modern aircraft [10]. As this is determined by airspeed and aircraft configuration (extension of high-lift devices and landing gears, deployment of speed brakes), procedural optimisation has become increasingly important. In 2007, ICAO conducted a review on noise abatement procedure (NAP) research and development projects and reported preliminary beneficial results for continuous descent arrivals (CDA) [11]. Isermann discussed potentials and limits of noise abatement flight procedures in 2013 and compared the acoustic footprints of different departure and arrival procedures [12]. He concluded the following:
[…] noise resulting from a departure can only be redistributed in the airport environment. However, approach procedures offer an additional real noise reduction potential because the force of gravity supports the descent process. Taking advantage of this and minimizing aerodynamic drag can result in local noise reductions of 5 dB or more compared to standard approach procedures.
Despite this finding, noise abatement departure procedures make sense if the local population distribution is taken into account. Kurz et al. recently proposed a pilot assistance system which aims at reducing the noise burden on the population by identifying a custom thrust reduction and acceleration altitude for each flight individually [13].
However, the primary focus of recent research has been on reducing the environmental footprint during approach. Thereby, an optimization can take place on the lateral and vertical path as well as on the execution of the procedure under the specific conditions. Flight routes might, for example, be designed to avoid a high noise impact on densely populated areas but might bring detriments in a prolonged time of flight and fuel burn [14]. To overcome this conflict, Rodrigues et al. developed a method to suggest the most suitable landing runway and landing time for specific scenarios, with the goal of minimizing noise, fuel consumption, and delays [15]. Many initiatives have also focussed on optimizing vertical profiles and arrival procedures. Thereby, continuous descent approaches were identified as beneficial in terms of fuel consumption and noise [16,17,18]. Filippone et al. also studied the steepness of descent as an additional optimization parameter [18]. Recently, Otero et al. [19] analyzed flight data recorder (FDR) data from Boeing 737–800 approaches and confirmed that fuel consumption and CO2 can be reduced in parallel with the noise footprint on the ground. Abdelmoula et al. additionally identified that interaction with air traffic control (ATC) has a major impact on noise and fuel [20]; comprehensive data including onboard operational data, ATC commands, noise measurements, surrounding traffic, and weather information were utilized. It was found that early speed instructions from ATC led to increased fuel consumption due to extended low-speed flight sections and early flap deployment. In contrast, speed instructions helped the pilots to maintain a pre-defined airspeed during transition and final approach that resulted in lower usage of speed brakes and also later gear extension at lower speeds, which reduces the noise footprint.
In addition to the question of the optimal approach strategy, it is also relevant how accurately it can be flown in reality. From a pilot’s perspective, the approach is a challenging phase of flight, as many configuration changes have to be initiated and the aircraft’s energy state has to be continuously monitored and controlled. The latter concerns the potential energy as a function of flight altitude as well as kinetic energy defined by the aircraft’s speed, while both depend on the aircraft’s total mass. The kinetic energy state can further be affected by the current wind situation, as for example tailwind can increase the kinetic energy. The primary focus of an approach is a safe, stabilized procedure without unnecessarily increasing the risk of a go-around. As there are very limited support systems for this task today, pilots are generally more likely to choose a safe strategy, preferring to dissipate too much energy along the descent and approach trajectories to ensure stabilization at 1000 ft above airfield level (AAL). This over-conservatism often leads to additional noise through dissipation and necessitates additional thrust in the later phases of the approach, increasing fuel consumption and again noise. It has been shown by Gerber et al. [21] that even under similar conditions (same aircraft type, mass, weather, runway, and even equivalent ATC instructions) the approach profile related to speed management, high-lift system, and landing gear configurations and speed brake settings looks very different among the pilots. This means that many of these profiles do not represent the optimal solution related to fuel consumption and noise exposure. The reason for this is not an insufficient qualification of the pilots but the high complexity of this task where tactical measures are often required by ATC to manage the traffic demand, making the actual trajectory hard to predict, compounded by a lack of a detailed vertical wind profile. This is a big challenge, even for highly experienced pilots and different pilots follow their individual energy dissipation strategies.
To support the pilots in this challenging task, the German Aerospace Center (DLR) developed a pilot assistance system called the Low Noise Augmentation System (LNAS) which provides the pilot with information on the aircraft energy state during descent [22] and thus allows approaches closer to the operational optimum without affecting flight safety. The implemented strategy is described as follows [21]:
For an aircraft to descend from cruise altitude to touchdown with the lowest possible fuel consumption and noise signature, an approach is required that is both at idle thrust in the ideal speed and follows an ideal vertical profile without using speed brakes, extending the landing gear too early, or flying unnecessary level segments with high thrust settings.
The noise and fuel reduction potential of LNAS was confirmed during a flight campaign in 2019 at Zurich Airport, Switzerland, using an Airbus A320 powered by IAE V2500 engines and dedicated flight test instrumentation [23].
In the SESAR exploratory research project DYNCAT (DYNamic Configuration Adjustment in the Terminal manoeuvring area), the results of which are presented in this paper, novel pilot support functions based on the LNAS concept were developed, integrated into the flight management system (FMS), and tested on a simulation integration bench at Thales in Toulouse, France. While the full DYNCAT concept foresees improved information exchange between ground and air on ATC intent, weather data, and the predicted flight profile [24], this first step addressed the optimal execution of the approach procedures with respect to environmental impact (noise and fuel consumption) under the status quo, i.e., radar vectoring and very limited availability of information. The extended flight deck functionalities provide information about air traffic control’s intended trajectories, particularly on the lateral path, making use of the concept of the permanent resume trajectory (PRT) [25] and only requiring the distance-to-go (DTG) or indicated time of arrival (ITA) from ATC. It is important to recognise that the PRT is an on-board expectation of the remaining trajectory only. However, as the most crucial information is the remaining distance, the PRT serves as the basis for predictions of the flight. These in turn allow continuous monitoring of the aircraft’s current and predicted energy state, clearly indicating the prospect of the eventual stabilisation at all times. Taking into account known restrictions and wind information, the novel guidance functions continuously determine the ideal location for the setting of flaps, landing gear extension, and use of speed brakes (trying to minimize the use of the latter due to their noise penalty). These are offered as visual cues to the pilot on the navigation display.
In a real-time pilot-in-the-loop cockpit simulation, the current state of the DYNCAT functionalities was evaluated with active Airbus-type-rated pilots and an active air traffic controller (ATCo) on an Airbus A321 FMS test bench. The aim of the trials was on the one hand to evaluate these functionalities qualitatively and to have the pilots’ opinion on the feasibility under real operational conditions and the usability of the provided information. On the other hand, a quantitative comparison was made of flights with and without the use of the novel DYNCAT functions in terms of noise emission and fuel consumption for a typical scenario that includes various ATC instructions. Preliminary results of the DYNCAT project and the corresponding trials were presented at two conferences [24,26]. In this contribution, a comparison of flights with and without the pilot assistance system with respect to the environmental impact are documented in detail. In Section 2, the test scenario is introduced and background information on the noise assessment is given. In Section 3, results for fuel consumption and noise are shown. On this basis, the system’s potential to reduce the environmental impact is evaluated and synergies as well as contradictions between the two optimization targets, fuel and noise, are discussed in Section 4.
The majority of the studies cited above were based on the analysis of real air traffic. The advantage of this approach lies in the large number of available events and their ecological validity. The advantage of the flight simulator experiments presented in this contribution results from the full control over the experiments, for example with regard to weather conditions or the content and timing of ATC instructions. This allows a much more detailed analysis of the effects and is expected to enable an optimal approach strategy to be narrowed down more precisely.

2. Methods

2.1. Test Scenario and Description of Flights

A test scenario was selected from real-world flight data with an approach situation to the Zurich airport from the northwest, where a shortcut instructed by the ATCo led to an over-energy situation (see Figure 1). With the goal of being stabilized at 1000 feet, this is a specifically challenging situation in terms of optimizing fuel and noise, with a reduced number of degrees of freedom. The approaches were carried out by applying so-called radar vectoring, whereby the ATCo specifies the lateral flight path until the final approach. Pilots were also informed about the expected distance to the runway before initiating the descent. This allowed the pilots to estimate the aircraft’s energy state, even when not flying along a pre-programmed path. The reference flights were carried out without the aid of DYNCAT, applying a standard configuration sequence of flaps and landing gear and standard operating procedures. The comparative flights with DYNCAT were carried out by following the instructions of the assistance function. This allowed for a 1:1 comparison between the pilot’s performance and the system’s performance in terms of fuel consumption and noise emission, as well as achieving a stabilized approach.
Based on the long-term statistics of local weather conditions, a representative setting with a wind of 1.5 m/s coming from 250°, i.e., west–southwest, a temperature of 8.7 °C, a relative humidity of 80% and an air pressure of 967.0 hPa at a reference height of 10 m was chosen for the cockpit simulation and the subsequent noise simulation. The local meteorological conditions were extrapolated for greater heights assuming one international standard atmosphere (ISA) of pressure and vertical profiles of wind, temperature, and humidity as defined in [27]. For the analysis of fuel consumption and noise, a representative set consisting of 12 flights with DYNCAT and 12 reference flights, performed by 6 experienced pilots, are compared.

2.2. Fuel Consumption

Information on the momentary fuel consumption was obtained from the simulation bench of the real-time cockpit simulation. The total fuel consumption was evaluated from a point in level flight at FL190 (19,000 ft pressure altitude) in the arrival sector shortly before further descent and at speeds of approximately 280 kt, to a point at 500 ft above airport level and speeds of approximately 135 kt as the endpoint. These initial and final conditions are common mission points from the energy standpoints and thus ensure relevant fuel comparisons.

2.3. Noise

The noise evaluation was performed using sonAIR, an aircraft noise simulation model specifically designed for the detailed analysis of single flights [10,28]. The source model separately describes engine and airframe noise and predicts sound power and directivity as a function of flight configuration (thrust setting, described by the readily accessible engine fan rotational speed N1, and airplane configuration, i.e., flaps/slats, landing gear, and speed brakes). The propagation model used in sonAIR, sonX, considers geometrical spreading, air absorption, the Doppler frequency shift, shielding by terrain and reflections from the ground based on an analytical solution for spherical waves, which was extended for finite segment length and variable ground properties. As meteorological effects, on the one hand, the local influence of temperature, relative humidity, and air pressure on air absorption and, on the other hand, the effect of vertical speed of sound gradients on barrier effects and on the evolution of acoustical shadow zones are taken into account. The simulation is based on a time-step procedure, where single flights are represented in a fine temporal resolution with the current aircraft position and orientation as well as N1 setting and configuration as input parameters. This allows for a detailed analysis of the momentary sound radiation of the aircraft as well as of the resulting sound exposure on the ground. sonAIR has been thoroughly validated and yielded a high accuracy in reproducing the sound exposure of individual flights [29,30].
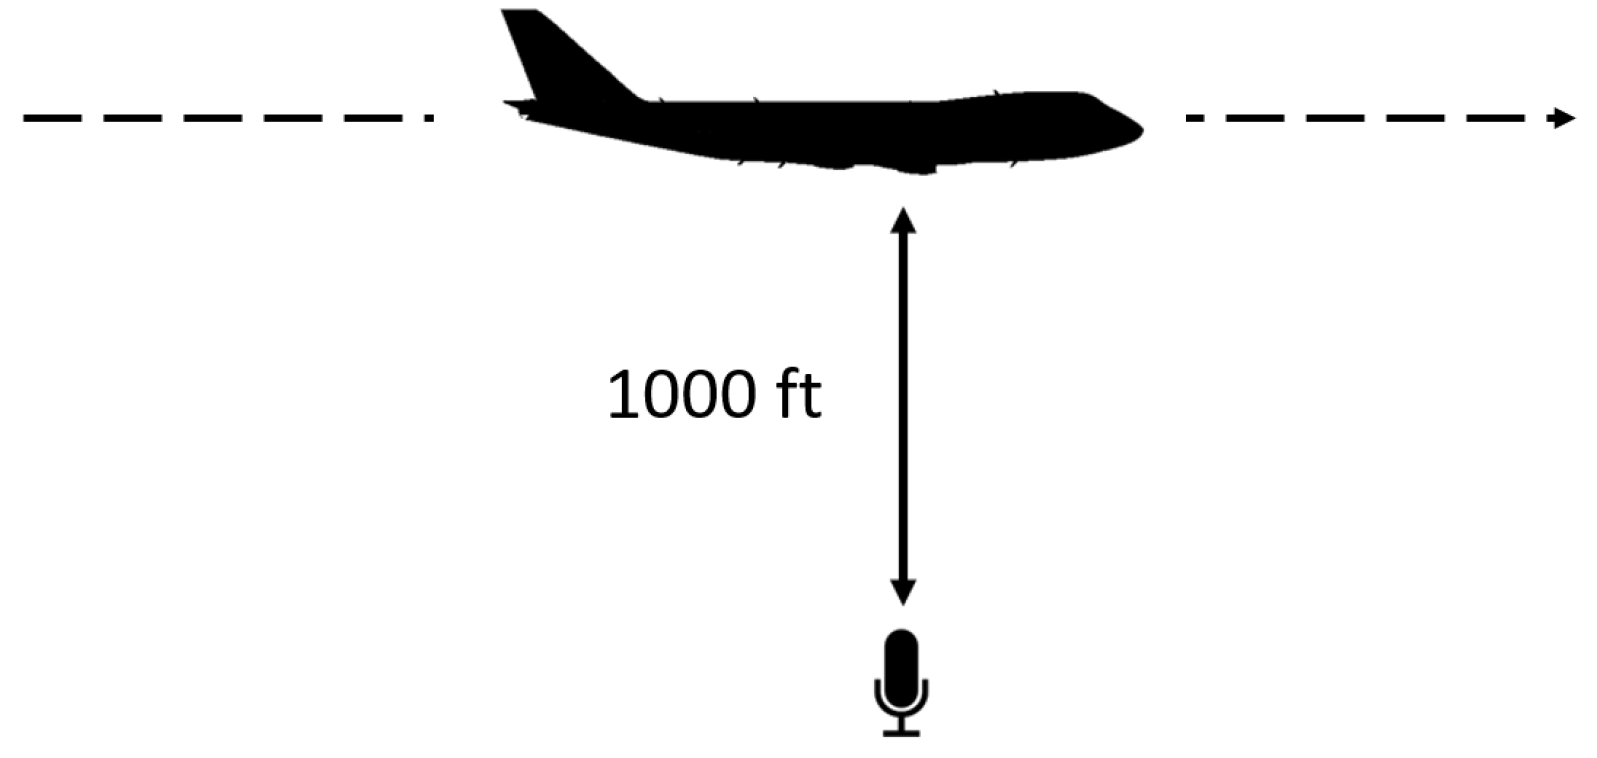
As input data for the simulation of individual flights, FDR data from the simulator trials, including time, the 3D trajectory, configuration (flaps/slats, landing gear and speed brakes), air density, N1 (as a proxy for thrust) and true airspeed were used. The momentary sound pressure level on the ground, LAS, is influenced by the distance to the aircraft, its relative speed (Doppler effect), and the sound power radiated in the corresponding propagation direction. For acoustic analysis, sound emission is investigated in the first step. In the second step, the sound is propagated to the ground and the sound exposure level (LAE) on the ground, representing the integral over time of the sound pressure for whole flights, is mapped. The sound emission over time is represented using a moved-along receiver at a fixed distance of 1000 ft vertically below the aircraft, as illustrated in Figure 2. This analysis allows for the direct quantification of the influence of individual flight-related variables on the sound radiation, like N1 and configuration setting or airspeed.
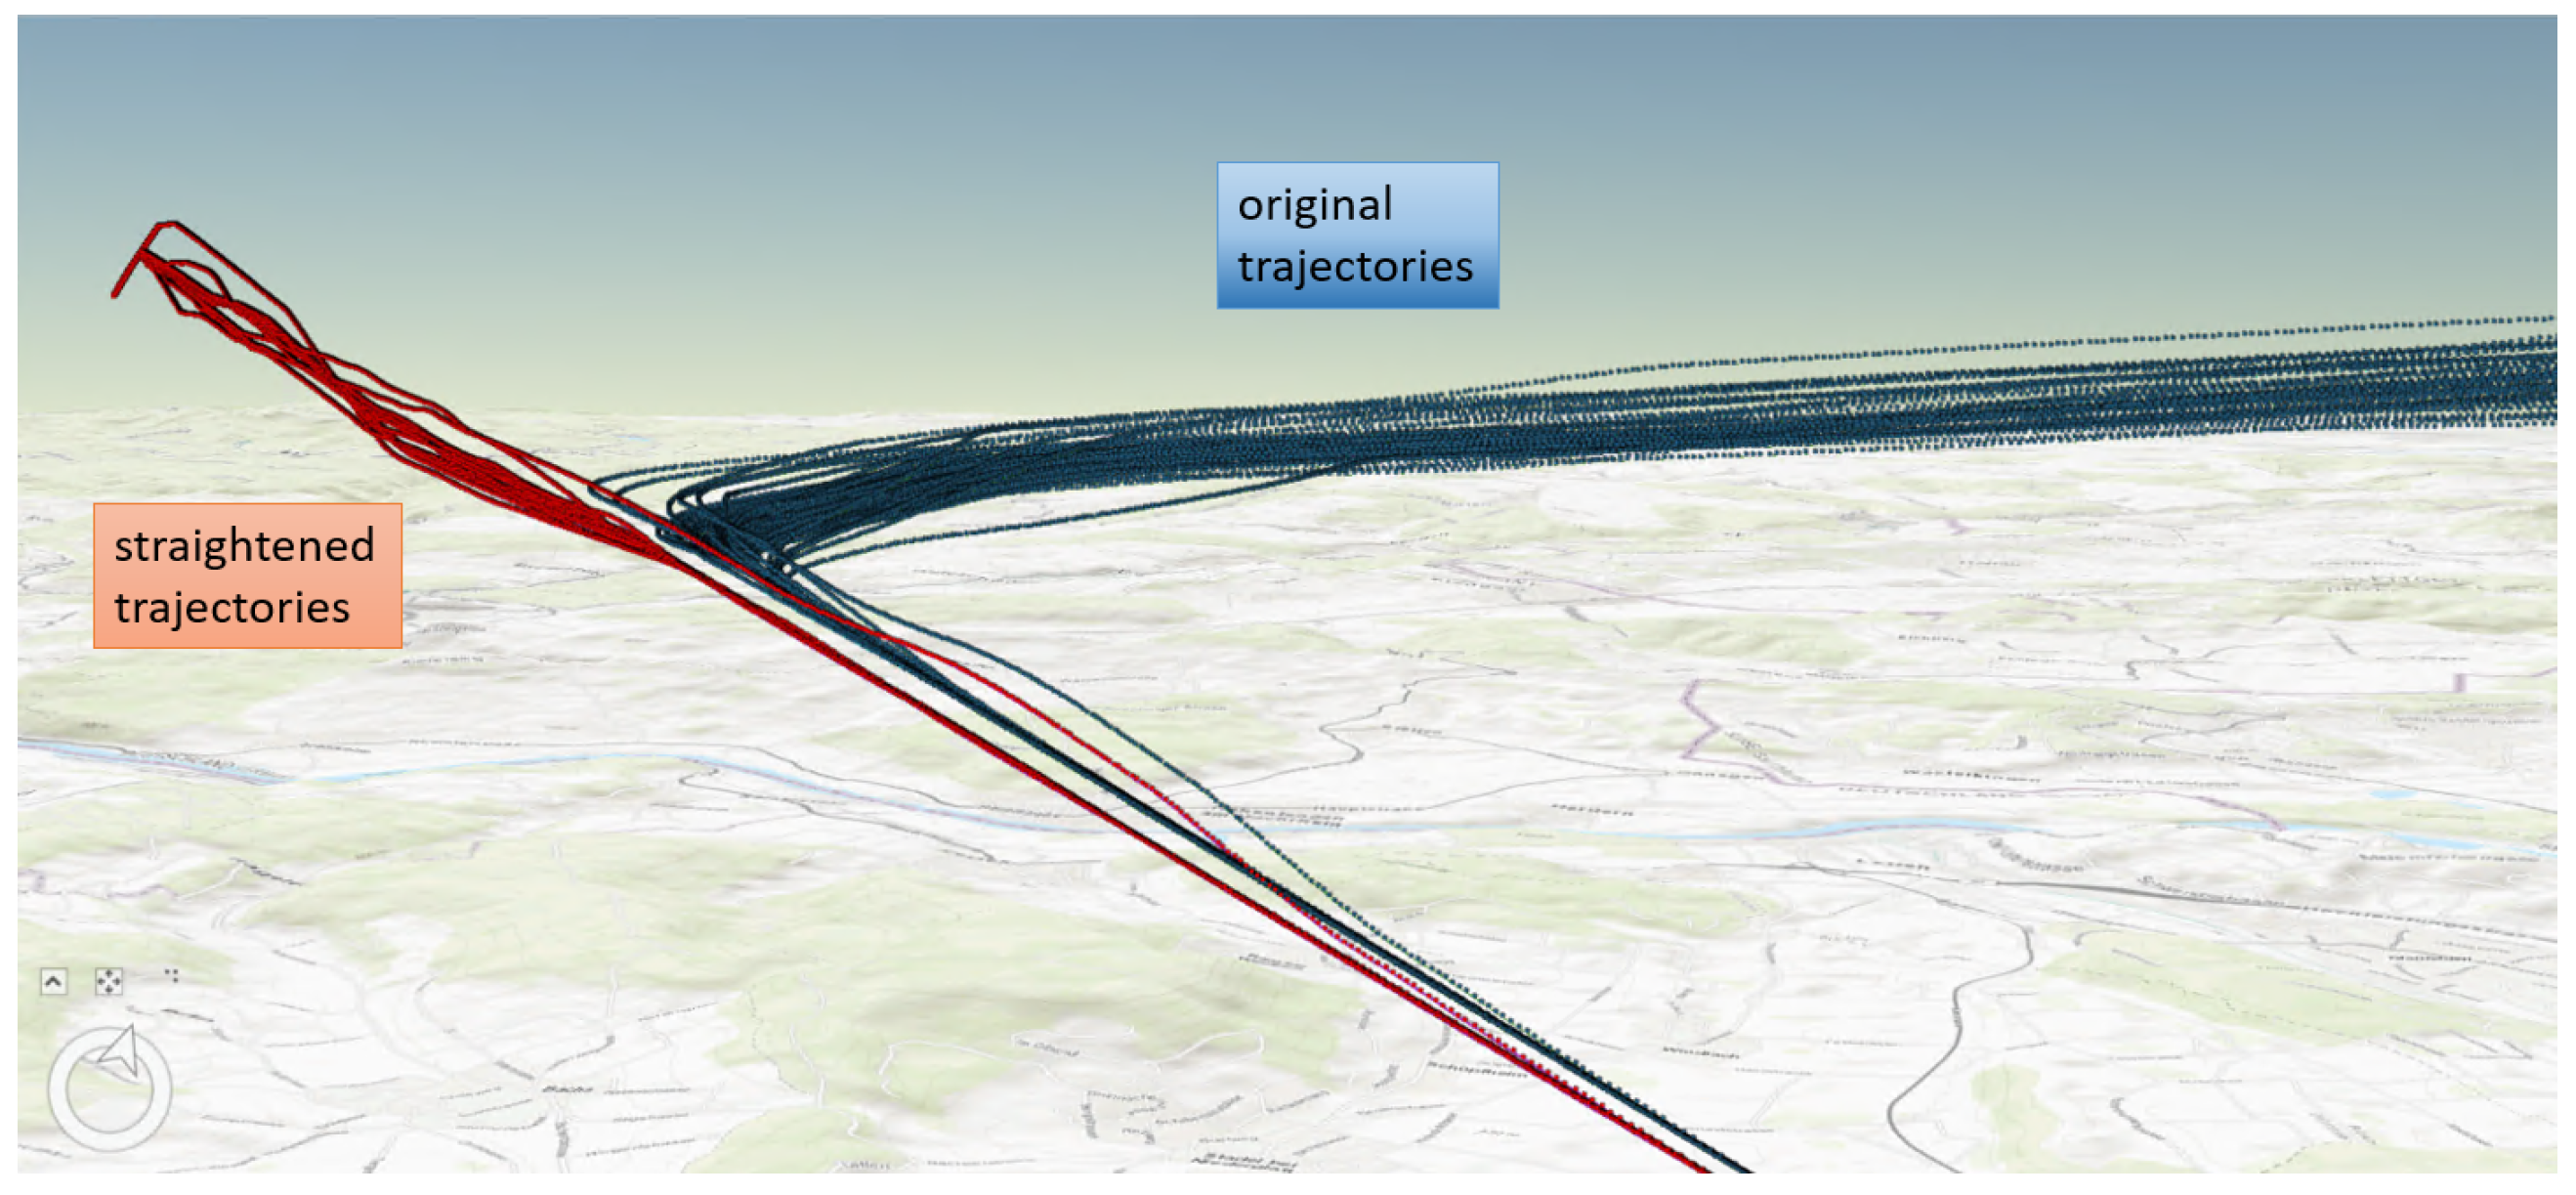
Sound exposure (LAE) maps on the ground, representing the energetic average for a number of entire flights, were calculated in two ways. On the one hand, the original trajectories of the trials in combination with real topography and land use were used. As can be seen in Figure 3, these original trajectories not only scatter vertically but also laterally, as a consequence of the curved approach. To exclude the influence of this lateral dispersion, which is not of interest here, and to generate more generic results excluding this effect, the flight trajectories were straightened relative to the orientation of the runway (trajectories in red in Figure 3), and calculations were repeated for flat terrain at runway elevation and uniform grassland conditions. As this representation yields more generally applicable insights (instead of representing the specific situation at Zurich airport), the focus of the current analysis will be on these results.

3. Results

3.1. Fuel Consumption

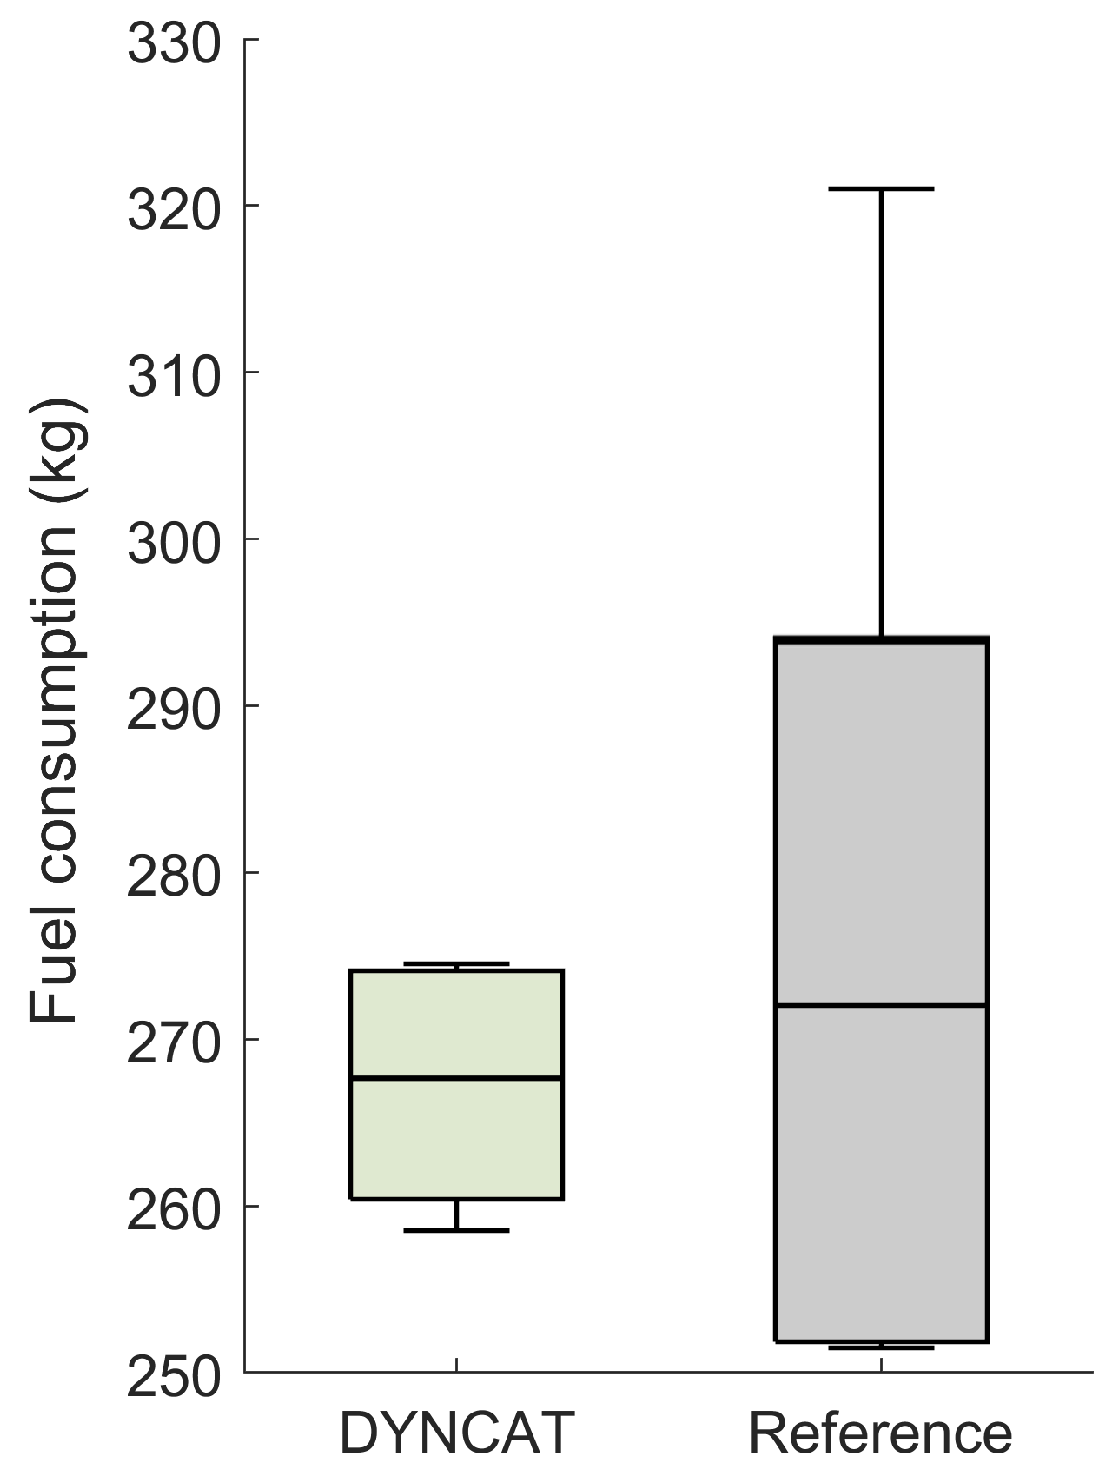
In Figure 4, the fuel consumption of flights with and without DYNCAT are compared. On average, flights using DYNCAT saved 5.2 kg of fuel. For the reference flights, the spread is substantially larger, with a standard deviation of 19.4 kg, compared to 4.6 kg for flights with DYNCAT. One of the reference cases yielded the best results, i.e. the flight with lowest fuel consumption of 252.3 kg, but also the flight with a maximum consumption of 320.5 kg was a reference flight.

3.2. Noise

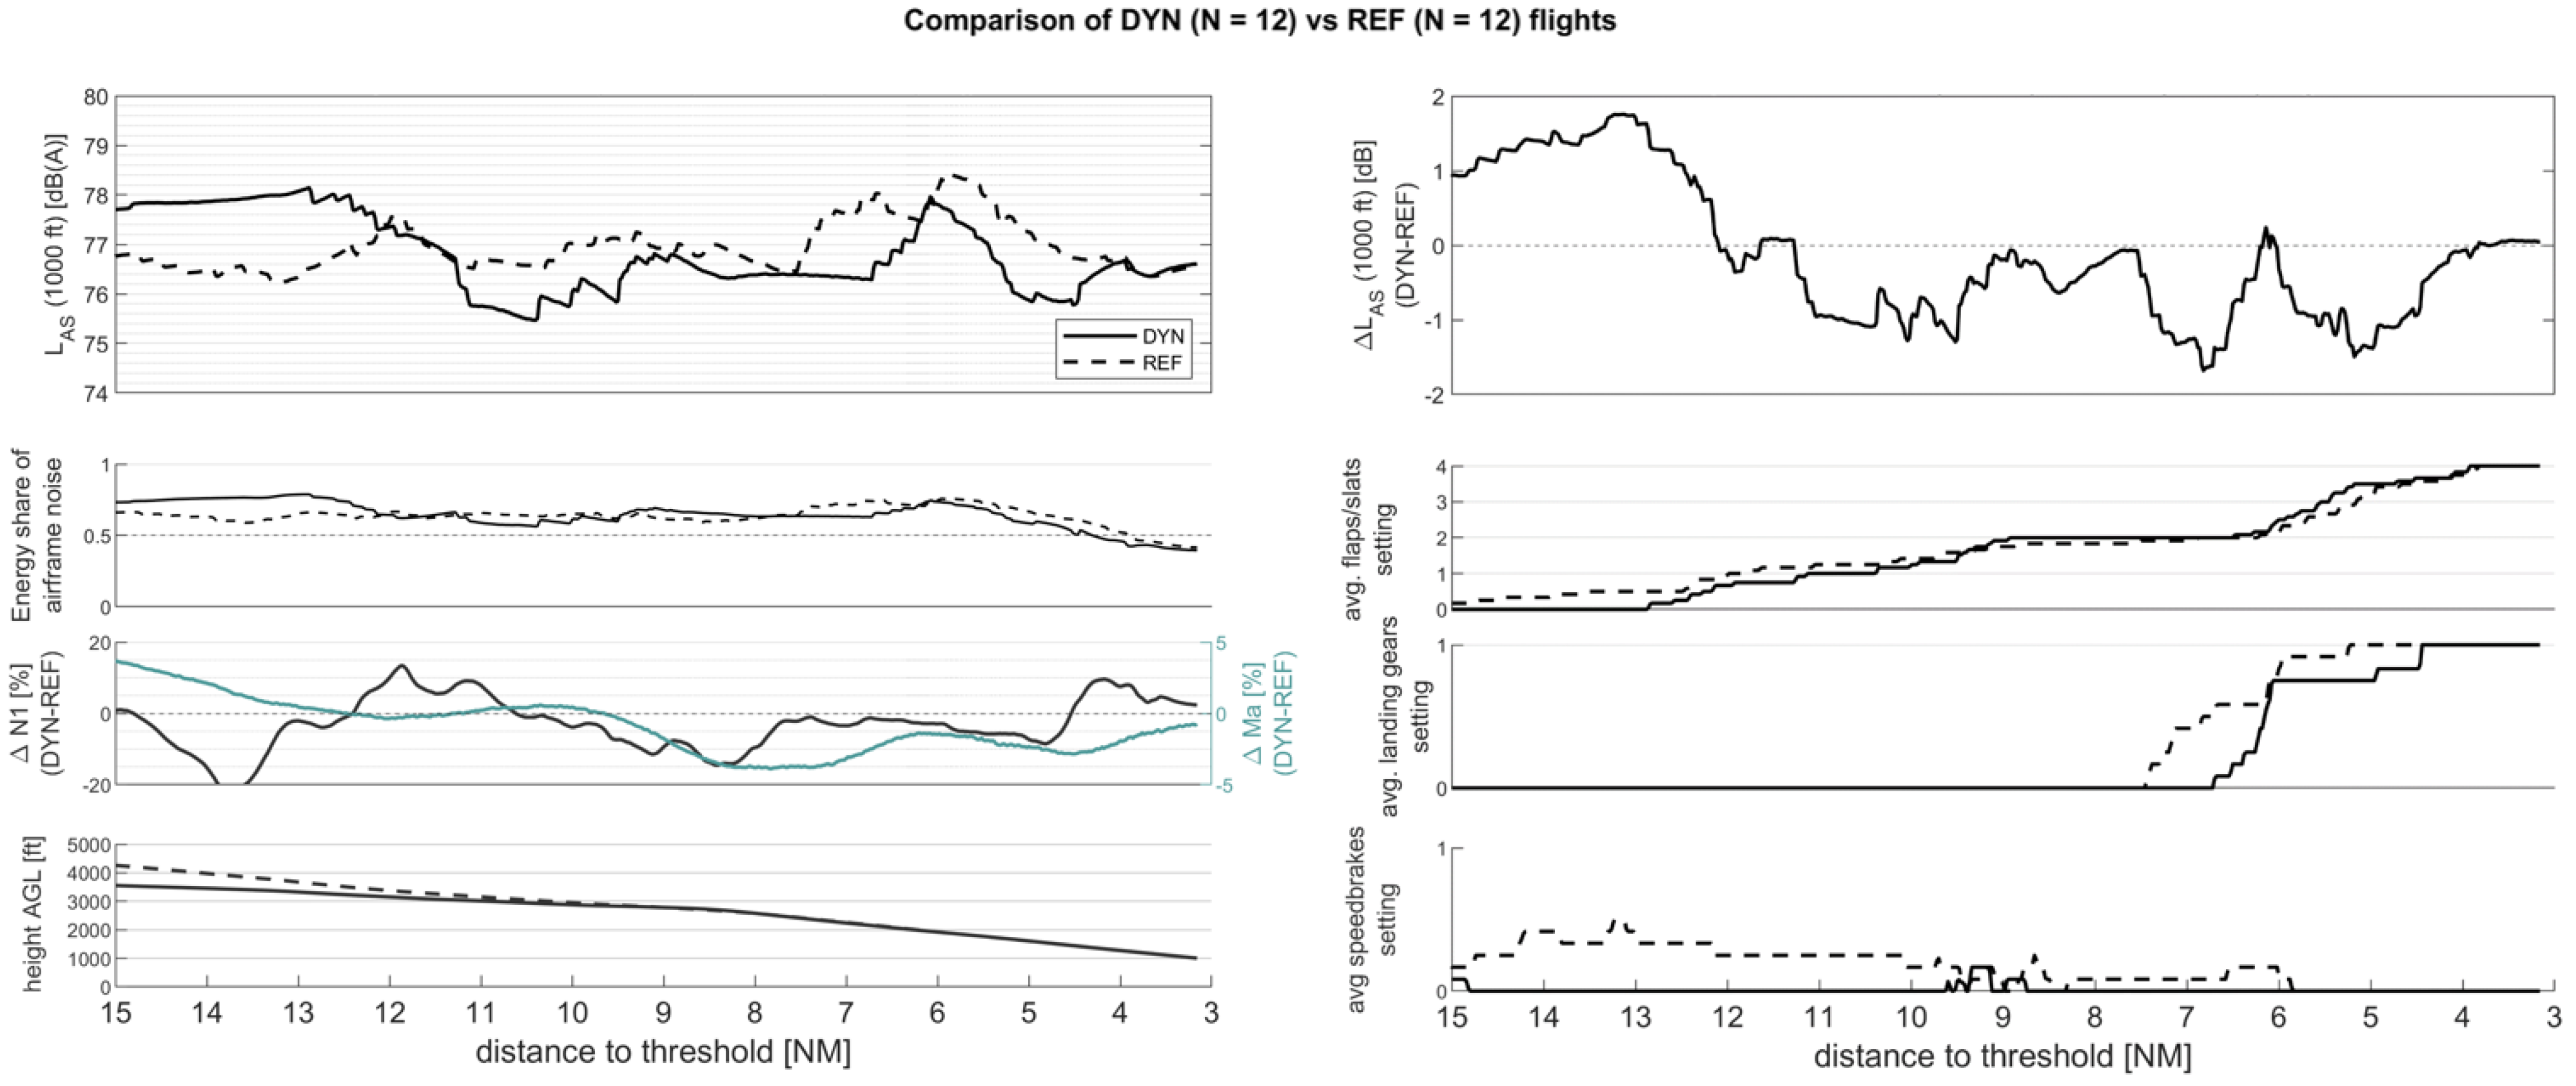
Figure 5 shows the results for the simulation of the moved-along receiver at a fixed position 1000 ft underneath the aircraft, averaged over 12 flights with and 12 flights without the use of DYNCAT. In the plots, the results are all presented over the horizontal distance to the runway threshold. At 3 nautical miles (NM) distance to threshold, all flights were stabilized. Due to the specifications there, which were the same for all flights, the use of DYNCAT no longer has any influence, which is why the x-axis of the plots ends there. Figure 5 also depicts the parameters influencing the sound emission like the engine rotational speed N1, Mach number, and airspeed to facilitate the interpretation of the resulting outcome in terms of noise. Further, the energy share is given, i.e., the ratio of the airframe noise compared to the total noise as defined in Equation (1):
e n e r g y s h a r e = 10 ( L a f m / 10 ) 10 ( L a f m / 10 ) + 10 ( L e n g / 10 )
where Lafm and Leng are the sound pressure level of the airframe and the engine noise, respectively. Values above 0.5 indicate that airframe noise is dominant over the engine noise and vice versa for values below 0.5. The information on the height AAL does not affect the sound pressure level shown in Figure 5, but is relevant for the exposure on the ground, which is introduced later on.
Figure 5 reveals that the airframe noise is in general dominant over the engine noise. Consequently, the mostly higher N1 setting of the reference flights is not a crucial factor for the overall sound emission. Between 15 and 12 NM distance to threshold, the flights with DYNCAT are on average louder, which is mostly due to the higher airspeed. The reduced speed of the reference flights can be explained by the frequent use of speedbrakes. Furthermore, the flights using DYNCAT have already reduced more altitude at 15 NM, and thus potential energy, which indicates a different approach strategy. Hence, for the reference flights, the potential energy has to be dissipated at a later stage. From 12 NM distance to the threshold, the flights with DYNCAT are generally less noisy. Several factors contribute to this noise reduction: On one hand, airspeed and thrust setting is either equal or lower with DYNCAT than without, and on the other hand, flaps/slats and landing gear are extended later, and the speed brakes are hardly used. The landing gear is extended on average 1 NM later with DYNCAT.
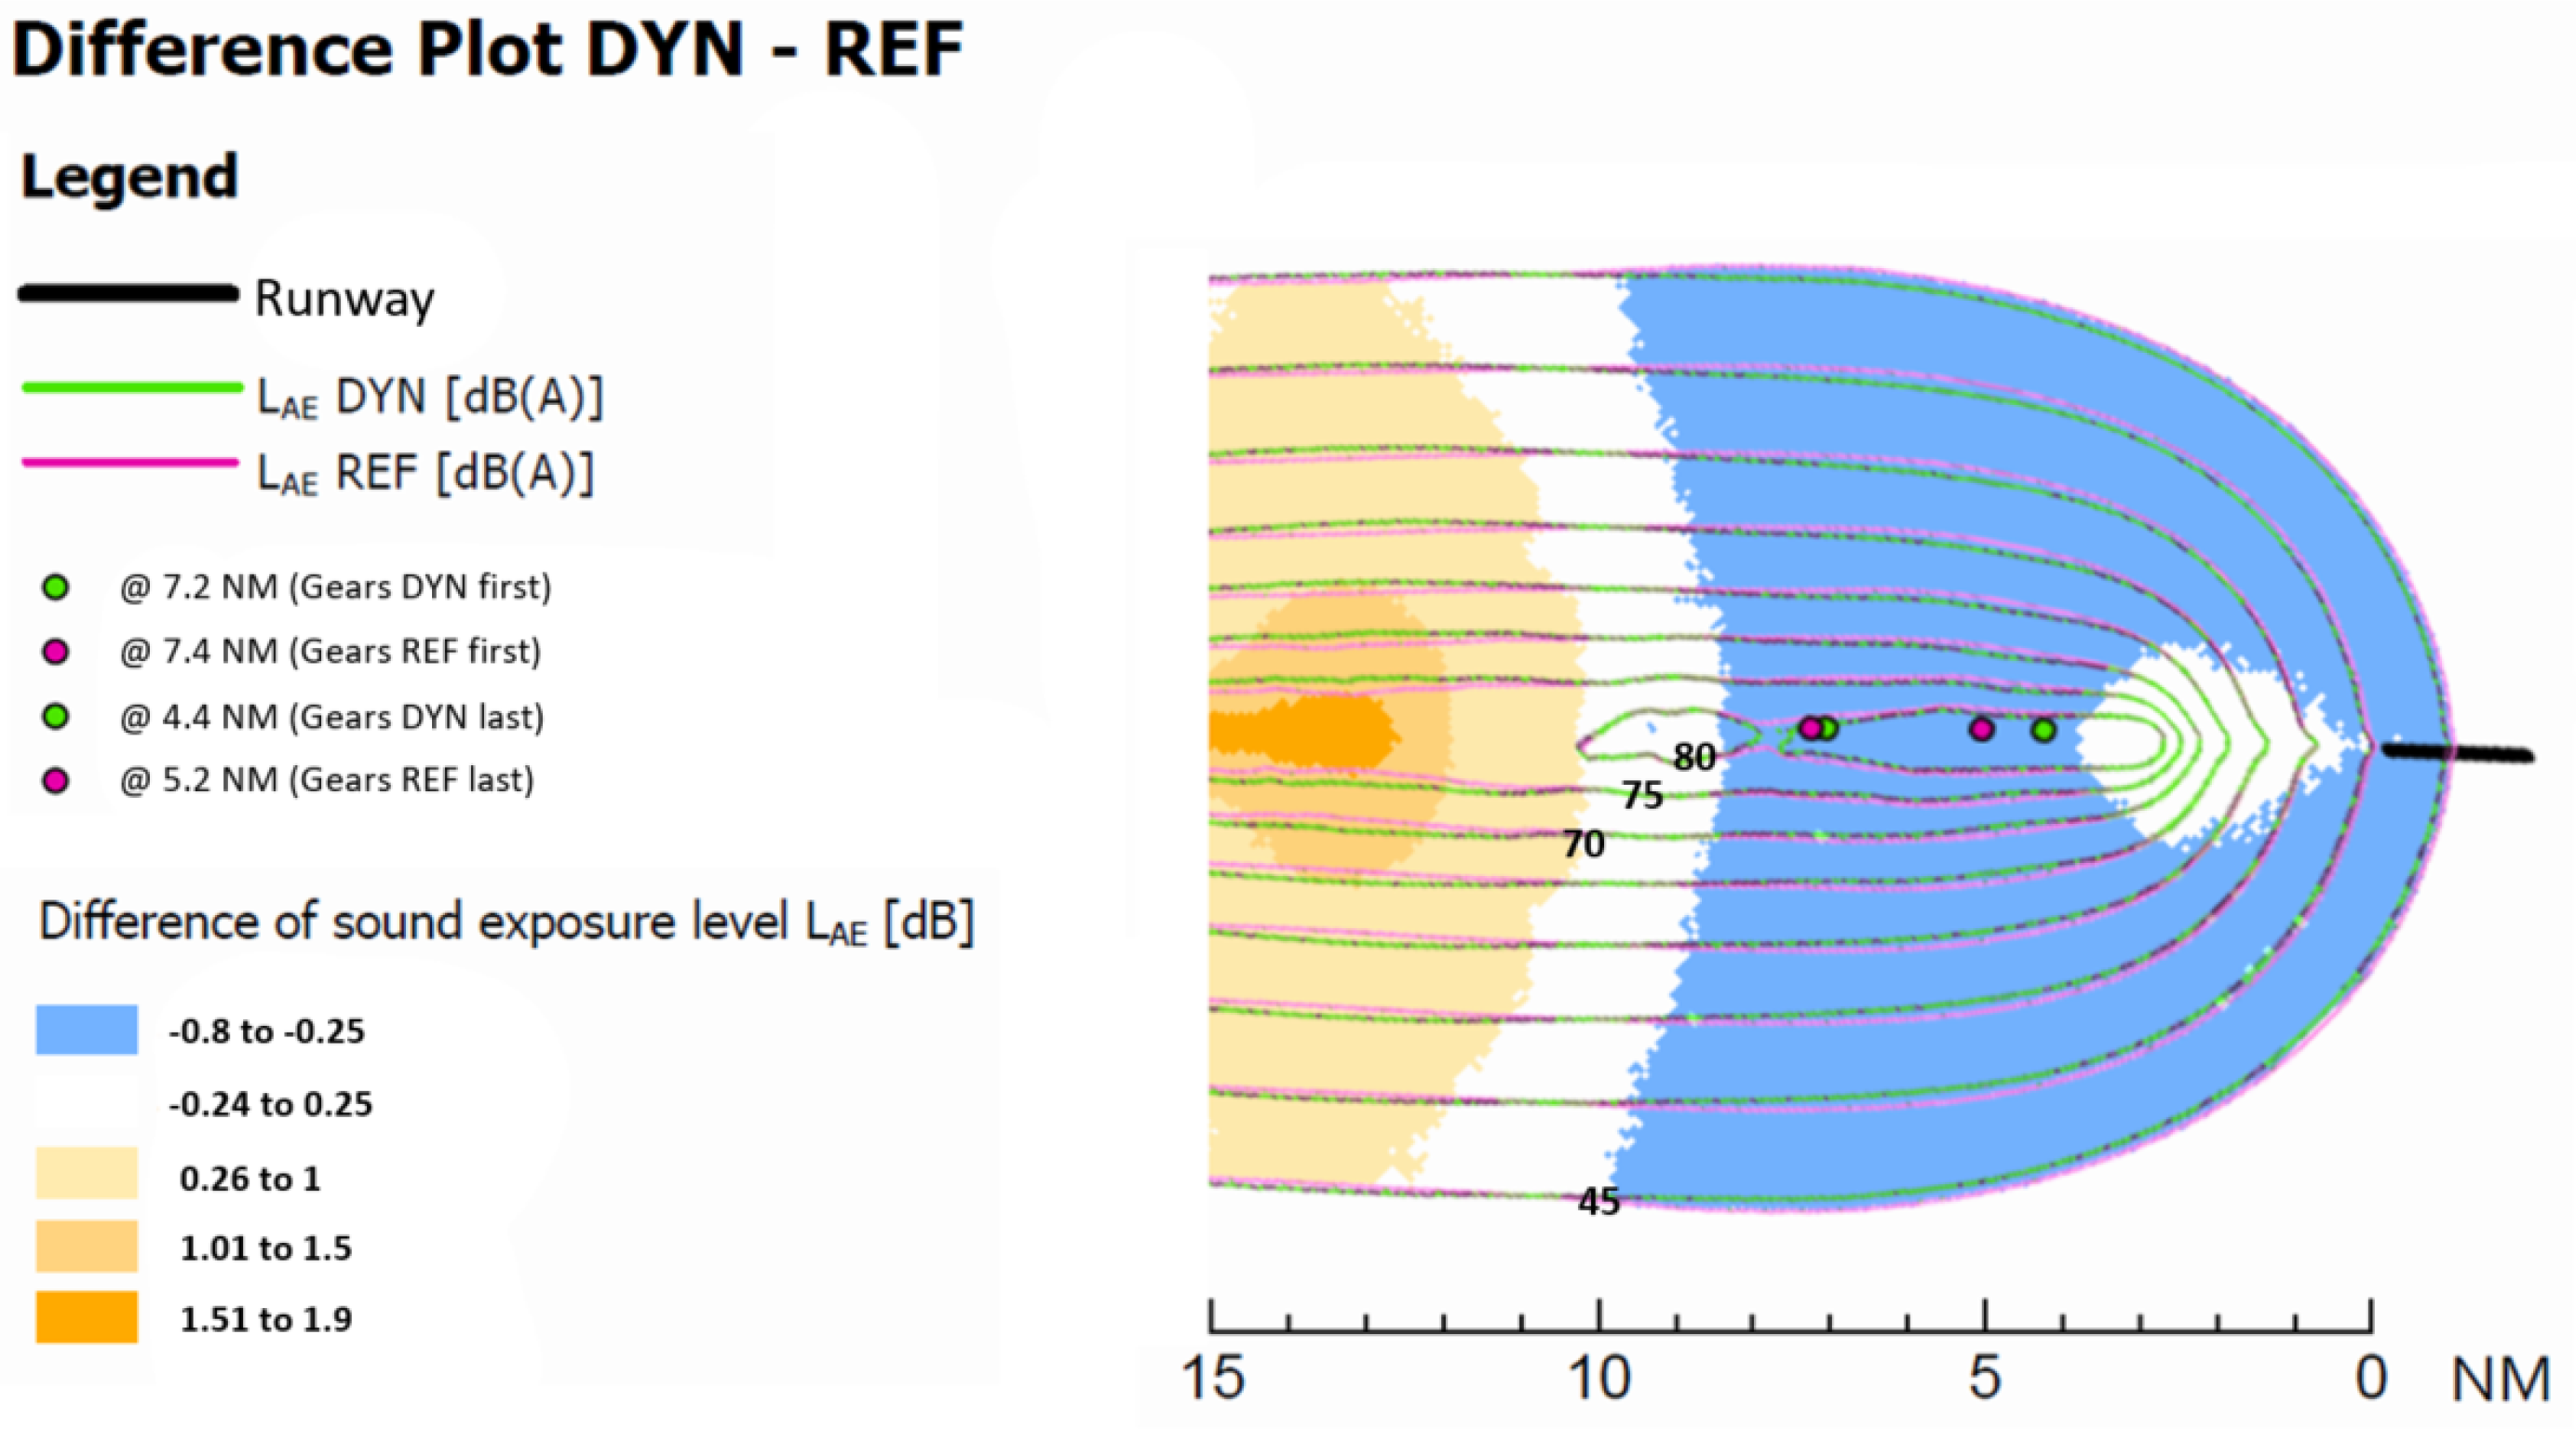
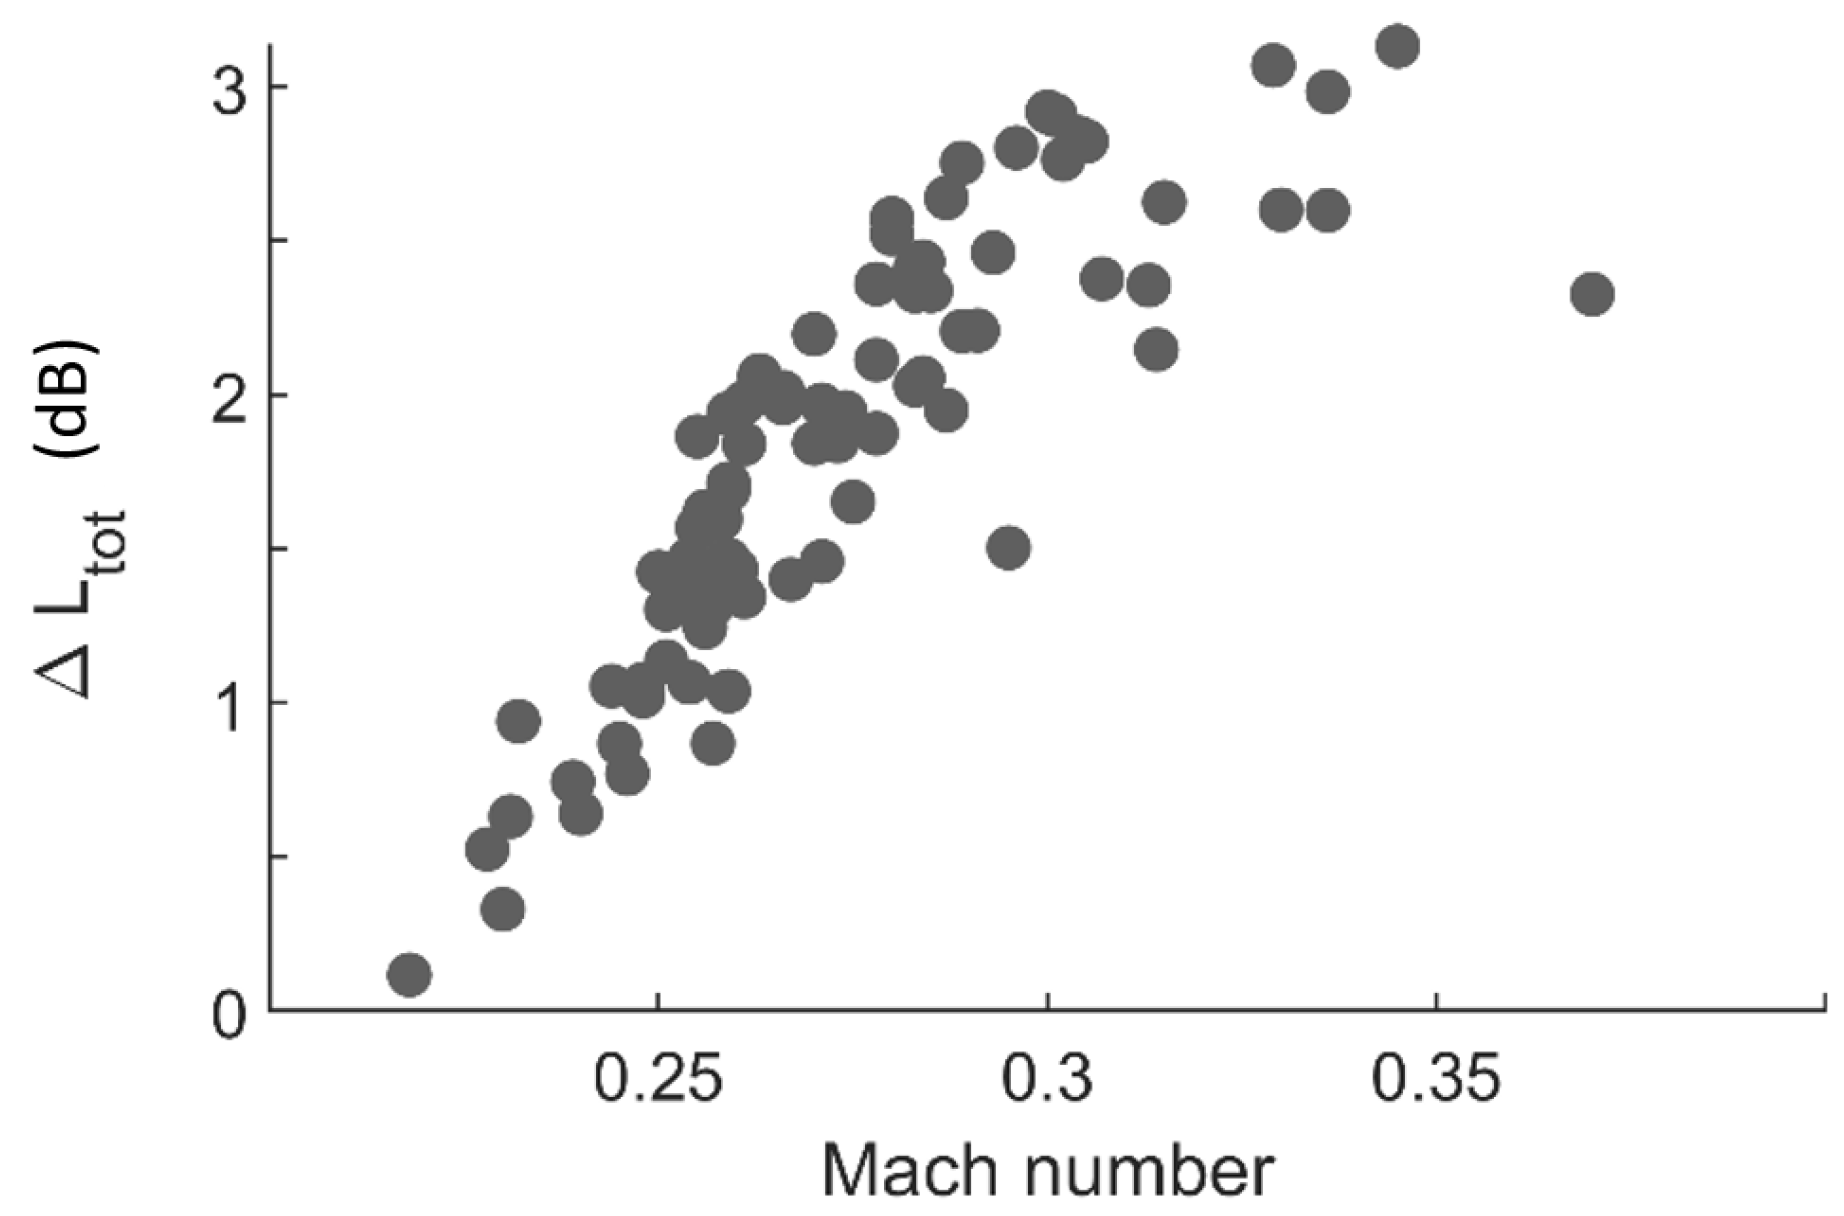
Figure 6 shows a map with the differences in LAE of flights with vs. without DYNCAT based on the straightened flights. The noise simulations of the flights end at the stabilization point (about 3 NM distance to runway threshold), where DYNCAT no longer has an effect. This explains the closing of the noise contours already before the runway. The results are in agreement with the evaluation of noise emissions with the moved-along receiver. The lower average flight altitude of the flights with DYNCAT and higher airspeed between 15 and 12 NM increases the sound exposure levels of the DYNCAT flights. In contrast, DYNCAT flights yield lower exposure level after 10 NM to touchdown. Most crucial thereby is the considerably later extension of the landing gear, as shown in Figure 6. The latter effect is visualized in Figure 7, which shows the change in overall sound pressure level at a receiver position of 1000 ft before and after the extension of the landing gear in dependence of speed. The dataset in Figure 7 is based on sonAIR simulations of real-world flights of Airbus A321 using FDR data provided by SWISS International Airlines.

3.3. Combined Analysis of Fuel Consumption and Noise

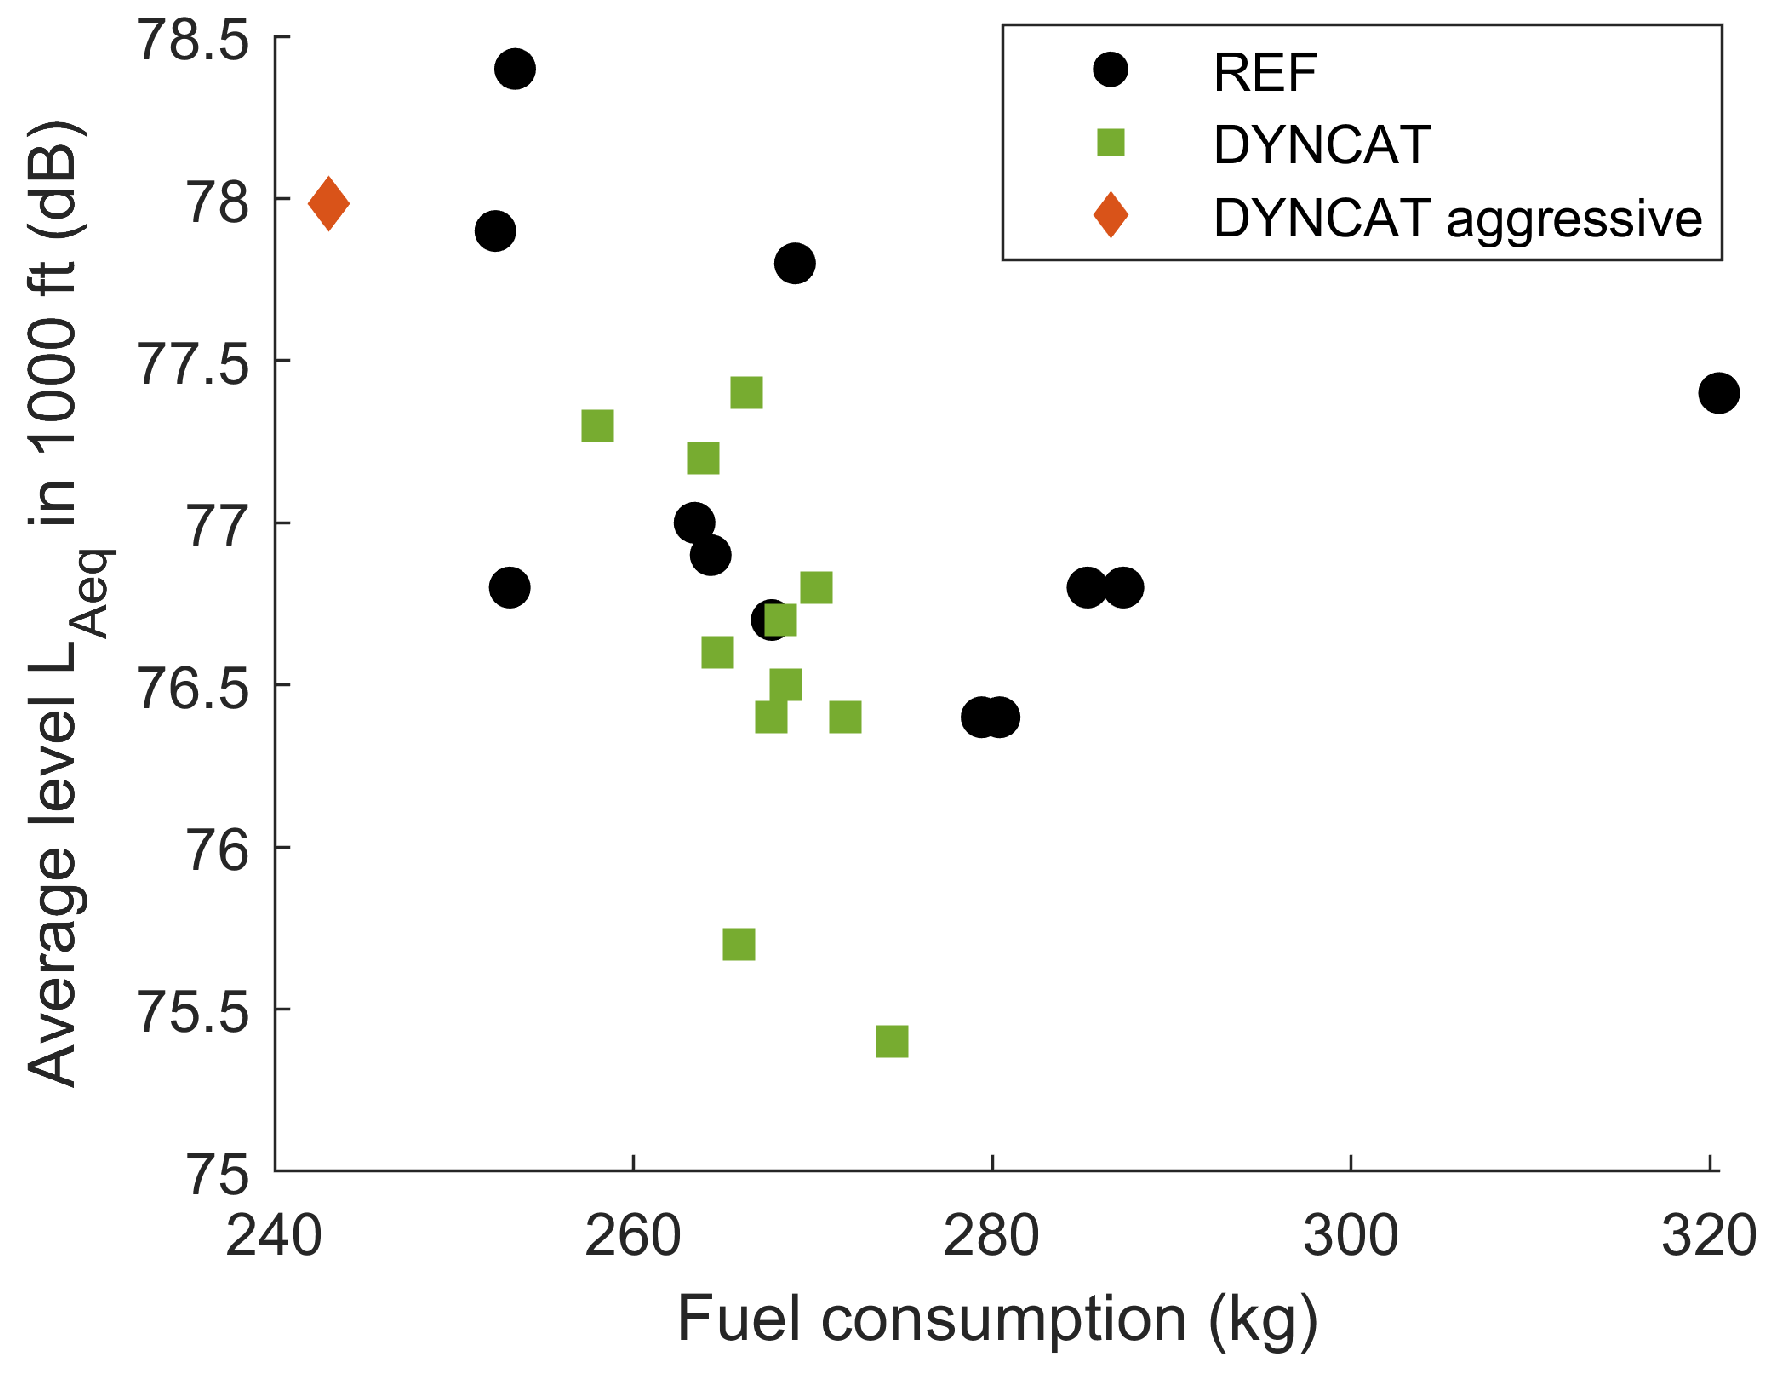
In Figure 8, fuel consumption and the average sound pressure level at a distance of 1000 ft are compared. In addition to the 12 reference and the 12 DYNCAT flights, a flight from the same cockpit simulation trials is shown with a more aggressive tuning towards fuel savings. The fuel consumption is taken for the entire descent and approach, as the location of CO2 emissions is irrelevant regarding environmental impact. For noise, in contrast, only the average sound emission during the last 10–3 NM is used, as this final part of the flight produces the highest noise levels on ground and therefore is most sensitive regarding health impact. As Figure 4 revealed, the fuel consumption values of the reference flights show a much larger scatter, which indicates that individual data points are outside the optimal range. Further, the reference flights with very low fuel consumption tend to be louder. The scatter of the DYNCAT flights is rather small for fuel consumption but similar to those of the reference flights for noise, although in trend shifted towards smaller values.

4. Discussion

In this publication, the new FMS functions developed and implemented in the DYNCAT project were exemplarily assessed in a case study of a specific over-energy situation. An evaluation based on simulator flights only provides a limited number of events but yields the maximum possible realism and provides the necessary input data for a detailed analysis and comparison of individual flights. The exercise supports the assumption that pilot assistance systems can help pilots to fly more accurately and with reduced environmental impact by reducing both the noise burden and the CO2 footprint of air traffic. Due to the challenging over-energy situation including various ATC instructions along the flight path, the pilots configured earlier without the use of DYNCAT chose a more conservative approach strategy. Consequently, energy management has been improved by the use of DYNCAT. At the same time, DYNCAT also enabled more precise stabilization of the approach at the 1000 ft gate, which improves flight safety accordingly.
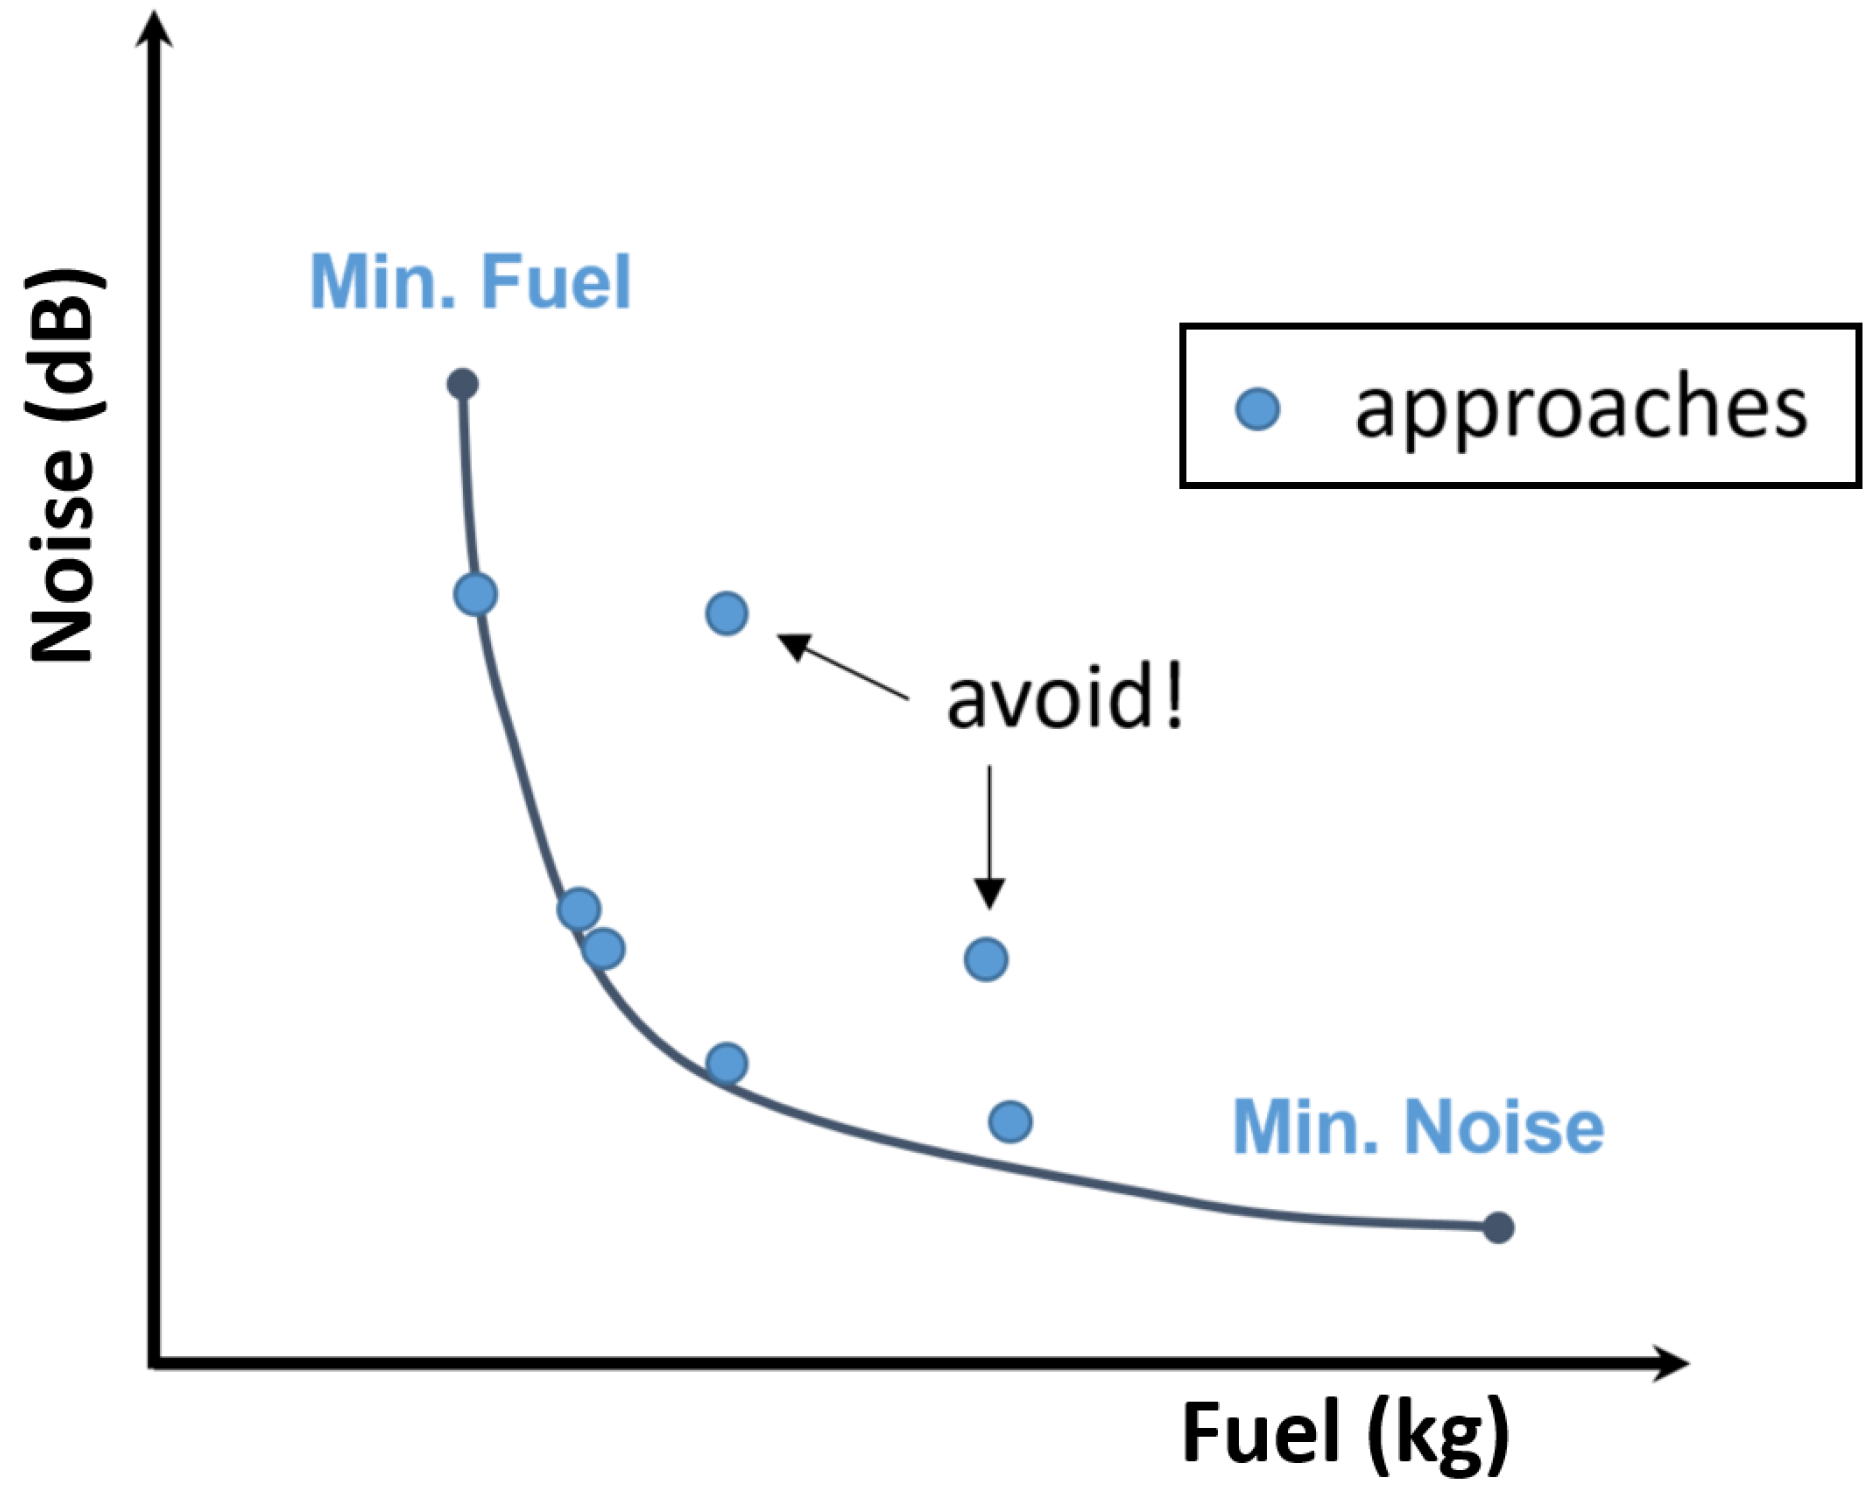
The results, however, reveal a potential conflict between the two environmental optimization goals. A perfect strategy to minimize noise would be to first reduce speed and only secondly height, as higher airspeeds lead to increased airframe noise, and as sound exposure increases with decreasing distance and thus with altitude loss. In contrast, saving fuel is not only achieved by flying in idle but also by reducing the flight time, as the engines consume a considerable amount of fuel even with engines operating at idle speed. The substantially higher airspeed for the flights with DYNCAT at 15 NM before touchdown is consequently beneficial to reduce the fuel consumption but leads to higher noise levels at this stage. In the end, only a Pareto optimum between these two criteria can be found along a minimal curve as schematically depicted in Figure 9. All points on the curve are Pareto efficient, meaning it is not possible to improve one criterion without negatively affecting the other. Outcomes that do not follow this Pareto curve are not optimal, neither for fuel nor noise, and have to be avoided.
Compared to Figure 9, one could assume that the current DYNCAT optimization is closer to the optimum for fuel consumption than for noise, i.e., following the upper left part of the schematic Pareto optimum curve. However, the flight with the aggressive tuning shows on the one hand that the tuning can be adjusted even further towards fuel savings, and on the other hand it confirms the finding that the DYNCAT flights are located around the optimum curve.
An even further reduction in fuel consumption could be achieved by not strictly following the standard configuration sequence. For example, an approach with 250 kt up to 12 NM before the runway is likely to be very economical but requires the landing gear to be extended at very high speeds, which in contrast will be detrimental for noise in the corresponding area.

5. Conclusions and Outlook

Pilot assistance systems that help optimizing aircraft energy management are a key technology to implement noise abatement operational procedures as envisioned by ICAO’s balanced approach [11]. In a simulator experiment, the newly implemented FMS functionalities of DYNCAT allowed for a reduction in noise and fuel consumption at the same time when compared to reference flights without the assistance system. In addition, it was shown that there is further potential to reduce fuel consumption and it can be assumed that the tuning potential of DYNCAT towards a further noise reduction has not yet been fully exploited and should be investigated in the future. As there is a potential conflict between these two environmental optimization goals, future refinements of the system should aim at local optimizations, namely to focus more on noise reduction in the final part of the flight, particularly in densely populated areas, while giving a higher weight to fuel consumption reduction in the early part of descent.
The current exercise was conducted for an Airbus A321 and arrivals at Zurich airport. However, the concept of the pilot assistance system is not limited to Airbus aircraft nor a specific airport. Consequently, this approach has the potential of generating a broader impact on the environmental footprint of the civil aviation industry.
Apart from optimizing the pilot assistance system and integrating it in operational flight management systems, a strong focus has to be given to its integration into the overall ATC environment. Energy management can only be optimized if a sufficiently accurate estimate of the remaining distance is available and if certain degrees of freedom in terms of speed and/or height are allowed. The strong influence of ATC instructions on fuel consumption and noise exposure was recently shown by Abdelmoula et al. in an analysis of real approach operations at Zurich airport, carried out within the framework of the DYNCAT project [20]. Hence, it can be concluded that environmentally friendly flight procedures have considerable potential, but there are still many challenges that have to be addressed before they can unravel their full potential. This assessment is in agreement with ICAO, who previously stated in 2007 that there are still several challenges to overcome on the road to implementation of noise abatement procedures [11]:
It will take incorporation of flight, airspace, and ATC procedure changes and improvements in aircraft equipage on a wide-spread basis, adopted by the pilots, air carriers, air navigation service providers and airport operators for these benefits to be fully realized.

Author Contributions

Conceptualization, F.A.; methodology, J.M., J.M.W., M.G. and F.A.; software, J.M. and J.B.; validation, J.M. and J.M.W.; formal analysis, J.M., J.M.W., M.G., T.B. and F.A.; investigation, J.M. and J.M.W.; resources, J.B., M.G., T.B. and F.A.; writing—original draft preparation, J.M.W. and J.M.; writing—review and editing, J.M.W., J.M., F.A. and T.B.; project administration, F.A. and T.B.; funding acquisition, F.A. and T.B. All authors have read and agreed to the published version of the manuscript.

Funding

The DYNCAT SESAR 2020 Exploratory Research project has received funding from the SESAR Joint Undertaking under the European Union’s Horizon 2020 research and innovation programme under grant agreement No. 893568.

Data Availability Statement

Data available on request due to restrictions.

Acknowledgments

Special thanks for the valuable contributions and discussions with pilots and air traffic controllers received during the analysis of data set. The authors would also like to thank SWISS International Airlines for the providing of the anonymous flight data sets.

Conflicts of Interest

Author Johan Boyer was employed by the company Thales AVS France SAS. The remaining authors declare that the research was conducted in the absence of any commercial or financial relationships that could be construed as a potential conflict of interest.

Abbreviations

The following abbreviations are used in this manuscript:
AALAbove Airfield Level
ATCAir Traffic Control
ATCoAir Traffic Controller
CDAContinuous Descent Approach
DYNCATDynamic Configuration Adjustment in the TMA
FDRFlight Data Recorder
FMSFlight Management System
ICAOInternational Civil Aviation Organization
LAEA-weighted sound exposure level
LASA-weighted sound pressure level with time constant SLOW (1 s)
LNASLow-Noise Augmentation System
N1Rotational speed of the jet engine’s low pressure shaft
NMNautical Miles
TMATerminal Manoeuvring Area

References

  1. Burgueño Salas, E. Environmental Impact of the Aviation Industry Worldwide-Statistics & Facts. 2022. Available online: http://publications.jrc.ec.europa.eu/repository/handle/111111111/26390 (accessed on 24 September 2013).
  2. Air Transport Action Group. Facts & Figures; Air Transport Action Group: Geneva, Switzerland, 2020. [Google Scholar]
  3. EUROCONTROL. EUROCONTROL Forecast Update 2023–2029; EUROCONTROL: Brussels, Belgium, 2023. [Google Scholar]
  4. de Hollander, A.E.M.; Melse, J.M.; Lebret, E.; Kramers, P.G.N. An aggregate public health indicator to represent the impact of multiple environmental exposures. Epidemiology 1999, 10, 606–617. [Google Scholar] [CrossRef]
  5. Sørensen, M.; Münzel, T.; Brink, M.; Roswall, N.; Wunderli, J.M.; Foraster, M. Chapter four—Transport, noise, and health. In Advances in Transportation and Health; Nieuwenhuijsen, M.J., Khreis, H., Eds.; Elsevier: New York, NY, USA, 2020; pp. 105–131. [Google Scholar] [CrossRef]
  6. WHO. Burden of Disease from Environmental Noise. Quantification of Healthy Life Years Lost in Europe; Report; World Health Organization (WHO) Regional Office for Europe: Copenhagen, Denmark, 2011; ISBN 978-92-890-0229-5.
  7. Friedt, F.L.; Cohen, J.P. Perception vs. reality: The aviation noise complaint effect on home prices. Transp. Res. Part D Transp. Environ. 2021, 100, 103011. [Google Scholar] [CrossRef]
  8. Kharina, A.; Rutherford, D. Fuel Efficiency Trends for New Commercial Jet Aircraft: 1960 to 2014; Report; International Council on Clean Transportation: Berlin, Germany, 2015. [Google Scholar]
  9. Kors, E.; Collin, D. Perspective on 25 Years of European Aircraft Noise Reduction Technology Efforts and Shift Towards Global Research Aimed at Quieter Air Transport. In Aviation Noise Impact Management: Technologies, Regulations, and Societal Well-Being in Europe; Leylekian, L., Covrig, A., Maximova, A., Eds.; Springer International Publishing: Cham, Switzerland, 2022; pp. 57–116. [Google Scholar] [CrossRef]
  10. Zellmann, C.; Schäffer, B.; Wunderli, J.M.; Isermann, U.; Paschereit, C.O. Aircraft Noise Emission Model Accounting for Aircraft Flight Parameters. J. Aircr. 2017, 55, 682–695. [Google Scholar] [CrossRef]
  11. ICAO (International Civil Aviation Organization). Review of Noise Abatement Procedure Research & Development and Implementation Results; Report; ICAO: Rio de Janeiro, Brazil, 2007. [Google Scholar]
  12. Isermann, U. Potentials and Limits of Noise Abatement Flight Procedures. In Proceedings of the Internoise 2013, Innsbruck, Austria, 15–18 September 2013. [Google Scholar]
  13. Kurz, J.; Blinstrup, J. Conceptual design of a pilot assistance system for customised noise abatement departure procedures. CEAS Aeronaut. J. 2023, 15, 325–337. [Google Scholar] [CrossRef]
  14. Christian, A.; Sparrow, V. A multi-objective evolutionary optimization approach to procedural flightnoise mitigation. Proc. Meet. Acoust. 2013, 19, 040073. [Google Scholar]
  15. Rodríguez-Díaz, A.; Adenso-Díaz, B.; González-Torre, P.L. Improving aircraft approach operations taking into account noise and fuel consumption. J. Air Transp. Manag. 2019, 77, 46–56. [Google Scholar] [CrossRef]
  16. Clarke, J.P.B.; Ho, N.T.; Ren, L.; Brown, J.A.; Elmer, K.R.; Tong, K.O.; Wat, J.K. Continuous Descent Approach: Design and Flight Test for Louisville International Airport. J. Aircr. 2004, 41, 1054–1066. [Google Scholar] [CrossRef]
  17. Jin, L.; Cao, Y.; Sun, D. Investigation of Potential Fuel Savings Due to Continuous-Descent Approach. J. Aircr. 2013, 50, 807–816. [Google Scholar] [CrossRef]
  18. Filippone, A. Options for aircraft noise reduction on arrival and landing. Aerosp. Sci. Technol. 2017, 60, 31–38. [Google Scholar] [CrossRef]
  19. Otero, E.; Tengzelius, U.; Moberg, B. Flight Procedure Analysis for a Combined Environmental Impact Reduction: An Optimal Trade-Off Strategy. Aerospace 2022, 9, 683. [Google Scholar] [CrossRef]
  20. Abdelmoula, F.; Roeser, M.S.; Kühne, C.G.; Gerber, M.; Wunderli, J.M. Impact of ATC speed instructions on fuel consumption and noise exposure: An assessment of real operations in Zurich. CEAS Aeronaut. J. 2022, 13, 1041–1053. [Google Scholar] [CrossRef]
  21. Gerber, M.; Schreiber, Y.; Abdelmoula, F.; Kühne, C.G.; Jäger, D.; Wunderli, J.M. Energy-optimized approaches: A challenge from the perspectives of pilots and air traffic controllers. CEAS Aeronaut. J. 2022, 13, 1055–1066. [Google Scholar] [CrossRef]
  22. Abdelmoula, F.; Scholz, M. LNAS—A pilot assistance system for low-noise approaches with minimal fuel consumption. In Proceedings of the 31st Congress of the International Council of the Aeronautical Sciences, Horizonte, Brazil, 9–14 September 2018. [Google Scholar]
  23. Jäger, D.; Zellmann, C.; Wunderli, J.M.; Scholz, M.; Abdelmoula, F.; Gerber, M. Validation of an airline pilot assistant system for low-noise approach procedures. Transp. Res. Part D Transp. Environ. 2021, 99, 103020. [Google Scholar] [CrossRef]
  24. Bauer, T.; Abdelmoula, F.; Boyer, J.; Gerber, M.; Meister, J.; Wunderli, J.M. Improved Configuration Management for Greener Approaches—Evaluation of a Novel Pilot Support Concept. In Proceedings of the ICAS 2022—33rd International Council of Aeronautical Sciences (ICAS), Stockholm, Sweden, 4–9 September 2022; Volume 9, pp. 6568–6583. [Google Scholar]
  25. Boyer, J.; Dacre-Wright, B. Permanent Resume Trajectory: An Innovative Flight Management System Functionality for Greener and Seamless Operations. In Proceedings of the Aerospace Europe Conference 2020, Bordeaux, France, 25–27 February 2020. [Google Scholar]
  26. Pauly, P.; Meister, J.; Wunderli, J.M.; Gerber, M.; Boyer, J.; Abdelmoula, F.; Bauer, T. Improved energy management during arrival for lower noise emissions. In Proceedings of the Towards Sustainable Aviation Summit (TSAS), Toulouse, France, 18–20 October 2022. Paper No. 16. [Google Scholar]
  27. Wunderli, J.M.; Rotach, M.W. Application of Statistical Weather Data From the Numerical Weather Prediction Model COSMO-2 for Noise Mapping Purposes. Acta Acust. United Acust. 2011, 97, 403–415. [Google Scholar] [CrossRef]
  28. Wunderli, J.M.; Zellmann, C.; Köpfli, M.; Habermacher, M.; Schwab, O.; Schlatter, F.; Schäffer, B. sonAIR—A GIS-Integrated Spectral Aircraft Noise Simulation Tool for Single Flight Prediction and Noise Mapping. Acta Acust. United Acust. 2018, 104, 440–451. [Google Scholar] [CrossRef]
  29. Jäger, D.; Zellmann, C.; Schlatter, F.; Wunderli, J.M. Validation of the sonAIR aircraft noise simulation model. Noise Mapp. 2020, 8, 95–107. [Google Scholar] [CrossRef]
  30. Meister, J.; Schalcher, S.; Wunderli, J.M.; Jäger, D.; Zellmann, C.; Schäffer, B. Comparison of the Aircraft Noise Calculation Programs sonAIR, FLULA2 and AEDT with Noise Measurements of Single Flights. Aerospace 2021, 8, 388. [Google Scholar] [CrossRef]
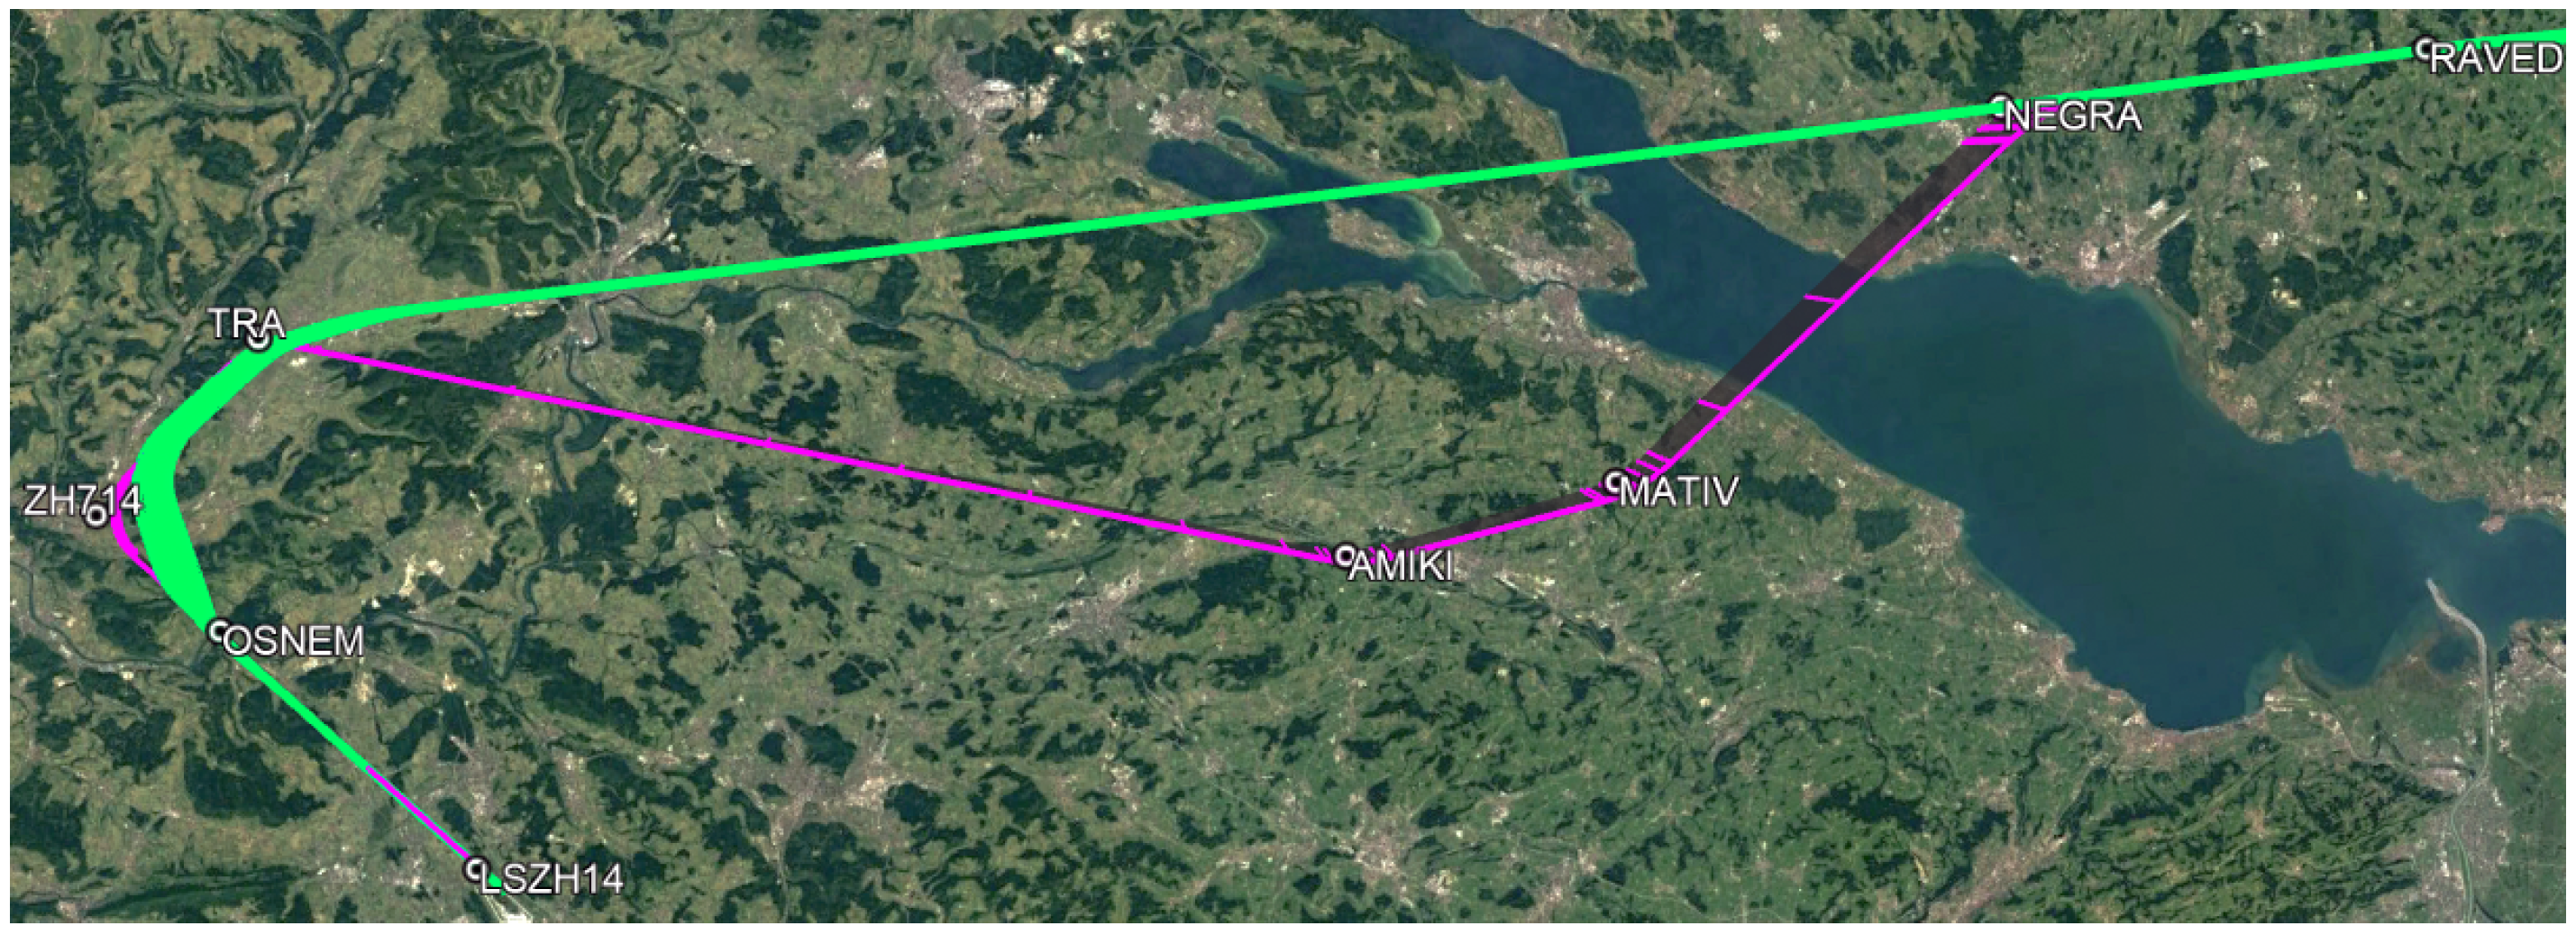
Figure 1. Planned flight track according to the flight plan (magenta) and actual flight track (green) after ATC instruction (short-cut to waypoint TRA). Credit: Google Earth.
Aerospace 11 00450 g001
Figure 2. Schematic representation of the moved-along receiver located 1000 ft vertically below the aircraft.
Aerospace 11 00450 g002
Figure 3. Original and straightened trajectories of all trial flights in blue and red, respectively. Credit: ArcGIS Pro.
Aerospace 11 00450 g003
Figure 4. Boxplots of fuel consumption of flights with (green) and without (grey) using DYNCAT.
Aerospace 11 00450 g004
Figure 5. Moved-along receiver analysis, comparing average outcomes for 12 flights with and 12 flights without the use of DYNCAT. The plots on the left show from top to bottom: (1) the A-weighted sound pressure level with time constant Slow LAS, (2) the energy share of the airframe noise on the total noise, see Equation (1), (3) the average difference of DYNCAT (DYN) minus reference (REF) flights for N1 and Mach-Number (Ma), and (4) the flight altitude. The plots on the right show from top to bottom: (1) the average sound pressure level difference ΔLAS (DYN-REF), (2) the mean flaps/slats setting, (3) the mean landing gear setting, and (4) the mean speed brakes setting. The dashed lines represent the reference flights, the solid lines the flights with DYNCAT.
Aerospace 11 00450 g005
Figure 6. Noise map showing the average difference of the sound exposure level on ground (LAE) of DYNCAT (DYN) minus reference (REF) flights. The A-weighted sound exposure levels LAE are shown as isolines from 45 to 80 dB in 5 dB steps. In addition, the beginning and ending of the phase with landing gear extensions are shown as points to illustrate the distances. Note that the flights have only been simulated until the stabilization point (about 3 NM distance to runway threshold).
Aerospace 11 00450 g006
Figure 7. Difference of sound pressure level (ΔLtot) for a moved-along receiver (1000 ft underneath the aircraft) caused by landing gear extension for an Airbus A321.
Aerospace 11 00450 g007
Figure 8. Fuel consumption vs. energetically averaged sound pressure level (at 1000 ft distance over 10–3 NM to runway threshold), compared for reference (REF) and DYNCAT flights.
Aerospace 11 00450 g008
Figure 9. Schematic two-parameter or Pareto optimum curve for a specific flight. Each blue point indicates an approach strategy, where approaches away from the Pareto optimum curve yield a higher environmental impact and hence have to be avoided.
Aerospace 11 00450 g009
Disclaimer/Publisher’s Note: The statements, opinions and data contained in all publications are solely those of the individual author(s) and contributor(s) and not of MDPI and/or the editor(s). MDPI and/or the editor(s) disclaim responsibility for any injury to people or property resulting from any ideas, methods, instructions or products referred to in the content.