Abstract
A pulsed detonation chamber (PDC) equipped with Hartmann–Sprenger resonators has been designed and tested for both Hydrogen/air and Hydrogen/Oxygen mixtures. A full-factorial experimental campaign employing four factors with four levels each has been carried out for both mixtures. Instantaneous static pressure has been measured at two locations on the exhaust pipe of the PDC, and the signal has been processed to extract the average and maximum cycle pressures and the operating frequency of the spark plug. The PDC has been shown to be able to reach sustained detonation cycles over a length below 200 mm, measured from the spark plug to the first pressure sensor. The optimal regimes for both air and Oxygen operation have been determined, and the influence of the four factors on the responses is discussed.
1. Introduction
It has been earlier demonstrated by numerous studies (e.g., [1,2]) that thermodynamic cycles based on pressure gain heat addition to the working fluid offer extraordinary potential in terms of cycle efficiency and a higher energy release rate. Various engine concepts that can accomplish this pressure supplement have been proposed over the years, and among these, the Pulsed Detonation Engine (PDE), the Rotating Detonation Engine (RDE), and the Oblique Wave Detonation Engine (OWDE) are the most studied. In all, a detonation wave is produced by igniting the combustible mixture under proper conditions. A detonation wave is composed of a leading shock wave coupled with a combustion wave, both traveling at the local speed of sound, where the leading shock wave raises the pressure and temperature of the fluid, allowing the combustion wave to propagate at the maximum possible velocity (called the Chapman–Jouguet velocity) [3]. The detonation wave causes an abrupt rise in pressure and temperature, fast enough to achieve complete combustion at a quasi-constant fluid density.
The PDE [4,5] is characterized by an unsteady cycle of a reactive mixture contained in a tube with a detonation wave created at one end and traveling to the other end of the combustor. The PDE cycle is started by filling the detonation chamber with a fuel/oxidizer mixture delivered through either a mechanical or aerodynamic valve from the premixing area. A detonation wave is initiated by means of a high-frequency ignition device, and combustion products are evacuated at the open end of the combustor, creating thrust [6]. The cycle is composed of four main stages: filling, detonation initiation, propagation, and blowout and purging [3]. Once the burned gases are purged, the cycle repeats. The minimum cycle frequency to ensure performance above classical combustion (deflagration) is 75 Hz [7], and the state-of-the-art devices range between 100 and 400 Hz [8,9,10].
The application of detonation waves in propulsion systems dates back to the 1940s [11,12], but the complexity of the problem delayed the first successful demonstrator flight to 2008 (DARPA’s Blackswift [13]), with insufficiently conclusive results.
Besides the increased cycle efficiency, further advantages arise from design simplicity, reduced specific weight, and lack of moving parts. PDCs are explored to be integrated as ground-based power generation devices or in different flight propulsion architectures, either for air-breathing or spaced-based applications [5]. The integration of PDC in turbomachinery has been demonstrated to yield an increased combined cycle efficiency of more than 60% [14], while the cycle average pressure has been shown to increase by 6.7% for a gas turbine coupled with two PDCs [15]. Other novel concepts of integrating PDCs in turbomachinery include sequentially firing single or multiple PDC tubes into the turbine [16,17].
Baptista et al. [16] disseminate the advantage of the sequential firing of a multi-tube PDC for turbine integration, proving its usefulness in avoiding resonance frequency phenomena. Frolov [17] reports the development of an innovative idea of dual-triggering to achieve DDT and stable operation for a liquid-fueled laboratory-scale air-breathing PDC demonstrator. In another study, Frolov [18] presented a new PDC model and state-of-the-art industrial burners for industrial applications fueled by natural gas. Stable, cyclic detonation is achieved by means of DDT with a long duration. Wang et al. [19] performed experiments on a valveless Pulse Detonation Rocket Engine (PDRE) with a modified cycle using liquid gasoline, confirming that smaller volume detonation tubes enhance the operating frequency and exhaust velocity. Card et al. [20] recorded through experiments the flame acceleration and DDT in different fuel-air mixtures.
PDCs for industrial burner applications have also been considered [18]. It was also found that orbital transfer systems costs can be lowered by adopting PDCs [21,22], while the compact configuration of the engine makes it a suitable candidate for powering Unmanned (Combat) Aerial Vehicles [23] and rocket engines [19]. Currently, the advantages of pressure-gain combustion propulsion systems are renewing interest in such engines, and interesting new developments in the field of detonation-based engines have been reported over the last year [24,25,26].
One of the main disadvantages of PDCs when compared to RDEs is the long channels required for the deflagration-to-detonation transition (DDT), i.e., the length required for the combustion wave to accelerate and couple to the leading shock wave. At the component level, several methods have been proposed to reduce the DDT length, such as Schelkin spirals [27,28], perforated plates [29], or obstacles [30]. An alternative approach is the use of Hartmann–Sprenger resonators for the intensification of the shock waves [31,32]. Furthermore, cross-flow injection of supersonic jets of fed gases increases mixing quality, which reduces DDT distances and timescales [33].
The present paper proposes a Pulsed Detonation Combustor concept developed by our team based on the latter approaches [34]. The model uses a couple of Hartmann–Sprenger resonators and cross-flow injections of supply gases that have the double purpose of creating an aerodynamic valve that controls the admission of fuel in the PDC and also enhancing the mixing and the turbulence upstream of the fresh mixture ignition point. Coupled with an obstacle placed at the end of the detonation chamber, the proposed model is demonstrated to achieve detonation over a length below 200 mm.
Another challenge for PDCs in achieving rapid DDT when switching oxidizers, apart from the component definition, is ensuring that the combustor can reach detonation for the same geometry configuration. The detonation cell size () is dependent on mixtures and gas input pressures [35]. For mixtures, the cell size is much smaller than for for the same gas feed pressure, which translates into a faster DDT. Also, the mixture is more sensitive to detonation than the latter because requires a higher temperature to dissociate and to participate in the reaction. Hence, geometry sizing is important. If the detonation wave is not confined in a properly designed channel, it loses its intensity and dissipates. However, the blockage ratio also plays an important role in the successful propagation of the detonation () [36].
Reports in the literature that study detonation mention several important aspects that separate experimental output parameters from theoretical values (CJ values). Chan et al. [37] prove that in the presence of area constraints within a channel, a detonation wave propagates at velocities less than CJ. In the presence of a step size within the channel, even if direct initiation by a spark plug is employed, theoretical values of detonation physical parameters (pressure, temperature, velocity) are achieved only at the ignition location, after which these parameters decay [37]. Teodorczyk et al. [38] explain that the input parameters, such as initial pressure of the mixture and mixture sensitivity, undergoing turbulence and shock flame interactions (specific for detonation waves) are responsible for reduced performance due to reflections and lower burning rate in the reaction zone.
The aim of this paper is to evaluate the effect of several parameters (i.e., equivalence ratio, oxidizer pressure, exhaust pipe length, and spark plug frequency) on the PDC performance, expressed in terms of maximum, average cycle pressure, and pressure gain.
2. Experimental Approach
2.1. Experimental Model
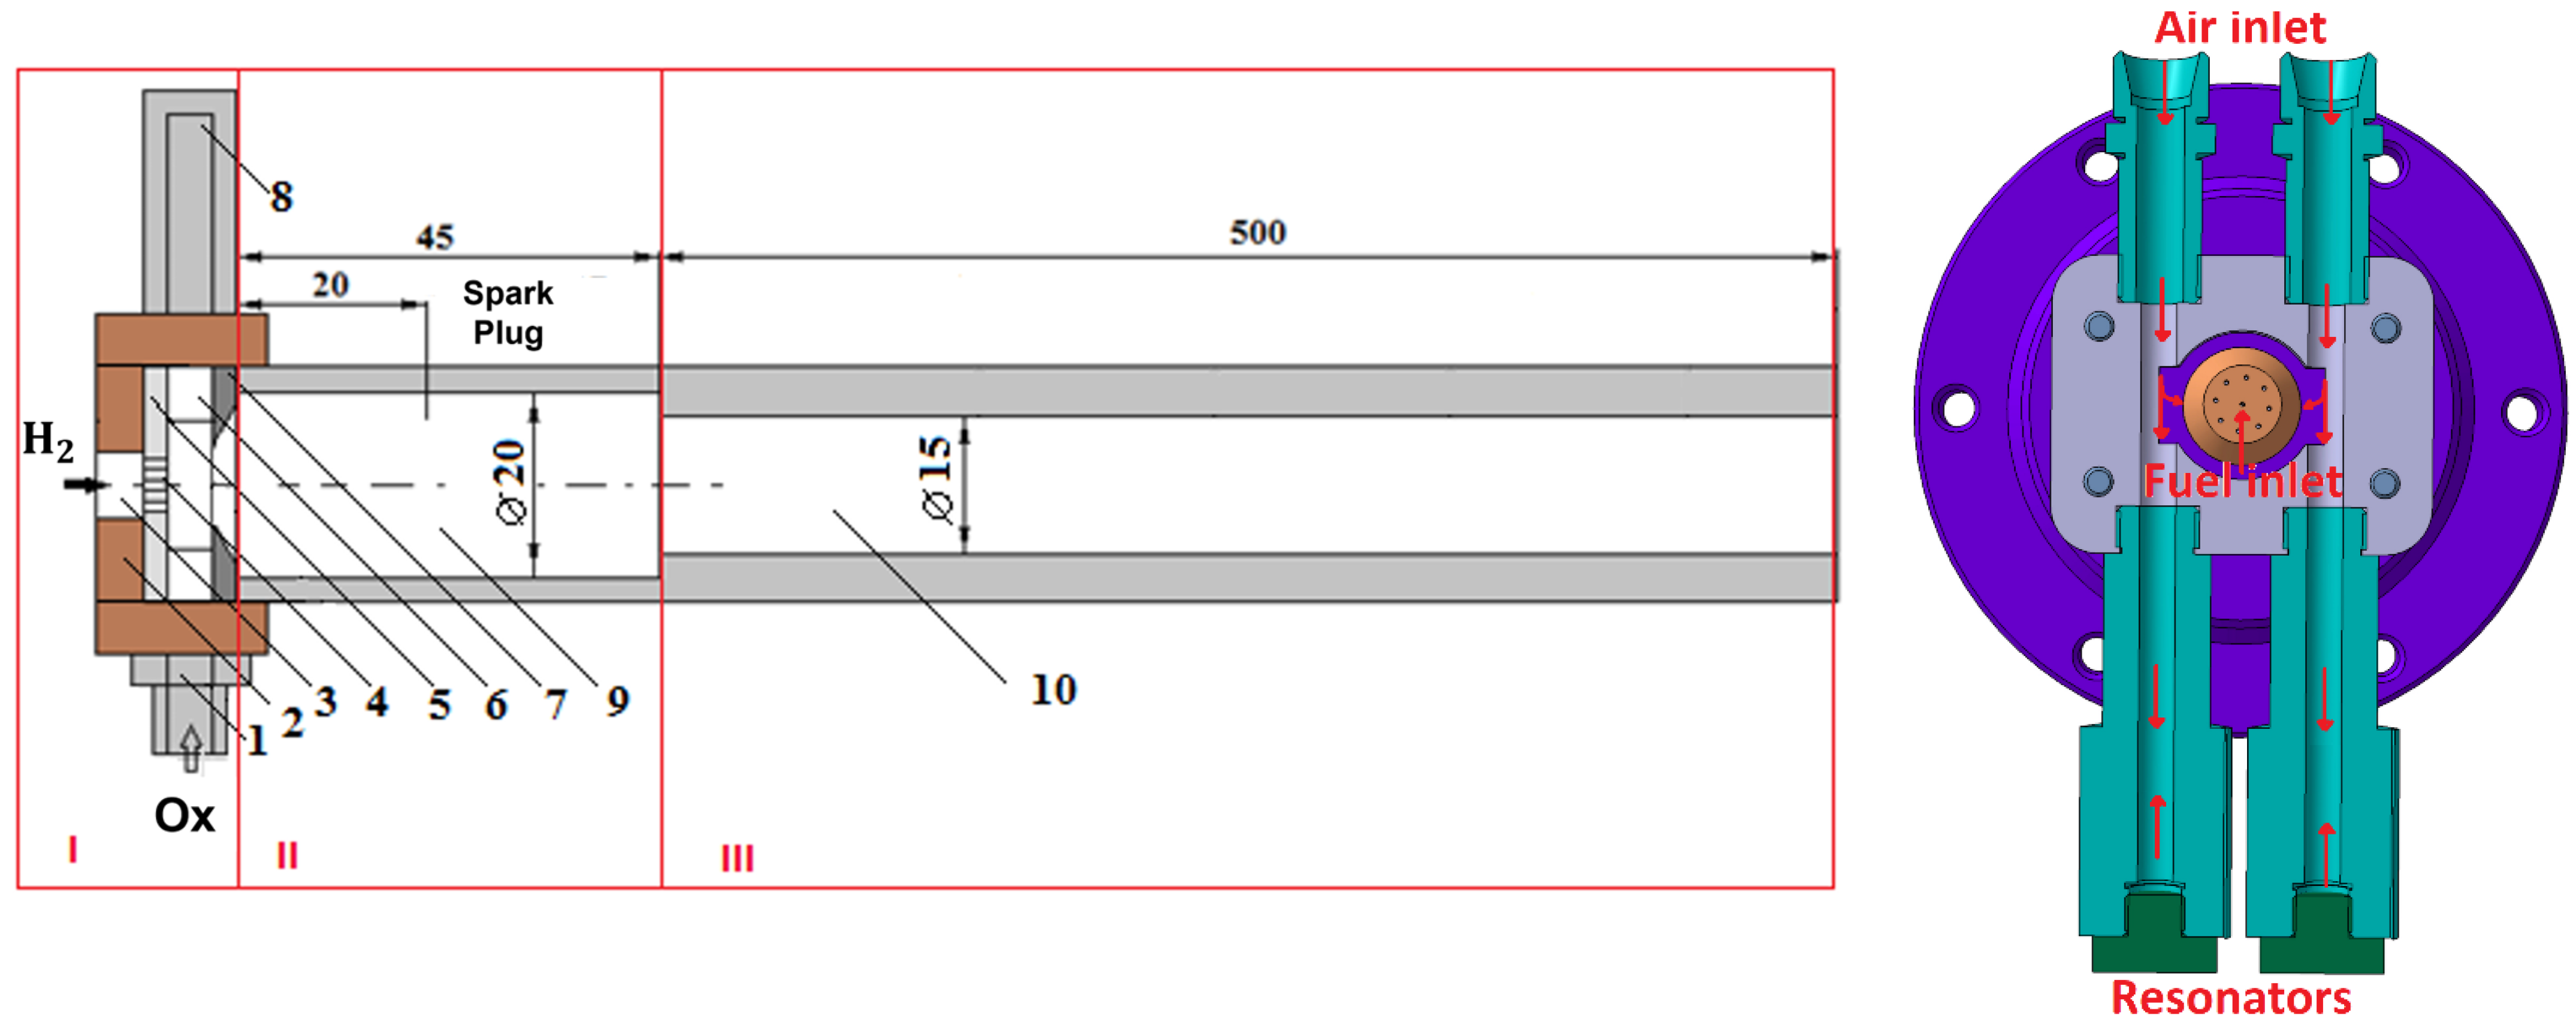
The PDC that was tested here consists of a premixer fitted with two Hartmann–Sprenger (I) resonators, a detonation chamber (II), and an exhaust pipe (III), as shown in Figure 1.
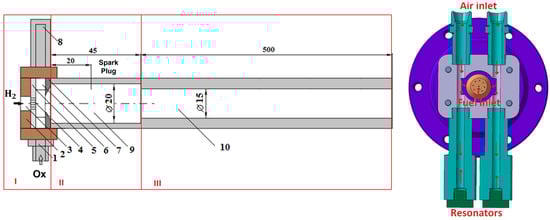
Figure 1.
Pulsed Detonation Combustor diagram.
The fuel, gaseous Hydrogen in this case, is brought by means of a nozzle (3—fuel inlet) in the axial direction inside a cylindrical premixing chamber. Air from the atmosphere, or Oxygen from a tank, enters the same chamber in the direction perpendicular to the direction of the fuel inlet by means of two channels (1—air inlet) that communicate tangentially with the premixing chamber. The air stream is first directed to a couple of Hartmann resonators (8) placed on the same axes as the inlets. The resonators create a series of high-frequency pressure pulsations upstream of the premixing chamber (2—end wall, 4—air passage window, 5—perforated plate). This configuration results in an alternating sense torsional motion created by the two planar tangential air jets entering the premixing chamber and colliding head-on, creating a central vortex (6—vortex generation chamber) with the dual role of both mixing the oxidizer and the fuel and generating an aerodynamic valve that alternately enables or disables the axial fuel inlet. During a period when the intensity of this vortex (rotational speed) is high enough, the static pressure in the premixing chamber is low, and the fuel can enter, being mixed with the air oxidizer within the vortex. As the vortex rotation slows down to change rotation sense, the planar jets of air collide above the fuel supply nozzle. During this period, a stagnation zone is created in the central area of the chamber where the static pressure is high. This, in turn, closes the aerodynamic valve and prevents fuel from entering.
The premixing chamber is connected to the detonation chamber by means of a diaphragm (7) provided with a central hole calibrated to accelerate the flow in the supersonic regime. When the torsional vortex is at its maximum intensity and the aerodynamic valve is open, except for the central region of the vortex, the flow velocity of the freshly formed mixture in the premixing chamber is predominantly tangential, and the static pressure upstream of the diaphragm orifice is small. Because of this, flow to the detonation chamber is negligible.
When the aerodynamic valve closes, the stagnation zone created in the center of the premixing chamber by the collision of the two planar jets of air significantly raises the pressure upstream of the diaphragm opening, and the fresh mixture is pushed into the detonation chamber in supersonic mode. The supersonic jet thus formed is preceded by a shock wave that separates it from the pre-existing quasi-stationary air in the detonation chamber.
Upon entering the detonation chamber, the fresh mixture is ignited by a spark plug. A flame front (combustion wave) is created and propagates in the fresh mixture both upstream and downstream with the speed of the laminar flame. Upstream, the combustion wave is stopped by the diaphragm. The shock wave preceding the supersonic jet, initially faster than the combustion wave, encounters a threshold created by a jump in diameter at the exit of the detonation chamber, which, forcing it to dissipate and recompose, creates a delay in its propagation and allows the combustion wave to catch up with the shock wave. The two waves couple at this threshold and form a detonation wave that propagates to the open end of the PDE through the exhaust pipe.
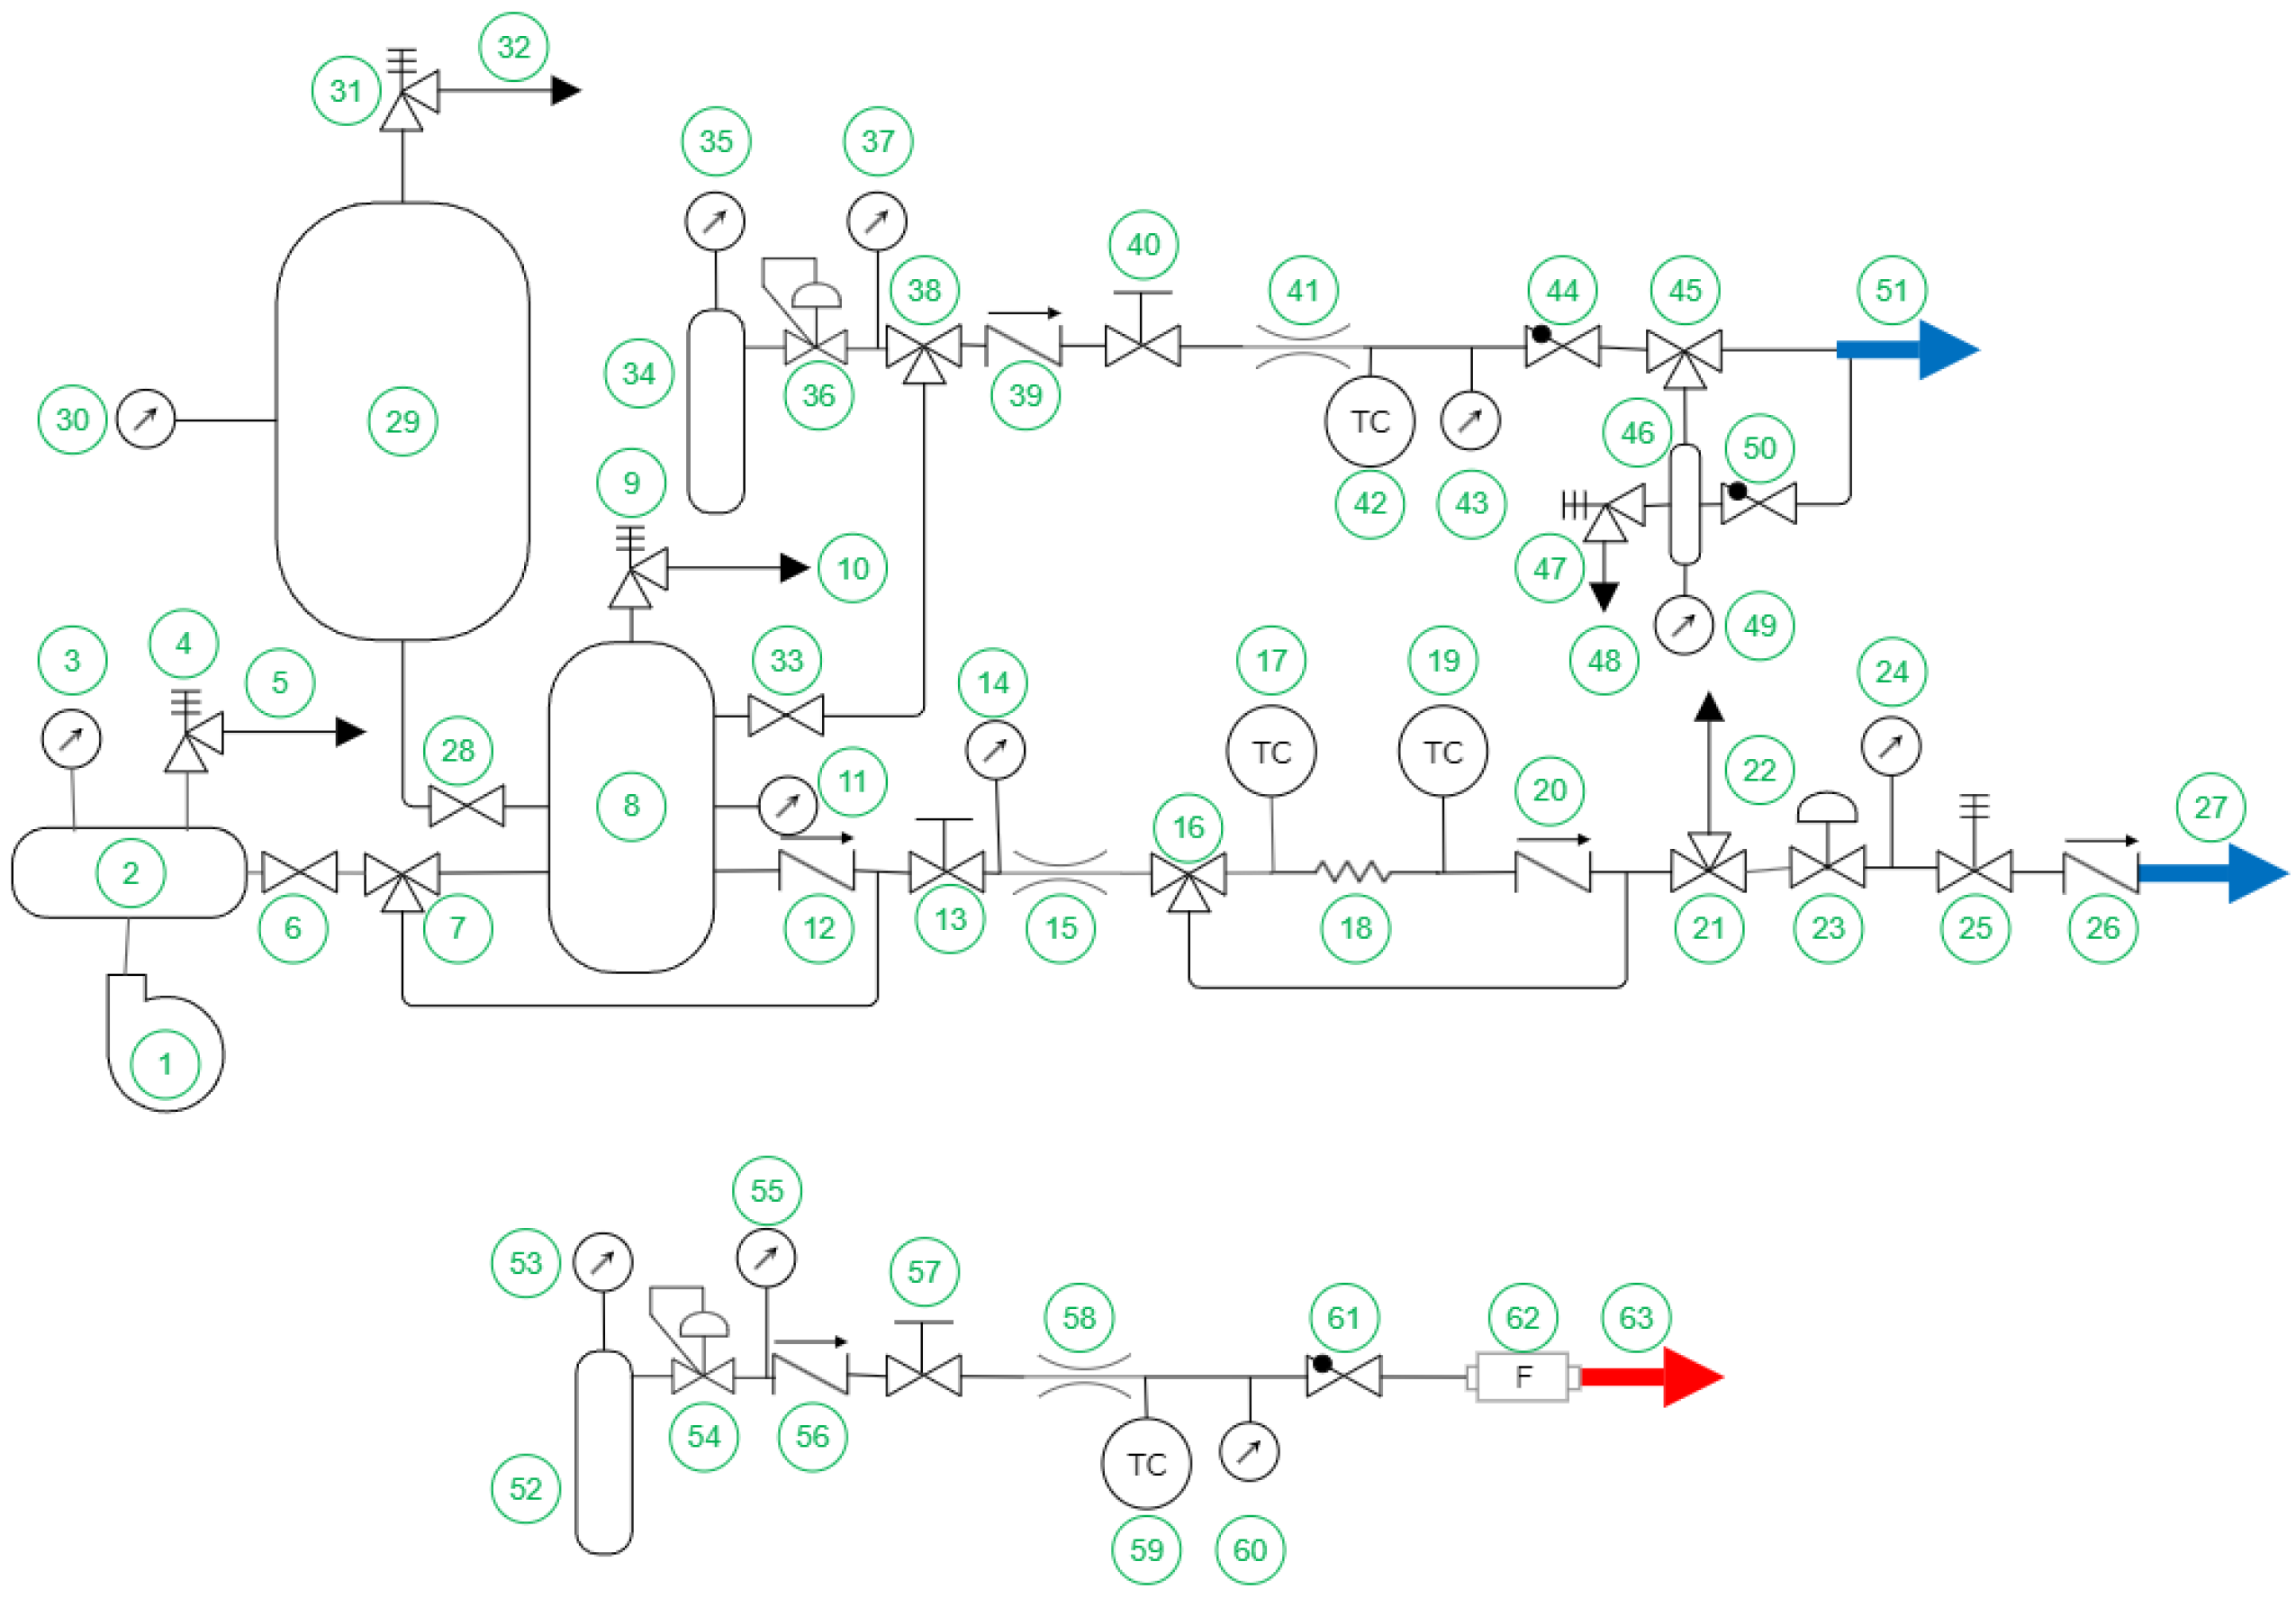
2.2. Experimental Setup
The PDE described above was installed on a test rig capable of providing Hydrogen, air, or Oxygen with the parameters provided in Table 1. The diagram of the test rig is presented in Figure 2.

Table 1.
Test rig maximum parameters.
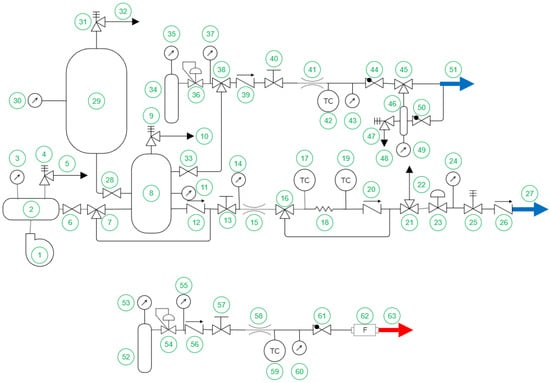
Figure 2.
Test rig diagram (see legend in Table 2).
2.3. Instrumentation and Test Matrix
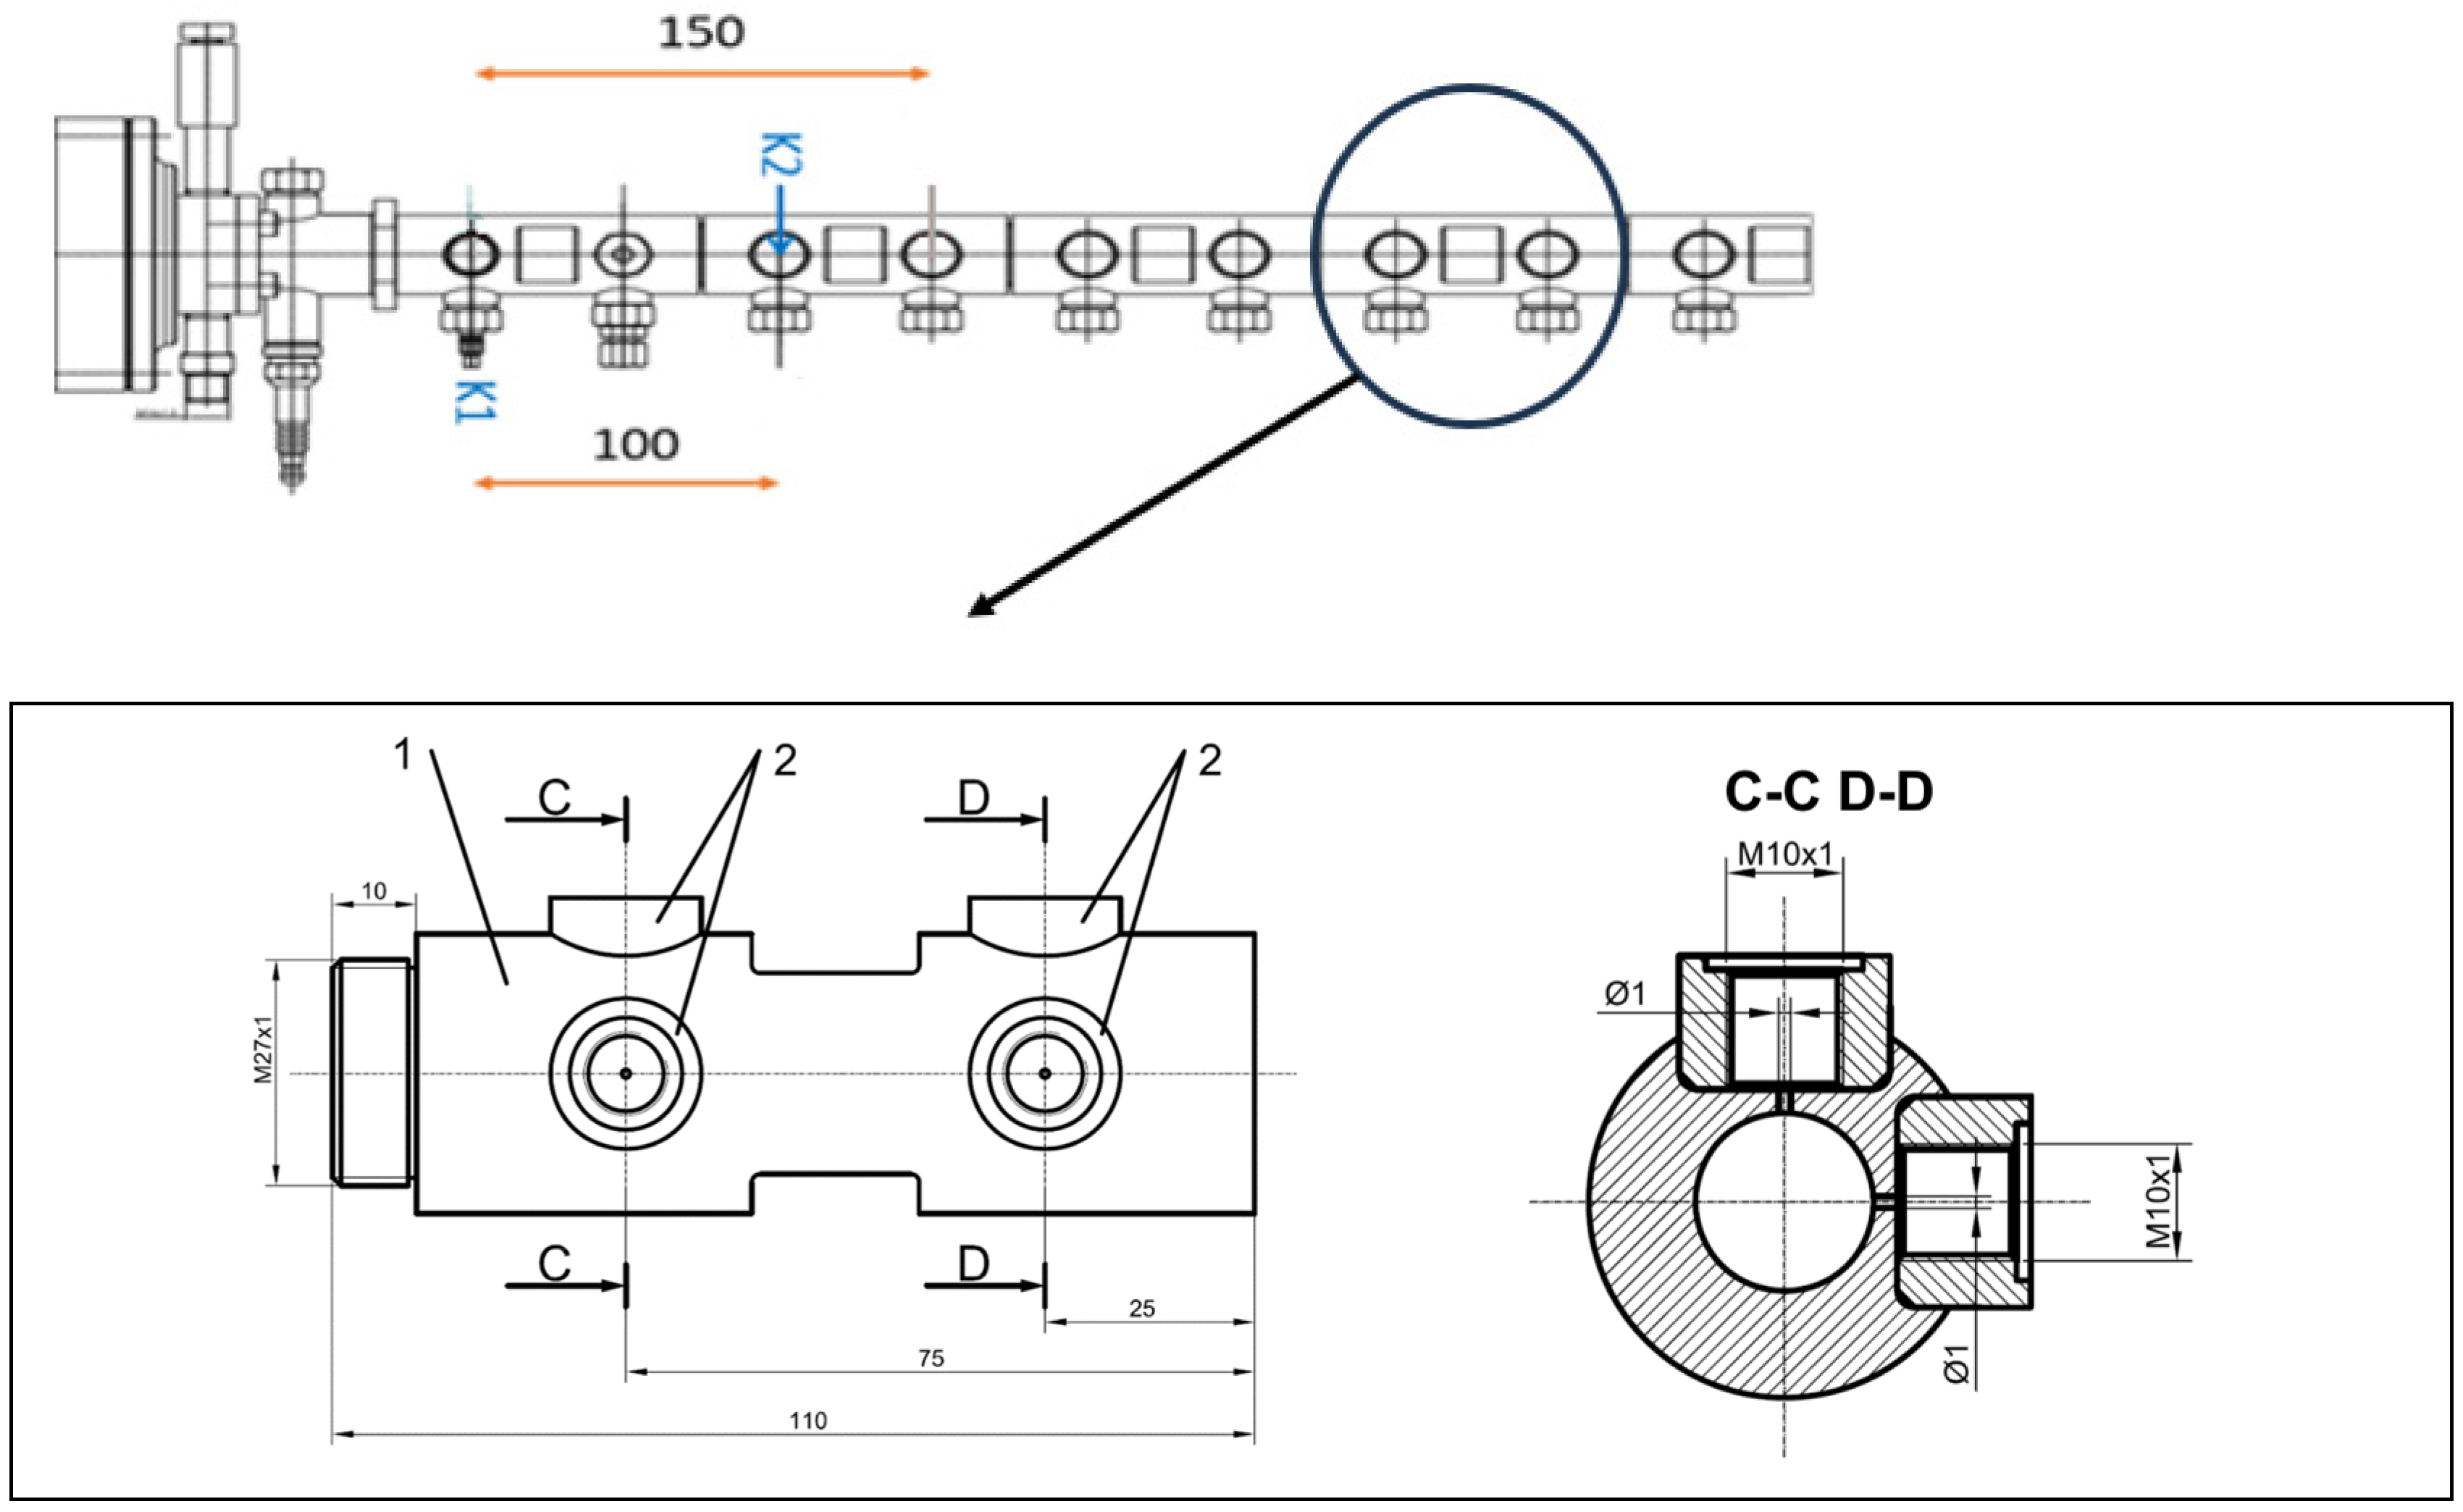
The results presented in this paper stem from fast measurements of static pressure on the exhaust pipe of the PDC. The measurements have been carried out using two Kulite ETM-HT-375 (M) sensors, placed according to Figure 3. Each sensor has an operating pressure of up to 35 bara, a bandwidth of up to 3 kHz (DC), a maximum combined non-linearity, hysteresis, and repeatability of ±0.5% FSO (typical is ±0.1% FSO BFSL), a natural frequency greater than 400 kHz, and an acceleration sensitivity of % FS/g. The transfer function from mV to bar is the result of a linear regression with = 0.99990, for K1 and = 0.99999, for K2. Calibration was performed for both sensors within the range of 1–20 bar, with an increment of 0.5 bar. The sampling rate for each sensor is 20 kHz. The data from the two sensors was averaged in the graphs shown in the next section.
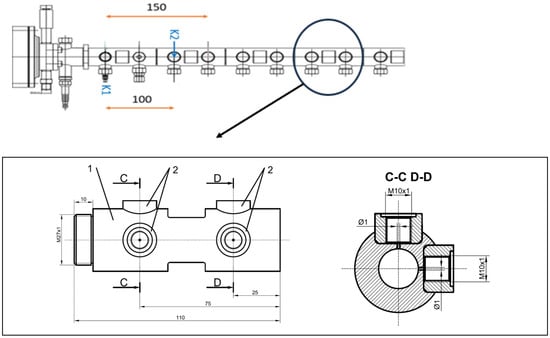
Figure 3.
Instrumentation diagram. K1 and K2 mark the positions of the two Kulite probes.
In addition to the sensors, Schlieren visualization data are added to back the pressure data. A Z-type Schlieren system is aligned perpendicular to the exhaust plane of the PDC. This system is composed of two 32 cm parabolic mirrors, an adjustable knife for cutoff, a light source and a Phantom VEO710L high-speed camera (Vision Research Wayne, NJ, USA). During recording, the camera is operated at 77,000 fps at 256 × 256 pixels with 1 exposure time.
The experimental campaign is organized to provide data for a DoE approach to assess the effect of four factors over a set of responses that characterize the operation of the PDT. The four factors, each with four levels (see Table 3), considered in the test matrix are the following:
Table 3.
Explicit values of the parameters level.
- 0.
- Exhaust pipe length—L;
- 1.
- Spark plug operating frequency—;
- 2.
- Fuel feed line pressure—;
- 3.
- Oxidizer feed line pressure—.
The test codes that will be referred to in the next section are thus formed by the concatenation of the level number for each of the four factors, starting with factor 0, the exhaust pipe length. For example, Test ID 0123 will use an exhaust pipe length of 200 mm, a spark plug frequency of 150 Hz, a fuel feed line pressure of 8.5 bar, and an oxidizer feed line pressure of 4.5 bar.
The full factorial matrix resulting from all possible combinations of the four levels of the four factors contains 256 cases. Two experimental campaigns have been carried out, one using air as an oxidizer and the second using pure Oxygen. Due to the extended testing space, not all the test cases resulted in sustained pulsed detonation cycles. In the next section, only the results for the valid cases are presented.
2.4. Post-Processing Algorithm
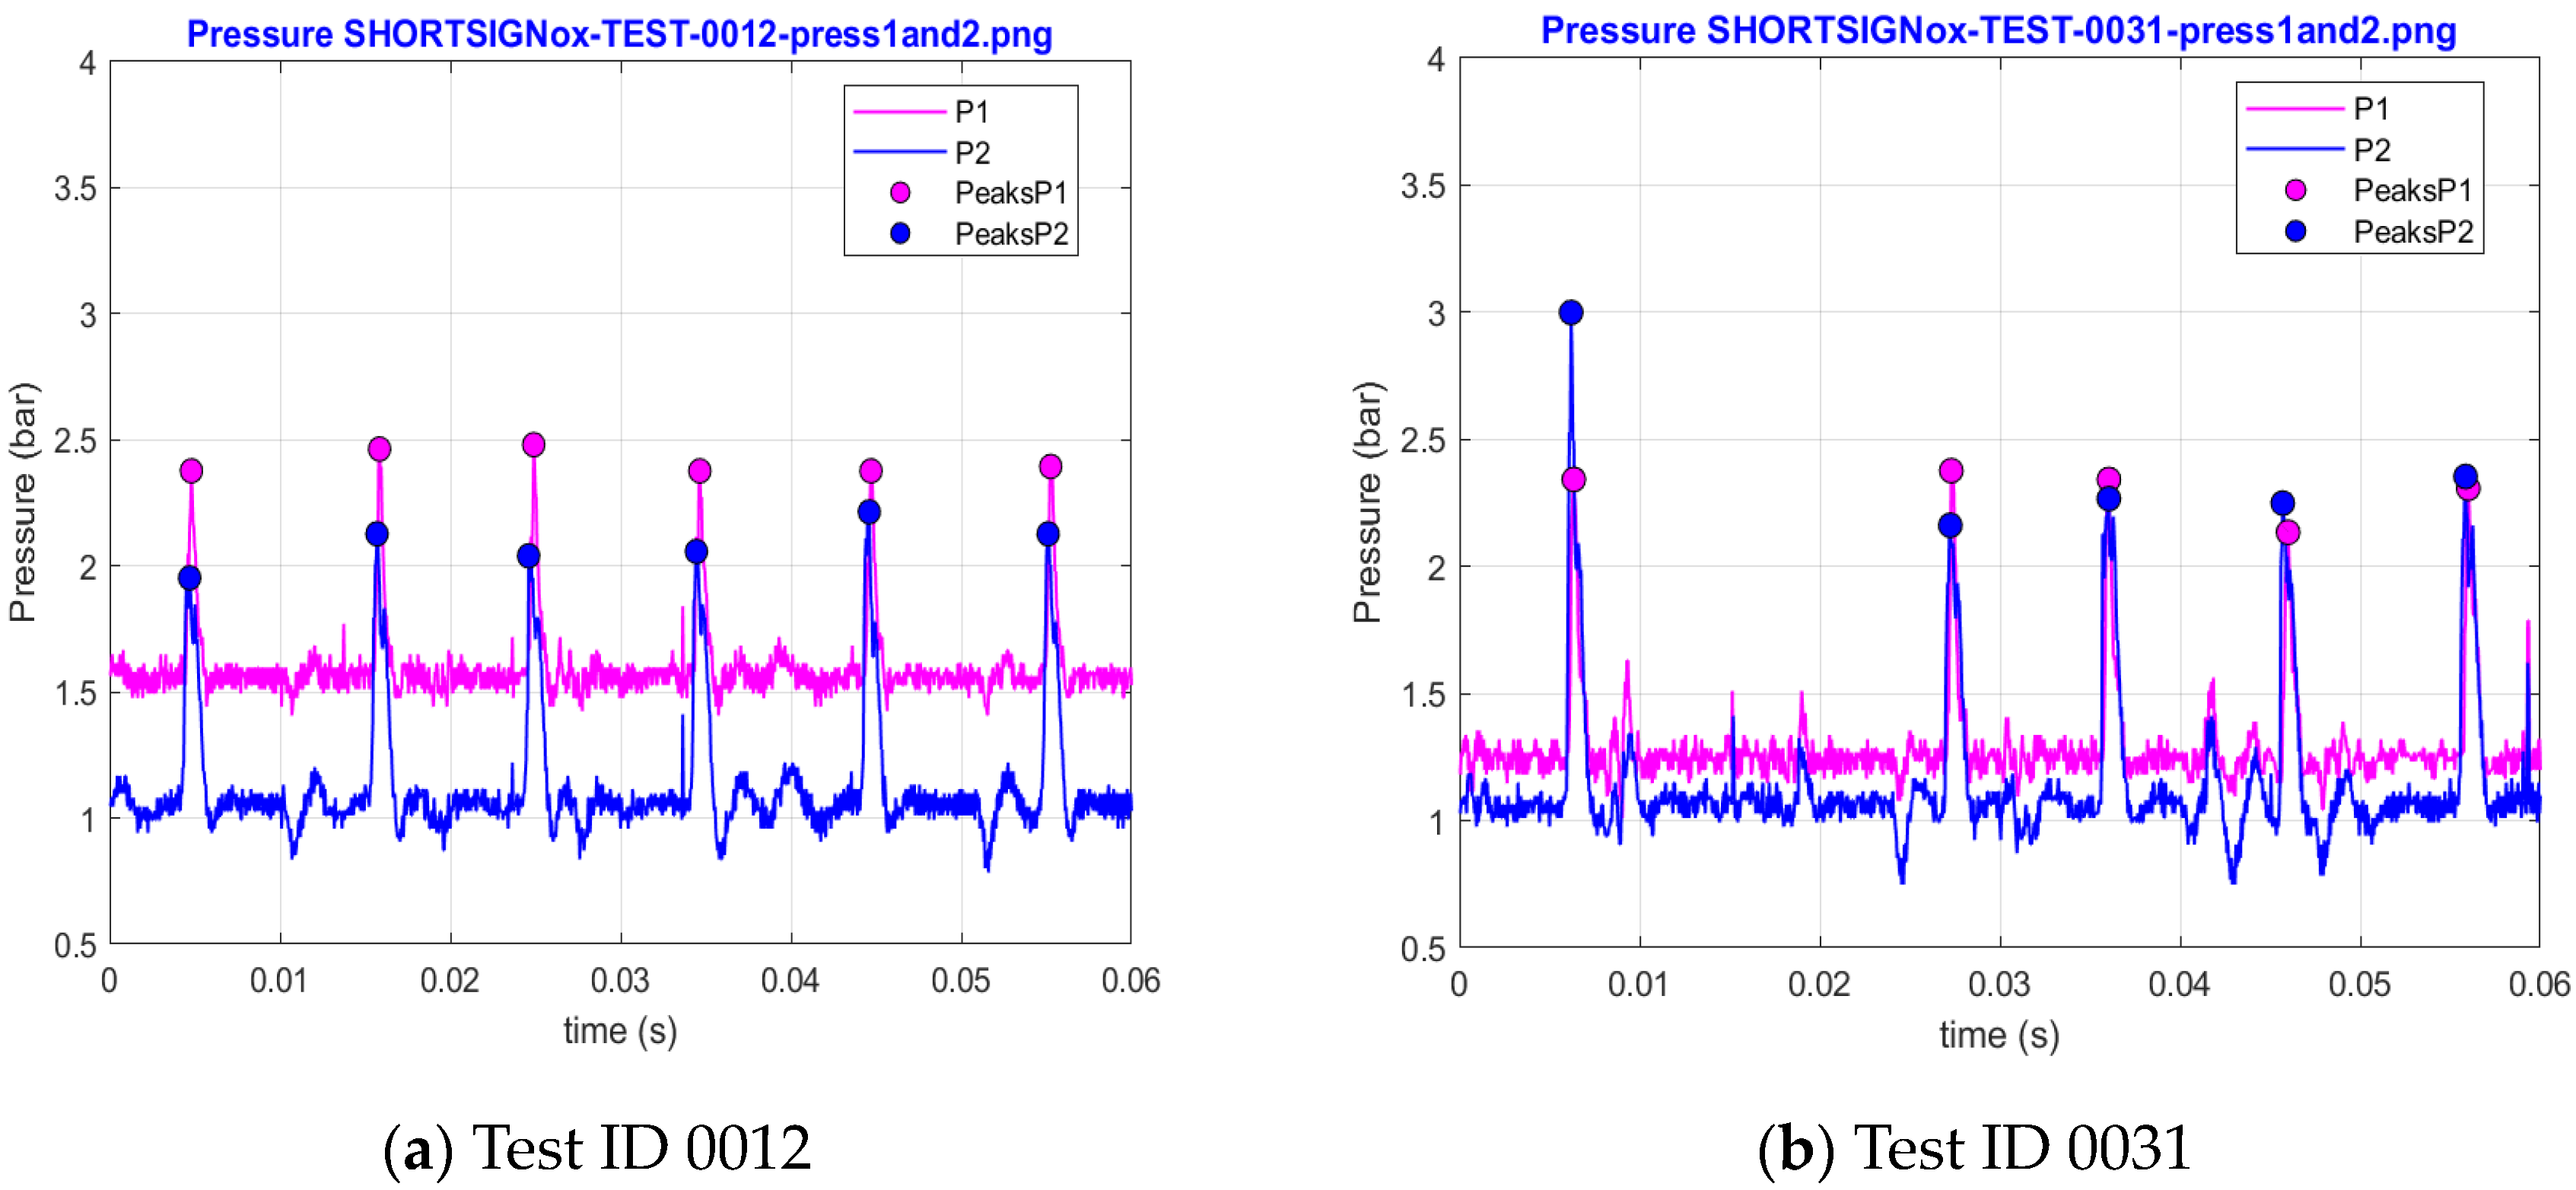
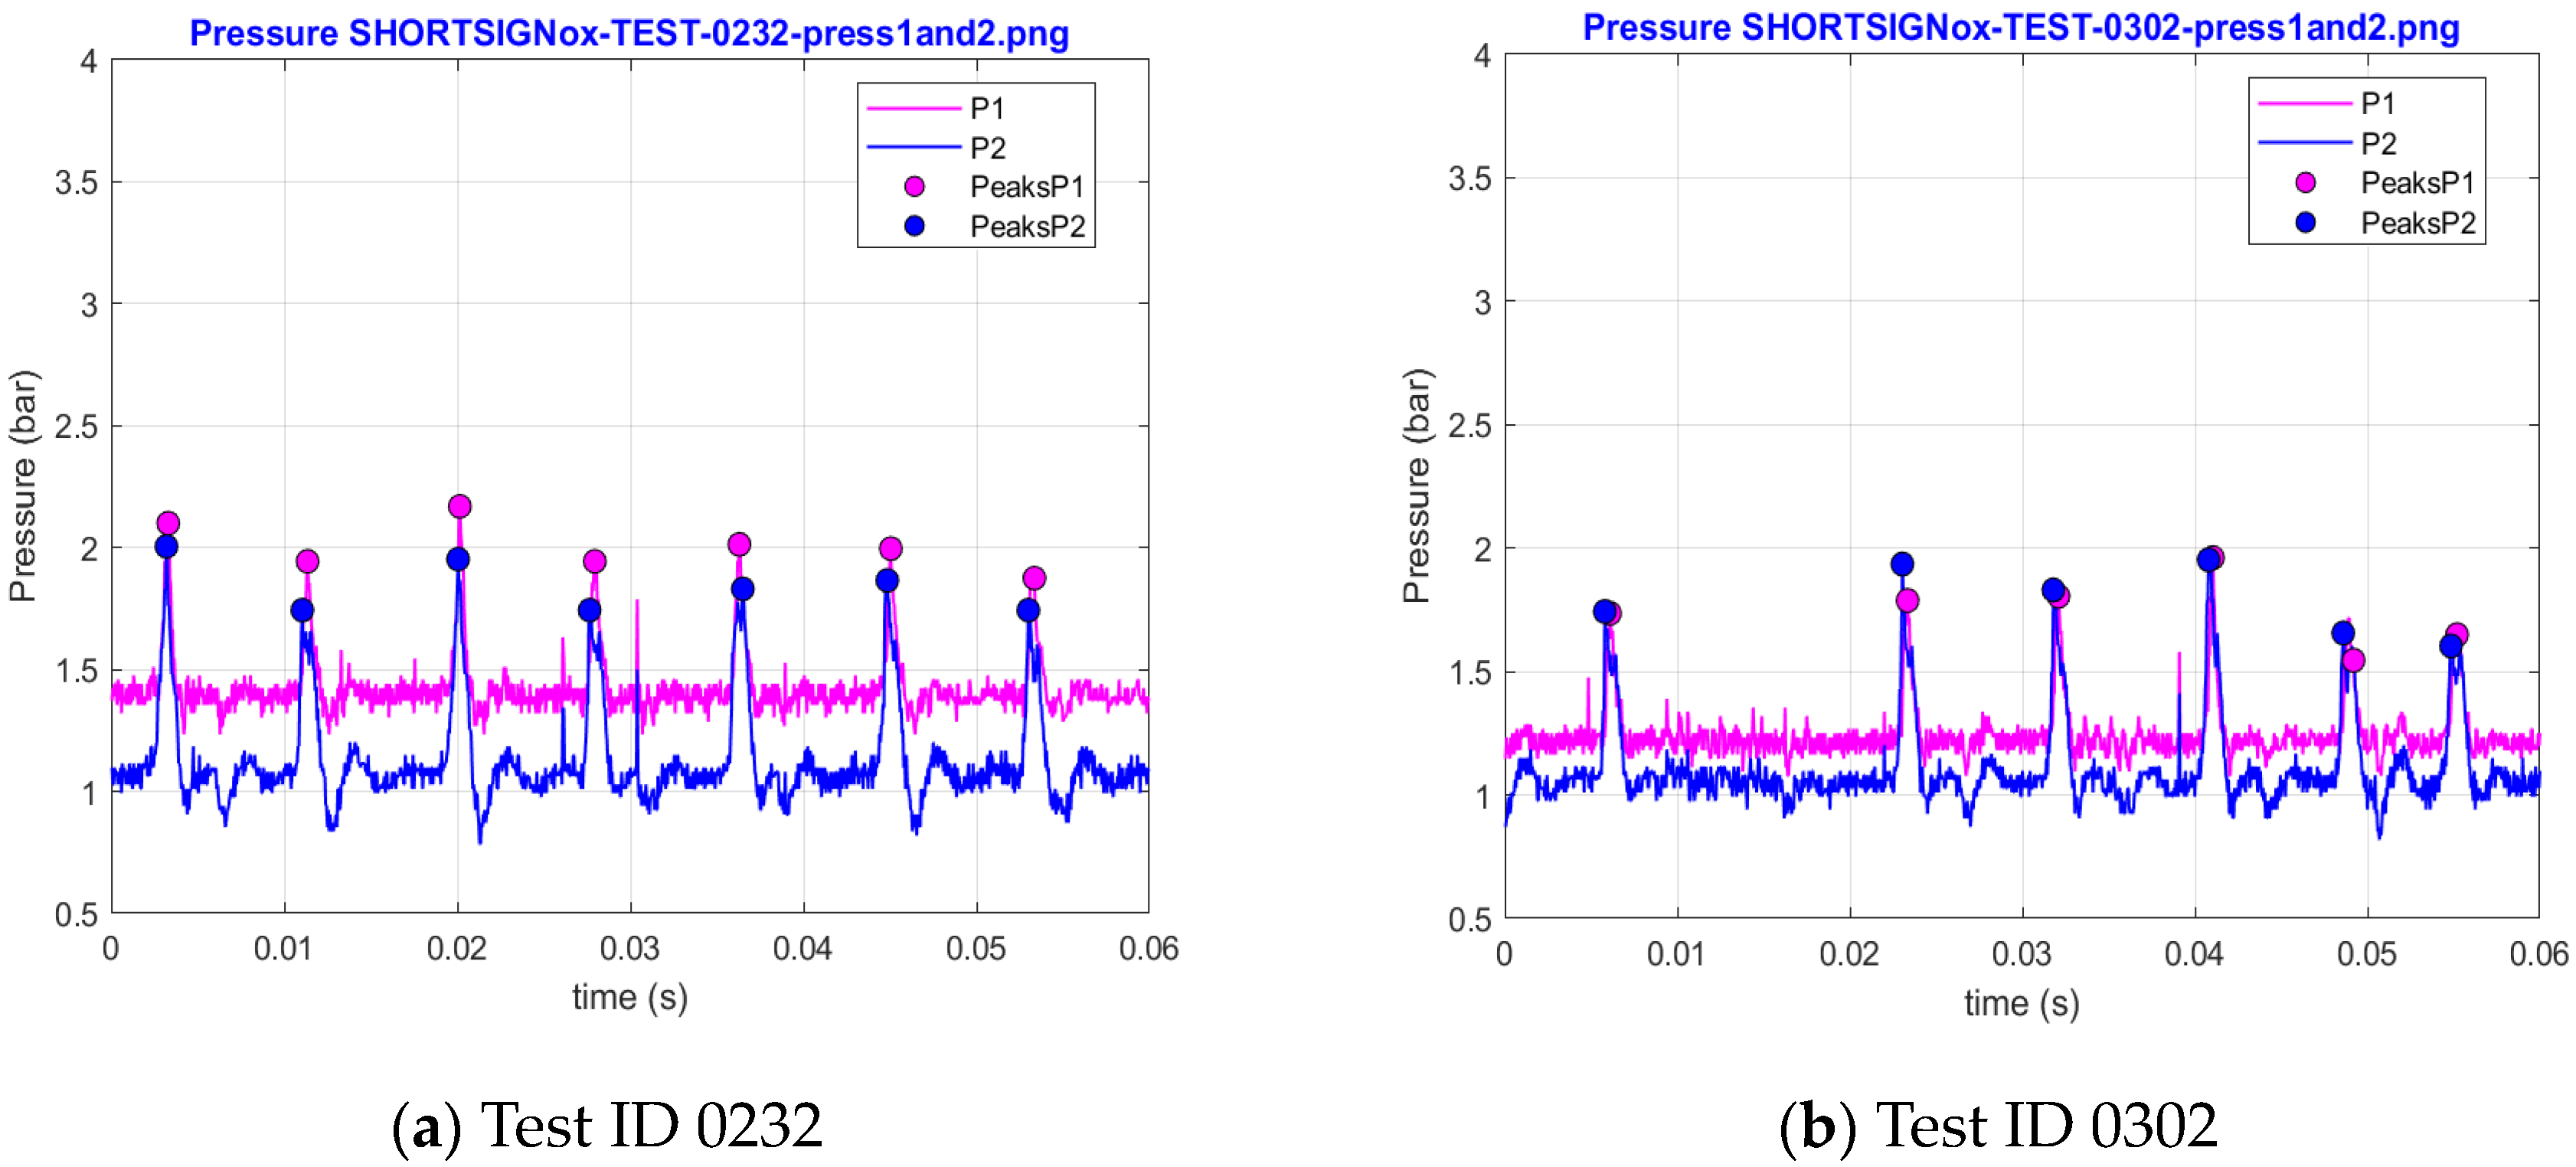
Given that the spark plug frequency for each test case is known and that this may be expected to be the critical parameter for the PDC operation frequency, it becomes possible to compute the maximum number of cycles within a given time period, , along with the theoretical fundamental time frequency of the pressure signal. However, practical observations reveal variations in the number of real peaks detected during testing—sometimes more, sometimes fewer. Identifying the genuine peaks is crucial to accurately determine the actual frequency of the cycles for each test. For example, in Figure 4a, the number of cycles in Test ID 0012 is equal to the theoretical number of cycles (6, because the spark plug frequency for this case is 100 Hz), while in Figure 4b, the number of cycles in the Test ID 0031 is an example of test with fewer cycles then the theoretical one (only 5 cycles are visible, even though the spark plug frequency remains 100 Hz).
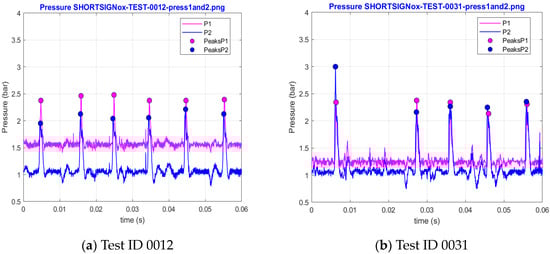
Figure 4.
Pressure signal examples.
A possible explanation of this situation is the variability arising due to insufficient mixing, or improper operation of the aerodynamic valve, leading to occasional misfires in the initiation of the PDC cycle. This is clearly the case in Figure 4b, where no peak is recorded between 0.01 s and 0.025 s. The elimination, or at least reduction of such misfires, is one of the main objectives of the parametric study carried out through the experimental campaigns reported here.
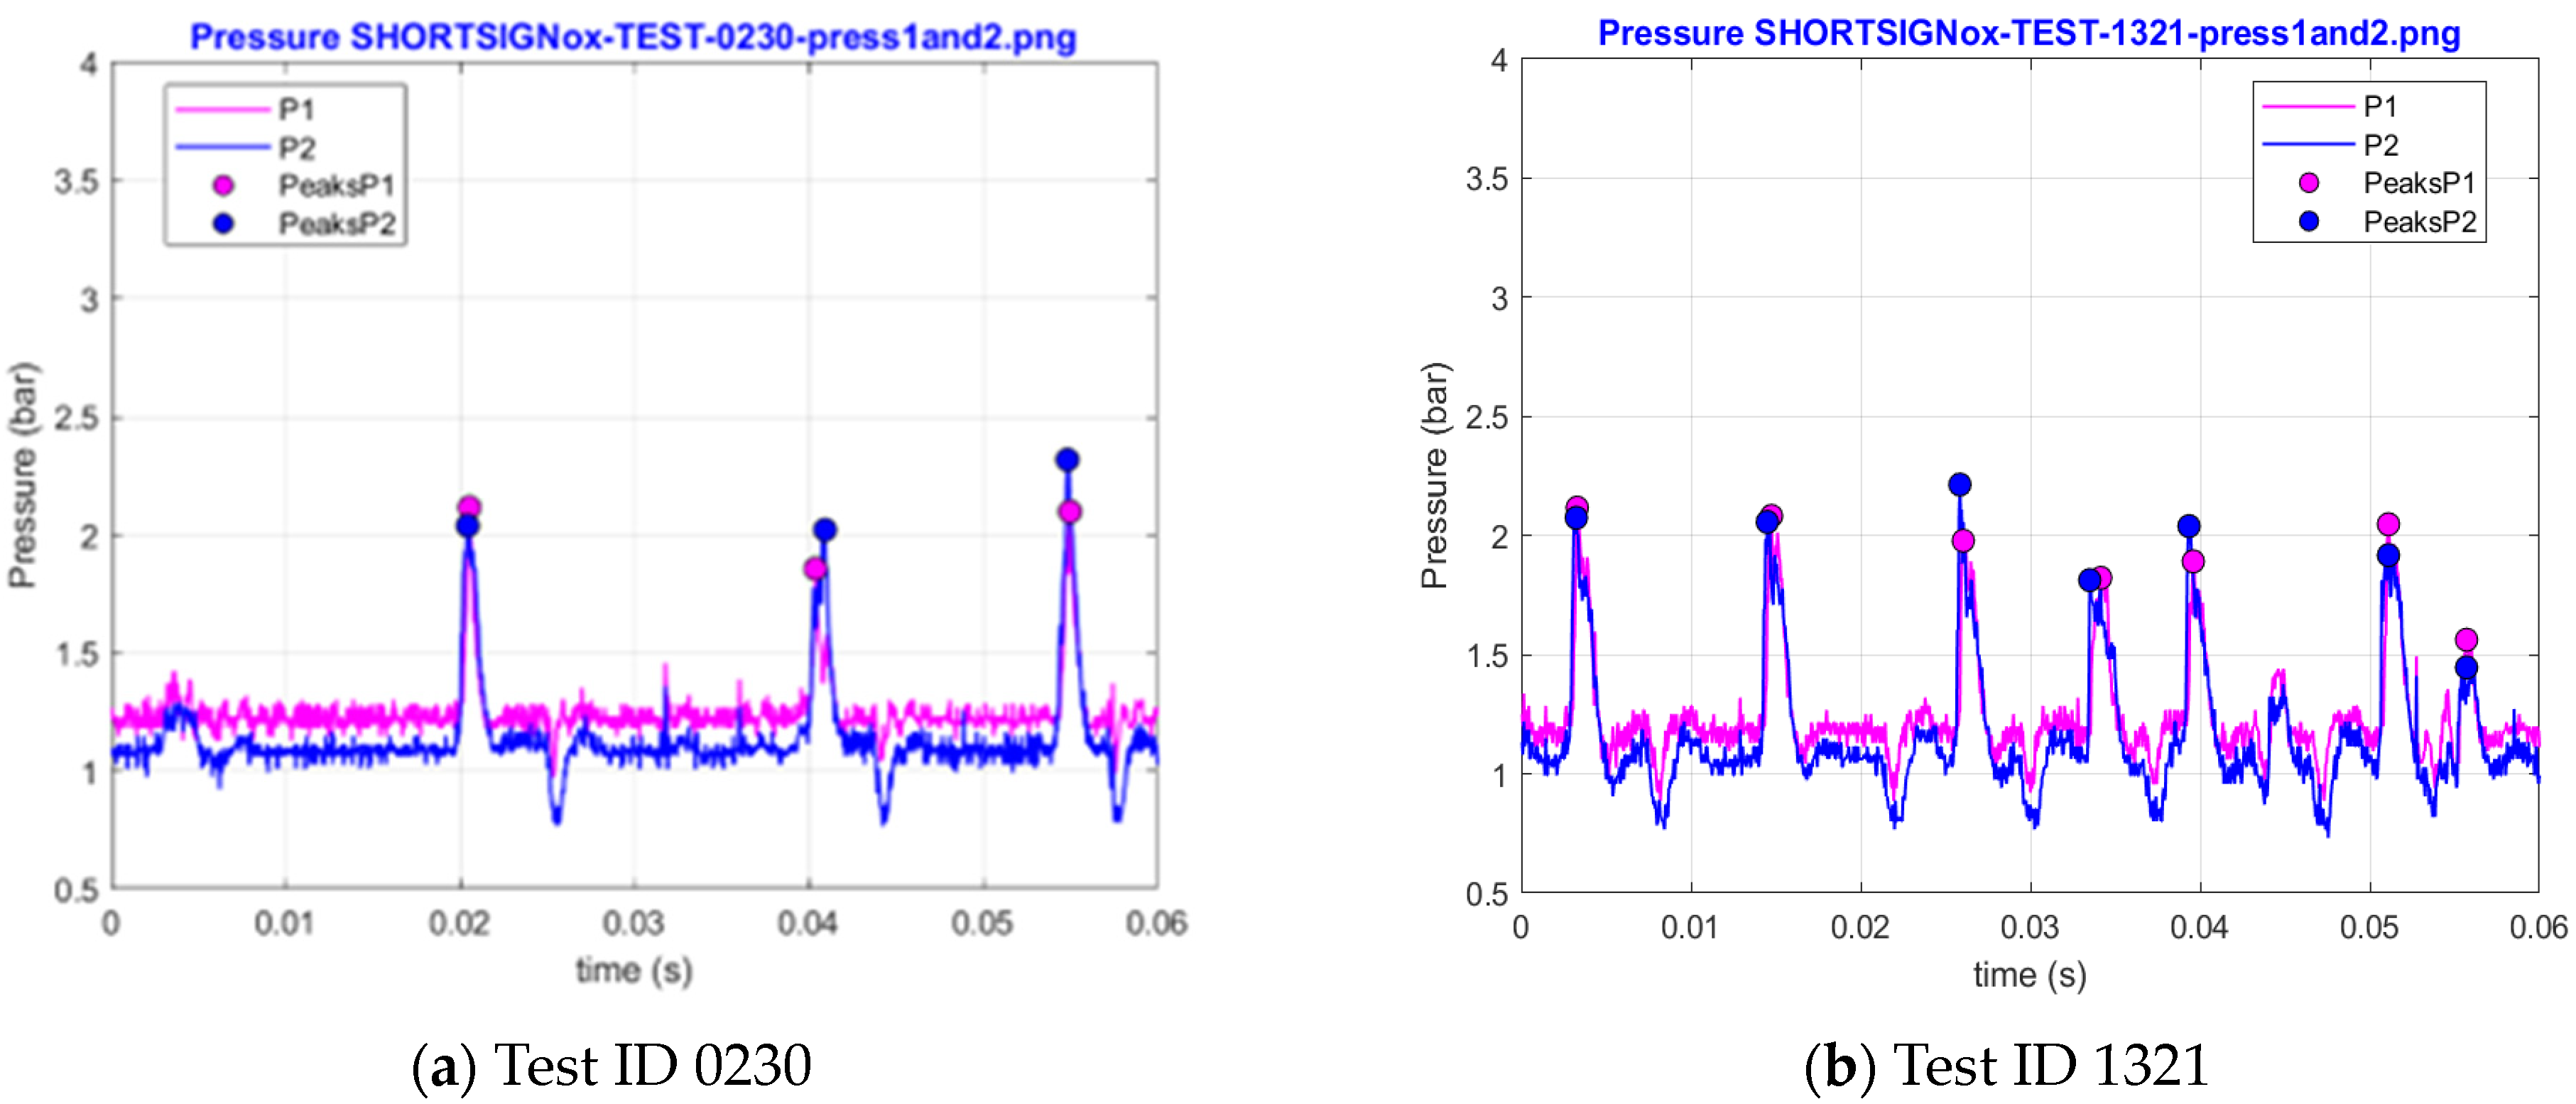
Consequently, the selection of the maximum pressure points during testing requires careful consideration, taking into account potential missing or erroneously identified peaks. It is imperative to acknowledge that the time between two peaks may not precisely align with the spark plug period between consecutive firings. It is worth noting that the design of the PDC was carried out, as the response of the PDC geometry to the off-design spark plug firing frequencies depends on several parameters, to be discussed in the following. These variations in the PDC response introduce uncertainties, creating a range around the spark plug frequency value that had to be dealt with by the post-processing algorithm, as they may lead to registering a non-existing peak pressure. Such a false positive was usually found to manifest as a Dirac function impulse. In such cases, the sensor registers the electromagnetic field generated by the activation of the spark plug, as seen in Figure 4b, or by some other unexpected electromagnetic interference, as exemplified in Figure 5. Thus, a comprehensive analysis is essential to discern genuine peaks from such electromagnetic influence potential artifacts.
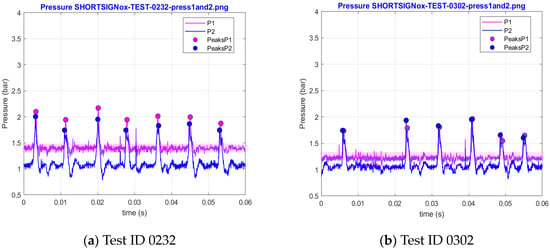
Figure 5.
Pressure signal examples showing spurious Dirac impulses.
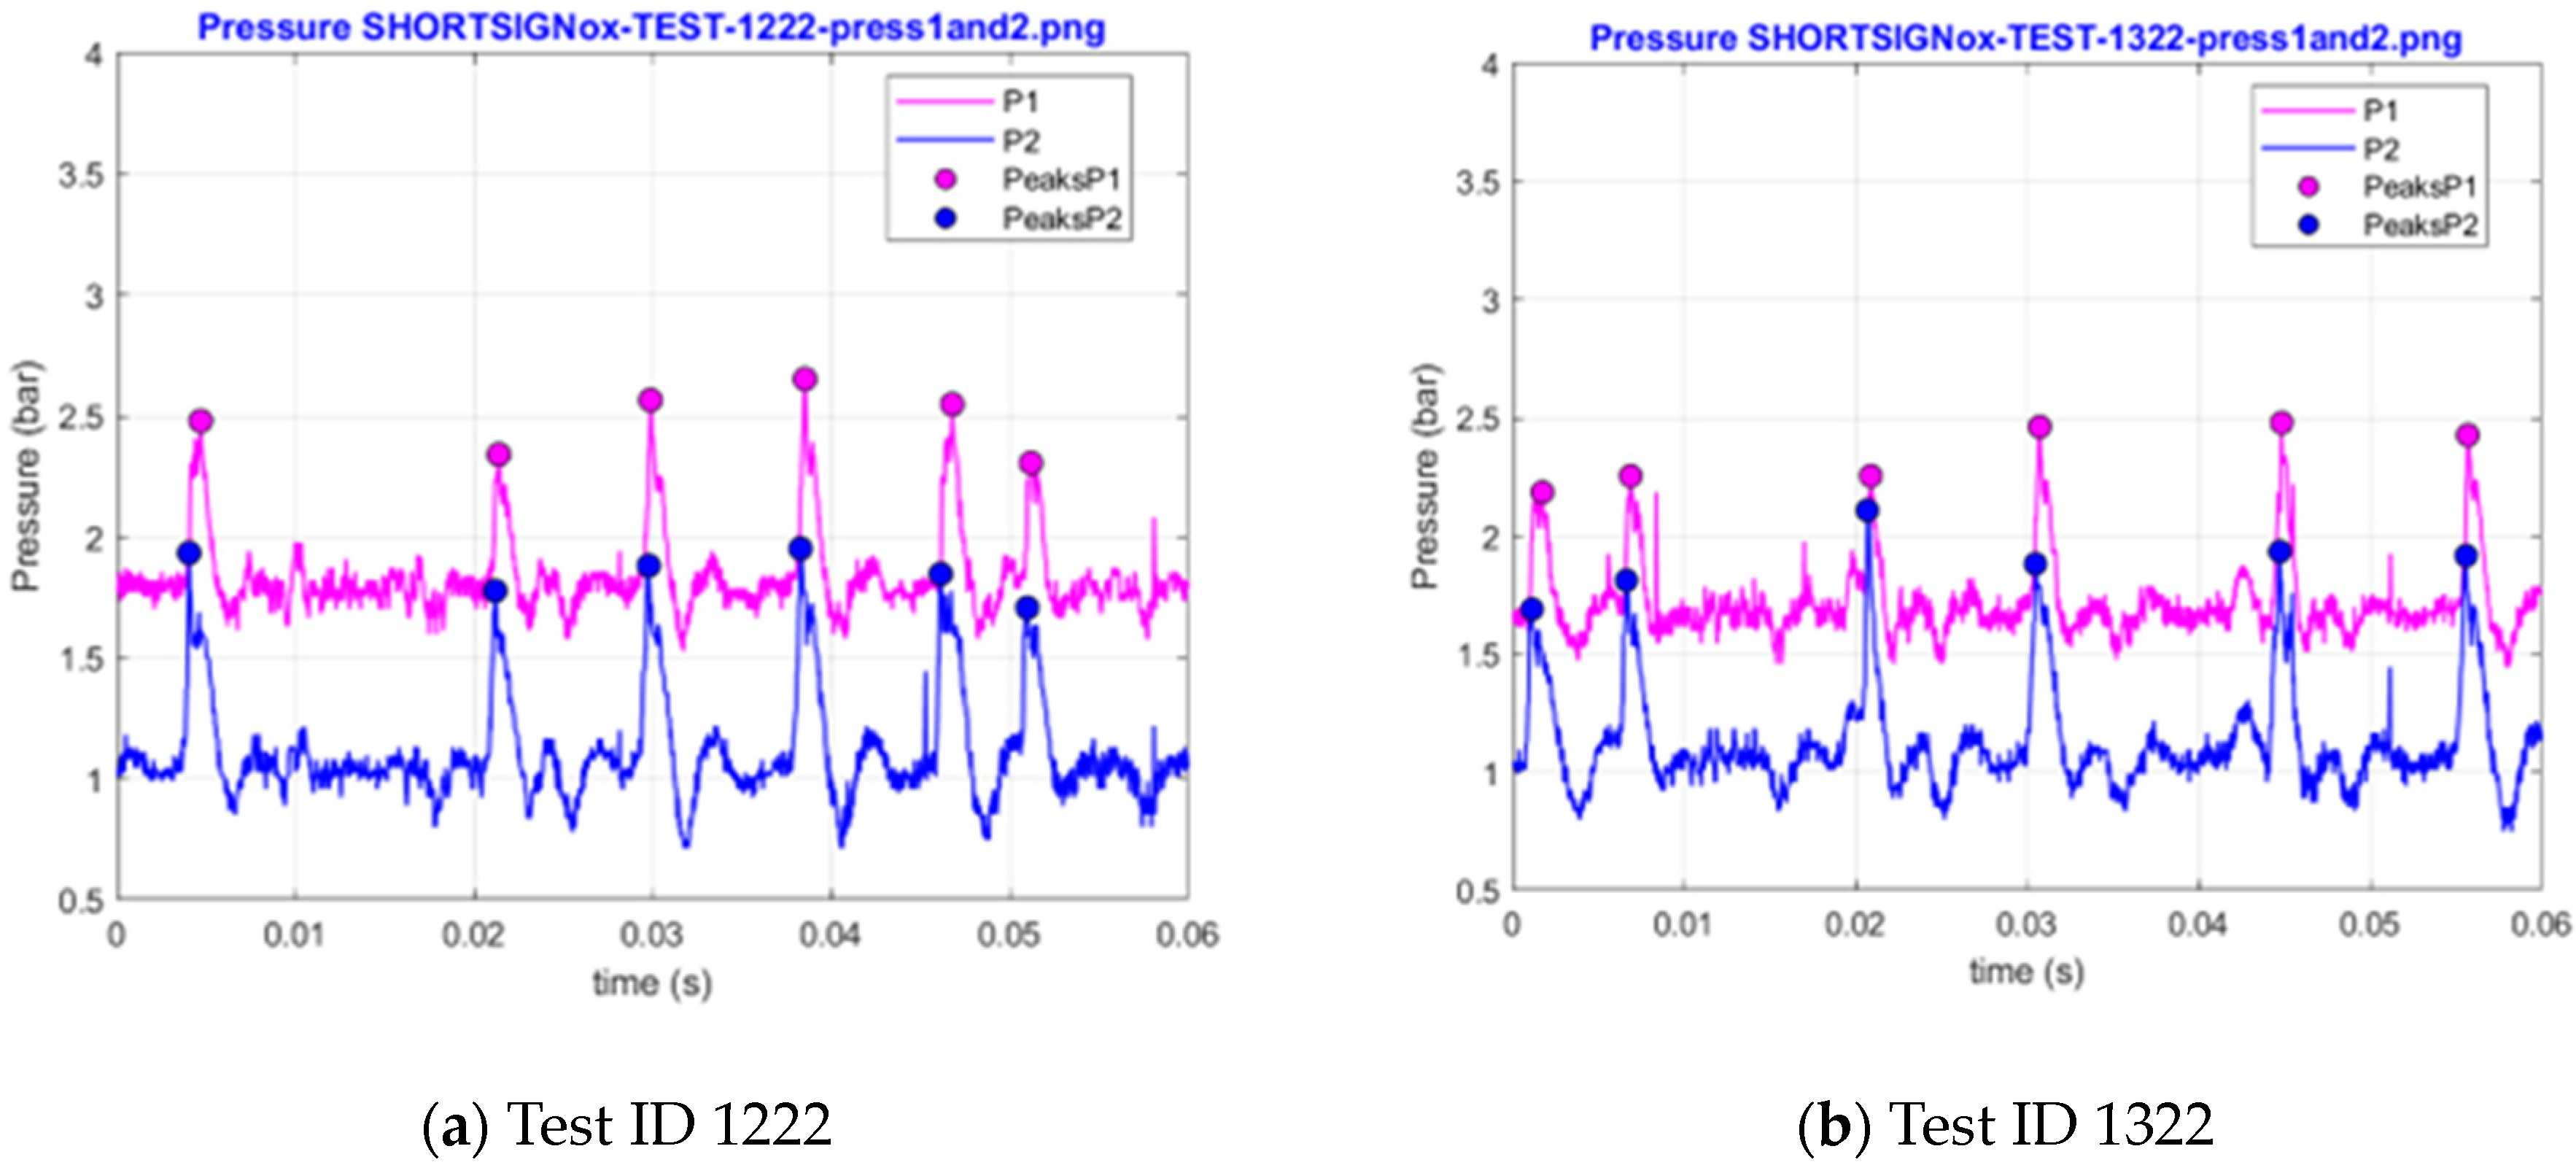
Thus, in the peak selection process, a pressure peak was regarded as significant if its value was greater than or equal to 1.5 bar in at least one of the two signals. This is not just a mathematical expedient but also has a physical sense, as it discards cycles where both sensors indicate that the pressure gain is only marginal, so achieving a proper detonation wave is questionable. As an example, Figure 6a shows the elimination of the peak around 0.03 s, which is a result of the electromagnetic pulse due to the firing of the spark plug, even though no detonation occurs. In this case, both signals record a peak below 1.5 bar. On the other hand, in Figure 6b, the last peak is recorded above 1.5 bar only by sensor 1. In this case, the peak is considered valid. Finally, also in Figure 6b, the peak around 0.045 is discarded as both sensors record a pressure peak below 1.5 bar, even though some marginal pressure gain cycle is visible. Finally, some signals show duplicated pressure peaks, as exemplified in Figure 7. The reason is not fully understood, possibly being related to electromagnetic interference, sensor malfunction due to overheating, or inertial effects affecting the accuracy of the piezoelectric sensor, such that the actual peak is not captured but only points on the increasing and decreasing slope are.
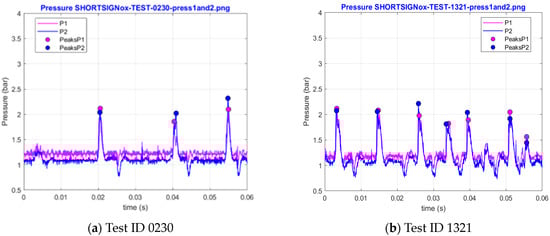
Figure 6.
Pressure signal examples with valid and invalid pressure peaks around the 1.5 bar cutoff limit.
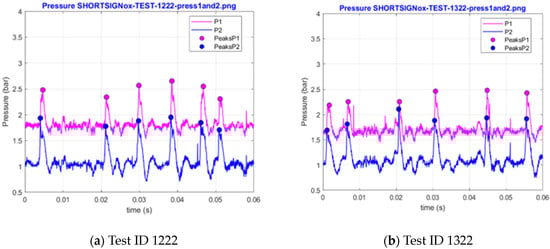
Figure 7.
Pressure signal examples show duplicate peaks.
To avoid this and refine the peak selection, a temporal domain encompassing each identified peak is defined, and the average pressure over it is determined. Any peak in that range not exceeding 20% above the domain average is discarded. The temporal domain size is selected as a function of the expected number of cycles and the fundamental period T0, which are based on the spark plug frequency, as shown in Table 4.
Table 4.
Temporal range for accepted peaks.
Using the above-described algorithm, three values are determined for each valid test case: the mean cycle pressure, the maximum cycle pressure, and the operating frequency of the PDC.
Let and represent the pressure data for signal 1, measured by sensor 1, and the pressure data for signal 2 measured by sensor 2, in a time range, , where M is the number of samples in the signal. The average cycle pressure is determined, first, for each signal as follows:
Then, the overall mean average cycle pressure, presented in Figure 4, Figure 5, Figure 6 and Figure 7 as a function of the equivalence ratio, is the following:
The maximum pressure for each cycle is determined, for each cycle, according to the procedure described in the previous section, for each signal and is denoted henceforth as , , where N is the number of cycles in the signal. The maximum cycle pressure is determined, then, for each signal, as the following:
while the global maximum cycle pressure is the following:
To determine the operating frequency, the mean period is calculated for each signal individually.
Subsequently, the overall period average is determined as the average of the two signals means
The mean operating frequency of the PDC is, then, given by the following:
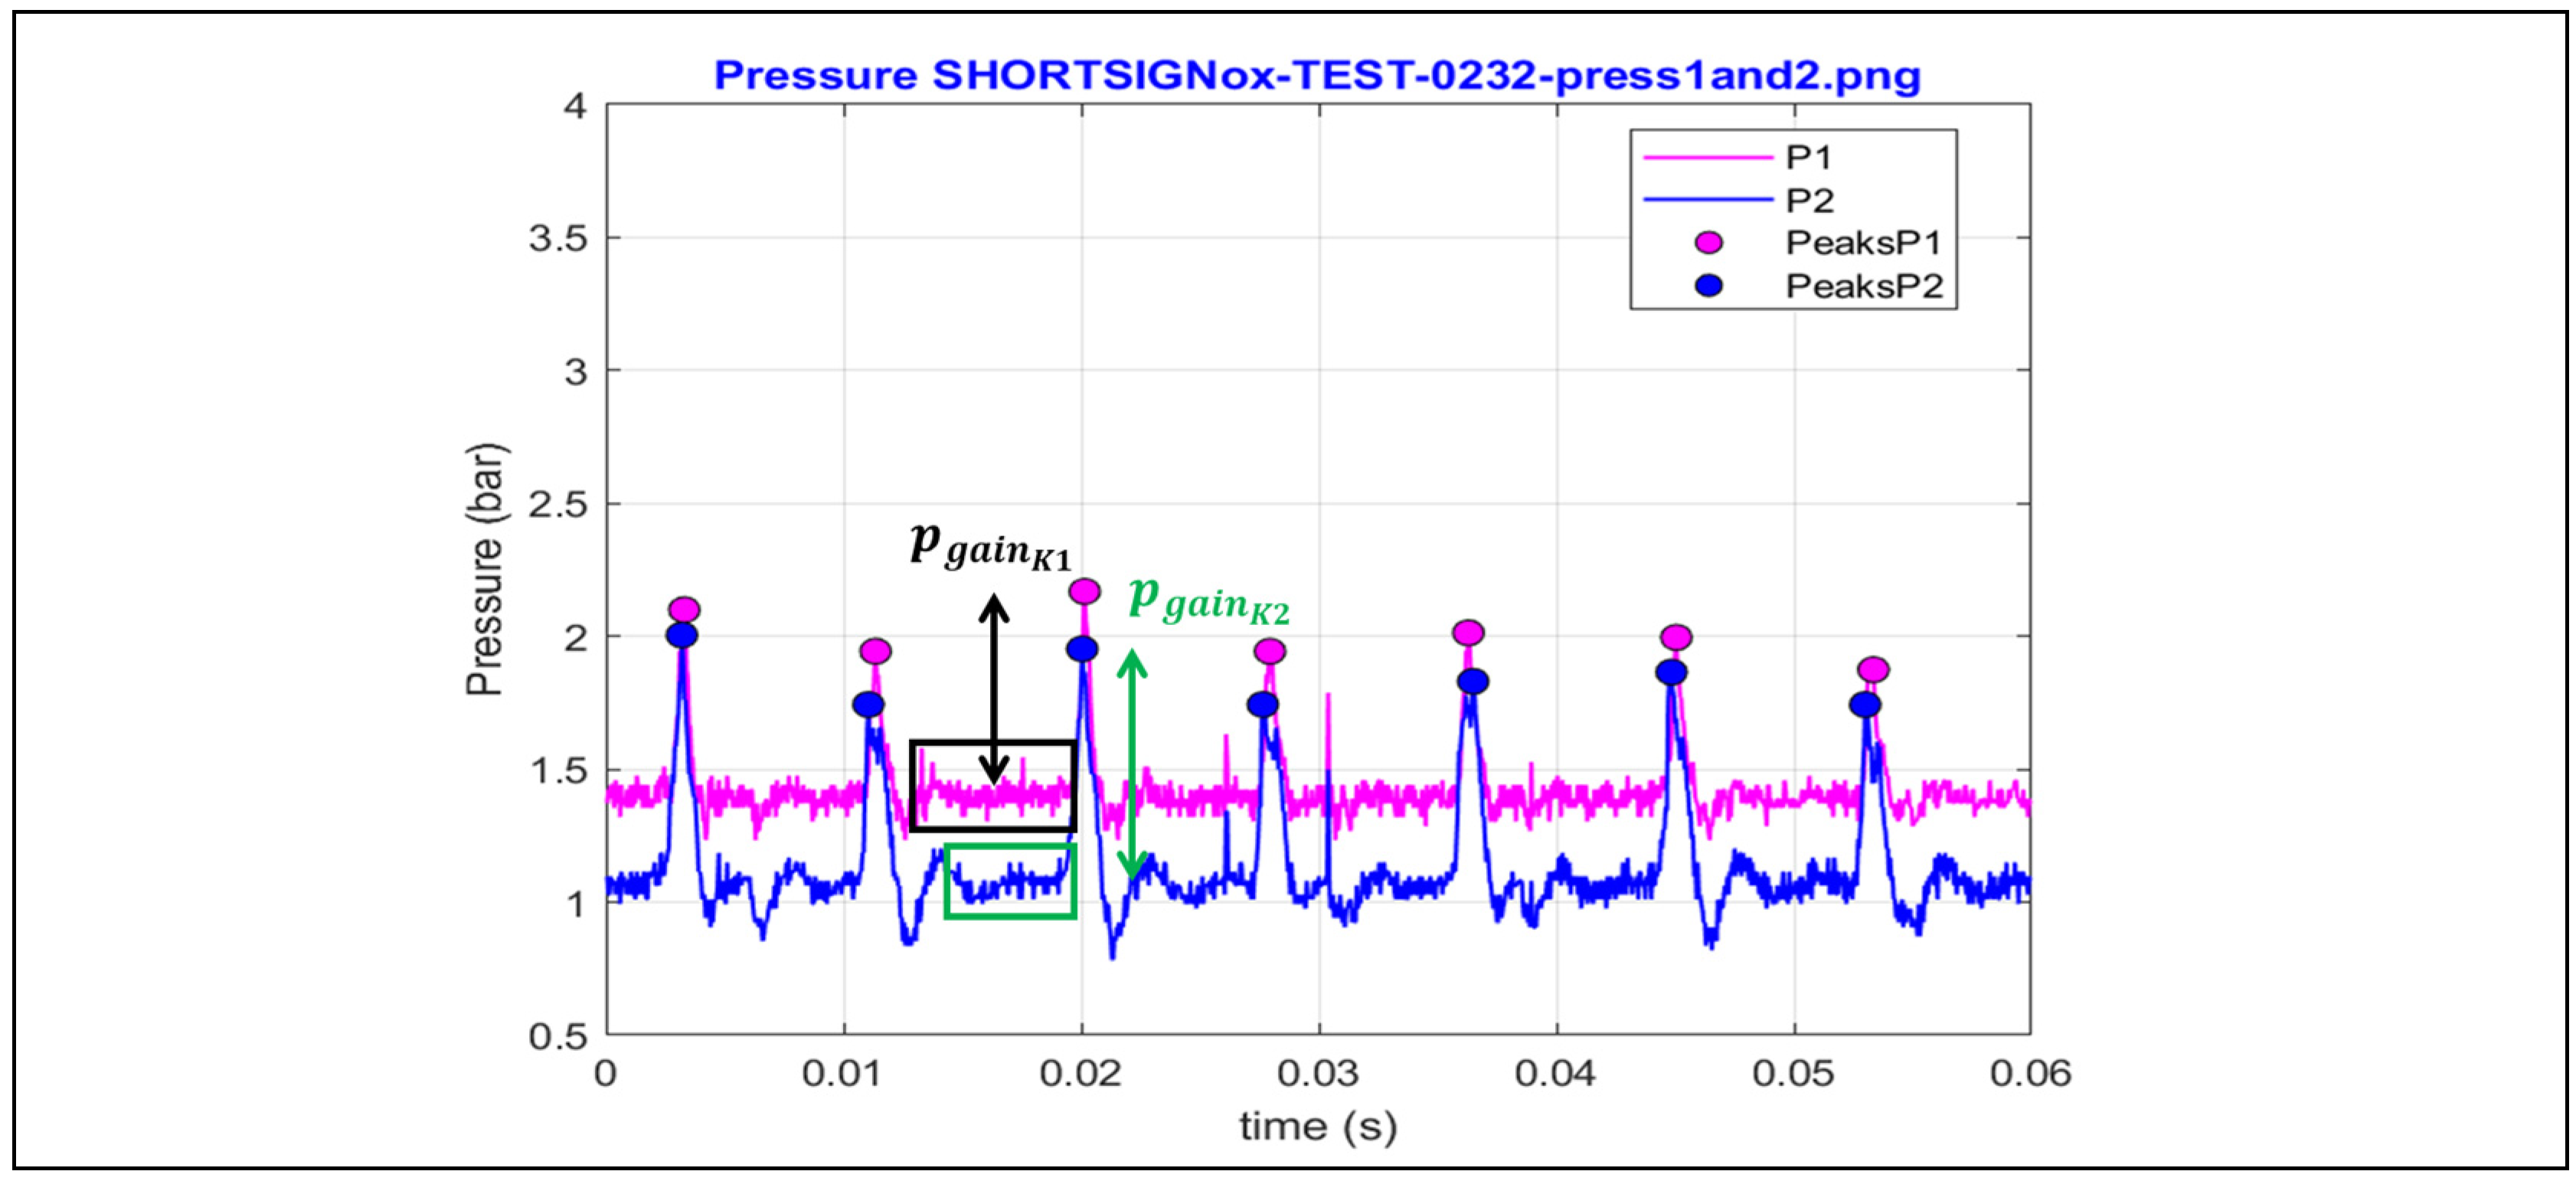
The pressure gain (Figure 8) is computed as the difference between the maximum pressure (peak values) and the average pressure (black rectangle for K1, green rectangle for K2) during the refilling of the fresh reactants after filtering the spurious signal, as explained above for both values.
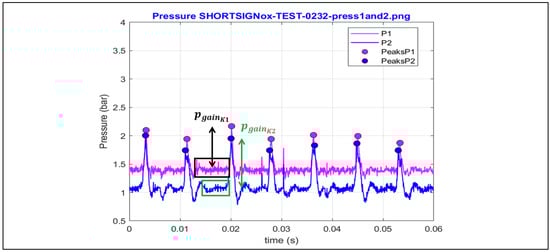
Figure 8.
Pressure gain example.
3. Results and Discussion
Three responses (measured parameters) are presented in this paper. For each response, its variation with the equivalence ratio is provided. The data are shown grouped into families of curves of constant exhaust pipe lengths, and each sub-figure represents one value of the oxidizer pressure. Each of the four figures presented for one response includes data gathered from a single spark plug frequency.
3.1. Hydrogen/Air Mixture
The subsection presents the results of the first experimental campaign, where air is used as an oxidizer.
3.1.1. Average Cycle Pressure
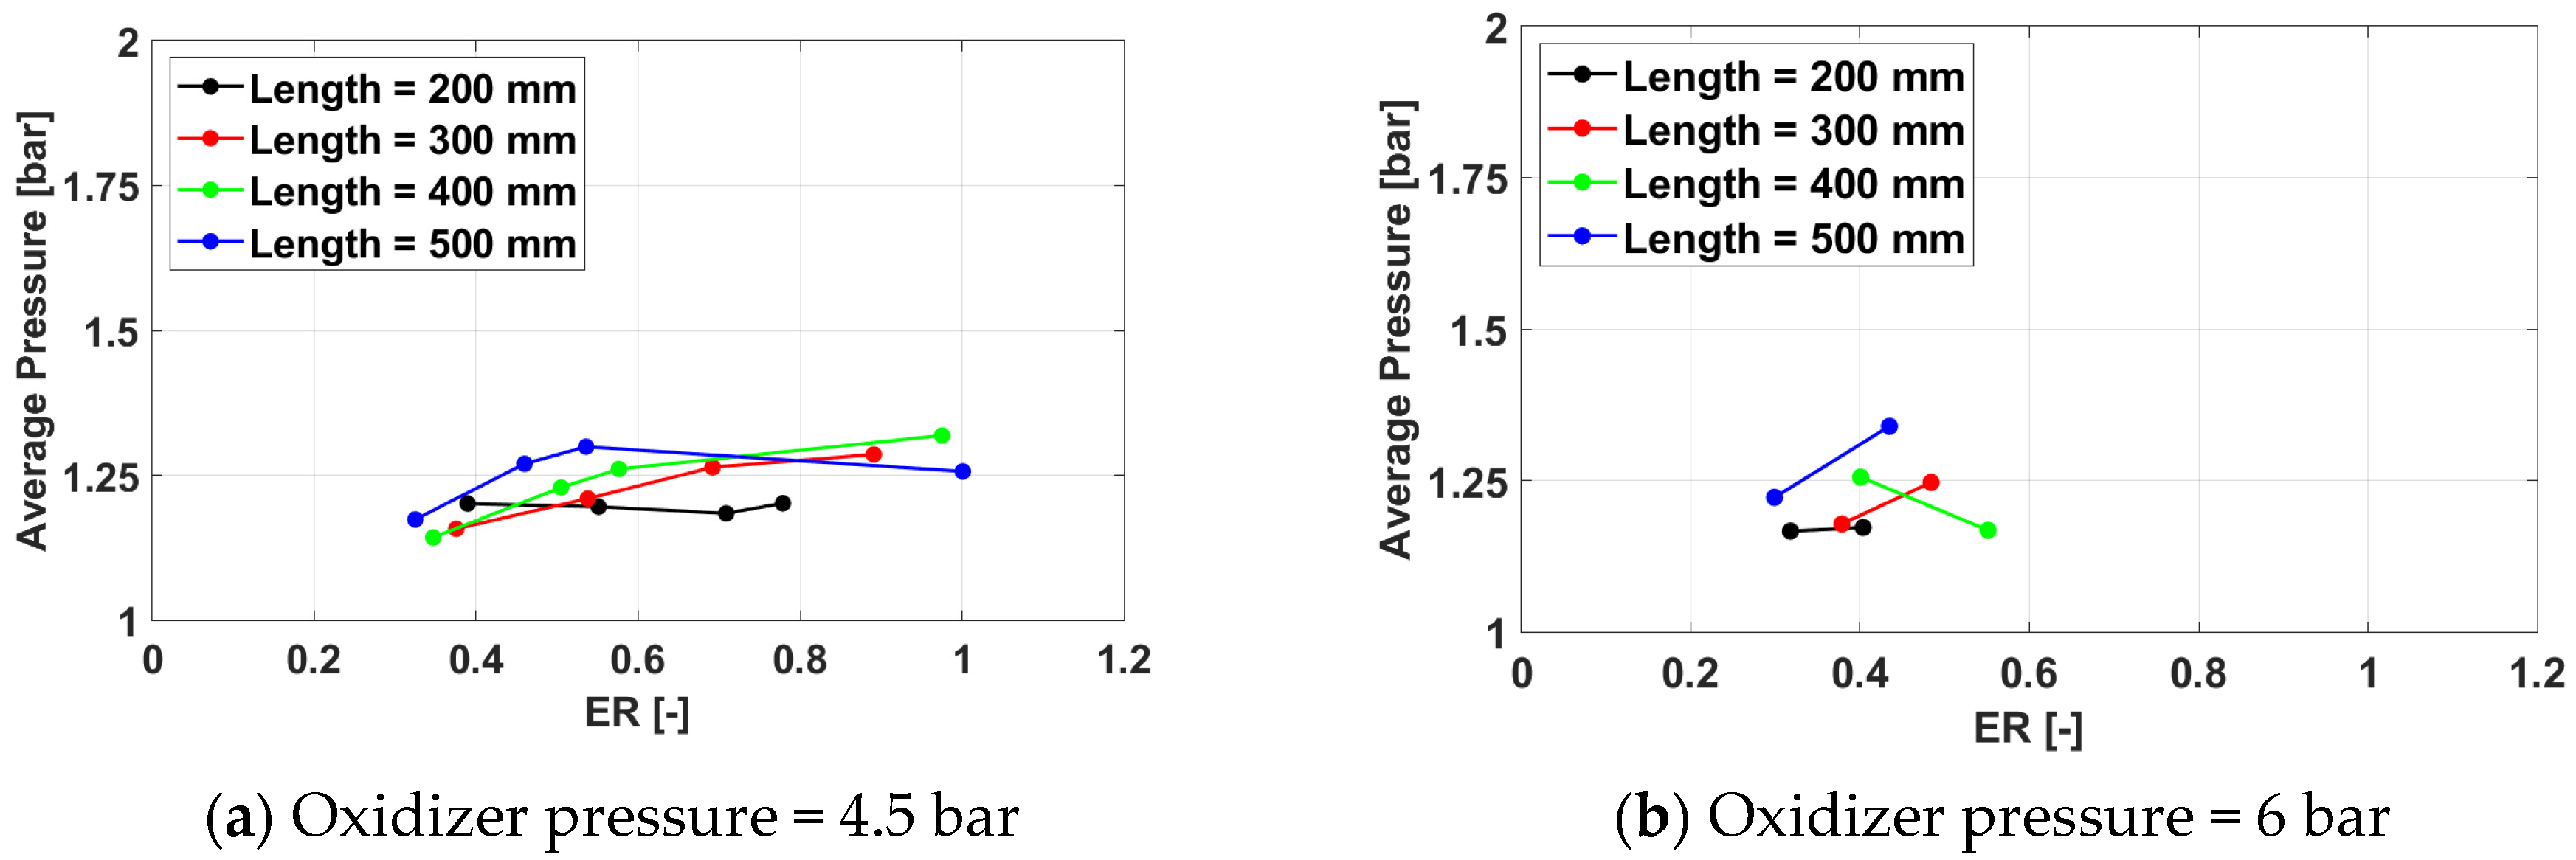
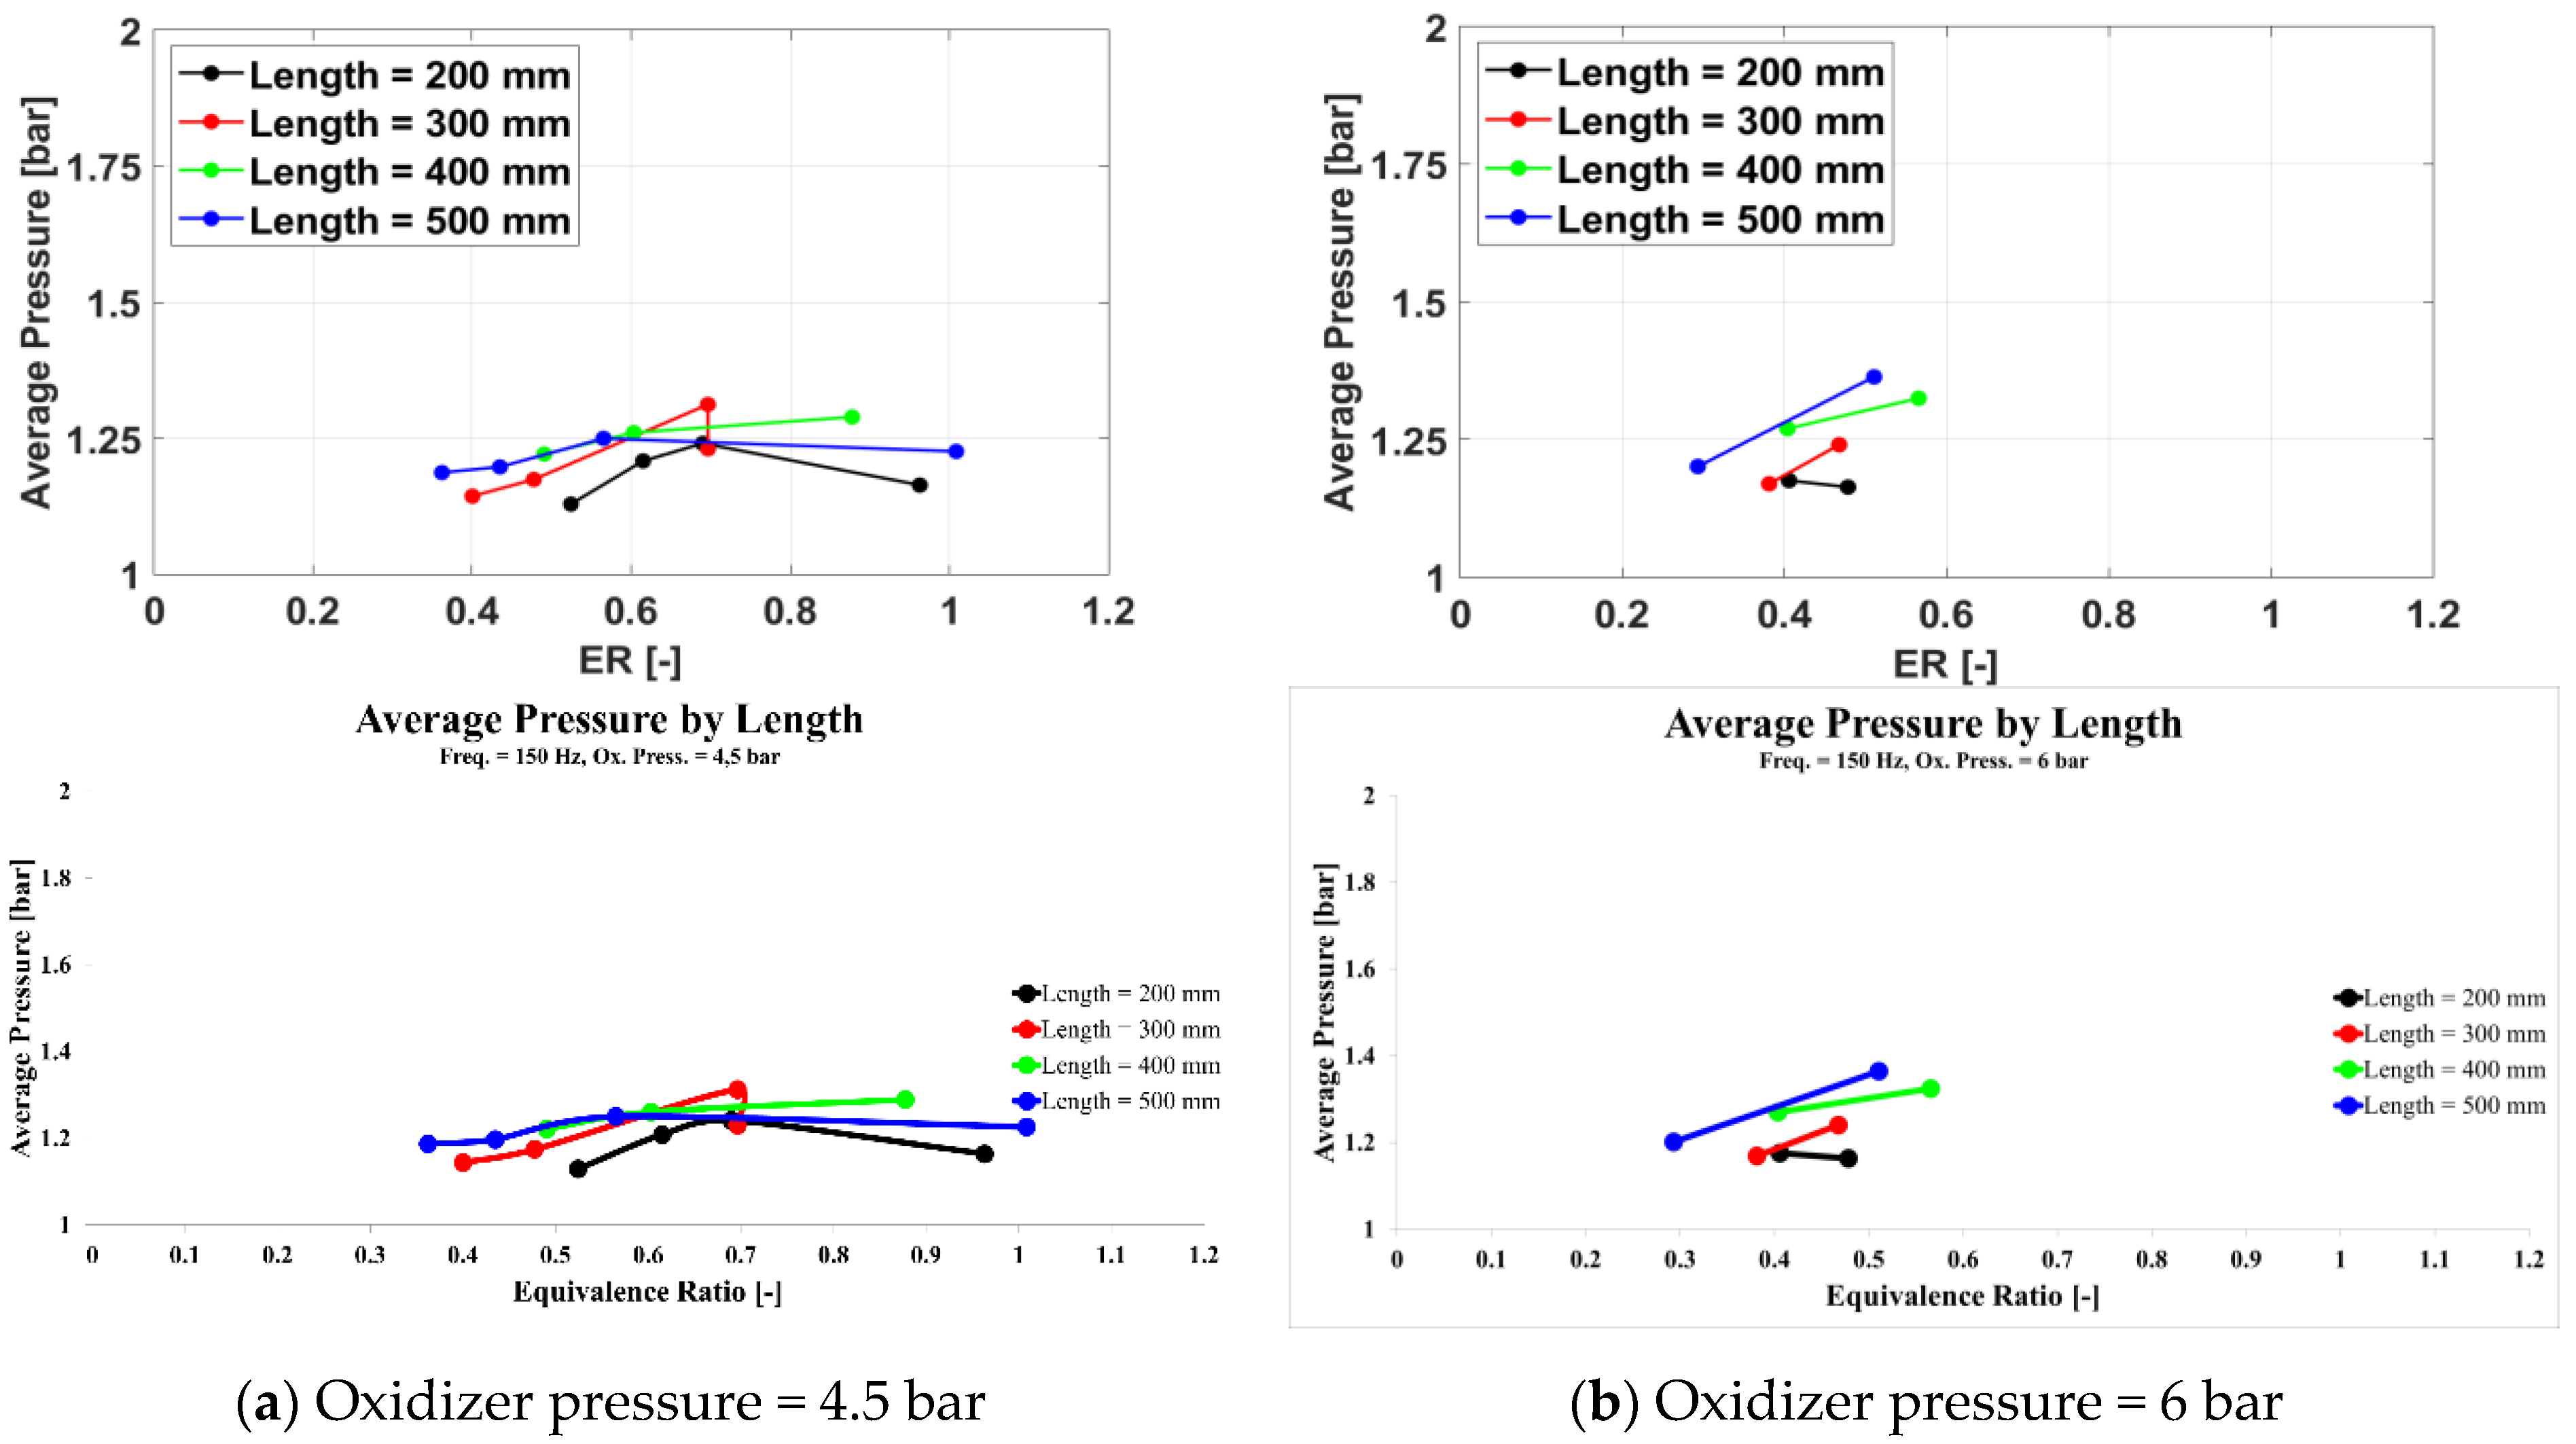
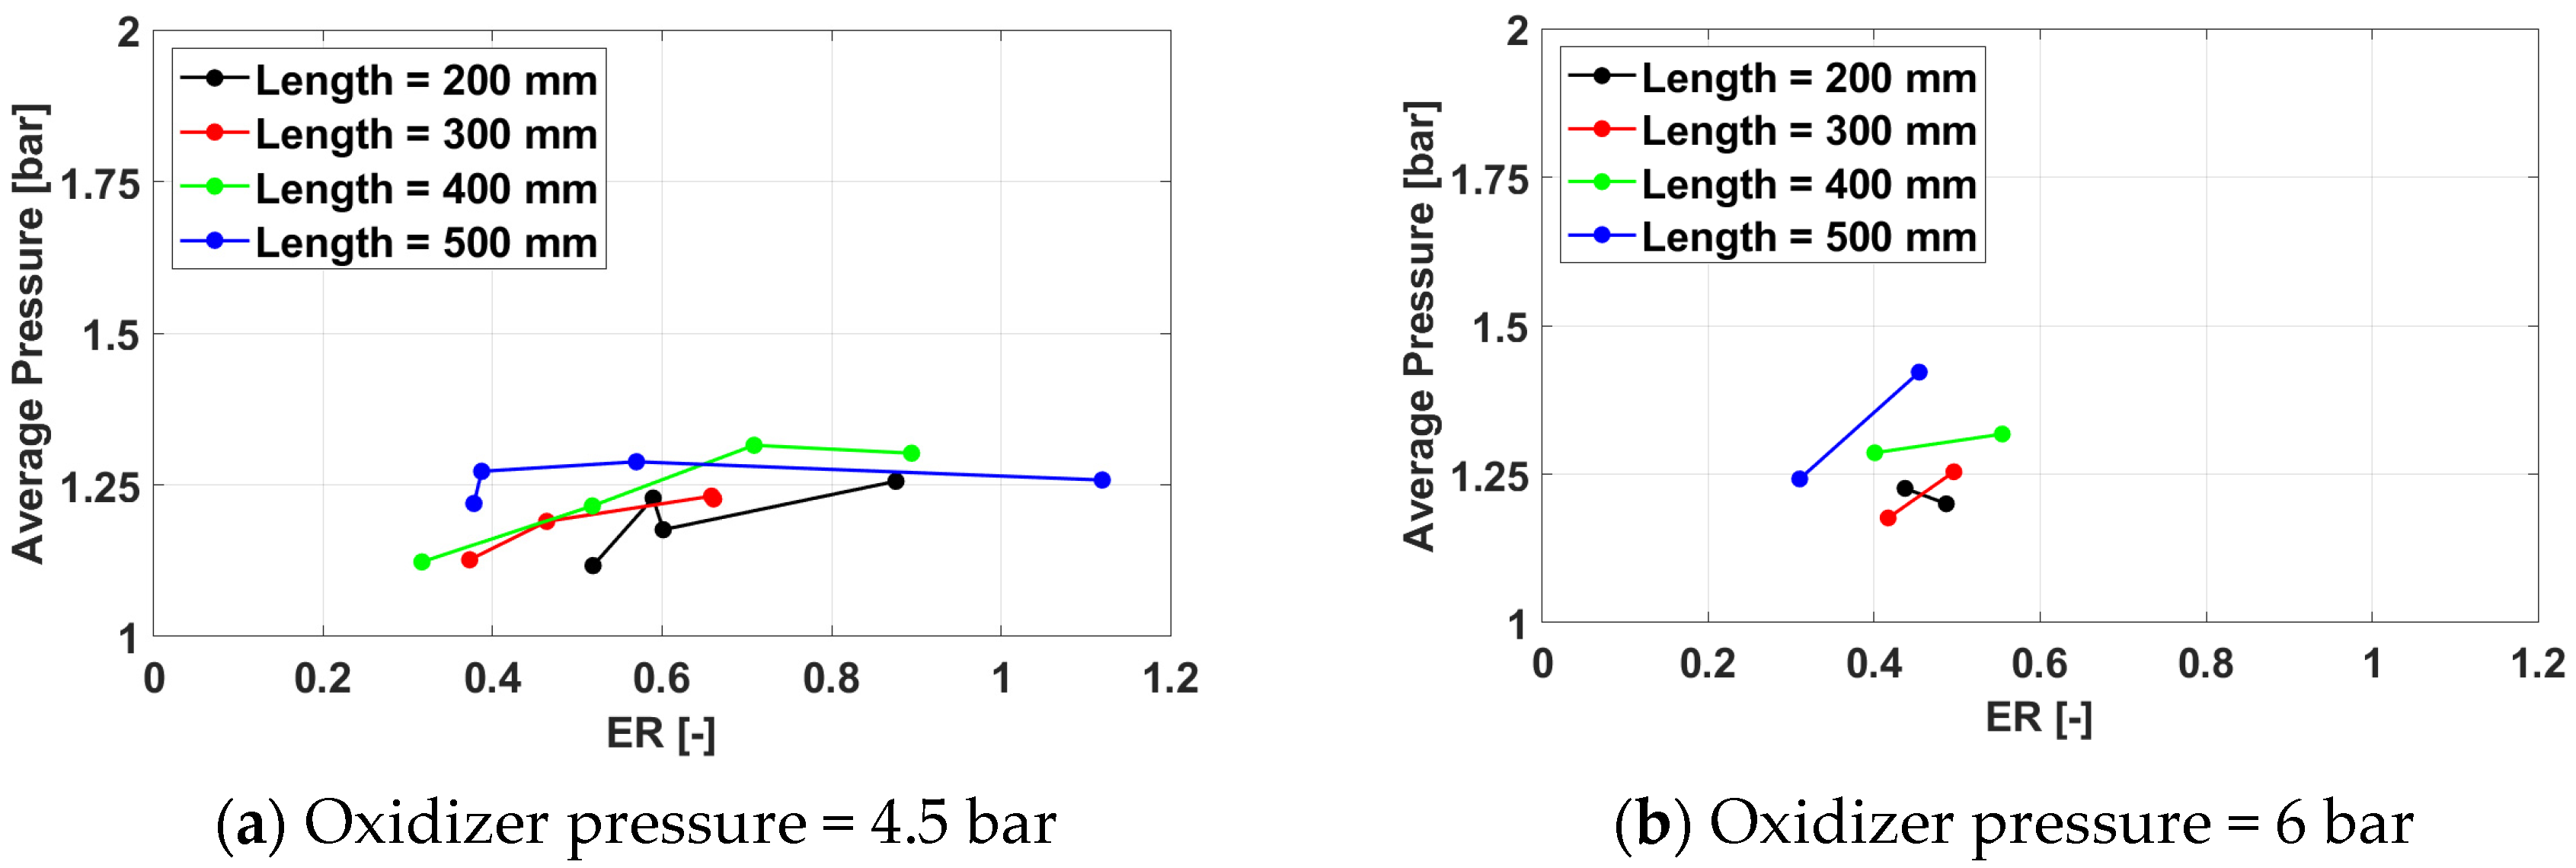
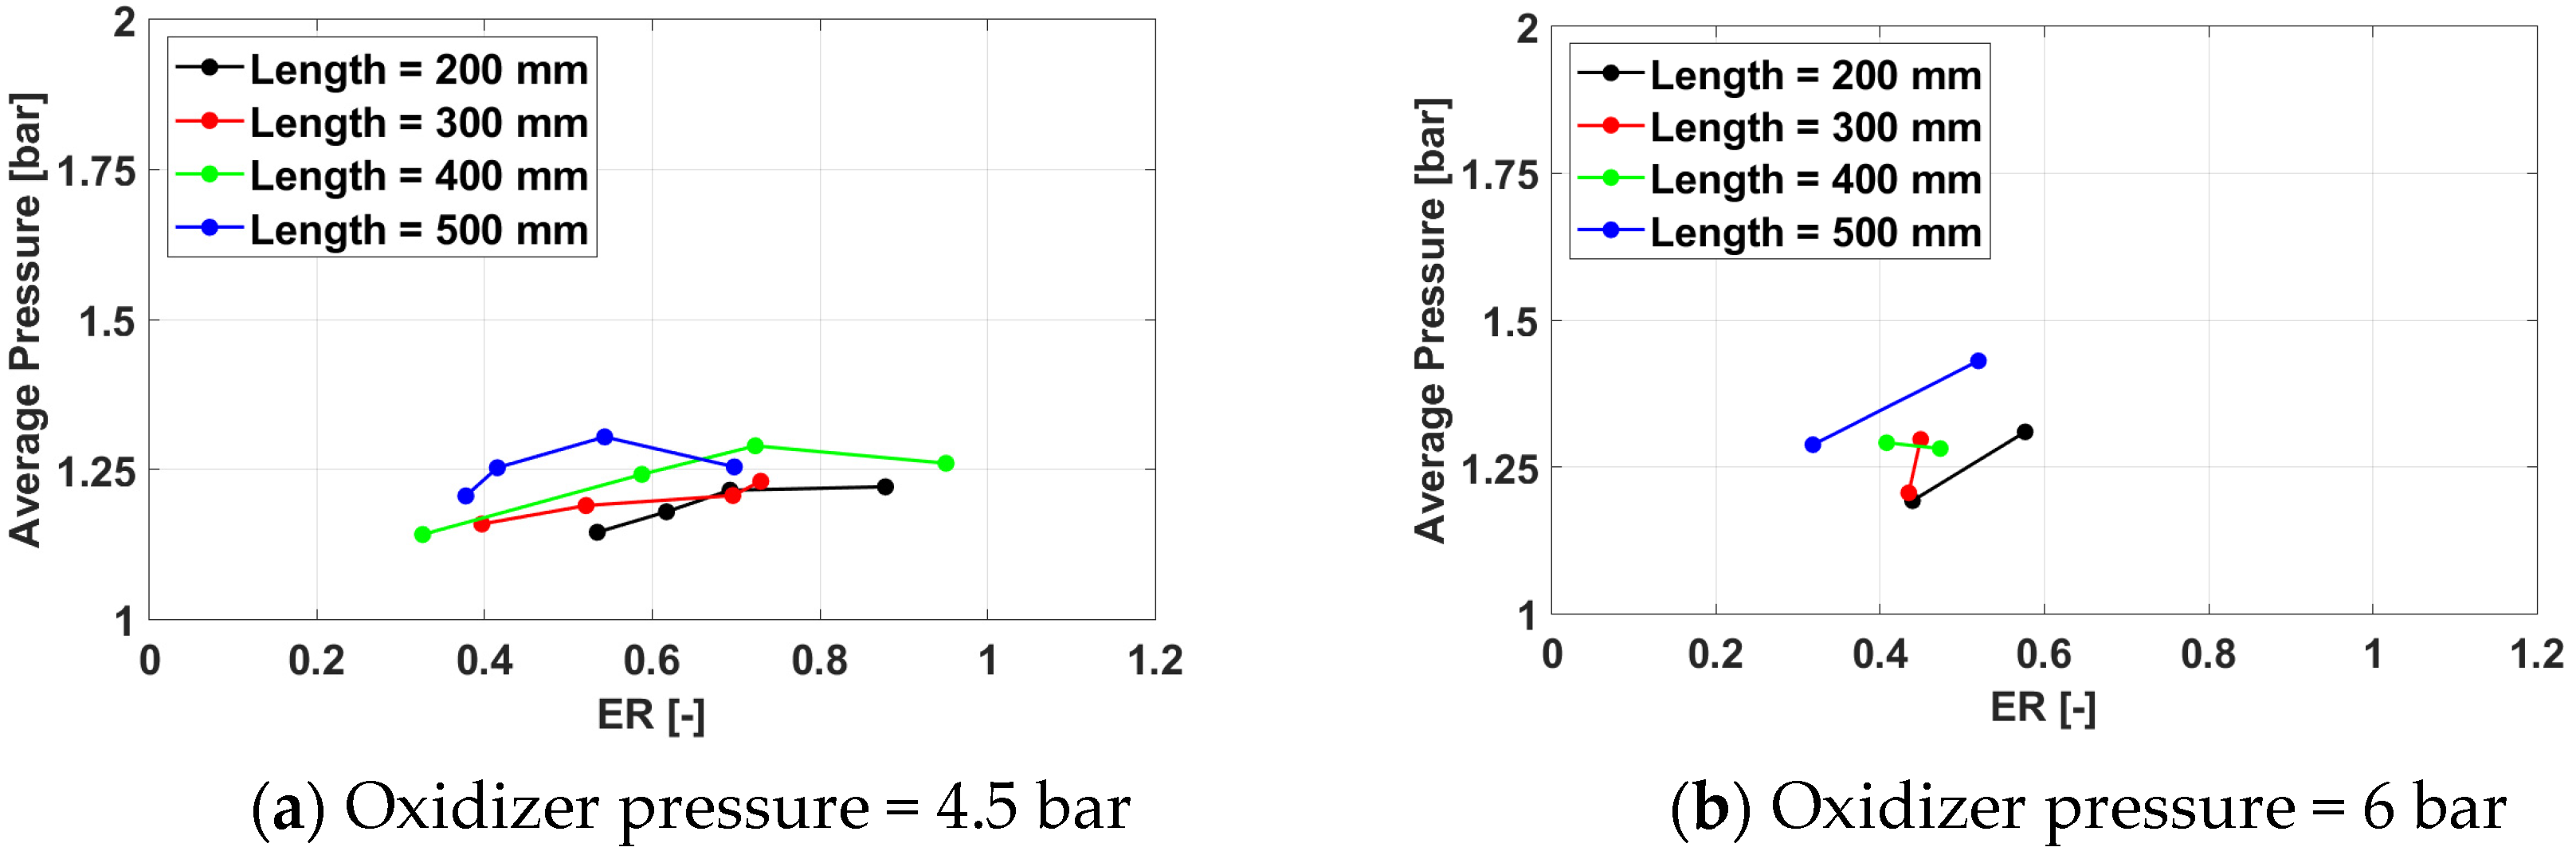
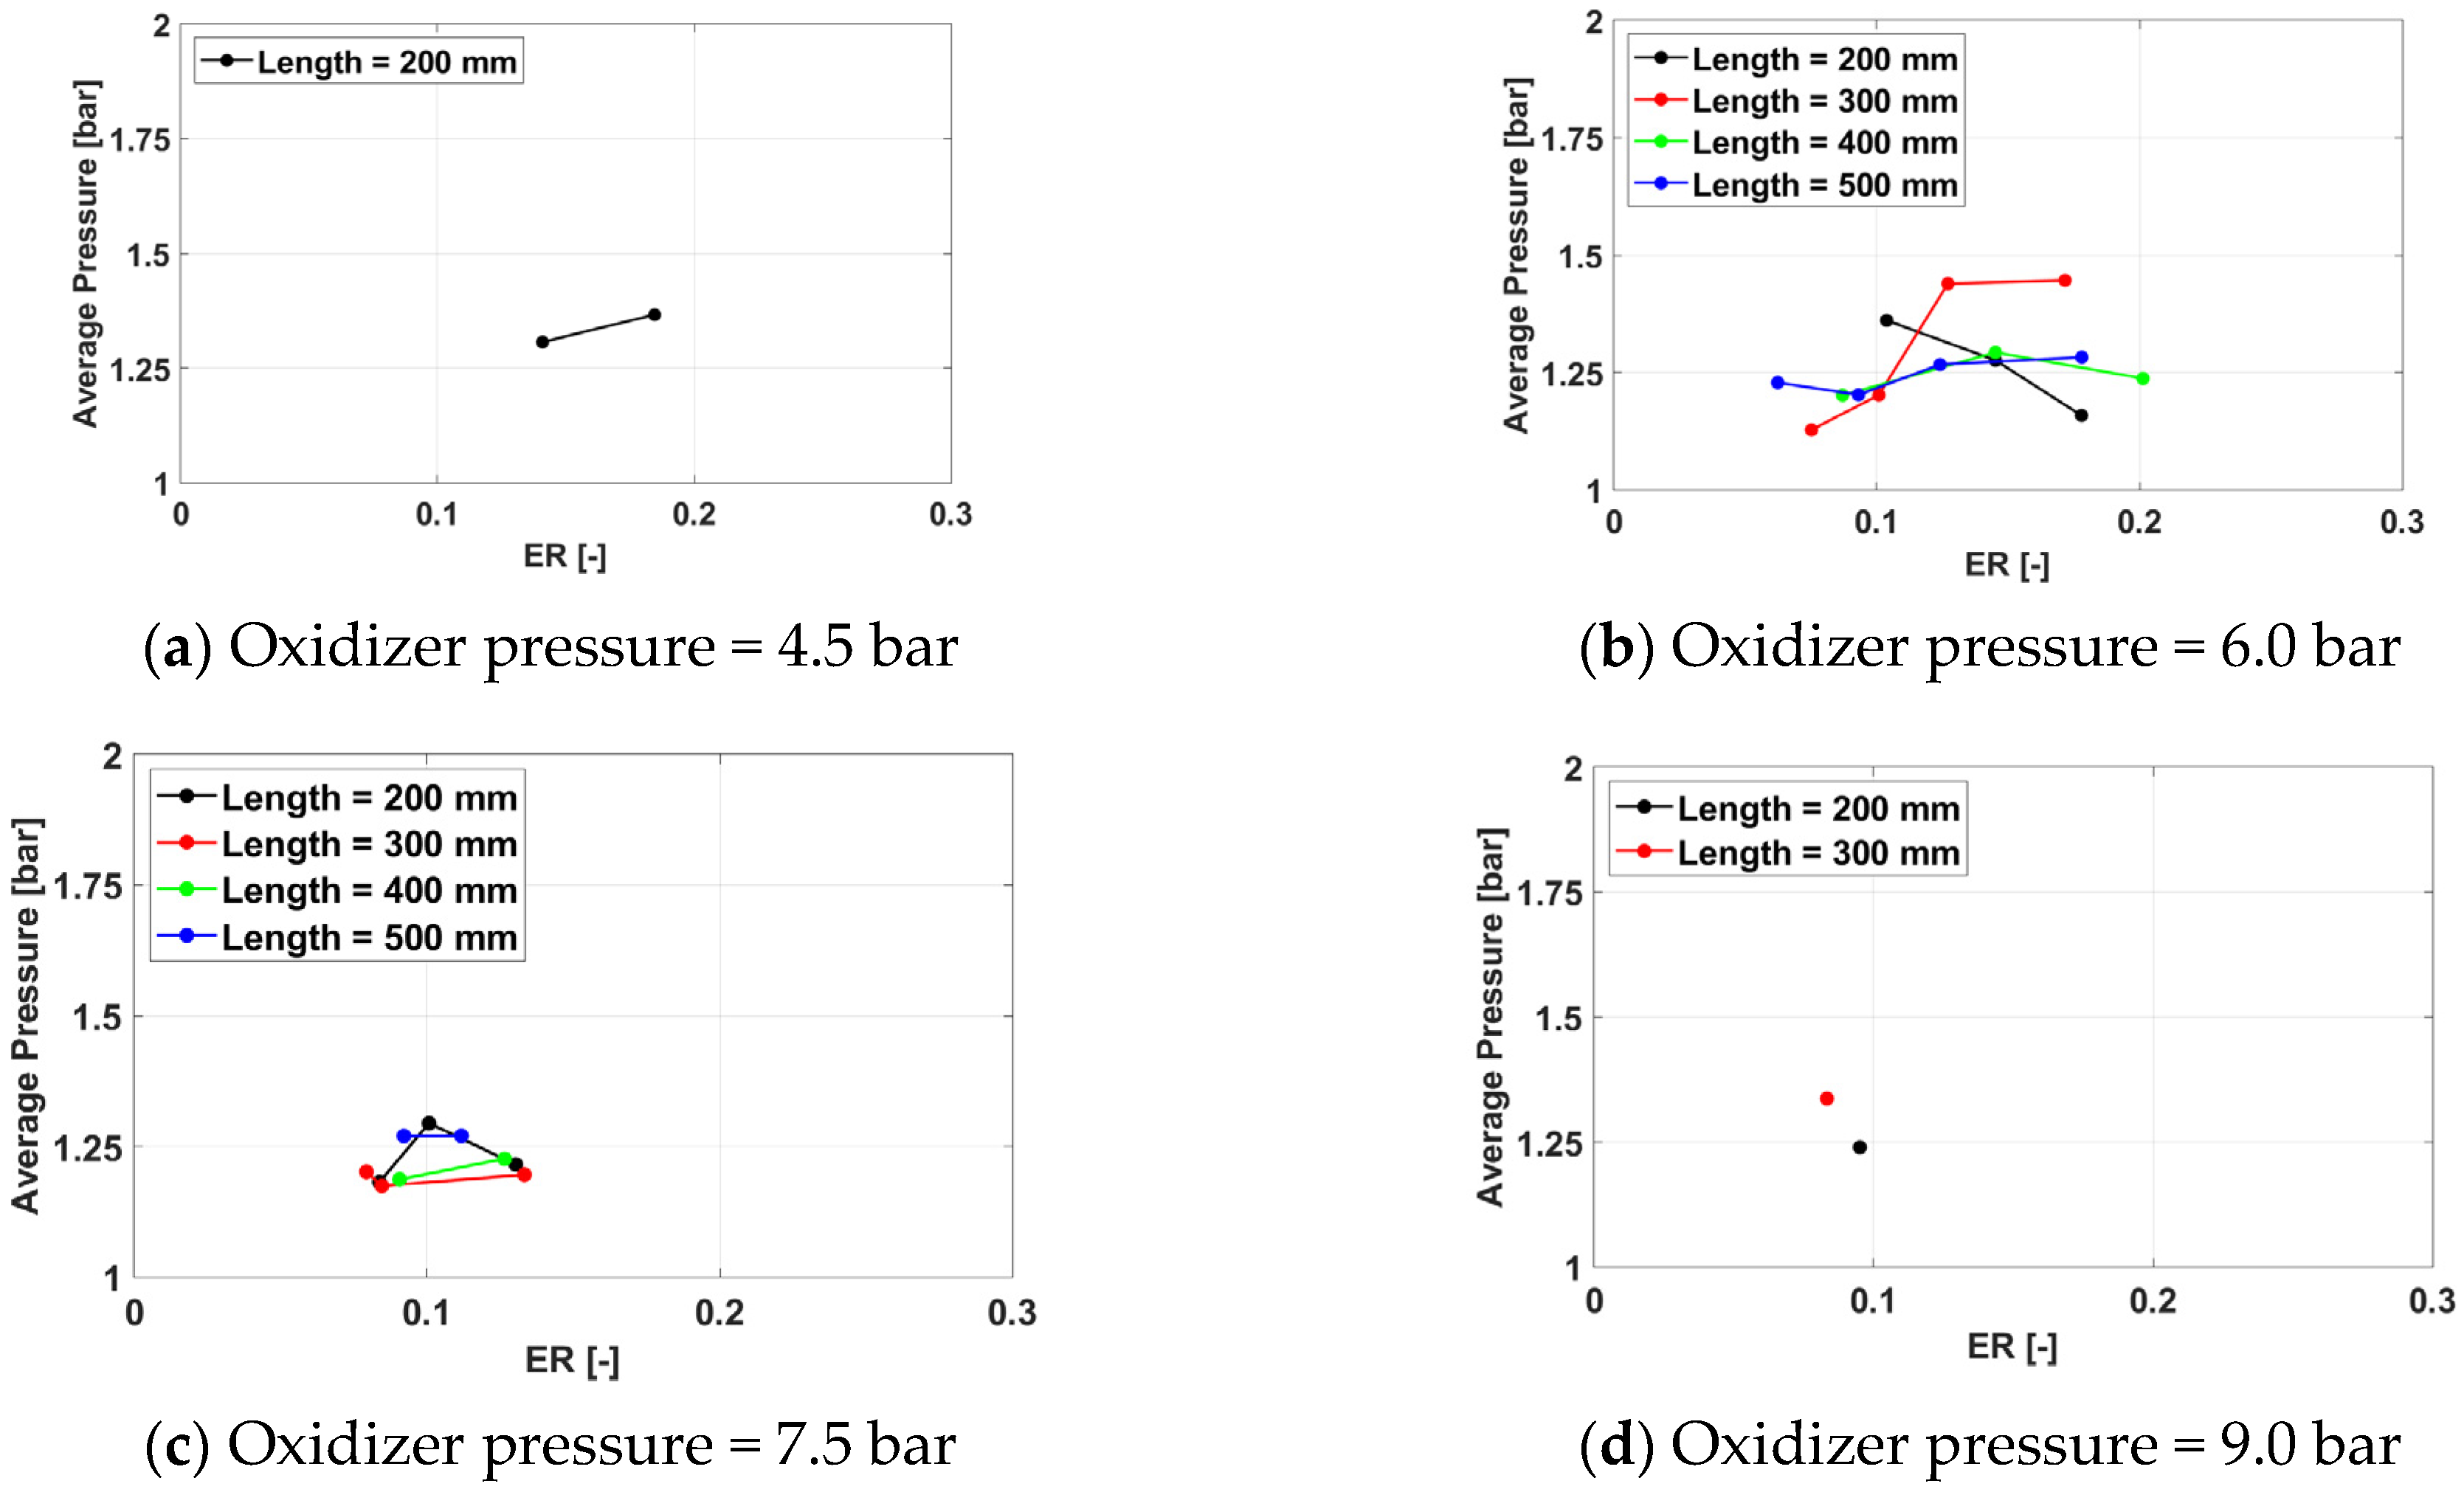
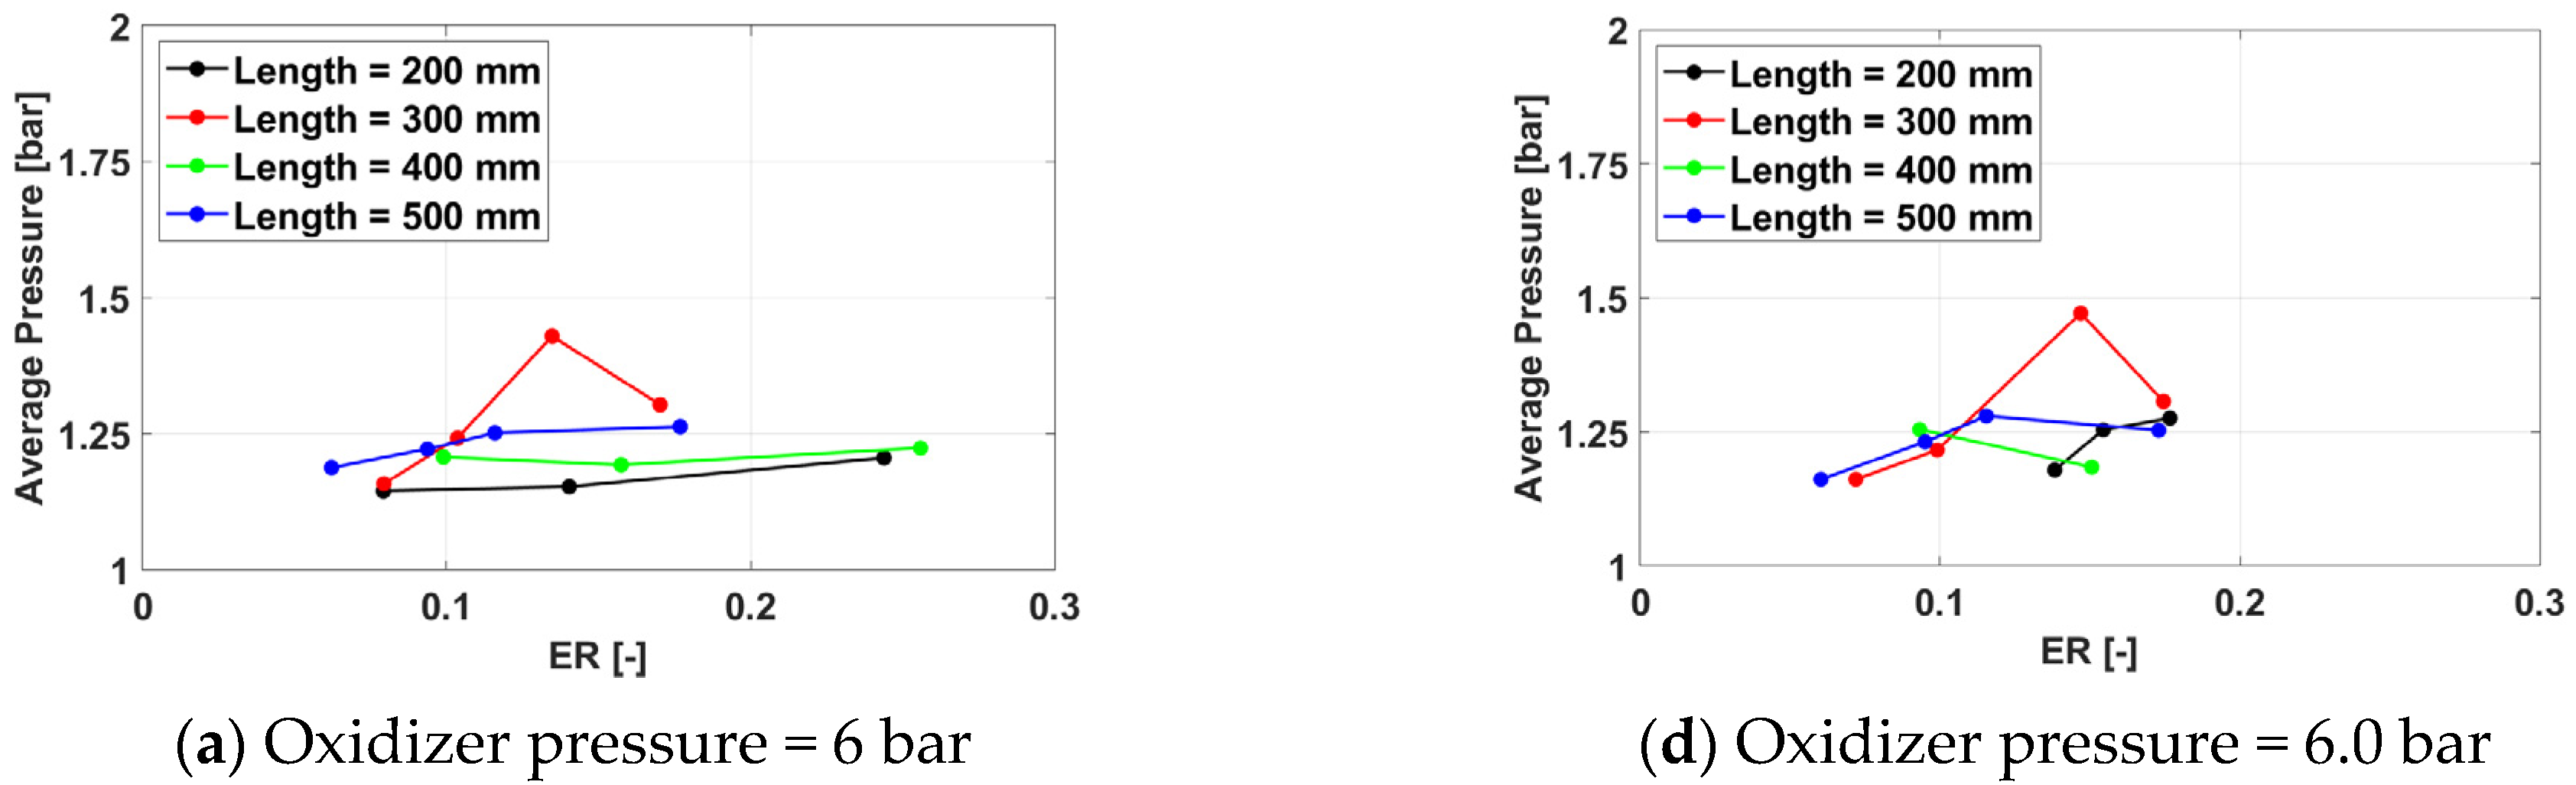
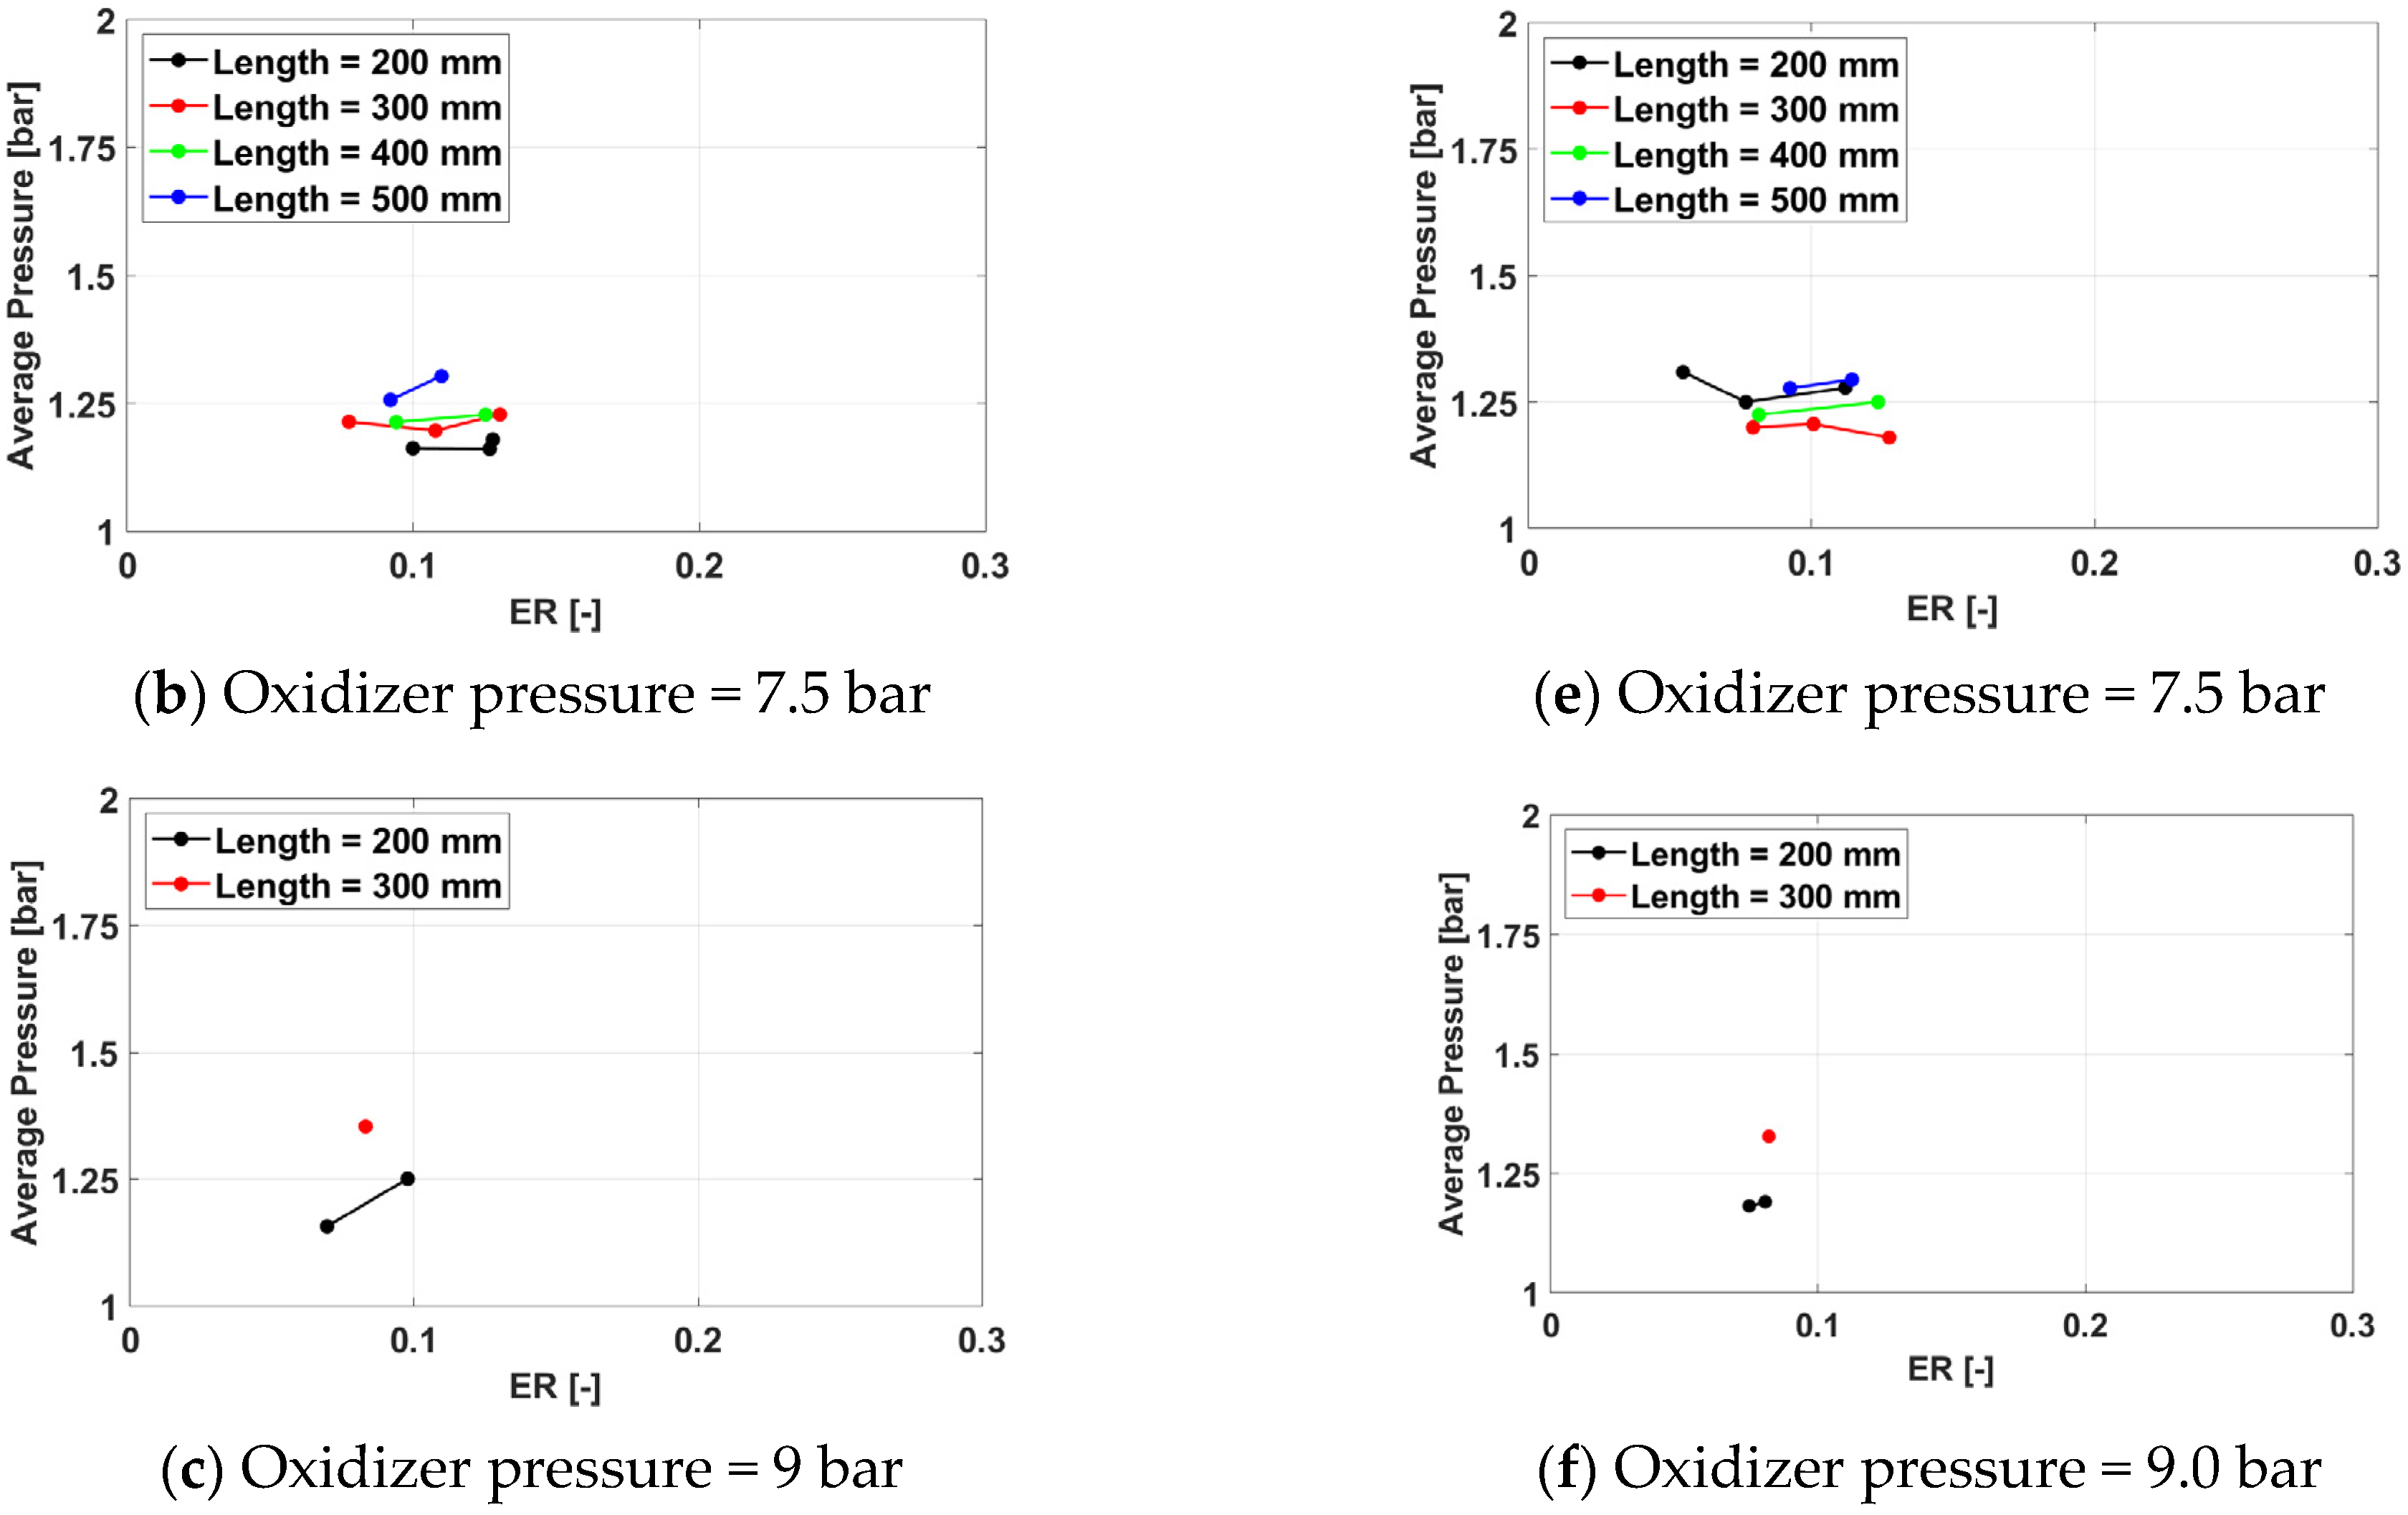
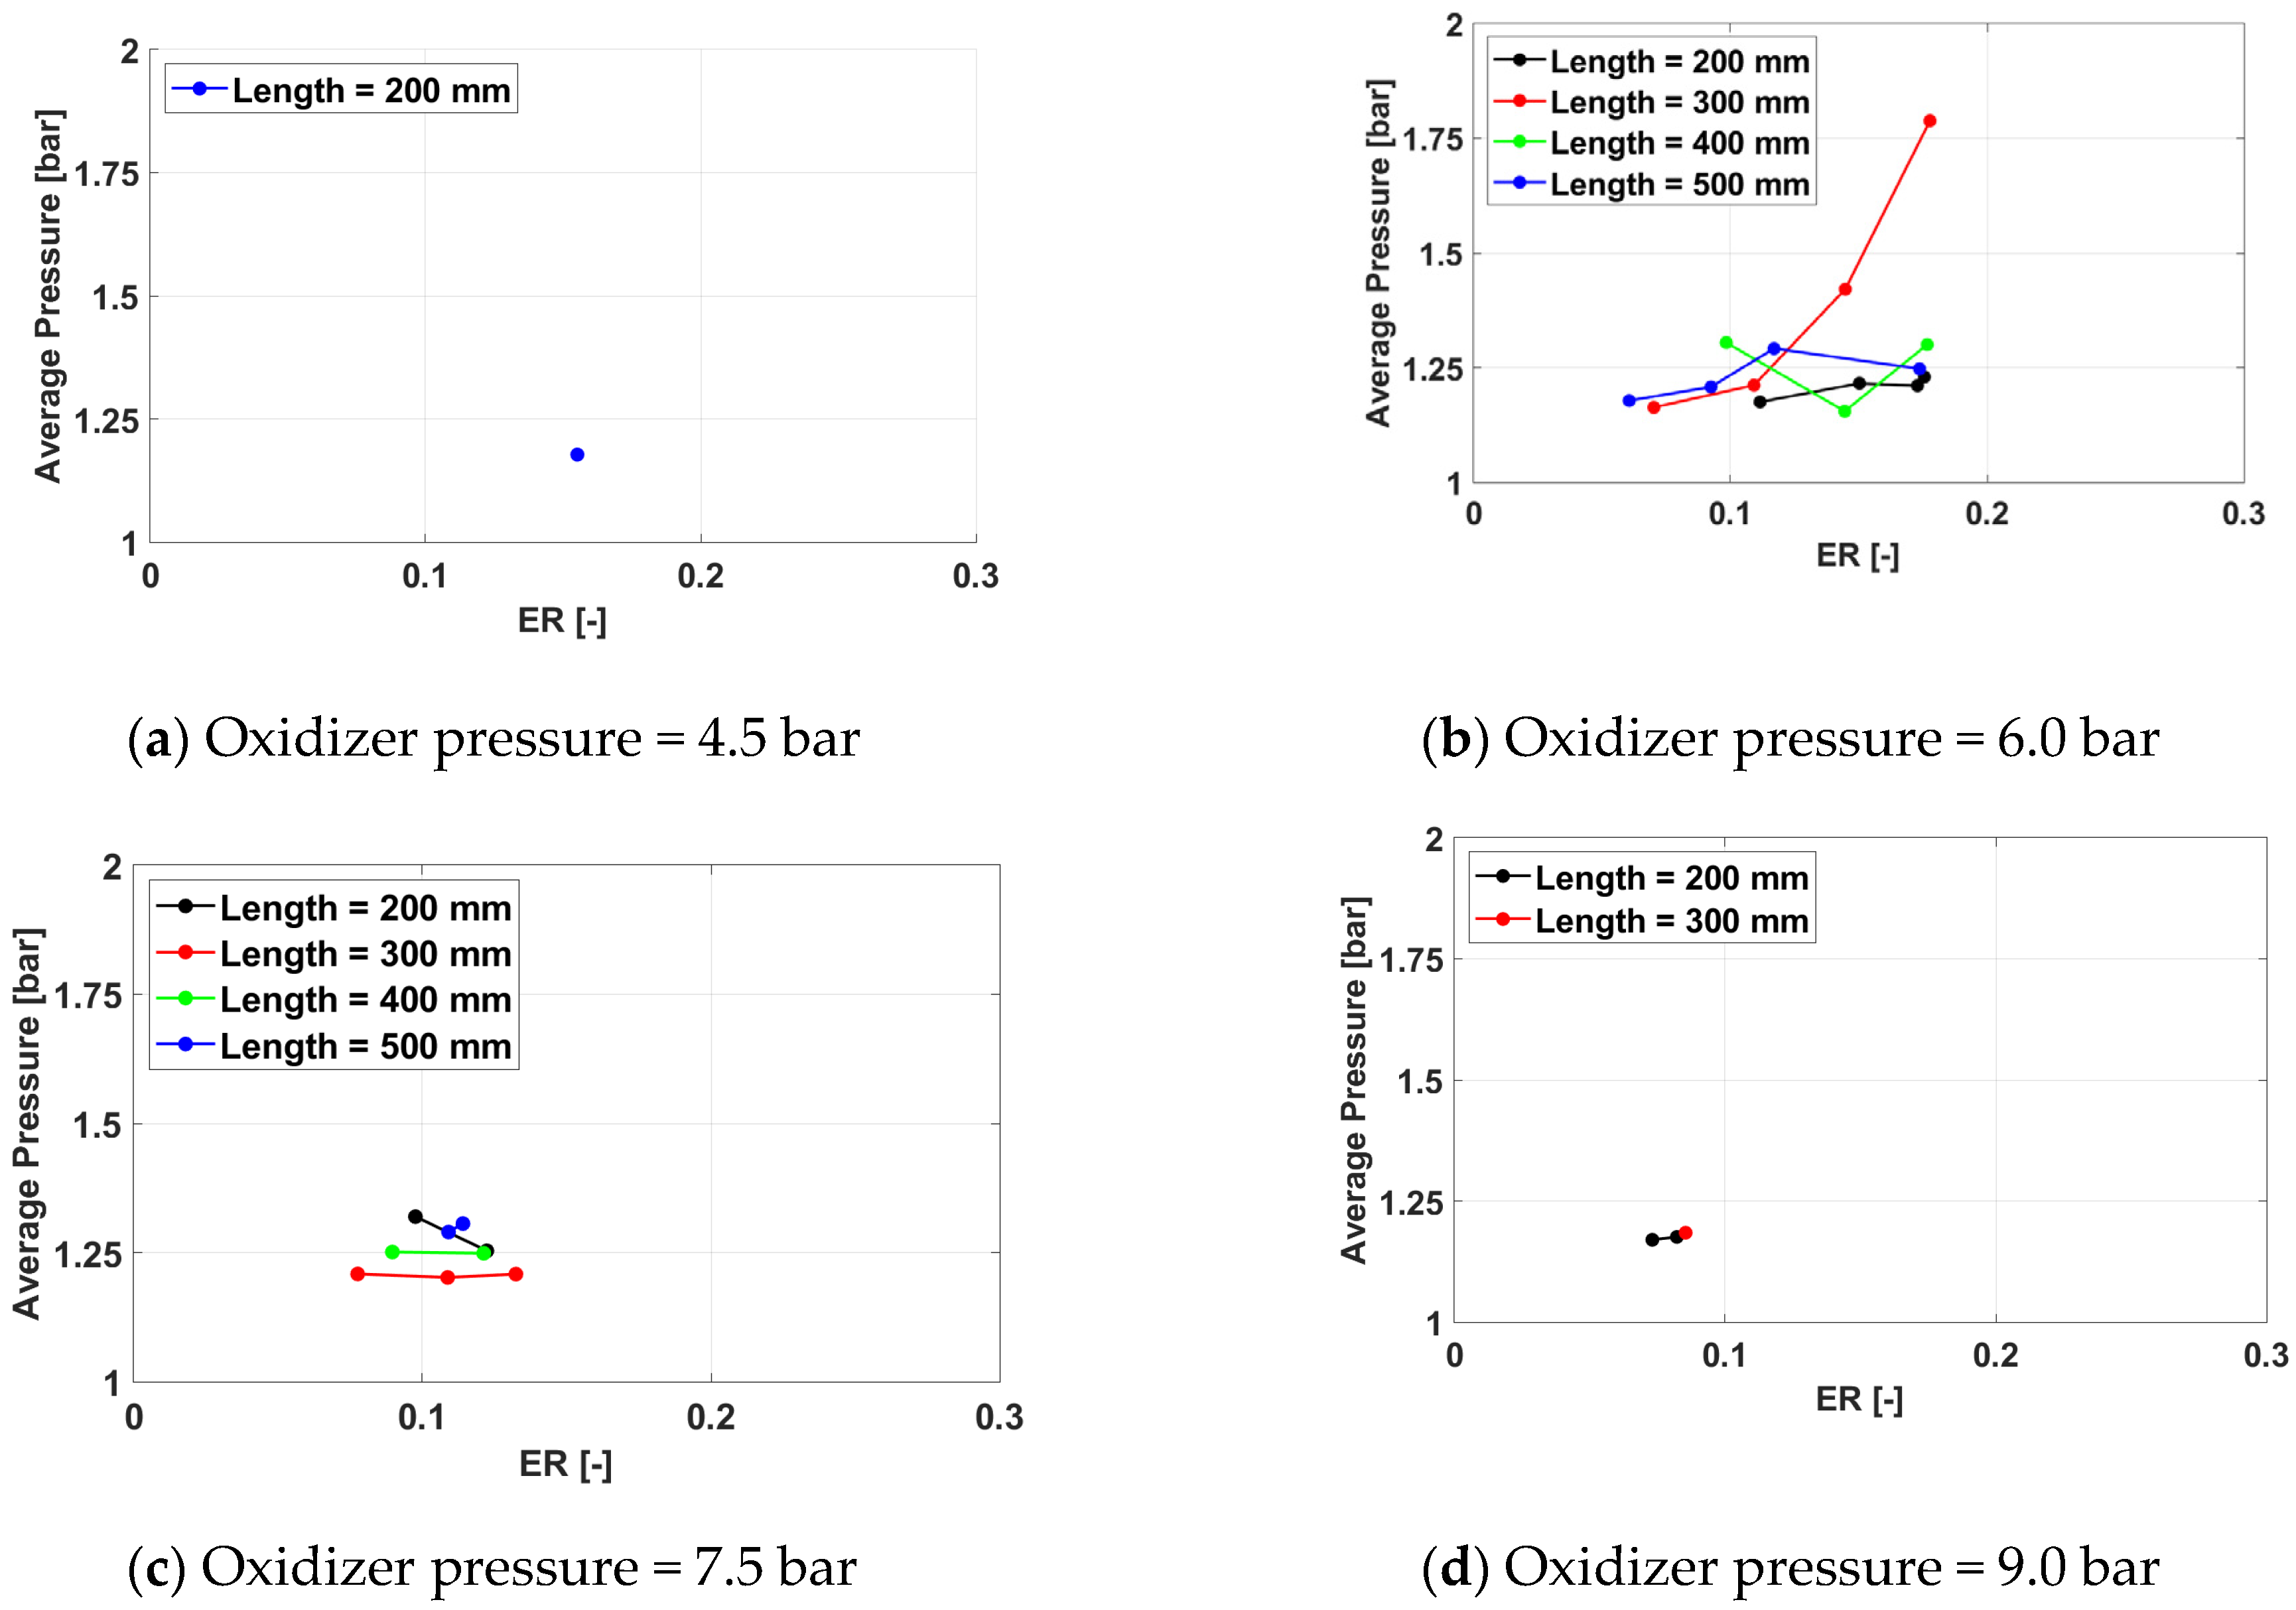
Figure 9, Figure 10, Figure 11 and Figure 12 present the average cycle pressure variation with the equivalence ratio. Sustained detonation cycles have been obtained only for oxidizer pressure values of 4.5 and 6.0 bar.
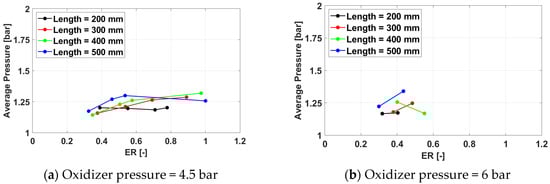
Figure 9.
Average cycle pressure for a frequency of 100 Hz for /air.
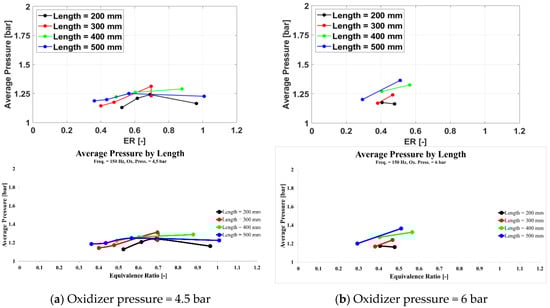
Figure 10.
Average cycle pressure for a frequency of 150 Hz for /air.
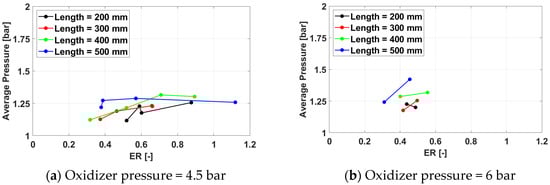
Figure 11.
Average cycle pressure for a frequency of 233 Hz for /air.
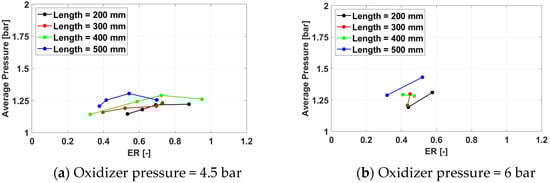
Figure 12.
Average cycle pressure for a frequency of 350 Hz for /air.
The average cycle pressure increases with both the oxidizer pressure and the exhaust pipe length for the same equivalence ratio. The effect of the oxidizer pressure is direct and easily understandable, while a longer exhaust pipe provides a longer distance for the deflagration-to-detonation process, enhancing the strength of the detonation wave.
For the low oxidizer pressure cases (4.5 bar), an optimal equivalence ratio value, where the average cycle pressure reaches a maximum, can be found. As the equivalence ratio increases, the chemical energy converted into pressure through the pressure gain combustion process increases, and so does the average cycle pressure. However, as the amount of fuel fed into the system increases further, mixing becomes a limiting factor, and incomplete combustion sets in, decreasing the performance of the PDC.
The value of the optimal equivalence ratio decreases with the increasing length of the exhaust pipe, while the value of the average cycle pressure for the same equivalence ratio increases with the exhaust pipe length, along with the overall increase of the average cycle pressure. As the strength of the detonation wave increases with the length of the exhaust pipe, its upstream influence increases the pressure into the mixing chamber, allowing for less fuel to properly mix into the combustible mixture.
For the higher oxidizer pressure cases (6.0 bar), only two valid cases were found for the same exhaust pipe length and spark plug frequency, so the average cycle pressure peak could not be identified but may be inferred from the presence of average cycle pressure profiles both increasing and decreasing with the equivalence ratio. The effect of the spark plug frequency on the average cycle pressure is insignificant.
Overall, the highest average cycle pressure is 1.43 bar, obtained for Test Case 3332, defined by an exhaust pipe length of 500 mm, a spark plug frequency of 350 Hz, an oxidizer line pressure of 6 bar, and a fuel line pressure of 10 bar. The maximum cycle pressure for this case is 3.02 bar.
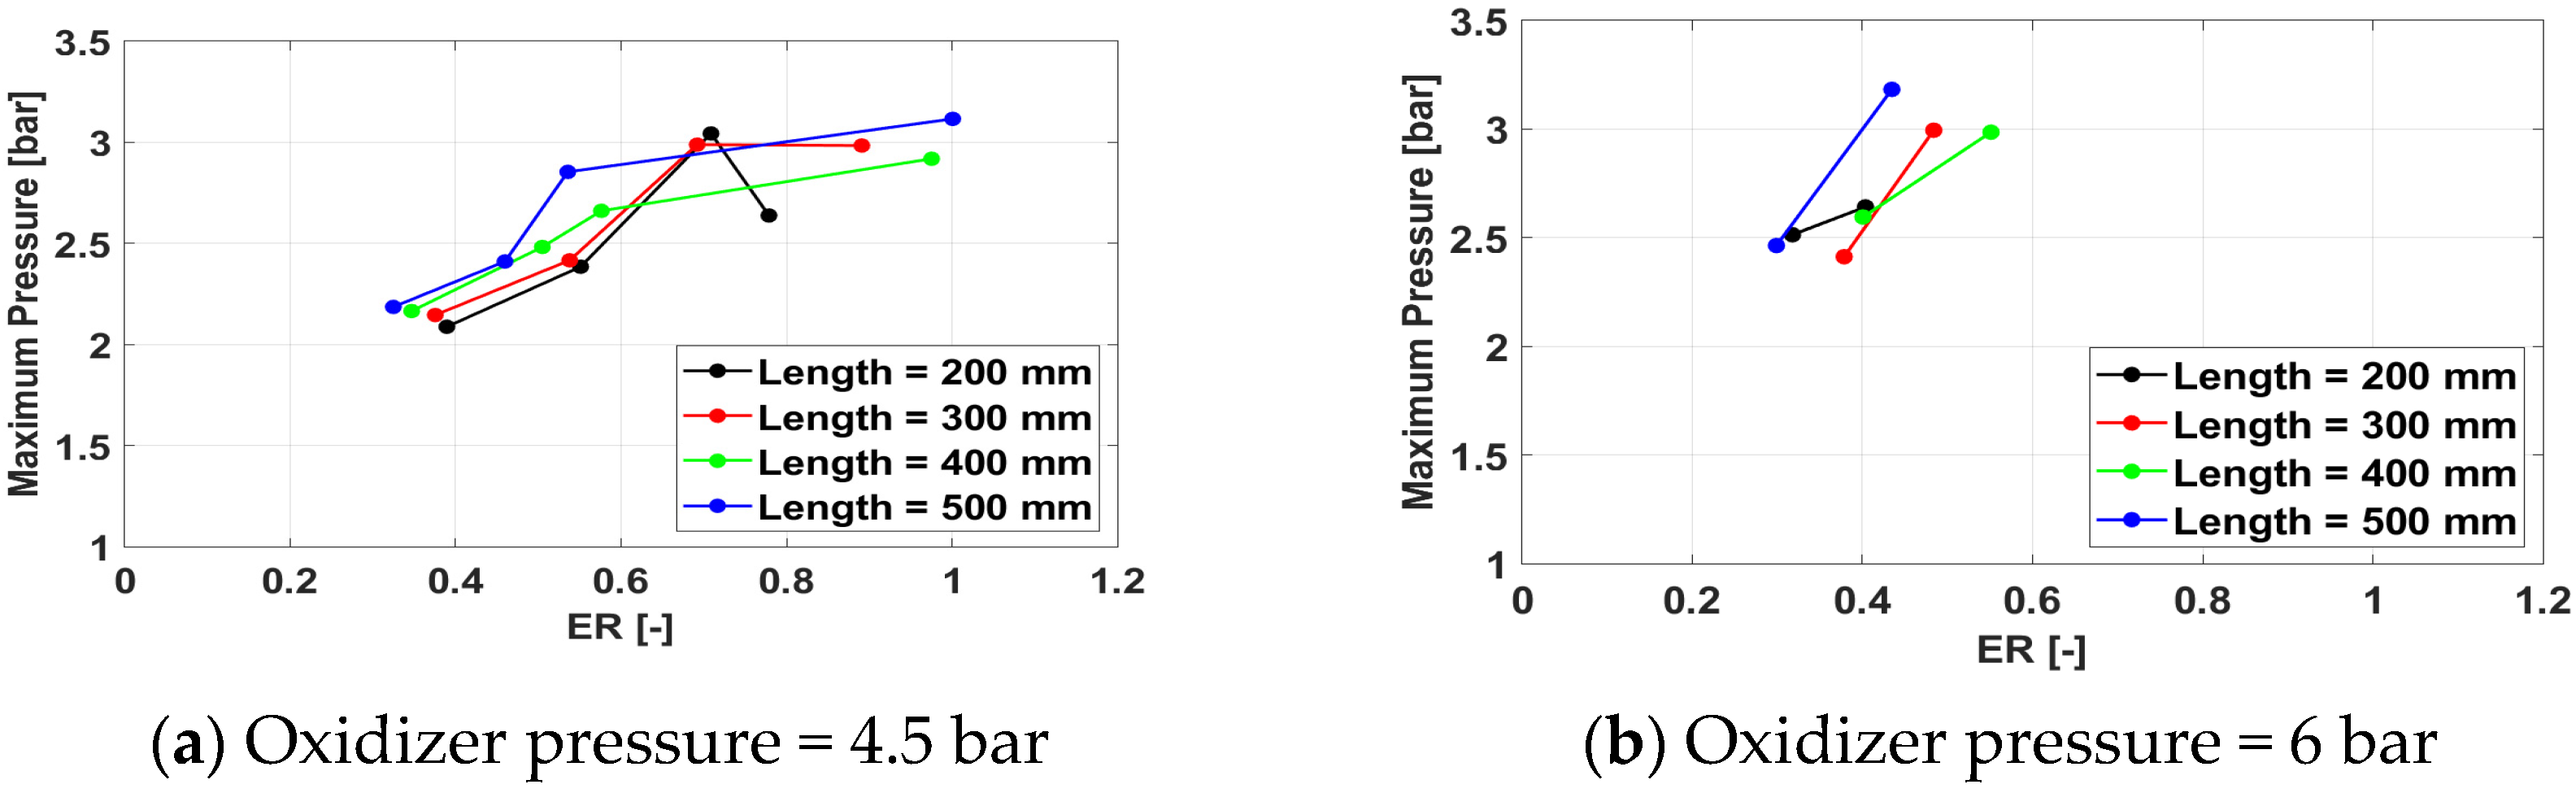
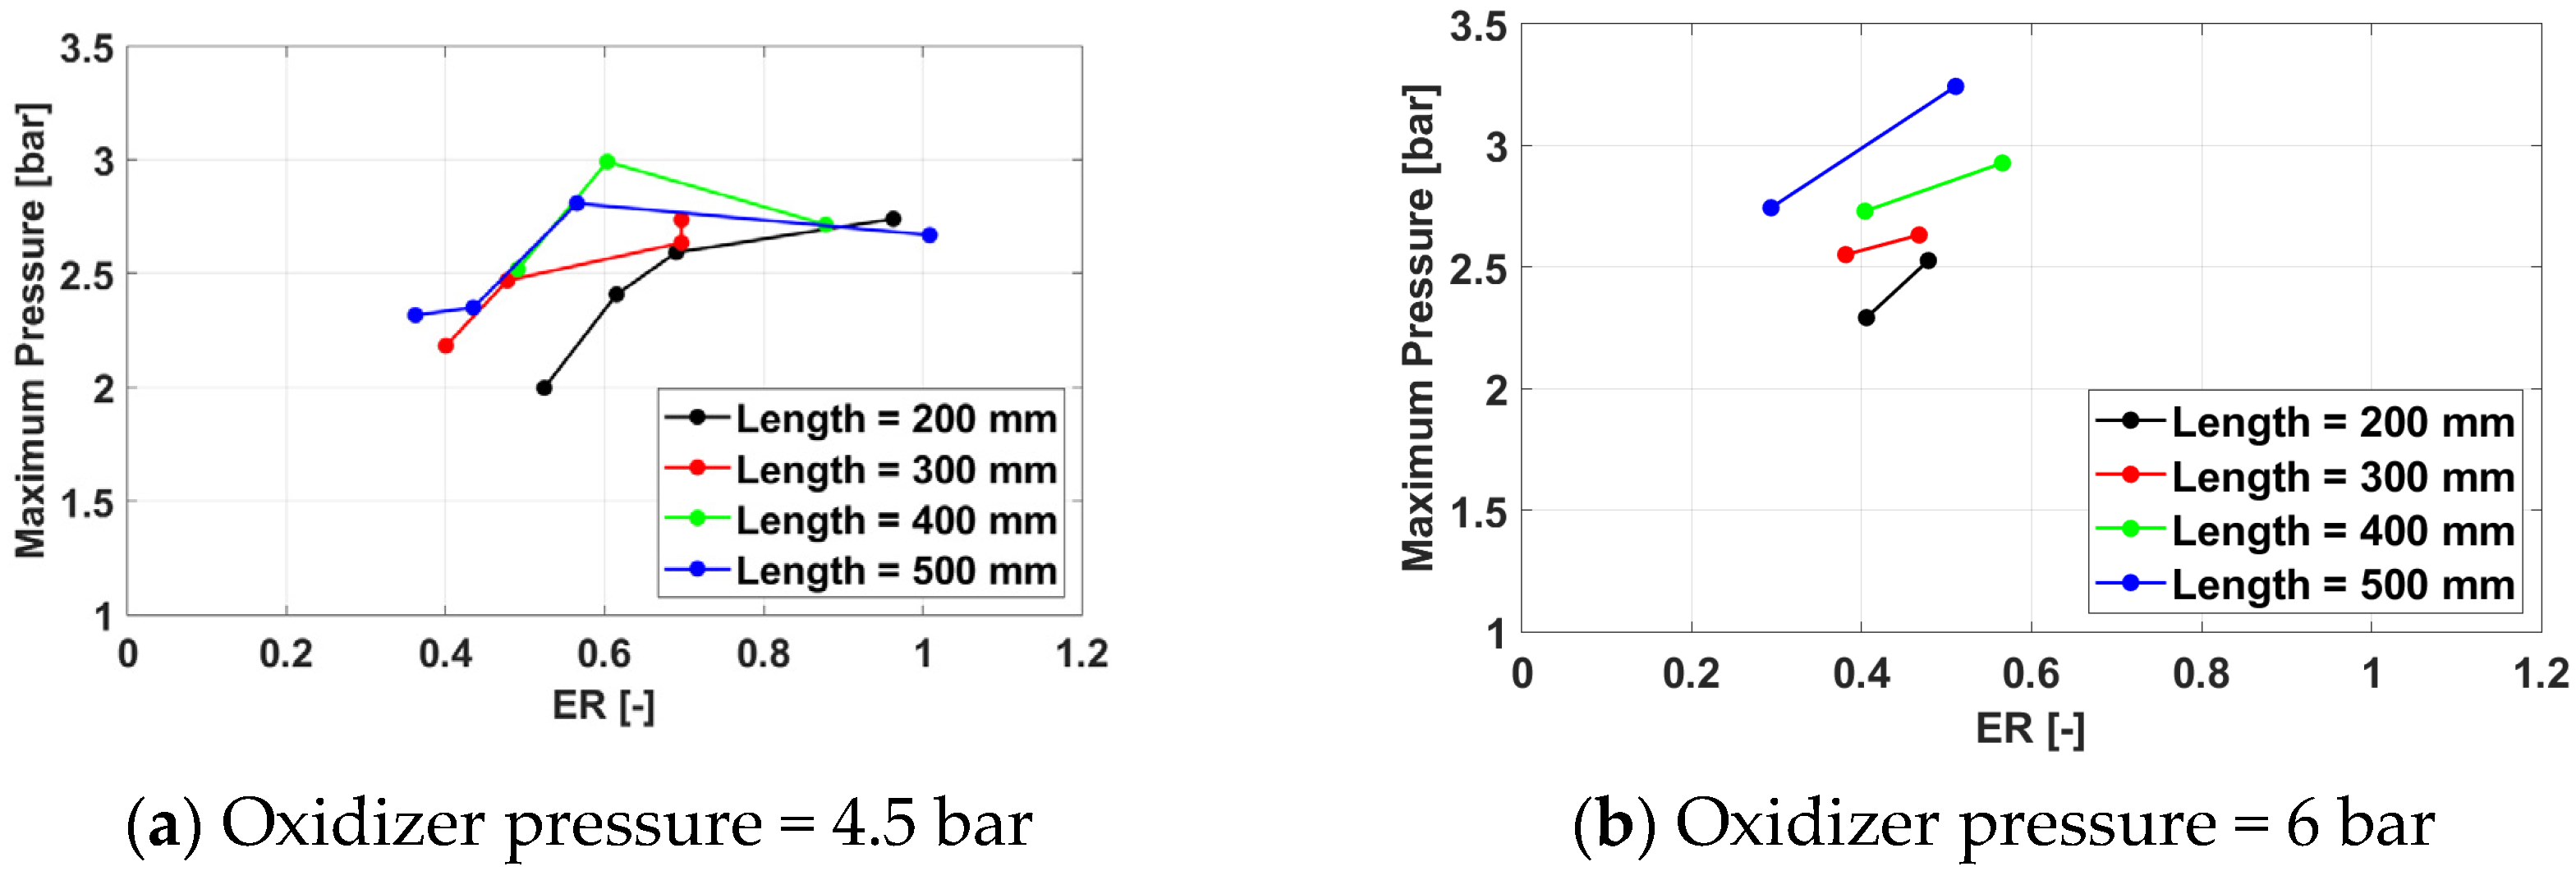
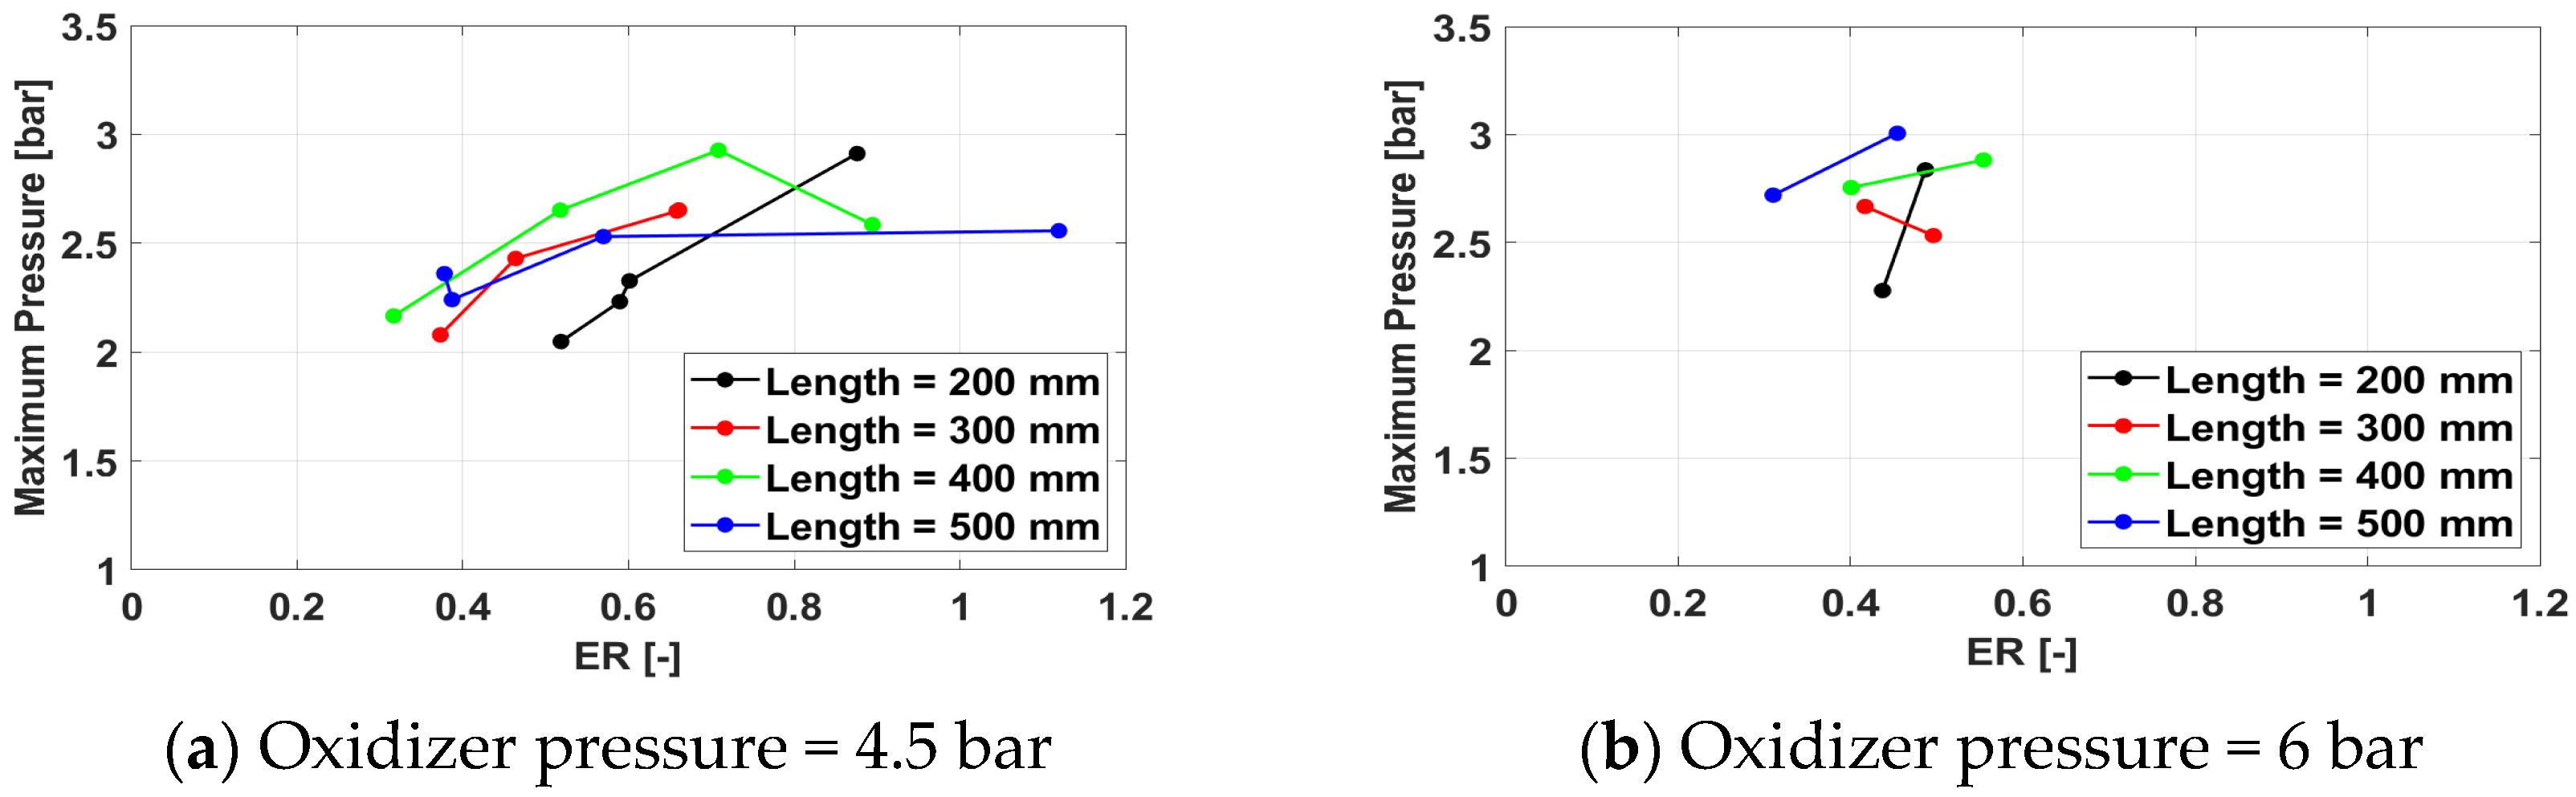
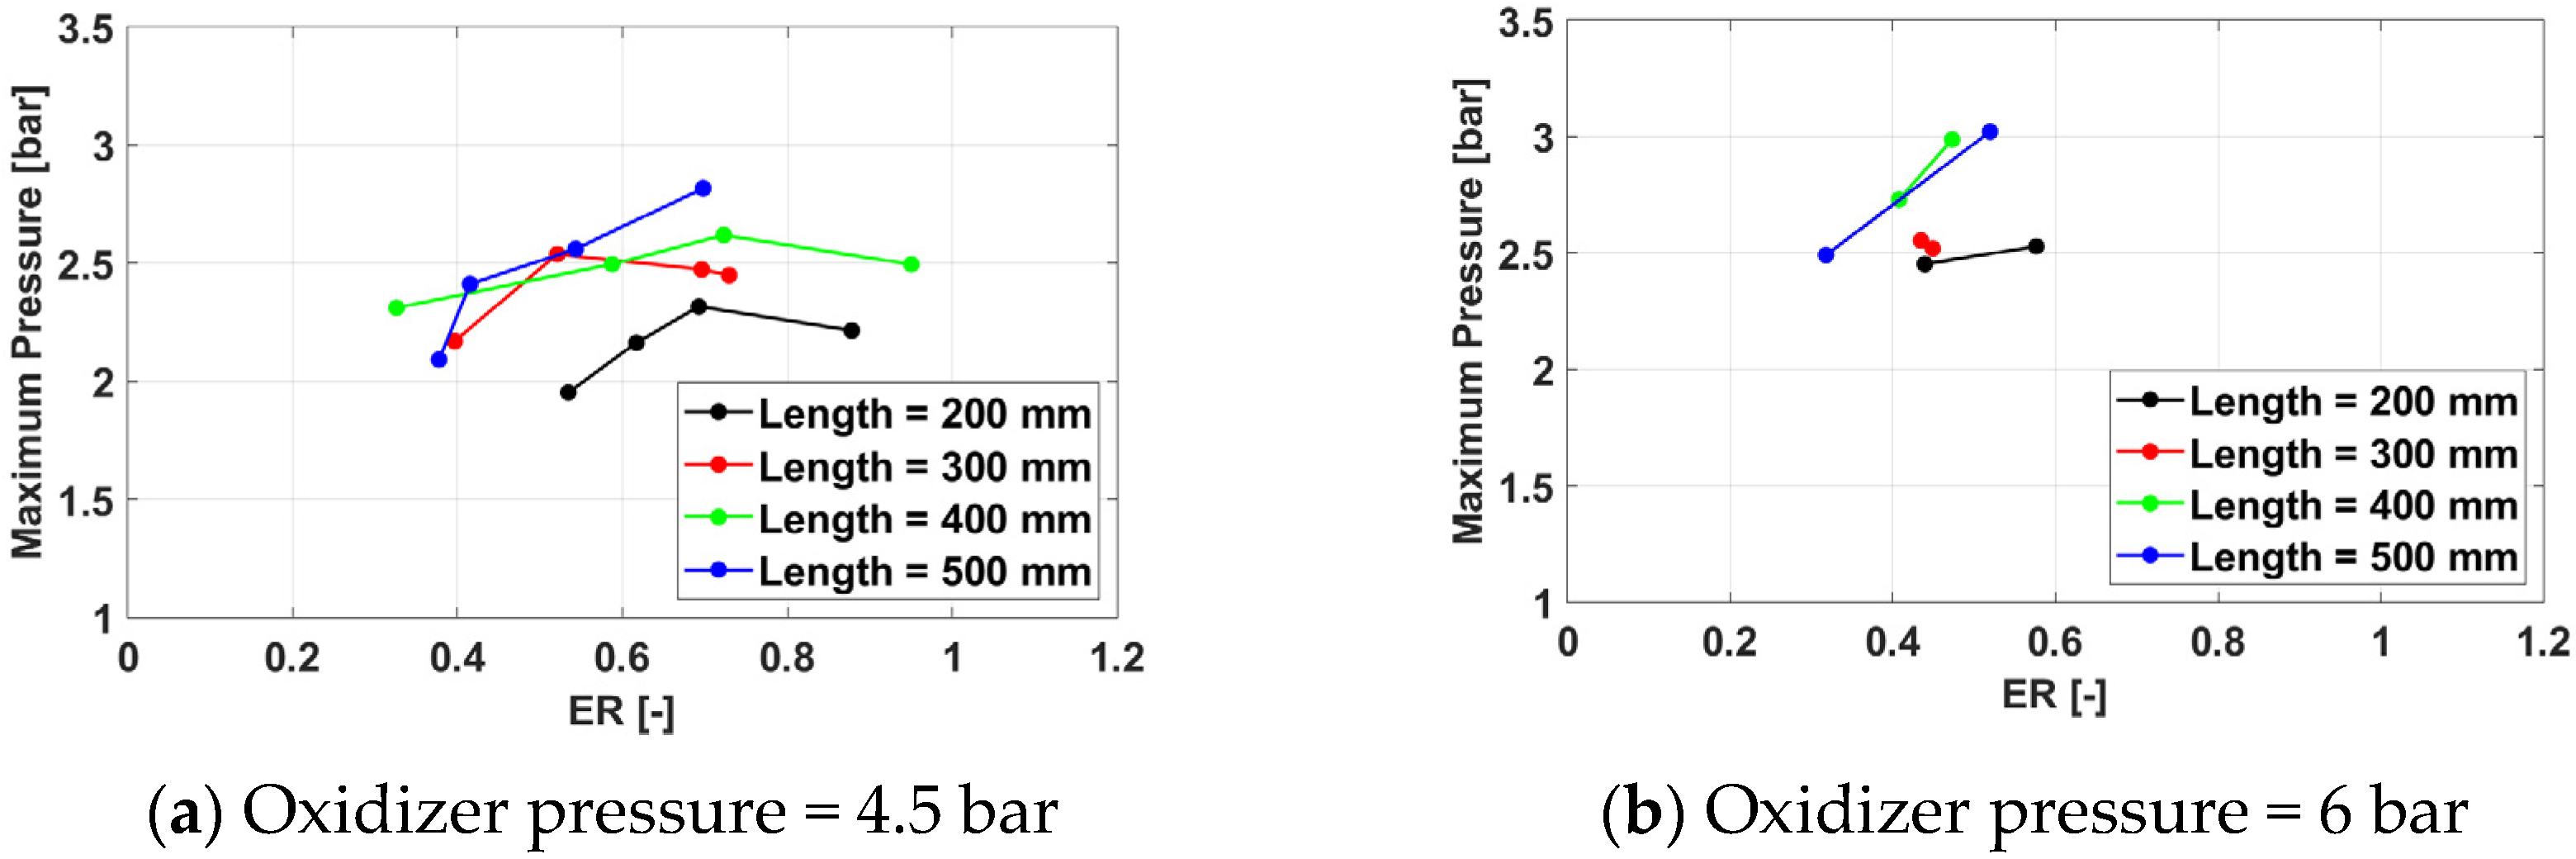
3.1.2. Maximum Cycle Pressure
Figure 13, Figure 14, Figure 15 and Figure 16 present the maximum cycle pressure variation with the equivalence ratio.
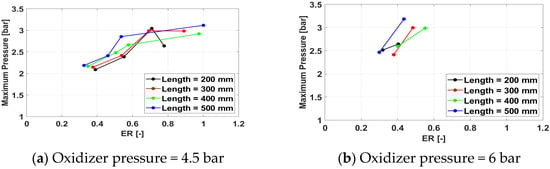
Figure 13.
Maximum cycle pressure for a frequency of 100 Hz for /air.
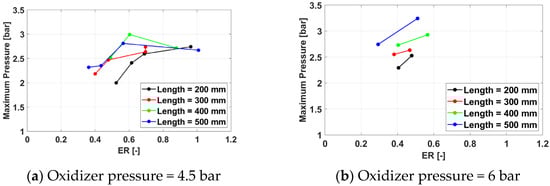
Figure 14.
Maximum cycle pressure for a frequency of 150 Hz for /air.
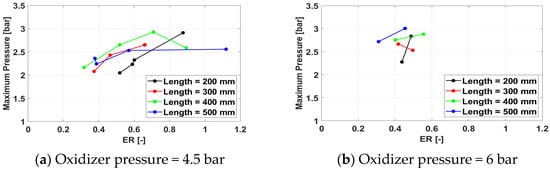
Figure 15.
Maximum cycle pressure for a frequency of 233 Hz for /air.
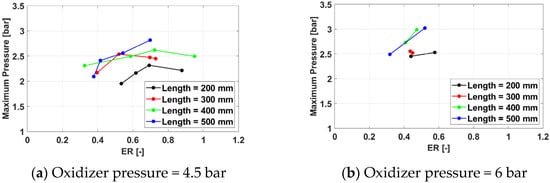
Figure 16.
Maximum cycle pressure for a frequency of 350 Hz for /air.
In general, the maximum cycle pressure follows the same trends identified earlier for the average cycle pressure. However, the effect of the exhaust pipe length is less consistent for the maximum cycle pressure than for the average cycle pressure, as higher values of the spark plug frequency tend to favor the 400 mm pipe over the 500 mm one. The reasons are unclear and may be related to the acoustics of the system.
Overall, the highest maximum cycle pressure is 3.24 bar, obtained for Test Case 3132, defined by an exhaust pipe length of 500 mm, a spark plug frequency of 150 Hz, an oxidizer line pressure of 6 bar, and a fuel line pressure of 10 bar. The average cycle pressure for this case is 1.36 bar. Because the spark plug frequency has been shown to have little effect on both the maximum and the average cycle pressure, it can be concluded that the optimal operating regime of the tested PDC is defined by an exhaust pipe length of 500 mm, an oxidizer line pressure of 6 bar, and a fuel line pressure of 10 bar.
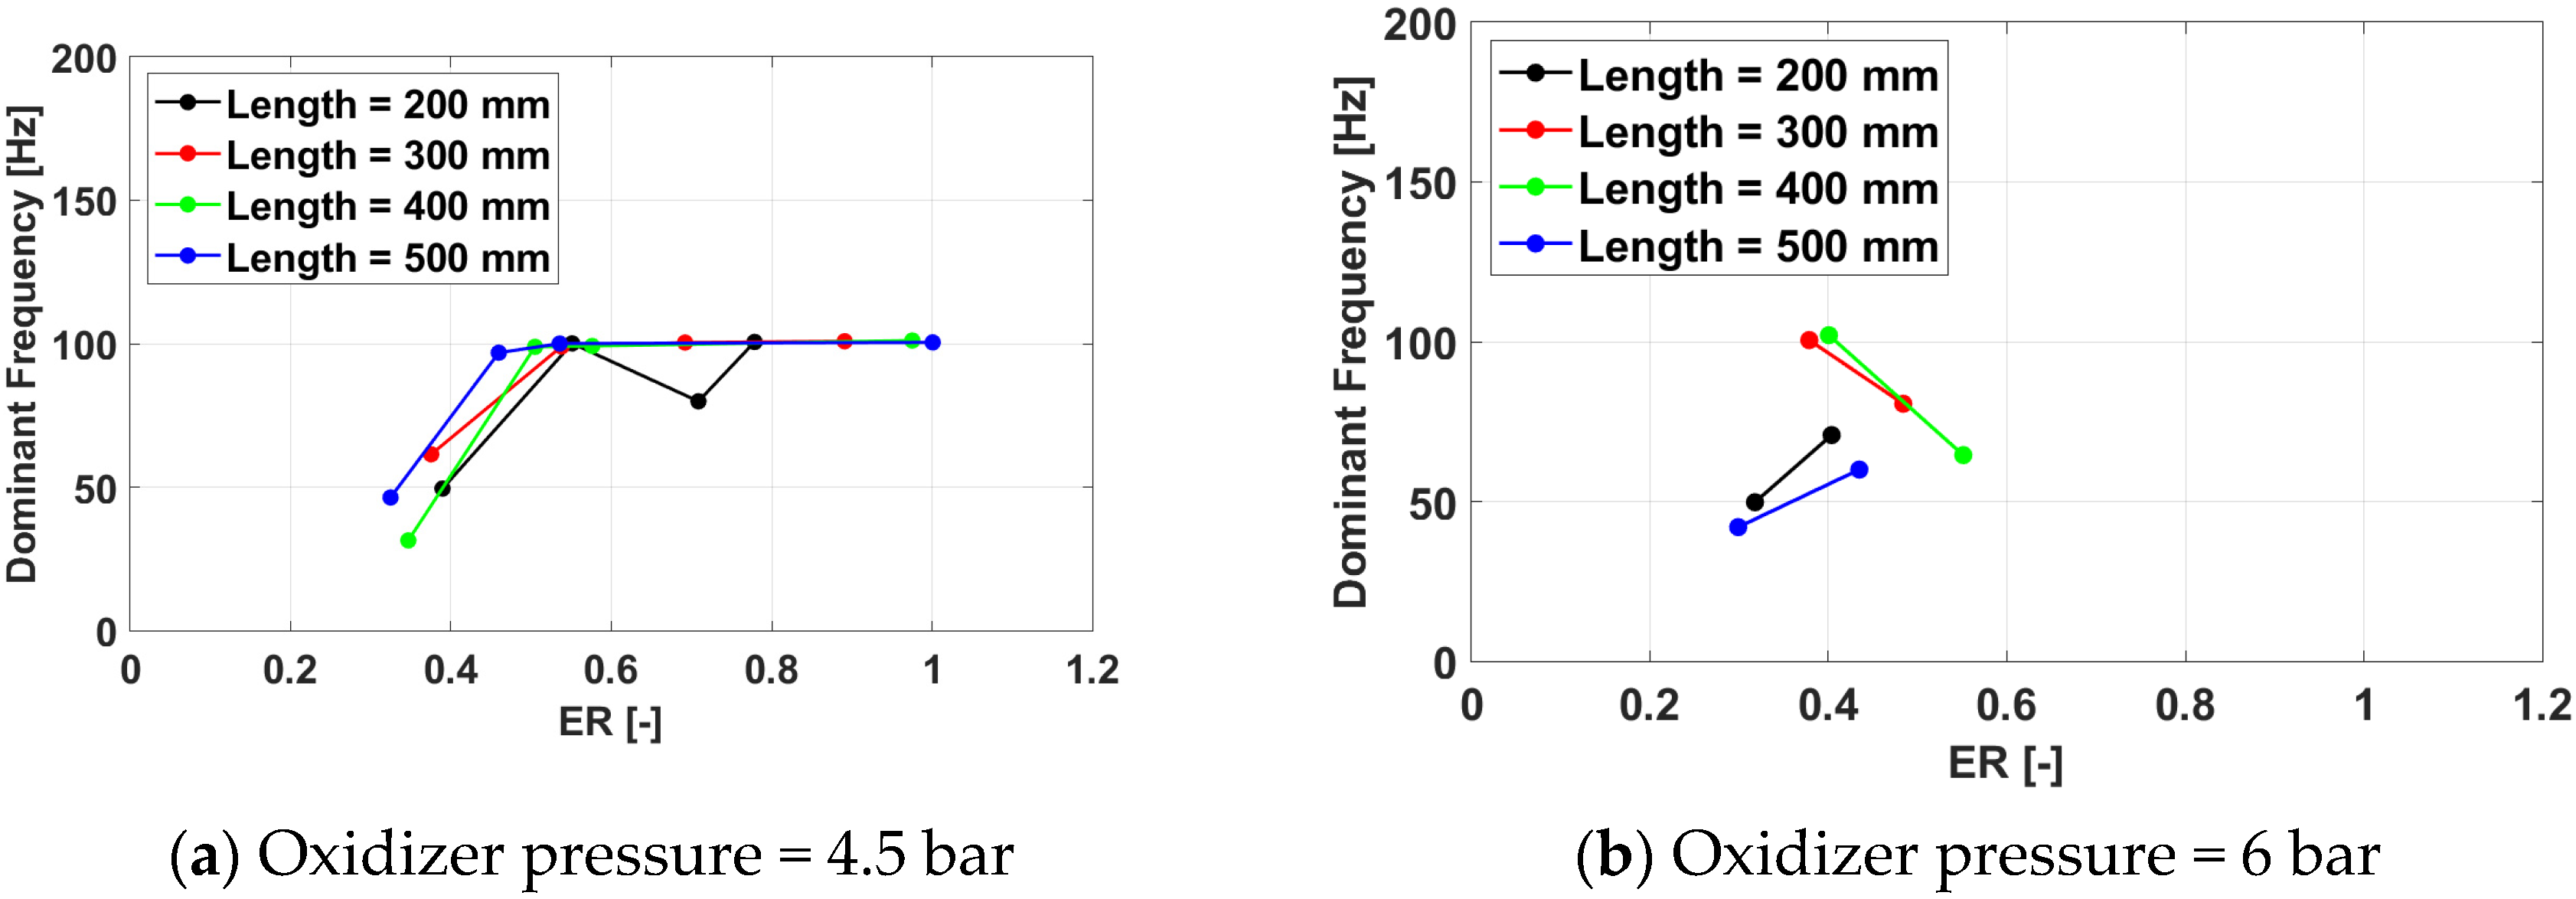
3.1.3. Operating PDC Frequency
Figure 17, Figure 18, Figure 19 and Figure 20 present the PDC operating frequency variations with the equivalence ratio.
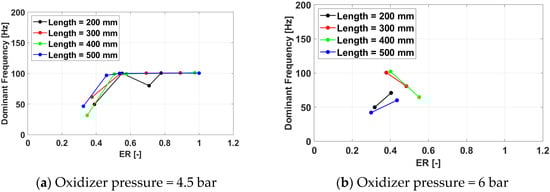
Figure 17.
Cycle frequency for a frequency of 100 Hz for /air.
Figure 18.
Cycle frequency for a frequency of 150 Hz for /air.
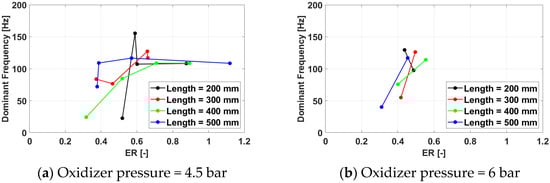
Figure 19.
Cycle frequency for a frequency of 233 Hz for /air.
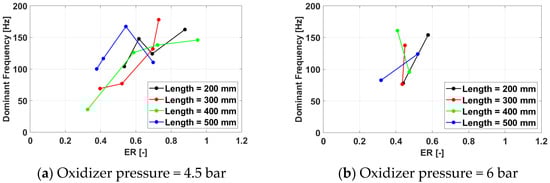
Figure 20.
Cycle frequency for a frequency of 350 Hz for /air.
The data clearly show that the spark plug frequency is driving the frequency response of the PDC, as in no case does the latter exceed the first. On the contrary, the system responds and, to a certain degree, adapts to the spark plug excitation but misfires in initiating the detonation cycle, decreasing the apparent operating frequency. It is noteworthy that the geometry of the PDC was designed for a 100 Hz frequency, and this is readily visible in the data. As for this spark plug frequency, most cases respond with an operating frequency of 100 Hz, and the number of misfires is zero or minimal.
As the spark plug frequency offset from the design point increases, the operating frequency response deteriorates. For 150 Hz, some cases where the PDC is capable of adapting itself and reaching the same operating frequency still exist for equivalence ratios around 0.7 and shorter exhaust pipes (200 mm and 300 mm), but above this value and for longer exhaust pipes, misfires start occurring as well. At 233 Hz, no test case is able to reach the excitation frequency, but sufficiently rich mixtures are consistently capable of yielding an operating frequency around the design frequency of 100 Hz, or even slightly above, up to 120 Hz. Interestingly enough, the 350 Hz cases are behaving better, with a larger number of configurations reaching an operating frequency of 175 Hz, which is half the spark plug frequency. This is most likely related to the fact that the driving frequency is a superposition of harmonics and sub-harmonics of the design frequency.
In general, more failures occur at lower equivalence ratios, as lean mixtures are more difficult to ignite. Even if less consistent, it also appears that shorter pipes tend to lead to fewer misfires, probably in relation to the heat fluxes through the experimental model and the reduced metal volume of the shorter pipe cases.
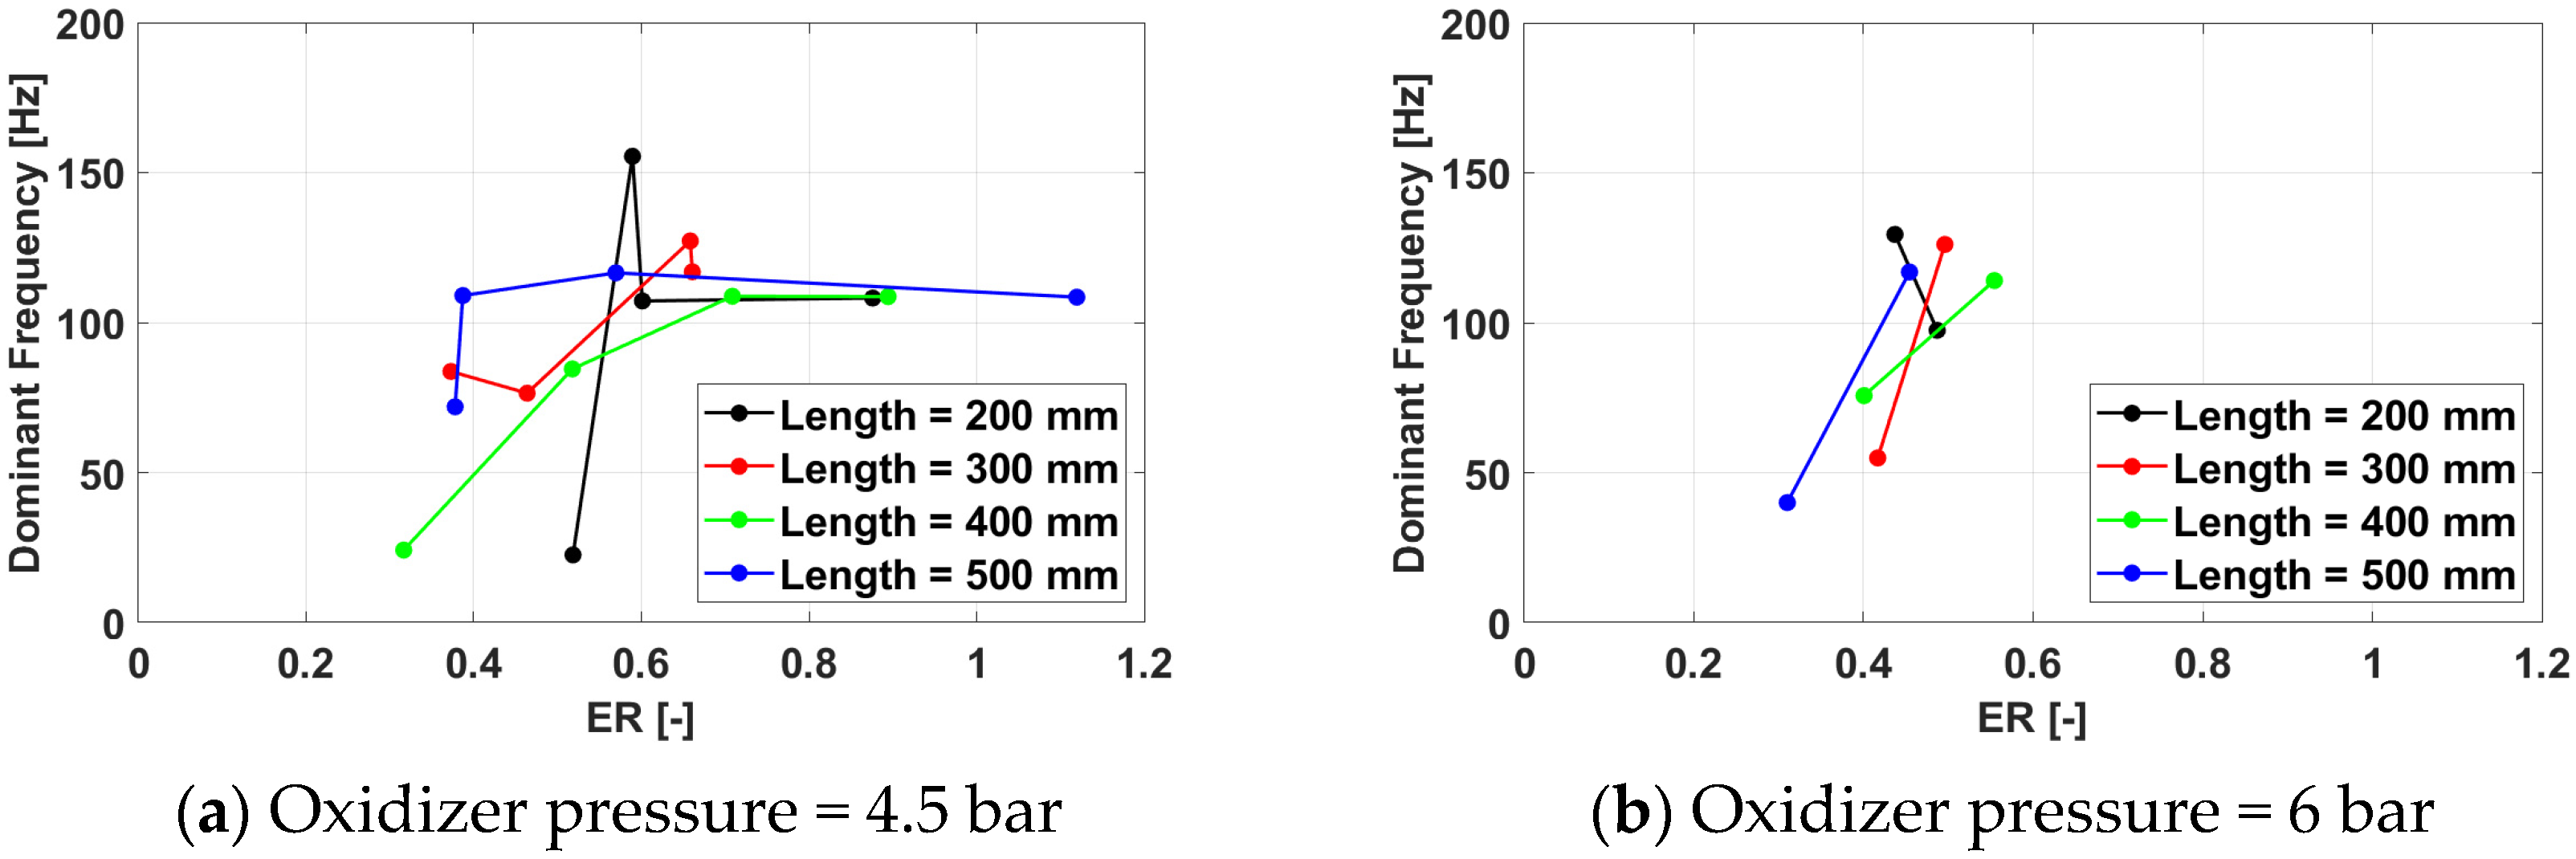
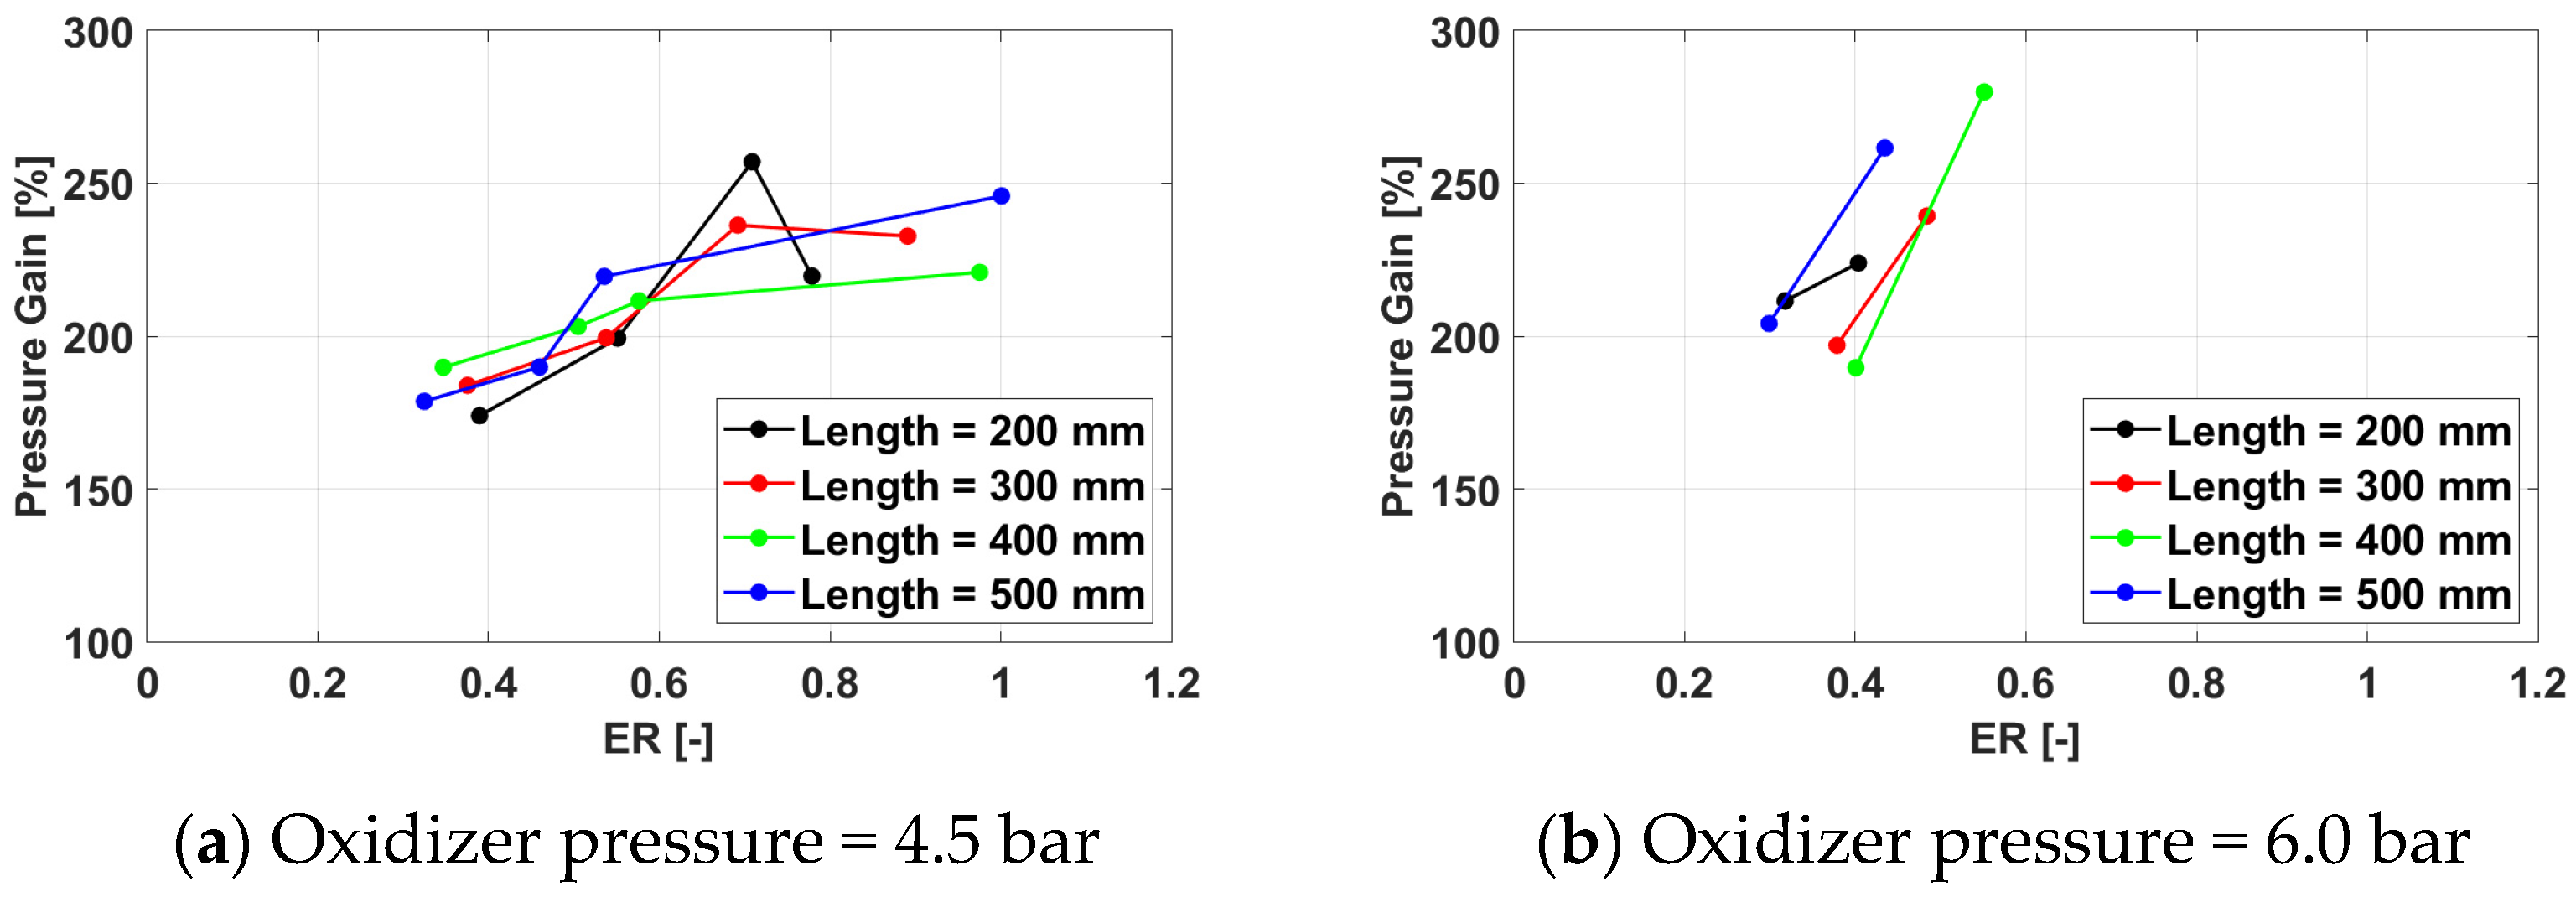
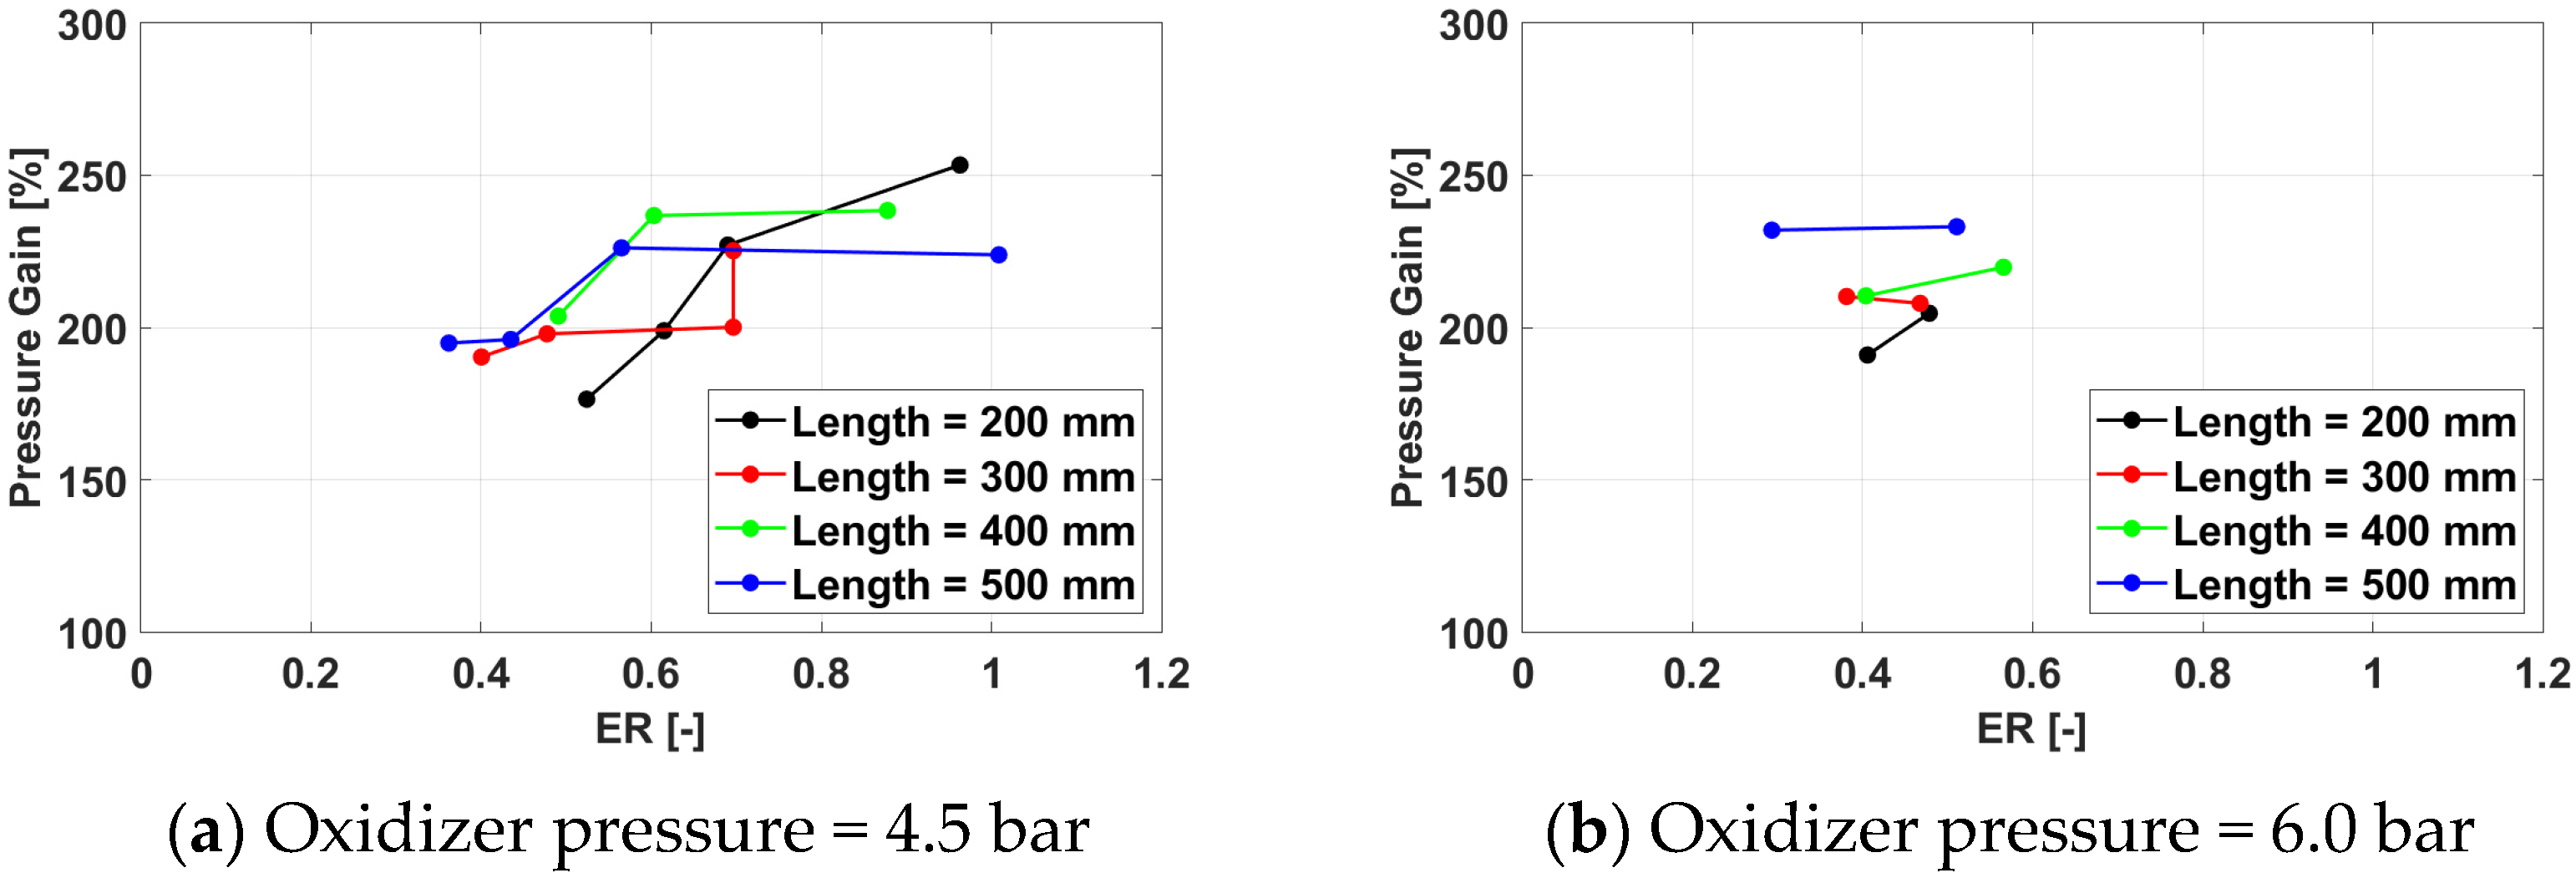
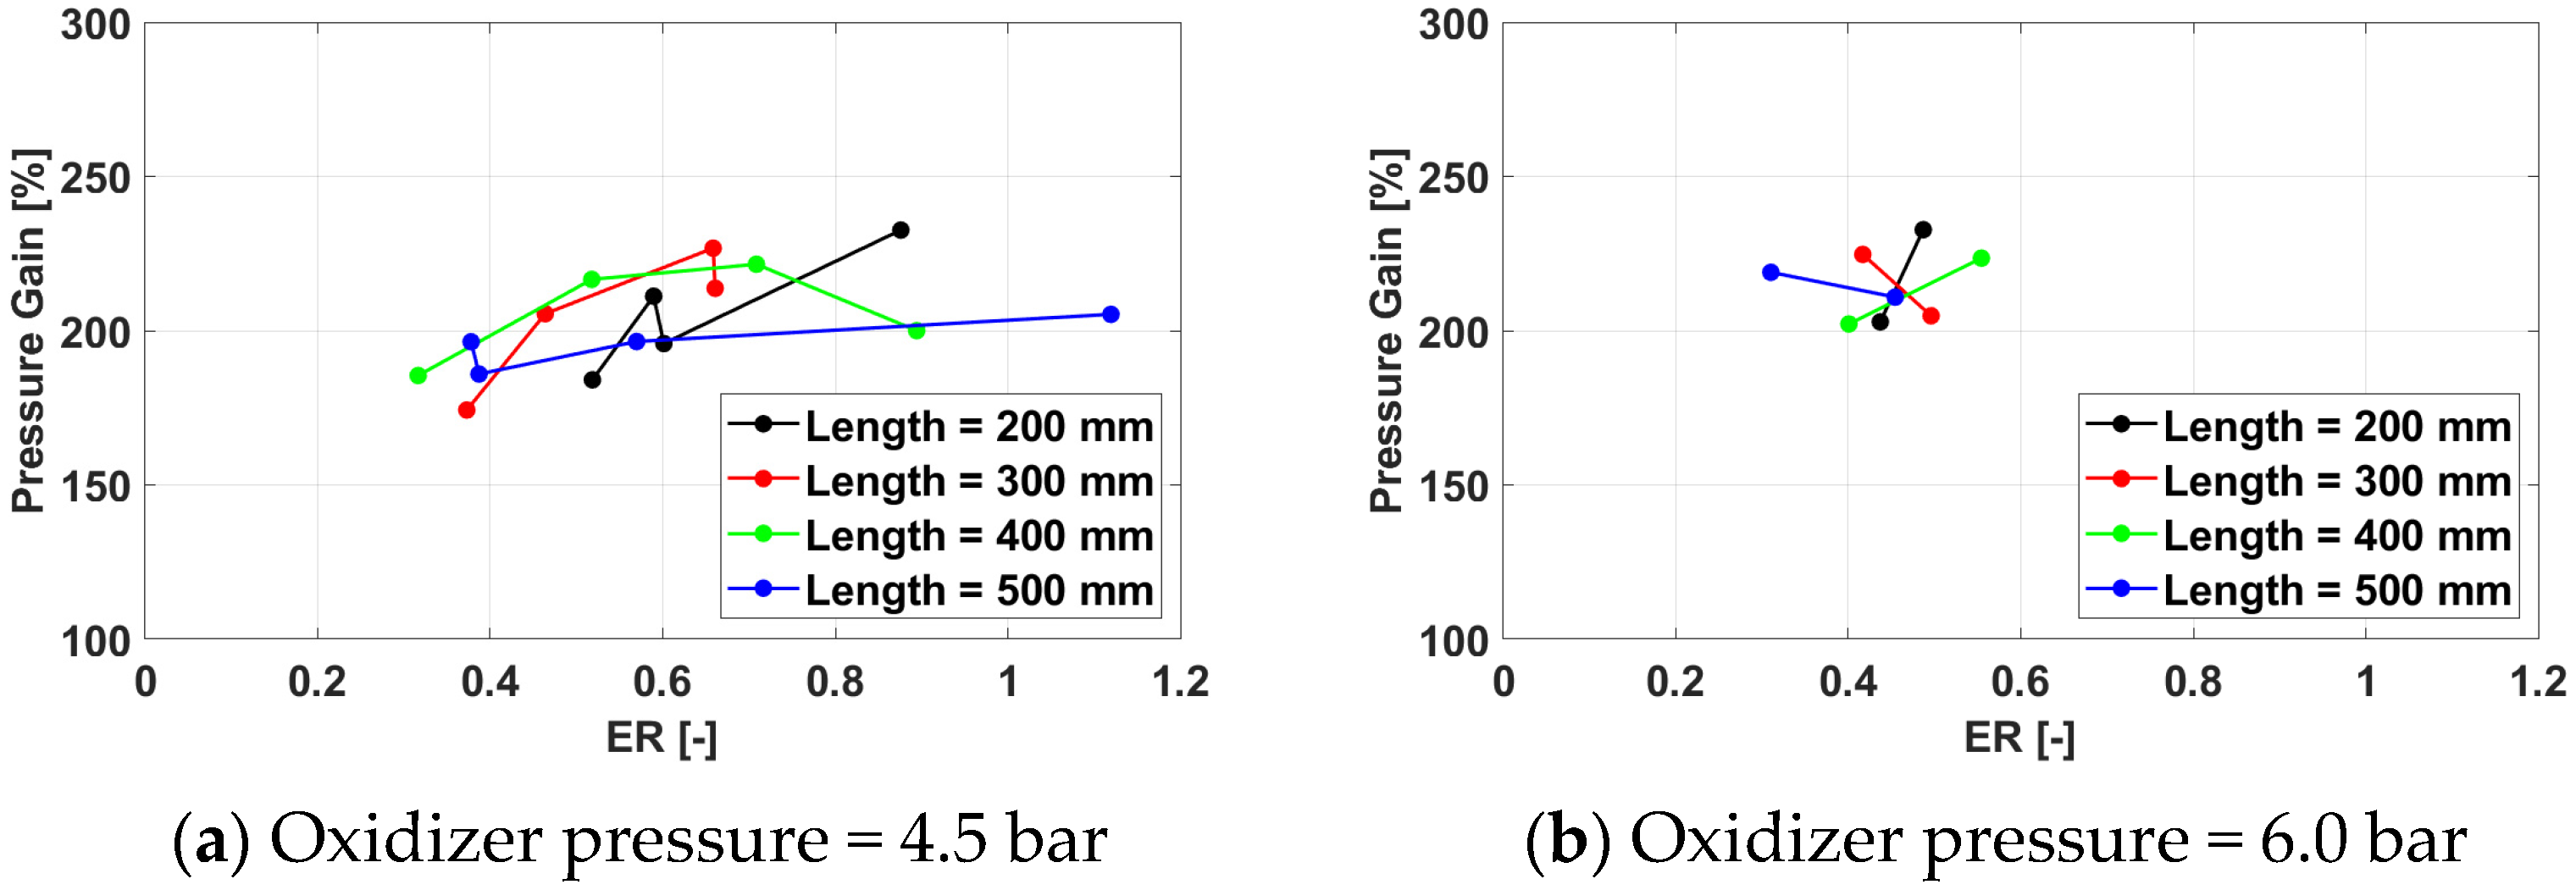
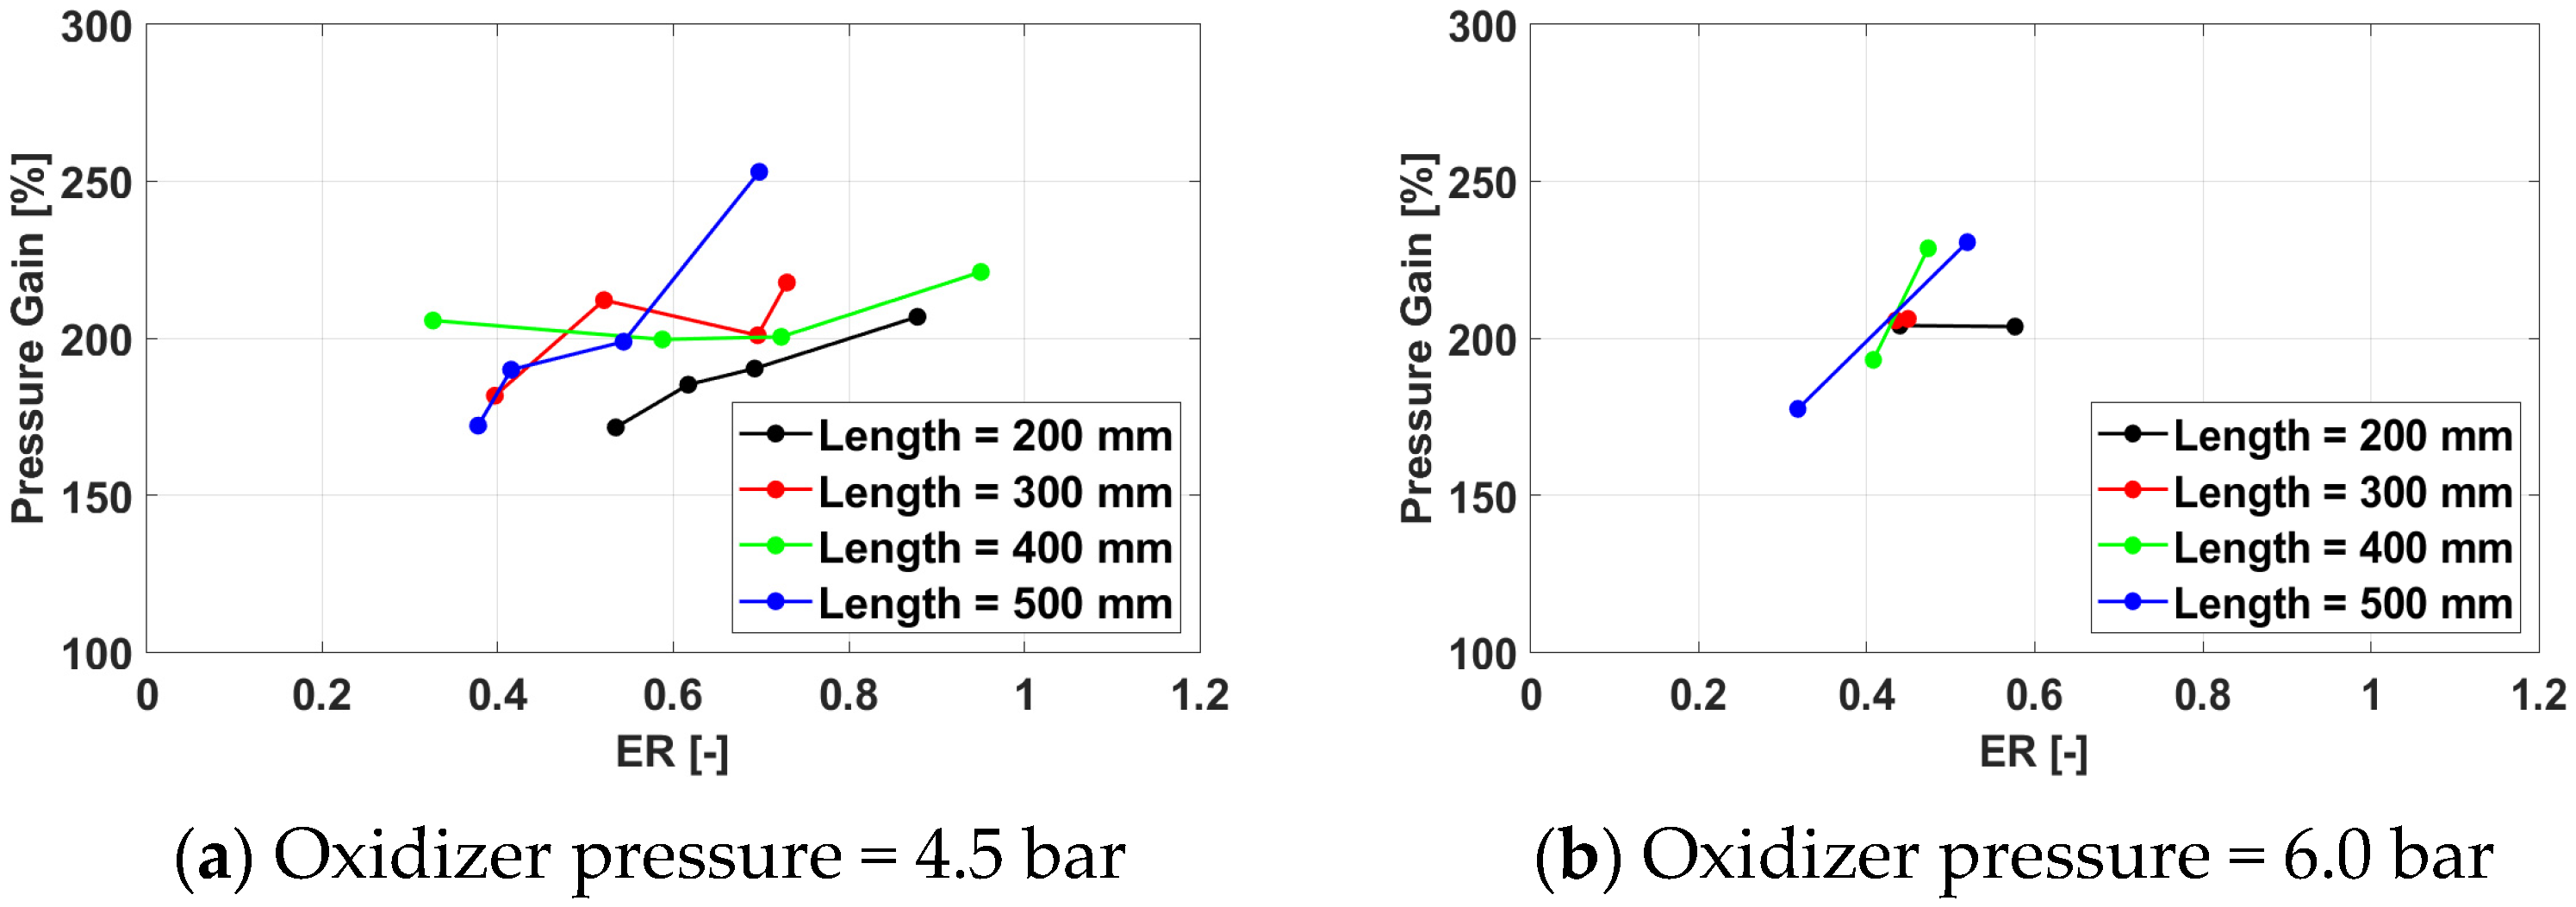
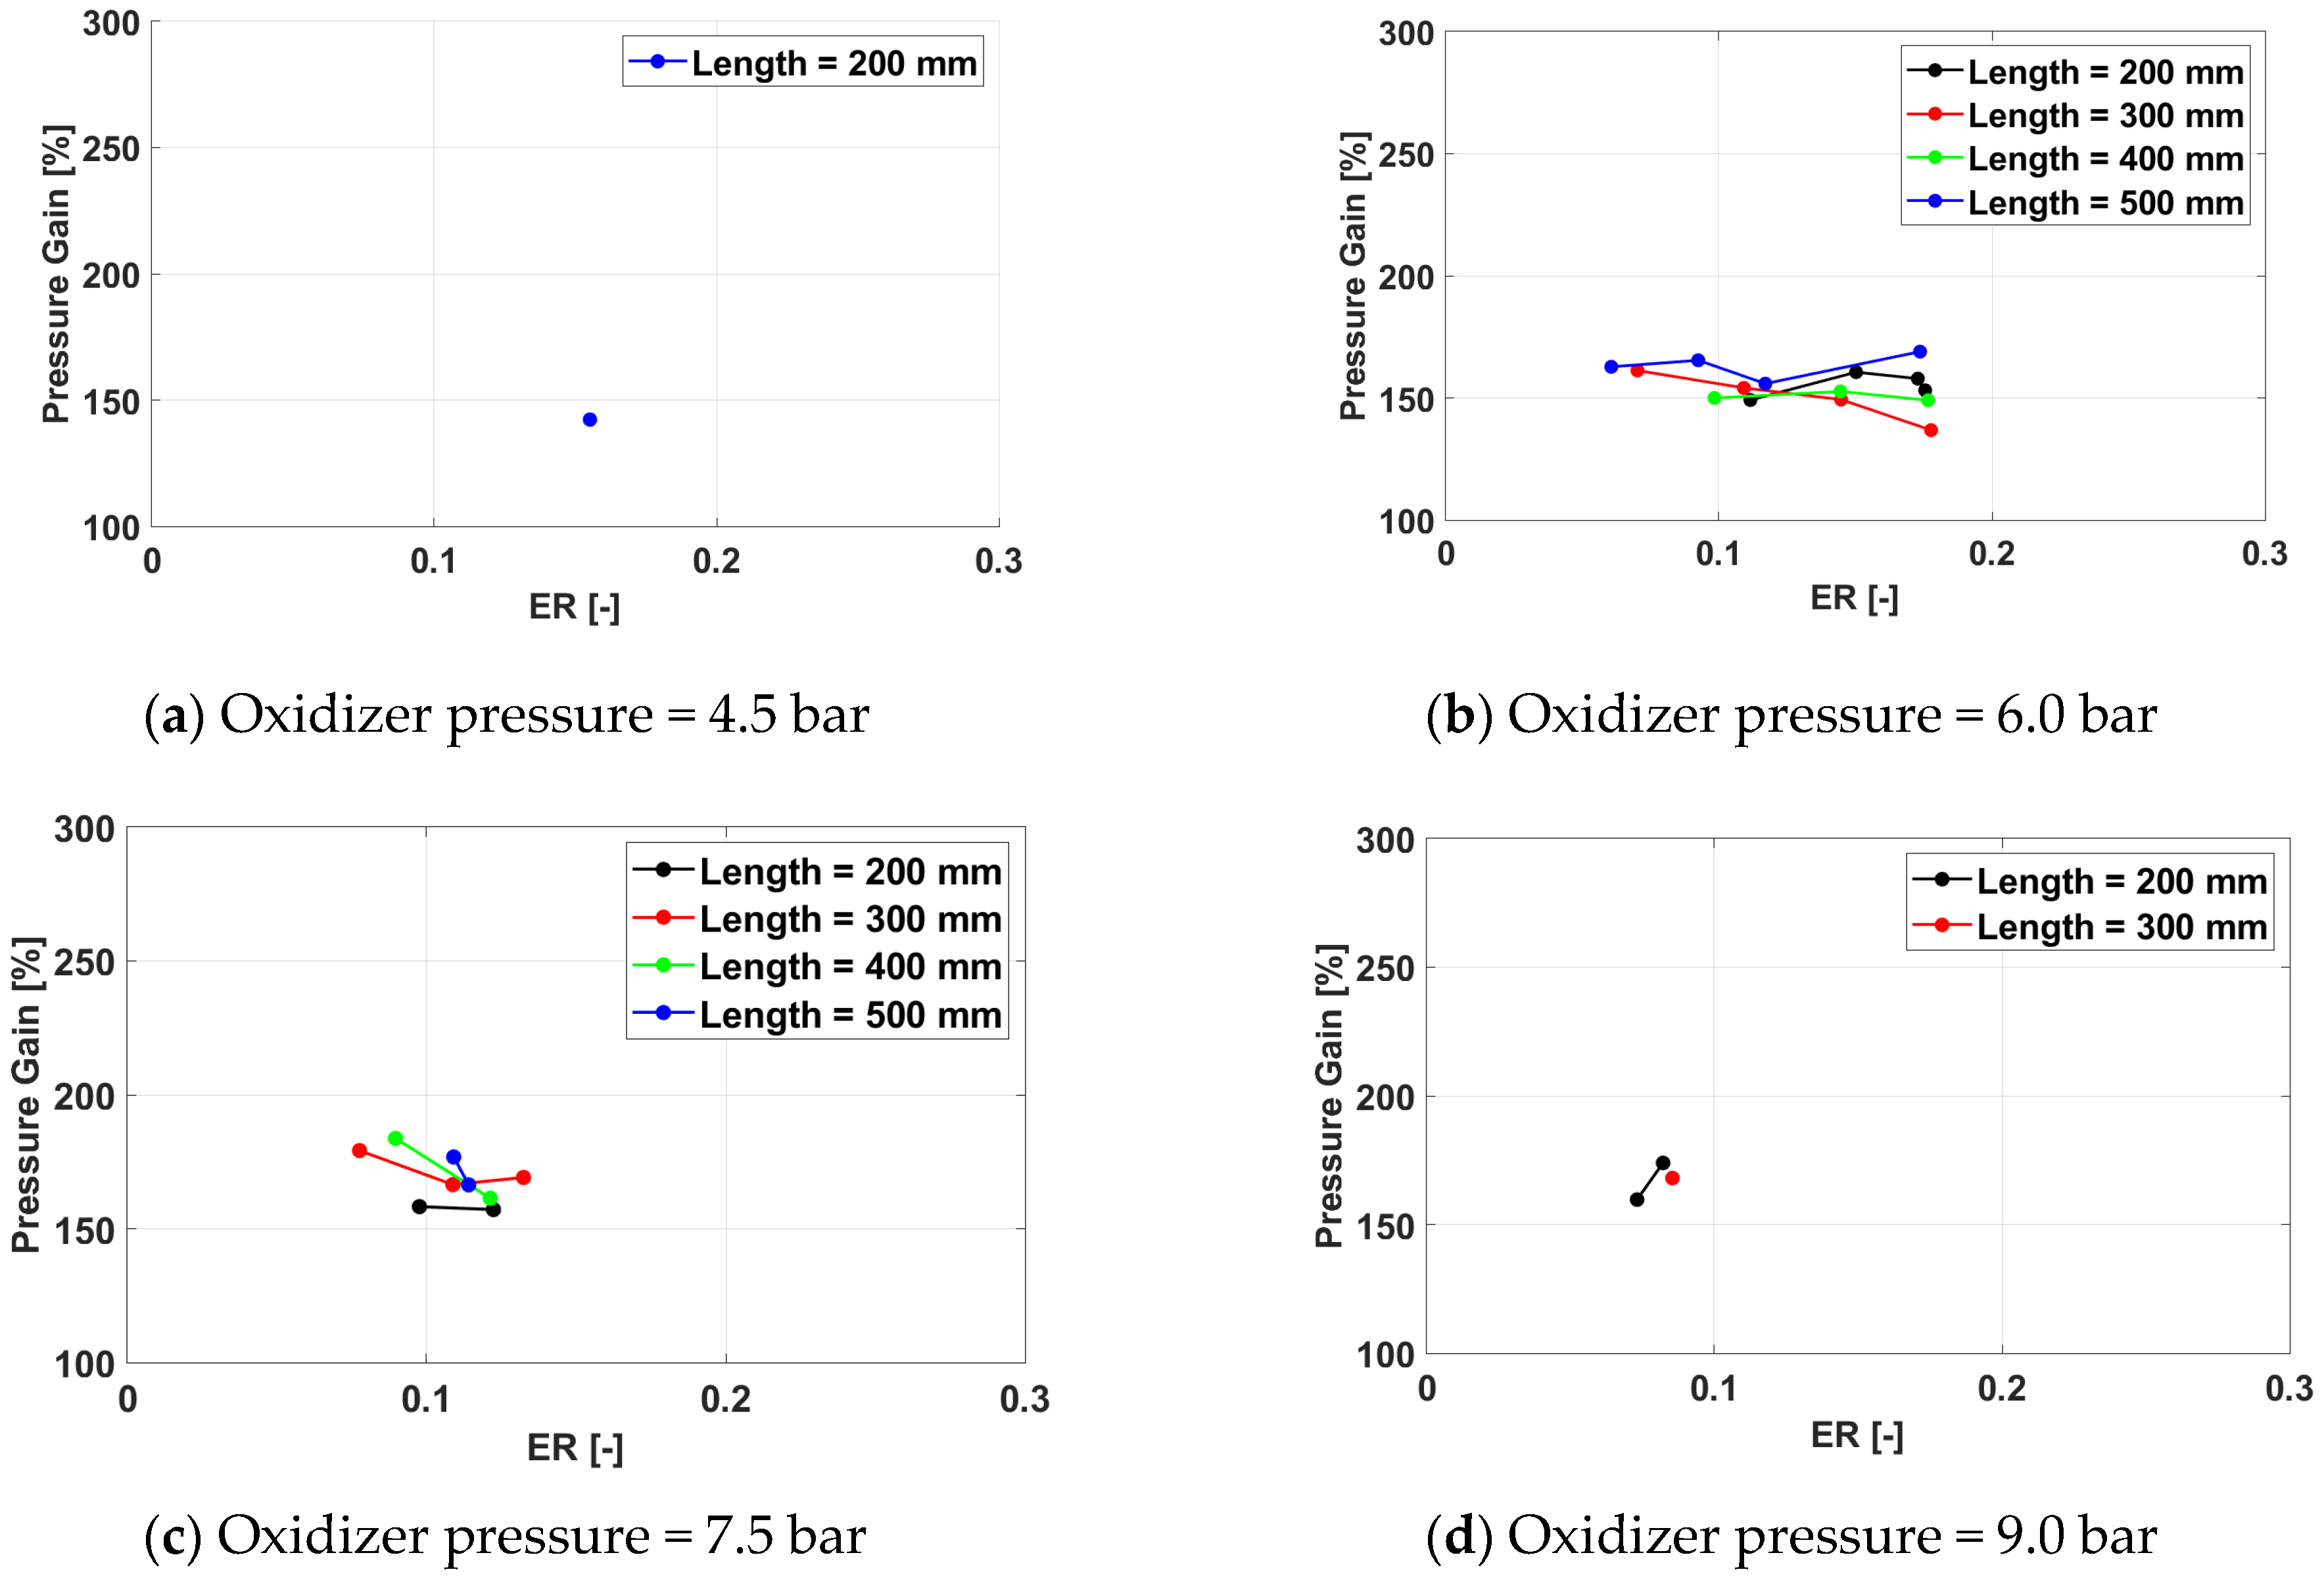
3.1.4. Pressure Gain
As a general trend, the pressure gain (Figure 21, Figure 22, Figure 23 and Figure 24) increases with the equivalence ratio as the amount of combustion-released chemical energy becomes larger. No consistent effect of the other parameters can be noted, except for a slight tendency to achieve higher pressure gain values at the design frequency of 100 Hz.
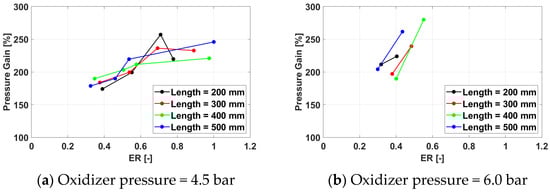
Figure 21.
Pressure gain for a frequency of 100 Hz for /air.
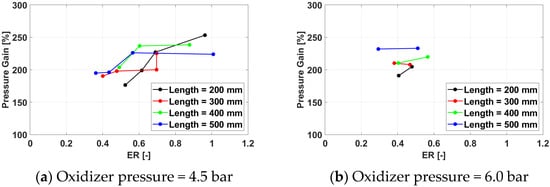
Figure 22.
Pressure gain for a frequency of 150 Hz for /air.
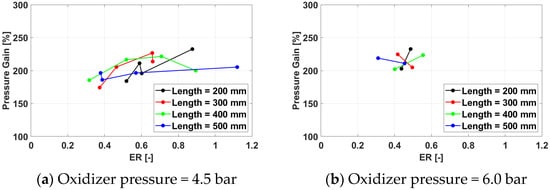
Figure 23.
Pressure gain for a frequency of 233 Hz for /air.
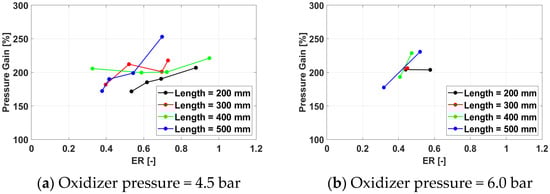
Figure 24.
Pressure gain for a frequency of 350 Hz for /air.
3.2. Hydrogen/Oxygen Operations
The subsection presents the results of the second experimental campaign, where the oxidizer was pure Oxygen.
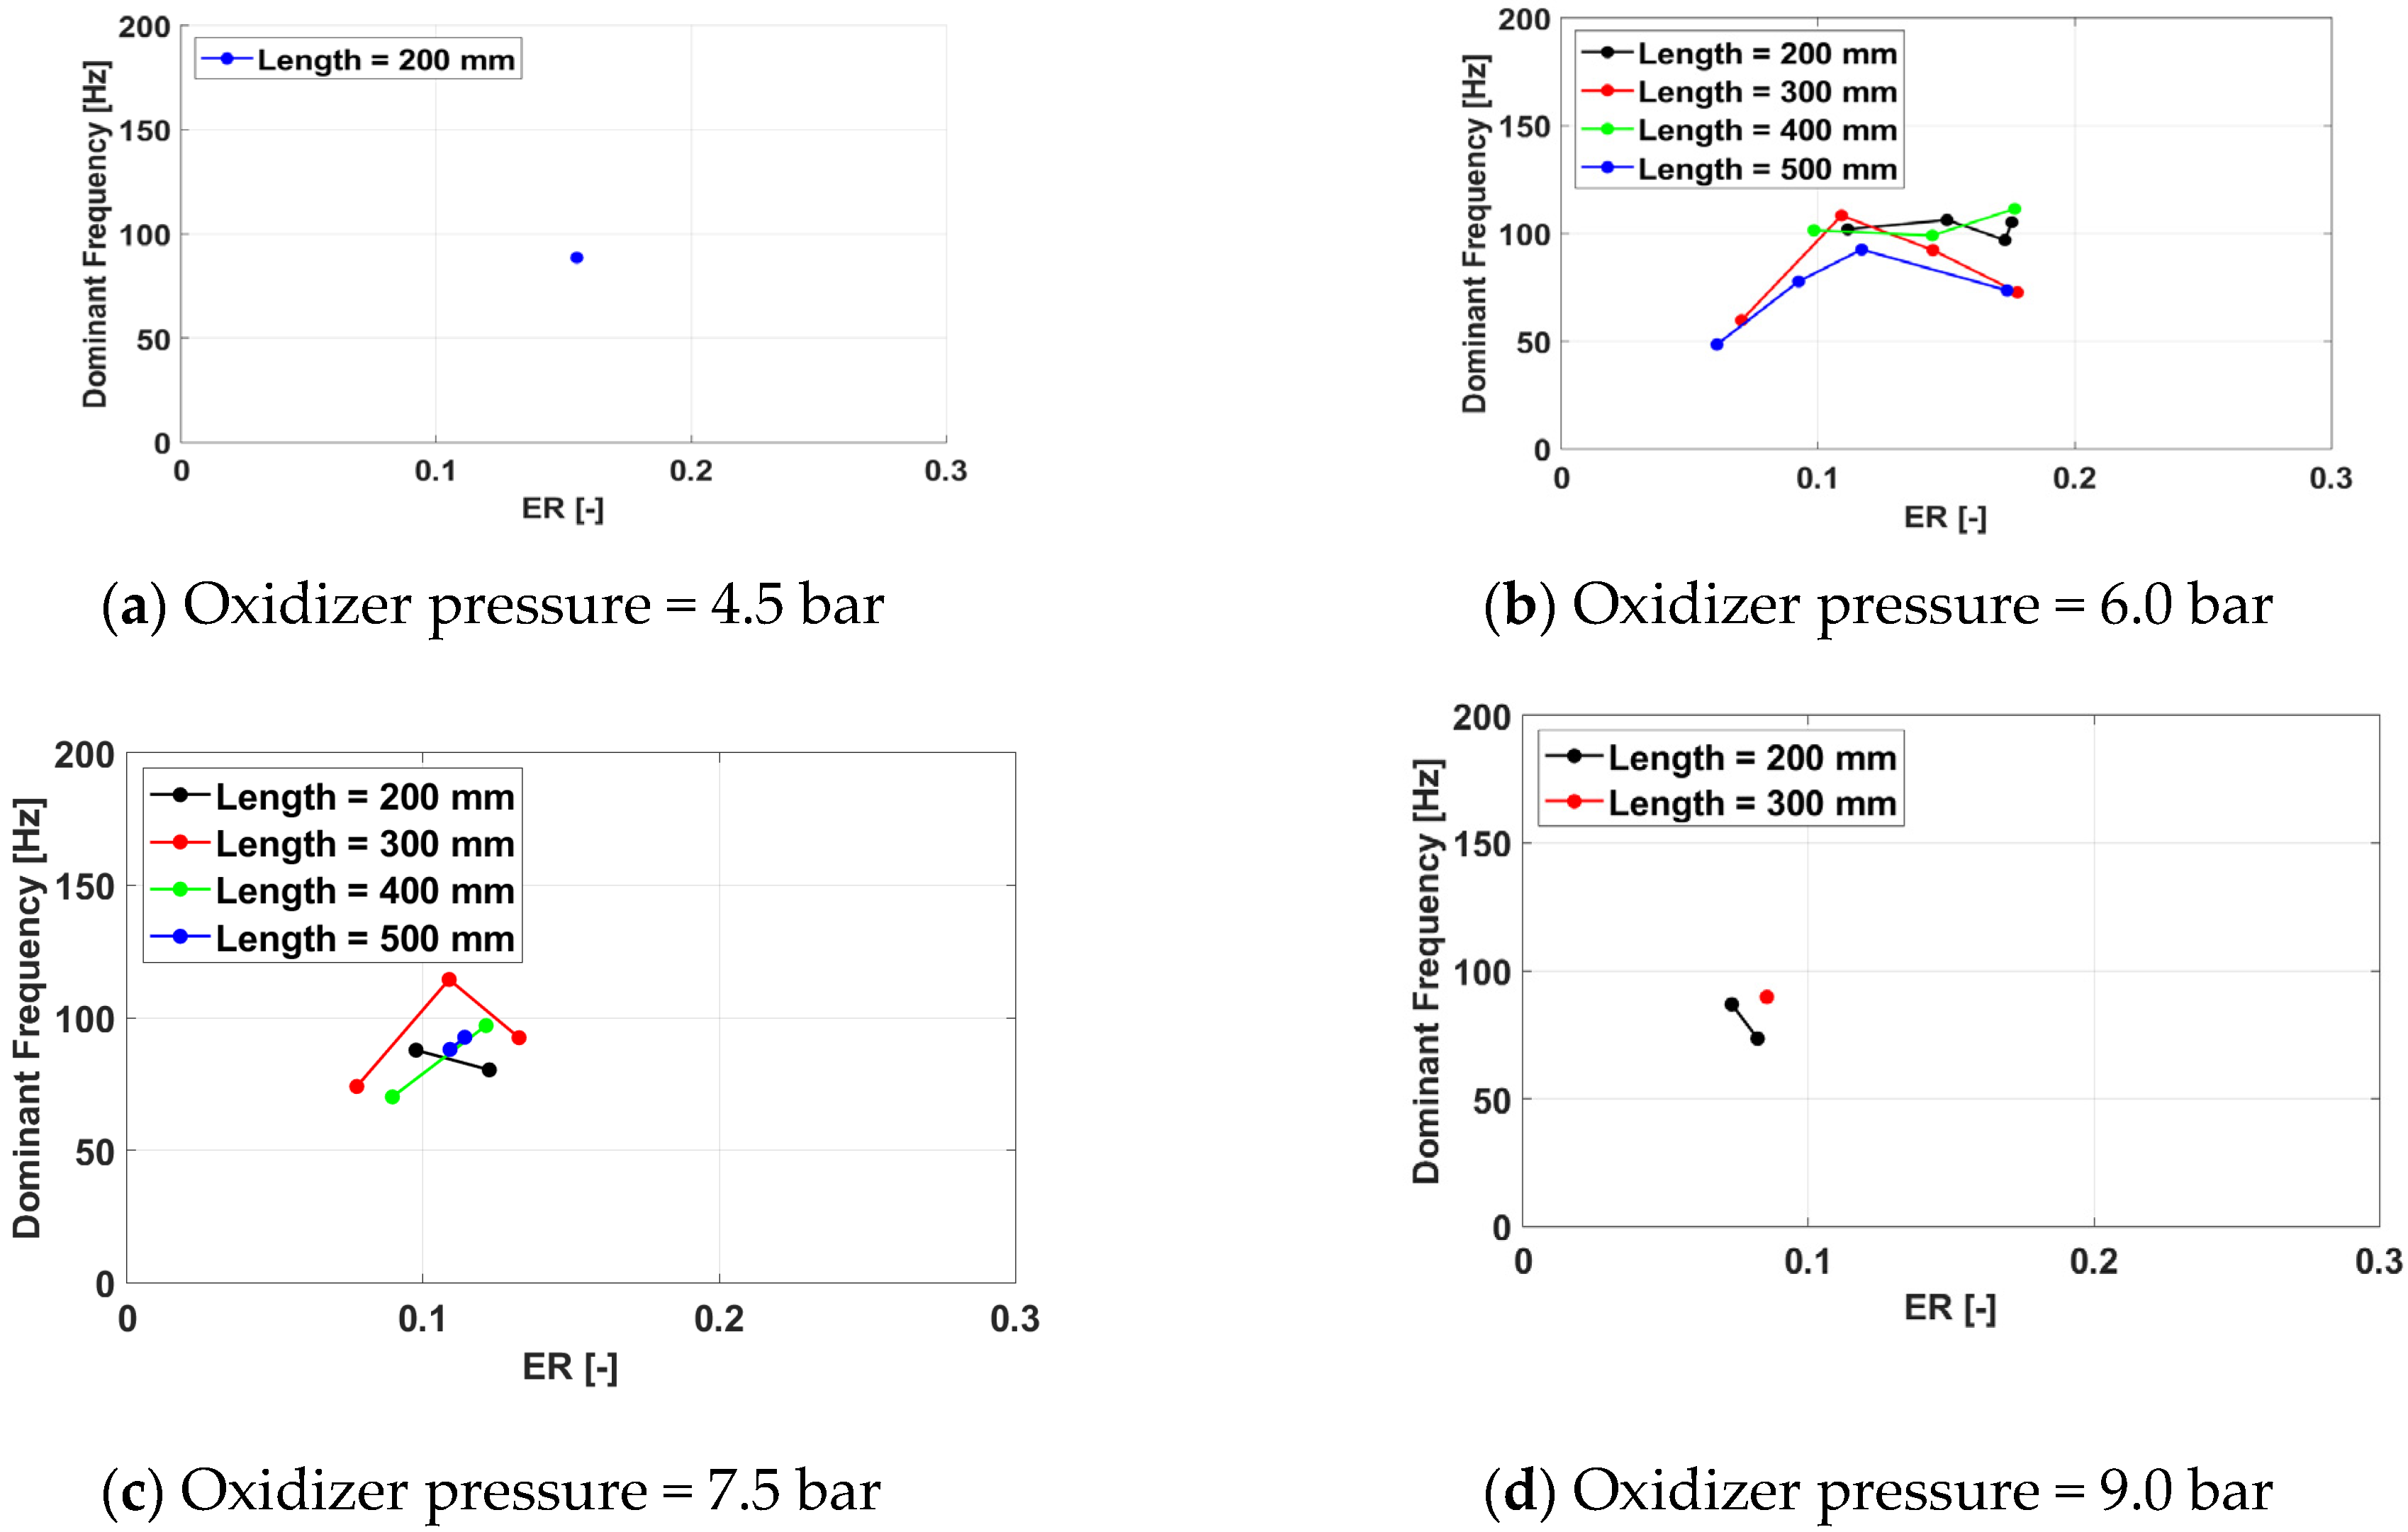
3.2.1. Average Cycle Pressure
Figure 25, Figure 26 and Figure 27 present the average cycle pressure variation with the equivalence ratio. For an oxidizer pressure of 4.5 bar, no sustained detonation cycles have been obtained for spark plug frequencies of 150 Hz and 233 Hz.
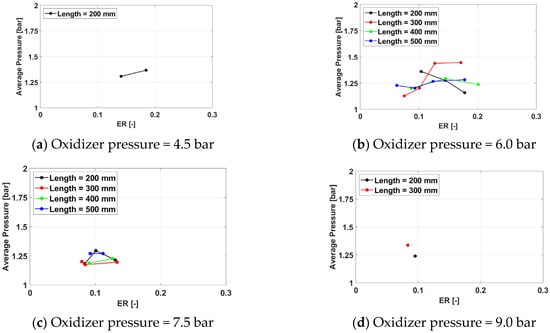
Figure 25.
Average cycle pressure for a frequency of 100 Hz for operation.

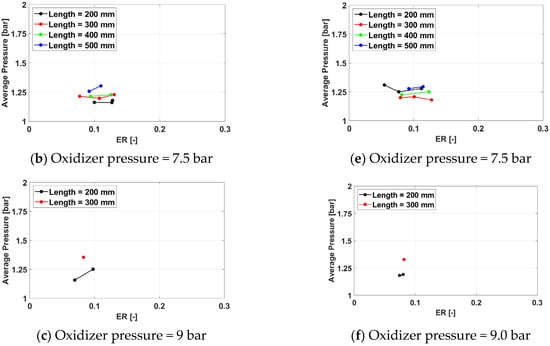
Figure 26.
Average cycle pressure for a frequency of 150 Hz (a–c) and 233 Hz (d–f) for operation.
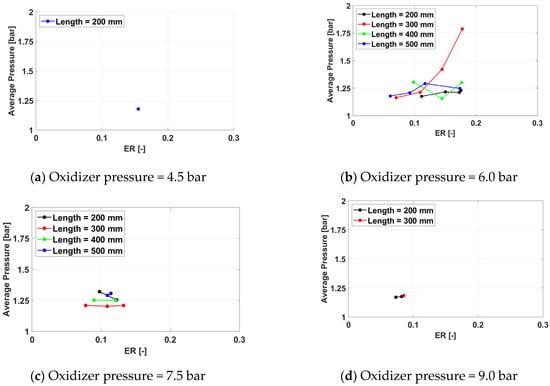
Figure 27.
Average cycle pressure for a frequency of 350 Hz for operation.
The trend of the average cycle pressure to increase, for the same equivalence ratio, with the oxidizer pressure and the exhaust pipe length is maintained from the previous experimental campaign. However, the equivalence ratios tested during the Oxygen campaign were much lower, and the range significantly reduced when compared with the air campaign as an effect of maintaining the same fuel and oxidizer pressure range and the larger stoichiometric fuel-to-air mass ratio for the Oxygen/Hydrogen system in comparison with the air/Hydrogen system. As an effect of the small range of equivalence ratios that have been tested in this campaign, an optimal equivalence ratio for the average cycle pressure is less visible. When present, the same trend identified in the air is preserved: the value of the optimal equivalence ratio decreases with the length of the exhaust pipe, while the value of the average cycle pressure for the same equivalence ratio increases with the exhaust pipe length. This situation occurs also for the lower oxidizer pressure values (in this case, 6.0 bar).
For higher oxidizer pressures (7.5 bar), though, the trend is reversed, and a minimum point for the average cycle pressure is recorded; as for extremely low equivalence ratios below 0.1, the average cycle pressure increases. Because the oxidizer pressure is high in these cases, it results in that the fuel mass flow rate is very small here. Further investigations into the PDC behavior in this region are needed to understand the effect. The effect of the spark plug frequency remains marginal.
Overall, the highest average cycle pressure is 1.78 bar, obtained for Test ID 1332, defined by an exhaust pipe length of 300 mm, a spark plug frequency of 350 Hz, an oxidizer line pressure of 6 bar, and a fuel line pressure of 10 bar. The average pressure value is higher than the optimal one for the air campaign due to the more energetic chemical reactions specific to the Hydrogen/Oxygen system.
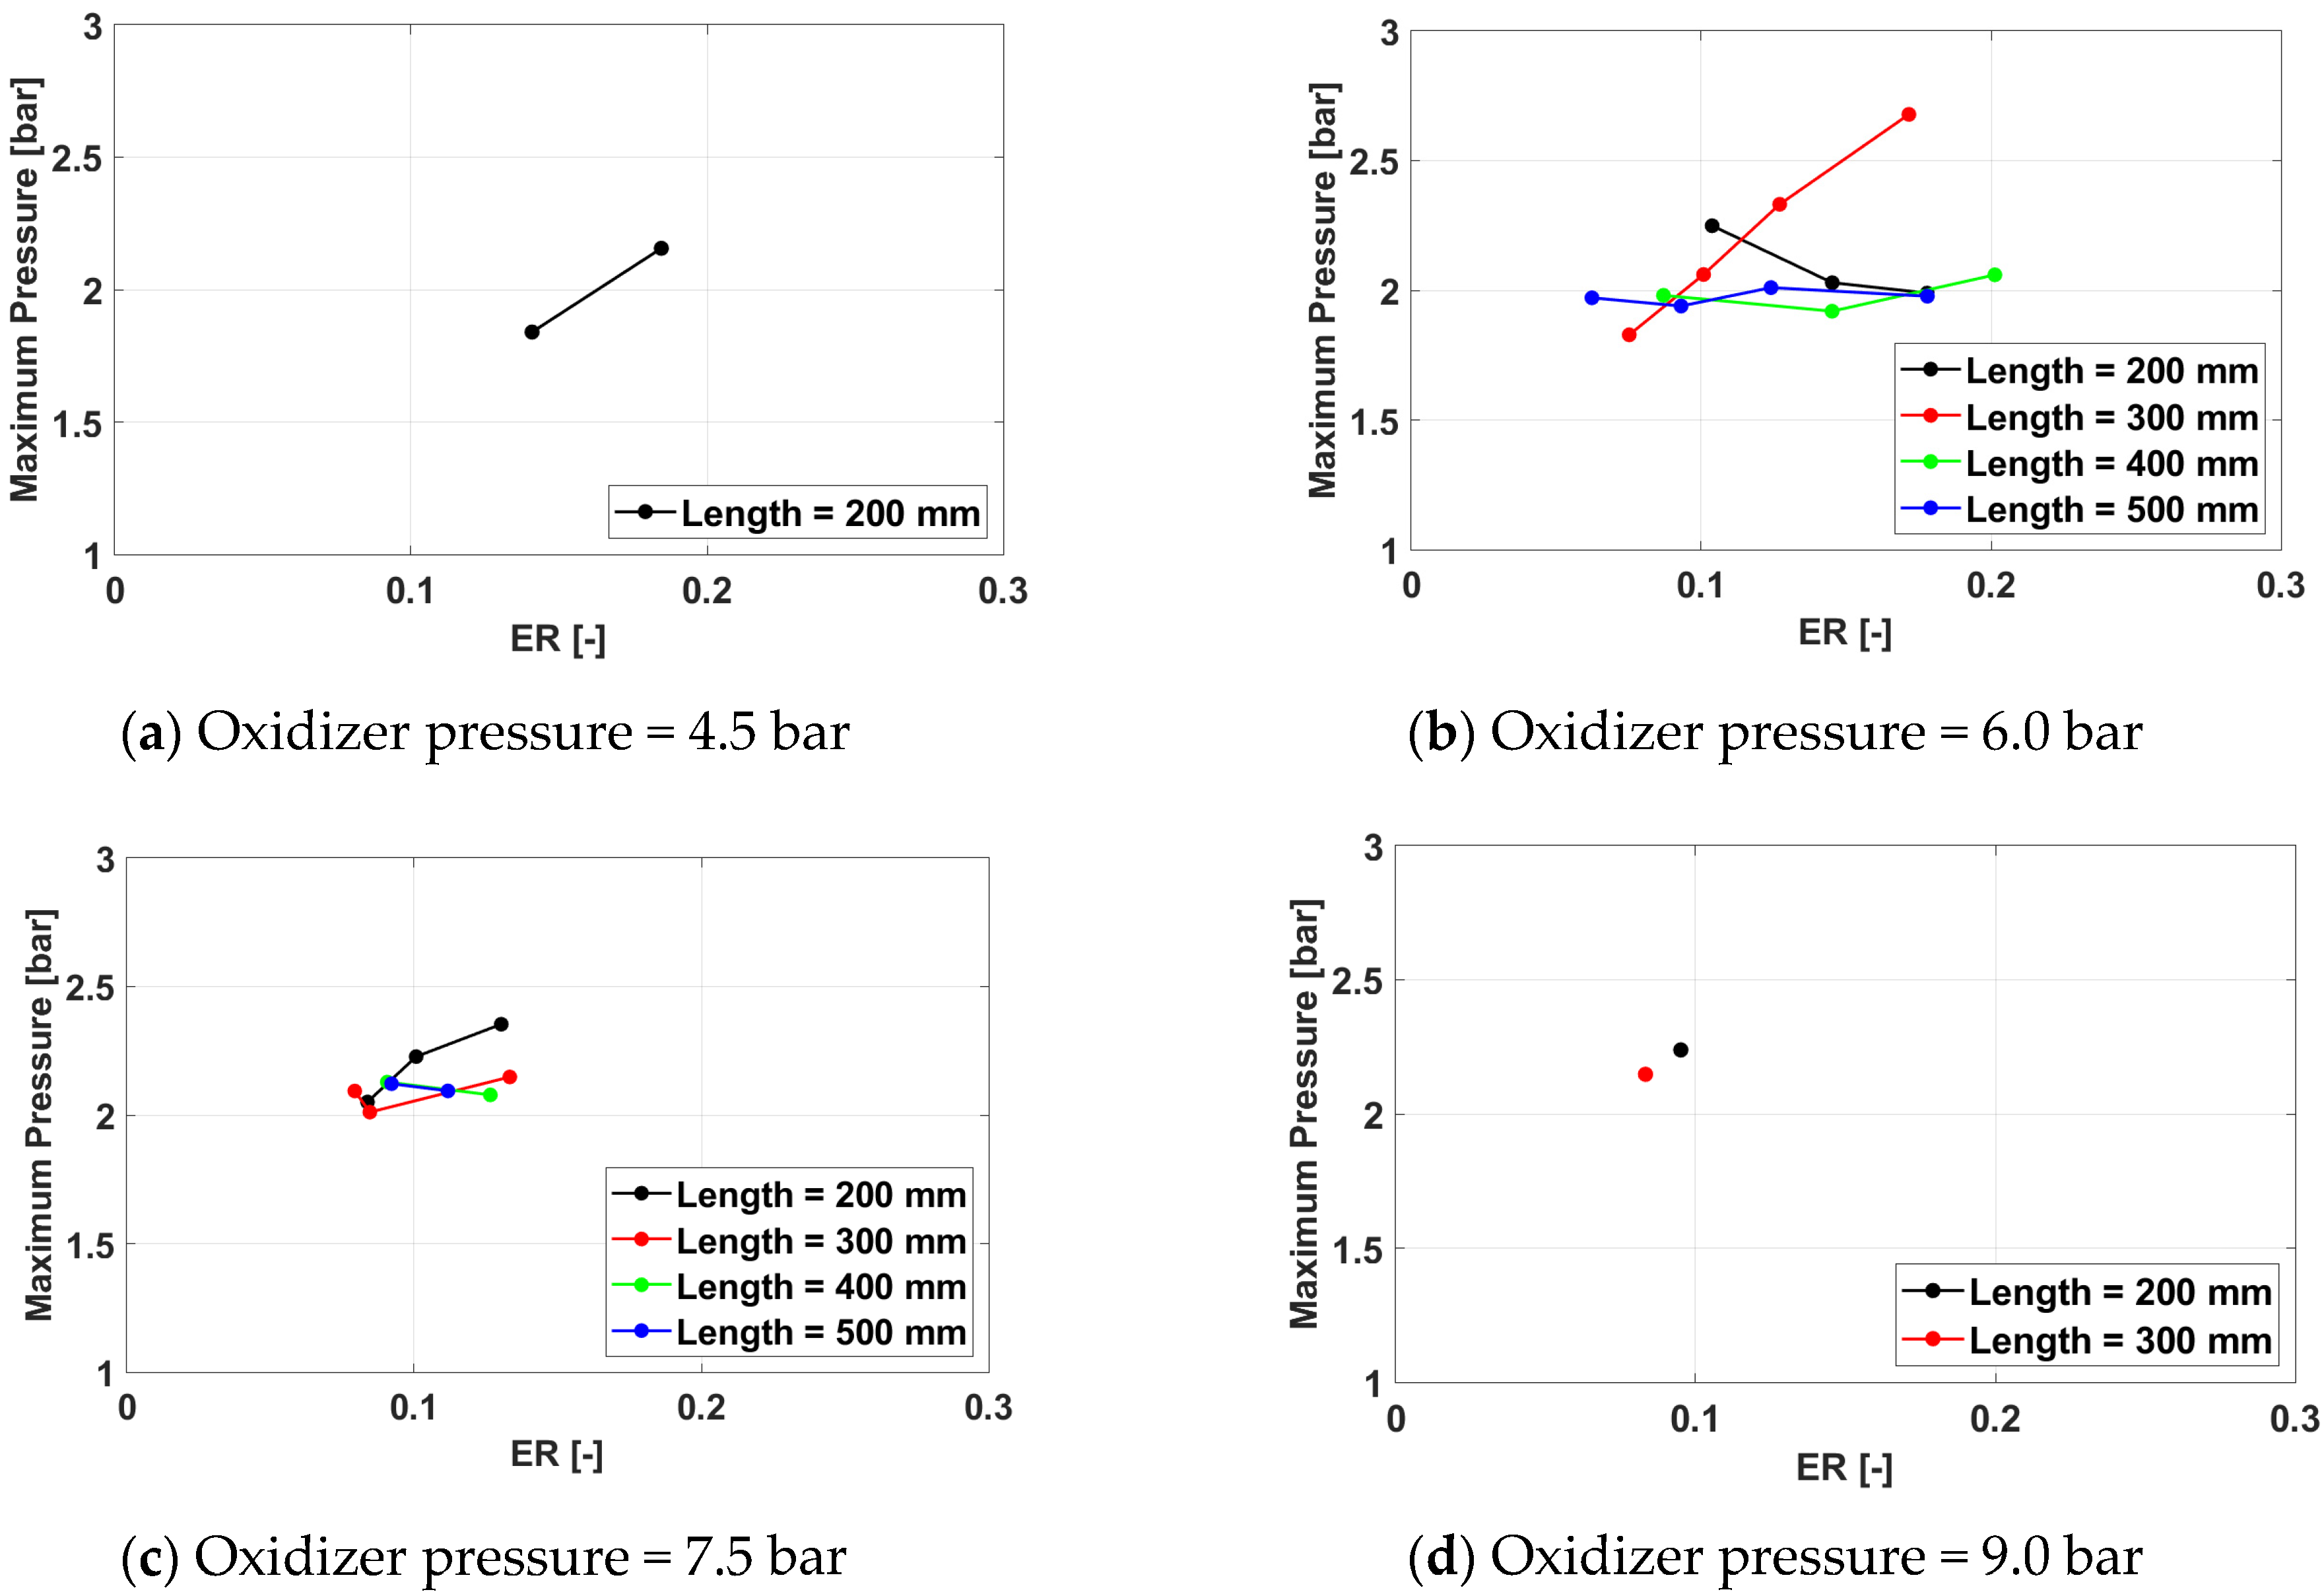
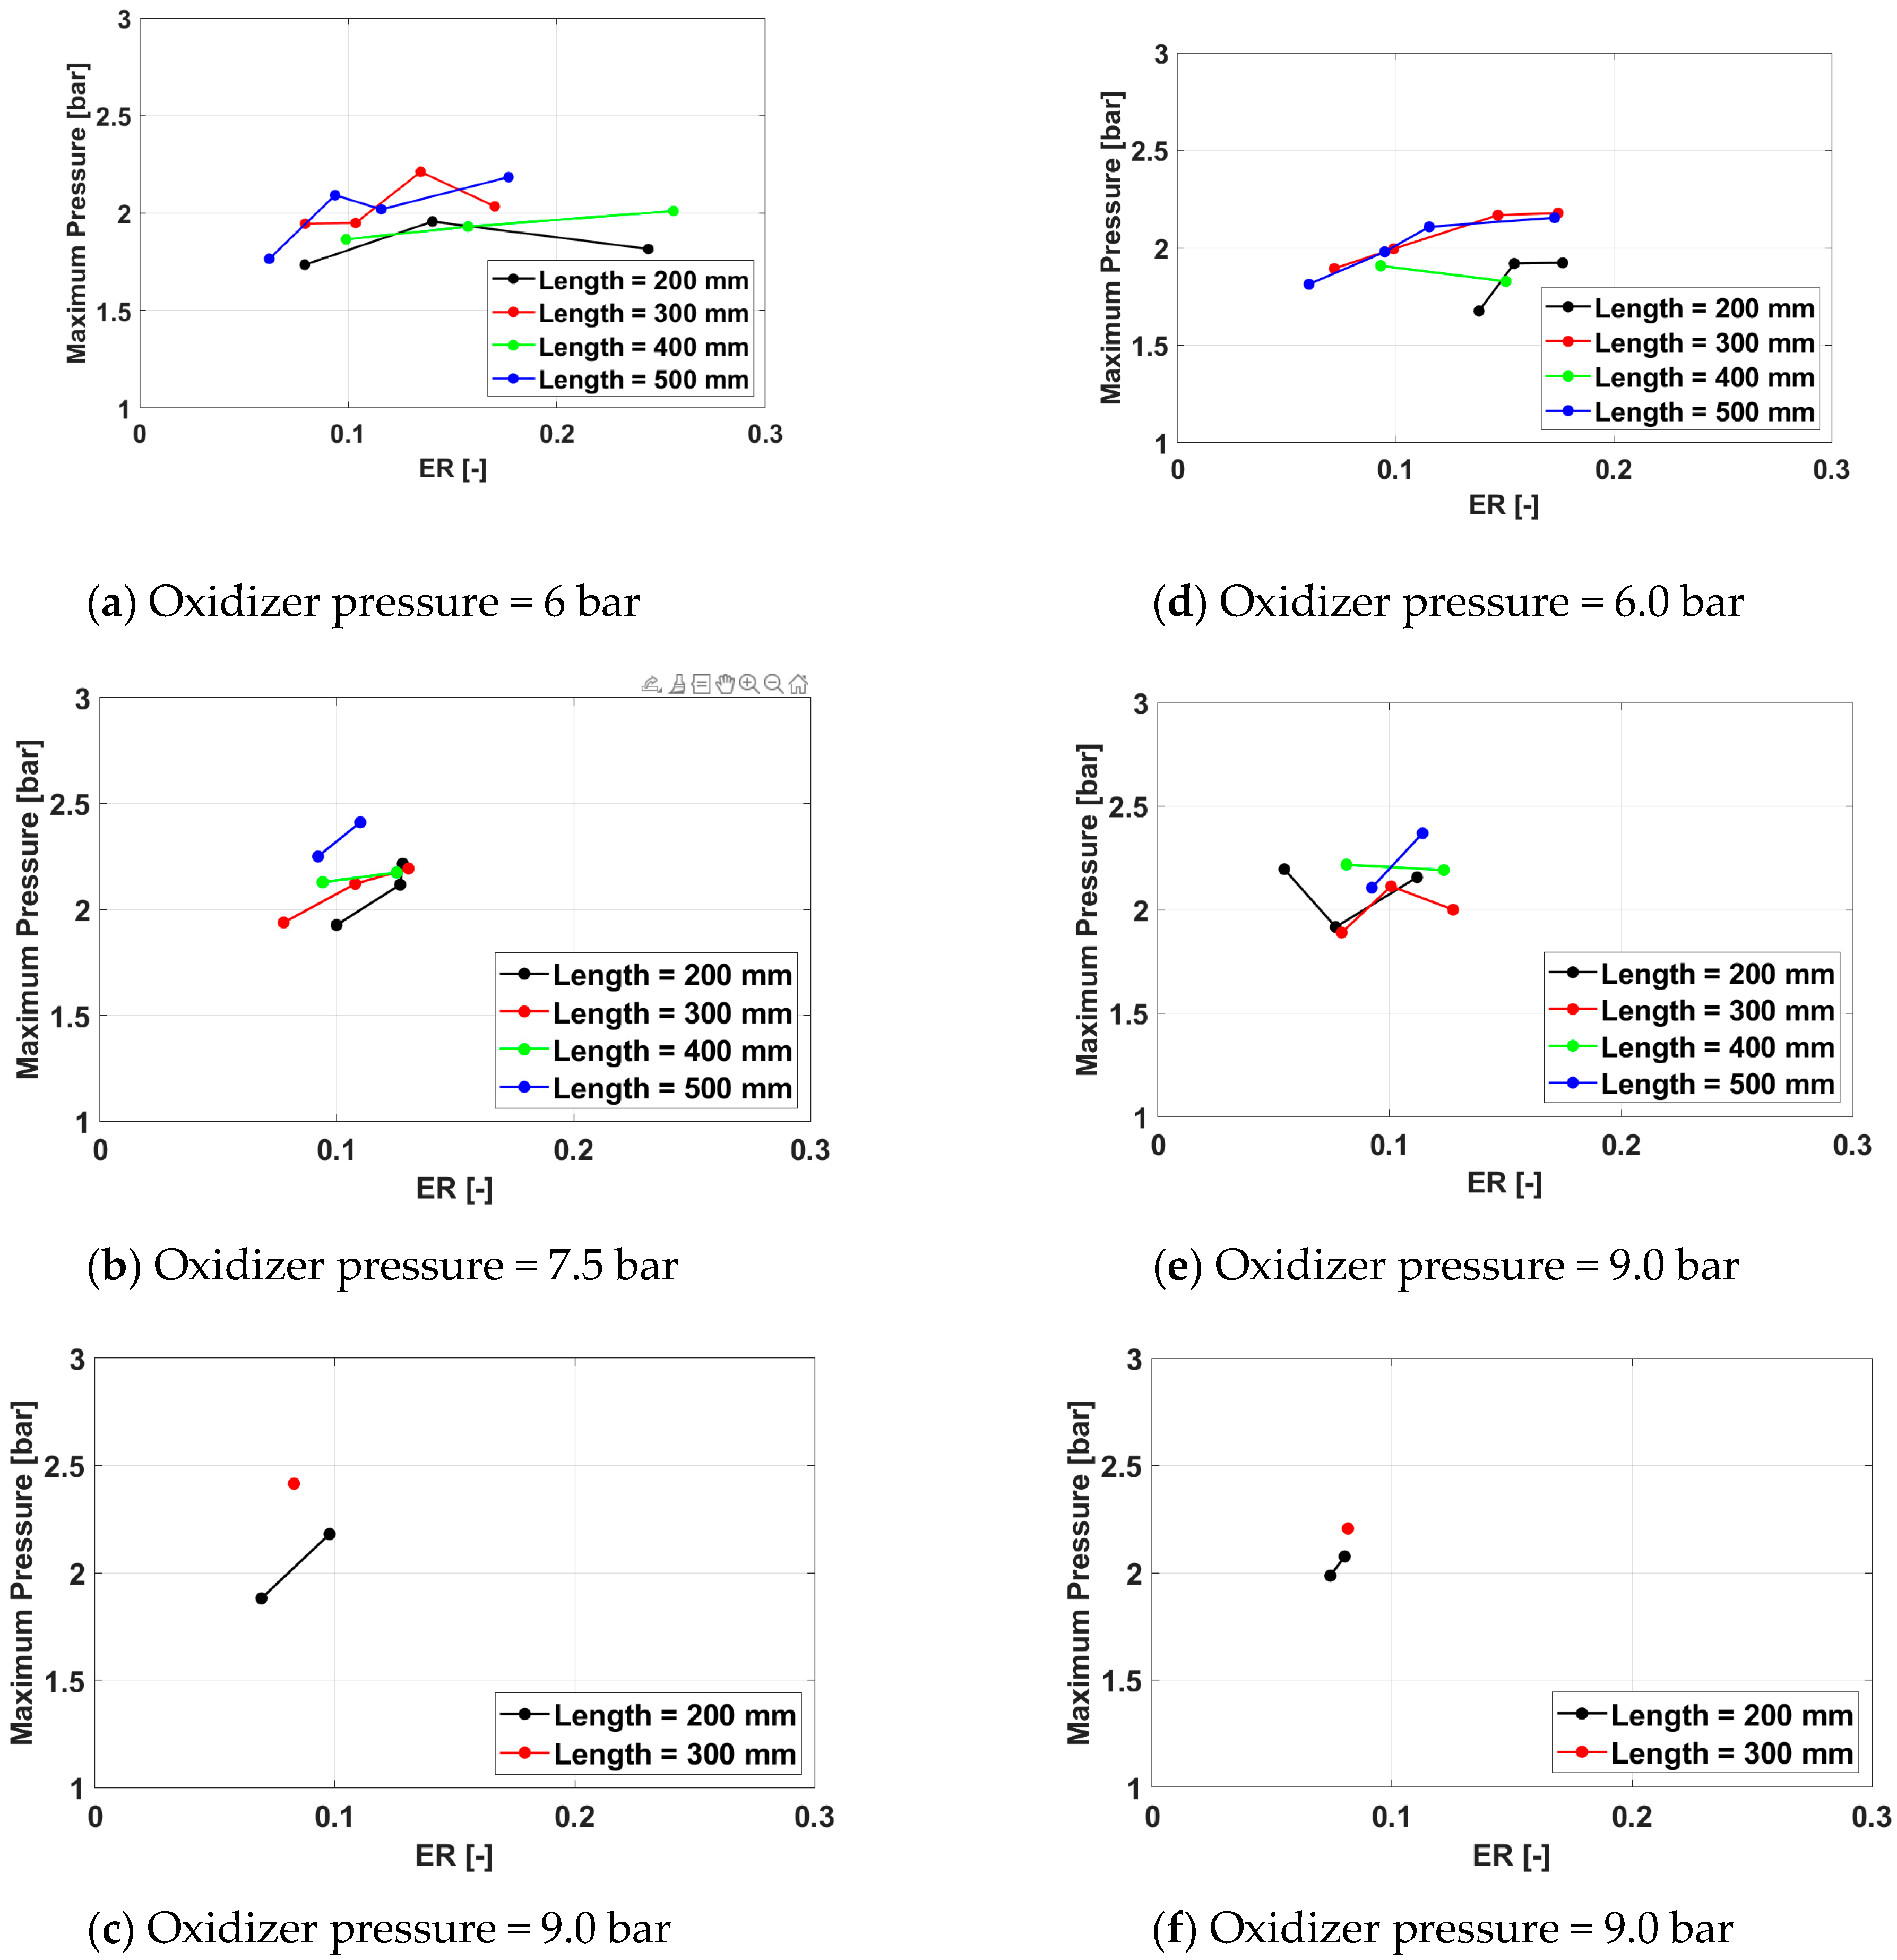
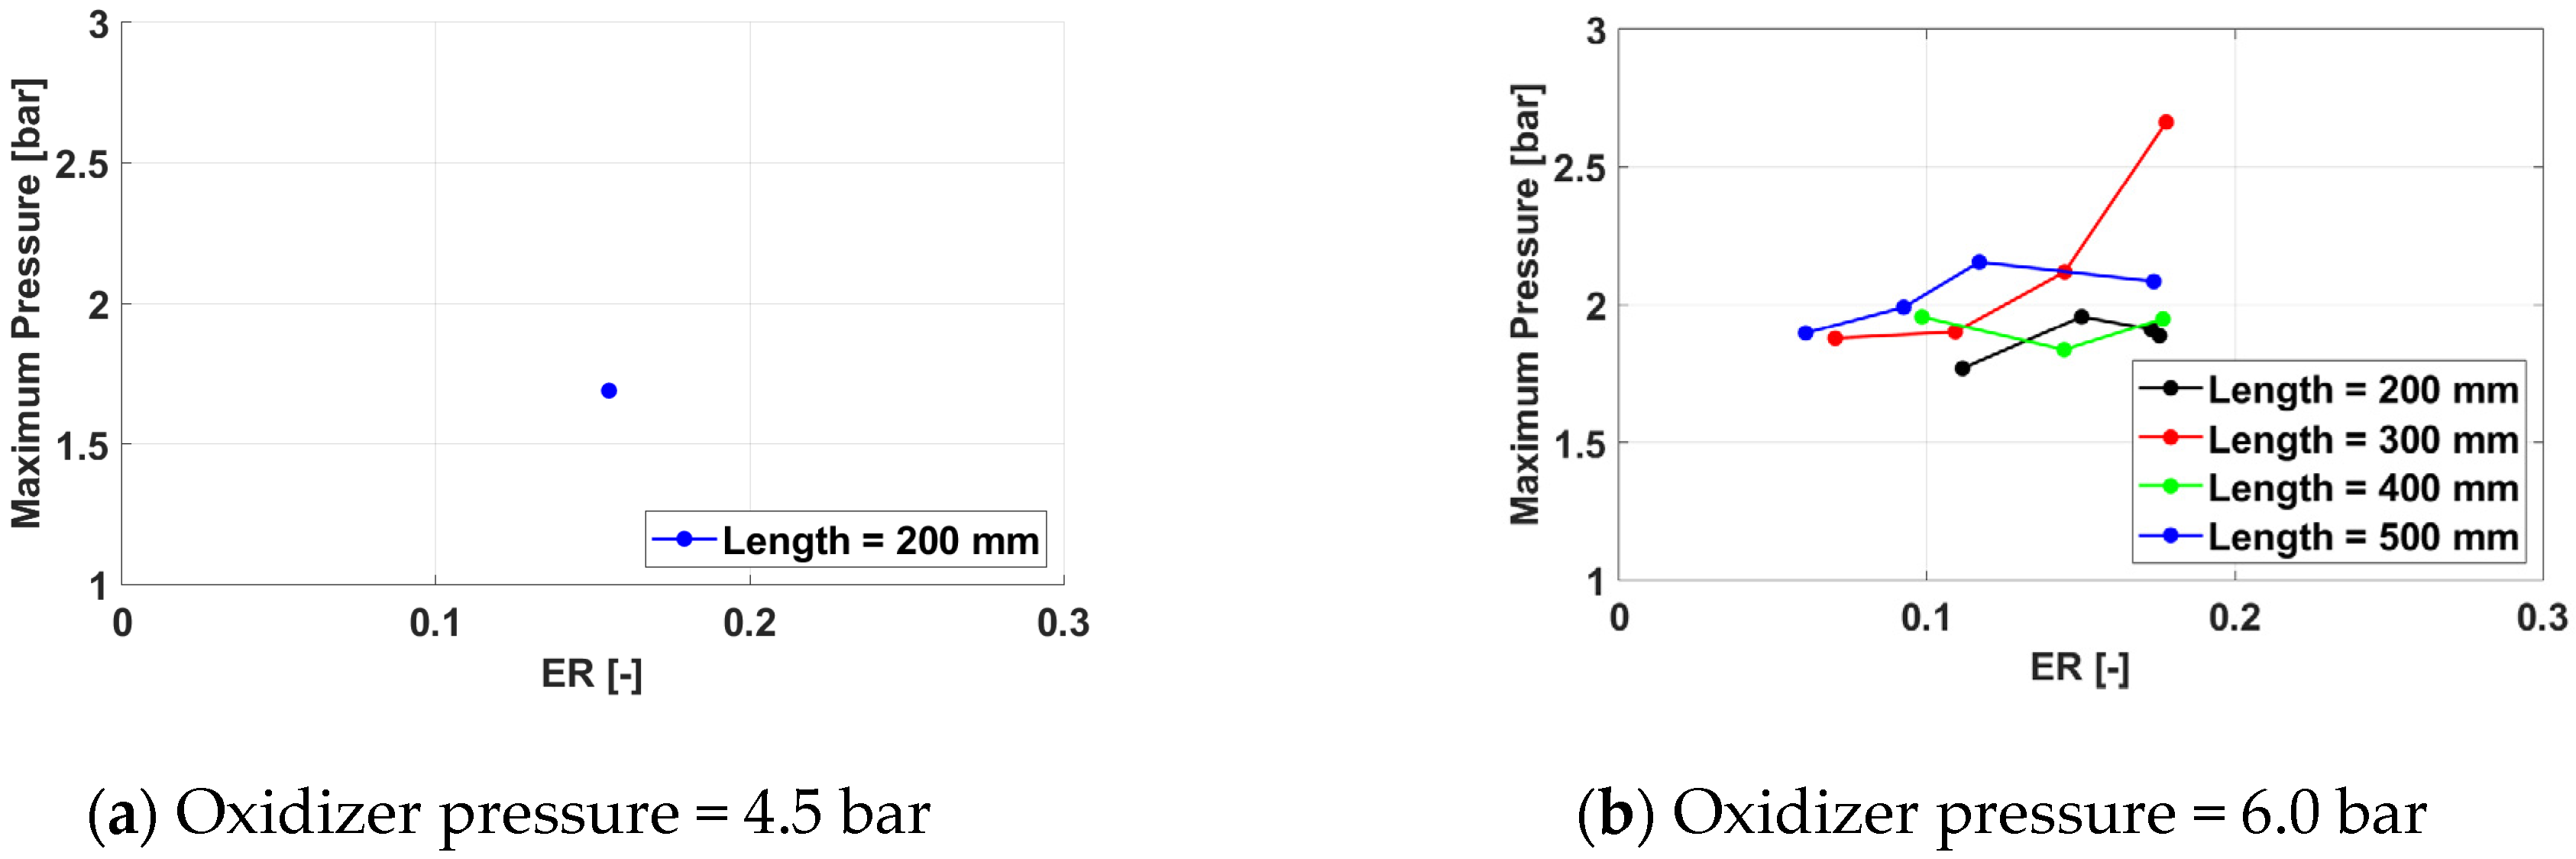
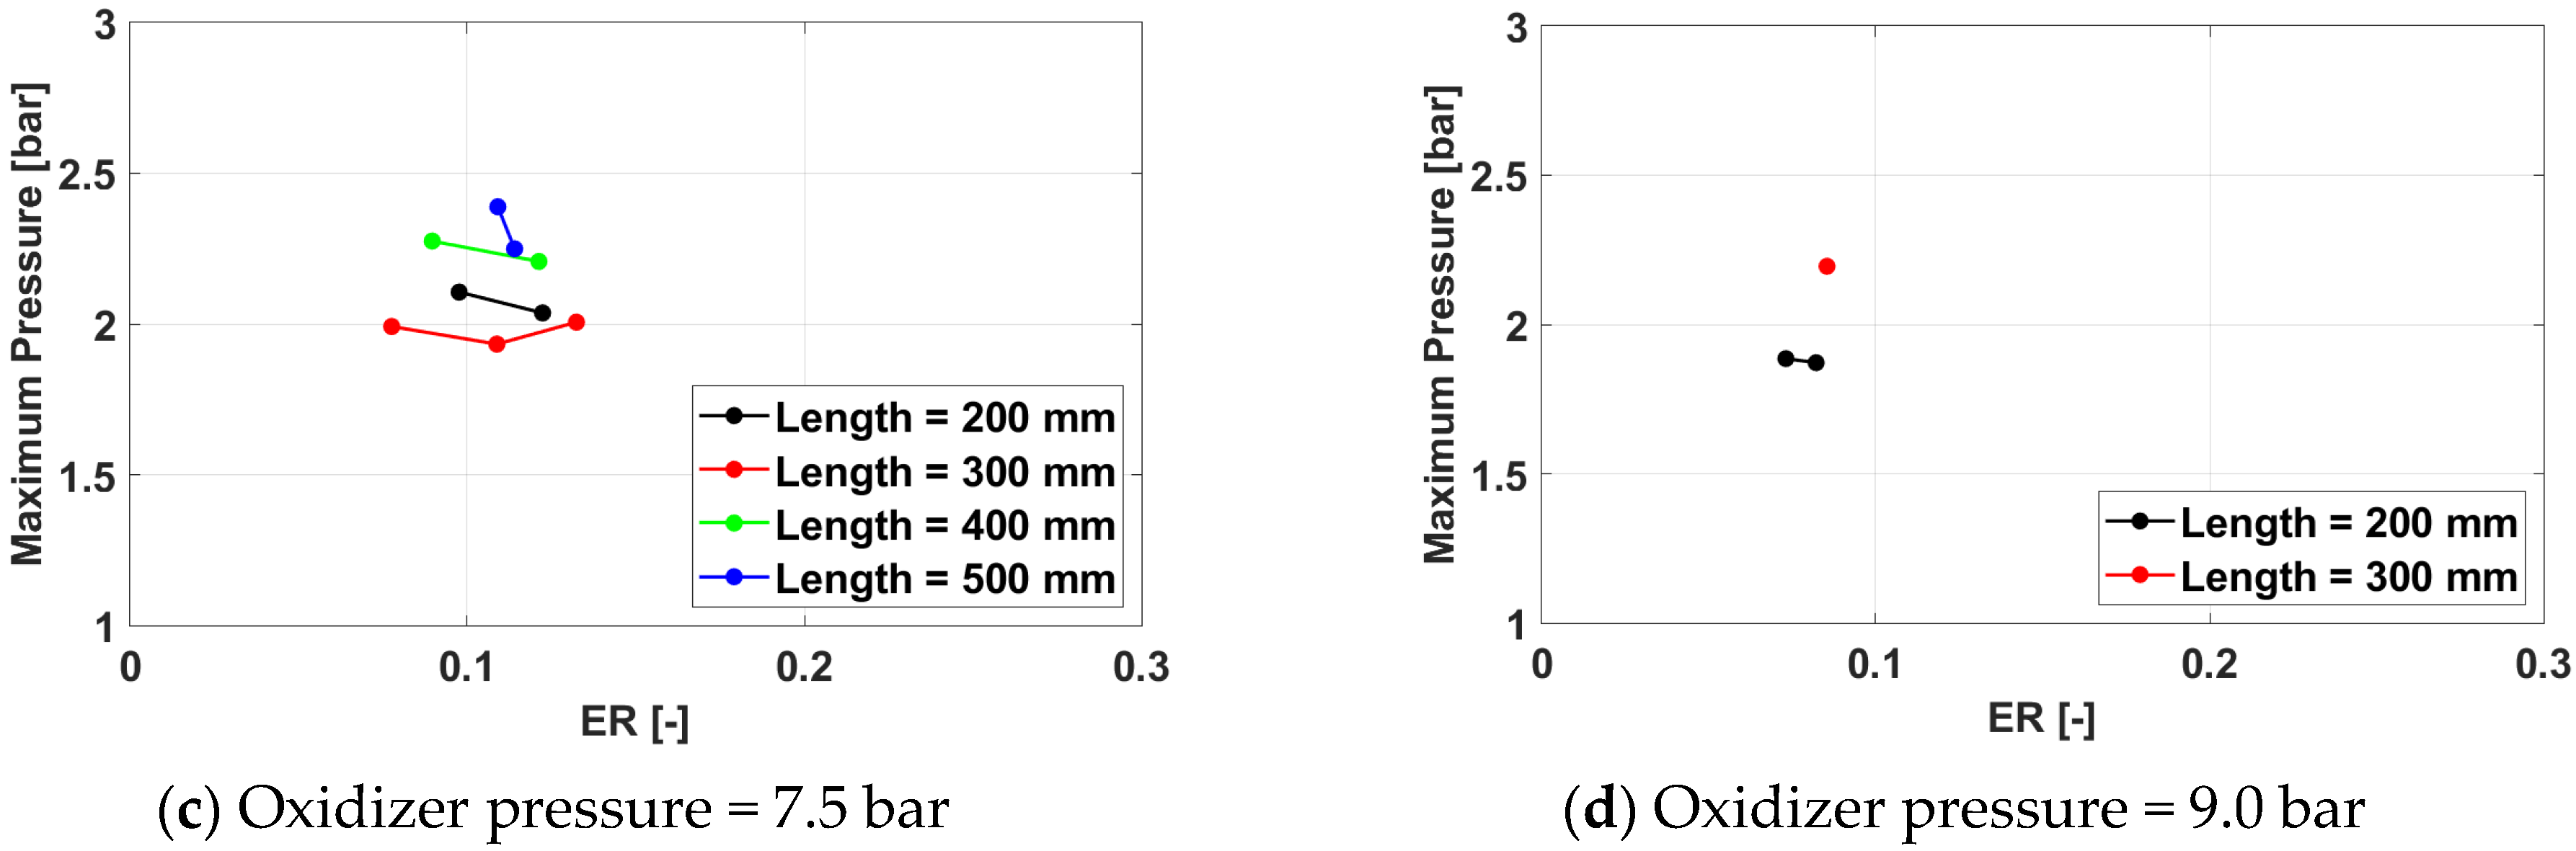
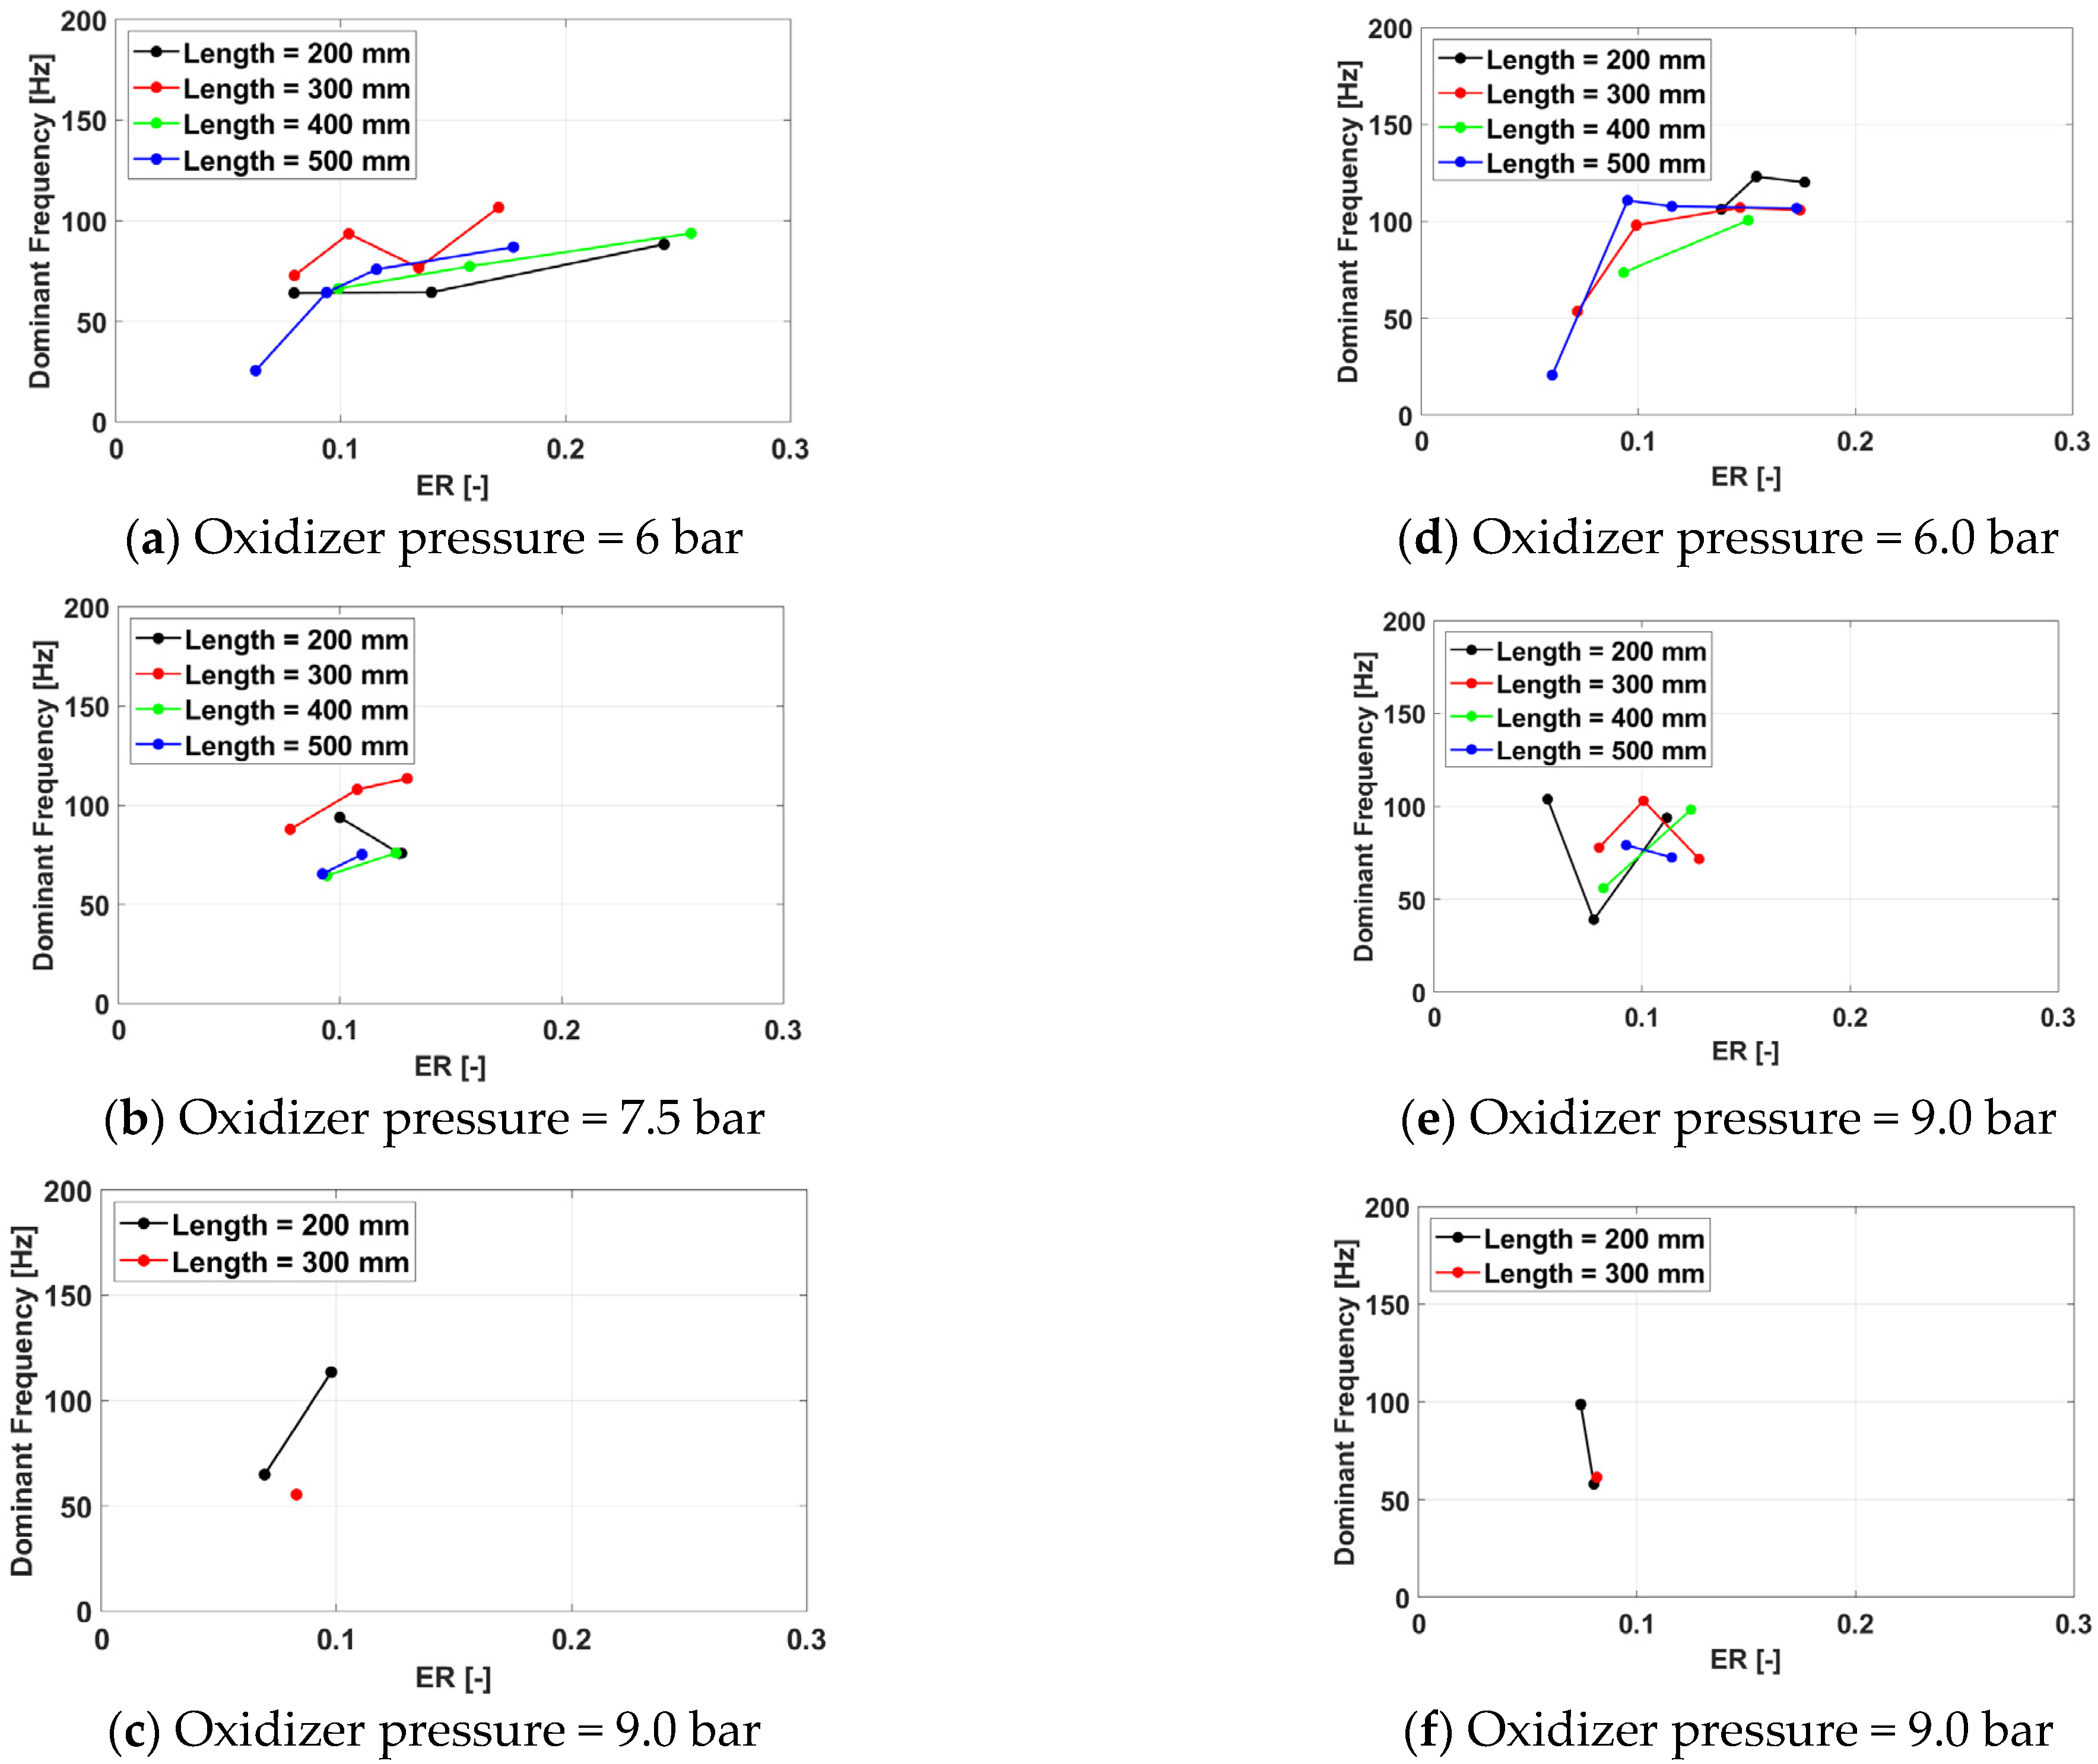
3.2.2. Maximum Cycle Pressure
Figure 28, Figure 29 and Figure 30 present the maximum cycle pressure variation with the equivalence ratio.
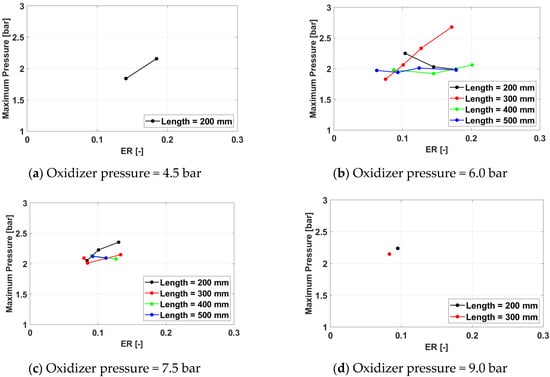
Figure 28.
Maximum cycle pressure for a frequency of 100 Hz for operation.
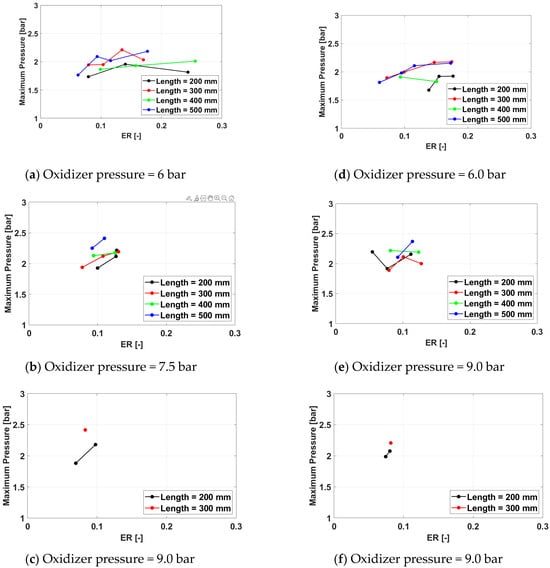
Figure 29.
Maximum cycle pressure for a frequency of 150 Hz (a–c) and 233 Hz (d–f) for operation.
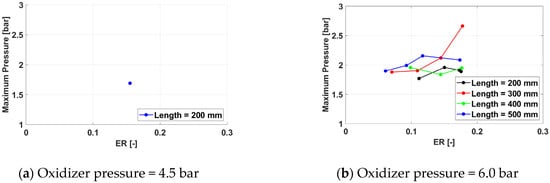
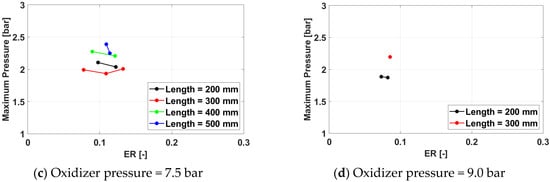
Figure 30.
Maximum cycle pressure for a frequency of 350 Hz for operation.
The trend of the maximum pressure to increase, for the same equivalence ratio, with the oxidizer pressure is maintained from the previous experimental campaign, but the effect of the exhaust pipe length is less consistent, even if, in broad terms, it is still visible to some extent.
As for the average pressure, for higher oxidizer pressures (7.5 bar) and for low equivalence ratios, the maximum cycle pressure increases, and the effect is more pronounced for shorter pipes. No consistent effect of the spark plug frequency is seen.
Overall, the highest average cycle pressure is 3.22 bar, also obtained for Test ID 1332. The maximum pressure value is also higher than the optimal one for the air campaign.
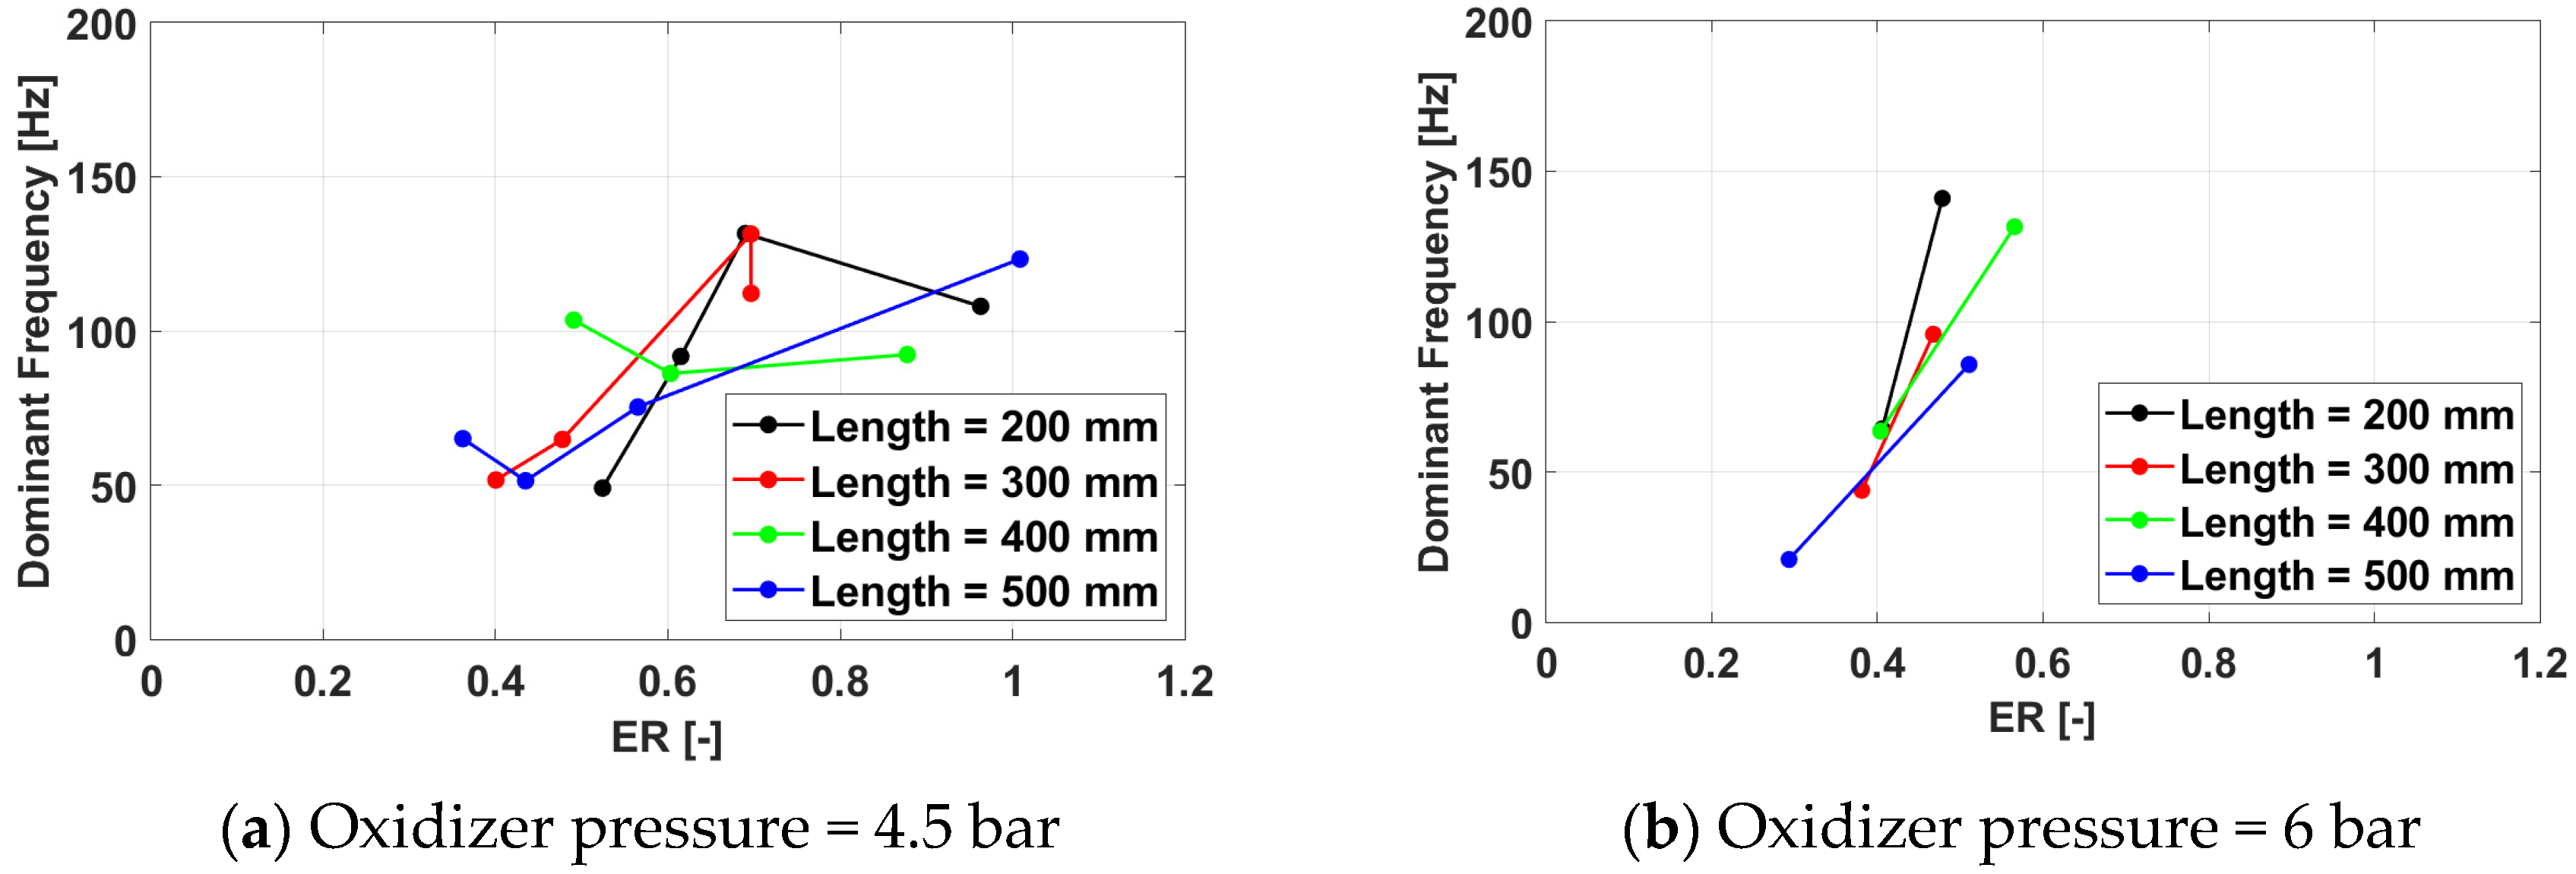
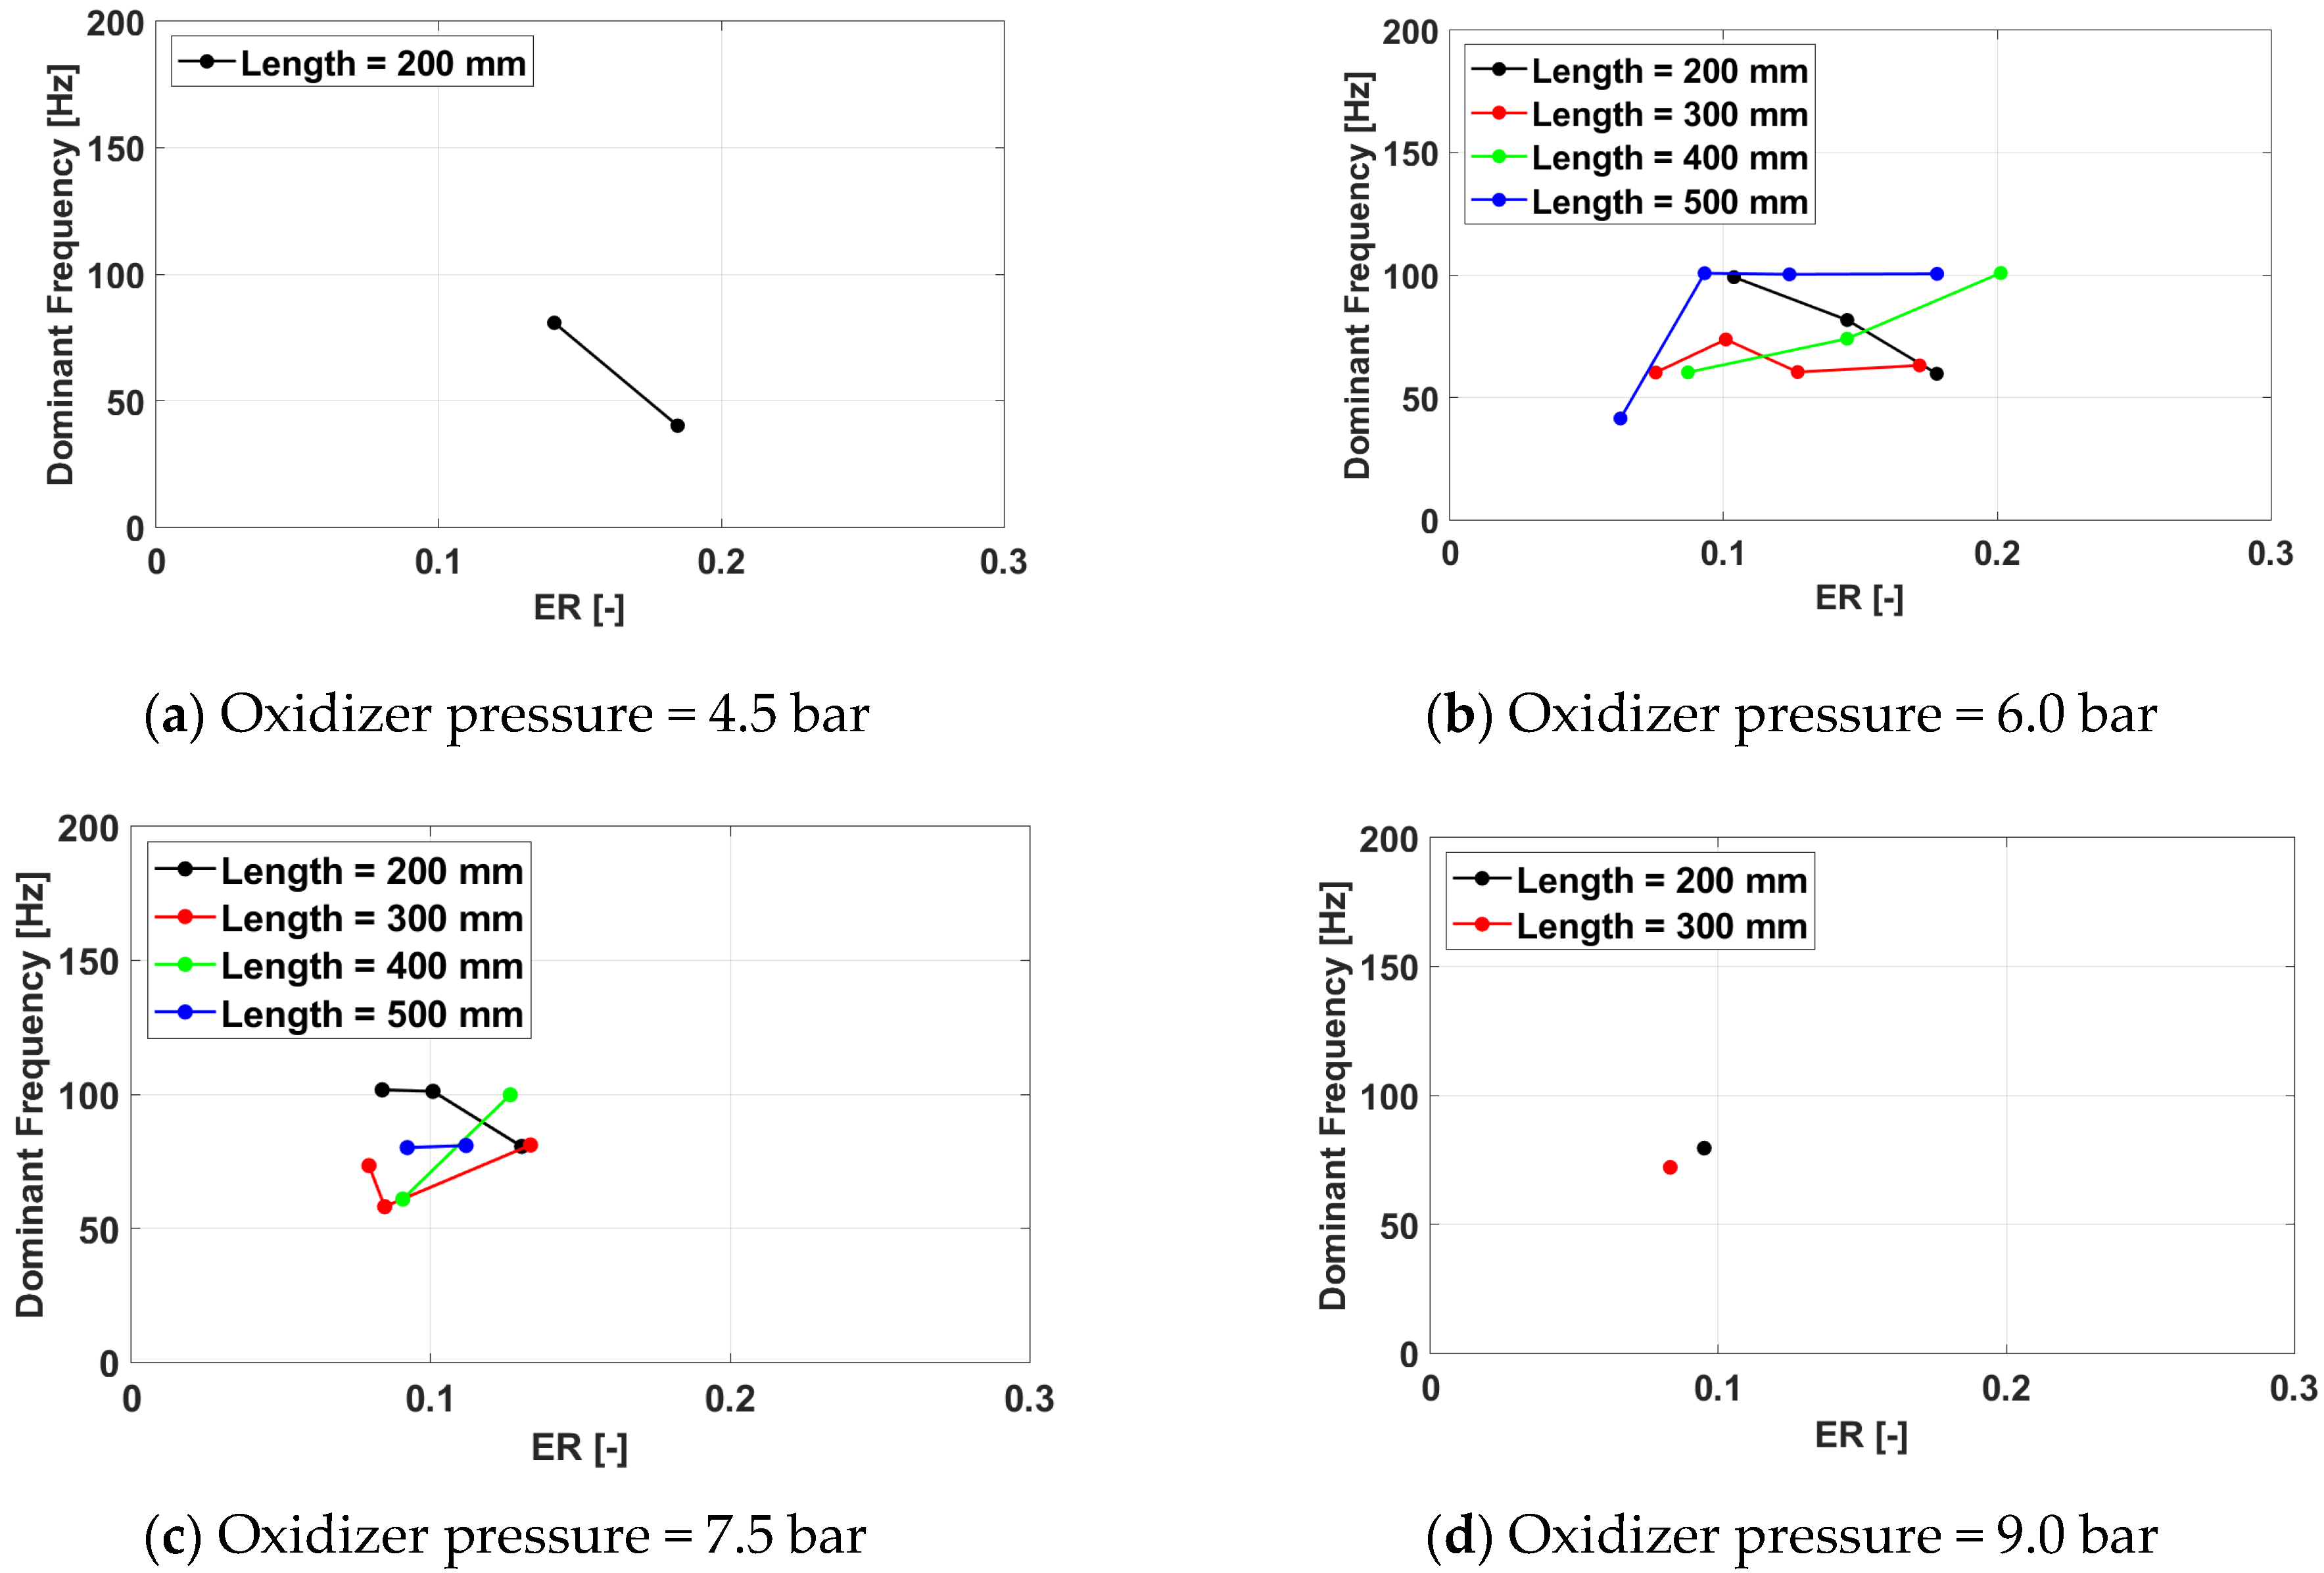
3.2.3. Operating Cycle Frequency
Figure 31, Figure 32 and Figure 33 Exhibit the PDC operating frequency variations with the equivalence ratio.
Figure 31.
Cycle frequency for a frequency of 100 Hz for operation.
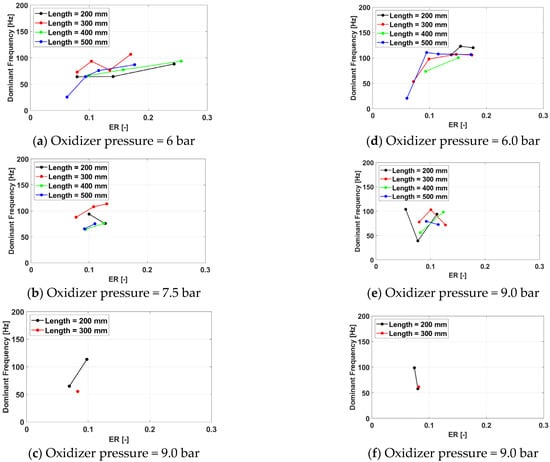
Figure 32.
Cycle frequency for a frequency of 150 Hz (a–c) and 233 Hz (d–f) for operation.
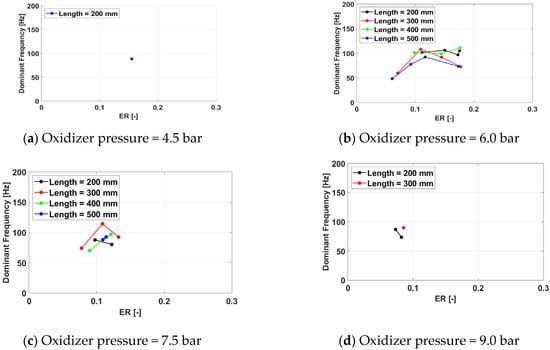
Figure 33.
Cycle frequency for a frequency of 350 Hz for operation.
When Oxygen is used as an oxidizer, the central role of the spark plug as a driver of the thruster operating frequency is maintained. For the design frequency, the optimal response is provided by long exhaust pipes for low oxidizer pressures (6.0 bar) and short exhaust pipes for high oxidizer pressures (7.5 bar and above). For off-design spark plug frequencies, the response of the PDC is worse than for the Hydrogen/air campaign, with no test case being able to respond to the higher excitation frequency. The maximum operating frequency is, for these cases, around 120 Hz, with higher values obtained for shorter exhaust pipes. The effect of the exhaust pipe is significant only for oxidizer pressures above 7.5 bar, while the trend of registering more misfires at a low equivalence ratio observed in the air testing remains valid, but the cutoff limit is significantly lower for Oxygen than for air (0.1 and 0.6, respectively).
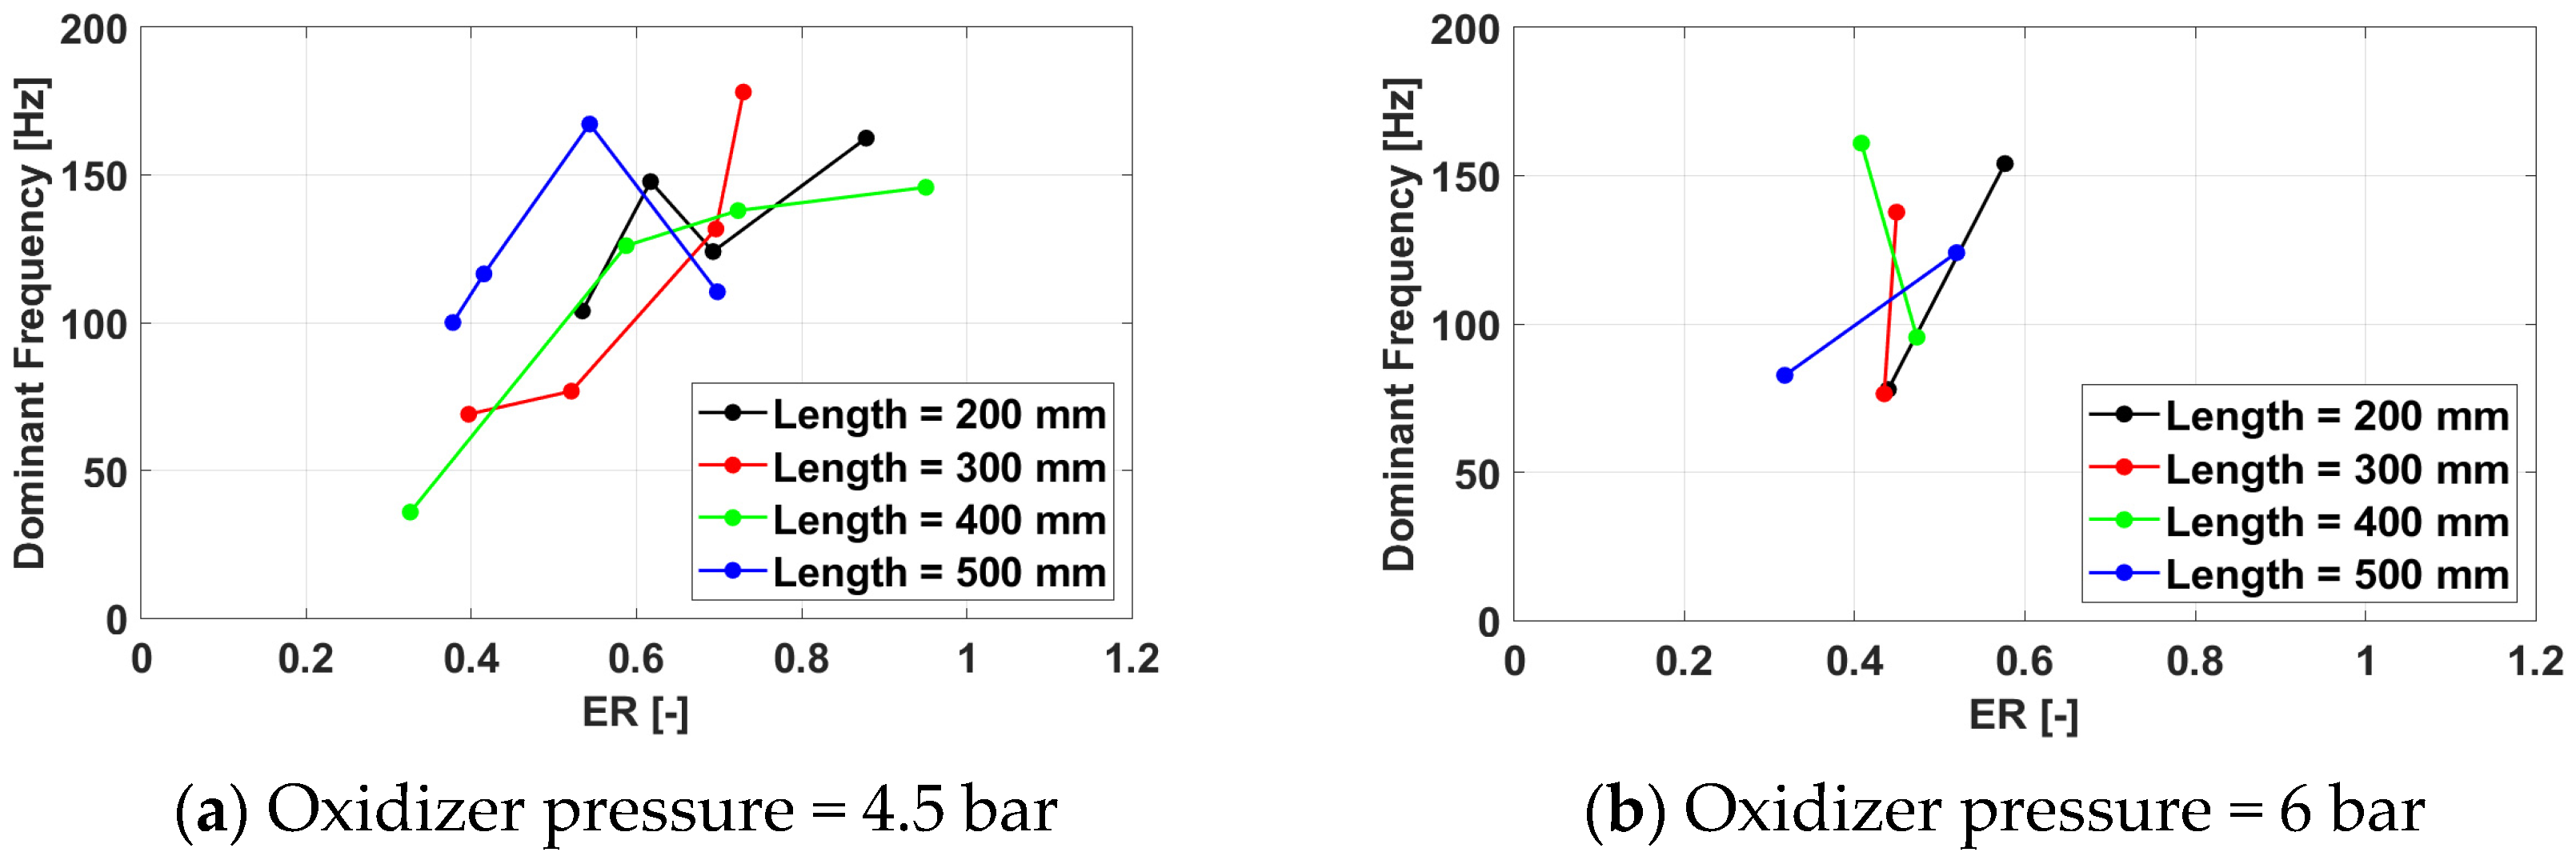
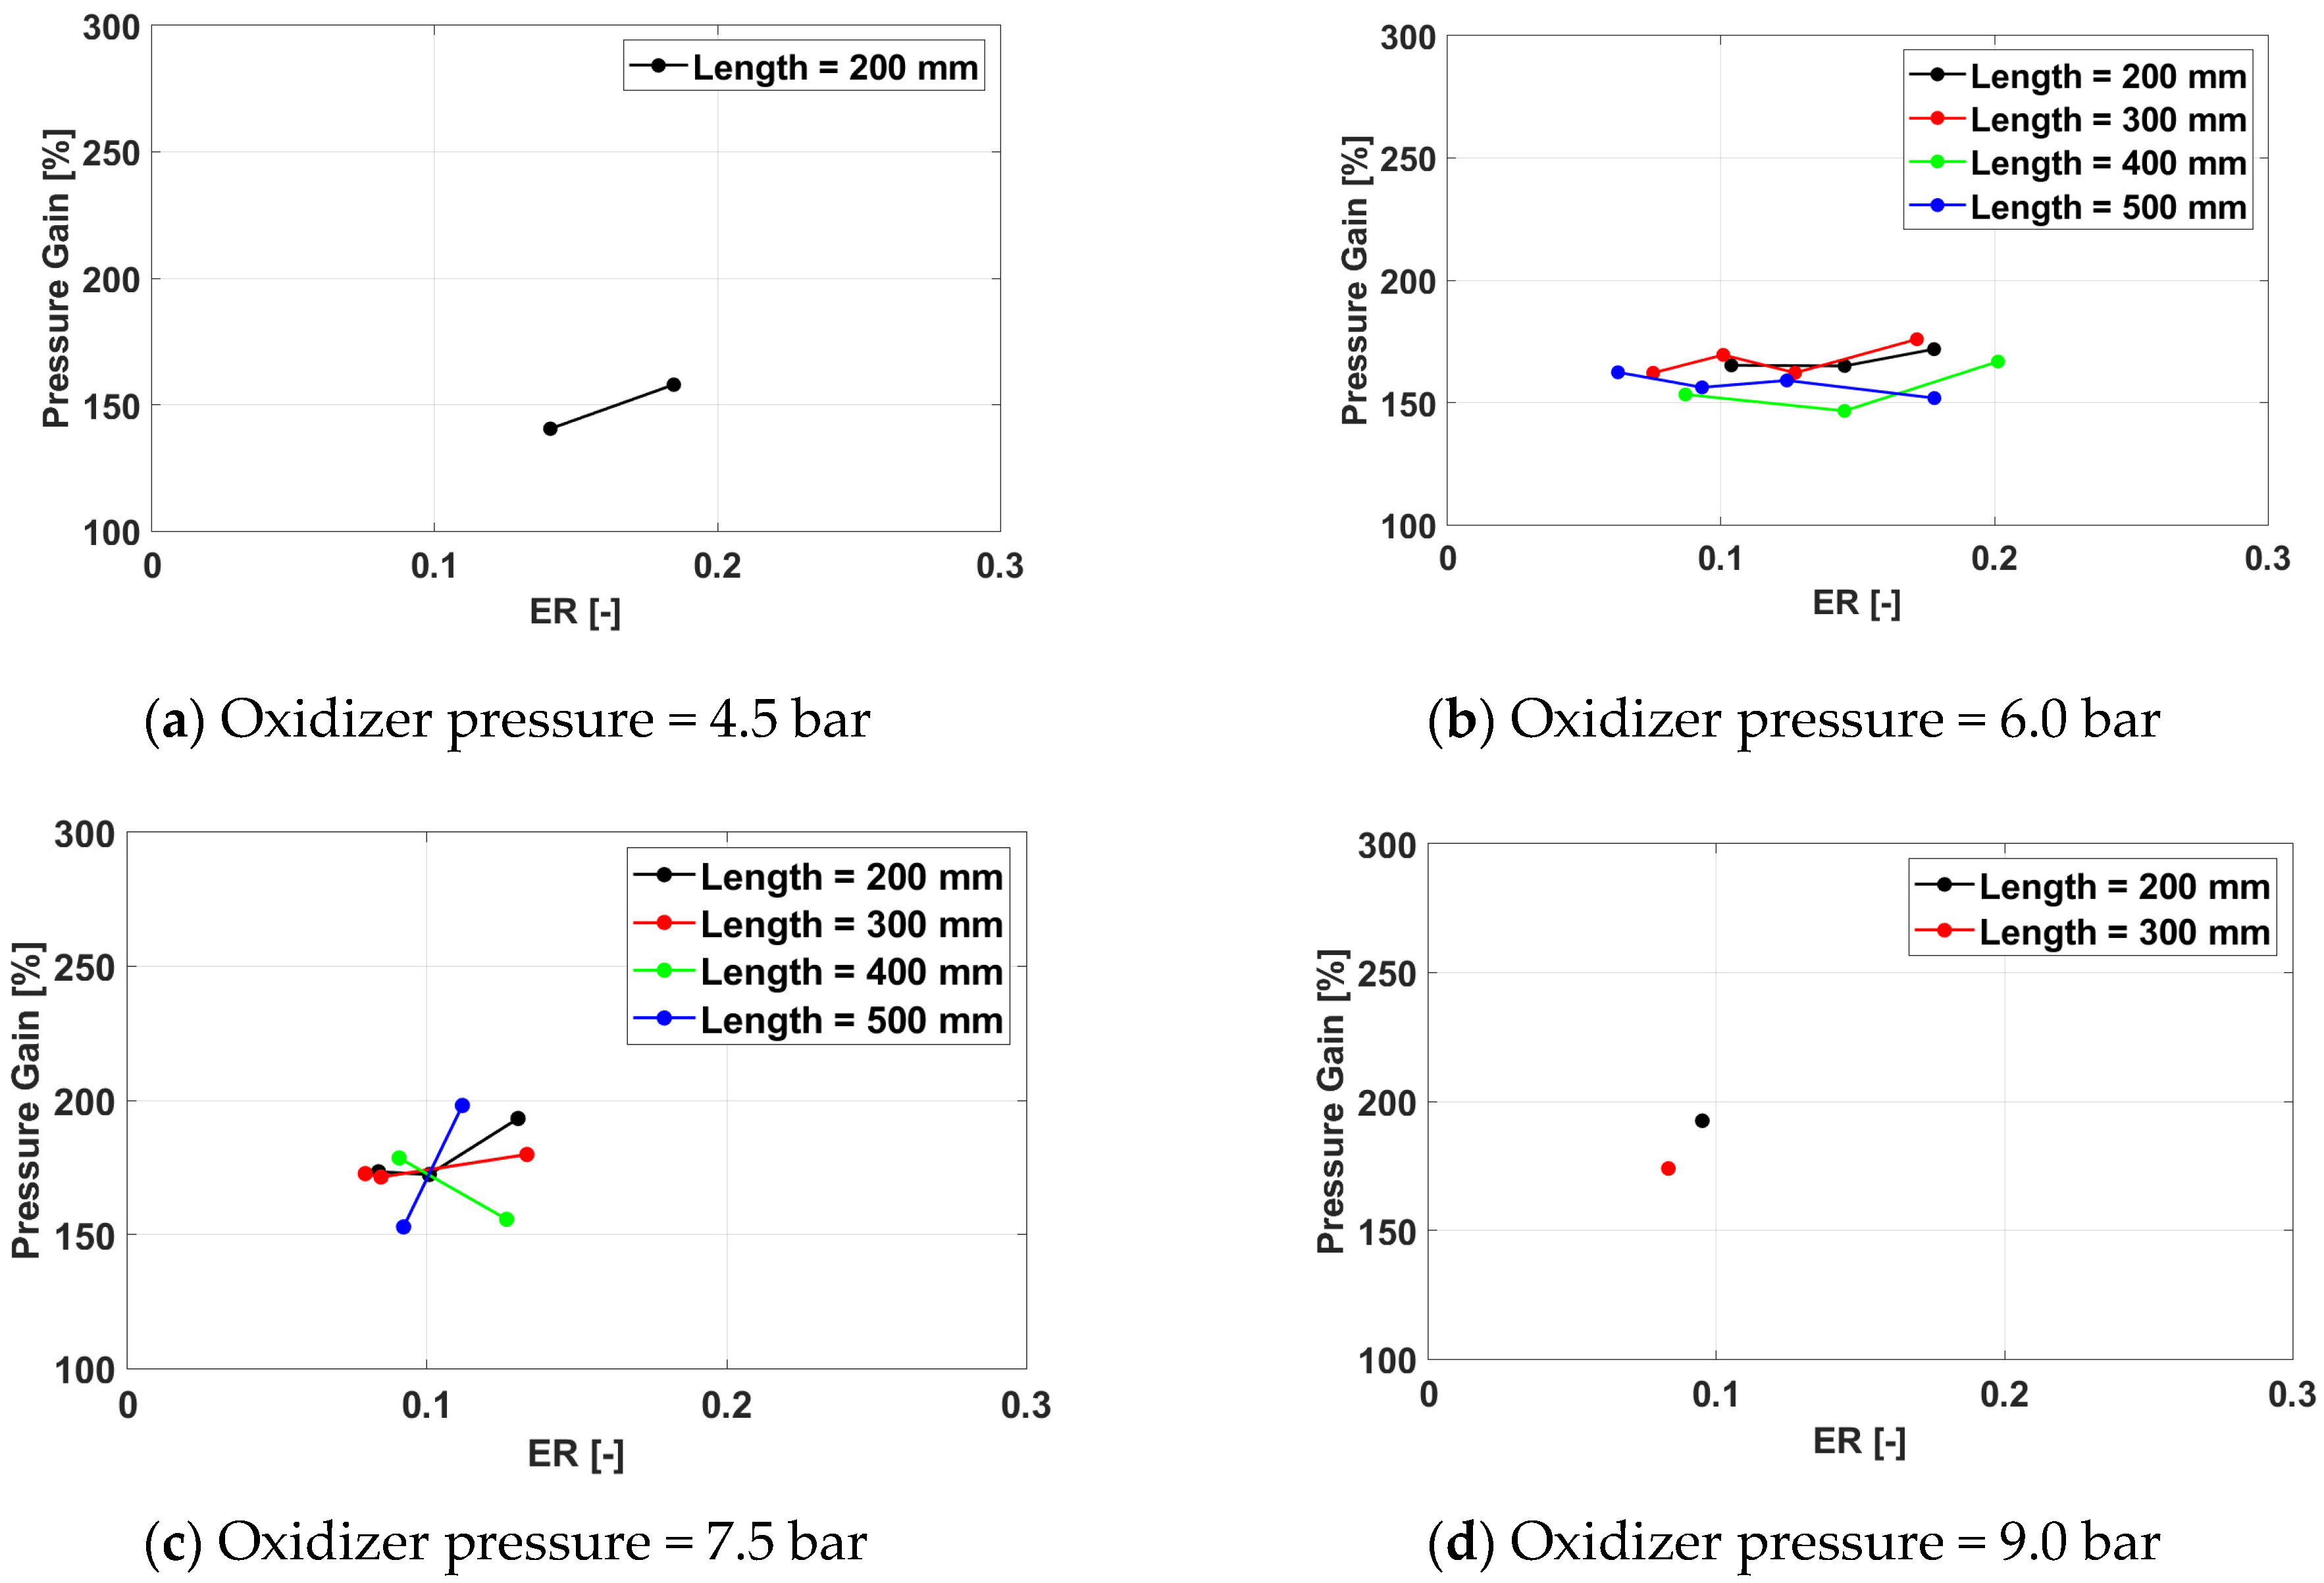
3.2.4. Pressure Gain
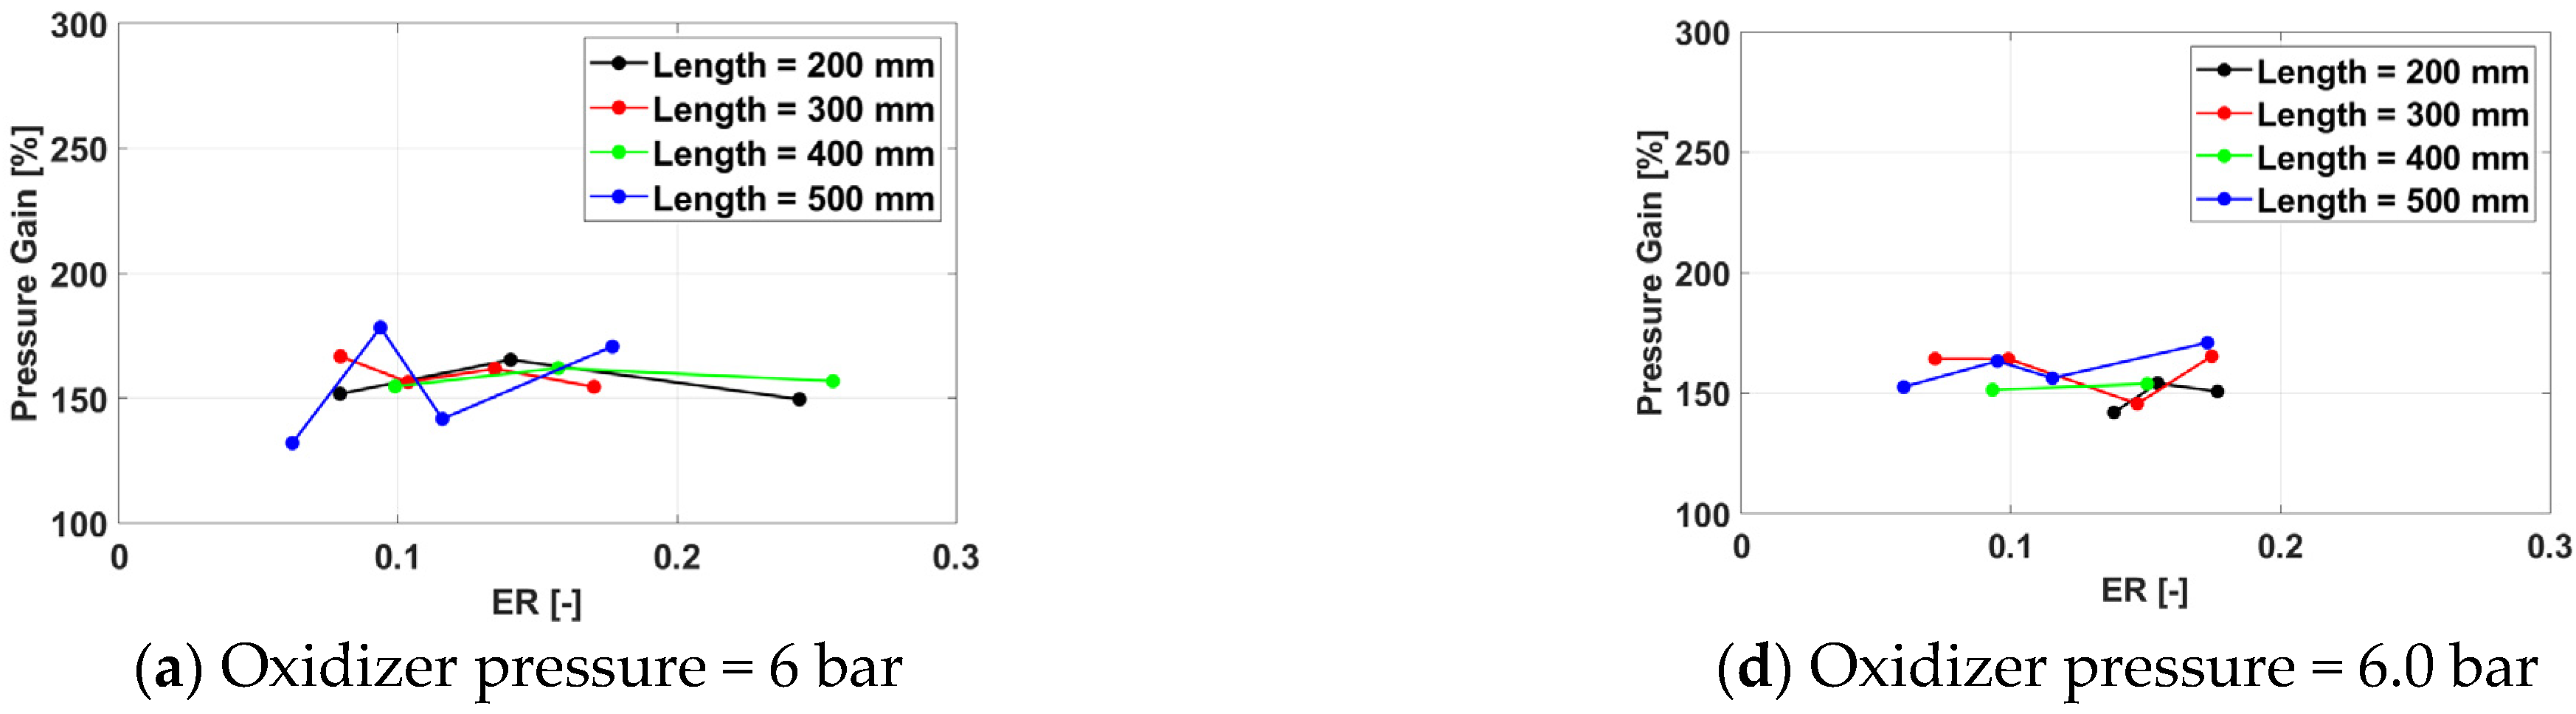
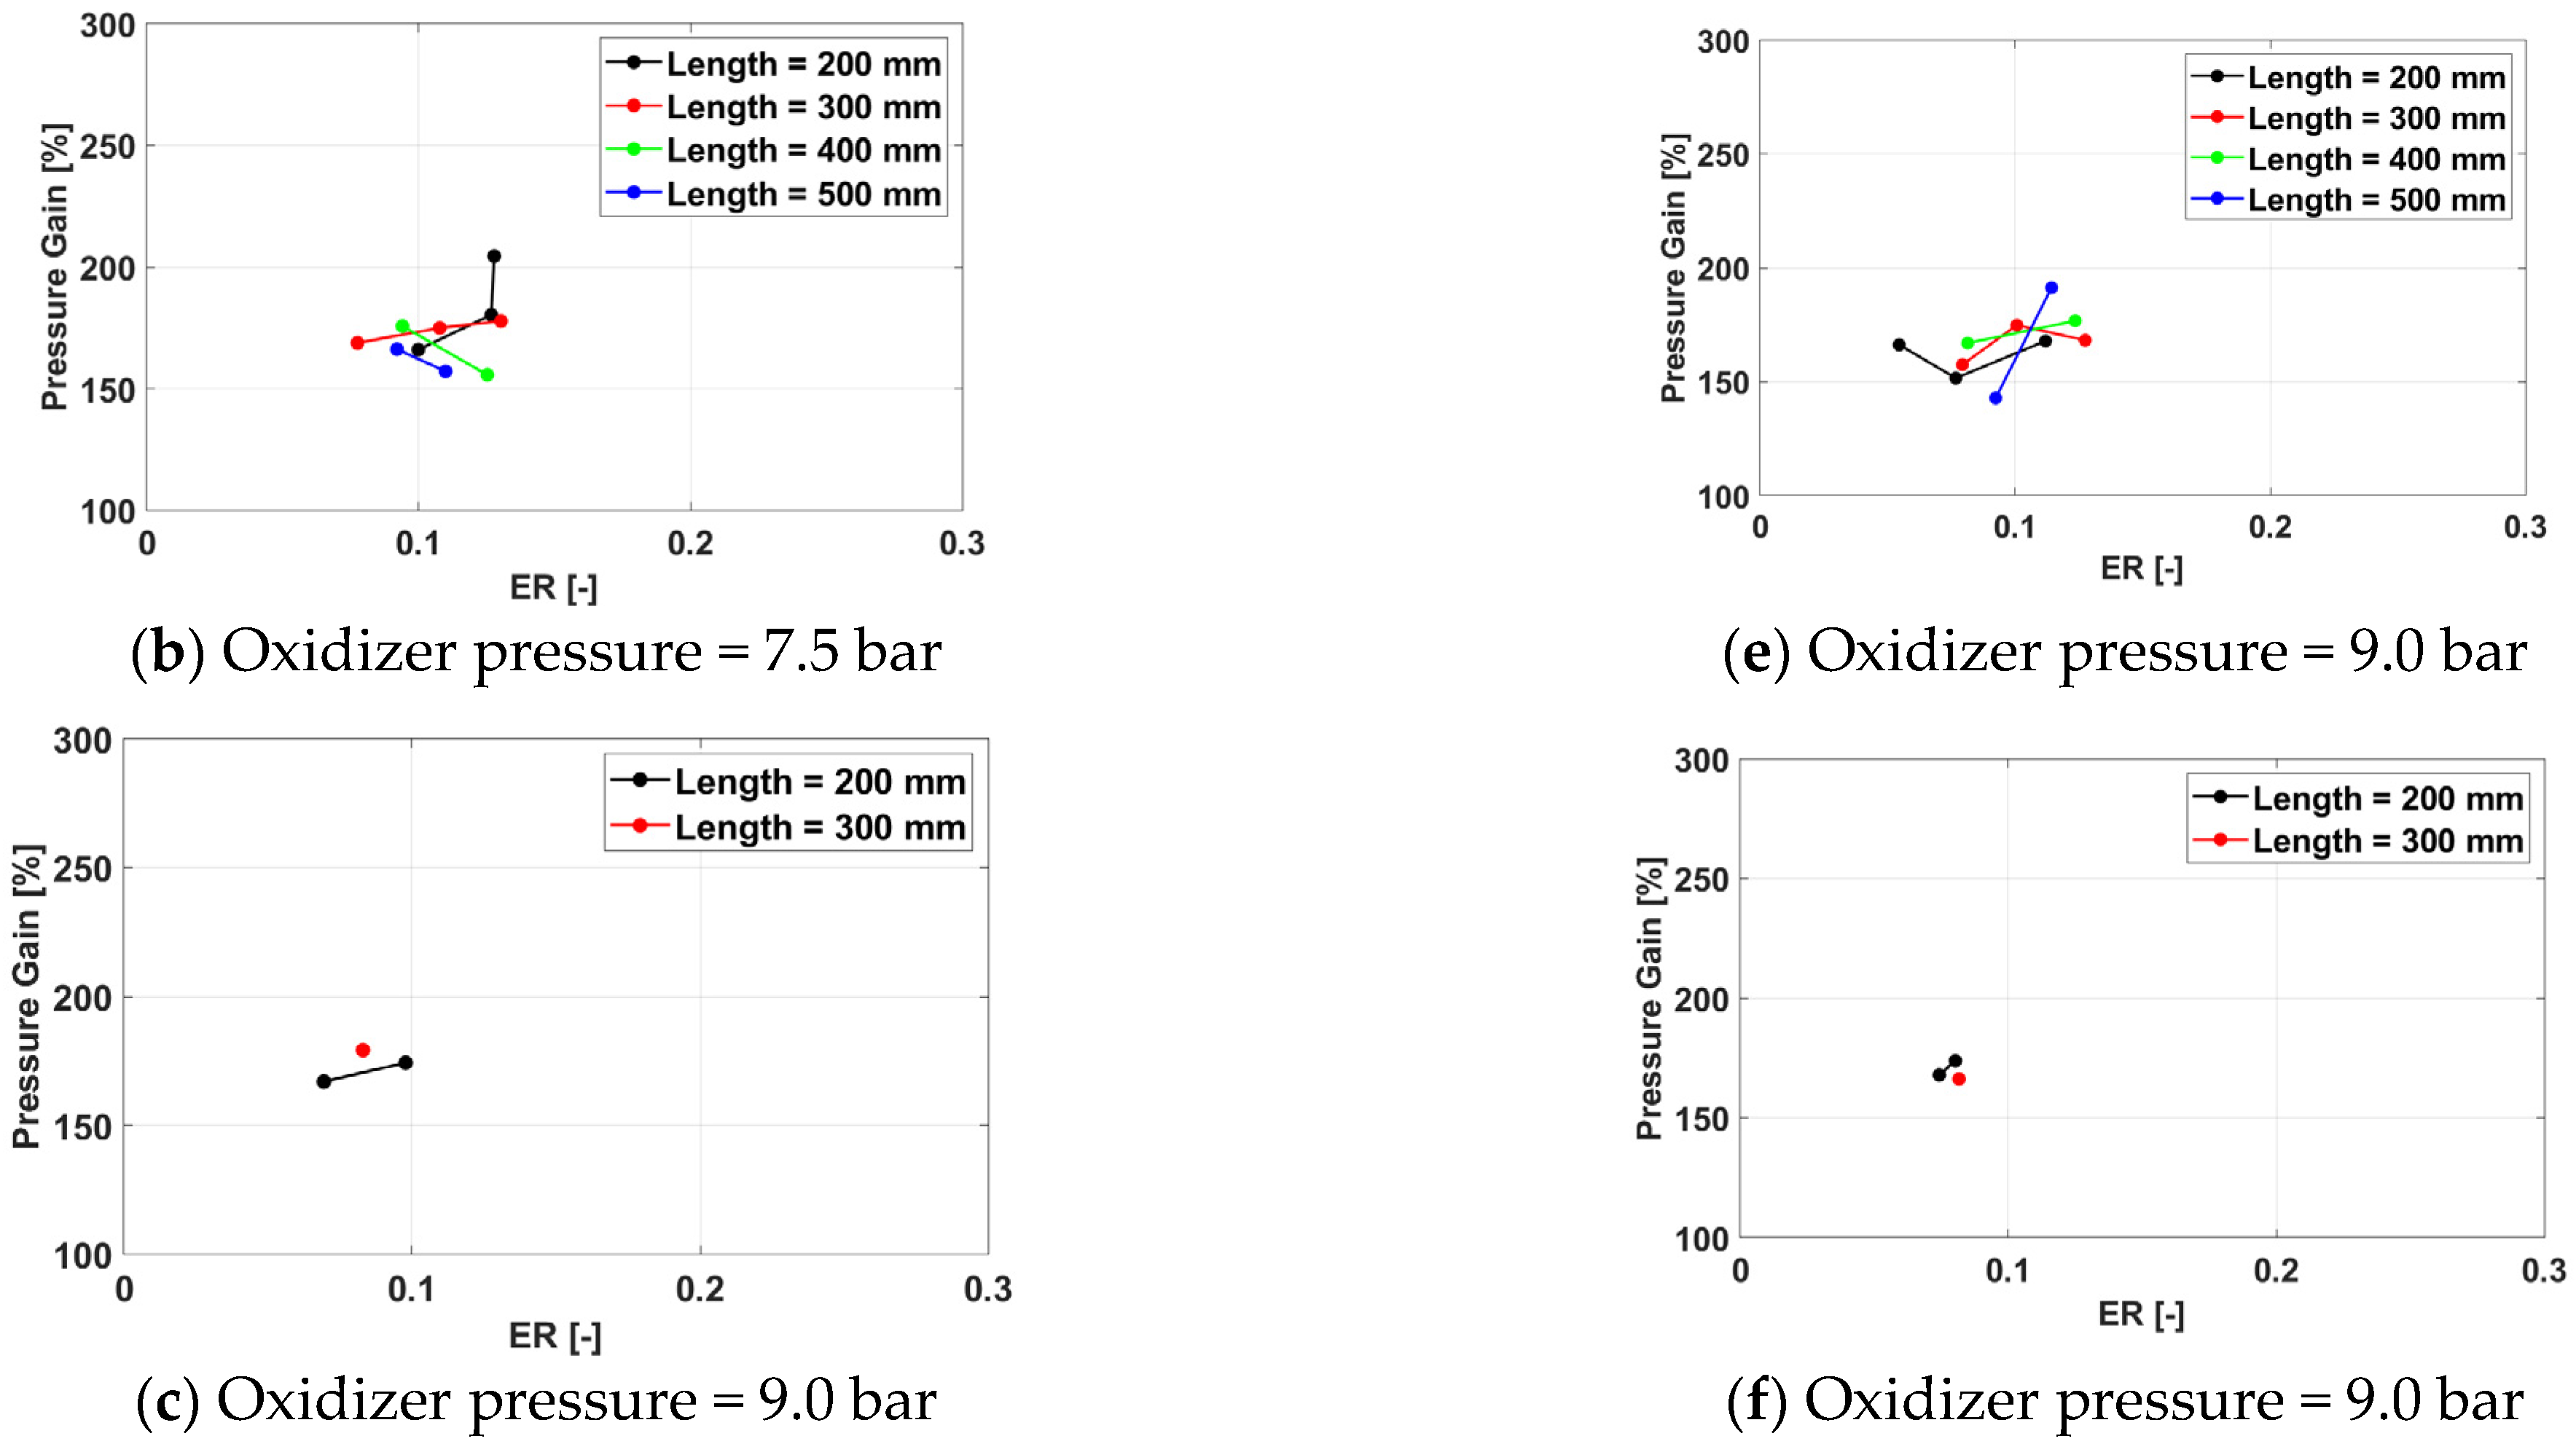
The recorded pressure gain (Figure 34, Figure 35 and Figure 36) is lower for Oxygen combustion than for air combustion as a result of the significantly lower equivalence ratios covered by the operational envelope in this case. The influence of the considered parameters on the pressure gain values is similar to the air case, with the pressure gain increasing with the equivalence ratio, while the other parameters have only a marginal impact.
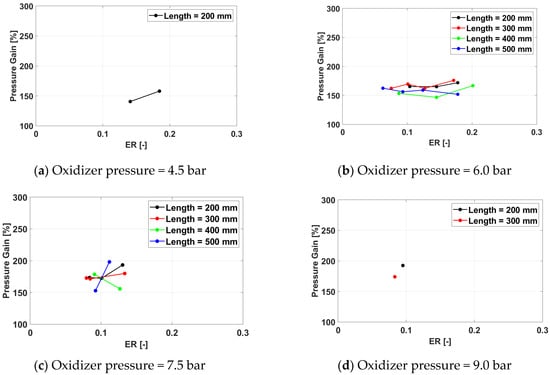
Figure 34.
Pressure gain for a frequency of 100 Hz for operation.
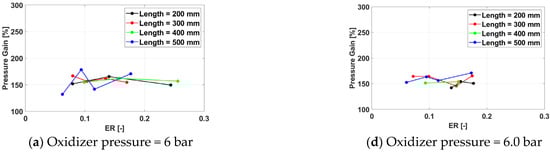
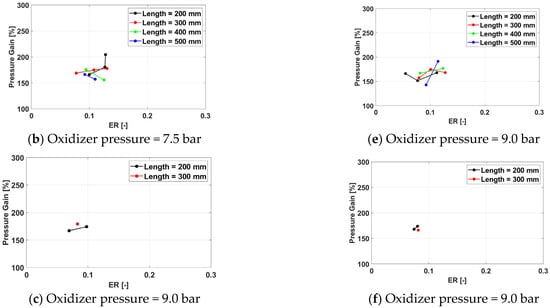
Figure 35.
Pressure gain a frequency of 150 Hz (a–c) and 233 Hz (d–f) for operation.
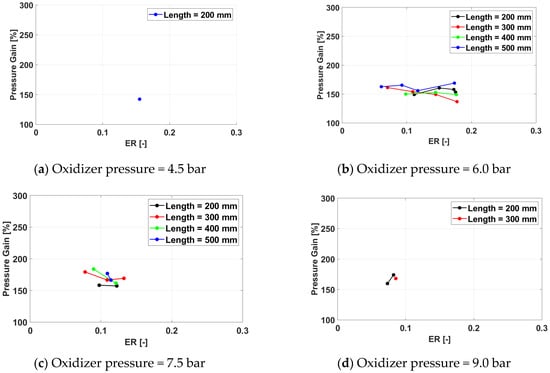
Figure 36.
Pressure gain for a frequency of 350 Hz for operation.
3.2.5. Schlieren Visualization
Schlieren visualizations also corroborate the shape of the recorded pressure signals. A detailed analysis of our Schlieren findings is available in reference [34]. To support the data presented above, examples of the flow field immediately downstream of the exhaust for each oxidizer are provided below. For both cases, Test ID 0032 is presented because it is a common reference. Averaged data for the most relevant parameters were extracted from the first 30 cycles since spark plug ignition. It has been determined that for all herein considered averaged values, the relative change in the average remains below 1% if more data are added to the average.
Hydrogen/Air
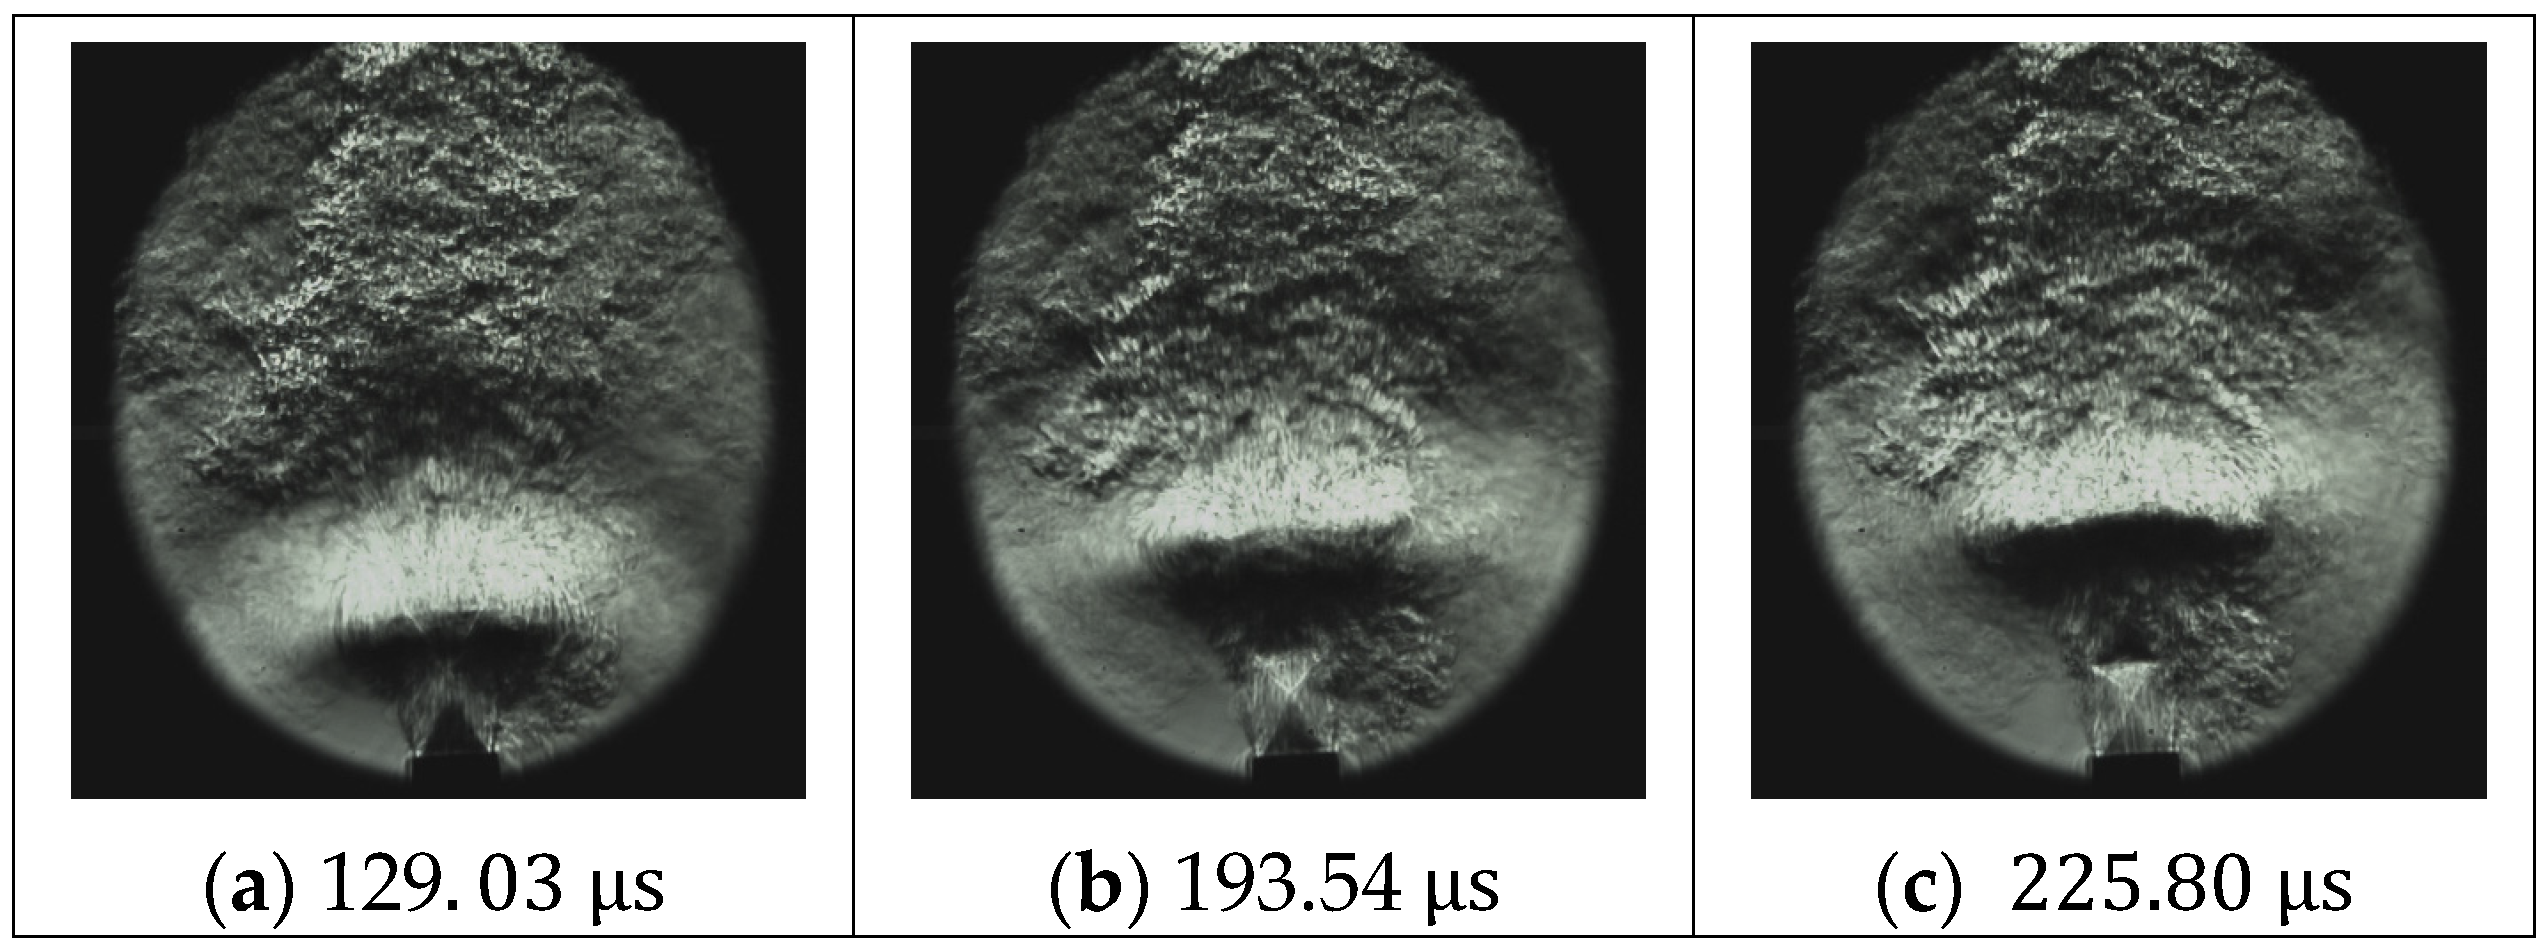
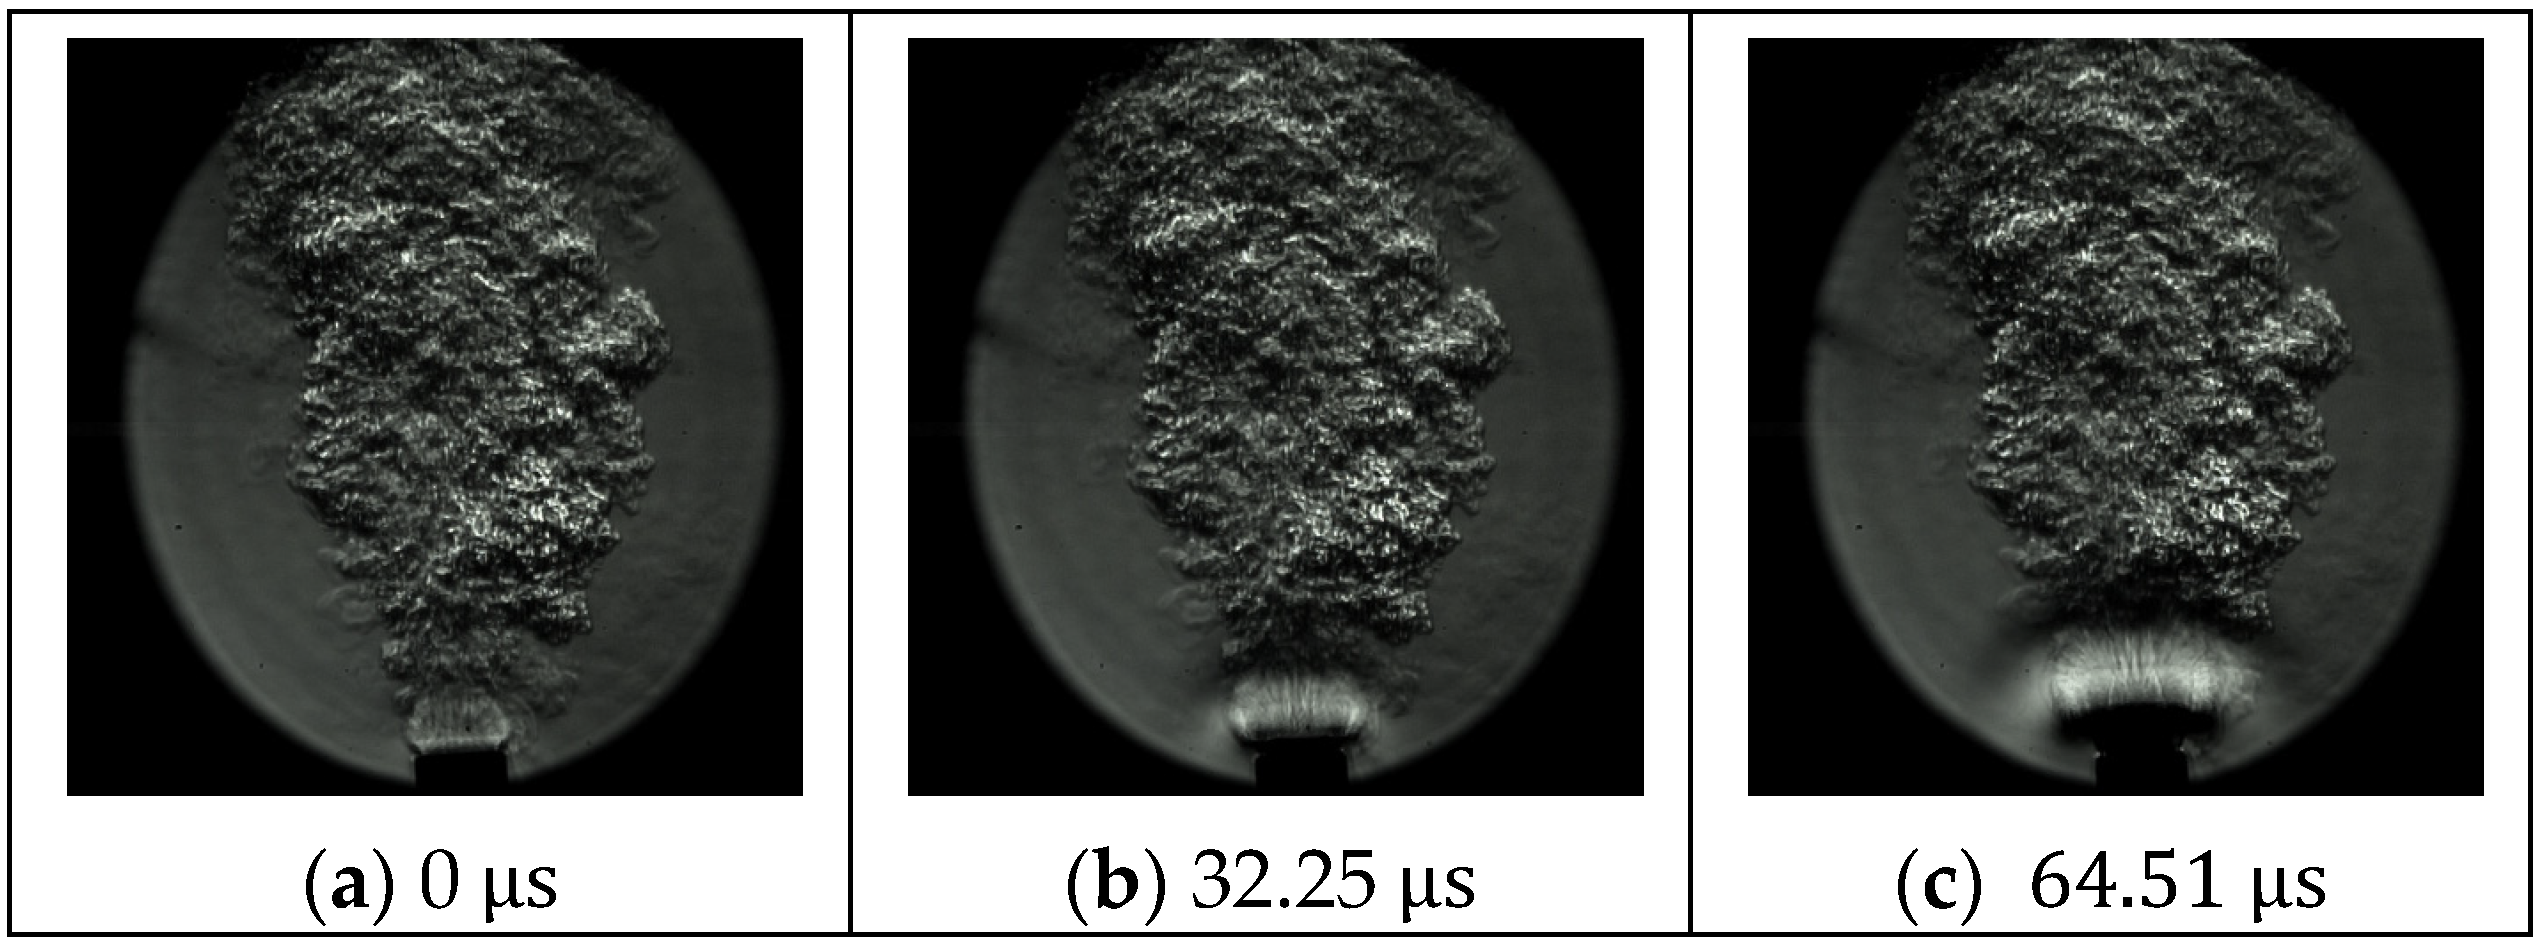
The time coordinate origin in the following discussion is set at the moment when the leading shock wave appears at the end of the exhaust pipe (Figure 37a) and starts propagating downstream (Figure 37b,c).
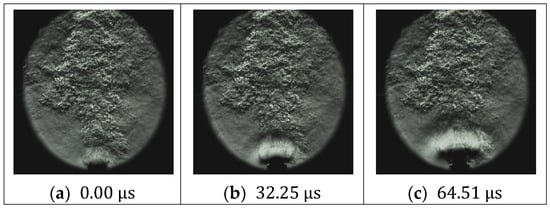
Figure 37.
Leading shock wave propagation for mixture.
The average velocity of the leading shock wave may be estimated based on the Schlieren data at 668 . Behind the leading shock wave, as shown in Figure 37, a Mach disk structure appears at the end of the exhaust pipe (Figure 38), indicating the supersonic nature of the flow.
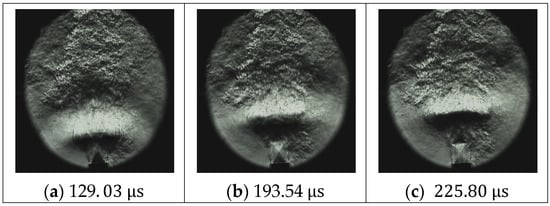
Figure 38.
Mach disk structure for mixture.
The angle made by the reflected shock wave with the horizontal axis first decreases (Figure 38a), then increases (Figure 38c), indicating that the flow accelerates up to a maximum value (Figure 38b), then decelerates until subsonic values. The Mach number is computed as the inverse of the Mach angle— The averaged maximum Mach number estimated from the Schlieren data is 1.1 and is reached after 149 The corresponding Mach angle is 66°.
As the Mach disk structure disappears, combustion products appear at the end of the detonation tube (Figure 38c). Their temperature is higher, which translates into a higher speed of sound, which contributes to the flow regime turning subsonic. The combustion front can be identified in white in Figure 38c, while the leading shock wave appears in black at the top of the same figure. Because the above figures prove the flow is supersonic immediately after the leading shock wave and because the geometry of the device allows supersonic flow to appear only through detonation (no Laval nozzle present), then the leading shock wave and the combustion wave should have been coupled in a detonation wave somewhere inside the PDE, upstream of the visualization area. Furthermore, the literature findings [36,37,38] prove that if there is an area constraint (step) or obstacle in the channel due to reflections and heat transfer phenomena, the detonation wave decouples and has lower speed propagation than CJ velocities.
Assuming that the shock and combustion waves have been fully coupled in a detonation wave at the spark plug location, the averaged velocity of the flow () during this part of the detonation cycle may be estimated as the following:
where is the time required by the leading shock wave to travel the length , between the location of the spark plug and the end of the exhaust length (545 ). is known from the estimated average leading shock wave velocity. Hence, the average flow velocity over this part of the cycle is 474 .
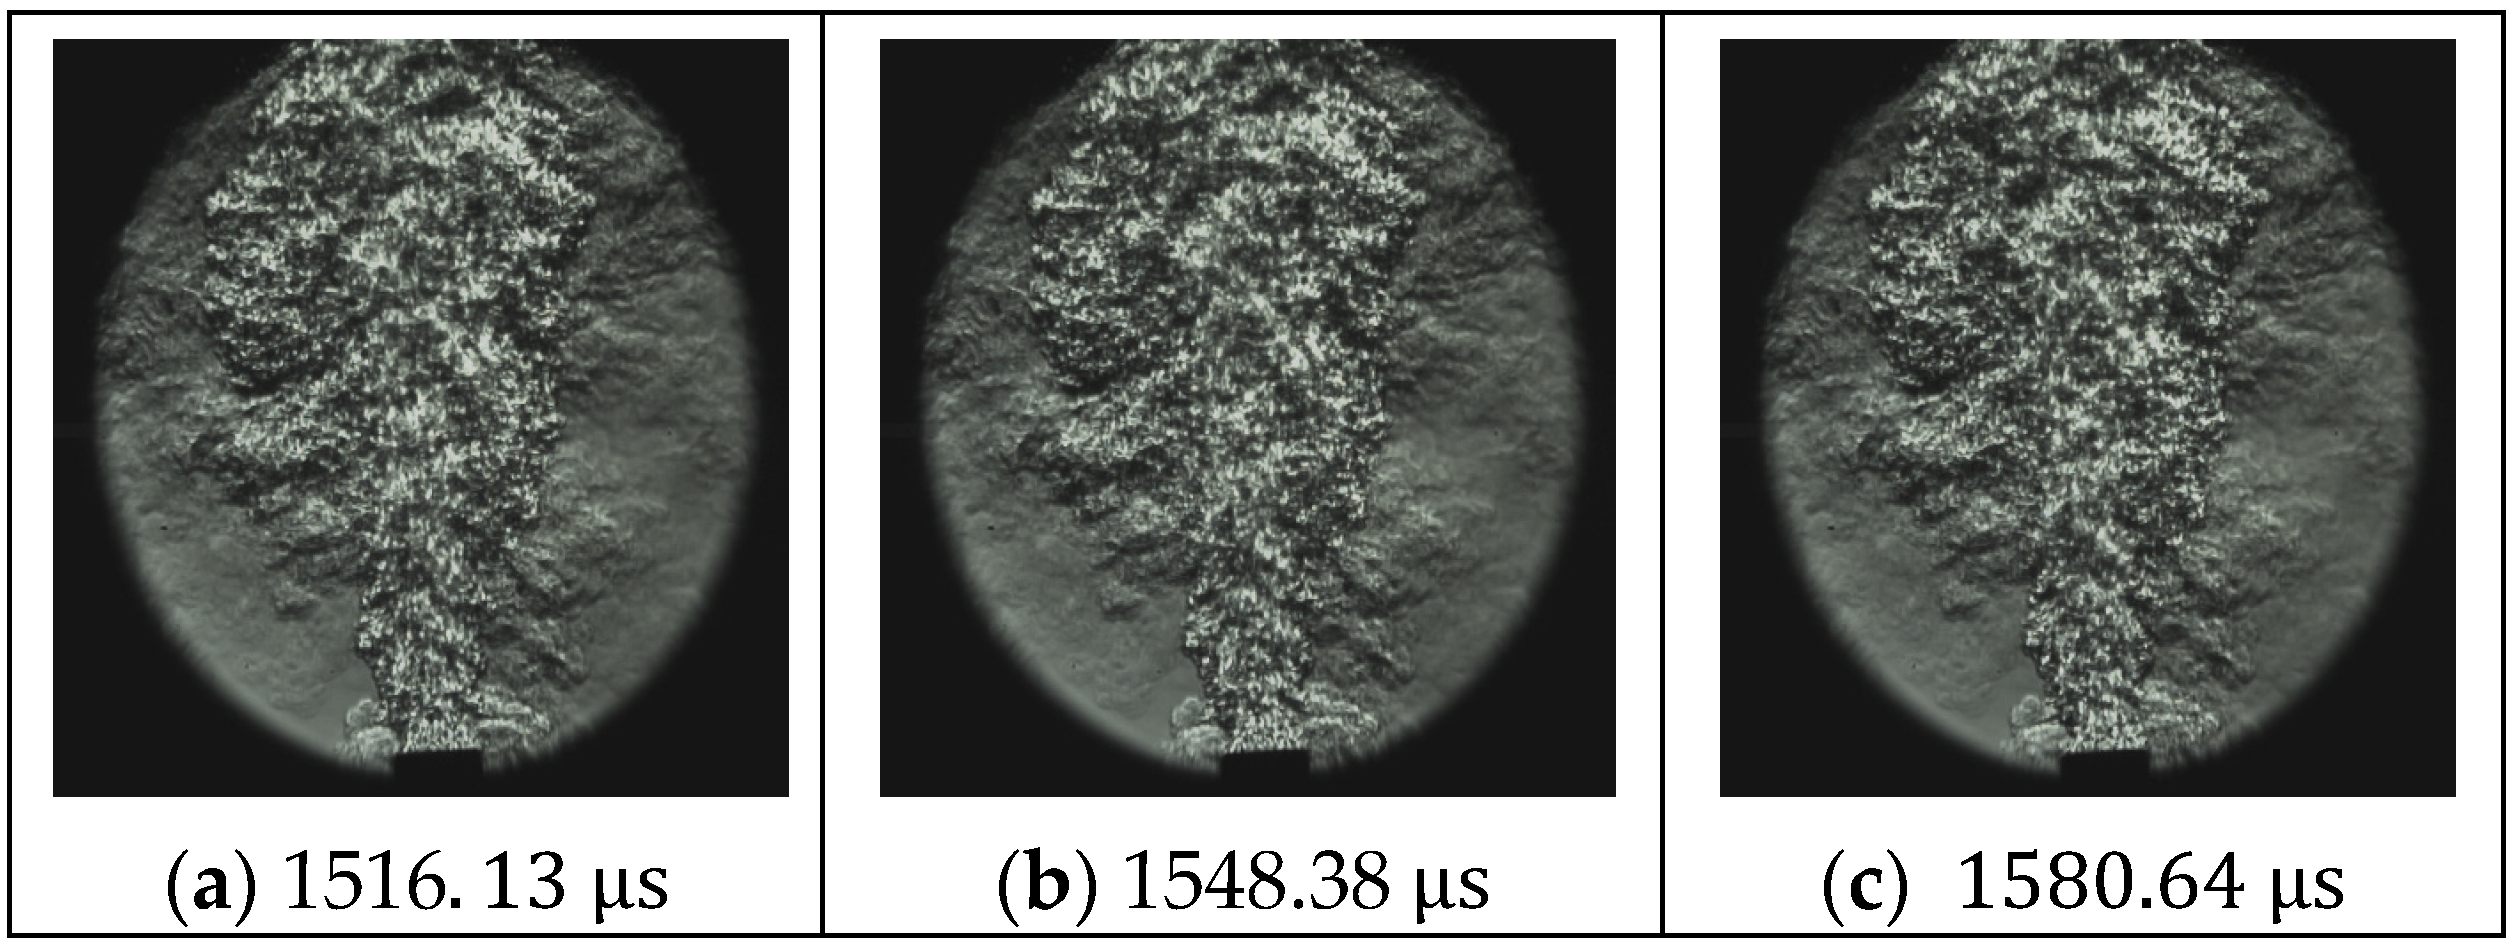
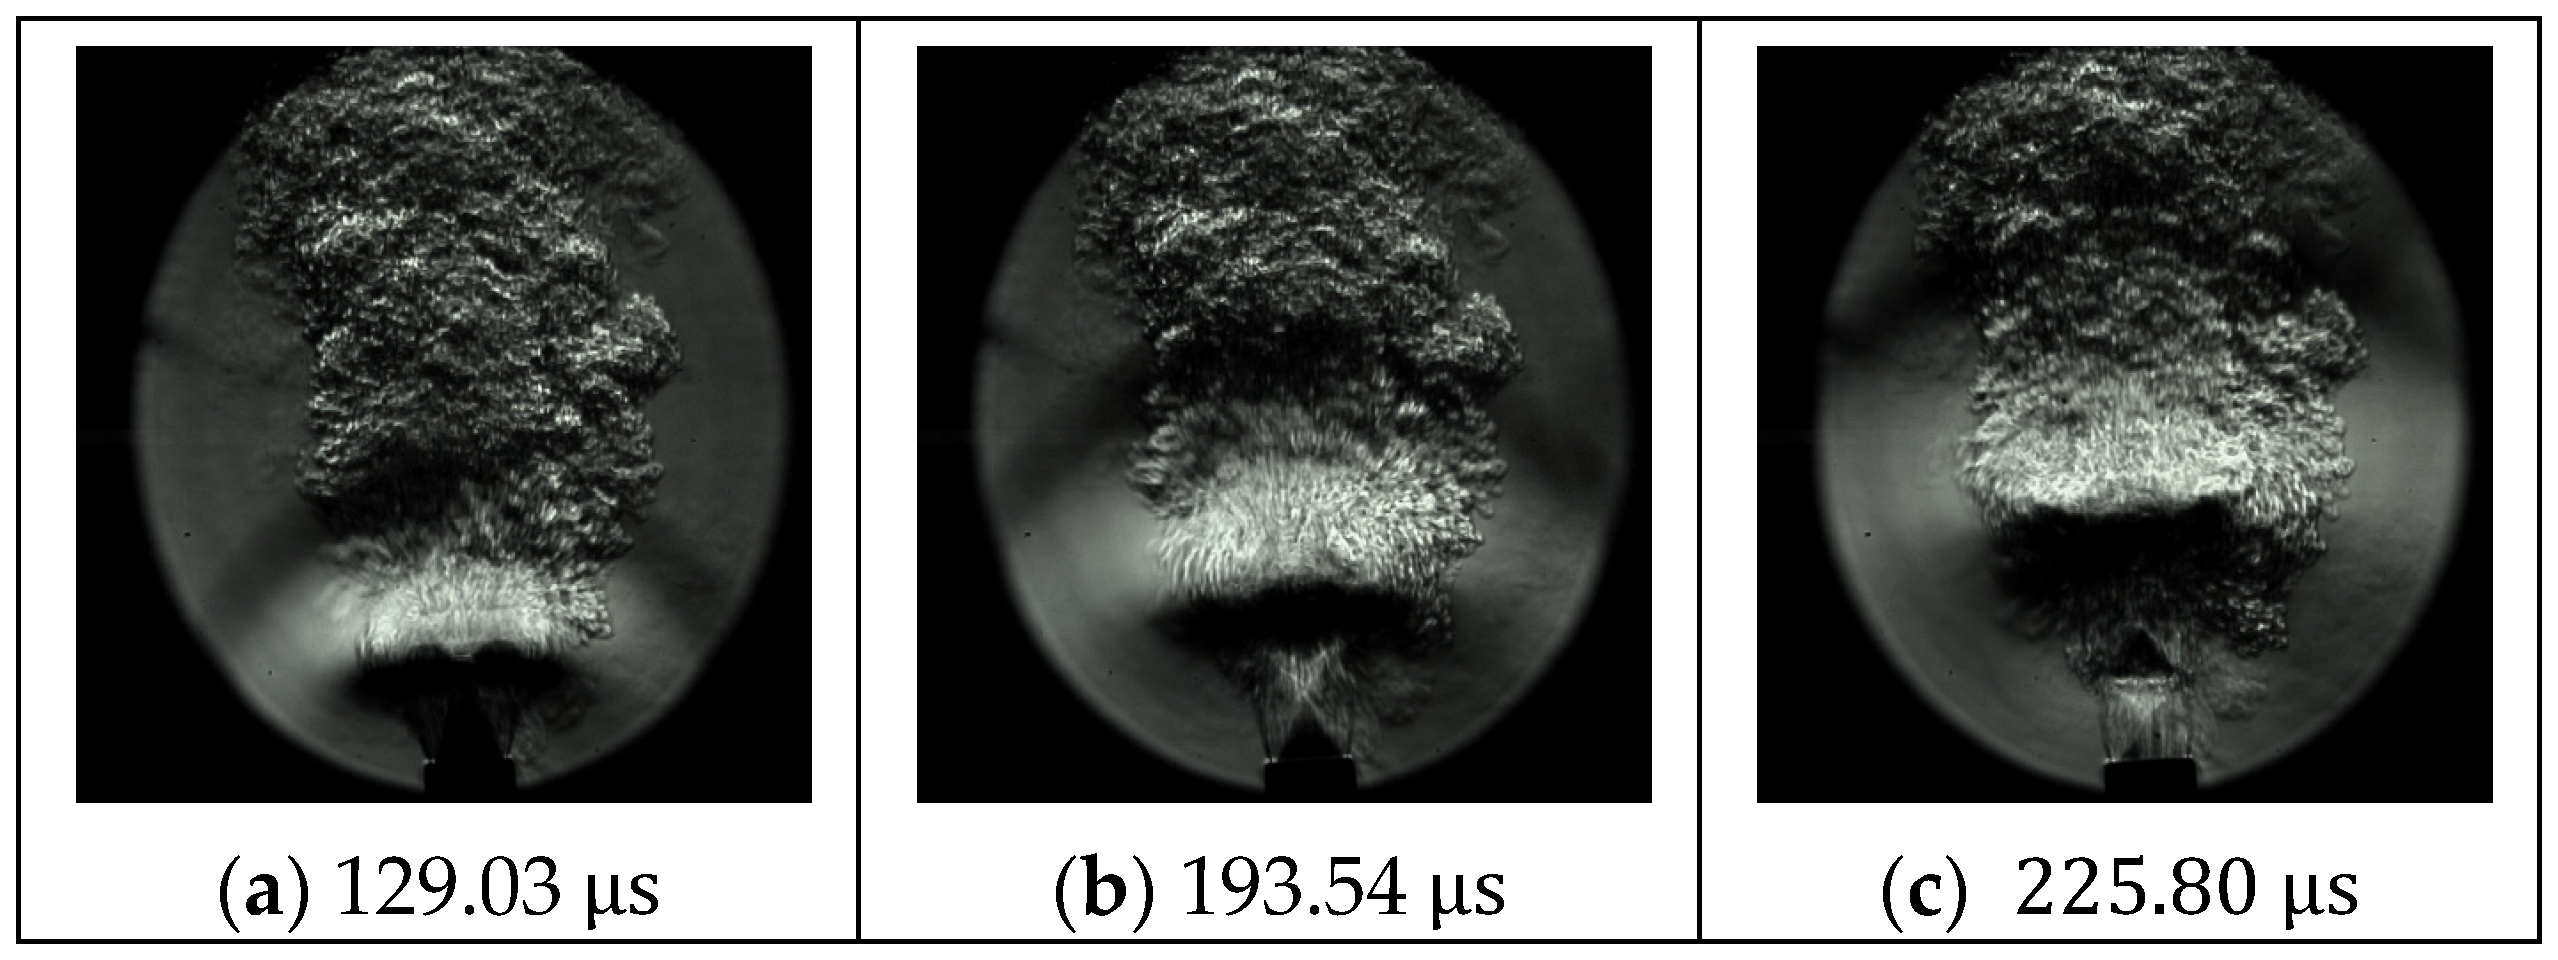
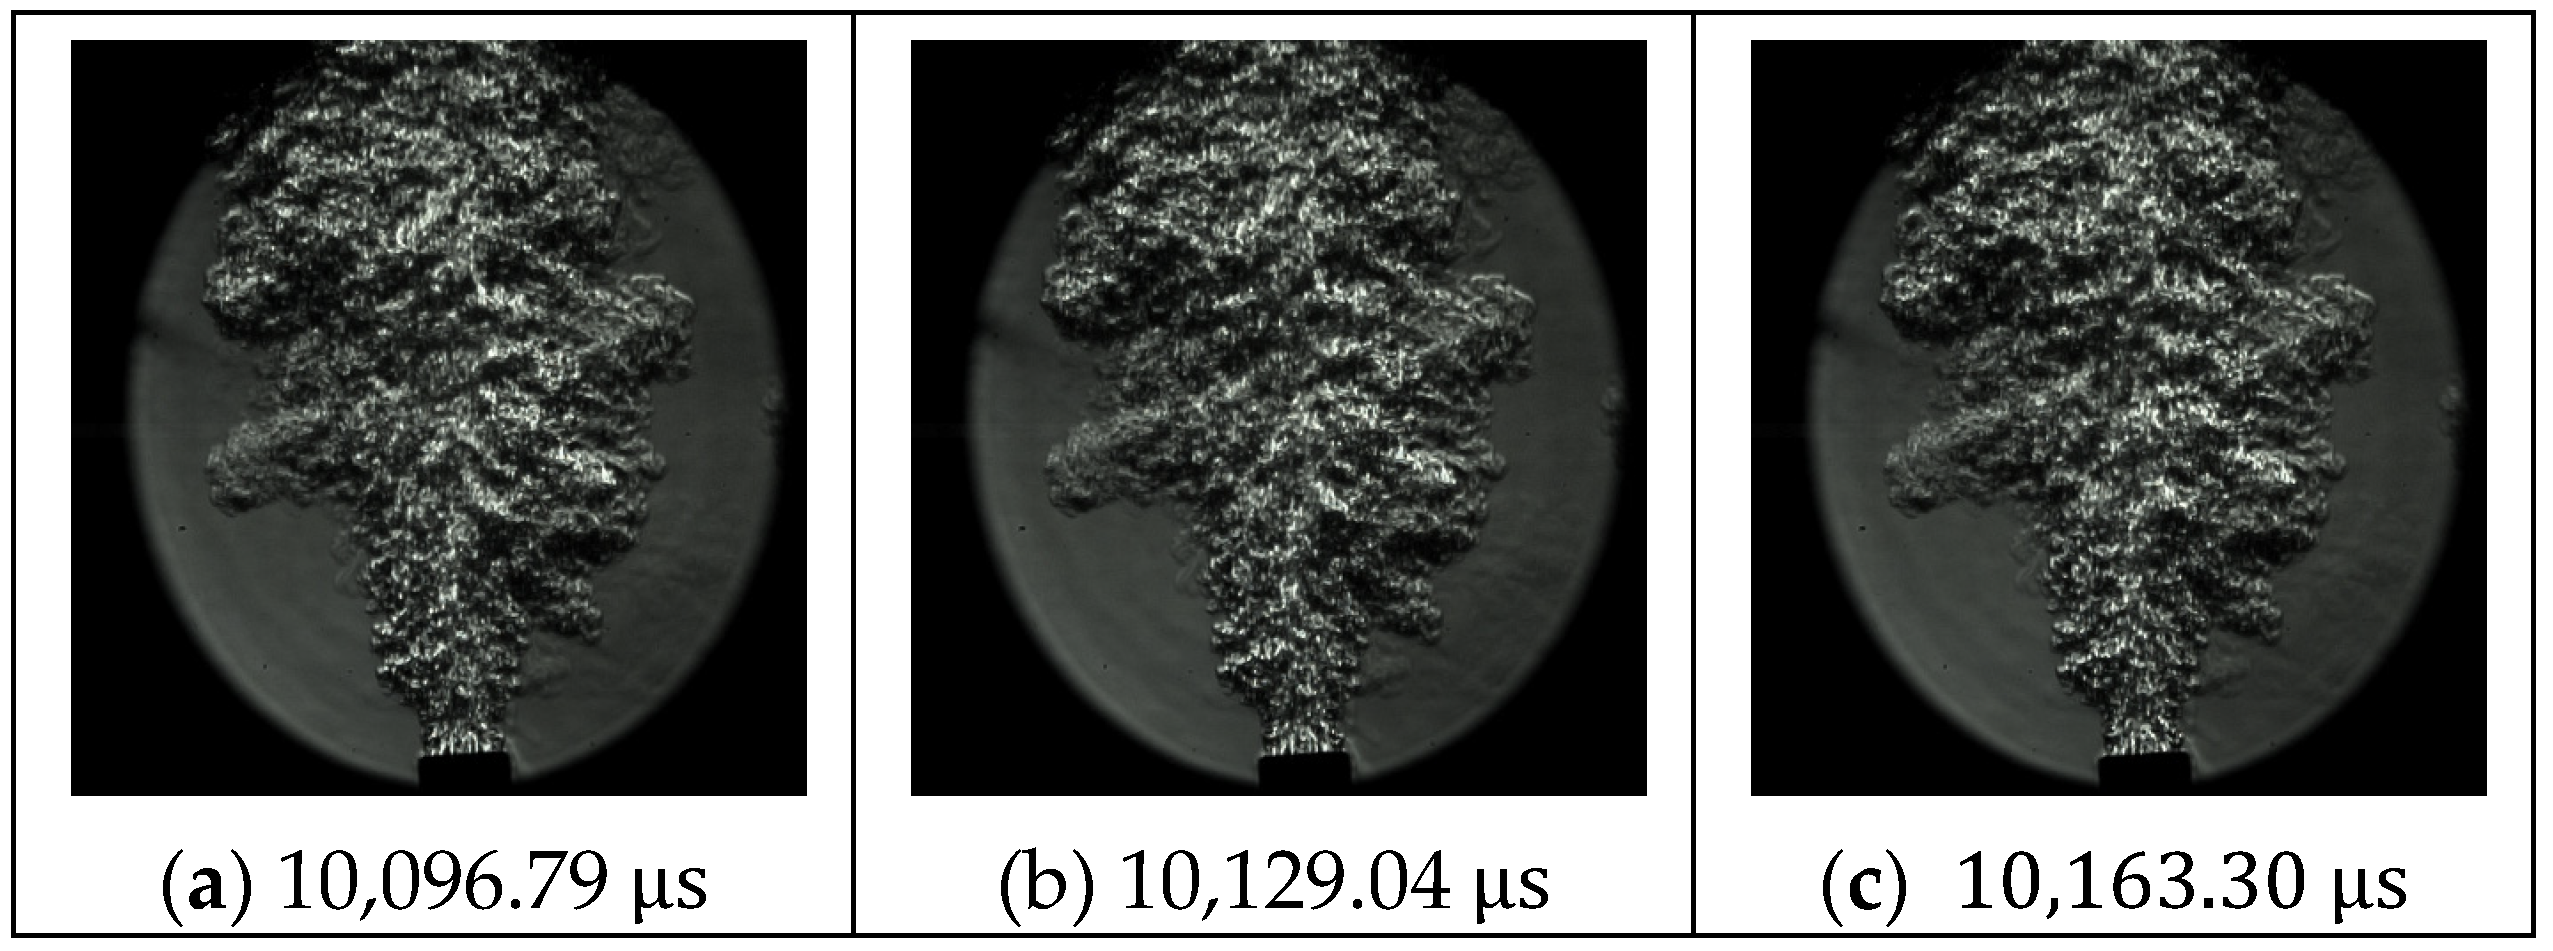
In Figure 39, the combustion gases continue to be exhausted at decreasing velocities.
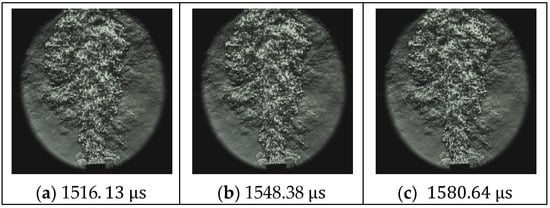
Figure 39.
Normal flow for mixture.
As the flue gas mass is exhausted from the combustor, both the exhaust velocity and the static pressure inside the chamber decrease up to a moment when the flow through the exhaust pipe reverses, and the surrounding air and burned gas are entrained inside the PDC. This moment is captured in Figure 39c, and on average, it occurs at 1598 . The reversed flow, shown in Figure 40, on average, occurs for 1705 .
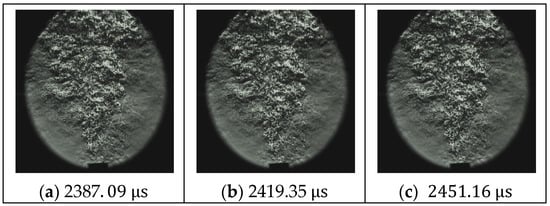
Figure 40.
Reversed flow for mixture.
The flow returns to an upward sense from the detonator towards the exhaust, and a new detonation wave appears at the end of the combustor, Figure 41, and the process repeats itself. On average, the frequency computed from the Schlieren images is 100.4 .
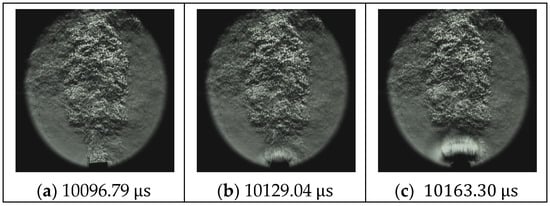
Figure 41.
Appearance of the next leading shock wave for mixture.
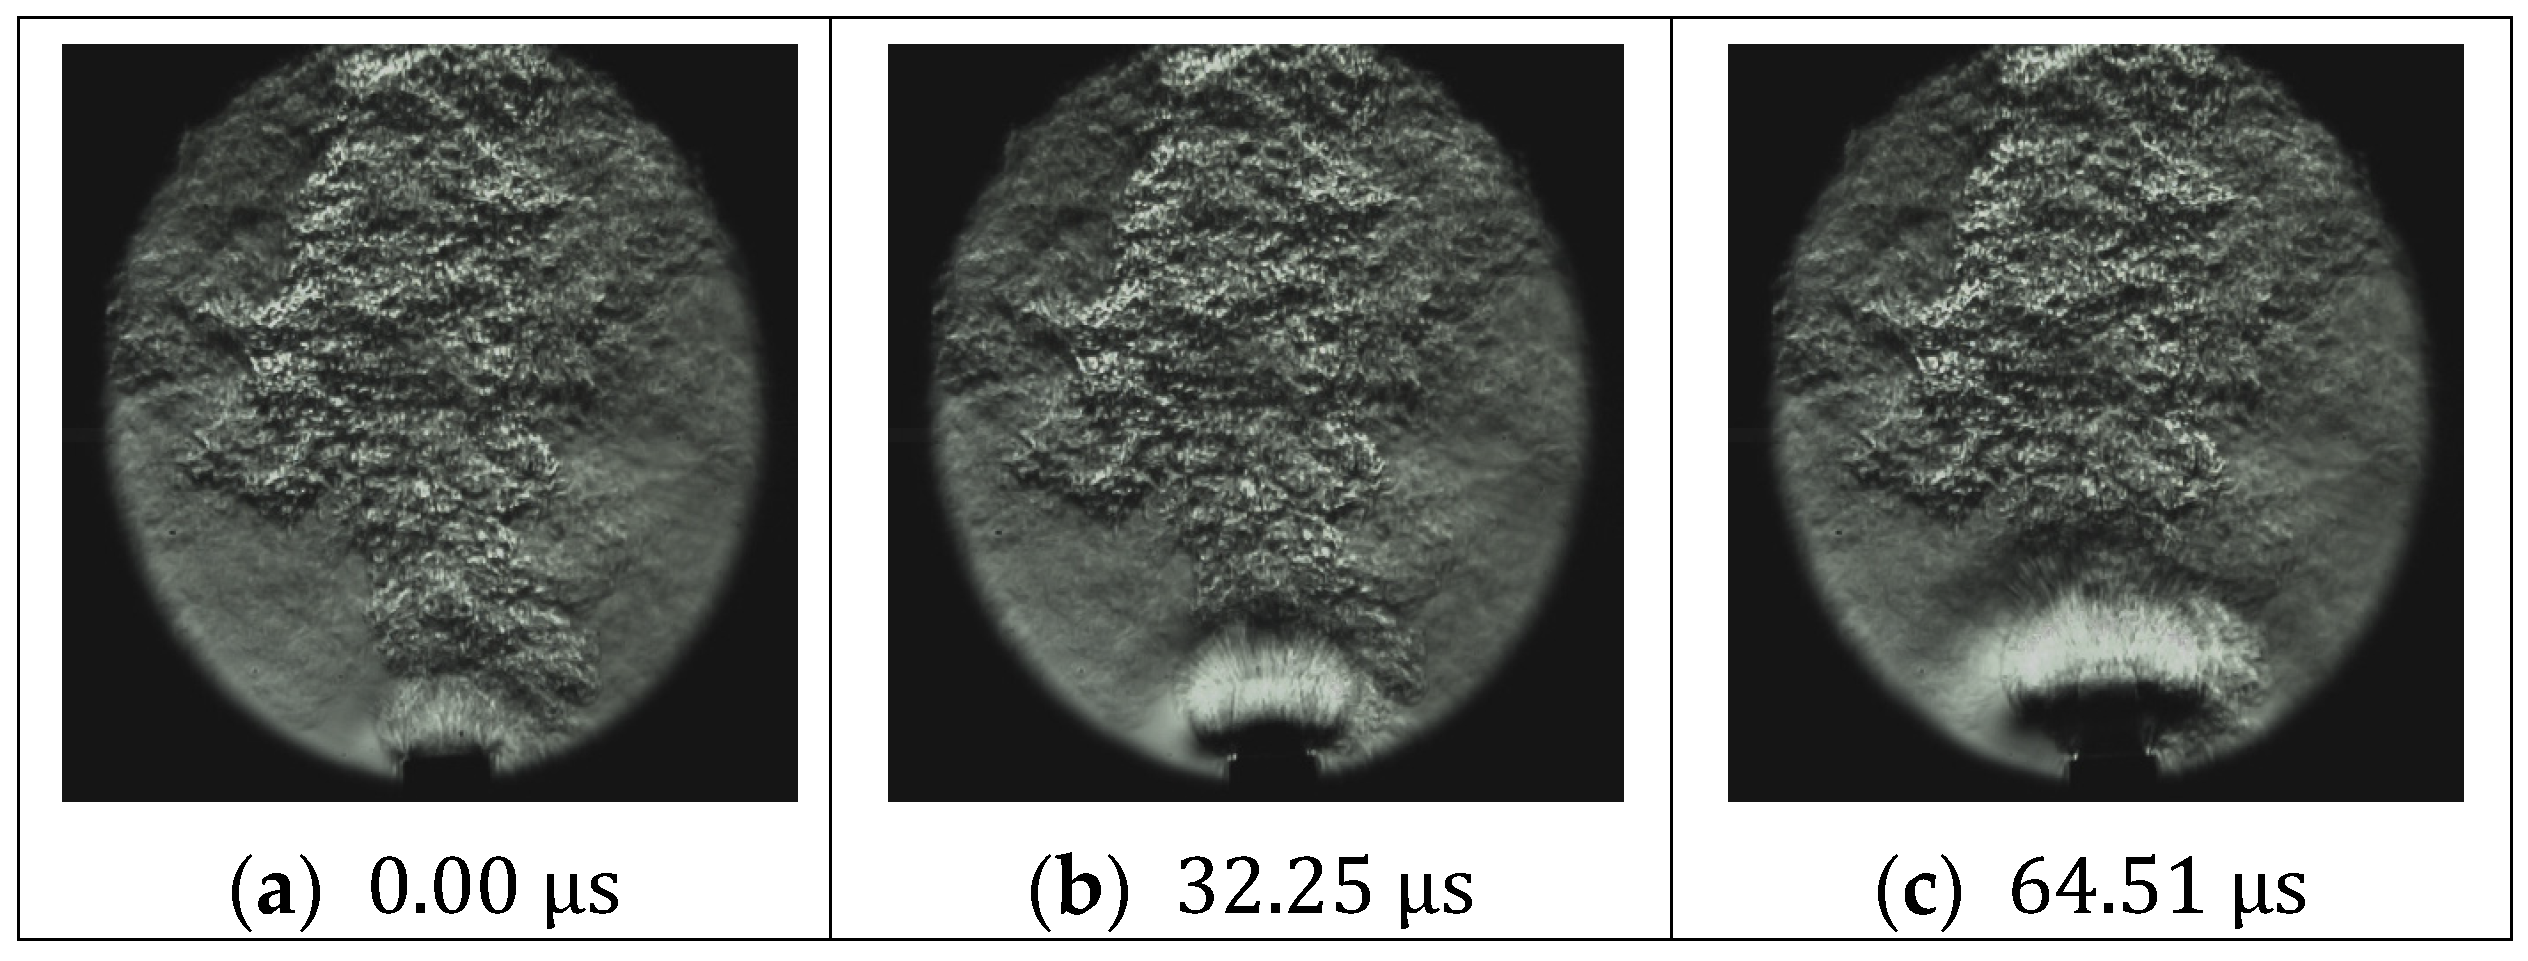
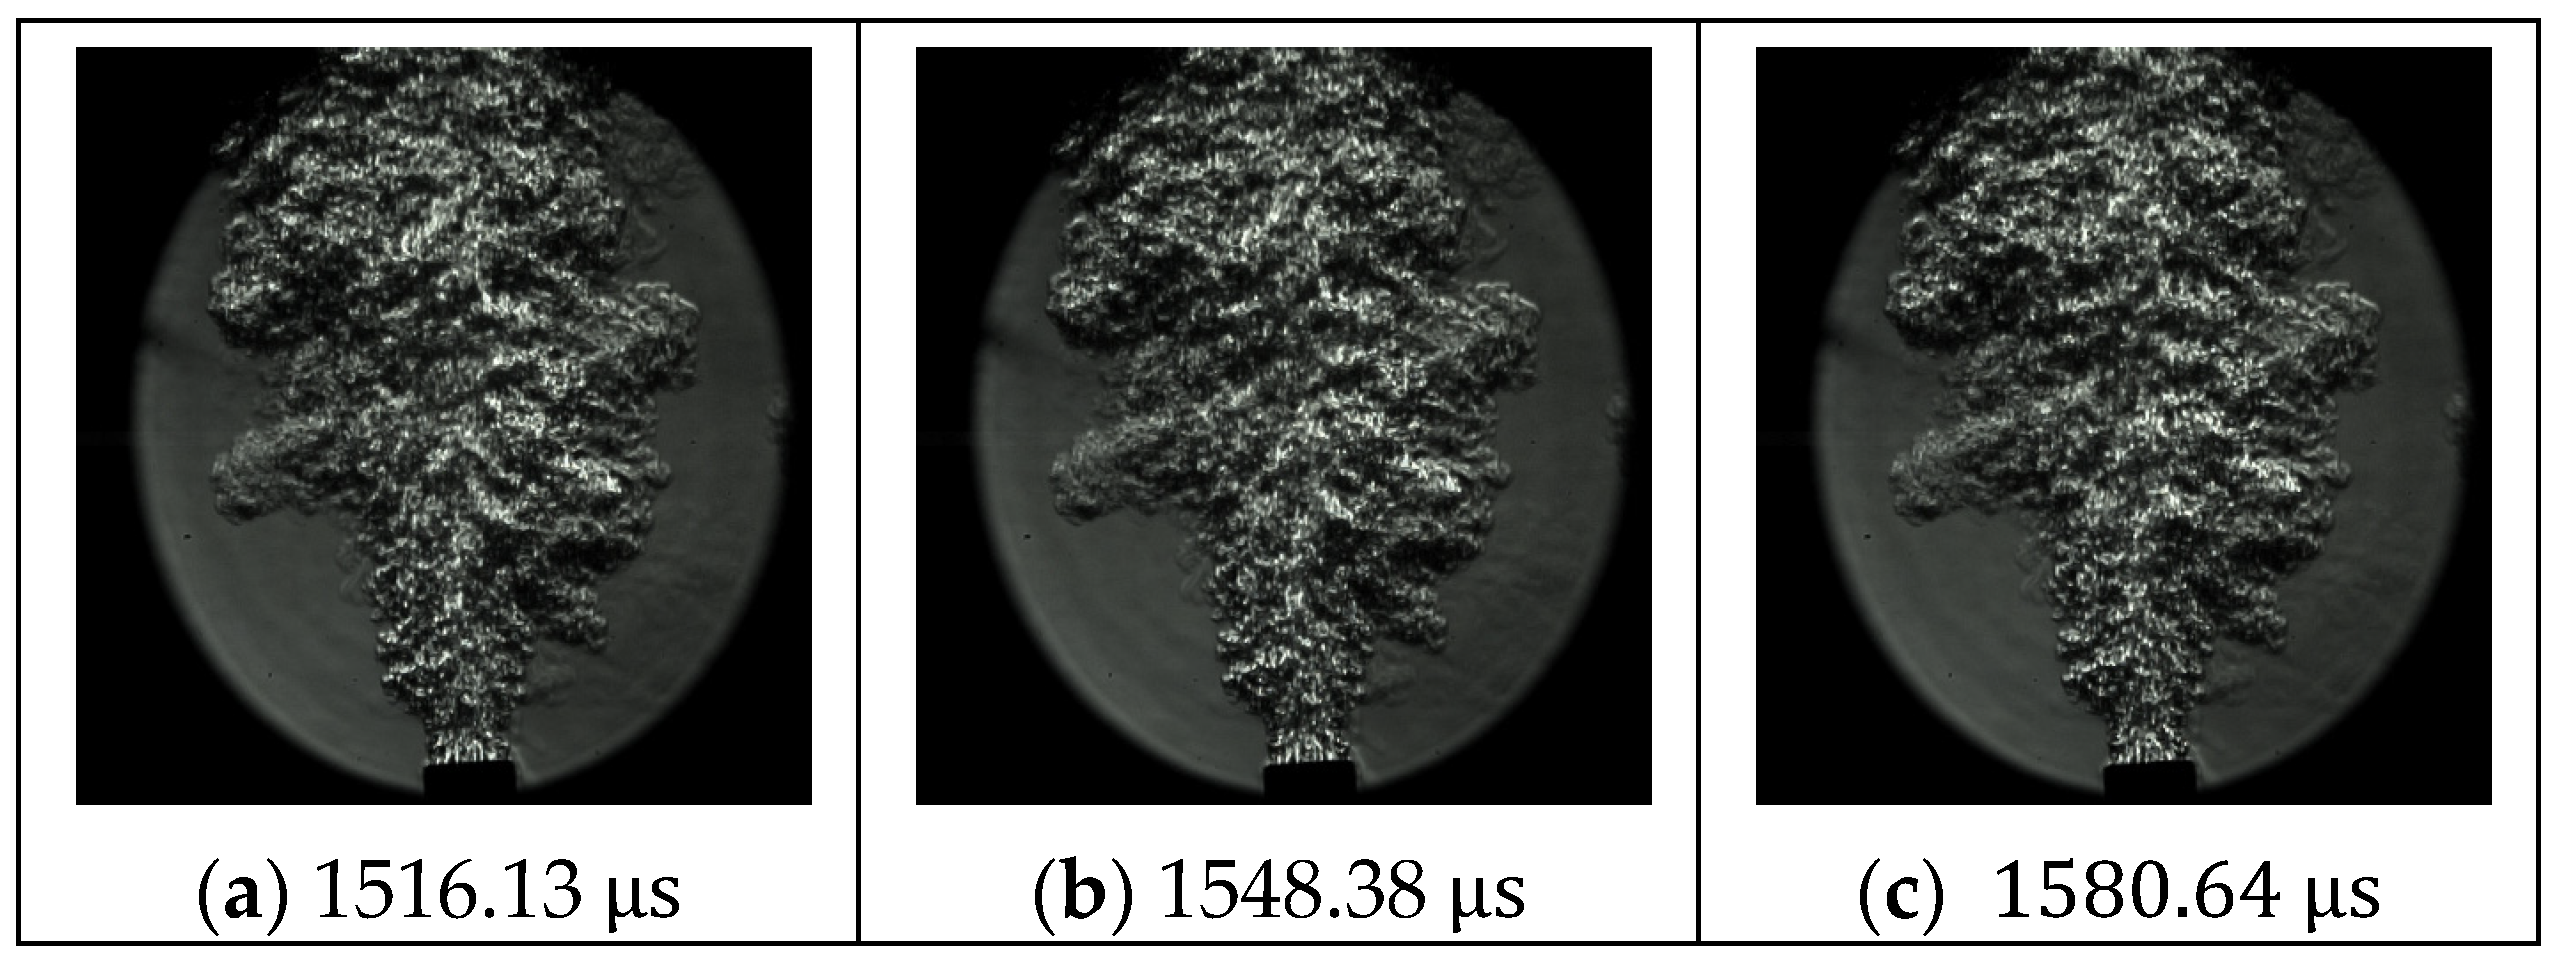
Hydrogen/Oxygen
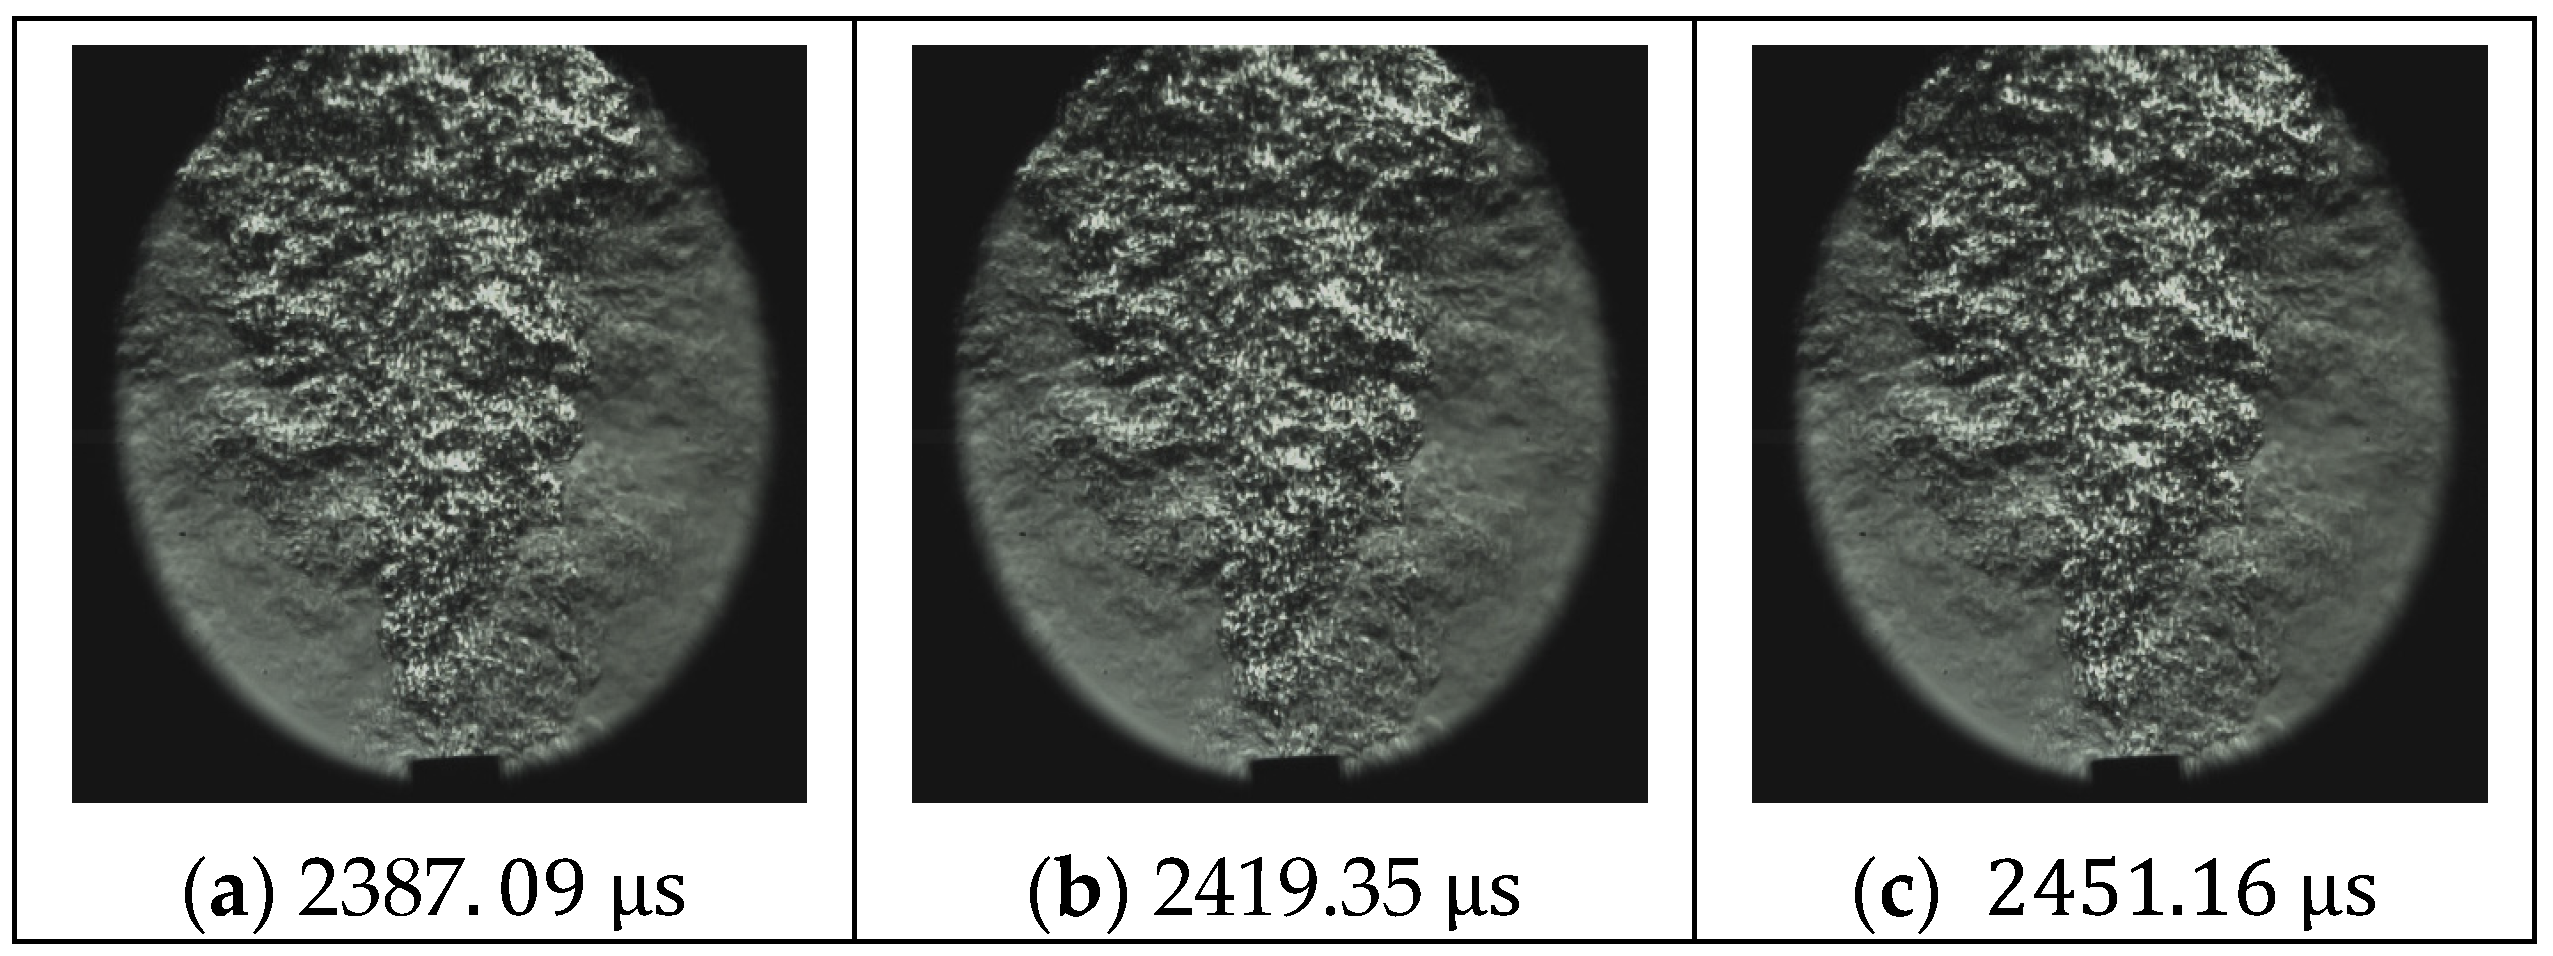
The same Schlieren analysis has been performed for the second mixture. The appearance of the leading shock wave is presented in Figure 42.
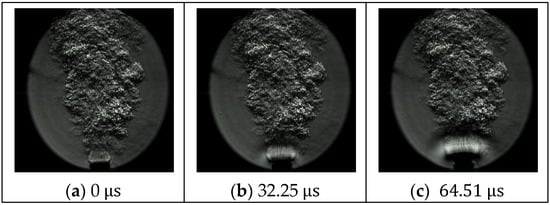
Figure 42.
Leading shock wave propagation for mixture.
The average velocity of the shock wave is slightly higher at 699 After the leading shock wave, the Mach disk structure (Figure 43) forms next, validating the existence of a supersonic regime in the flow, as for the previous mixture case. The average Mach angle value is 53°, corresponding to a Mach number of 1.3. The maximum value of the Mach number is reached, on average, after 217 from the appearance of the shock wave (Figure 43b).
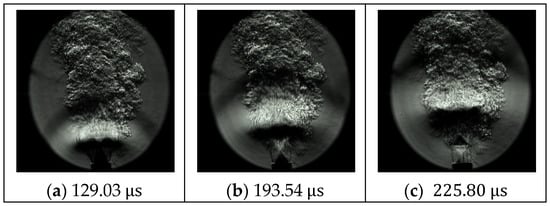
Figure 43.
Mach disk structure for mixture.
Behind the leading shock wave, combustion products start to exit the exhaust pipe. The distance over which the combustion front lags behind the wave is smaller in the case of pure Oxygen. The mean flow velocity, estimated as before, is 598 The presence of detonation in the PDC, confirmed both by the existence of a supersonic flow achieved by heat addition only and by previously discussed pressure data indicating pressure gain combustion, validates the assumption that the shock wave and the combustion wave should have been coupled in a detonation wave, upstream of the visualization area.
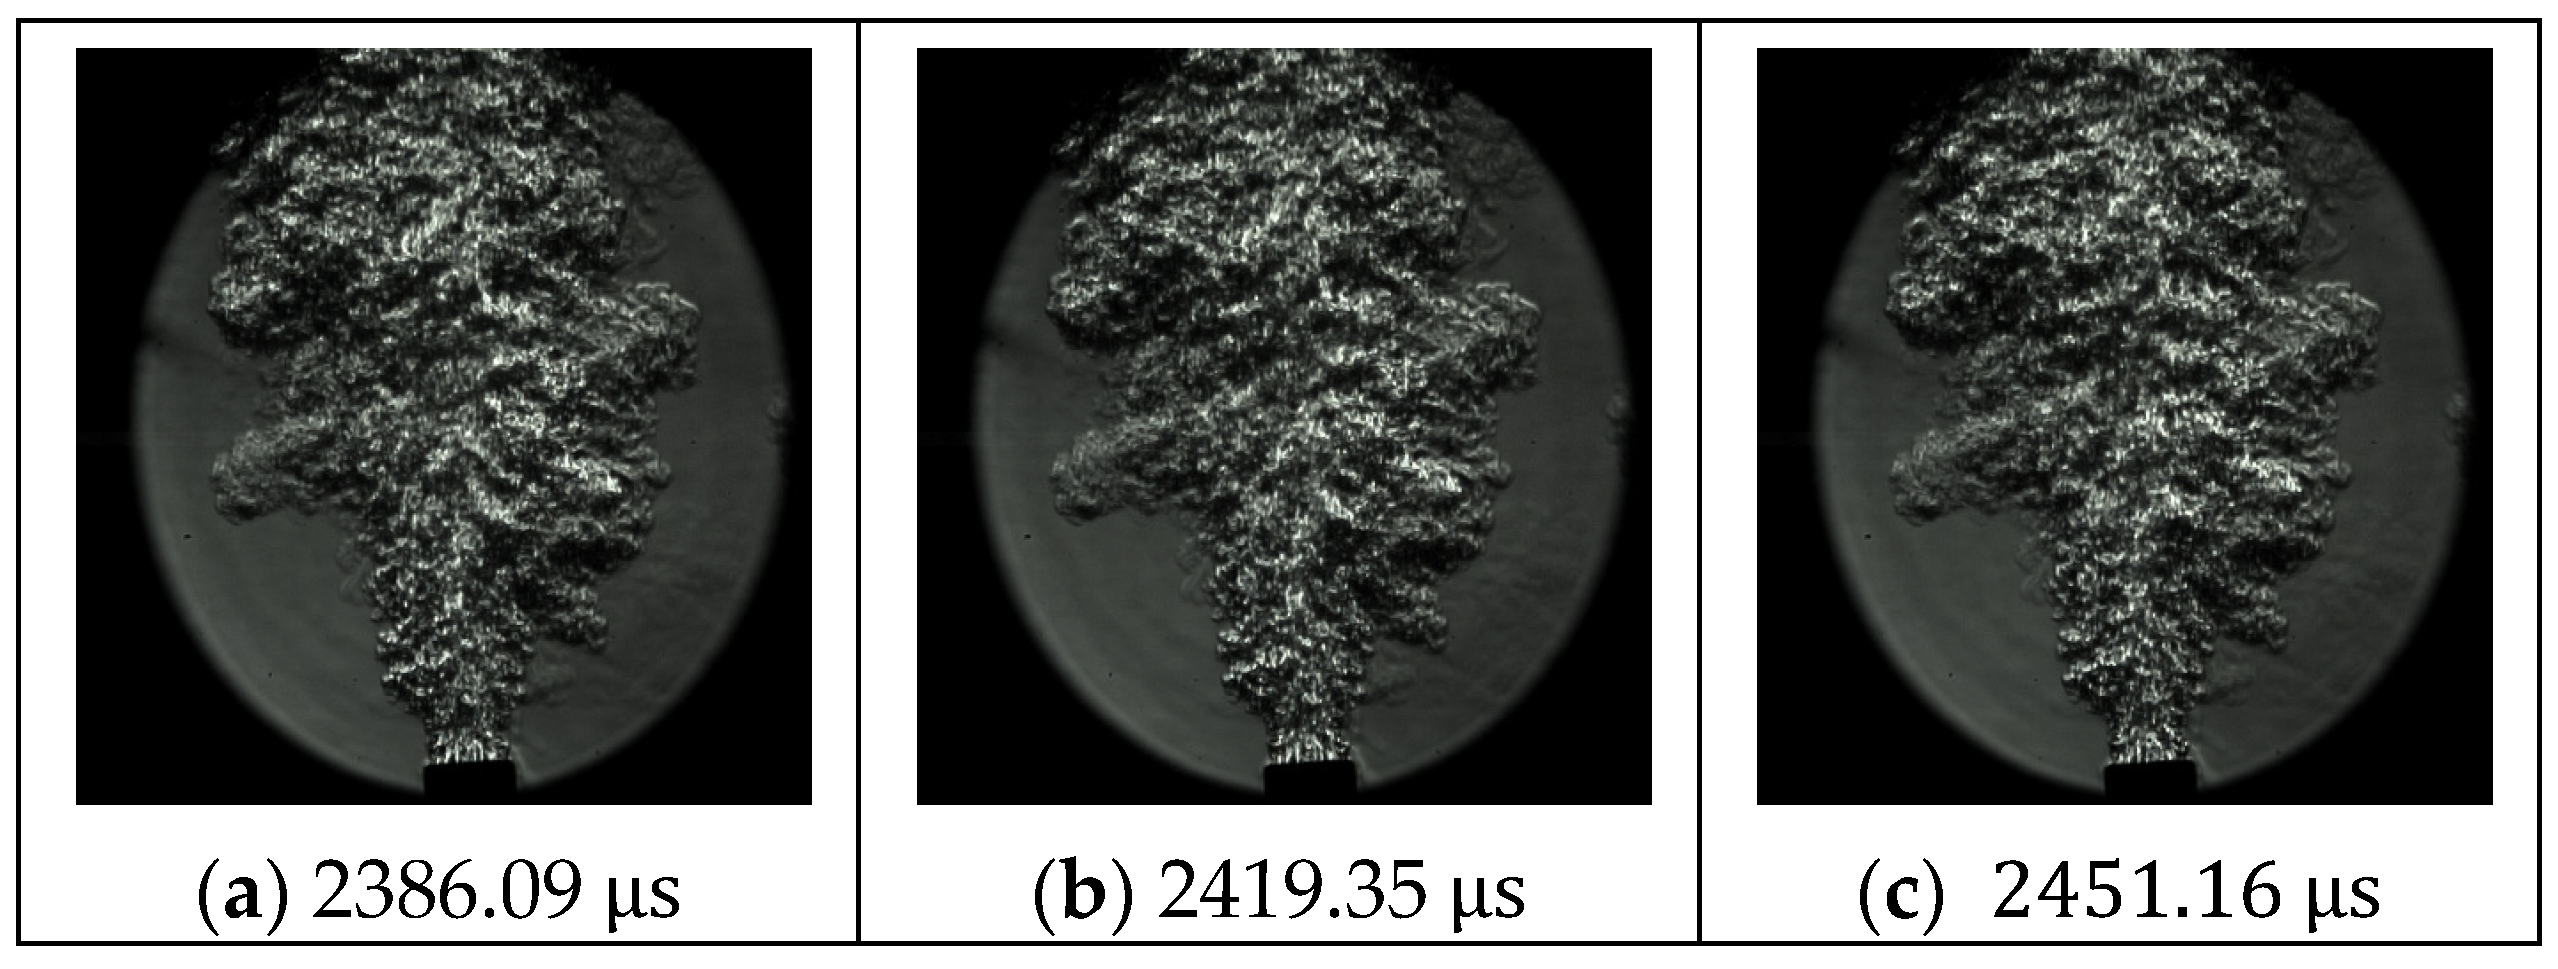
Oxygen combustion yields higher temperatures in the absence of Nitrogen acting as a heat sink, so the speed of sound is higher than Oxygen, as is the leading shock wave propagation velocity. However, the reduced lag indicates that the combustion front propagates even faster, canceling, in part, the delay accumulated while the waves propagate through the exhaust pipe. This is a result of the faster chemistry combustion of the reactants.
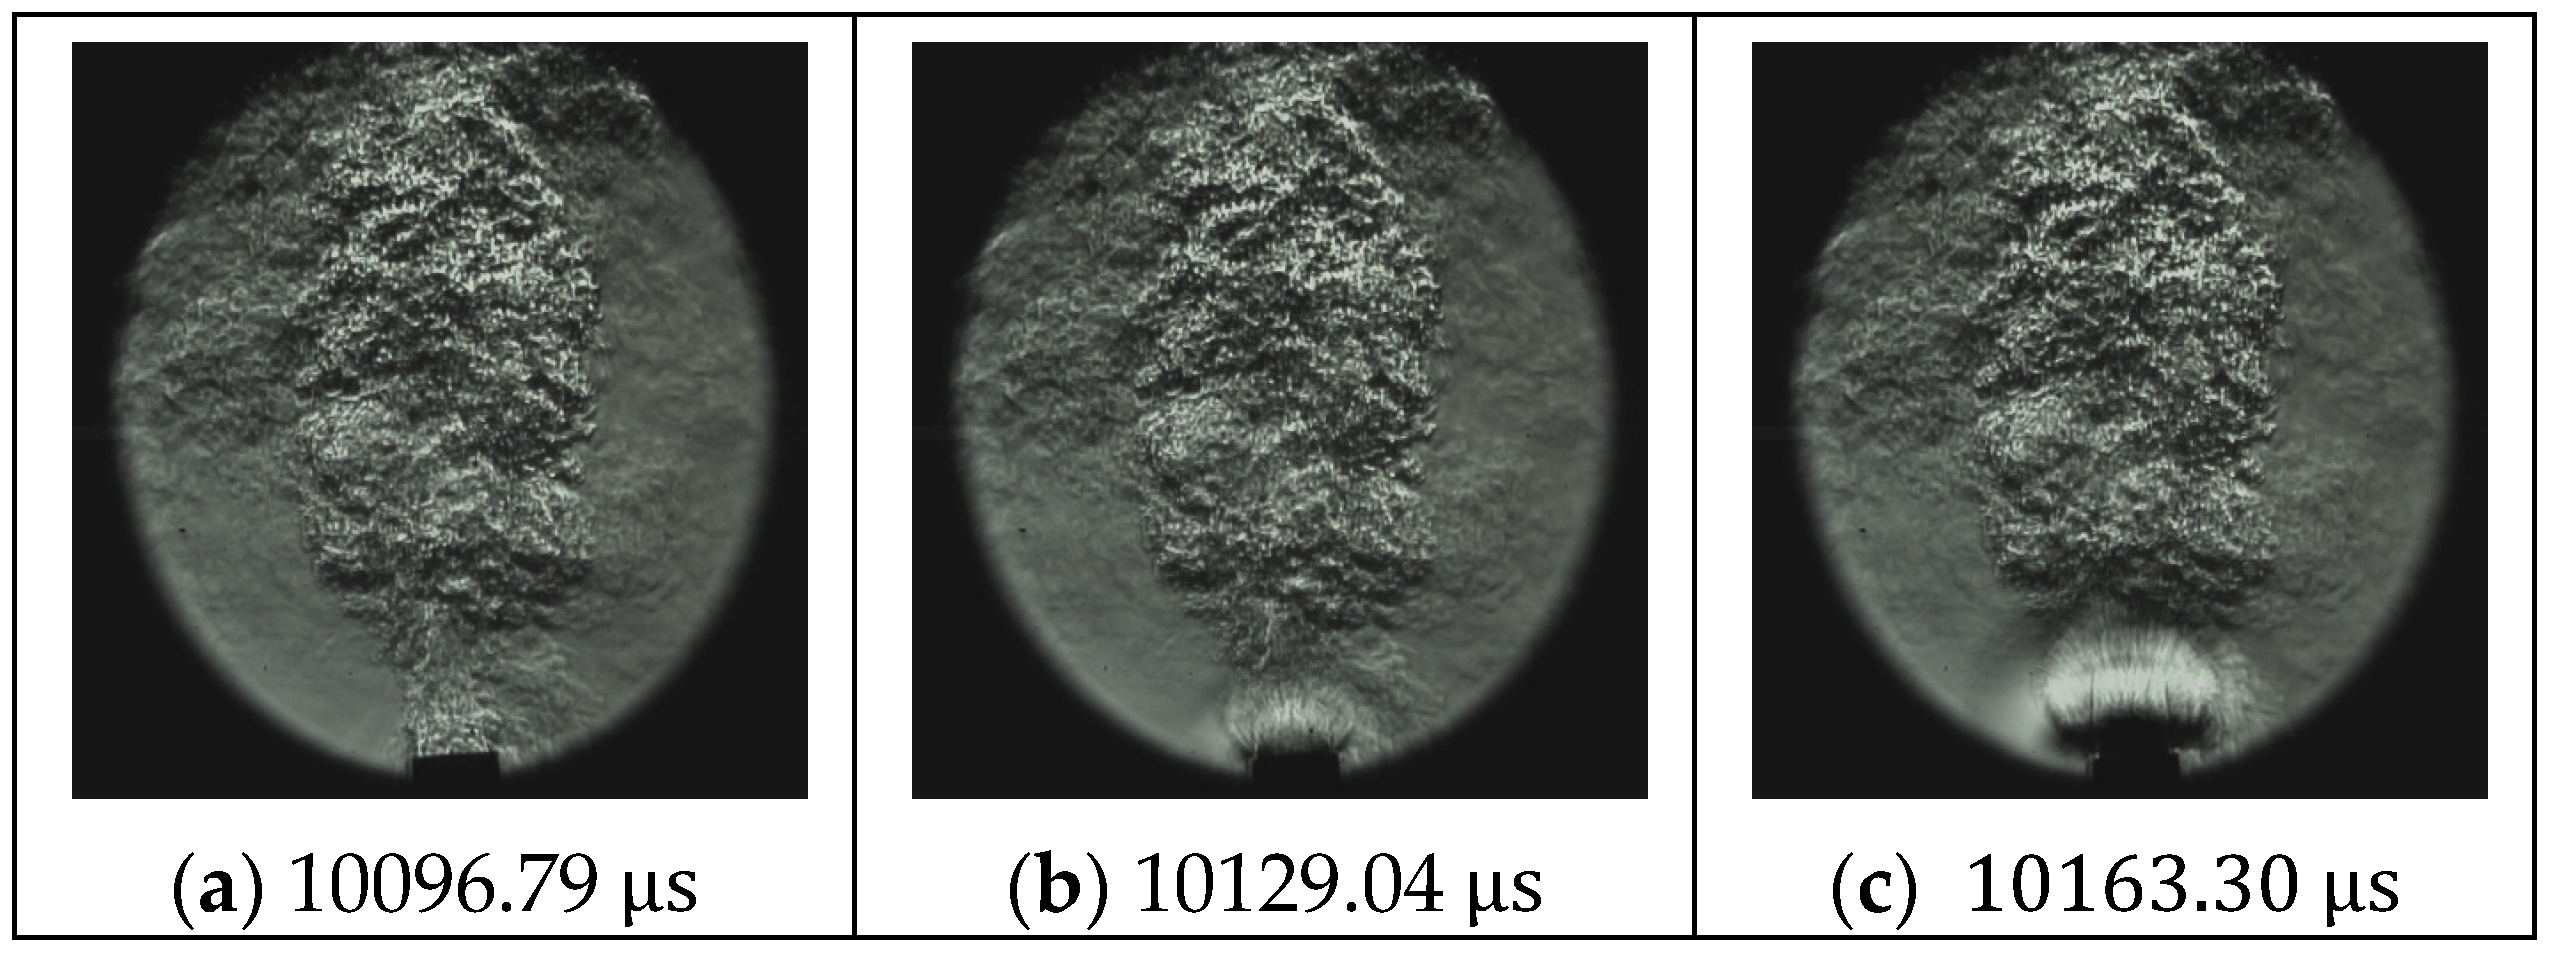
The start of the flow reversal, shown in Figure 44, occurs significantly later for Oxygen than for air, at 2311 , on average. This is in line with the previous observation. The flow velocity at the exhaust pipe is higher for Oxygen. As the initial momentum is higher, the time to dissipate it is longer.
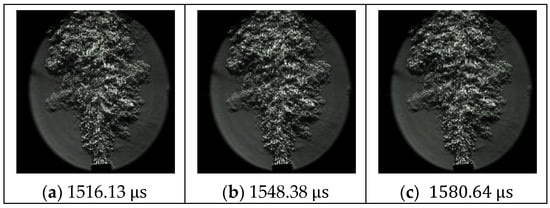
Figure 44.
Normal flow for mixture.
The duration of the reversed flow (Figure 45) is shorter for Oxygen combustion, estimated, on average, at 1331. Once more, this is due to the higher impulse imparted into the gas at detonation. It is noteworthy that for some Hydrogen/Oxygen cycles, the reversed flow regime completely vanishes, while for others, its duration may exceed the reversed flow duration for air.
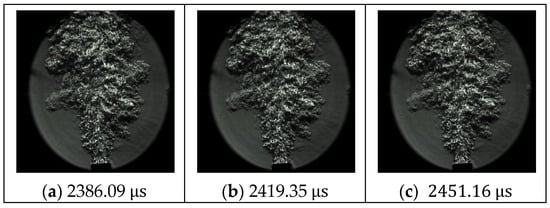
Figure 45.
Reversed flow for mixture.
The return of the flow to the normal direction (detonator to exhaust pipe) also occurs later for Oxygen than for air. A new detonation wave appears at the end of the detonation pipe, as seen in Figure 46, proving the cycle of the PDC.
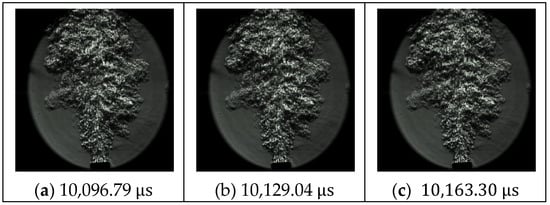
Figure 46.
Appearance of the next leading shock wave for mixture.
4. Conclusions
Based on the shape of the recorded pressure signals and the Schlieren visualizations, the tested PDC reached sustained detonation cycles for different operating conditions in terms of ER, spark plug frequency, and exhaust pipe length.
The obtained maximum pressure values are expected to be lower than the theoretical ones. Theoretically, the CJ values should have been found exactly at the ignition spot, while the current pressure signals are recorded further downstream in the exhaust pipe (36 mm for K1 and 136 mm for K2) due to the limited temperature exposure of the sensors. In the detonation chamber, where the spark plug is located and the exhaust pipe, there is also a step size that influences the intensity of the detonation wave. Furthermore, its intensity decays as the detonation wave travels downstream due to the shear layer formed inside the tube and due to the heat exchange with the walls, which have lower temperatures. The influence of the step size in the current geometry is quite large, as an abrupt penalty in terms of pressure gain is introduced between the theoretical CJ parameters and the measured pressure gain. According to CEA equilibrium computations, for the Hydrogen–air mixture, the detonation pressure ratio varies from 12 at ER = 1 down to 3 at ER 0.1, while for the Hydrogen–Oxygen mixture, the detonation pressure ratio varies from 15 at ER = 1 down to 8 at ER = 0.1.
The optimal operation of the PDC, in terms of maximum and average cycle pressures, is found to occur at 6 bar oxidizer line pressure (total) and 10 bar fuel line pressure (also total) for both air and Oxygen. The optimal exhaust pipe length is 500 mm for air and 300 mm for Oxygen. Based on the operating frequency data, the optimal spark plug frequency is 100 Hz in both cases.
For the same equivalency ratio, it is observed in both experimental operations that the average and maximum pressures rise with exhaust pipe length and oxidizer pressure, while the influence of spark plug frequency is negligible.
In terms of equivalence ratio, for low oxidizer pressure, an optimal equivalence ratio exists, and its value decreases with increasing exhaust pipe length in both campaigns, the pressure cutoff limit being 4.5 bar for air and 6.0 bar for Oxygen. For higher oxidizer pressures, the trend is reversed, and an equivalence ratio corresponding to a minimum value for both the average and the maximum pressure was found to exist. Further investigations on the behavior of the PDC for very small fuel mass flow rates are needed.
The thruster operating frequency is found to be driven by the spark plug and is often lower than this due to misfires in initiating the detonation cycle. As expected, the design frequency of 100 Hz provides the least number of misfires. For off-design frequencies, the data show that if air is used as an oxidizer, a spark plug frequency of 150 Hz can be reproduced by the PDC system in some cases. In all other cases, frequencies above the design frequency forced by the spark plug can be obtained in some cases but never reach the spark plug frequency due to misfires.
Low equivalence ratios are found to yield more misfires for both experimental campaigns. Short exhaust pipes lead to fewer misfires in air and for high Oxygen pressure, while longer exhaust pipes operate better at low Oxygen pressures.
Author Contributions
Conceptualization, T.C., I.P., A.V.C. and C.E.H.; methodology, I.P., A.V.C. and M.G.; software, A.B.; validation, I.P., A.V.C. and M.G.; formal analysis, A.V.C.; investigation, T.C., A.V.C., I.P. and A.B.; resources, I.P. and C.E.H.; data curation, A.V.C., A.B. and I.P.; writing—original draft preparation, I.P. and A.V.C.; writing—review and editing, A.V.C. and M.G.; visualization, A.V.C. and M.G.; supervision, A.V.C.; project administration, I.P.; funding acquisition, I.P. All authors have read and agreed to the published version of the manuscript.
Funding
This work was funded by the European Space Agency project No. 1000027451-8000015065-3 PDT (“Pulsed Detonation Thruster”), the Romanian Competitiveness Operational Programme No. PN-III-P2-2.1-PED-2019-0577 (“Pulsed Detonation Combustor”), and the Republic of Moldova State Project PS/30.01.2020 20.80009.5007.06 (“Applicability of the intensification of transfer and processing in electric, electromagnetic and cavitation fields”).
Data Availability Statement
Data are contained within the article.
Conflicts of Interest
The authors declare no conflicts of interest.
References
- Cuciumita, C.F.; Cuciuc, T.; Porumbel, I. Evaluation of the Cycle Avearged Performances of PDE Based on Thermodynamic Cycle Computation. In Proceedings of the ASME Turbo Expo 2016, Seoul, Republic of Korea, 13–17 June 2016. GT2016-57310. [Google Scholar]
- Wintenberger, E.; Shepherd, J.E. Thermodynamic Cycle Analysis for Propagating Detonations. J. Propuls. Power 2006, 22, 694–697. [Google Scholar] [CrossRef]
- Lu, F.K.; Braun, E.M. Rotating Detonation Wave Propulsion: Experimental Challenges, Modeling, and Engine Concepts. J. Propuls. Power 2014, 30, 1125–1142. [Google Scholar] [CrossRef]
- Kailasanath, K. Review of Propulsion Applications of Detonation Waves. AIAA J. 2000, 38, 1698–1708. [Google Scholar] [CrossRef]
- Caldwell, N.; Glaser, A.; Gutmark, E. A review of pulse detonation engine research at the University of Cincinnati. In Proceedings of the 43rd AIAA/ASME/SAE/ASEE Joint Propulsion Conference & Exhibit, Cincinnati, OH, USA, 8–11 July 2007; p. 5697. [Google Scholar]
- Braun, E.M.; Lu, F.K.; Wilson, D.R.; Camberos, J.A. Air breathing rotating detonation wave engine cycle analysis. Aerosp. Sci. Technol. 2013, 27, 201–208. [Google Scholar] [CrossRef]
- Pegg, R.J.; Couch, B.D.; Hunter, L.G. Pulse detonation engine air induction system analysis. In Proceedings of the 32nd Joint Propulsion Conference and Exhibit, Lake Buena Vista, FL, USA, 1–3 July 1996. AIAA Paper 96-2918. [Google Scholar]
- Cutler, A.D. Parametric Study of High Frequency Pulse Detonation Tubes. In Proceedings of the 44th AIAA/ASME/SAE/ASEE Joint Propulsion Conference & Exhibit, Hartford, CT, USA, 21–23 July 2008. AIAA Paper 2008-4691. [Google Scholar]
- Matsuoka, K.; Muto, K.; Kasahara, J.; Endo, T. Development of High-Frequency Pulse Detonation Combustor without Purging Material. J. Propuls. Power 2017, 33, 43–50. [Google Scholar] [CrossRef]
- Schwinn, K.; Gejji, R.; Kan, B.; Sardeshmukh, S.; Heister, S.; Slabaugh, C.D. Self-sustained, high-frequency detonation wave generation in a semi-bounded channel. Combust. Flame 2018, 193, 384–396. [Google Scholar] [CrossRef]
- Zeldovich, Y.B. On the theory of the propagation of detonation in gaseous systems. J. Exp. Theor. Phys. 1940, 10, 542–568. (In Russian) [Google Scholar]
- Hoffmann, N. Reaction Propulsion by Intermittent Detonative Combustion. Ger. Minist. Supply 1940, AI152365, 161–167, Volkenrode Translation. [Google Scholar]
- Walker, S.H.; Shell, D.; Schena, R.; Bergmann, J.F.; Gladbach, J. The DARPA/AF Falcon Program: The Hypersonic Technology Vehicle #2 (HTV-2) Flight Demonstration Phase. In Proceedings of the 15th AIAA International Space Planes and Hypersonic Systems and Technologies Conference, Dayton, OH, USA, 28 April 2008–1 May 2008. AIAA 2008-2539. [Google Scholar]
- Gulen, S. Pressure gain combustion advantage in land-based electric power generation. J. Glob. Power Propuls. Soc. 2017, 1, 288–302. [Google Scholar] [CrossRef]
- Sakurai, T.; Sekiguchi, T.; Inoue, S. Evaluation of Pressure Gain and Turbine Inlet Conditions in a Pulse Combustion Gas Turbine. In Turbo Expo: Power for Land, Sea, and Air; American Society of Mechanical Engineers: New York, NY, USA, 2022; Volume 86007, p. V03BT04A053. [Google Scholar]
- Baptista, M.; Rasheed, A.; Badding, B.; Velagandula, O.; Dean, A. Mechanical response in a multi-tube pulsed detonation combustor-turbine hybrid system. In Proceedings of the 44th AIAA Aerospace Sciences Meeting and Exhibit, Reno, NV, USA, 9–12 January 2006; p. 1234. [Google Scholar]
- Frolov, S.M. Liquid-fueled, air-breathing pulse detonation engine demonstrator: Operation principles and performance. J. Propuls. Power 2006, 22, 1162–1169. [Google Scholar] [CrossRef]
- Frolov, S.M. Natural-gas-fueled pulse-detonation combustor. J. Propuls. Power 2014, 30, 41–46. [Google Scholar] [CrossRef]
- Wang, K.; Fan, W.; Lu, W.; Chen, F.; Zhang, Q.; Yan, C. Study on a liquid-fueled and valveless pulse detonation rocket engine without the purge process. Energy 2014, 71, 605–614. [Google Scholar] [CrossRef]
- Card, J.; Rival, D.; Ciccarelli, G. DDT in fuel–air mixtures at elevated temperatures and pressures. Shock Waves 2005, 14, 167–173. [Google Scholar] [CrossRef]
- Warimani, M.; Azami, M.H.; Khan, S.A.; Ismail, A.F.; Saharin, S.; Ariffin, A.K. Internal flow dynamics and performance of pulse detonation engine with alternative fuels. Energy 2021, 237, 121719. [Google Scholar] [CrossRef]
- Soni, S.K.; Singh, A.; Sandhu, M.; Goel, A.; Sharma, R.K. Numerical simulation to investigate the effect of obstacle on detonation wave propagation in a pulse detonation engine combustor. Int. J. Emerg. Technol. Adv. Eng. 2013, 3, 458–464. [Google Scholar]
- Falempin, F.; Bouchaud, D.; Daniau, E. Pulsed detonation engine—Towards a tactical missile application. In Proceedings of the 36th AIAA/ASME/SAE/ASEE Joint Propulsion Conference and Exhibit, Las Vegas, NV, USA, 24–28 July 2000; p. 3473. [Google Scholar]
- Teasley, T.W.; Fedotowsky, T.M.; Gradl, P.R.; Austin, B.L.; Heister, S.D. Current State of NASA Continuously Rotating Detonation Cycle Engine Development. In Proceedings of the AIAA SCITECH 2023 Forum, National Harbor, MD, USA, 23–27 January 2023. AIAA 2023-1873. [Google Scholar]
- Goto, K.; Matsuoka, K.; Matsuyama, K.; Kawasaki, A.; Watanabe, H.; Itouyama, N.; Kazuki Ishihara, K.; Buyakofu, V.; Noda, T.; Kasahara, J.; et al. Space Flight Demonstration of Rotating Detonation Engine Using Sounding Rocket S-520-31. J. Spacecr. Rocket. 2023, 60, 273–285. [Google Scholar] [CrossRef]
- Trevithick, J. GE’s Breakthrough in ‘Detonating’ Hypersonic Propulsion Is a Big Deal. The War Zone. 2023. Available online: https://www.thedrive.com/the-war-zone/ges-breakthrough-in-detonating-hypersonic-propulsion-is-a-big-deal (accessed on 14 December 2023).
- New, T.H.; Panicker, P.K.; Lu, F.K.; Tsai, H.M. Experimental Investigations on DDT Enhancements by Schelkin Spirals in a PDE. In Proceedings of the 44th AIAA Aerospace Sciences Meeting and Exhibit, Reno, NV, USA, 9–12 January 2006. [Google Scholar]
- Schultz, E.; Wintenberger, E.; Shepherd, J. Investigation of Deflagration to Detonation Transition for Application to Pulse Detonation Engine Ignition Systems. In Proceedings of the 16th JANNAF Propulsion Symposium, Pasadena, CA, USA, 6–9 May 1999. [Google Scholar]
- Sorin, R.; Zitoun, R.; Desbordes, D. Optimization of the deflagration to detonation transition: Reduction of length and time of transition. Shock. Waves 2006, 15, 137–145. [Google Scholar] [CrossRef]
- Veser, A.; Breitung, W.; Dorofeev, S.B. Run-up distances to supersonic flames in obstacle-laden tubes. J. Phys. IV Fr. 2002, 12, 333–340. [Google Scholar] [CrossRef]
- Wilson, J.; Wernet, M.P.; Paxson, D.E. Vortex Rings Generated by a Shrouded Hartmann–Sprenger Tube. AIAA J. 2006, 44, 2706–2718. [Google Scholar] [CrossRef]
- Wu, Y.; Han, Q.; Yang, G. Effects of an acoustic atomizer upon liquid-fueled detonation initiations in a detonation tube. Exp. Therm. Fluid Sci. 2019, 109, 109863. [Google Scholar] [CrossRef]
- Frolov, S.; Smetanyuk, V.; Aksenov, V.; Koval, A. Deflagration-to-detonation transition in crossedflow fast jets of propellant components. In Doklady Physical Chemistry; Springer: Berlin/Heidelberg, Germany, 2017; Volume 476, pp. 153–156. [Google Scholar]
- Cojocea, A.V.; Cuciuc, T.; Porumbel, I.; Gall, M.; Gherman, B.; Crunţeanu, D.E. Experimental Investigations of Hydrogen Fuelled Pulsed Detonation Combustor. In Turbo Expo: Power for Land, Sea, and Air; American Society of Mechanical Engineers: New York, NY, USA, 2022; Volume 86007, p. V03BT04A020. [Google Scholar]
- Shepherd, J. Detonation Database. 2002. Available online: https://shepherd.caltech.edu/detn_db/html/db.html (accessed on 12 May 2024).
- Peraldi, O.; Knystautas, R.; Lee, J.H. Criteria for transition to detonation in tubes. In Symposium (International) on Combustion; Elsevier: Amsterdam, The Netherlands, 1988; Volume 21, pp. 1629–1637, No. 1. [Google Scholar]
- Chan, C.K.; Greig, D.R. The structures of fast deflagrations and quasi-detonations. In Symposium (International) on Combustion; Elsevier: Amsterdam, The Netherlands, 1989; Volume 22, pp. 1733–1739, No. 1. [Google Scholar]
- Teodorczyk, A.; Lee, J.H.S.; Knystautas, R. Propagation mechanism of quasi-detonations. In Symposium (International) on Combustion; Elsevier: Amsterdam, The Netherlands, 1989; Volume 22, pp. 1723–1731, No. 1. [Google Scholar]
Disclaimer/Publisher’s Note: The statements, opinions and data contained in all publications are solely those of the individual author(s) and contributor(s) and not of MDPI and/or the editor(s). MDPI and/or the editor(s) disclaim responsibility for any injury to people or property resulting from any ideas, methods, instructions or products referred to in the content. |
© 2024 by the authors. Licensee MDPI, Basel, Switzerland. This article is an open access article distributed under the terms and conditions of the Creative Commons Attribution (CC BY) license (https://creativecommons.org/licenses/by/4.0/).