Article

Airborne Lithium Battery Health Assessment: An Improved Support Vector Machine Algorithm for Imbalanced Sample Sets

1
College of Automation Engineering, Nanjing University of Aeronautics and Astronautics, Nanjing 211100, China
2
Flight Test Center, Commercial Aircraft Corporation of China, Shanghai 200126, China
3
Shanghai Engineering Research Center of Civil Aircraft Flight Test, Shanghai 201324, China
*
Author to whom correspondence should be addressed.
Aerospace 2024, 11(6), 467; https://doi.org/10.3390/aerospace11060467
Submission received: 11 May 2024 / Revised: 4 June 2024 / Accepted: 5 June 2024 / Published: 11 June 2024
(This article belongs to the Special Issue Recent Advances in Flight Testing)

Abstract

:
The health assessment of airborne lithium batteries is crucial for flight testing, ensuring the safety and reliability of aircraft power systems. This paper proposes a support vector machine-based algorithm for the health assessment of airborne lithium batteries, featuring a dynamic correction mechanism for the risk loss penalty parameter. The proposed approach systematically adjusts risk loss penalty parameters based on sample misjudgment ratios and incorporates fault identification corrections to meet the safety requirements of the airborne operation. The experimental results demonstrate the stability and reliability of the proposed algorithm in hyperplane deviation suppression as well as significant improvements in fault sample recall rates. When compared with traditional SVM and other baseline methods such as Random Forest and SVR, our method significantly outperformed these algorithms in terms of accuracy, recall rate, and precision rate. This study provides an efficient and reliable method for the health assessment of airborne lithium batteries, with significant application value.

1. Introduction

The airborne batteries are an essential component of aircraft auxiliary and emergency power systems. Their health is critical to flight safety [1]. Lithium batteries are known for their superior cycle life and lower maintenance costs compared to traditional alternatives such as lead–acid or nickel–chromium. Therefore, they are at the front of the latest development in airborne power sources [2]. Rigorous health assessments of these batteries are required to prevent potential failures and to keep the aircraft’s electrical systems operating normally. It is worth noting that events like the B787 thermal runaway in 2013 highlight the significant challenges in safety management during the life cycle of airborne lithium batteries [3]. Therefore, reliable methods to assess their health status are urgently needed for improving flight safety.
Extensive research has been conducted on the health assessment of lithium batteries, exploring both offline and online methods [4]. Traditional offline methods such as the capacity fading method [5] and impedance analysis method [6] are mature in technology, but their online applications to airborne lithium batteries remain verified. Meanwhile, data-driven online methods that evaluate external performance metrics have attracted considerable research interest [7,8]. Recent studies have advanced the understanding of the thermal characteristics and liquid cooling designs for lithium batteries, providing insights into better thermal management [9]. The state of health assessment of lithium-ion batteries has also evolved with the application of deep Gaussian process regression, which considers heterogeneous features and enhances prediction accuracy [10]. Additionally, comprehensive reviews on state-of-health characterizations, estimations, and applications highlight the ongoing efforts to refine these methods [11]. Efforts to improve the online state-of-charge estimation through simplified electrochemical models accounting for current bias further contribute to the field [12]. Integrating physics-based and equivalent circuit models offers a balanced approach to model accuracy and computational efficiency [13]. Modeling methods that incorporate commonly used constant current conditions have been developed to better reflect real-world applications [14]. Moreover, new acoustic emission detection and analysis methods for battery health status provide non-invasive and real-time monitoring capabilities [15]. However, these model-based methods often face challenges in accuracy and reliability under complex and harsh conditions, particularly in airborne applications.
This paper utilizes the support vector machine (SVM) algorithm, known for its efficacy in handling nonlinear issues in small sample sizes, for fault diagnosis and health assessment across various systems [16,17,18,19,20]. Despite its proven reliability, the application of SVM often neglects the importance of recall rates, relying instead on empirical or optimization methods for selecting penalty parameters, which can be time-consuming and yield unstable results due to sample imbalances.
In response to these challenges, this study introduces a novel real-time grading method for adjusting risk loss penalty parameters in SVM applications. This method also incorporates fault identification correction parameters to enhance fault sample recall capabilities. The experiment results demonstrate that the improved SVM algorithm is more stable than the traditional SVM algorithm in suppressing the deviation of separation hyperplane and exhibits superior fault sample identification performance.

2. Experimental Methods

2.1. Analysis of Unbalanced Sample Set Based on SVM

The SVM algorithm based on statistical learning theory is a reliable method to deal with engineering problems [21]. However, when using SVM in the case of an unbalanced sample set like the lithium battery data set, it will face the problem of separation hyperplane offset. During the operation of the onboard battery, it is difficult to obtain fault samples that cause the sample size to be relatively small, which leads to an unbalanced sample set. This will cause the SVM separation hyperplane offset problem and affect the accuracy of the health assessment.
The training data set T1 is formed after the normalization of the selected data from the lithium battery data set of the NASA laboratory. The ratio of the number of healthy samples to the number of faulty samples in T1 is approximately equal to 6:1, and the samples are not balanced. The healthy samples in T1 are randomly removed until the number of fault samples and healthy samples is close to 1:1 to obtain the training set T2.
Based on the C-SVM algorithm using a polynomial kernel function, the penalty parameter C is set to 100 or 10. The separation hyperplanes in the four cases are obtained by training on the T1 and T2 data sets, respectively, as shown in Figure 1. The horizontal and vertical axes in the figure, respectively, represent the characteristics of the constant current charging time and the area of the charging voltage curve. The purple and red points correspond to the fault and healthy samples, respectively. It can be seen from Figure 1a,c that when the samples are unbalanced, the hyperplane shifts to the faulty sample area, causing some faulty samples to be misjudged as healthy. When the value of the penalty parameter is large, the deviation can be slightly suppressed, but the effect is not obvious and the generalization of the model will be reduced.
As shown in Figure 1b,d, reducing the number of healthy samples can suppress the deviation of the separation hyperplane to the fault side. However, this method will lose a lot of training data, and due to the relatively sparse distribution of healthy samples when the number is similar, it will cause the hyperplane to reverse shift. The common method to solve this problem is to assign penalty parameters C1 and C2 to the fault and healthy samples through experience or optimization algorithms during training, such as kb-SVM. This method does not consider the difference in information value of different individuals in the same category and has the disadvantages of large calculation amounts and unstable offset suppression effects.
In order to solve the problem of stable suppression of hyperplane migration and fully excavate the information contained in each sample, the paper proposes a method for a grading adjustment of risk loss penalty parameters C based on the needs of airborne lithium battery health assessment tasks and combined with the characteristics of the data.

2.2. Improved SVM Algorithm for Unbalanced Samples

Considering the difference in the value of the information contained in different samples, different samples are given different risk loss penalty parameters during the training of the SVM algorithm, and the constant penalty parameters C in the conventional SVM optimization problem [22] are replaced with variables C i to obtain the following formula:
min w , b , ξ 1 2 w 2 + C i i = 1 N ξ i   s . t .   y i ( w · x i + b ) 1 ξ i , ξ i 0 ,     i =   1 , 2 ,   , N
where x i and y i correspond to the feature vector and class label of sample i, y i = ± 1 corresponds to positive or negative samples in the training sample set T = x 1 , y 1   , , x N , y N . The separating hyperplane can be expressed as w · x + b = 0 , where w is the weight vector and b is the intercept.
In order to ensure the generalization of the model, the parameter C i is selected as an initial value of 10 based on experience, and the Gaussian kernel function with reliable performance is selected for a wide range of applications [23]. The initial separation hyperplane and classification decision function are obtained by training the SVM algorithm, and then the predicted value of each sample is calculated. We can calculate the classification error and the geometric distance γ i from the sample to the separating hyperplane according to the following expression:
e r r o r = 1 2 ( 1 1 2 i = 0 N E i ) = 1 2 ( a c c u r a c y )
γ i = y i ( w w · x i + b w )
E i represents the difference between the predicted value of the sample and the true value.

2.2.1. Penalty Parameter Grading Based on Geometric Distance

In SVM, only the support vector plays a role when deciding to separate the hyperplane. The process of finding the optimal separation hyperplane in the iterative process is to find the optimal support vector. The geometric distance of the sample distance separating the hyperplane can indicate the degree of confidence in the classification prediction. The smaller the geometric distance of the sample, the greater the risk of classification error, and at the same time, it is closer to the optimal support vector, which contains high information value, and needs to be given a larger penalty parameter. According to the following formula, the positive and negative samples are divided into ten information weight levels from 0 to 9 according to the geometric distance:
γ min ± = min ( γ i ) ; γ max ± = max ( γ i ) ; y i = ± 1
l e v e l i ± = γ i γ min ± γ max ± γ min ± × 10
Among them, y = [x] is the function of rounding down.
According to the classification results, the misjudged samples are selected from the positive and negative samples, and the information weight level is extracted to form set E + and set E . When there are samples in a certain weight level that are misjudged, the risk loss penalty parameter C of all samples of that level will be amplified according to the level and the classification error rate errorj within the level to achieve the penalty parameter classification.
The closer the sample is to the separating hyperplane, the greater the degree of amplification of the penalty parameter.
C i = C i 1 e r r o r j e r r o r j 1 2 ( 10 l e v e l i ± ) l e v e l i ± E ±  
We can adjust the final penalty parameters according to the loss function and average value to obtain the final grading penalty parameters. The expression is as follows:
L ± = i = 1 N   C i ξ i = i = 1 N   C i max ( 0 , 1 f ( x 0 ) )  
C i new = C i ¯ C i L ± y i = ± 1  

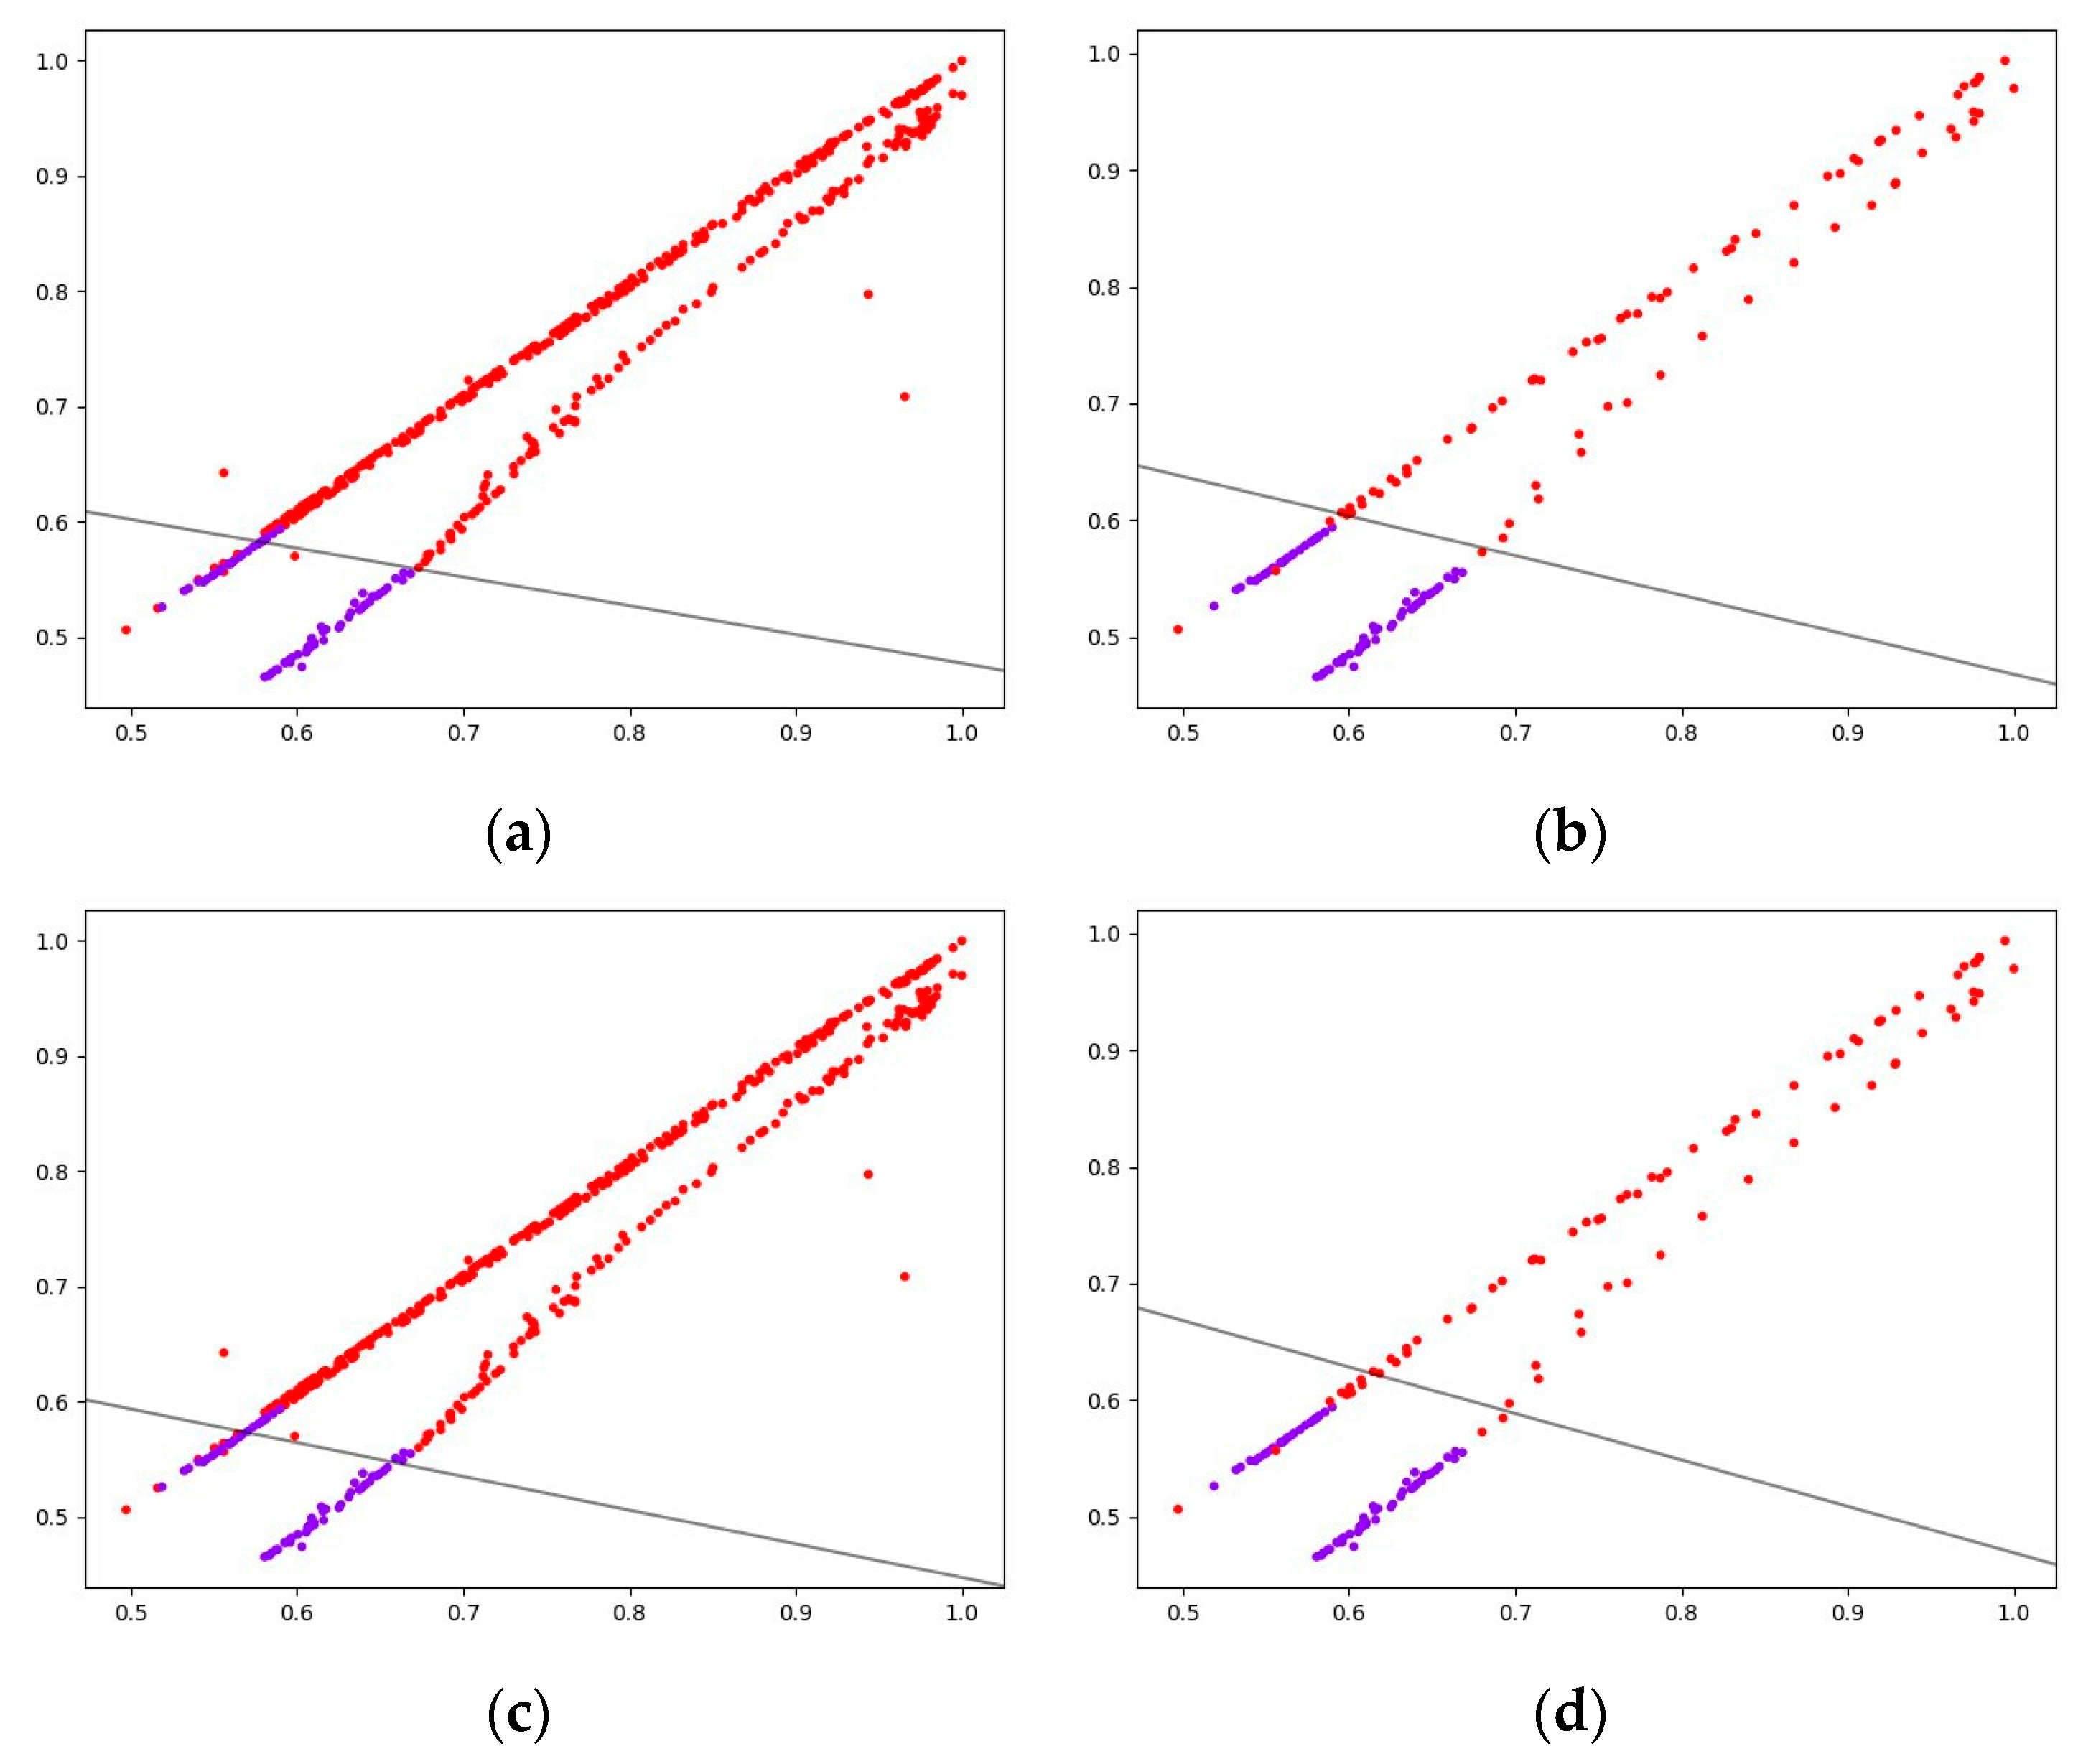
2.2.2. Analysis of Hyperplane Migration Suppression Ability

Generally, the ratio of the empirical risk loss of the misjudgment of positive samples and negative samples is used to express the SVM classifier’s ability to suppress hyperplane shift R:
R = C 1 i = 1 p   ξ i C 2 j = 1 q   ξ j   y i = + 1 ,   y j = 1
In the expression, p and q represent the number of positive and negative samples, respectively. When R = 1, the sample balance ability is the best. The traditional SVM algorithm usually combines the optimization algorithm to optimize the positive and negative penalty parameters C 1 and C 2 so that R = 1.
For the grading penalty parameters proposed in this paper, the sample imbalance suppression ability is derived as follows:
R = i = 1 p   C i new ξ i j = 1 q   C j new ξ j = L i = 1 p   C i ξ i L + j = 1 q   C i ξ j  
Substituting Formulas (7) into (10) to simplify and obtain R = 1 shows that the use of hierarchical penalty parameters theoretically has strong suppression ability and stable performance for hyperplane offset imbalance.

2.2.3. Decision Function Adjustment for Enhanced Fault Sample Identification

By adjusting the penalty parameters hierarchically, the separation hyperplane offset is suppressed. To this end, the classification ability of the decision function on the faulty sample and the healthy sample is more balanced. However, in the field of civil aviation, which requires high safety and reliability, it is necessary to consider improving the ability to identify fault samples to ensure system health. This paper combines the concepts of confusion matrix and recall and adds fault identification correction parameters to the decision function to optimize and improve the SVM algorithm’s ability to identify fault samples.
The confusion matrix is a multidimensional measurement index system for binary classification problems, which can accurately reflect the performance of algorithms with unbalanced samples. It uses {0,1} to represent {healthy sample, faulty sample}, and includes true positives (11), false positives (01), true negatives (10), and false negatives (00). Common evaluation metrics based on the confusion matrix include accuracy, precision, and recall. These metrics range from 0 to 1, with values closer to 1 indicating better classification performance. The formulas for these metrics are as follows:
A c c u r a c y = ( 11 + 00 ) / ( 11 + 10 + 01 + 00 )
P r e c i s i o n = 11 / ( 11 + 01 )
R e c a l l = 11 / ( 11 + 10 )
In order to increase the recall rate as much as possible under the premise of ensuring the precision rate, the fault identification correction parameter β is introduced on the basis of the decision function to obtain a new decision function expression (14).
f ( x ) = s i g n ( i = 1 N α i * y i K ( x , x i ) + b * + β )
The fault identification correction parameters are adjusted in the iterative process according to the recall rate and the precision rate, and the expression is as follows. When β is less than 0, the decision function’s ability to identify fault samples is enhanced, and the recall rate increases.
β = β 0.05 ( 1 R e c a l l ) + 0.01 ( 1 P r e c i s i o n )
By changing β to obtain a new decision function to classify the training set, we can re-execute the penalty parameter hierarchical adjustment according to the classification result. We can iterate repeatedly until the set number of iterations is completed or the recall and precision both meet the preset threshold.

2.2.4. Flow of Improved SVM Optimization Algorithm

The SVM algorithm optimization process is shown in the Figure 2, which mainly includes two parts: risk loss penalty parameter grading and decision function adjustment. According to the initial separation hyperplane and decision function, the classification error, recall, geometric distance, and other indicators are calculated. The penalty parameters are graded according to the geometric distance and trained repeatedly until the hyperplane offset can be effectively suppressed, and the final grading penalty parameters are obtained. Finally, according to the trained separation hyperplane, the SVM decision function is trained and adjusted according to the recall rate and the precision rate to improve the fault sample recognition ability while ensuring the precision rate. We can obtain the final model that meets the needs of the project.

3. Results

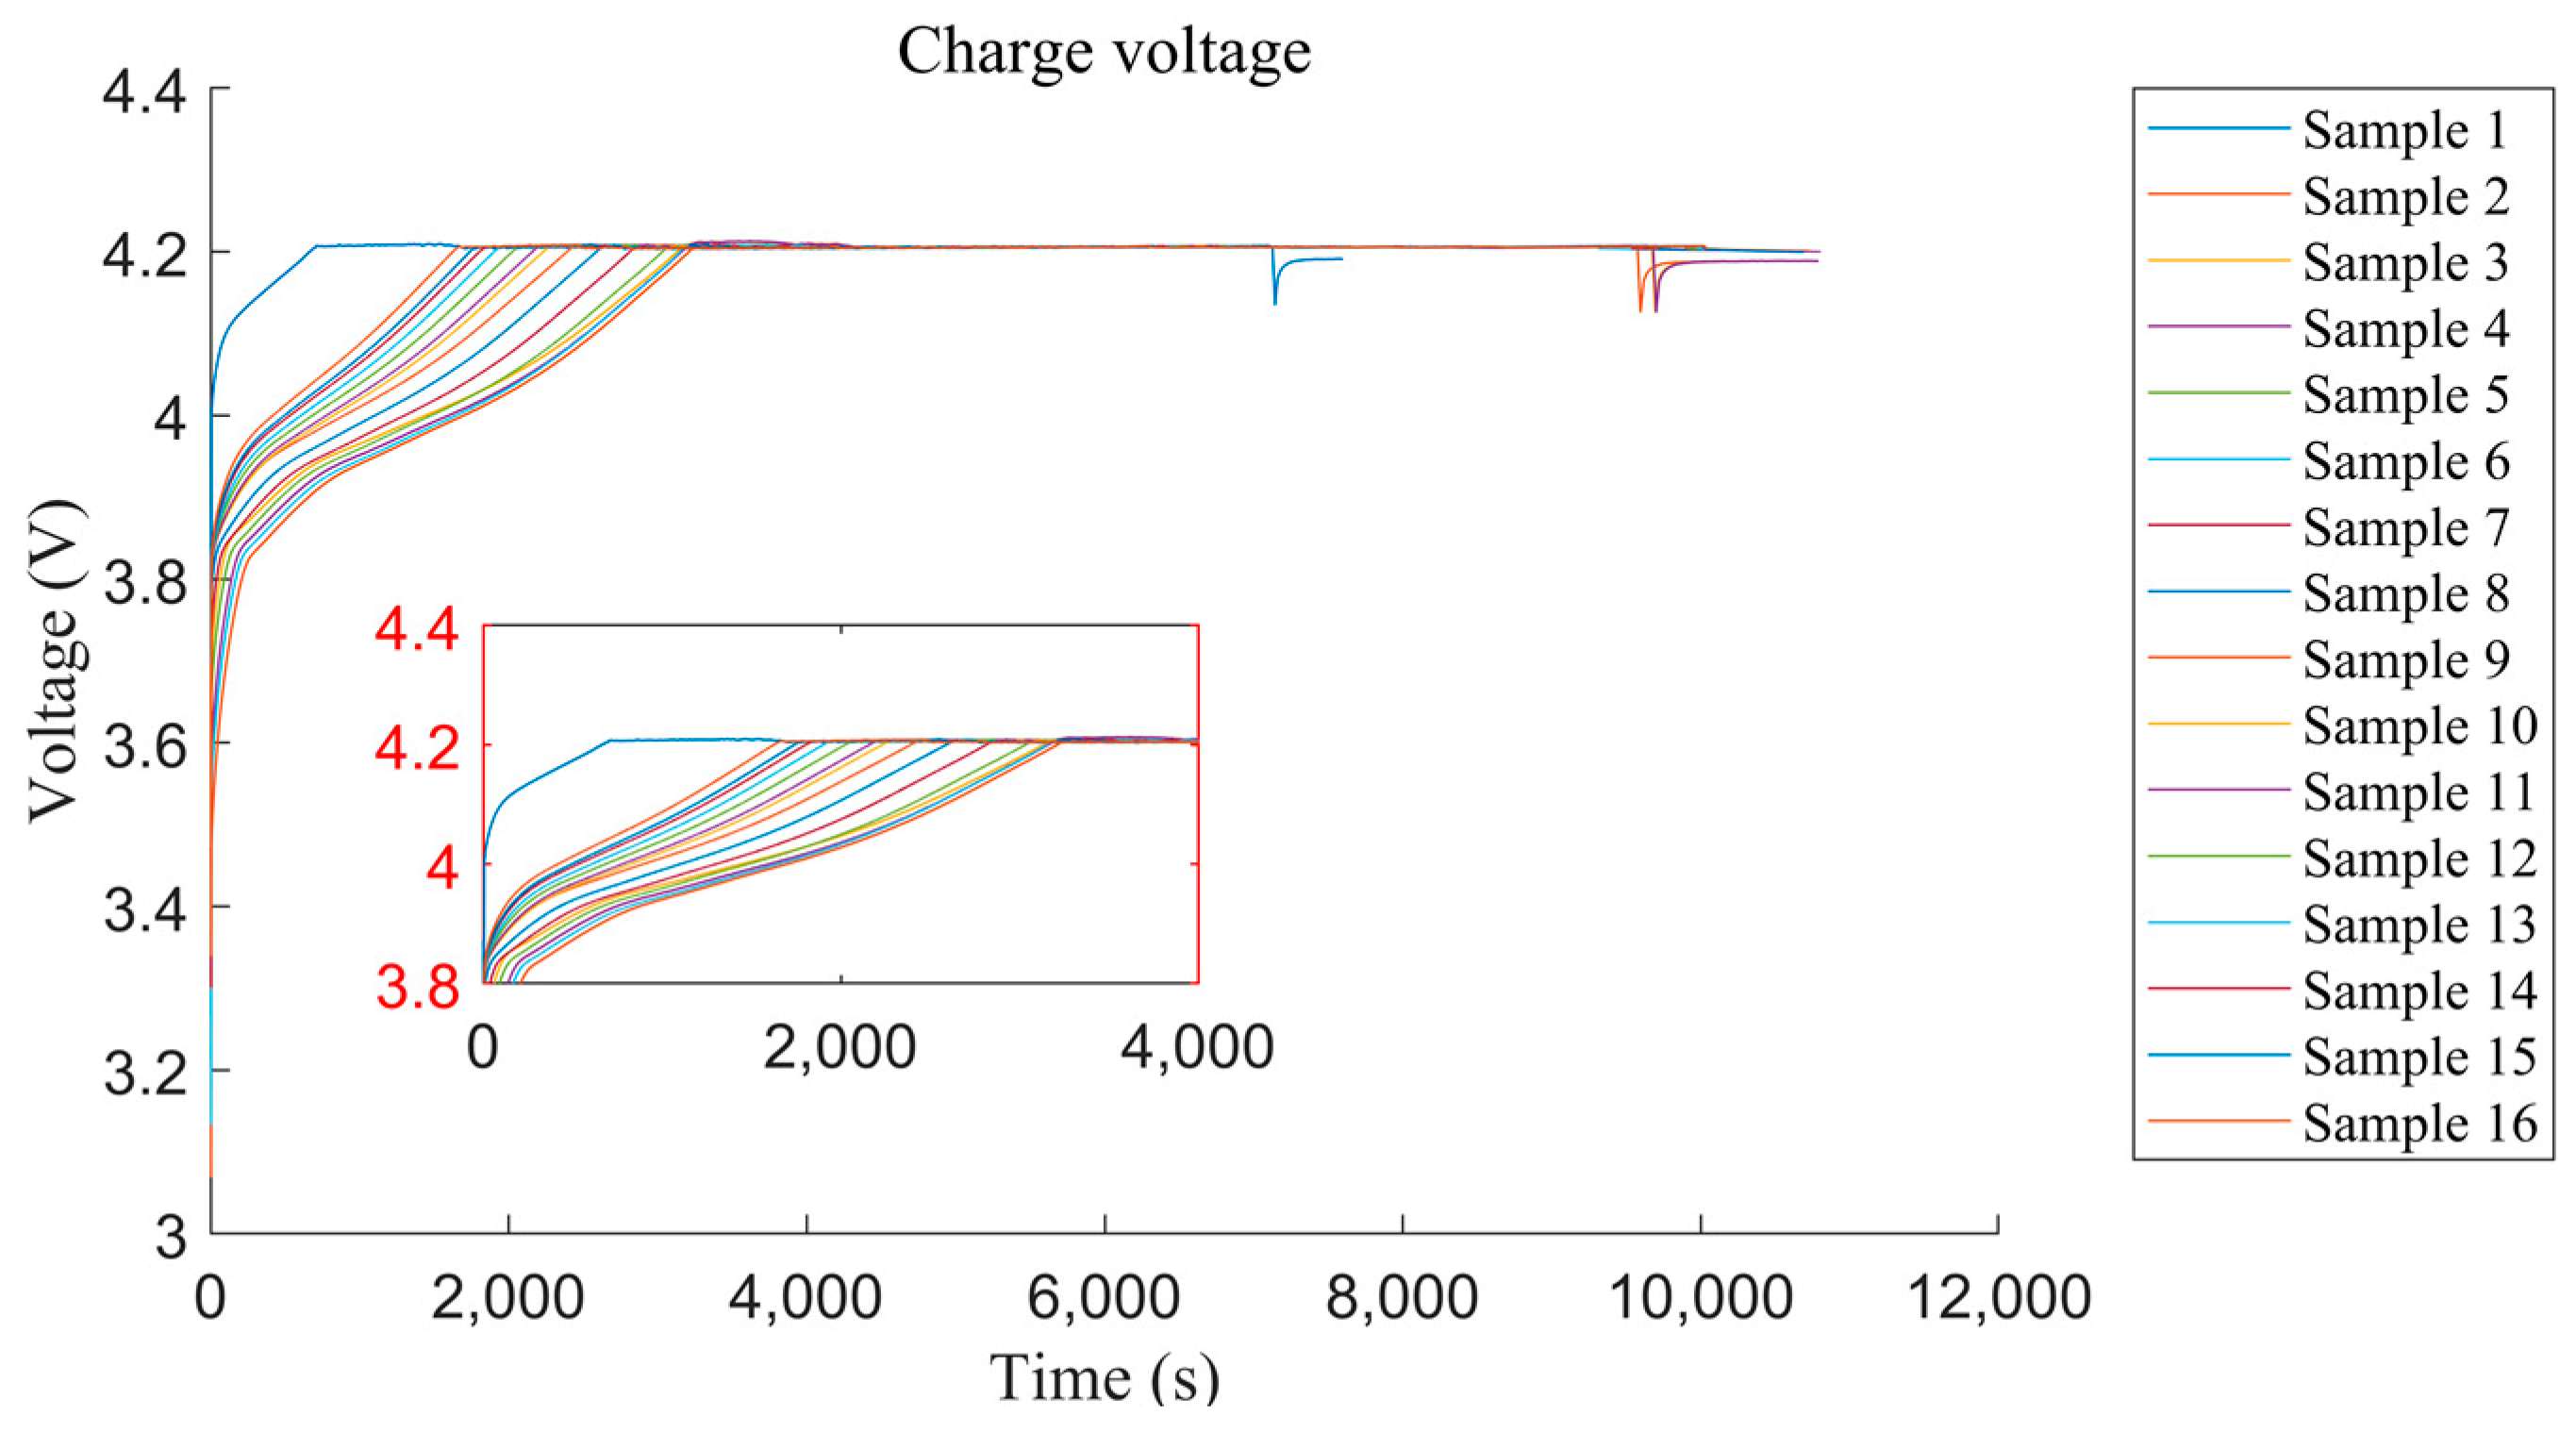
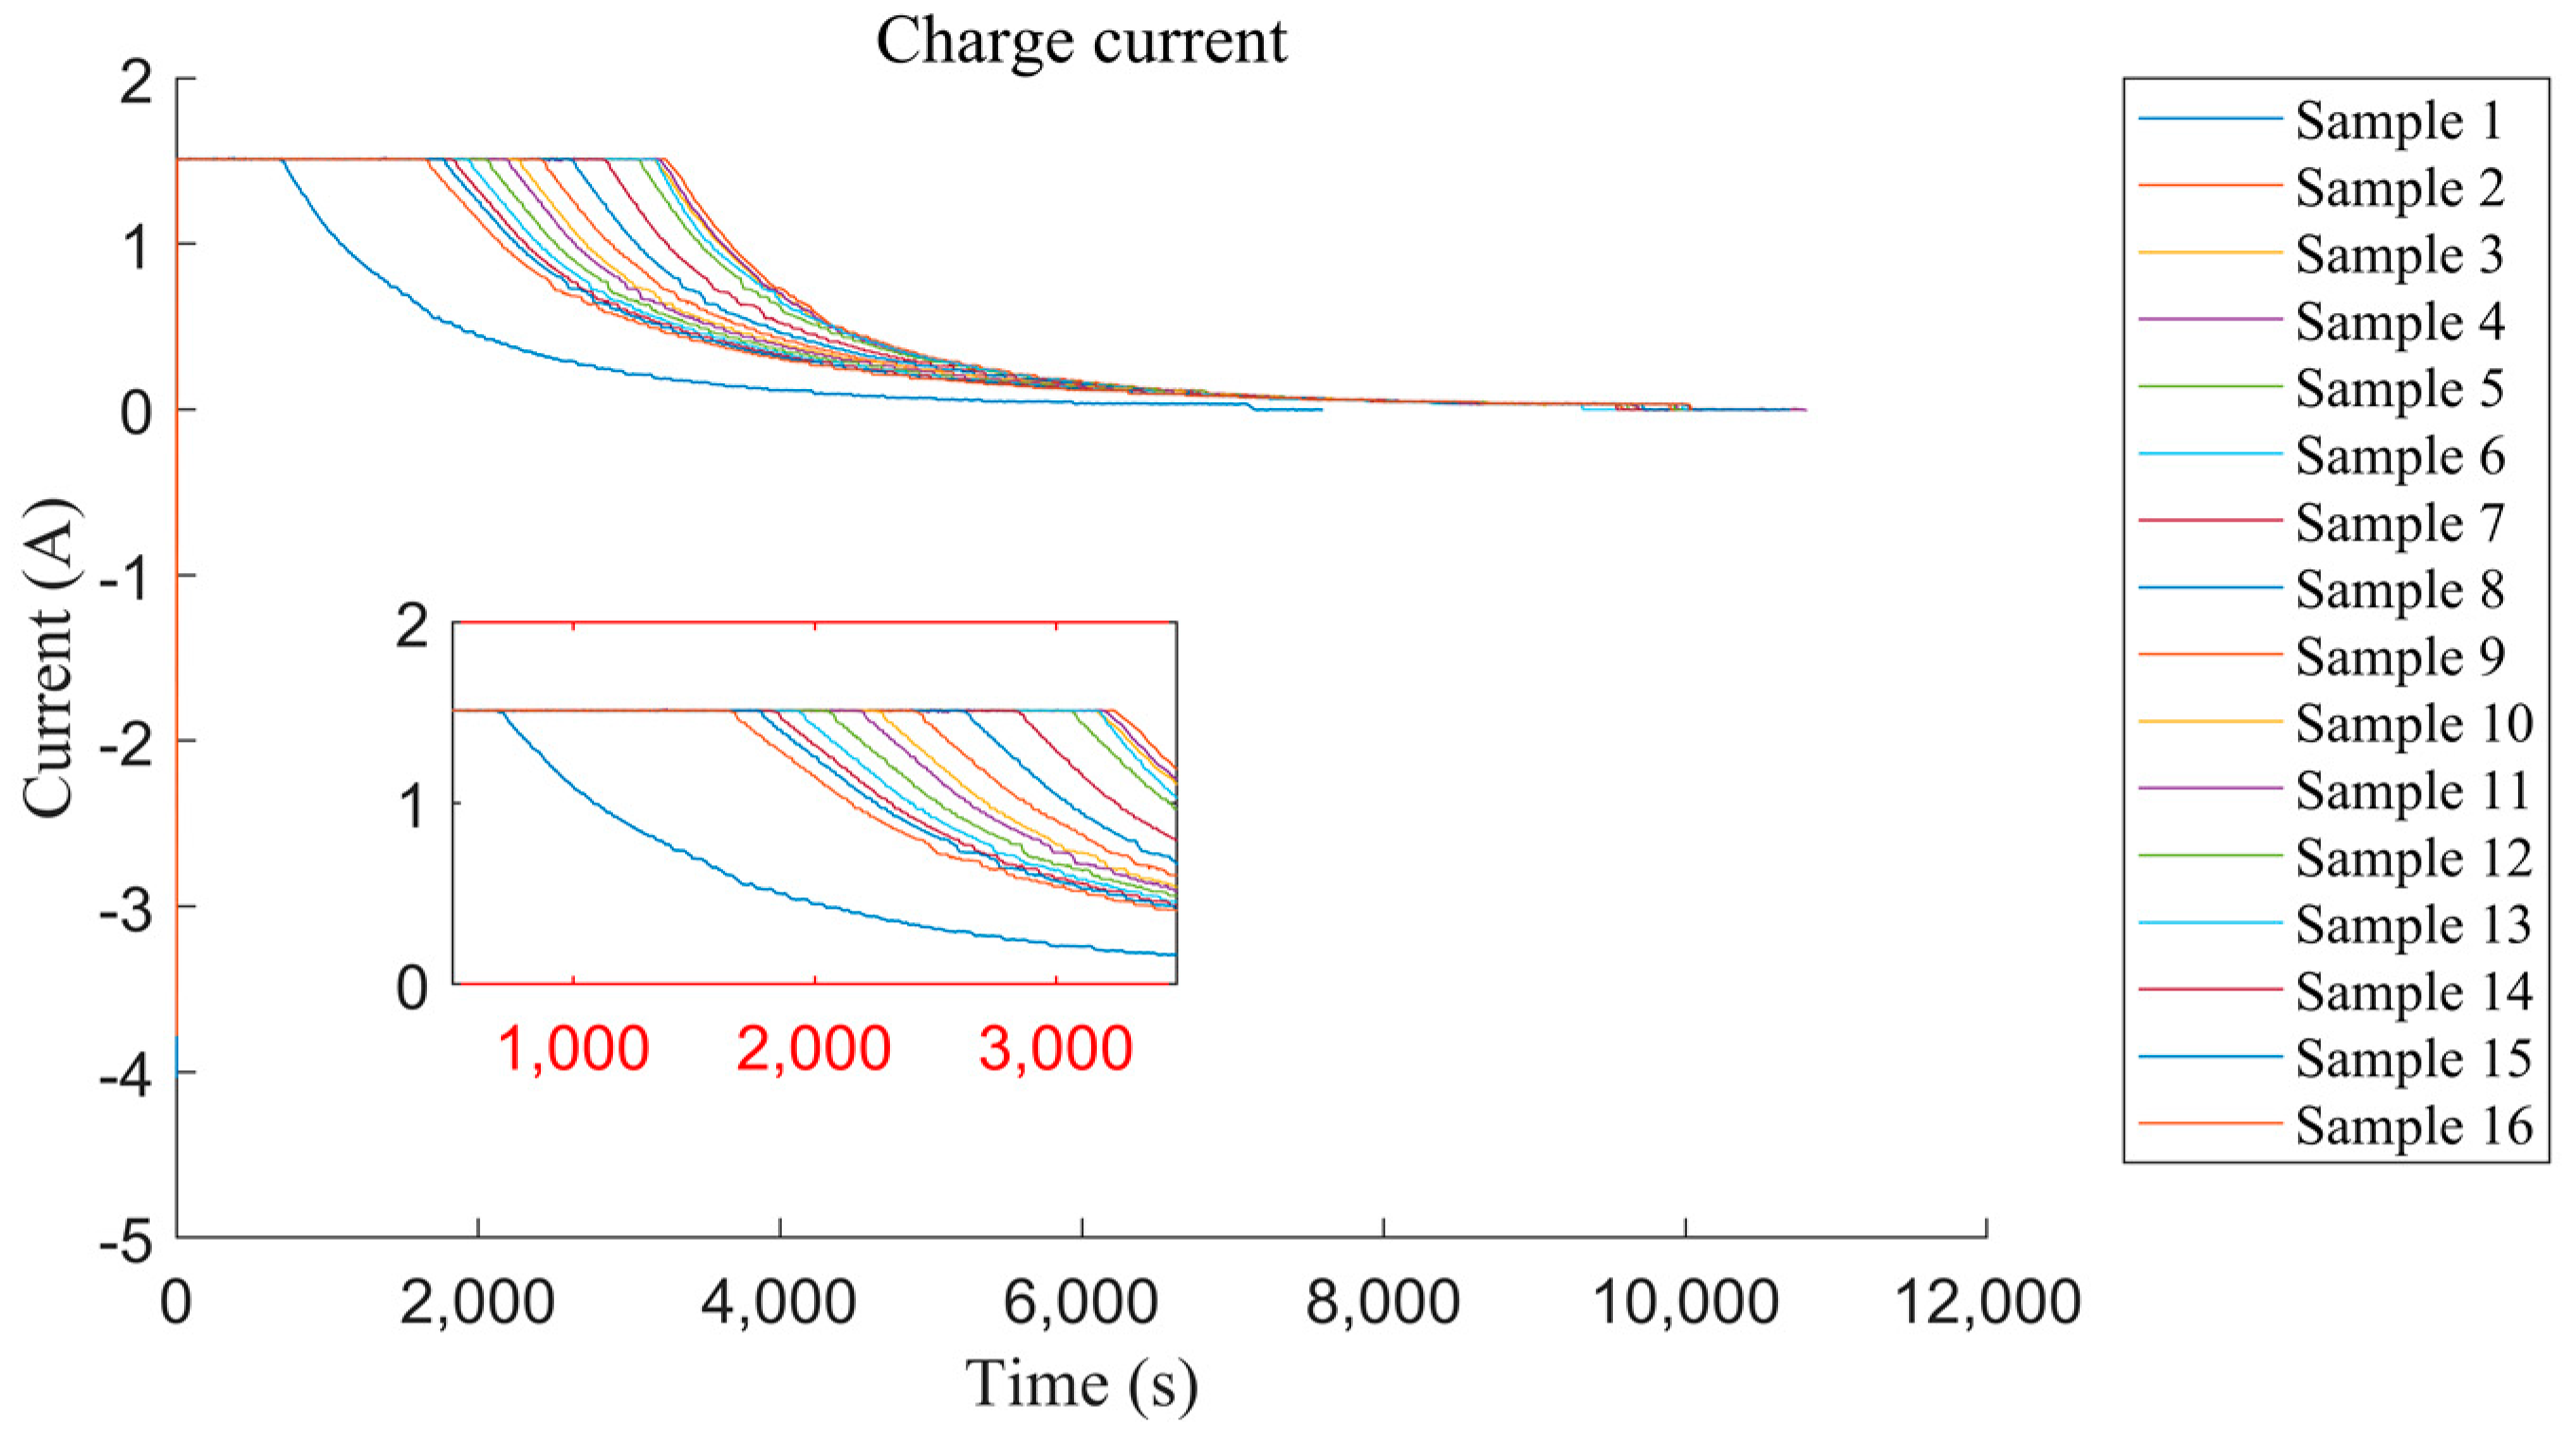
3.1. Data Preprocessing

The data source used in this article is the full life cycle charge and discharge data set of 18,500 lithium batteries in the NASA laboratory [24]. Table 1 shows the basic parameters of the experimental battery.
Cyclic charging and discharging of lithium-ion batteries in a room temperature environment, when the battery capacity drops to 70% of the rated capacity, is regarded as end-of-life (EOL). In other words, samples with less than 1.4 Ah are regarded as faulty samples. During the battery charging phase, the battery is charged in a constant current mode of 1.5 A until the voltage reaches 4.2 V, and then it continues to be charged in a constant voltage mode until the charging current drops to 20 mA.
This paper uses the data of No. 5, No. 6, No. 7, and No. 18 batteries for experiments. They are discharged at a constant current of 2 A during the discharge phase, and the discharge end voltage corresponds to 2.7 V, 2.5 V, 2.2 V, and 2.5 V in sequence. Airborne batteries are usually charged in a fixed mode on the ground, and data collection during the charging phase is convenient, so the training set and the test set are obtained by dividing the charging data. Considering that the battery discharge depth is not fixed in actual work, the charging data of No. 5, 7, and 18 batteries with different discharge modes are used as the training set, and the charging data of the No. 6 battery is used as the test set. The changing trend of charging current and voltage during the experiment of the No. 5 battery is shown in Figure 3 and Figure 4.
Observing the two figures, it can be found that as the charge and discharge experiment progresses, the battery capacity continues to decrease, and the constant current charging time Tc and the voltage Vp at the inflection point of the charging voltage curve both show a downward trend. In this paper, the constant current charging time Tc is extracted, the sliding window method is used to smooth the curve to extract the inflection point voltage Vp of the charging voltage curve, and the data feature set is obtained. Taking into account the difference in dimensions, it is necessary to perform normalization after denoising the data to linearly scale the data set to the interval [0, 1].
After the above-mentioned data preprocessing and feature extraction, the training set is obtained. There are 392 healthy samples and 73 faulty samples in the training set, and the samples are unbalanced.
We can obtain the classification result after the SVM penalty parameter is adjusted by level. At this time, the ratio of the misjudgment loss contributed by the positive and negative samples R = 1.0073 is approximately equal to 1. It shows that the penalty parameters that have been adjusted hierarchically have a strong ability to suppress the deviation of the separation hyperplane.

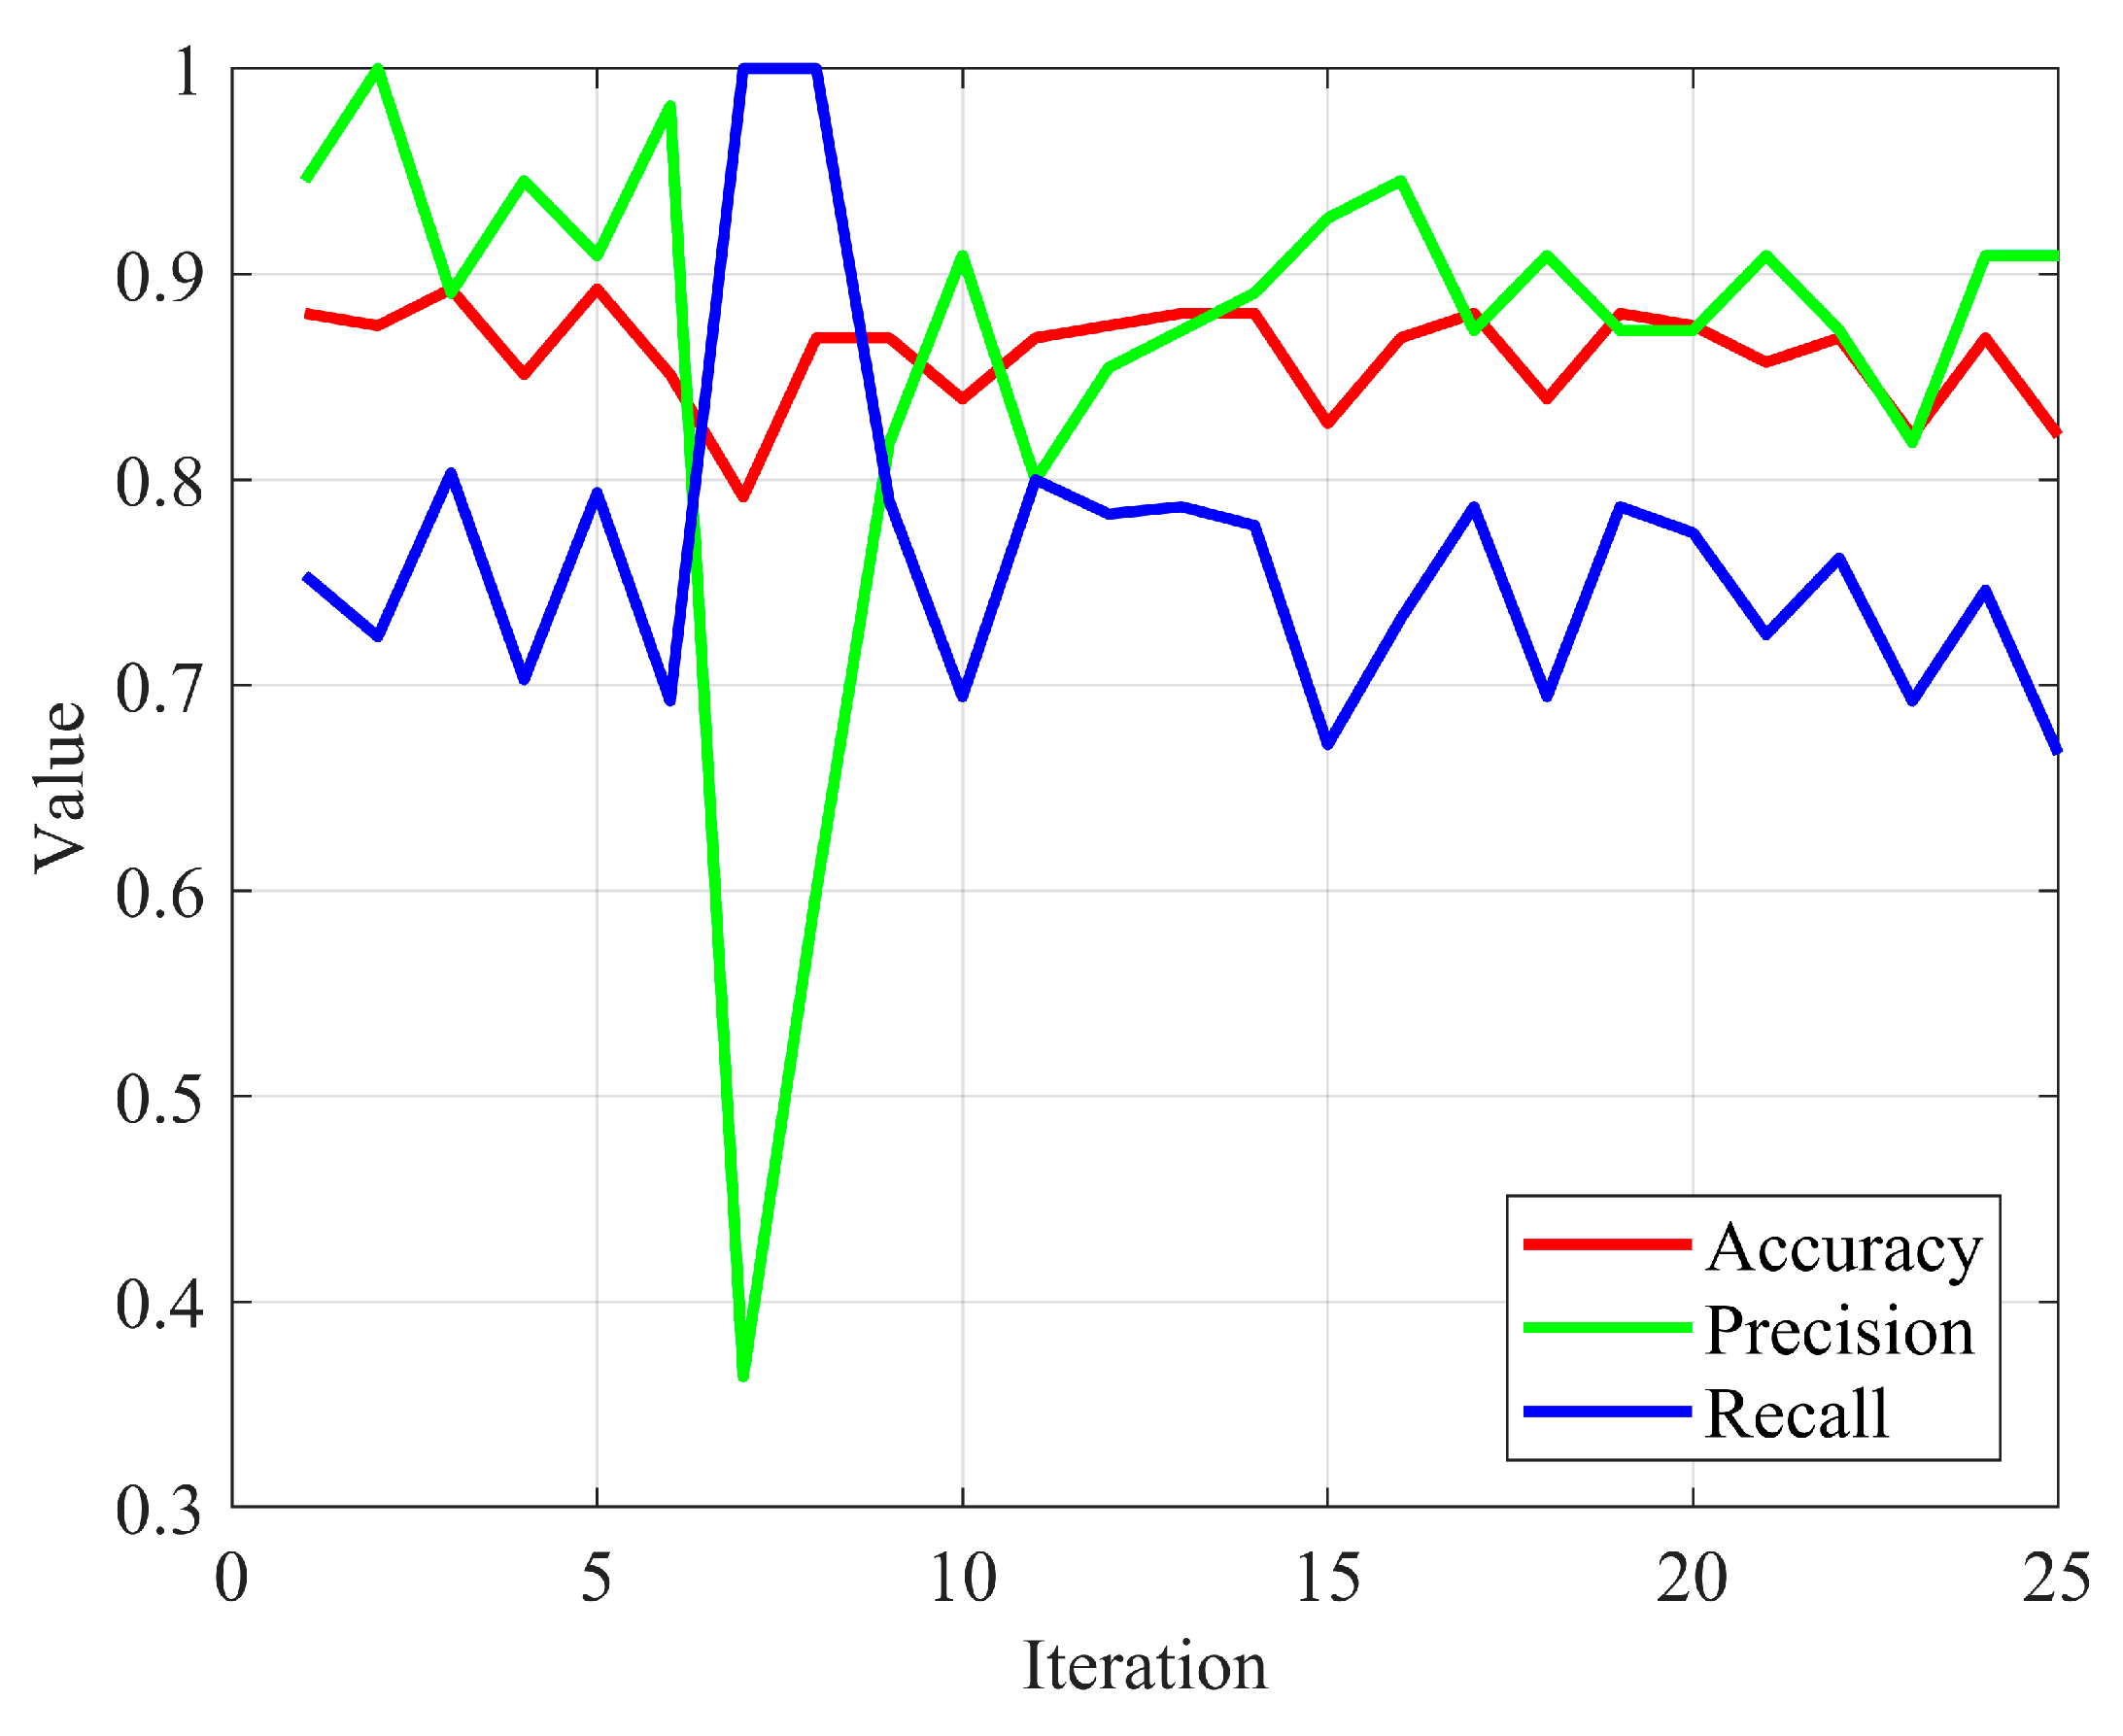
3.2. Iteration Process of Optimized SVM

The abscissa in the Figure 5 represents the number of iterations, and the range of values for accuracy, precision, and recall are all in [0, 1]. The fault identification correction parameter β is adjusted according to the expression 2.7 during the iteration process, and the recall rate has a higher weight. Therefore, the recall rate in the second round of iterative training quickly rises to 100%, but it also causes the decision function to misjudge healthy samples. It makes the precision rate drop significantly. Subsequently, the parameter β of the decision function was modified to reduce the misjudgment of healthy samples, and the accuracy of the second to sixth rounds of iterations gradually increased.

3.3. Accuracy of the Prediction by Optimized SVM

We can introduce the harmonic mean F1 of precision rate and recall rate as a comprehensive index to consider classification performance:
F 1 = 2 1 P r e c i s o n + 1 R e c a l l = 2 × P r e c i s o n × R e c a l l P r e c i s o n + R e c a l l
The recall rate and the value of F1 are used as the optimization targets. When the recall reaches above 0.95 and the F1 reaches above 0.8, the training output decision function ends. This time, B is approximately equal to 0.01398. According to the trained decision function, by substituting into the test set obtained from the processing of battery charging data of No. 6 for the classification test, the test result is shown in the figure below.
In Figure 6, the ordinate is the battery capacity, and the abscissa is the sample number. The red represents identification errors, the blue represents accurate identification of faults, and the purple represents accurate identification of health. It can be seen from the figure that the model trained by the improved SVM algorithm proposed in this paper can accurately identify all failed sample points, while the number of healthy sample points that have been accidentally injured is small and the battery capacity of these sample points is mostly below 1.45 Ah, which is close to the failure value. As Table 2 shows, the proposed SVM algorithm achieves an accuracy rate of 90.48%, a recall rate of 77.47%, and a precision rate of 100.00% on the test set.

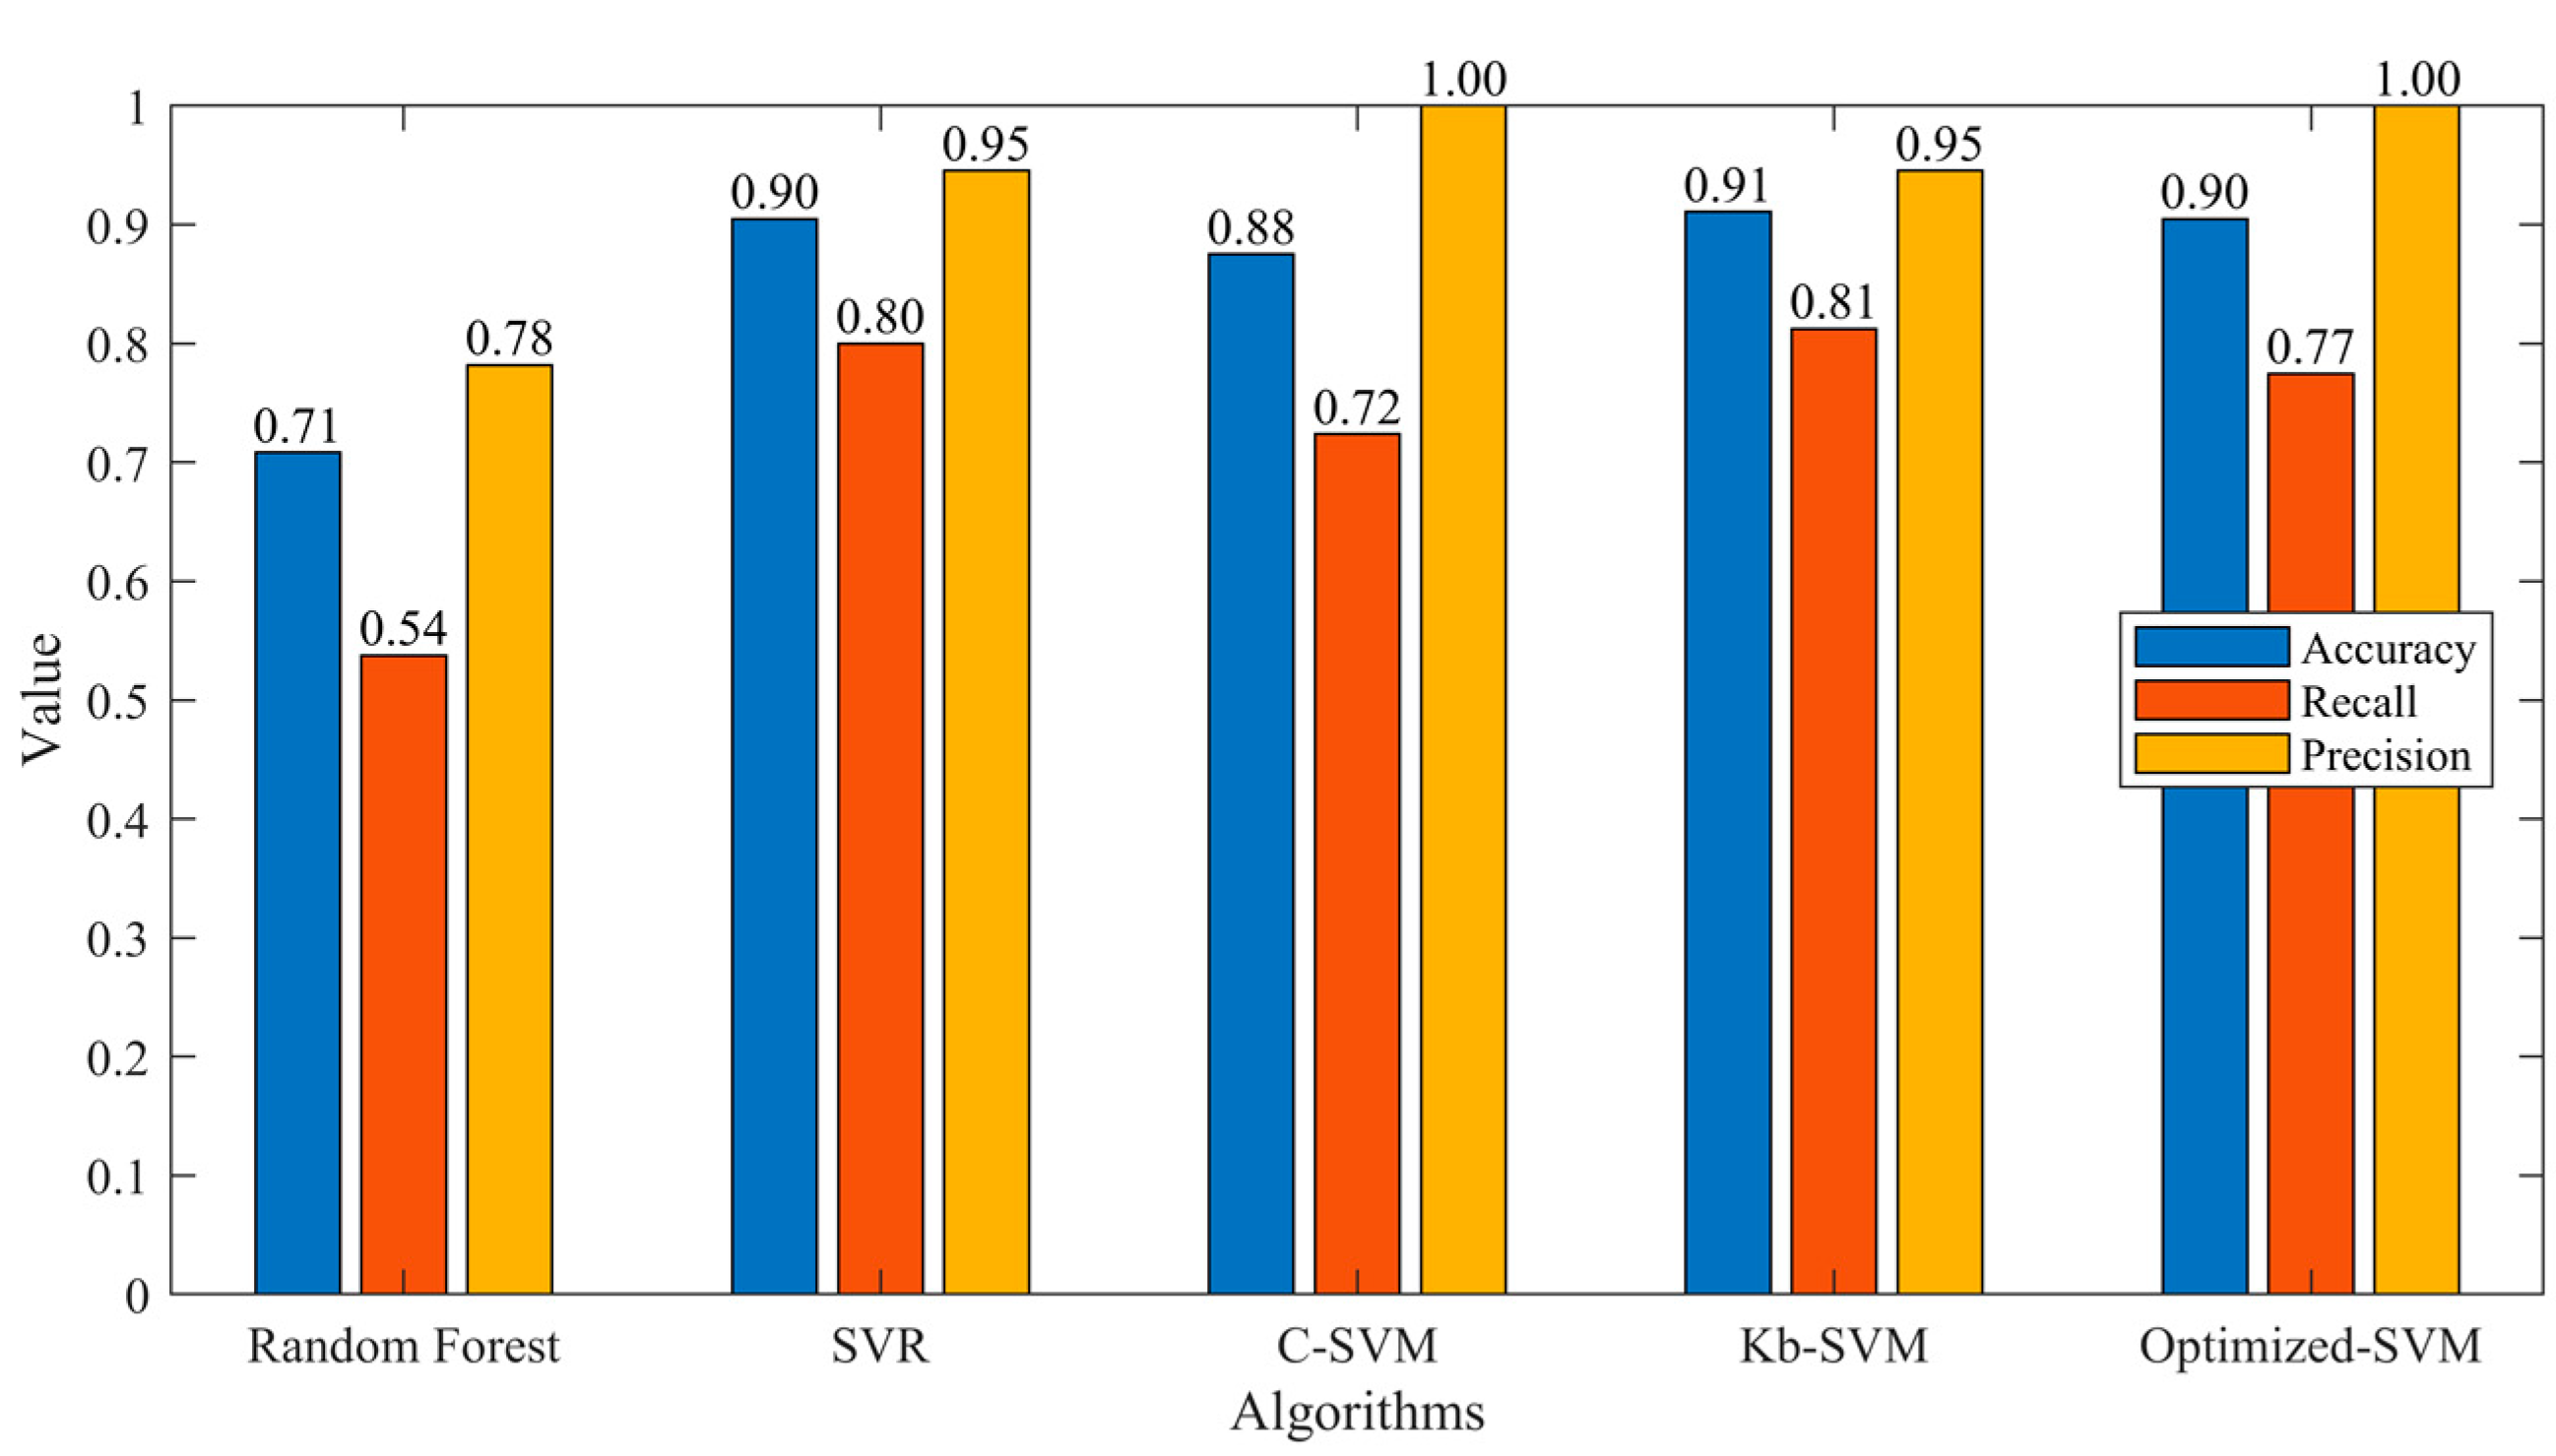
3.4. Comparision of the Performance with Other Baseline Methods

In order to compare the optimization effect of the algorithm, the traditional C-SVM and the conventional improved method Kb-SVM were used for the control experiment. The kernel functions are all Gaussian kernel functions. The recall rate and precision rate of the above two algorithms and the improved SVM algorithm for the recognition results of the test set are shown in Figure 7. Comparing the recognition results, it can be seen that the improved algorithm in this paper has a good effect on identifying failed lithium battery samples. Compared with the conventional improved method, the Kb-SVM recall rate and precision rate are significantly improved.

4. Discussions

The proposed support vector machine (SVM) algorithm demonstrates a significant advancement in the health assessment of airborne lithium batteries. The introduction of a dynamic correction mechanism for risk loss penalty parameters and fault identification corrections ensures the stability and reliability of the algorithm. The experimental results underline the algorithm’s superior performance in suppressing hyperplane deviation and enhancing fault sample recall rates.
In the experiments, the optimized SVM achieved an accuracy rate of 90.48%, a recall rate of 77.47%, and a precision rate of 100.00% on the test set. These metrics indicate a balanced and robust performance, surpassing the traditional SVM and other baseline algorithms like Random Forest and SVR. The algorithm’s ability to systematically adjust risk loss penalty parameters based on sample misjudgment ratios significantly improves its effectiveness in handling imbalanced datasets.
By incorporating a real-time grading method for penalty parameter adjustment and fault identification correction parameters, the proposed SVM algorithm achieves a strong suppression of hyperplane deviation, thus ensuring accurate health assessments. This innovative approach not only enhances the fault sample recall capabilities but also maintains high precision, making it highly suitable for the stringent safety requirements of airborne operations.

5. Conclusions

For airborne lithium battery health assessment, this paper introduces an optimized support vector machine (SVM) algorithm that performs well with imbalanced sample sets. This algorithm enhances hyperplane stability and classification accuracy through the innovative adjustment of the risk loss penalty parameter. It is proven mathematically that the proposed algorithm achieves more stable hyperplane suppression than the traditional methods through optimizing penalty parameters C driven by classification errors. Using NASA’s lithium battery dataset for validation, the results show that the optimized SVM algorithm outperforms C-SVM with a higher accuracy and recall rate of 90.48% and 77.47%, respectively, as well as a 2.98% less error rate. Meanwhile, our method achieves a higher precision of 100% compared to Kb-SVM, despite requiring slightly more time. Thus, from a comprehensive perspective, the optimized SVM attains a balanced performance when dealing with an unbalanced dataset. For future development, we plan to explore the proposed method’s real-world applications using data collected in our research and development activities. The future work targets examining long-term performance and further improving computational efficiency.

Author Contributions

Conceptualization, C.Y. and H.G.; methodology, C.Y.; software, H.J.; validation, C.Y. and H.G.; formal analysis, C.Y. and S.L.; investigation, C.Y.; resources, C.Y.; data curation, C.Y.; writing—original draft preparation, C.Y.; writing—review and editing, H.G. and H.J.; visualization, C.Y., H.J., and S.L.; supervision, H.G.; project administration, H.G.; funding acquisition, H.G. All authors have read and agreed to the published version of the manuscript.

Funding

This work was supported by the National Natural Science Foundation of China (NSFC) under Grant U2233205 and U2133203.

Data Availability Statement

Data are contained within the article.

Conflicts of Interest

Author Chunxia Yang was employed by the company Commercial Aircraft Corporation of China. The remaining authors declare that the research was conducted in the absence of any commercial or financial relationships that could be construed as a potential conflict of interest.

References

  1. Liu, Z.Y. Research on Aircraft Battery Test Technology; Nanjing University of Aeronautics and Astronautics: Nanjing, China, 2015. [Google Scholar]
  2. Xie, S.; Gong, Y.Z.; Li, M.H. Progress in the application of lithium-ion batteries in the field of civil aviation. Batteries 2020, 50, 388–392. [Google Scholar] [CrossRef]
  3. ANON. Aircraft Incident Report: Auxiliary Power Unit Battery Fire Japan Airlines Boeing 787-8, JA829J, Boston, Massachusetts, January 7, 2013; National Transportation Safety Board: Washington, DC, USA, 2014. [Google Scholar]
  4. Chen, M.; Wu, J.; Jiao, C.Y.; Chen, J.Z.; Zhang, Z.P. Multi-factor online estimation method of lithium-ion battery health status. J. Xi’an Jiaotong Univ. 2020, 54, 169–175. [Google Scholar]
  5. Ovejas, V.J.; Cuadras, A.; Morante, J.R. SoH evaluation of LiFePO4 cells using impedance and thermal measurements. In Proceedings of the 2014 IEEE 11th International Multi-Conference on Systems, Signals & Devices (SSD14), Barcelona, Spain, 11–14 February 2014; pp. 1–6. [Google Scholar]
  6. Sarikurt, T.; Ceylan, M.; Balikci, A. An analytical battery state of health estimation method. In Proceedings of the 2014 IEEE 23rd International Symposium on Industrial Electronics (ISIE), Istanbul, Turkey, 1–4 June 2014; pp. 1605–1609. [Google Scholar]
  7. Shi, W.J.; Wang, H.M. Research on SOH online diagnosis model based on thermal characteristics of lithium-ion battery. Chin. J. Sci. Instrum. 2020, 41, 206–216. [Google Scholar]
  8. Zhou, D.; Song, X.H.; Lu, W.B.; Fu, P. Real-time SOH Estimation Algorithm for Lithium-ion Batteries Based on Daily Segment Charging Data. Proc. Chin. Soc. Electr. Eng. 2019, 39, 105–111. [Google Scholar] [CrossRef]
  9. Pan, C.F.; Liu, B.; Chen, L.; He, Z.; Han, C. Temperature rise characteristic analysis and liquid cooling structure design of lithium battery. J. Southwest Jiaotong Univ. 2020, 55, 68–75. [Google Scholar]
  10. Yang, Y.L.; Chen, S.Y.; Chen, T.; Huang, L. State of health assessment of lithium-ion batteries based on deep Gaussian process regression considering heterogeneous features. J. Energy Storage 2023, 61, 106797. [Google Scholar] [CrossRef]
  11. Yang, S.J.; Zhang, C.P.; Jiang, J.C.; Zhang, W.; Zhang, L.; Wang, Y. Review on state-of-health of lithium-ion batteries: Characterizations, estimations and applications. J. Clean. Prod. 2021, 314, 128015. [Google Scholar] [CrossRef]
  12. Wu, L.X.; Liu, K.; Pang, H.; Jin, J. Online soc estimation based on simplified electrochemical model for lithium-ion batteries considering current bias. Energies 2021, 14, 5265. [Google Scholar] [CrossRef]
  13. Geng, Z.Y.; Wang, S.Y.; Matthew, J.L.; Brandell, D.; Thiringer, T. Bridging physics-based and equivalent circuit models for lithium-ion batteries. Electrochim. Acta 2021, 372, 137829. [Google Scholar] [CrossRef]
  14. Liu, W.; Yang, G.; Meng, D.; Li, L.; Wang, B. Modeling method of lithium-ion battery considering commonly used constant current conditions. Trans. China Electrotech. Soc. 2021, 36, 5186–5200. [Google Scholar]
  15. Zhang, K.; Yin, J.X.; He, Y.Z. Acoustic emission detection and analysis method for health status of lithium-ion batteries. Sensors 2021, 21, 712. [Google Scholar] [CrossRef] [PubMed]
  16. Yin, Z.; Hou, J. Recent advances on SVM based fault diagnosis and process monitoring in complicated industrial processes. Neurocomputing 2016, 174, 643–650. [Google Scholar] [CrossRef]
  17. Cui, J.; Yan, X.; Pu, X.; Qi, Y.; Jiang, L.; Shi, J. Aero-engine fault diagnosis based on dynamic PCA and improved SVM. Zhendong Ceshi Yu Zhenduan/J. Vib. Meas. Diagn. 2015, 35, 94–99. [Google Scholar] [CrossRef]
  18. Ge, X.K.; Hu, J.B.; Xu, B. Status data analysis of inertial navigation and construction of fault diagnosis model based on SVM. Syst. Eng. Theory Pract. 2012, 32, 405–410. [Google Scholar]
  19. Zhou, D.; Zhuang, X.; Zuo, H.; Cai, J.; Bao, H. Hazard identification and prediction system for aircraft electrical system based on SRA and SVM. Proc. Inst. Mech. Eng. Part G J. Aerosp. Eng. 2020, 234, 1014–1026. [Google Scholar] [CrossRef]
  20. Zhou, D.; Zhuang, X.; Zuo, H.; Wang, H.; Yan, H. Deep Learning-Based Approach for Civil Aircraft Hazard Identification and Prediction. IEEE Access 2020, 8, 103665–103683. [Google Scholar] [CrossRef]
  21. Vapnik, V.N. An overview of statistical learning theory. IEEE Trans. Neural Netw. 1999, 10, 988–999. [Google Scholar] [CrossRef] [PubMed]
  22. Li, H. Statistical Learning Methods; Tsinghua University Press: Beijing, China, 2019. [Google Scholar]
  23. Gao, D. Prediction of the Remaining Life of Lithium-Ion Batteries Based on New Health Indicators; Wuhan University of Technology: Wuhan, China, 2018. [Google Scholar]
  24. Saha, B.; Goebel, K. Battery Data Set, NASA Prognostics Data Repository; NASA Ames Research Center: Mountain View, CA, USA, 2007. [Google Scholar]
  25. Zhang, Z.; Li, Y.; Li, Y.; Liang, X. Research on SOC estimation of lithium batteries using several machine learning algorithms. J. Chongqing Univ. Technol. (Nat. Sci.) 2023, 37, 40–48. [Google Scholar]
  26. Han, W.; Wang, S.; Zhang, X.; Li, Y.; Chen, W. Holistic comparison of different kernel functions for support vector regression based on state-of-health prediction of lithium-ion battery. Chin. J. Power Sources 2021, 45, 362–365, 377. [Google Scholar] [CrossRef]
  27. Huang, Y.; Wang, T.; Pei, H.; Wang, J.; Wang, X. Diagnosis method of diesel common rail system based on operating conditions and multi-category support vector machine. Trans. Beijing Inst. Technol. 2023, 43, 719–725. [Google Scholar]
  28. Zhang, R.; Liu, T.Y.; Jin, G. Remaining useful life prediction of lithium-ion batteries based on Gaussian process regression with self-constructed kernel. Syst. Eng. Electron. 2023, 45, 2623–2633. [Google Scholar]
Figure 1. Hyperplane offset of lithium battery data set. (a) Training set T1, C = 100; (b) training set T2, C = 100; (c) training set T1, C = 10; (d) training set T2, C = 10.
Aerospace 11 00467 g001
Figure 2. Flow chart of optimized SVM algorithm.
Aerospace 11 00467 g002
Figure 3. Trend of charging voltage.
Aerospace 11 00467 g003
Figure 4. Charging current trend graph.
Aerospace 11 00467 g004
Figure 5. Optimized SVM algorithm training iterative process.
Aerospace 11 00467 g005
Figure 6. SVM optimization algorithm test set evaluation results.
Aerospace 11 00467 g006
Figure 7. Comparison of SVM recognition effects in test set.
Aerospace 11 00467 g007
Table 1. Basic parameters of experimental battery.
Parameter NameParameter Value
Battery Model18,500
Maximum Charge Cut-off Voltage4.2 V
Rated Voltage3.6 V
Rated Capacity2 Ah
Charging Temperature Range0~45 °C
Discharge Temperature Range−20~60 °C
Specific Magnetization−20~60 °C
Table 2. Comparison of improved SVM with baseline algorithms on test set.
AlgorithmsAccuracy (%)Recall (%)Precision (%)Error (%)Time (s)
Random Forest [25]70.8353.7578.1829.170.462
SVR [26]90.4880.0094.549.520.208
C-SVM [27]87.5072.37100.0012.501.034
Kb-SVM [28]91.0781.2594.548.930.251
Optimized-SVM 90.4877.47100.009.520.529
Disclaimer/Publisher’s Note: The statements, opinions and data contained in all publications are solely those of the individual author(s) and contributor(s) and not of MDPI and/or the editor(s). MDPI and/or the editor(s) disclaim responsibility for any injury to people or property resulting from any ideas, methods, instructions or products referred to in the content.

