Article

Investigation on Accelerated Initiation of Oblique Detonation Wave Induced by Laser-Heating Hot-Spot

1
School of Mechanics, Civil Engineering & Architecture, Northwestern Polytechnical University, Xi’an 710129, China
2
State Key Laboratory of High Temperature Gas Dynamics, Institute of Mechanics, Chinese Academy of Sciences, Beijing 100190, China
3
School of Engineer Science, University of Chinese Academy of Sciences, Beijing 100049, China
4
Research & Development Institute, Northwestern Polytechnical University in Shenzhen, Shenzhen 518057, China
5
Innovation Center NPU Chongqing, Northwestern Polytechnical University, Chongqing 400000, China
*
Authors to whom correspondence should be addressed.
Aerospace 2024, 11(6), 485; https://doi.org/10.3390/aerospace11060485
Submission received: 28 April 2024 / Revised: 13 June 2024 / Accepted: 14 June 2024 / Published: 19 June 2024
(This article belongs to the Special Issue Advances in Detonative Propulsion)

Abstract

:
A reliable initiation of oblique detonation is critical in oblique detonation engines, especially for oblique detonation engines under extreme conditions such as a high altitude and low Mach number, which may lead to excessive length of the induction zone and even the phenomenon of extinction. In this paper, surface ignition was applied to the initiation of oblique detonation, and a high-temperature region was set on the wedge to simulate the presence of a hot-spot induced by the laser heating. The two-dimensional multi-component Navier–Stokes equations considering a detailed H2 combustion mechanism are solved, and the oblique detonation wave accelerated by a hot-spot is studied. In this paper, hot-spots in the induction zone on the wedge, are introduced to explore the possibility of hot-spot initiation, providing a potential method for initiation control. Results show that these methods can effectively promote the accelerated initiation of the oblique detonation. Furthermore, the hot-spot temperature, size and position are varied to analyze their effects on the initiation position. Increasing the temperature and size of the hot-spot both can accelerate initiation, but from the perspective of energy consumption, a small hot-spot at a high temperature is preferable for accelerating ODW initiation than a large hot-spot at a low temperature. The initiated position of the oblique detonation is sensitive to the position of the hot-spots; if a 2000 K hotspot is at the beginning of the wedge, then the ODW’s initiation distance will be reduced to about 30% of that without hotspot acceleration.

1. Introduction

A detonation wave is a shock wave that is tightly coupled to the combustion with significant potential applications in hypersonic propulsion [1,2,3]. The oblique detonation engine (ODE) is a type of ramjet engine that uses the oblique detonation wave (ODW) to generate thrust. In 1958, Dunlap et al. [4] first proposed the application of standing detonation combustion to airbreathing propulsion. Pratt et al. [5] started from the requirements of combustion organization in the air-breathing hypersonic propulsion system and drew on the shock polar theory to elaborate on the theoretical scope of the ODW. Morrison et al. [6] carried out a one-dimensional theoretical evaluation and scheme design of the performance of the ODE machine. Compared with traditional scramjet, it has the advantages of high efficiency of the heat cycle, simple structure, reliability, and wide working scope [7,8,9,10]. In the process of ODE practice, the reliable initiation and standing of ODW in the combustor is the primary problem, so it is necessary to study the initiation characteristics and mechanism of the ODW. Over the last few decades, many researchers conducted extensive research on the ODW induced by a wedge. Li [11,12] firstly determined the wave structure of the ODW in their numerical simulations. This typical structure is mainly composed of an oblique shock wave (OSW), ODW surface, and triple-wave point connecting the OSW and the ODW. Following that, Viguier, Desbordes, and Kamel et al. confirmed the accuracy of Li’s numerical simulation by performing experiments [13,14,15]. Previous studies [3,8] have frequently used a semi-infinite wedge to investigate the initiation mechanism of ODW. Furthermore, the researchers have also conducted many studies on the ODW induced by the multistage wedge [16,17] and the limited-length wedge [18,19,20]. These studies included the systematic structure, transition characteristics, and stationary characteristics of ODW, contributing to the theoretical development of ODW and the design of ODE. However, at extreme conditions such as a high altitude, in-homogeneous inflow, and low Mach number, the phenomenon of extinction or the failure of initiation may still occur [21,22,23,24].
The researchers have proposed some ways to deal with the phenomenon of extinction and the failure of initiation. Fang et al. proposed spheres-induced ODW; the blunt body generates a bow shock and makes the high post-shock temperature so the detonation is initiated [25]. However, this structure creates extra resistance, which is additionally prone to fracture and ablation. Han et al. [26] and Xiang et al. [27] proposed ODW induced by a blunt bump on the wedge surface. The results of their studies demonstrated that the presence of the blunt produces an additional shock wave, promoting the formation of the heat-release chemical reactions thus accelerating the initiation of the oblique detonation wave. However, this approach complicates the structure and creates resistance. Jet can promote the flame acceleration and deflagration-to-detonation transition process [28], thus the jet is a potential method to accelerate ODW initiation. Wang et al. [29] and Zhang et al. [30] investigated the effects of transverse jets on the initiation characteristics of oblique detonation waves. The results showed that the transverse jet is an effective method to control the initiation position, and the structure and position of the ODW are affected by the position, the angle, and the flow discharge of the jet. However, consistent with the blunt bump on the wall, the jet also creates additional resistance. In the early days, Daiber and Thompson [31] used a pulsed laser to heat a mixture of air, hydrogen, and noble gases to induce a spherical detonation wave. Steverding [32] used a pulsed laser to irradiate the target plate to generate a plasma jet, inducing combustion and detonation in a combustible gas mixture. Recently, Zhang et al. [33] numerically simulated the ODW induced by the laser spark; in their studies, a high-temperature and high-pressure region was used to simulate the presence of laser sparks. The laser is a non-intrusive energy, and the use of it to induce ODW avoids additional resistance and total pressure loss, but the direct induction of ODW by the laser requires a tremendous energy input.
In the internal combustion engine, detonation is an anomalous combustion phenomenon. However, it has significant potential applications in hypersonic propulsion. There is another anomalous combustion phenomenon in the internal combustion engine, surface ignition, which is a combustion phenomenon caused by a hot surface. In some cases, surface ignition can trigger detonation combustion. Theoretically, surface ignition can also be applicable to hypersonic propulsion. Some researchers have studied the hot surface ignition of hydrogen and oxygen mixture at low-temperature and low-pressure conditions [34,35,36,37]. These studies were based on the context of industrial safety. In this paper, surface ignition is applied to the induction of the ODW, and the initiation of ODW is accelerated by forming a high temperature hot-spot on the wedge. Studies [38,39] showed that laser irradiation at the metal indicates the formation of temperatures above 2000 K, so lasers can be used to generate hot-spots on the wedge.
In this paper, numerical studies on oblique detonation induced by a hot-spot on the wedge in hydrogen–air mixtures are performed, and a high-temperature region was set on the wall to simulate the presence of a hot-spot. Based on the detailed H2 combustion mechanism, the effects of the hot-spot on the ODW initiation are investigated by solving the two-dimensional N-S equation. Firstly, comparisons are made on the structures of ODW in the presence or absence of the hot-spot. Secondly, the effects of the temperature, size, and position of the hot-spot on the initiation length of the ODW are discussed. Section 2 introduces the physical and mathematical models. Section 3 is the results and discussion section where the effects of the hot-spot on oblique detonation are investigated and discussed. The conclusions of this paper are given in Section 4.

2. Physical and Mathematical Models

2.1. Physical Models

Figure 1 shows the ODE schematic (a) and the computation domain (b). As is shown in Figure 1a, the structure of the ODE is simple, including an inlet, a combustor, and a nozzle. Firstly, the inflow is compressed by two OSWs and the fuel and air are assumed to be premixed well at the inlet. After the compression of the inlet, the supersonic premixed combustible mixture reflects on the wedge to induce an OSW with a high post-shock temperature that triggers rapid heat-release chemical reactions, resulting in the formation of the ODW. The computation domain is presented in Figure 1b, which is a 30 mm × 15 mm rectangular area. The gray zone is the wedge, and the solid black line represents the wall. In this paper, viscosity is considered, so the wall condition is set to a non-slip isothermal boundary condition, and the wall temperature is 300 K. The short red line on the wall represents the hot-spot at a high temperature, which can be generated by laser irradiation on the wall. Like our previous studies [40], the wedge angle θ is fixed as 25°. The left and the upper dashed line are the inflow condition, and the right dashed line is the outflow condition.
In this paper, the characteristic length of the induction zone is defined as LI, which is the length on the x-axis from the position of the oblique shock-detonation transition to the front point of the OSW. For easy analysis, in some cases, the original LI without hot-spot control is represented as LO. The position of the hot-spot is determined by the xhot-spot, which is the x-coordinate of its starting point. The size of the hot-spot is defined as δ and the temperature of the hot-spot is T. The incoming gas is a hydrogen–air mixture with an equivalence ratio of 1.0, H2:O2:N2 = 2:1:3.76. The parameters of inflow are selected as T0 = 300 K, P0 = 101,325.0 Pa, and M0 is different in different cases.
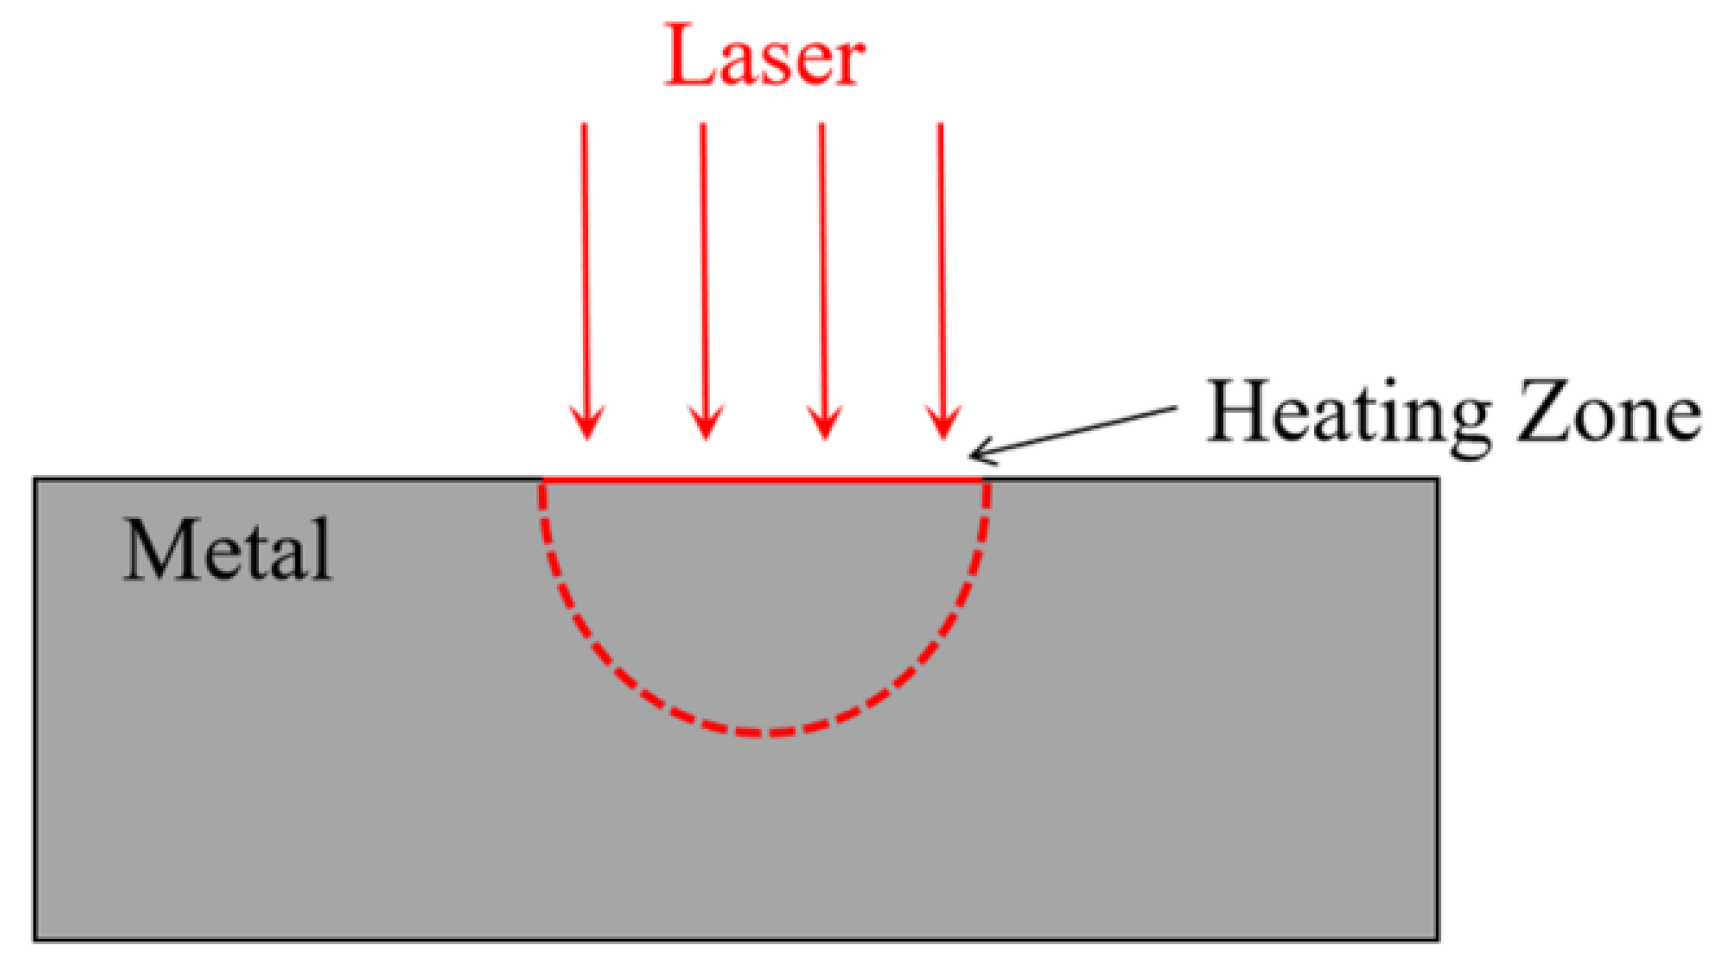
To study the effect of hot-spots on ODW, a high-temperature region was set on the wedge to simulate the presence of a hot-spot. When there is laser irradiation of metal, composite materials, etc., part of the laser energy is absorbed by the surface layer of the material, which will increase the temperature of the material. Several past studies have demonstrated the feasibility of using lasers to heat the surface of materials, either numerically or experimentally [41,42,43]. Figure 2 shows the schematic of the laser heating material. To analyze the temperature field distribution of continuous laser-irradiated materials, the differential equation of solid thermal conductivity can be established by Fourier’s law. Assuming that there is no heat source inside the material and the laser enters in the direction of the vertical material surface, then the heat conduction equation can be expressed as
T t = k ρ c 2 T x 2 + 2 T y 2 + 2 T z 2 + Q
where T is the temperature of the material, t is the time, k is the thermal conductivity, ρ is the density of the material, c is the specific heat, and Q is the heat source acting on the material. During the interaction of laser and opaque material, the laser absorption layer is very thin, and the heat source generated by the laser can be simplified to the surface heat source. Assuming a uniform distribution of energy within the laser spot, then the model of the heat source can be expressed as Q = A × Q0 in which A is the absorption rate of the surface of the material and Q0 is the power density of the laser.
The governing equation for calculating the temperature field is [44]
C T ˙ + K T = Q a
where [C] represents the specific heat capacity matrix, [ T ˙ ] is the temperature rate of change matrix, [K] is the thermal conductivity matrix, [T] is the node temperature matrix, and [Qa] represents the external heat flux matrix.
Metal tungsten is used as an example to verify the feasibility of using a laser to generate hot-spots on a wedge. The surface reflectivity of which is about 50% [45,46]. Other thermophysical parameters of tungsten are given in Table 1.
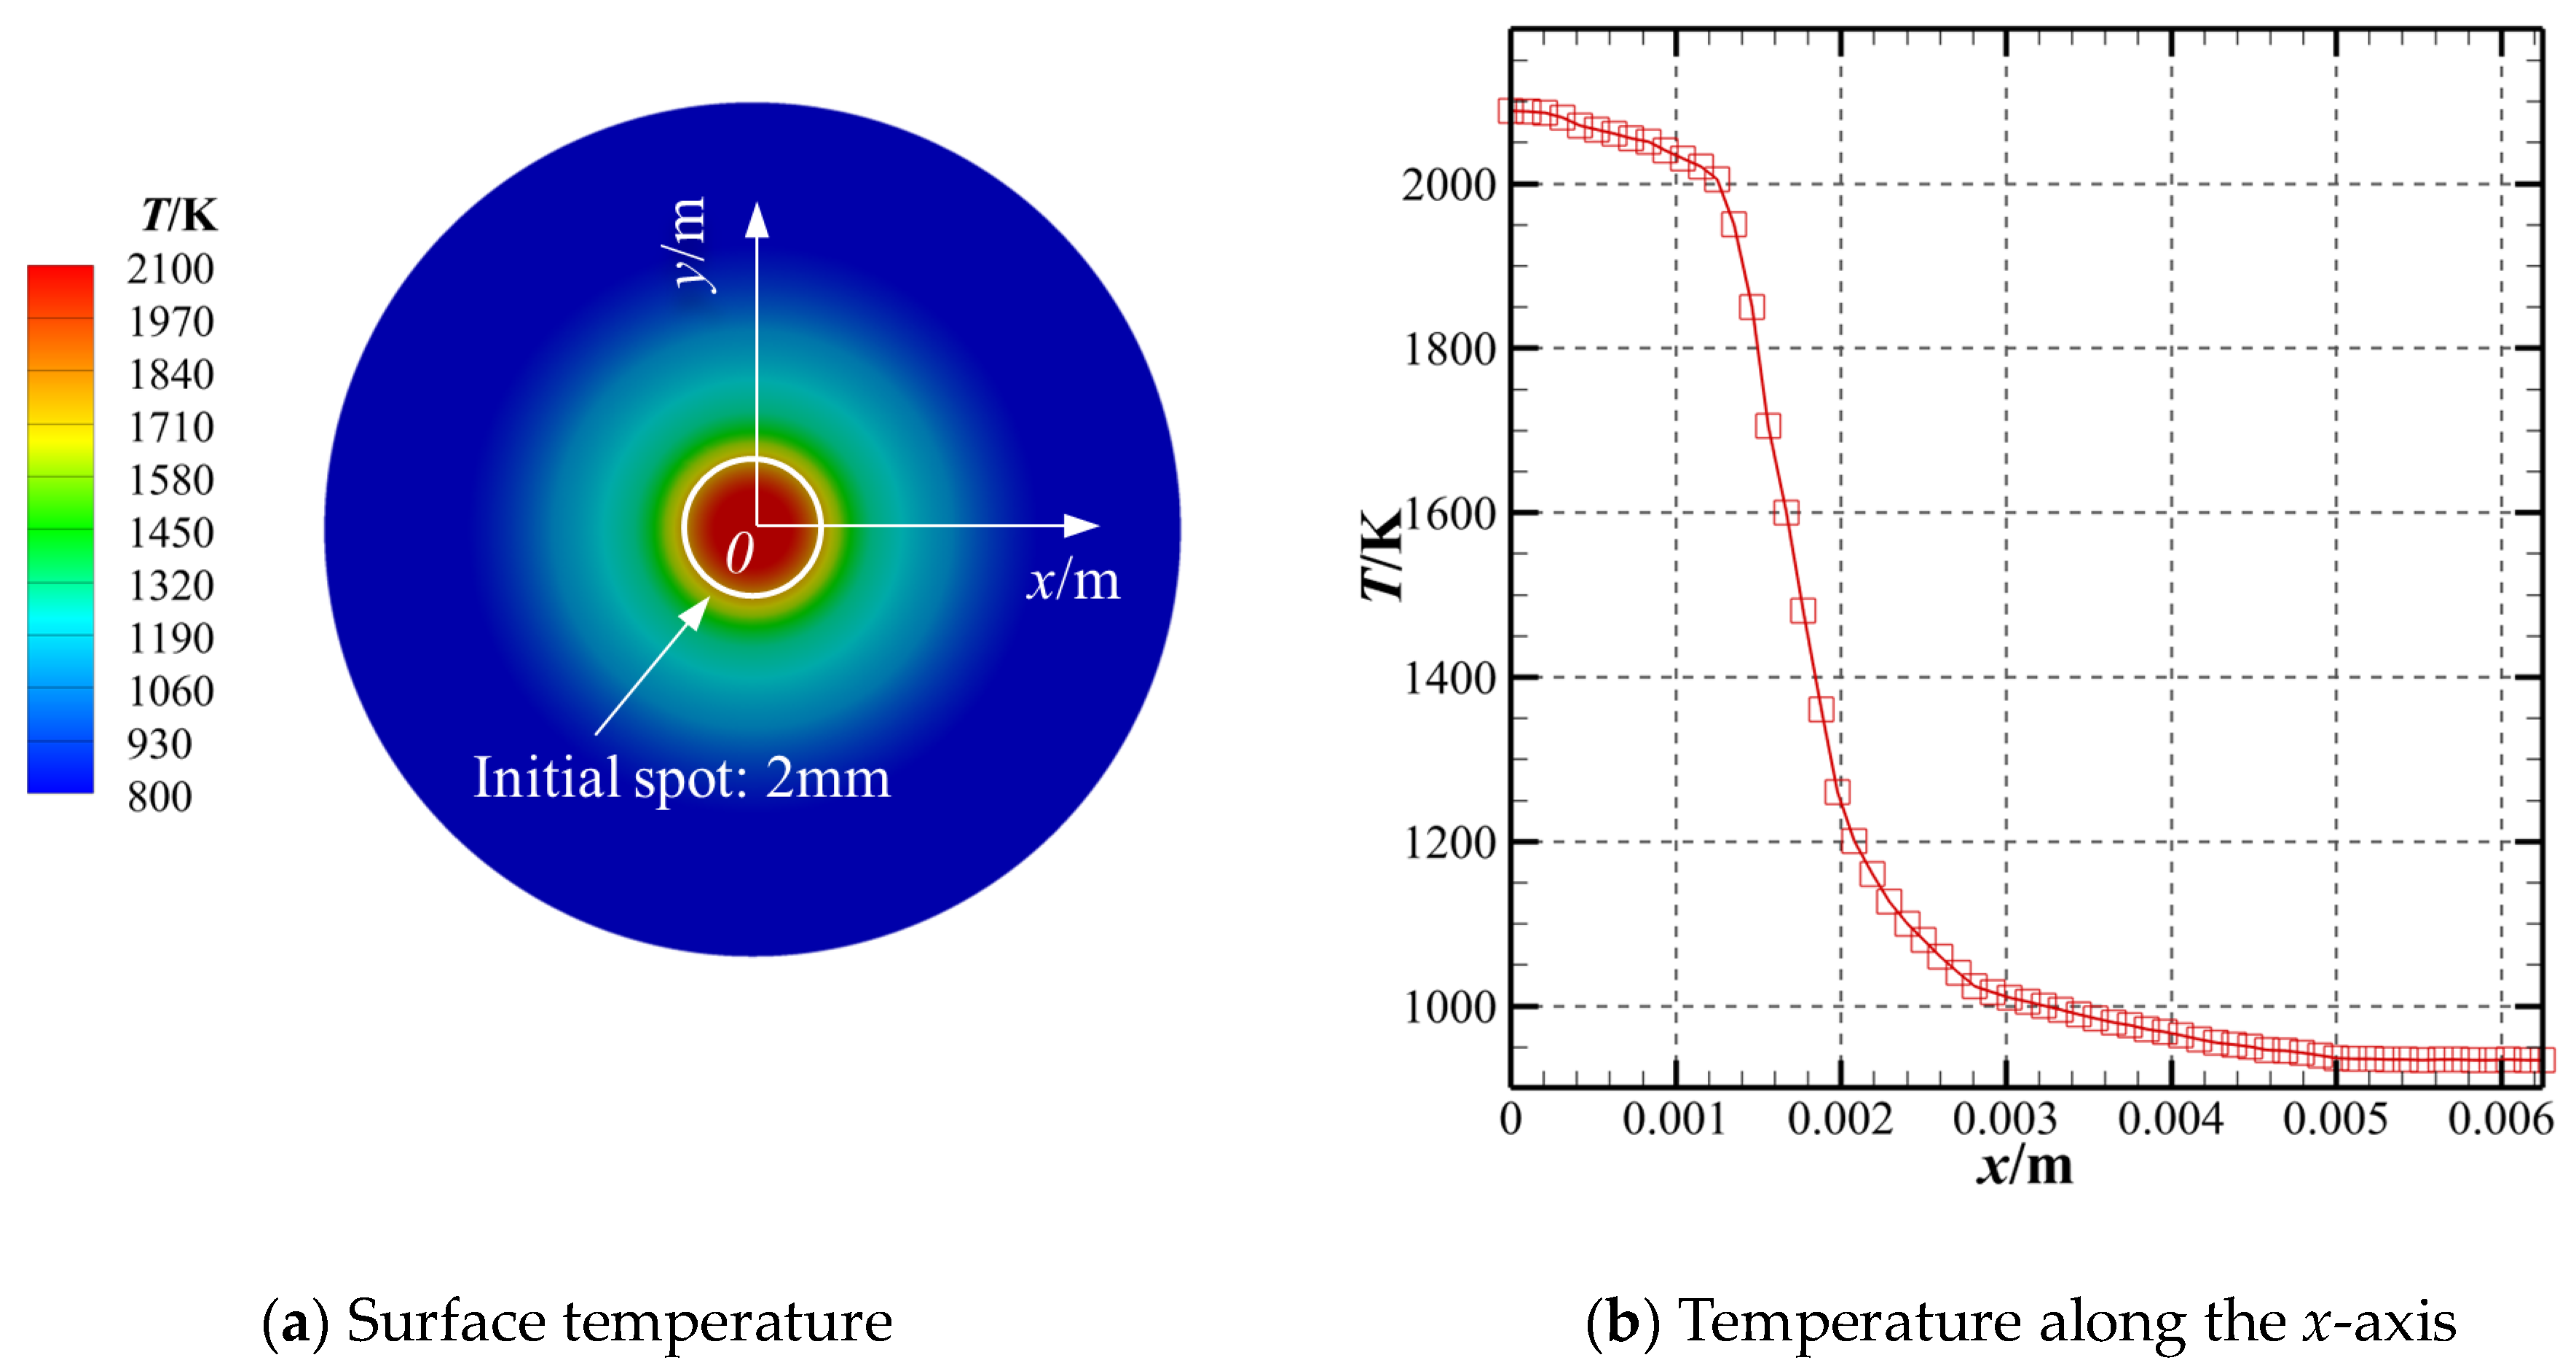
Figure 3 shows the temperature distribution of the tungsten surface after 1 s irradiation by a laser with Q0 = 19,000 W/cm2. It can be observed that the high temperature region almost coincides with the initial laser spot, and the temperature of the tungsten surface drops rapidly outside the laser irradiation area. The temperature of the hot-spot can be controlled by adjusting the laser power density and irradiation time, and the relationship between the power density of the laser and the highest temperature of the hot-spot is given in Table 2, which provides a reference for the laser selection.
In practice, the temperature of the hot-spot can be adjusted according to the power density of the laser; the temperature distribution within hot-spots is in fact uneven because of the influence of heat transfer. In this paper, however, we are trying to qualitatively analyze the effects of the hot-spot on ODW initiation, to simplify the analysis, the temperature within the hot-spot is assumed to be uniformly distributed. The hot-spot setting is given by boundary conditions. Within the hot-spot is set to an isothermal wall with high temperature.

2.2. Numerical Methods

In this paper, the two-dimensional multi-component Navier–Stokes equations considering elementary reactions are solved, i.e.,
U t + F F v x + G G v y = S
where U is the conservation variable vector, F and G are the convective flux vectors in the x-direction and y-direction, respectively. Fv and Gv are the viscous flux vectors in the x-direction and y-direction, respectively. S is the source item vector. Each vector is specified as follows:
U = ρ 1 ρ n ρ u ρ v e , E = ρ 1 u ρ n u ρ u 2 + p ρ u v ( e + p ) u , F = ρ 1 v ρ n v ρ u v ρ u v 2 + p ( e + p ) v
F v = 0 0 τ x x τ x y u τ x x + v τ x y q x , G v = 0 0 τ y x τ y y u τ y x + v τ y y q y , S = ω ˙ 1 ω ˙ n 0 0 0
In Equation (4), the subscript i (i = 1,2, ⋯, n) refers to the i-th substances. p, ρ, u, and v are the pressure, the density of mixed gas, and the velocity in the x and y direction, and e is the total internal energy of the mixed gas per unit mass:
p = i = 1 n p i = i = 1 n ρ i R 0 ω i T , ρ = i = 1 n ρ i
e = h p + 1 2 ρ u 2 + v 2
In Equation (6), R0 is the gas constant, and ωi is the molecular weight of the i-th species. In Equation (7), h is the specific enthalpy of the mixed gas, and other important thermodynamic parameters of the mixed gas include the constant pressure specific heat cp and the specific entropy s:
h = i = 1 n Y i h i c p = i = 1 n Y i c p i s = i = 1 n Y i s i
where Yi is the mass fraction of the i-th species and cpi, hi, and si are the constant pressure specific heat, specific enthalpy, and specific entropy of component i, respectively. These thermodynamic parameters can be fitted by functions of temperature T through NASA’s empirical formula [47]:
c p i ( T ) R i = a i 1 + a i 2 T + a i 3 T 2 + a i 4 T 3 + a i 5 T 4 h i ( T ) R i T = a i 1 + a i 2 T 2 + a i 3 T 2 3 + a i 4 T 3 4 + a i 5 T 4 5 + b i 1 T s i 0 ( T ) R i T = a i 1 ln T + a i 2 T + a i 3 T 2 2 + a i 4 T 3 3 + a i 5 T 4 4 + b i 2
where the coefficients ai1–5 and bi1–2 can be found from the literature [47], Ri is the gas constant of species i, which is calculated by the formula Ri = R0i, where the universal gas constant R0 = 8.314 J/(mol·K) and ωi is the mole mass of species i.
In Equation (5), τxx, τxy, τyx, and τyy are the four components of the viscous stress tensor, and qx and qy are the components of heat flow in the x-direction and y-direction, which can be expressed as
[ τ x x τ x y τ y x τ y y ] = μ [ 4 3 u x 2 3 v y u y + v x u y + v x 4 3 v y 2 3 u x ]
q x = k T x , q y = k T y
where μ is the viscosity coefficient given by the Sutherland formula, k is the thermal conductivity coefficient and k = μ·cp/Pr, Pr is the Prandtl number, here Pr = 0.72.
In this paper, the chemical reaction model used the H2–air chemical reaction model containing nine species (H2, O2, H, O, OH, HO2, H2O2, H2O, and N2) and nineteen reactions [48]. In this paper, the governing equations are solved by the finite volume method based the quadrilateral grid, the AUSM PW+ scheme is used to discretize the convective term of governing equations, the original variables are reconstructed with the MUSCL scheme, and the minmod limiter with third-order spatial accuracy is used [49].
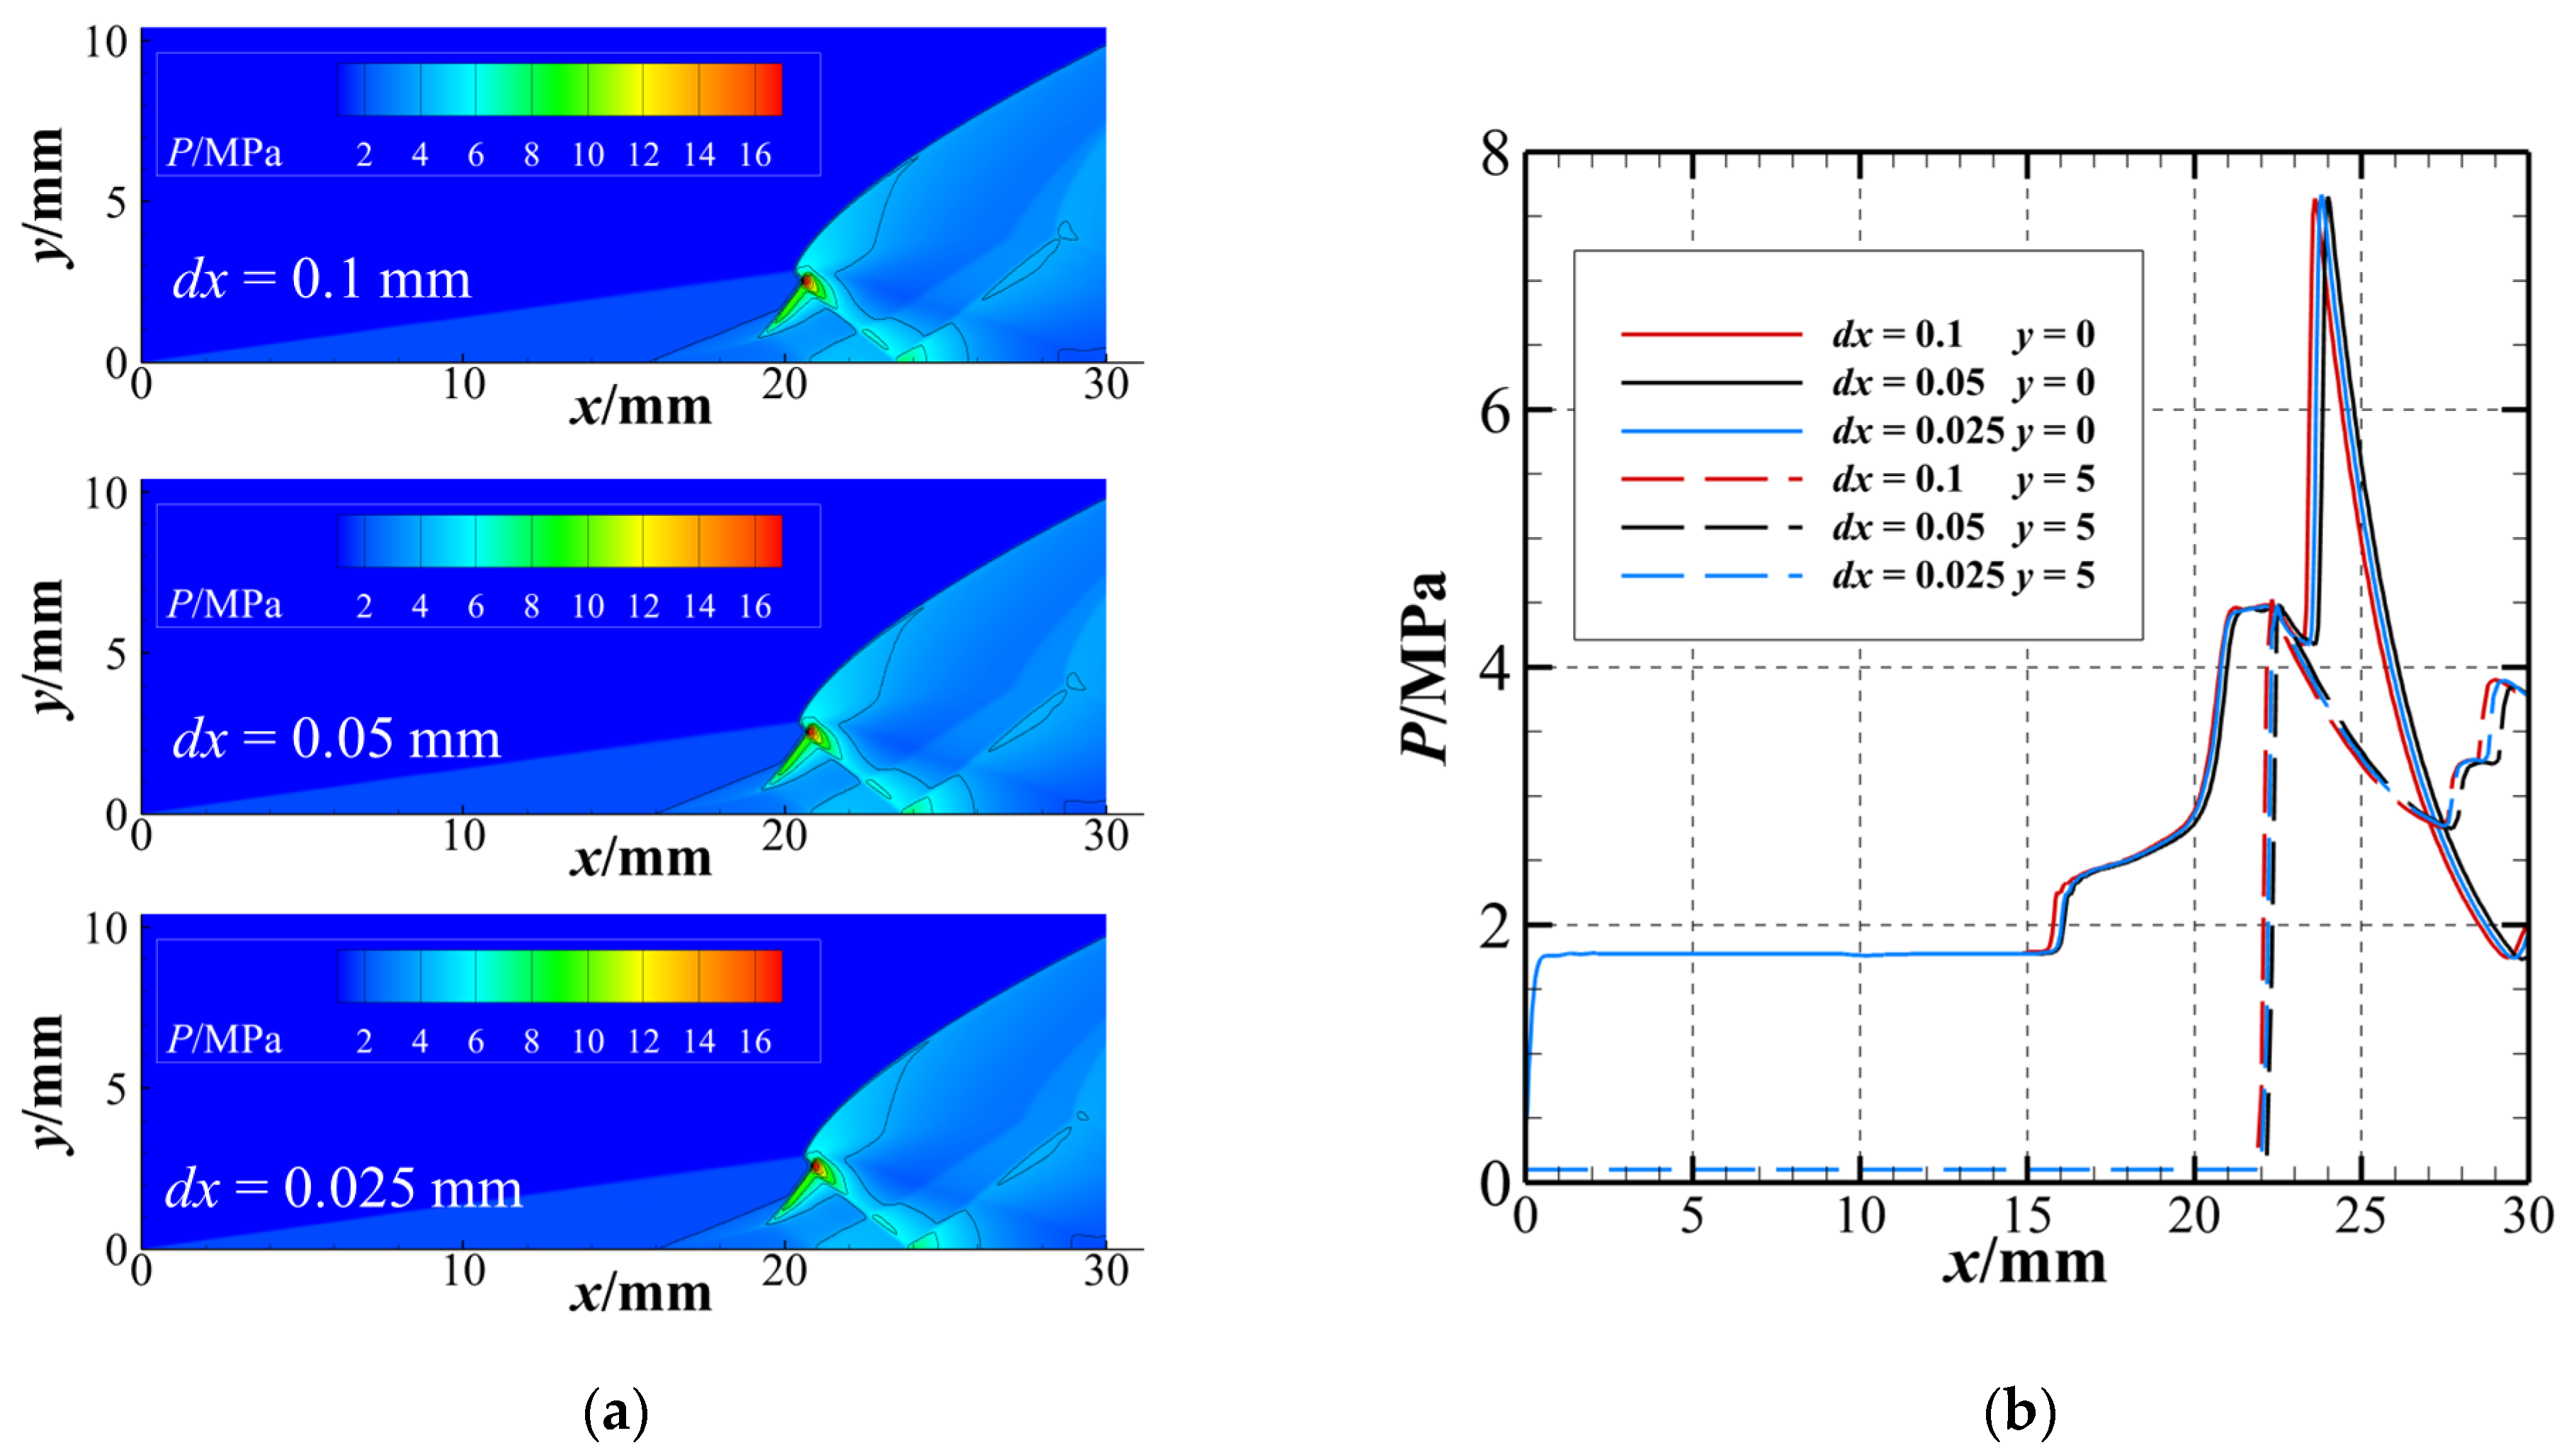
To eliminate the influence of grid resolution on numerical simulation results, in this paper, three grid sizes (dx = dy = 0.1 mm, dx = dy = 0.05 mm, and dx = dy = 0.025 mm) were used for the initial calculation, and the flow parameters are T0 = 300 K, P0 = 101,325.0 Pa, and M0 = 7. Figure 4a shows the pressure contours of ODW in three grid scales, the main structure of the flow field consists of an OSW, an ODW, and a triple-wave point connecting them. Figure 4b shows the pressure distribution along different lines parallel to the x-axis in different grid scales. The results of pressure contours in Figure 4a show that the wave structure at the three grid scales is consistent. Figure 4b shows that there are some differences between the results of dx = 0.1 mm and those of dx = 0.05 mm and dx = 0.025 mm, but at the grid size of 0.05 mm and 0.025 mm, the pressure distributions along the different straight lines almost coincide. Therefore, to save on computing costs, the grid size of 0.05 mm was used for subsequent numerical calculations.

3. Results and Discussion

3.1. Initiation Characteristics of ODW Induced by a Hot-Spot

The results of the pre-calculations (Figure 5a) are in agreement with previous studies [40,50] indicating that the post-shock temperature of the original ODW without a hot-spot could exceed 1100 K, but not more than 1200 K. The temperature of the hot-spot needs to significantly exceed the post-shock temperature and the heat resistance of most materials needs to be considered; therefore, it was set to 1500 K to 2000 K.
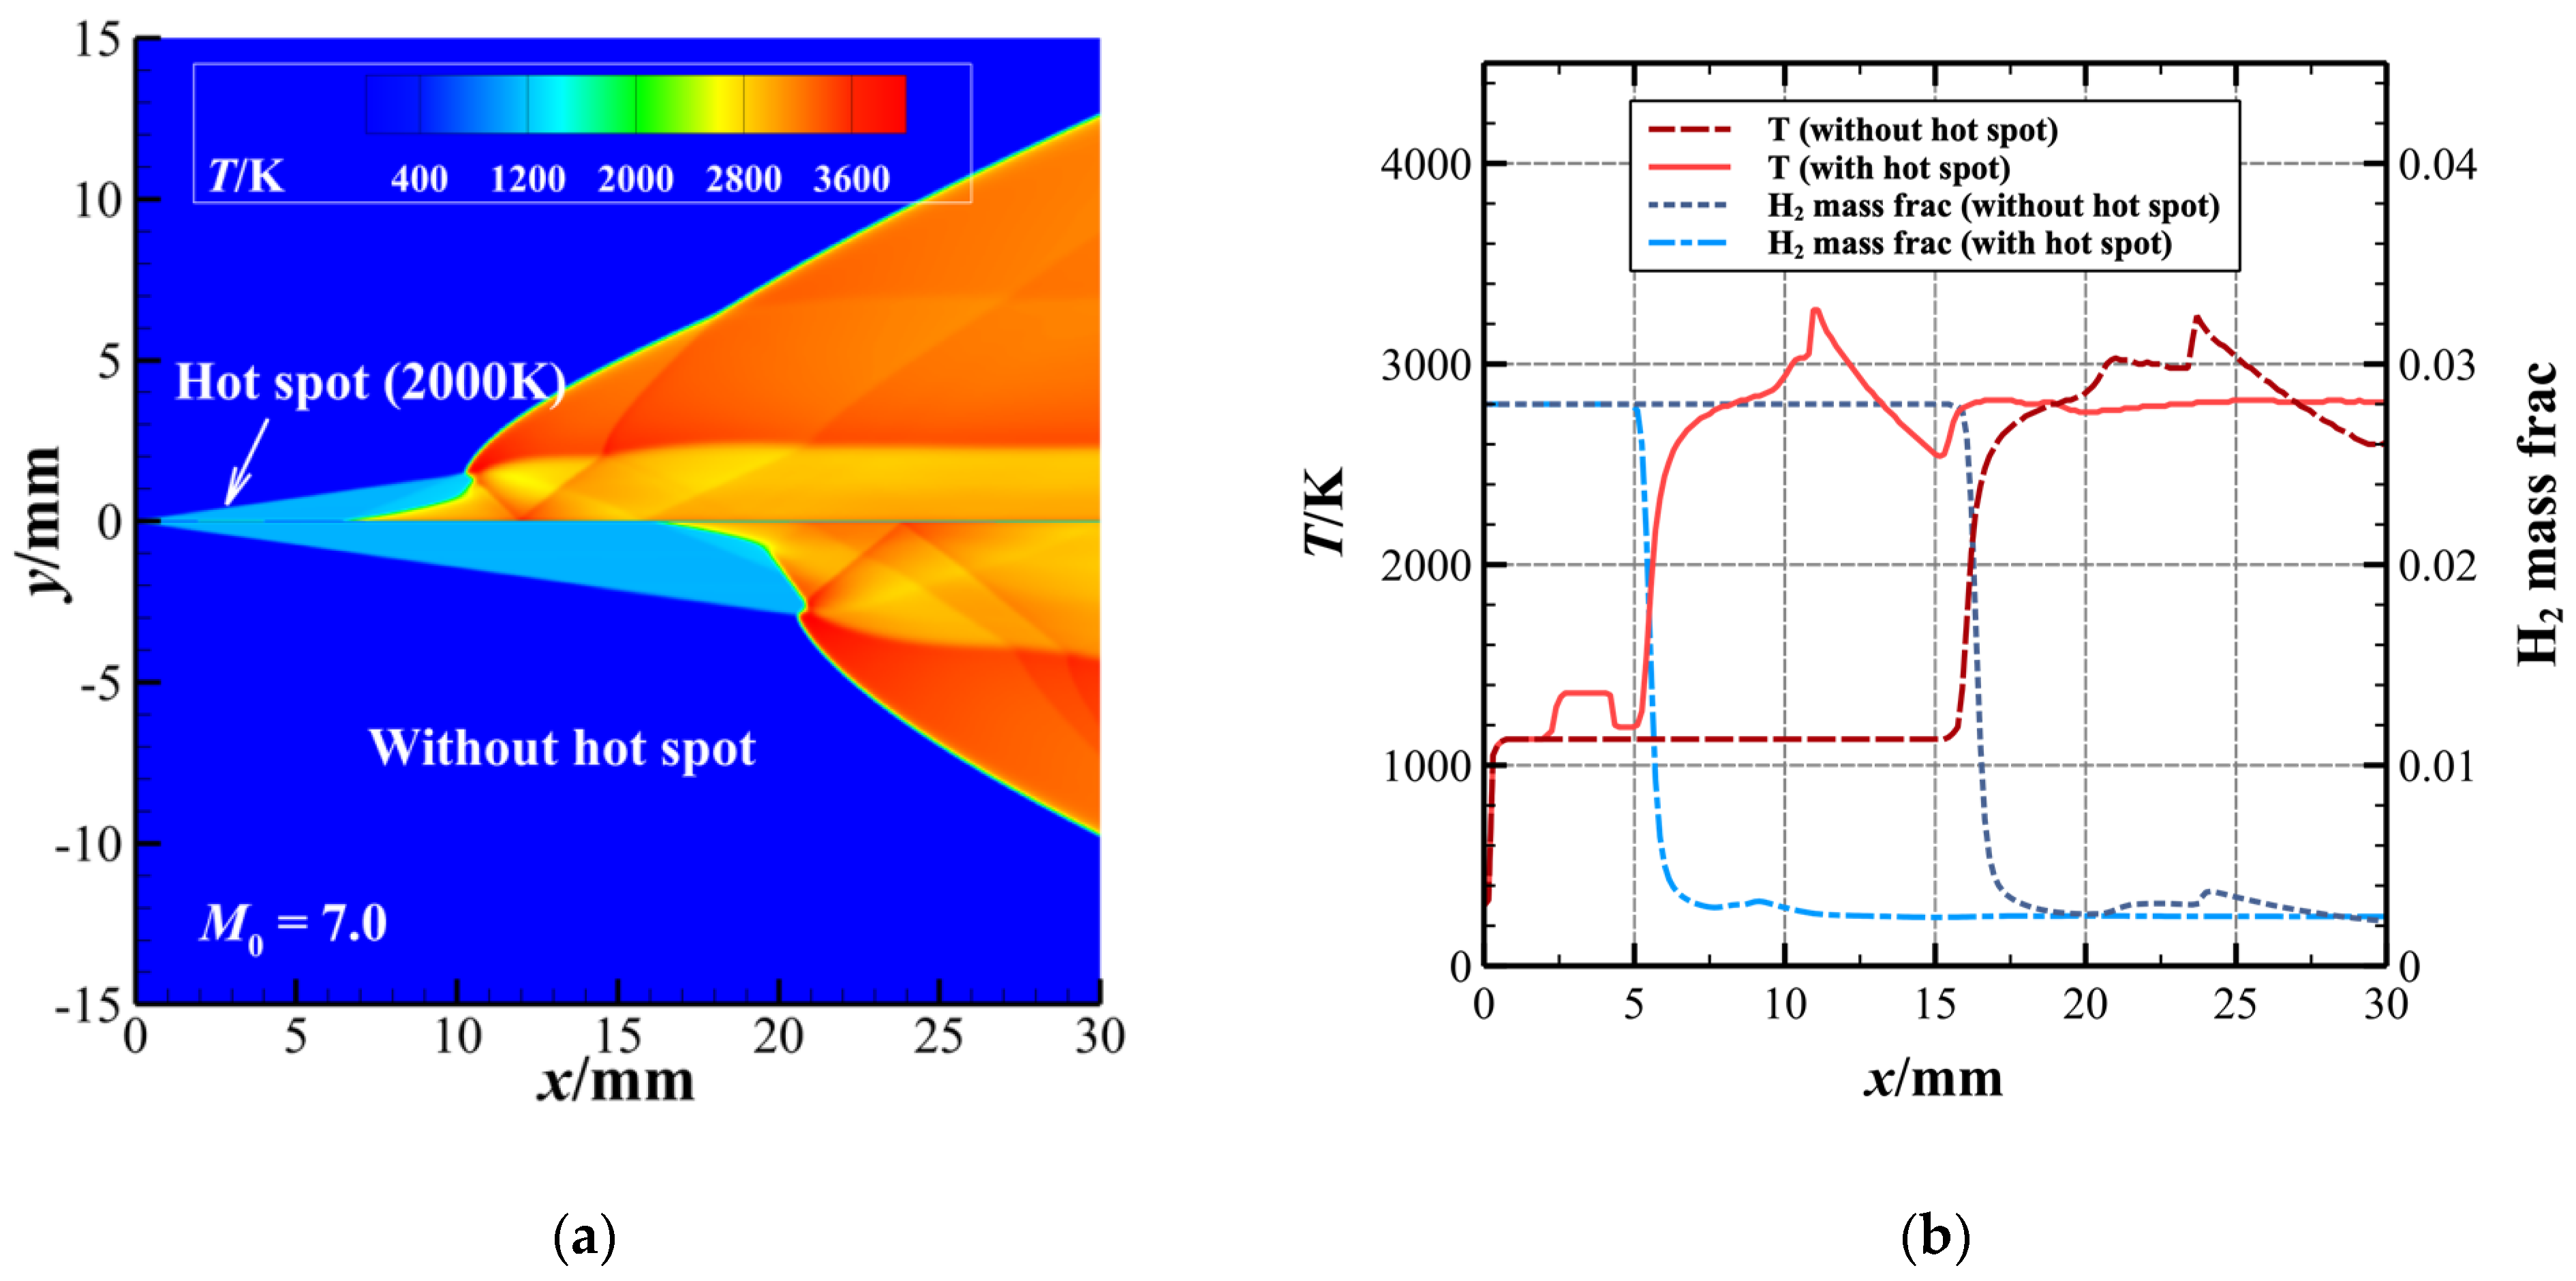
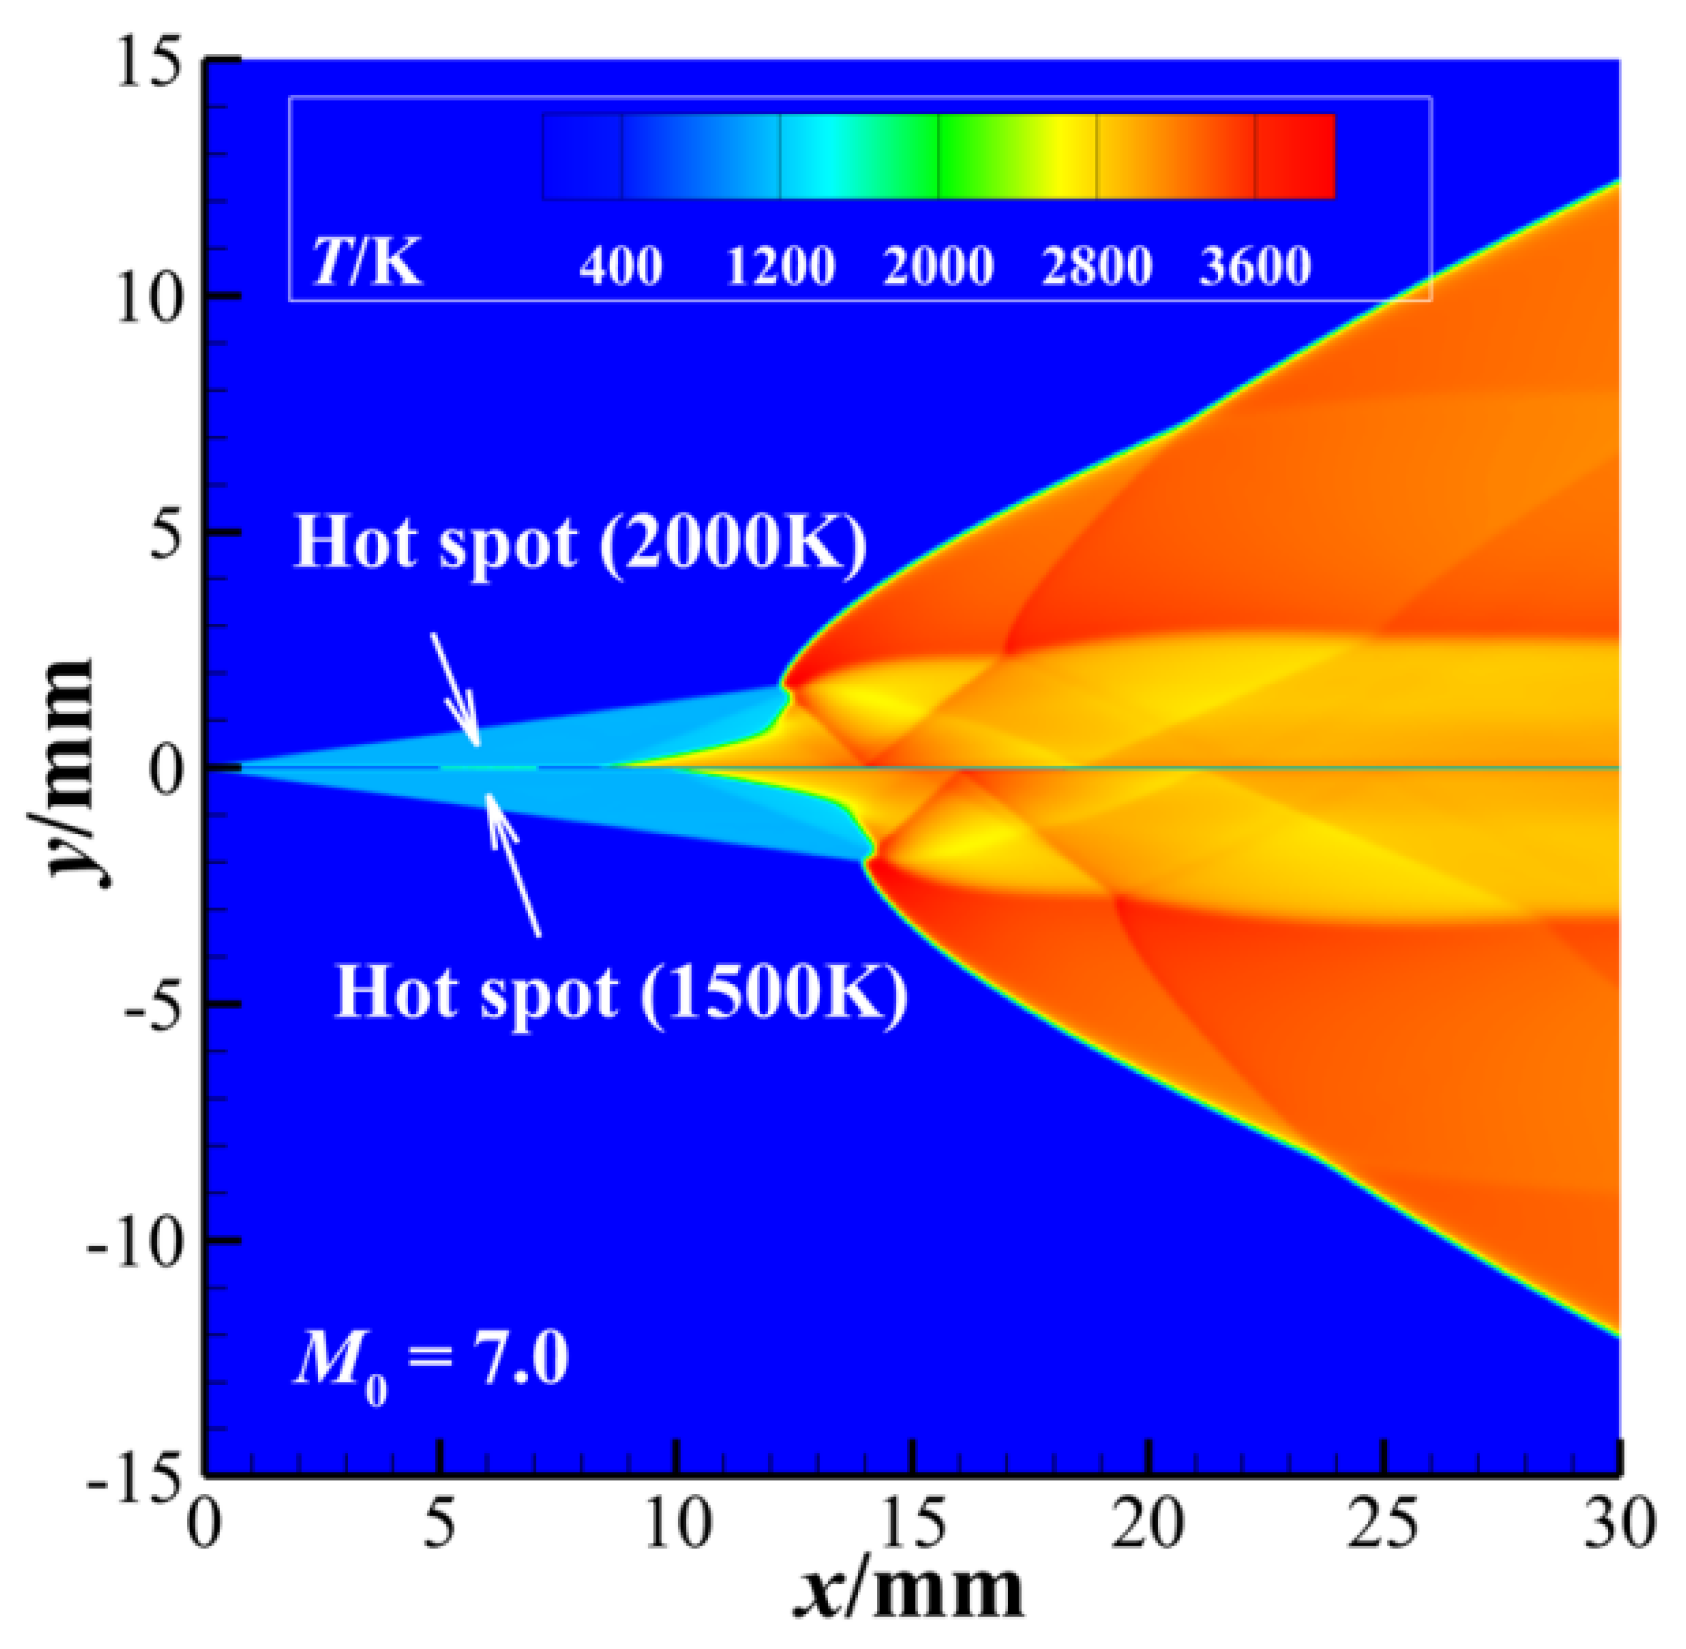
The variable parameters used in the simulations are listed in Table 3. The position of the hot-spot xhot-spot is determined by the position of the oblique shock-detonation transition in the original ODW without a hot-spot LI; that is, xhot-spot = 10% LI. The temperature and size of the hot-spots in this section are fixed to T = 2000 K and δ = 2 mm. Figure 5a shows the temperature fields of the original ODW without a hot-spot and hot-spot-initiation ODW for M0 = 7.0. Compared with the original ODWs without a hot-spot, the initiation position of the ODWs moves upstream after the hot-spot is introduced. The position of the triple-wave point originally is near x = 20.60 mm, moving to approximately x = 10.17 mm after the hot-spot is added. It can be observed that the ignition occurs just after the hot-spot on the wedge, demonstrating that the hot-spot plays an essential role in the earlier initiation. Figure 5b shows the temperature and the mass fraction of H2 distributing along the line of y = 0.05 mm in the original ODW without a hot-spot and hot-spot-initiation ODW. It should be noted that there is a fluctuation in the H2 mass fraction at the position of the shock reflection on the wall, which may be due to the increase in the rate of hydrogen-producing reactions due to the high post-reflected shock temperature, but this does not affect the subsequent analysis. It can be observed that, firstly, at x = 2 mm, the mixture in the boundary layer is heated by the hot-spot, and the temperature close to the wall is increased. The mass fraction of H2 is not reduced simultaneously, which means that the mixture was not immediately ignited by a hot-spot. These illustrate that the hot-spot increases the energy of the combustible mixture, resulting in the early occurrence of exothermic chemical reactions, which is the physical mechanism of ODW initiation acceleration by the hot-spot.
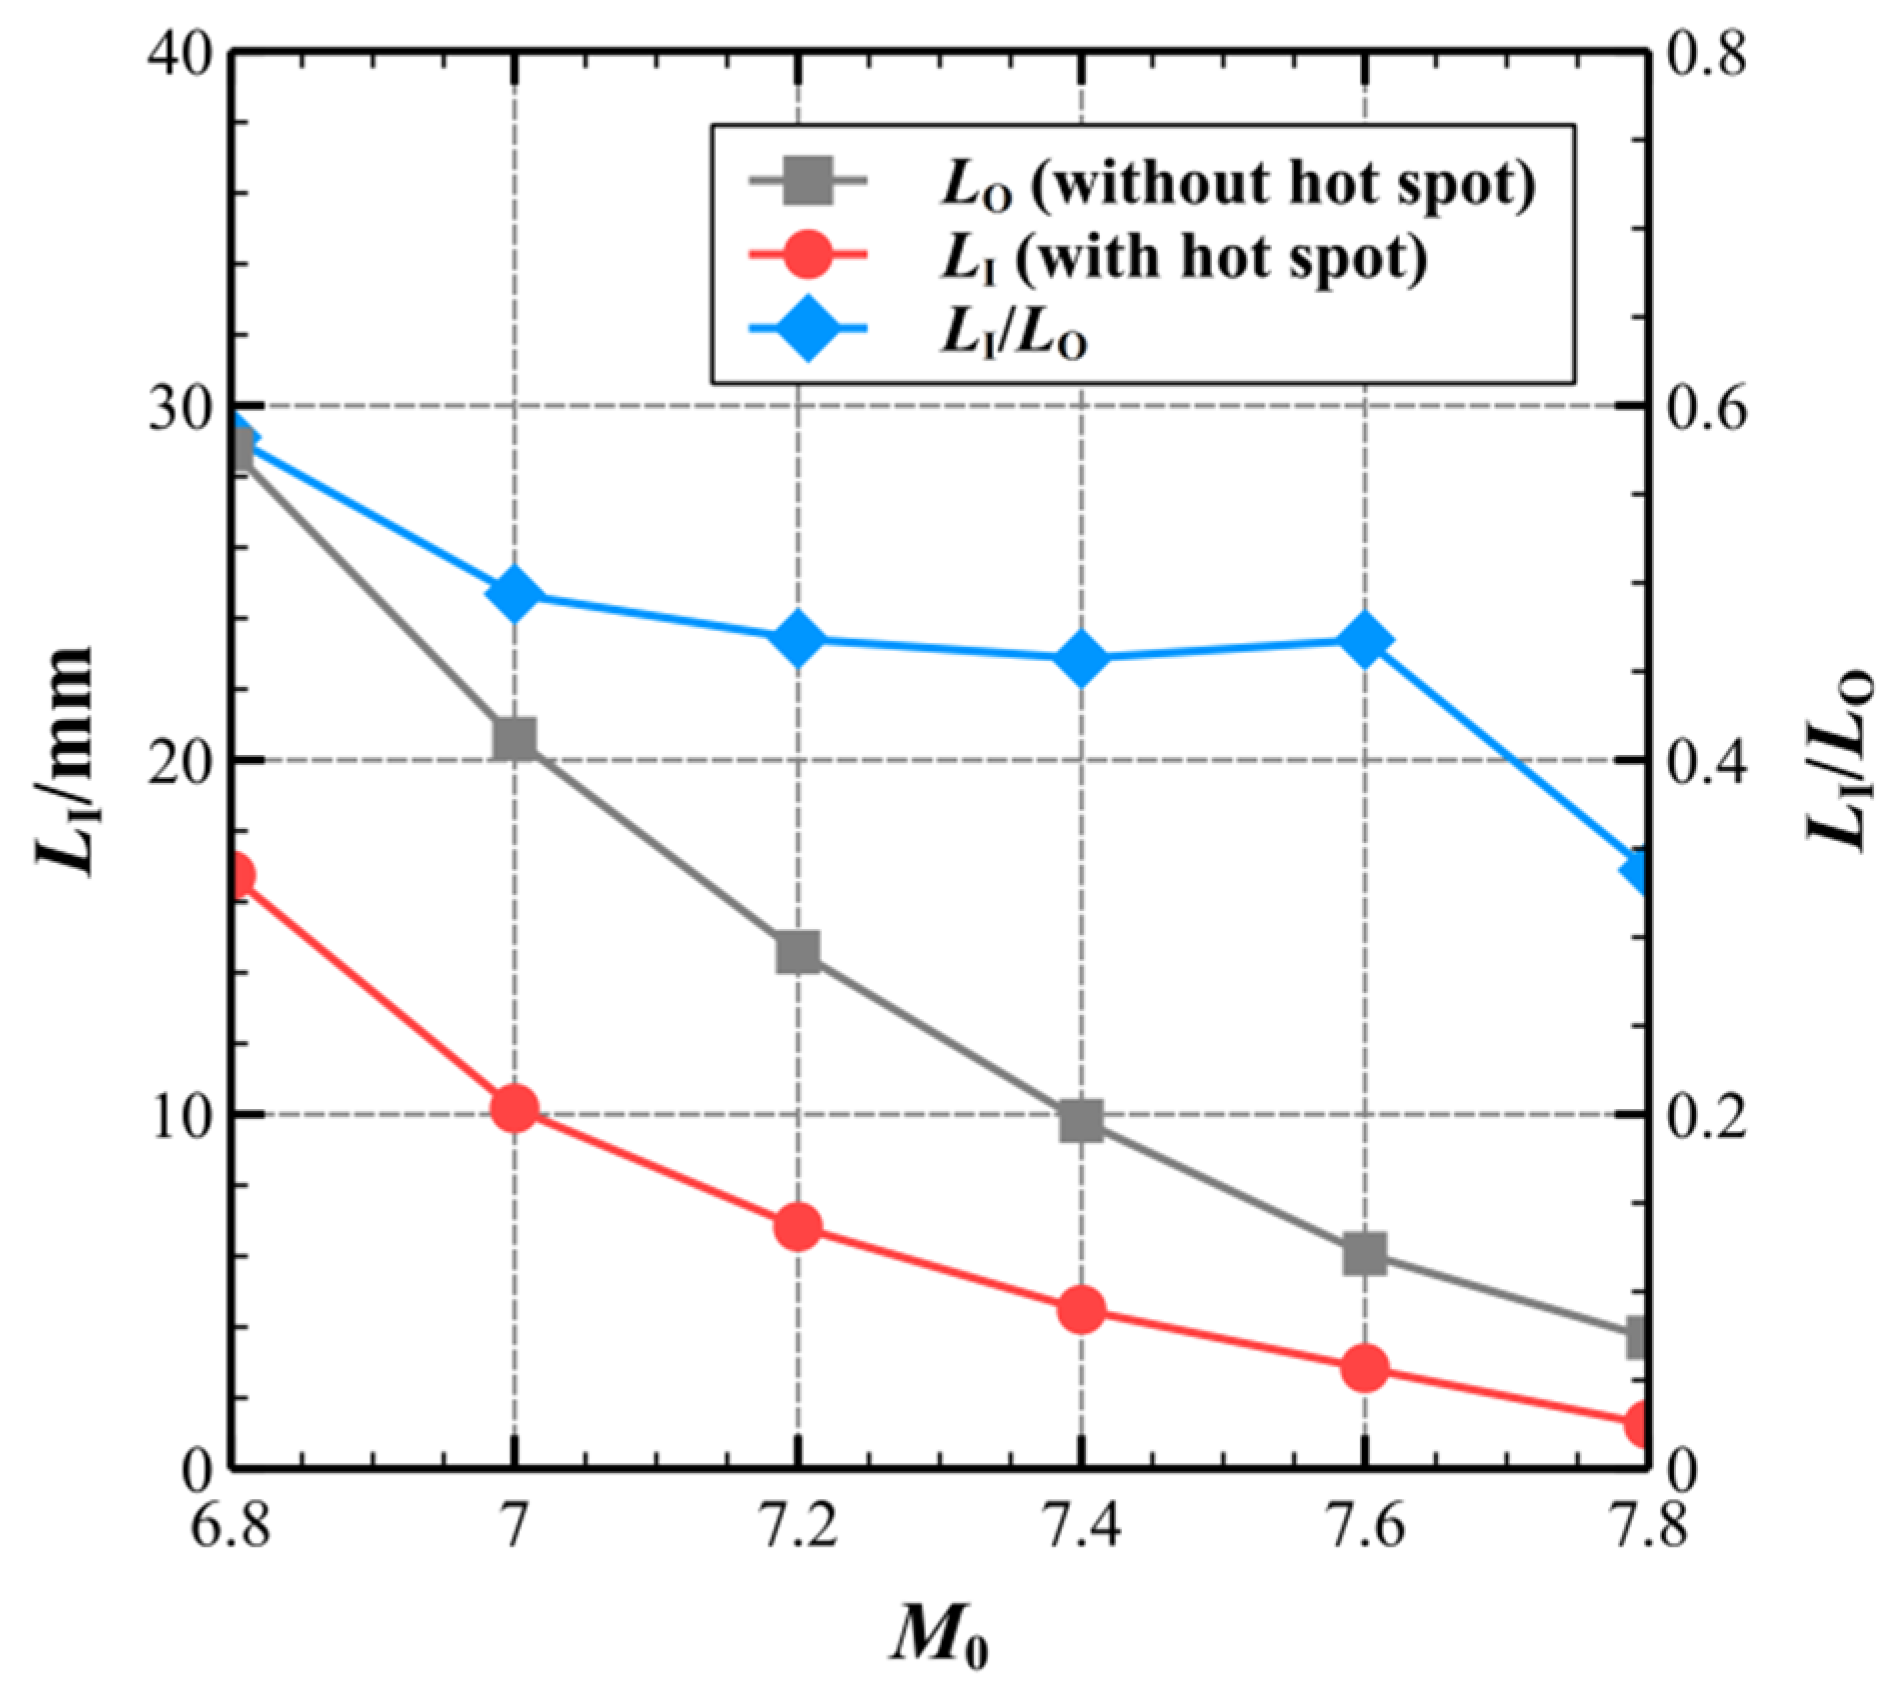
Figure 6 compares the position of the oblique shock-detonation transition of the original ODW without a hot-spot to that of the ODW with a hot-spot as a function of inflow Mach number. Compared with the original ODWs without hot-spots, the position of the oblique shock-detonation transition with hot-spot control is significantly shorter. With or without hot-spot initiation, LI follows nearly the same trend as M0 increases. The blue line represents the ratio of LI controlled by the hot-spot to the original LI, the LO. It can be observed that in the cases where xhot-spot is 10% of the original LI, during the increase of M0 from 6.8 to 7.6, the LI with hot-spot control is found in between 40% and 60% of the original LI, and most are close to 50%. The difference is that when M0 increased to 7.8, the LI/LO rapidly decreased to approximately 35%. This is because in case M0 reaches 7.8, the original initiation position is too close to the position of the hot-spot, and in this case, the size of the hot-spot has a relatively obvious effect on ODW initiation, resulting in a rapid decrease of LI/LO. The effect of the size of the hot-spots on ODW initiation is discussed in Section 3.2 Together, these results demonstrate that introducing a hot-spot in the induction zone is an effective method to accelerate the initiation of the ODW.

3.2. The Effects of Hot-Spot Parameters on ODW

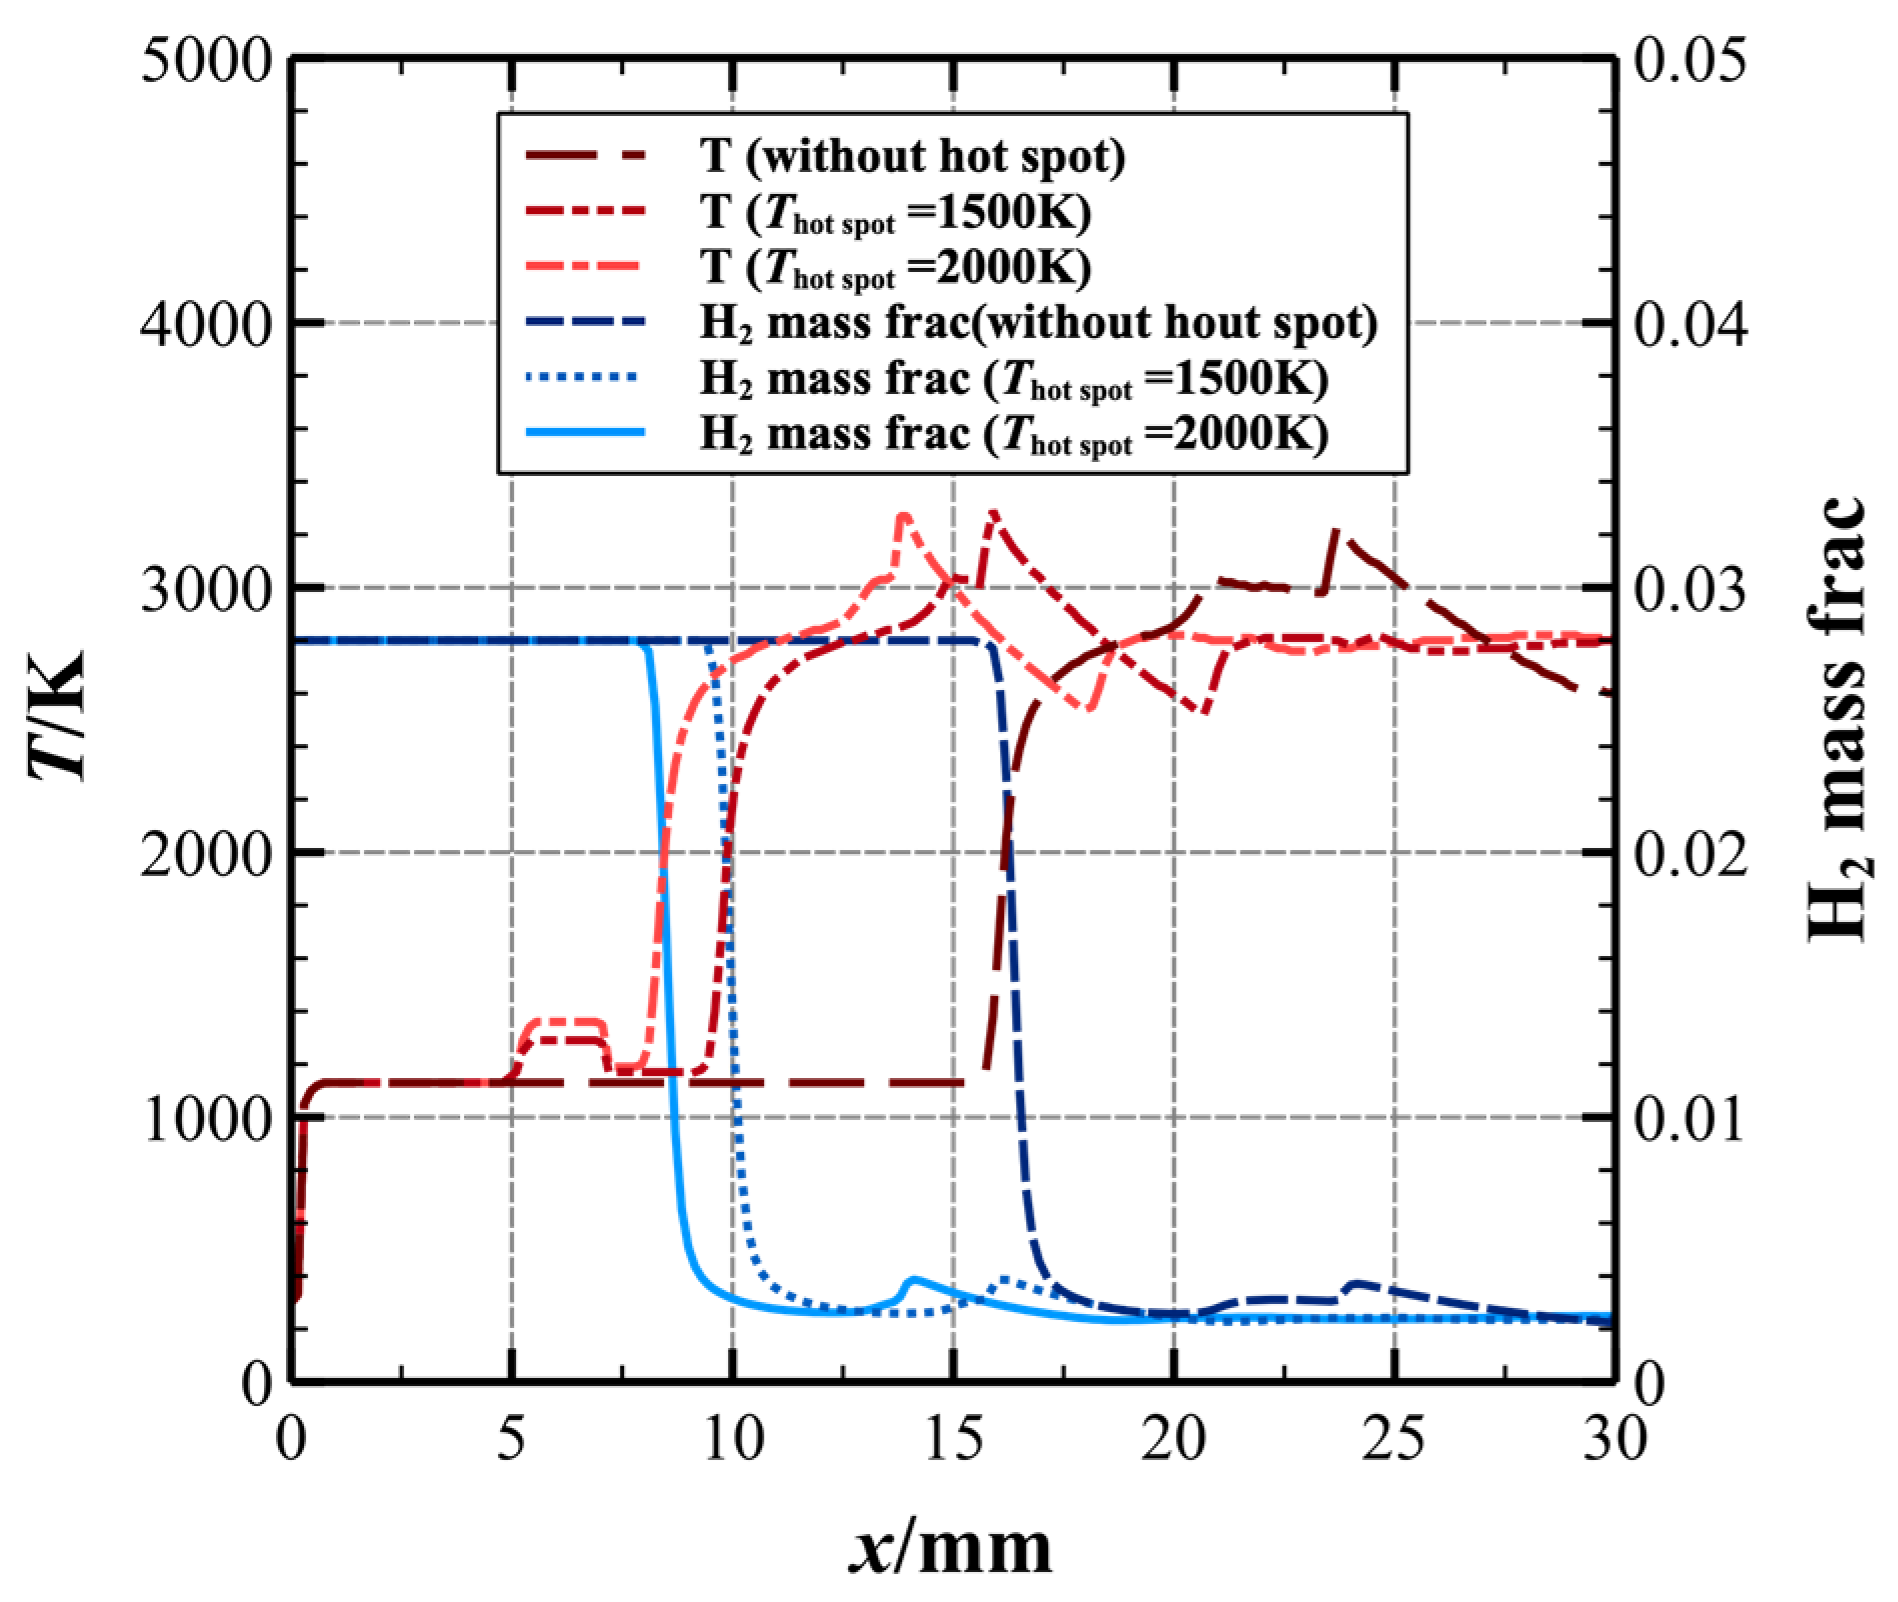
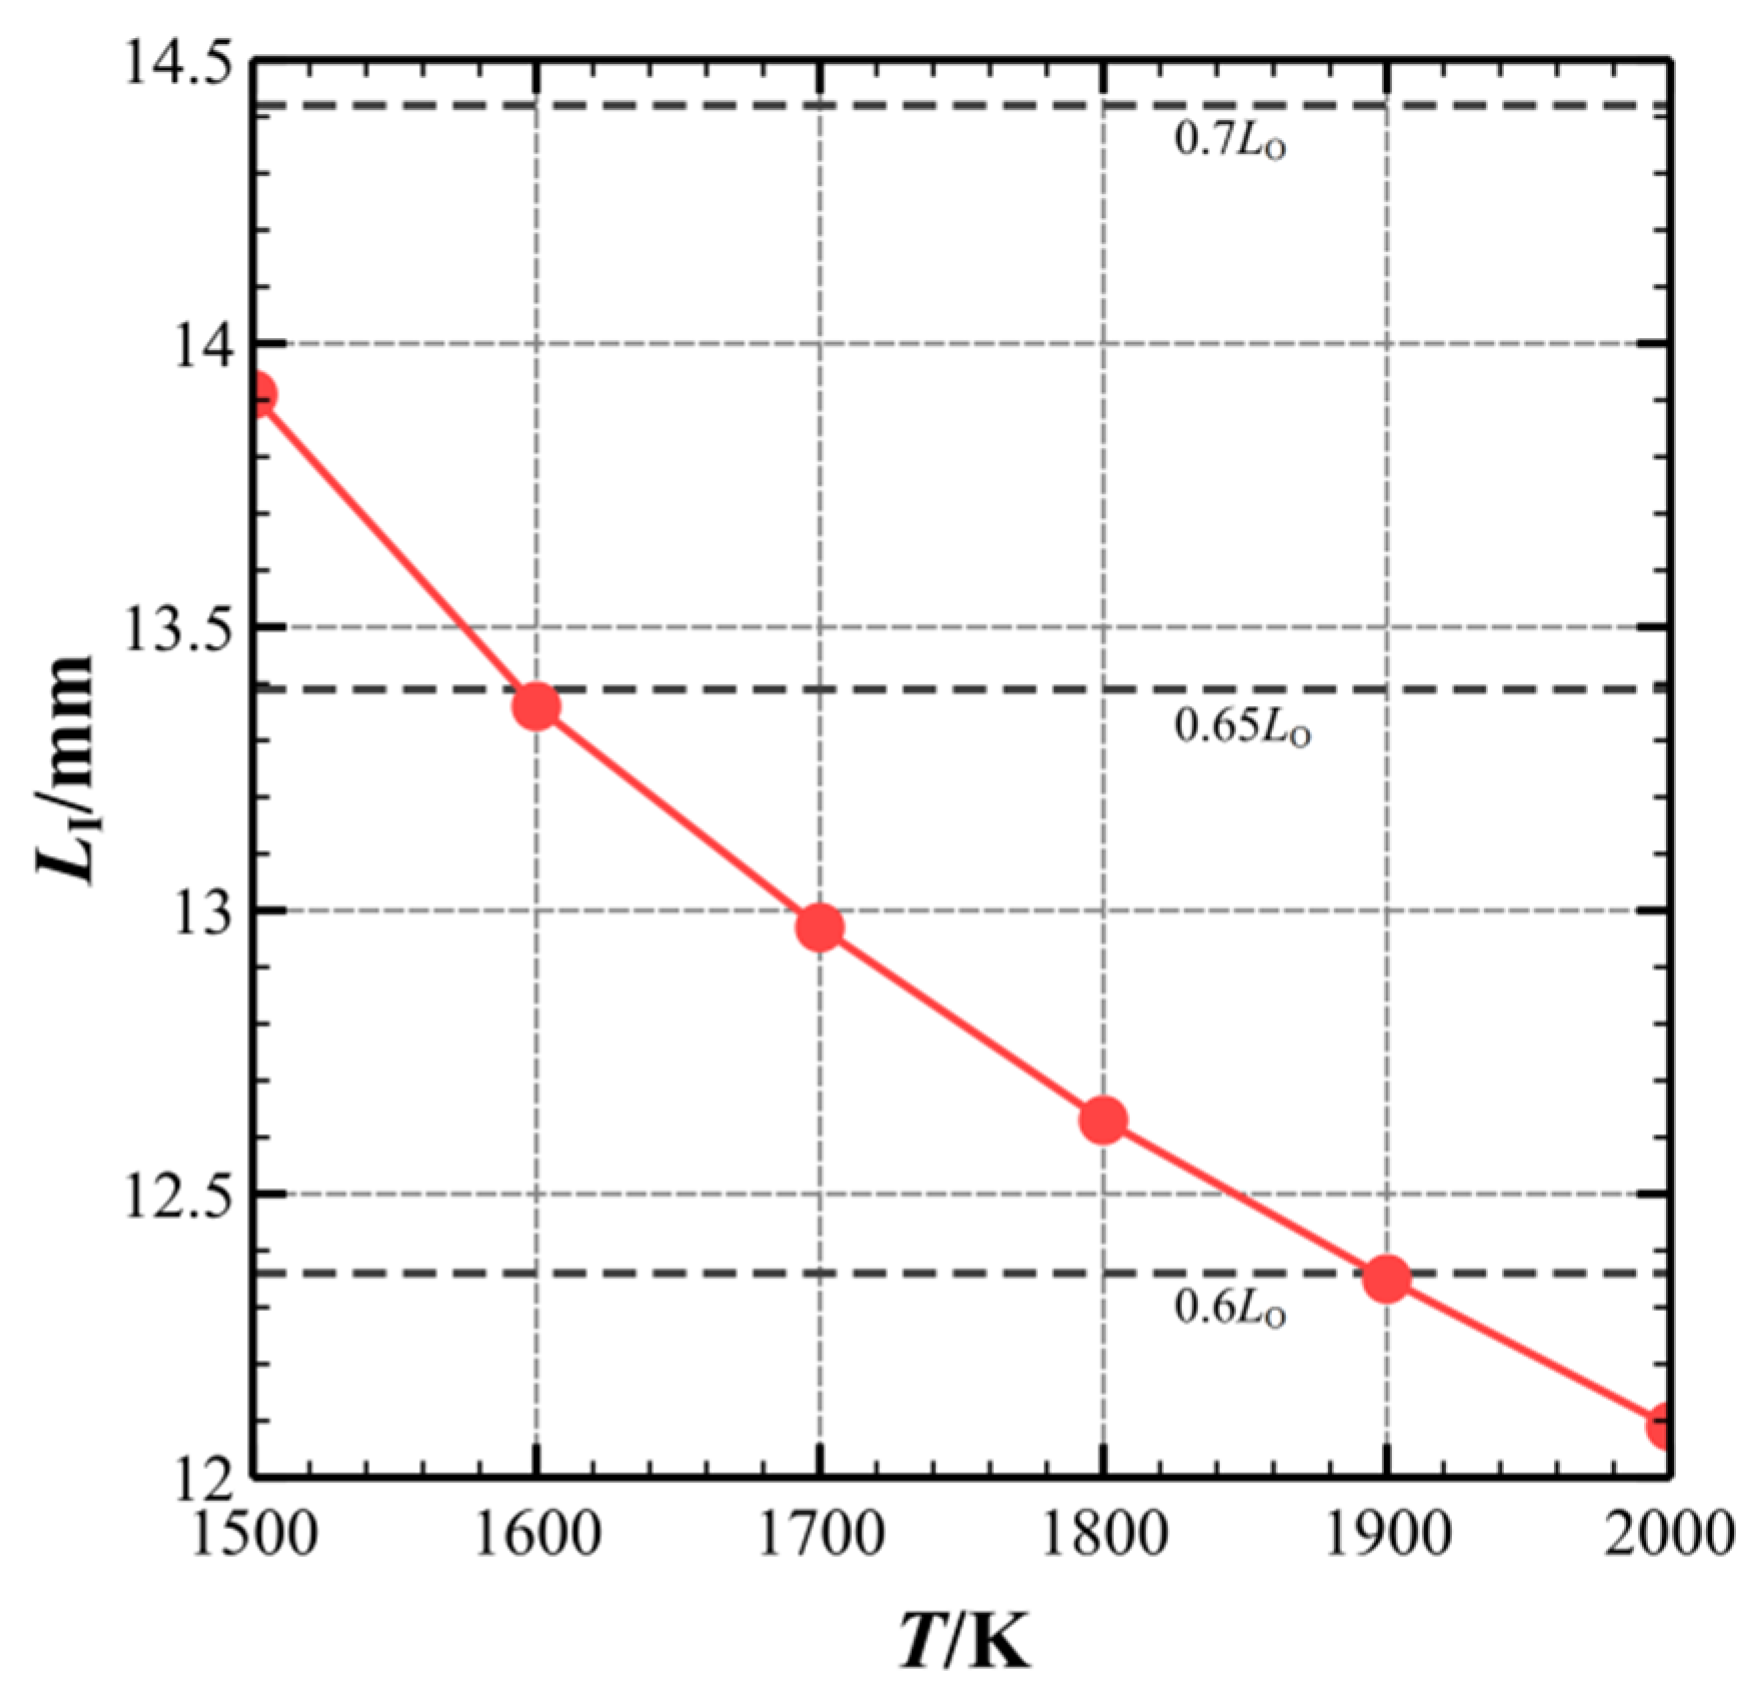
Figure 7 shows the temperature fields of ODWs under the control of a hot-spot at different temperatures for M0 = 7.0, δ = 2 mm, xhot-spot = 5.15 mm. The initiation position of the ODWs with hot-spot control both at 1500 K and 2000 K are closer upstream than the original ODW without a hot-spot. The initiation position of the ODW originally is near x = 20.60 mm, after the hot-spot is added, moving to approximately x = 12.09 mm at T = 2000 K and approximately x = 13.91 mm at T = 1500 K. Obviously, a hot-spot with a higher temperature accelerates the ODW initiation with better effect. Figure 8 demonstrates the temperature and the H2 mass fraction along the line of y = 0.05 mm in the ODW with a hot-spot at different hot-spot temperatures and without a hot-spot. It can be observed that the H2 and air mixture is heated when passing through the hot-spot; this has led to the early initiation of ODW. The higher hot-spot temperature increases the temperature retained after the mixture passes through the hot-spot, and the elementary reactions are sensitive to the temperature, which makes higher hot-spot temperatures more favorable for ODW initiation. Figure 9 shows the characteristic length of the induction zone as a function of the hot-spot temperature, and the Mach number is 7.0, the diameter of the hot-spot is 2.0 mm, and the starting point of the hot-spot is at x = 5.15 mm. The position of the oblique shock-detonation transition LI is almost linear to the hot-spot temperature. As the temperature of the hot-spot increases, the position of the triple wave point moves upstream. In Figure 9, the horizontal dashed line represents the ratio of LI with hot-spot control to the original LI and the LO. It can be observed that the temperature of the hot-spot increases by 500 K. The initiation position of the ODW was moved about 13% upstream, LI decreased from approximately 13.9 mm to about 12.1 mm and the reduced distance was approximately 8.8% of the LO. Therefore, the control of the temperature of the hot-spot may need to be considered in practice.
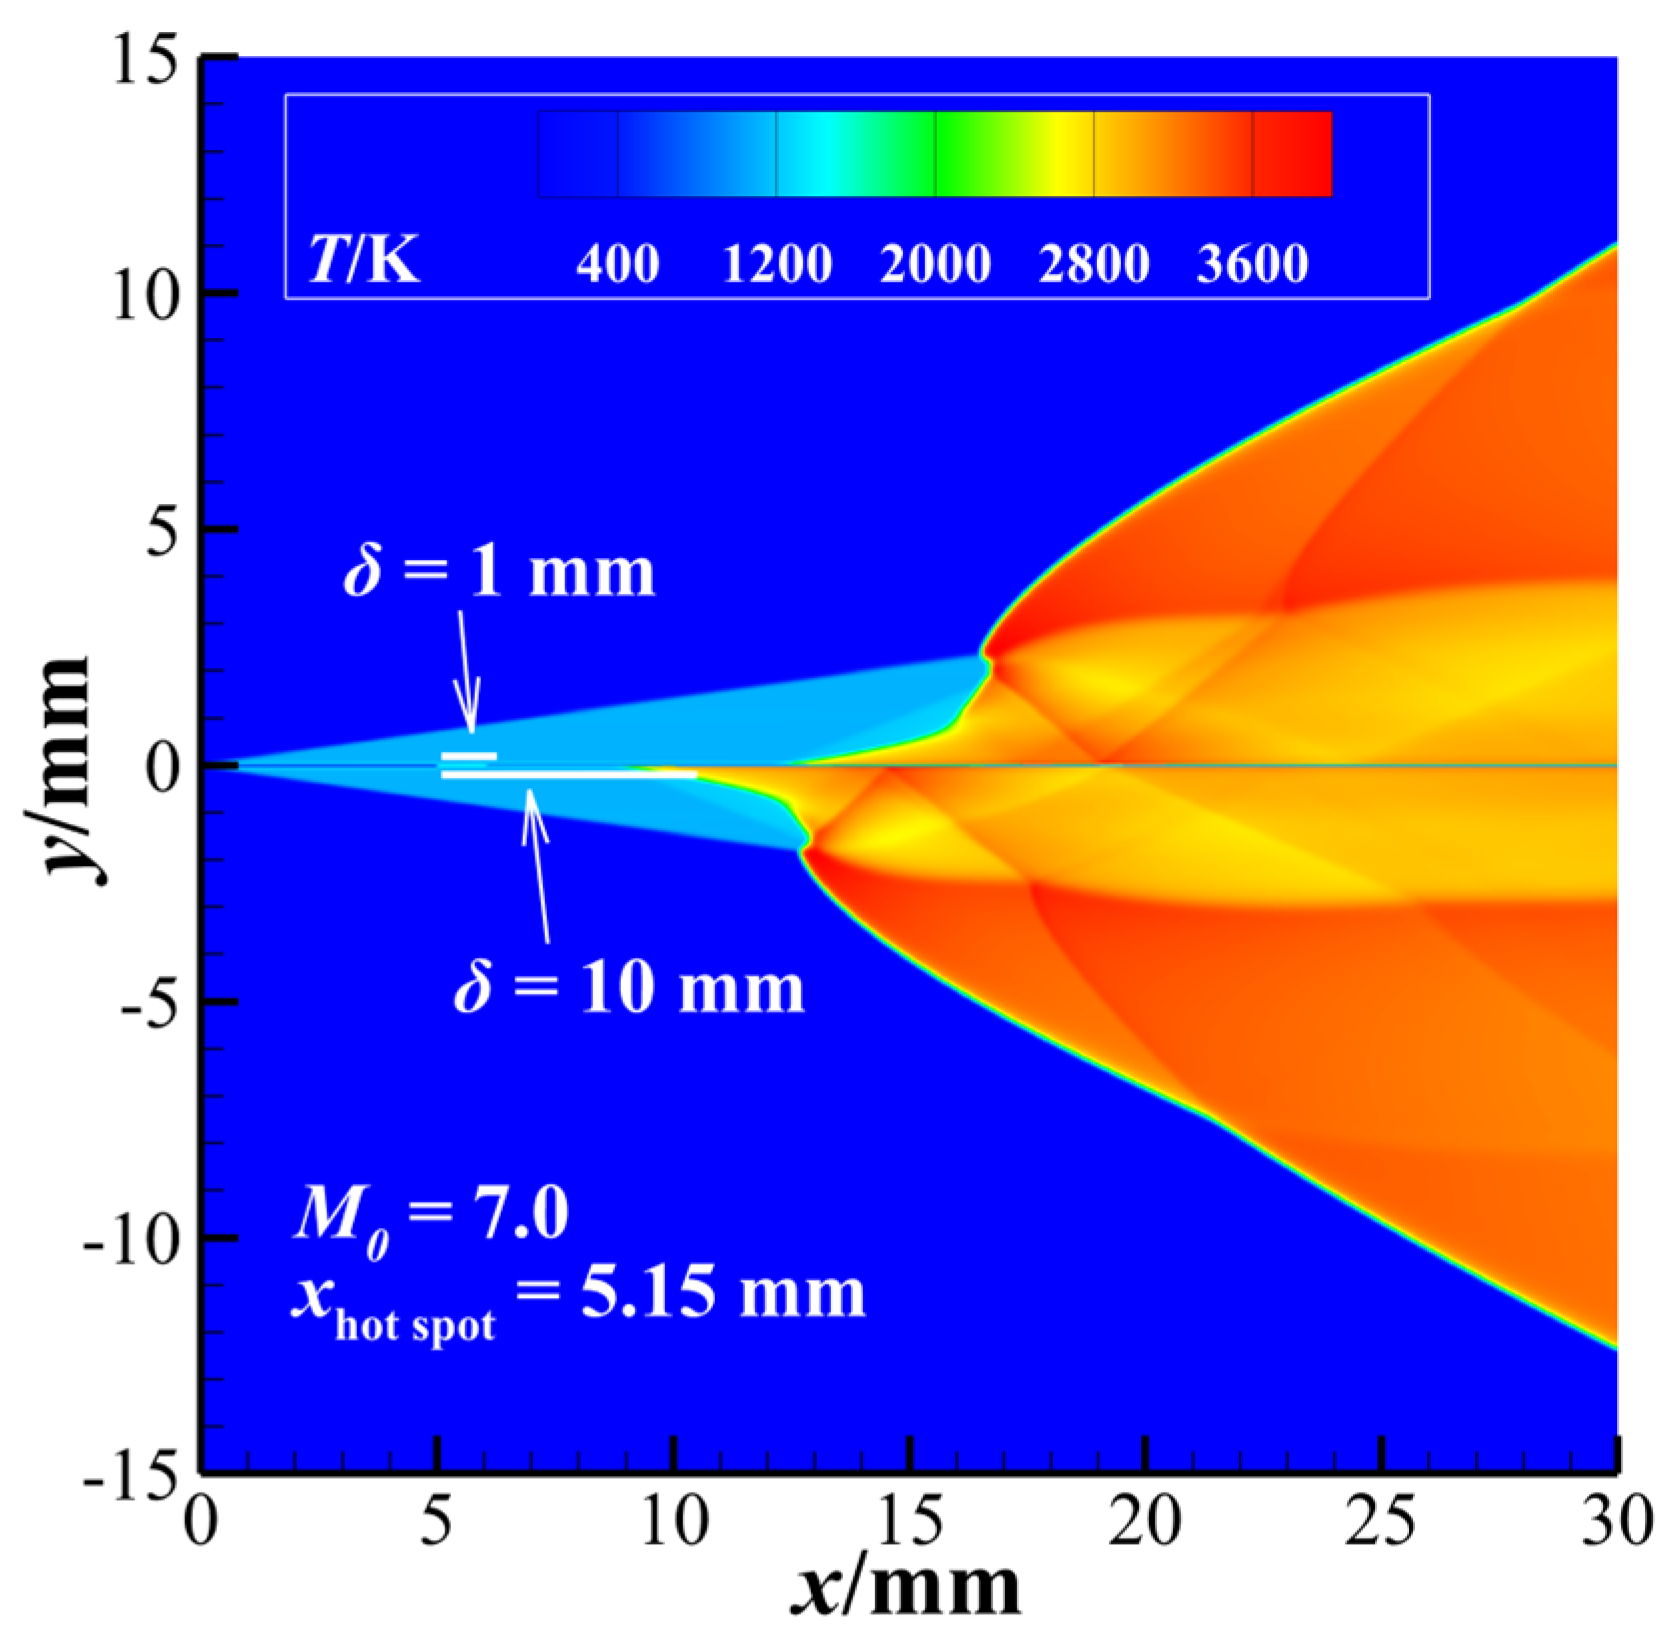
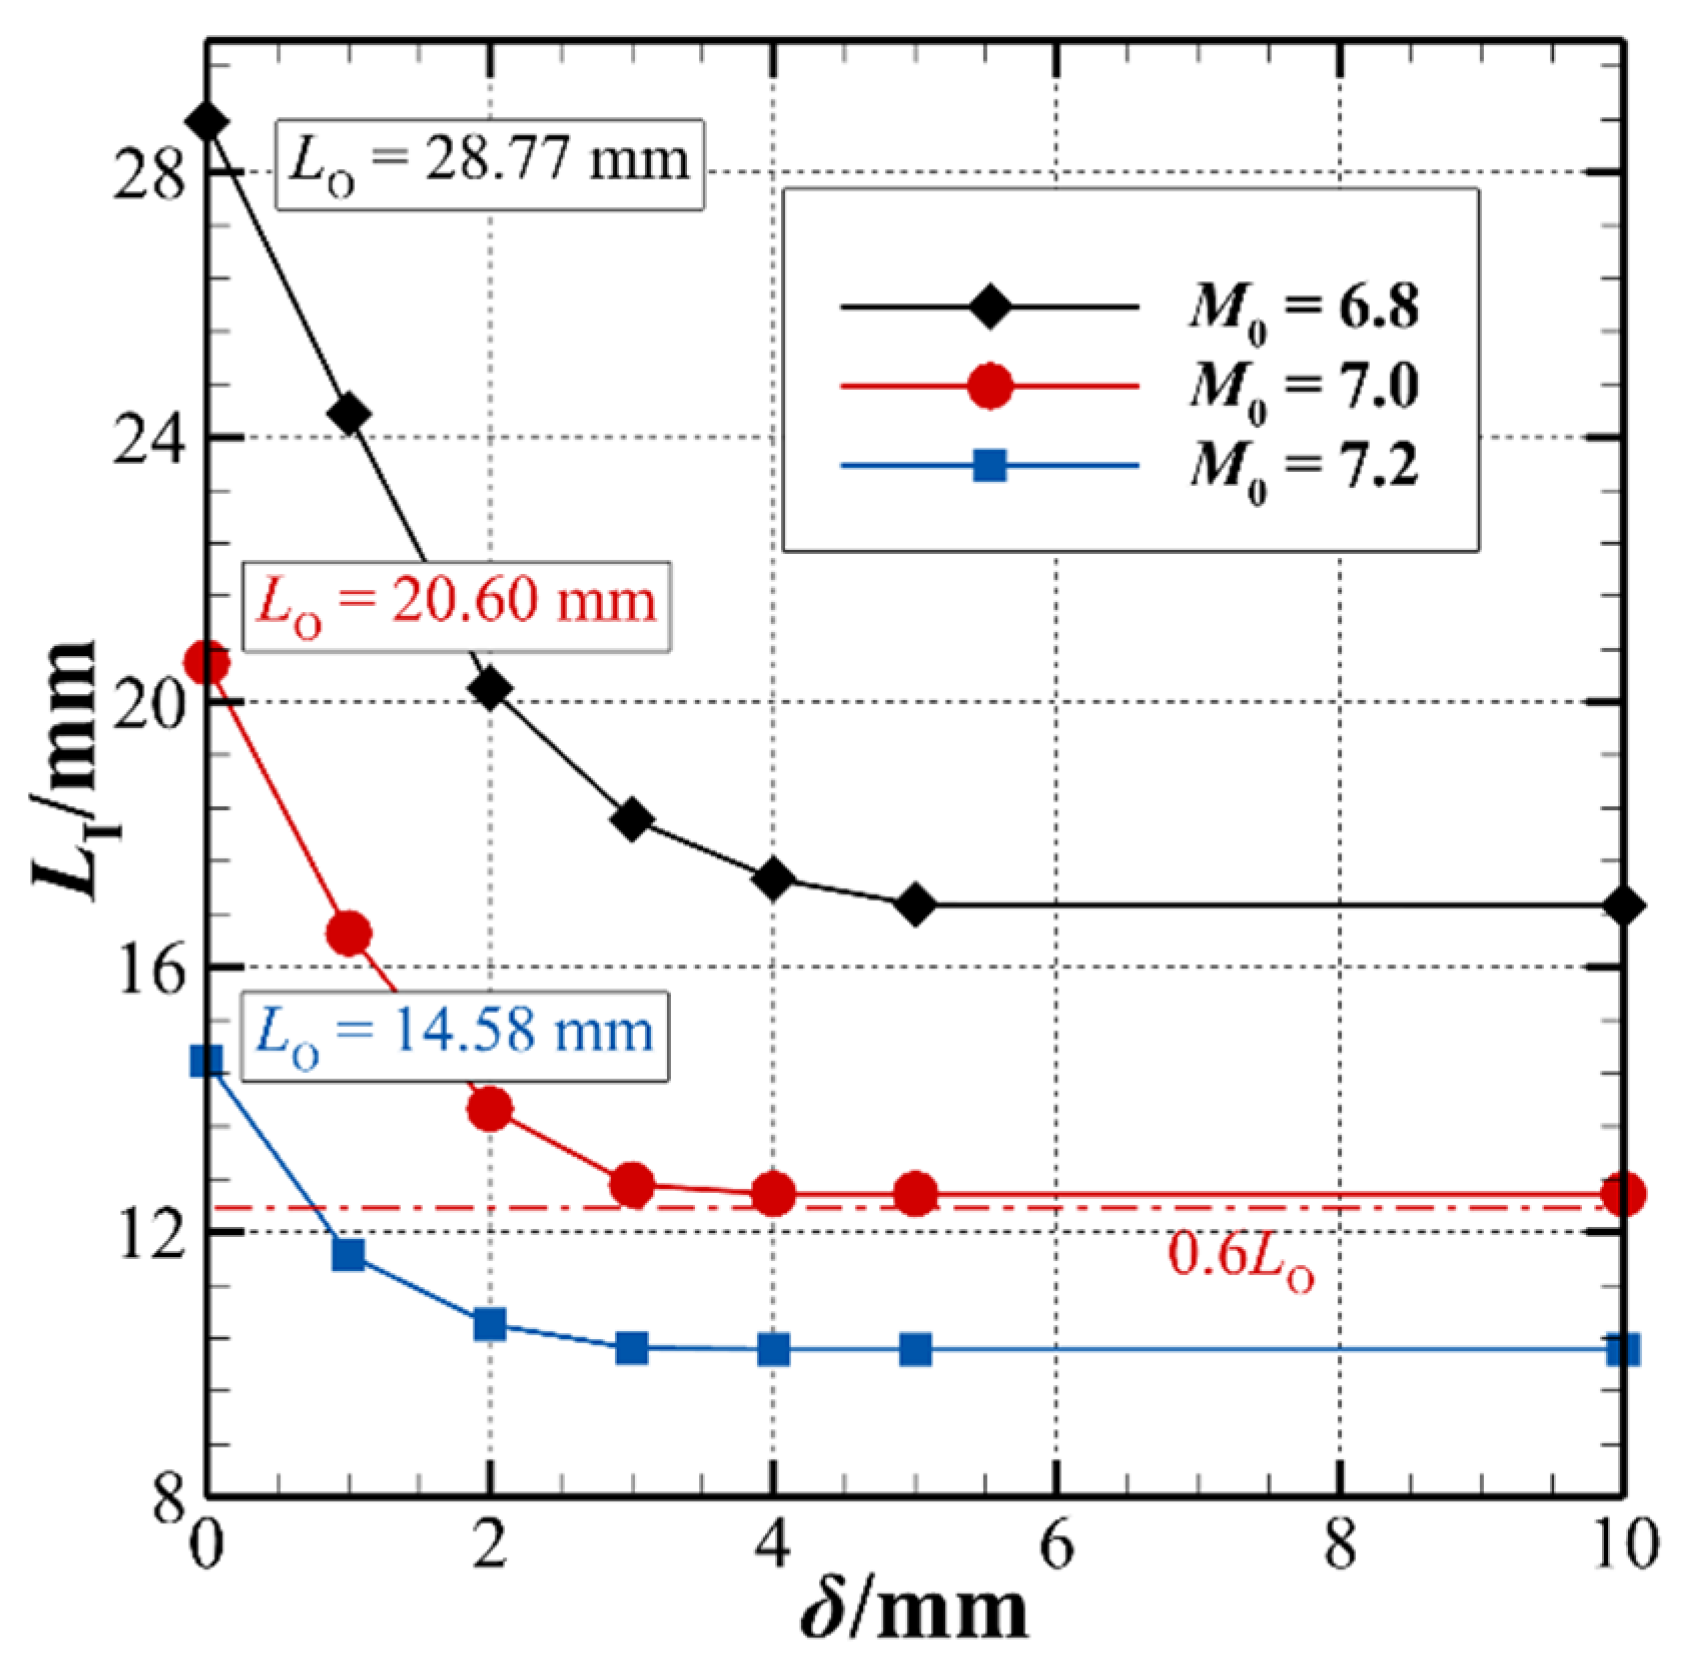
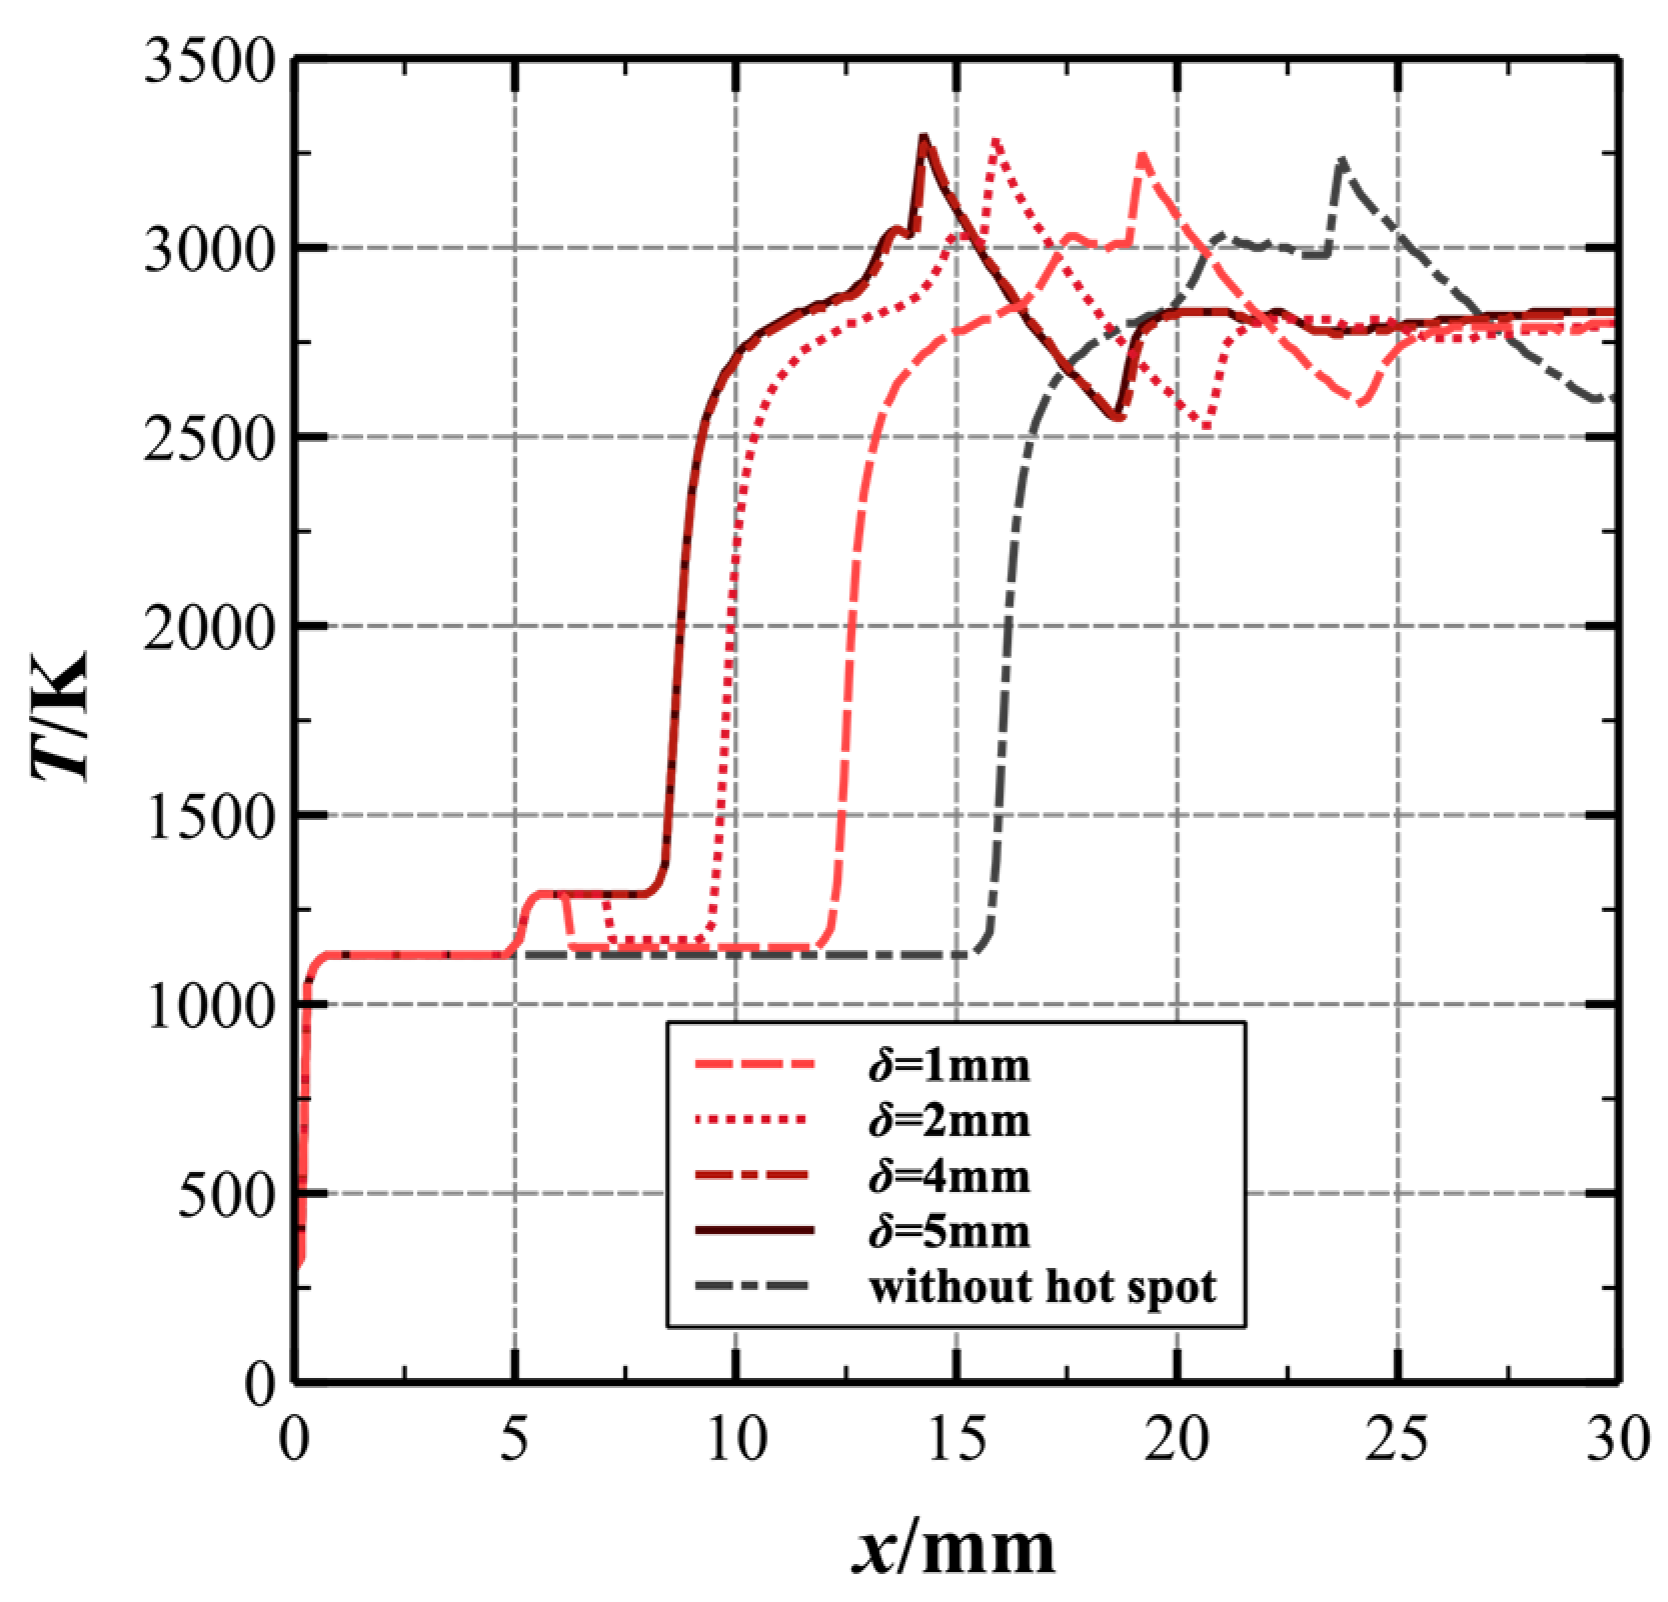
Figure 10 shows the ODW temperature fields controlled by a hot-spot of size δ = 1 mm and δ = 10 mm. Compared with the original ODW without a hot-spot controlled, the position of the triple-wave point moves upstream from near x = 20.60 mm to approximately x = 16.46 mm at δ = 1 mm and approximately x = 12.61 mm at δ = 10 mm. Figure 11 shows the characteristic length of the induction zone as a function of hot-spot size at three Mach numbers; it can be observed that the characteristic length of the induction zone becomes shorter as the hot-spot size increases. It should be noted that there is a maximum hotspot size at different Mach numbers, beyond which the length of the induction zone does not change. At Mach 6.8, the maximum hot-spot size is 5 mm, at Mach 7.0, the change in LI becomes very small after the hot-spot size exceeds 4 mm, and at Mach 7.2, the LI does not change after the hot-spot size is more than 3 mm. From the above results, it can be inferred that the higher the Mach number at the same hot-spot temperature and position, the smaller the maximum hot-spot size so that the length of the sensing region LI does not change. To illustrate this phenomenon, Figure 12 demonstrates the temperature distributing along the line close to the x-axis in the ODW without and with a hot-spot at different δ. Similar to the higher hot-spot temperature, the larger hot-spot size makes the mixture to maintain a higher temperature after passing through the hot-spot. The reaction rate of the elementary reaction is determined by the Arrhenius formula [47], which is sensitive to the temperature, so higher mixture temperatures can make the rapid chemical reactions occur faster. After the size of the hot-spot exceeds 4 mm, the initiation of the chemical reaction occurs within the hot-spot range; thus, the position of the triple-wave points changes little after the hot-spot size exceeds 4 mm, and almost never changes after exceeding 5 mm.
The above results show that for a hot-spot on the wall at the same location, within a certain range, both a higher temperature and a larger area of the hot-spot can make the initiation distance of the ODW shorter. We noticed that at x = 5.15 mm, a hotspot with T = 1900 K, δ = 2 mm (Figure 9) or a hotspot with T = 1500 K, δ = 4 mm (Figure 11) can shorten the initiation distance of the ODW to 60%. The relationship between the hot-spot temperature and the power density of the input can be obtained from Table 2 of Section 2, Q = 11.2T − 3619. Therefore, a 1900 K hotspot needs to input a power density of Q = 17.66 kW/cm2, and a 1500 K hotspot needs to input a power density of Q = 13.18 kW/cm2. Further, it can be found that when the initiation distance of the ODW is shortened to 60%, a 1900 K hotspot needs to input 3.53 kW/cm, while a 1500 K hotspot needs to input 5.27 kW/cm; obviously, the former consumes less energy. Therefore, from the perspective of energy consumption, a small hot-spot at high temperatures is preferable for accelerating ODW initiation than a large hot-spot at low temperatures.
The ODWs with different positions of the hot-spot are shown in Figure 13. The position of the hot-spot is determined by the characteristic length of the induction zone of the original ODW without a hot-spot, being 50%, 25%, and 0% of the original LI, respectively. The temperature fields overlapping with pressure contours clearly shows that these cases are all with abrupt transition [3,51], and there are second ODWs between the deflagration wave and the main ODW. It can be observed that, after adding a hot-spot to the wall, the position of the triple-wave point moves upstream as the hot-spot position moves upstream, and the length of the second ODW becomes shorter in this process. According to Teng’s theory [51], this may be caused by the different intensities of the compression wave. To further illustrate the effect of the position of the hot-spot on the initiation distance, Figure 14 demonstrates the characteristic length of the induction zone as a function of the position of the hot-spot. It can be observed that the characteristic length of the induction zone is sensitive to the position of the hot-spots. As the hot-spot position moves upstream, the characteristic length of the induction zone becomes significantly shorter. If a 2000 K hotspot is at the beginning of the wedge, then the ODW’s initiation distance will be reduced to about 30% of that without hotspot acceleration. In summary, the ODW initiation can be controlled in ODE by adjusting the position of the hot-spot on the wall.

4. Summary and Conclusions

In this paper, the initiation characteristics of an ODW induced by a laser-heating hot-spot are investigated numerically. Two-dimensional multi-component Navier–Stokes equations considering the elementary reactions are solved. The flow field characteristics with and without a hot-spot have been studied and compared. The effects of the hot-spot at the initiation zone and its parameters on the wave structure and initiation characteristic are investigated. The main conclusions are as follows:
  • Laser-heating hot-spots are an effective method to accelerate the initiation of the ODW. They change the initiation mode of the ODW from no ignition to ignition. In the situation of a longer initiation length at a low flight Mach number or high altitude, this approach makes the initiation length shorter, broadening the engine’s working range of flight speed and height.
  • Higher hot-spot temperatures are more conducive to the initiation of oblique detonation. With the start position of xhot-spot = 5.15 mm and the size of δ = 2 mm, the temperature of the hot-spot increases by 500 K, the initiation position of the ODW was moved about 13% upstream, and the characteristic length of the induction zone decreased from approximately 13.9 mm to about 12.1 mm.
  • The larger the size of the hot-spot, the closer the oblique detonation initiation is upstream. There is a maximum hotspot size at different Mach numbers, beyond which the ignition is generated within the hotspot and the length of the induction zone does not change. The higher the Mach number, the smaller the maximum hotspot size. In addition, from the perspective of energy consumption, a small hot-spot at a high temperature is preferable for accelerating ODW initiation than a large hot-spot at a low temperature.
  • The initiation of the oblique detonation is sensitive to the position of the laser-heating hot-spots. The closer the hot-spot is located upstream, the shorter the length of the induction zone of ODW. If a 2000 K hotspot is at the beginning of the wedge, then the ODW’s initiation distance will be reduced to about 30% of that without hotspot acceleration.

Author Contributions

Conceptualization, methodology, G.X. and Q.W.; software, validation, Y.X. and J.S.; formal analysis, investigation, Y.X. and J.S.; resources, G.X.; writing—original draft preparation, Y.X. and J.S.; writing—review and editing, Y.X., J.S. and G.X. All authors have read and agreed to the published version of the manuscript.

Funding

This work is supported by the National Natural Science Foundation of China (12202365), the Guangdong Basic and Applied Basic research Foundation (2022A1515011565, 2023A1515010031), Natural Science Foundation of Chongqing (2022NSCQ-MSX5709), Foundation of State Key Laboratory of High Temperature Gas Dynamics (2021KF10), and the China Postdoctoral Science Foundation funded project (2021M692633, 2022T150534).

Data Availability Statement

The data presented in this paper are available on request from the corresponding author. The data are not publicly available due to privacy restrictions.

Conflicts of Interest

The authors declare no conflict of interest.

References

  1. Wang, K.; Teng, H.; Yang, P.; Ng, H.D. Numerical investigation of flow structures resulting from the interaction between an oblique detonation wave and an upper expansion corner. J. Fluid Mech. 2020, 903, A28. [Google Scholar] [CrossRef]
  2. Kailasanath, K. Review of propulsion applications of detonation waves. AIAA J. 2000, 38, 1698–1708. [Google Scholar] [CrossRef]
  3. Teng, H.H.; Jiang, Z.L. On the transition pattern of the oblique detonation structure. J. Fluid Mech. 2012, 713, 659–669. [Google Scholar] [CrossRef]
  4. Dunlap, R.; Brehm, R.L.; Nicholls, J.A. A preliminary study of the application of steady-state detonative combustion to a reaction engine. J. Jet Propuls. 1958, 28, 451–456. [Google Scholar] [CrossRef]
  5. Pratt, D.T.; Humphrey, J.W.; Glenn, D.E. Morphology of standing oblique detonation waves. J. Propuls. Power 1991, 7, 837–845. [Google Scholar] [CrossRef]
  6. Morrison, R.B. Oblique Detonation Wave Ramjet; NASA-CR-159192; NASA: Hampton, VA, USA, 1980. [Google Scholar]
  7. Zhang, B.; Liu, H.; Yan, B.; Ng, H.D. Experimental study of detonation limits in methane-oxygen mixtures: Determining tube scale and initial pressure effects. Fuel 2020, 259, 116220. [Google Scholar] [CrossRef]
  8. Yang, P.; Teng, H.; Jiang, Z. Effects of inflow Mach number on oblique detonation initiation with a two-step induction-reaction kinetic model. Combust. Flame 2018, 193, 246–256. [Google Scholar] [CrossRef]
  9. Yang, Z.; Zhang, B. Numerical and experimental analysis of detonation induced by shock wave focusing. Combust. Flame 2023, 251, 112691. [Google Scholar] [CrossRef]
  10. Cheng, J.; Zhang, B.; Ng, H.D.; Liu, H.; Wang, F. Effects of inert gas jet on the transition from deflagration to detonation in a stoichiometric methane-oxygen mixture. Fuel 2021, 285, 119237. [Google Scholar] [CrossRef]
  11. Li, C.; Kailasanath, K.; Oran, E.S. Detonation structures behind oblique shocks. Phys. Fluids 1994, 6, 1600–1611. [Google Scholar] [CrossRef]
  12. Li, C.; Kailasanath, K.; Oran, E.S. Effects of boundary layers on oblique-detonation structures. In Proceedings of the 31st Aerospace Sciences Meeting, Reno, NV, USA, 11–14 January 1993. AIAA Paper 1993-0450. [Google Scholar]
  13. Viguier, C.; Silva, L.F.; Desbordes, D.; Deshaies, B. Onset of oblique detonation waves: Comparison between experimental and numerical results for hydrogen-air mixtures. Symp. (Int.) Combust. 1996, 26, 3023–3031. [Google Scholar] [CrossRef]
  14. Desbordes, D.; Hamada, L.; Guerraud, C. Supersonic H2-air combustions behind oblique detonation waves. Shock Waves 1995, 4, 339–345. [Google Scholar] [CrossRef]
  15. Kamel, M.R.; Morris, C.I.; Stouklov, I.G.; Hanson, R.K. PLIF imaging of hypersonic reactive flow around blunt bodies. Symp. (Int.) Combust. 1996, 26, 2909–2915. [Google Scholar] [CrossRef]
  16. Qin, Q.; Zhang, X. Study on the effects of geometry on the initiation characteristics of the oblique detonation wave for hydrogen-air mixture. Int. J. Hydrogen Energy 2019, 44, 17004–17014. [Google Scholar] [CrossRef]
  17. Teng, H.; Zhang, Y.; Yang, P.; Jiang, Z. Oblique detonation wave triggered by a double wedge in hypersonic flow. Chin. J. Aeronaut. 2022, 35, 176–184. [Google Scholar] [CrossRef]
  18. Zhang, Y.; Xiang, G.; Tu, Q.; Wang, Q.; Wei, H. The initiation characteristics of oblique detonation in acetylene-air mixtures in the finite wedge. Acta. Mech. Sin. 2023, 39, 122231. [Google Scholar] [CrossRef]
  19. Zhang, G.; Li, G.; Wang, K. Wave structure of oblique detonation disturbed by an expansion wave from a bended tunnel. Appl. Therm. Eng. 2020, 180, 115856. [Google Scholar] [CrossRef]
  20. Fang, Y.; Hu, Z.; Teng, H. Numerical investigation of oblique detonations induced by a finite wedge in a stoichiometric hydrogen-air mixture. Fuel 2018, 234, 502–507. [Google Scholar] [CrossRef]
  21. Cai, X.; Liang, J.; Deiterding, R.; Mahmoudi, Y.; Sun, M. Experimental and numerical investigations on propagating modes of detonations: Detonation wave/boundary layer interaction. Combust. Flame 2018, 190, 201–215. [Google Scholar] [CrossRef]
  22. Zhang, Y.; Fang, Y.; Ng, H.D.; Teng, H. Numerical investigation on the initiation of oblique detonation waves in stoichiometric acetylene—Oxygen mixtures with high argon dilution. Combust. Flame 2019, 204, 391–396. [Google Scholar] [CrossRef]
  23. Watanabe, H.; Matsuo, A.; Chinnayya, A.; Matsuoka, K.; Kasahara, J. Numerical analysis of the mean structure of gaseous detonation with dilute water spray. J. Fluid Mech. 2020, 887, A4. [Google Scholar] [CrossRef]
  24. Niu, S.; Yang, P.; Wang, K.; Teng, H. Unsteady Oblique Detonation Waves in a Tunnel Induced by Inflow Mach Number Variation. Aerospace 2023, 10, 330. [Google Scholar] [CrossRef]
  25. Fang, Y.; Hu, Z.; Teng, H.; Jiang, Z. Numerical study of the oblique detonation initiation induced by spheres. Chin. J. Theor. Appl. Mech. 2017, 49, 268–273. [Google Scholar]
  26. Han, X.; Zhang, W.; Zhang, Z.; Liu, Y.; Jiang, Z. Numerical Study of Oblique Detonation Waves Induced by a Bump. J. Propuls. Technol. 2022, 43, 200853. [Google Scholar]
  27. Xiang, G.; Zhang, Y.; Zhang, C.; Kou, Y. Study on initiation mechanism of oblique detonation induced by blunt bump on wedge surface. Fuel 2022, 323, 124314. [Google Scholar] [CrossRef]
  28. Cheng, J.; Zhang, B. Characteristics of flame acceleration and deflagration-to-detonation transition enhanced by SF6 jet-in-cross-flow/flame interaction. Aerosp. Sci. Technol. 2023, 140, 108451. [Google Scholar] [CrossRef]
  29. Wang, A.; Bian, J.; Teng, H. Numerical study on initiation of oblique detonation wave by hot jet. Appl. Therm. Eng. 2022, 213, 118679. [Google Scholar] [CrossRef]
  30. Zhang, Y.; Xiang, G.; Gao, X.; Yu, J.; Hu, X.; Xin, Y.; Li, D.; Wang, Q. Study on initiation characteristics of oblique detonation induced by hydrogen jets in acetylene-air mixtures. Fuel 2023, 350, 128787. [Google Scholar]
  31. Daiber, J.W.; Thompson, H.M. Laser Driven Detonation Waves in Gases. Phys. Fluids 1967, 10, 1162. [Google Scholar] [CrossRef]
  32. Steverding, B. Ignition of laser detonation waves. J. Appl. Phys. 1974, 45, 3507. [Google Scholar] [CrossRef]
  33. Zhang, W.; Zhang, Z.; Jiang, Z.; Han, X.; Liu, Y.; Wang, C. Numerical investigation of free oblique detonation wave induced by non-intrusive energy deposition. AIP Adv. 2021, 11, 125119. [Google Scholar] [CrossRef]
  34. Melguizo-Gavilanes, J.; Boeck, L.R.; Mével, R.; Shepherd, J. Hot surface ignition of stoichiometric hydrogen-air mixtures. Int. J. Hydrogen Energy 2017, 42, 7393–7403. [Google Scholar] [CrossRef]
  35. Kumar, R.K. Ignition of hydrogen-oxgen-diluent mixtures adjacent to a hot, nonreactive surface. Combust. Flame 1989, 75, 197–215. [Google Scholar] [CrossRef]
  36. Marengo, S.; Migliavacca, G.; Hugony, F.; Maggioni, A.; Morreale, C. Reactivity of H2/air mixtures over hot metal surfaces. Int. J. Hydrogen Energy 2010, 35, 10018–10023. [Google Scholar] [CrossRef]
  37. Ghermay, Y.; Mantzaras, J.; Bombach, R.; Boulouchos, K. Homogeneous combustion of fuel-lean H2/O2/N2 mixtures over platinum at elevated pressures and preheats. Combust. Flame 2011, 158, 1491–1506. [Google Scholar] [CrossRef]
  38. Jian, X.; Xu, R.; Shao, C.; Li, J. Thermal effect analysis of the interaction between laser and metal material. J. Shenyang Aerosp. Univ. 2014, 31, 33–36. [Google Scholar]
  39. Huang, J.; Shi, W.; Xie, Y.; An, F.; Li, Y. Numerical simulation of transient temperature field under the interaction between laser and metal materials. High Power Laser Part. Beams 2018, 30, 164–168. [Google Scholar]
  40. Xiang, G.; Zhang, Y.; Tu, Q.; Gao, Y.; Huang, X.; Peng, T. The initiation characteristics of oblique detonation waves induced by a curved surface. Aerosp. Sci. Technol. 2022, 128, 107743. [Google Scholar] [CrossRef]
  41. Darif, M.; Semmar, N. Numerical simulation of Si nanosecond laser annealing by COMSOL Multiphysics. In Proceedings of the COMSOL Conference 2008, Hannover, Germany, 4–6 November 2008; pp. 567–571. [Google Scholar]
  42. Hanon, M.M.; Akman, E.; Oztoprak, B.G.; Gunes, M.; Taha, Z.; Hajim, K.; Kacar, E.; Gundogdu, O.; Demir, A. Experimental and theoretical investigation of the drilling of alumina ceramic using Nd: YAG pulsed laser. Opt. Laser Technol. 2012, 44, 913–922. [Google Scholar] [CrossRef]
  43. Pei, X.; Wu, J. Numerical simulation of transient temperature field on metal material induced by pulse laser irradiation. Laser Technol. 2012, 36, 828–831. [Google Scholar]
  44. Sun, C.W. Effect of Laser Irradiation; National Defense Industry Press: Beijing, China, 2002. [Google Scholar]
  45. Rakic, A.D.; Djurisic, A.B.; Elazar, J.M.; Majewski, M.L. Optical properties of metallic films for vertical-cavity optoelectronic devices. Appl. Opt. 1998, 37, 5271–5283. [Google Scholar] [CrossRef]
  46. Genieys, T.; Sentis, M.; Utéza, O. Investigation of ultrashort laser excitation of aluminum and tungsten by reflectivity measurements. Appl. Phys. A 2020, 126, 263. [Google Scholar] [CrossRef]
  47. McBride, B.J.; Gordon, S.; Reno, M.A. Coefficients for Calculating Thermodynamic and Transport Properties of Individual Species; NASA: Hampton, VA, USA, 1993; TM-4513. [Google Scholar]
  48. Wilson, G.J.; MacCormack, R.W. Modeling supersonic combustion using a fully implicit numerical method. AIAA J. 1992, 30, 1008–1015. [Google Scholar] [CrossRef]
  49. Kim, K.H.; Kim, C.; Rho, O.H. Methods for the accurate computations of hypersonic flows: I. AUSMPW+ scheme. J. Comput. Phys. 2021, 174, 38–80. [Google Scholar] [CrossRef]
  50. Zhang, G.; Gao, S.; Xiang, G. Study on initiation mode of oblique detonation induced by a finite wedge. Phys. Fluids 2021, 33, 016102. [Google Scholar] [CrossRef]
  51. Teng, H.; Tian, C.; Zhang, Y.; Zhou, L.; Ng, H.D. Morphology of oblique detonation waves in a stoichiometric hydrogen-air mixture. J. Fluid Mech. 2021, 913, A1. [Google Scholar] [CrossRef]
Figure 1. The (a) ODE schematic and (b) computation domain.
Aerospace 11 00485 g001
Figure 2. Schematic of the laser heating material.
Aerospace 11 00485 g002
Figure 3. Temperature distribution of the tungsten surface after 1 s irradiation by laser with Q0 = 19,000 W/cm2.
Aerospace 11 00485 g003
Figure 4. (a) Pressure contours of ODW and (b) pressure distributed along the line of y = 0 mm and y = 5 mm with three scales for T0 = 300 K, P0 = 101,325.0 Pa, and M0 = 7.
Aerospace 11 00485 g004
Figure 5. (a) Temperature fields of ODWs and (b) mass fraction (H2) and temperature along the line of y = 0.05 mm without and with a hot-spot for M0 = 7.0, T = 2000 K, δ = 2 mm, xhot-spot = 2.06 mm.
Aerospace 11 00485 g005
Figure 6. The position of the oblique shock-detonation transition LI as a function of inflow Mach number with and without a hot-spot.
Aerospace 11 00485 g006
Figure 7. Temperature fields for a hot-spot-controlled ODW for M0 = 7.0, δ = 2 mm, xhot-spot = 5.15 mm and T = 2000 K (upper), T = 1500 K (lower).
Aerospace 11 00485 g007
Figure 8. Temperature and mass fraction of H2 along the line of y = 0.05 mm in the ODW without and with a hot-spot for M0 = 7.0, T = 2000 K, T = 1500 K, δ = 2 mm, and xhot-spot = 5.15 mm.
Aerospace 11 00485 g008
Figure 9. The characteristic length of the induction zone as a function of hot-spot temperature (M0 = 7.0, δ = 2 mm and xhot-spot = 5.15 mm).
Aerospace 11 00485 g009
Figure 10. Temperature fields for a hot-spot-controlled ODW in two sizes of hot-spot (δ = 1 mm and δ = 10 mm) for M0 = 7.0, xhot-spot = 5.15 mm, T = 1500 K.
Aerospace 11 00485 g010
Figure 11. The characteristic length of the induction zone as a function of hot-spot size at three Mach numbers, xhot-spot = 5.15 mm, T = 1500 K.
Aerospace 11 00485 g011
Figure 12. The temperature along the line of y = 0.05 mm in the ODW without and with a hot-spot at different δ, M0 = 7.0, xhot-spot = 5.15 mm, T = 1500 K.
Aerospace 11 00485 g012
Figure 13. Temperature fields overlapped with pressure contours in the cases of M0 = 7.0, T = 2000 K, δ = 2 mm and without hot-spot (a), xhot-spot = 10.30 mm (b), 5.15 mm (c), 0 mm (d).
Aerospace 11 00485 g013
Figure 14. The characteristic length of the induction zone as a function of the position of the hot-spot, M0 = 7.0, T = 2000 K.
Aerospace 11 00485 g014
Table 1. The thermophysical properties of tungsten W.
PropertiesValues
Density (ρ) (g/cm3)19.3
Heat conductivity (k) (W·m−1·K−1)174
Specific heat (c) (J·kg−1·K−1)132
Table 2. Temperature of the hot-spots at the power densities of the different lasers.
Power Density (Q0) (W/cm2)Temperature (T) (K)
10,0001217
16,0001756
19,0002021
Table 3. The LI of the original ODW without a hot-spot and the position of the hot-spot.
M06.87.07.27.47.6
LI (mm)28.7720.6014.589.826.07
xhot-spot (mm)2.882.061.460.980.61
Disclaimer/Publisher’s Note: The statements, opinions and data contained in all publications are solely those of the individual author(s) and contributor(s) and not of MDPI and/or the editor(s). MDPI and/or the editor(s) disclaim responsibility for any injury to people or property resulting from any ideas, methods, instructions or products referred to in the content.