Article

Numerical Study on Rotor–Building Coupled Flow Field and Its Influence on Rotor Aerodynamic Performance under an Atmospheric Boundary Layer

National Key Laboratory of Helicopter Aeromechanics, Nanjing University of Aeronautics and Astronautics, Nanjing 210016, China
*
Author to whom correspondence should be addressed.
Aerospace 2024, 11(7), 521; https://doi.org/10.3390/aerospace11070521
Submission received: 19 March 2024 / Revised: 23 June 2024 / Accepted: 24 June 2024 / Published: 27 June 2024
(This article belongs to the Special Issue Gust Influences on Aerospace)

Abstract

:
In urban settings, buildings create complex turbulent conditions, affecting helicopter flight performance during missions and increasing safety risks during takeoff and landing. A numerical study on rotor–building coupled flow field is carried out to address rotor aerodynamic performance under building interferences in natural atmospheric conditions. A high-fidelity atmospheric boundary layer (ABL) model described by an exponential law is established herein. The solution of the coupled flow field is based on the Reynolds-averaged Navier–Stokes (RANS) equations, with the rotor’s rotation achieved through the overset grid method. Based on the dominant wind features, the building flow field is distributed into four regions, where the updraft along the headwind side impacts the rotor, bringing about a 76% increase in pitching moment. On the lateral side of the building, distorted rotor wake squeezed upward into the rotor disk, leading to severe blade–vortex interaction (BVI). During low-altitude hovering over rooftops, the mixing of building shed vortices with forward flow wakes causes the formation of a circulation region on the rotor’s windward side, resulting in a thrust loss of approximately 7.8%. Meanwhile, the flow environment on the leeward side of the buildings is more stable. Therefore, it is recommended that helicopters adopt a headwind approach during rooftop operations. However, an 11.4% loss in the average hover figure of merit is observed due to consistent thrust losses caused by the recirculation region.

1. Introduction

Helicopters possess the capabilities of vertical flight and hover, which makes them suitable for takeoff and landing on narrow platforms on building rooftops, and they are widely used in urban firefighting, medical rescue, and post-disaster material transport. However, in urban areas, numerous buildings are prone to the formation of complex turbulence, such as vortices and downdrafts [1]. When helicopters carry out missions in urban areas, their flight performance deteriorates significantly due to the influence of building wakes, making the safety issues more pronounced [2].
The flow of outdoor winds around buildings generally falls into the category of low-speed turbulence. Traditional methods in wind engineering research used for capturing large-scale flow characteristics around buildings mainly involve on-site measurements and scaled wind tunnel tests [3,4,5]. Regarding numerical simulations, Agrawal [6] and Tominaga [7,8] have conducted studies on the flow fields around isolated buildings and downstream pollutant dispersion characteristics using the URANS method. Melaku [9], Ding [10], and Liu [11] utilized the LES model to study the primary wind flow features of buildings in urban areas. Due to the higher complexity and computational cost associated with LES, RANS is still widely applied in research and engineering practices [12]. Furthermore, research [13] has analyzed the applicability of turbulence models by comparing wind pressure and velocity distributions to ensure the accuracy of reverse pressure gradient flow calculations.
In the case of mutual interference between helicopters and environmental flow fields, the large-scale motion of the rotor worsens the complexity of the flow. To accurately determine the rotor loads, higher demands are placed on solving the boundary layer flow around the blades. The GARTUER [14,15,16] conducted a series of experiments under the Action Group (HC/AG-22), with a prior focus on the interference between helicopters and obstacles. Some of the noteworthy studies available in the literature include the impact of enclosed area geometry and relative positions on rotor downwash and loads. Based on experimental data, researchers have evaluated various methods, including the free wake method, vortex methods, and grid-based methods. Quinliven [17] analyzed the distribution of rotor downwash in the wake of large building structures using the blade element vortex method (BEV) based on flow superposition. Schmid [18] conducted an analysis of rotor load under obstacle interference, using the UPM method based on potential flow equations. These methods employed symmetric boundaries and did not consider viscous effects. Tan [19] developed a coupled viscous boundary vortex particle method to predict the flow field of rotors near ground obstacles. In addition to that, Polsky [20] and Paul [21] simulated various helicopter hovering and forward flight conditions under obstacle interference using the N-S equations and the virtual disk method, demonstrating complex phenomena arising from flow interactions. By employing the established numerical simulation methods, researchers have analyzed helicopter flight safety issues in urban environments. Giulia [14] noted that significant interference occurs between the rotor and buildings only when the distance is within 3R under free flow conditions. Adam Dziubinski [22] focused on oscillations in helipad static pressure and pedestrian safety.
To replicate the coupled flow field characteristics in real environments, many scholars have emphasized the importance of considering atmospheric effects. Forrest [23] and Watson [24] have introduced steady ABL into dynamic flow field studies of ships. Regis [25] has generated unsteady ABL by using grid systems with different resolutions upstream. However, this method struggles to ensure the similarity of velocity profiles. As of yet, research on rotor–building interference flow fields has mostly focused on the blocking effect of scaled building walls on rotor flow fields or used simple constant velocities as wind input, which subsequently fails to accurately reflect the unsteady disturbances caused by large building turbulence in the real atmospheric environment on helicopter rotor, and systematic studies on the impact of disturbances on rotor performance have not been conducted.
This article establishes a numerical simulation method suitable for analyzing the coupled flow field of rotor–building interactions. An exponential law velocity profile is employed herein to describe a steady ABL. Simulations were conducted on isolated buildings, isolated rotors, and rotor–building coupled flow fields under atmospheric boundary conditions. At the start, the velocity field, vorticity, and turbulent kinetic energy distribution around isolated buildings were analyzed. Key regions threatening rotor safety were identified based on flow disturbance characteristics. Subsequently, transient flow field velocity distributions, coupled vortex structures, and rotor load characteristics during rotor–building interference were studied. Finally, rotor aerodynamic performance at different interference positions was analyzed, and path planning recommendations for landings and takeoffs on the roof of the building are provided.

2. Numerical Methods

2.1. CFD Solver

The simulation of rotor–building coupled flow field was performed utilizing the STAR-CCM+ solver, with the three-dimensional RANS equations employed as the governing equations. The expressions in the inertial coordinate system are represented as follows:
t V W d V + S F F V · n d S = β V R d V
where W represents the conserved variables, F and F V denote the convective flux and viscous flux, R is the source term, and n is the outward normal vector. β is the logical variable for rotor model. V and S are the volume of grid and the area of grid surface. The MUSCL interpolation method with second-order spatial accuracy is employed herein for data reconstruction in the flow field, while the Roe scheme is utilized to compute the convective fluxes on the grid surfaces. The time advancement was carried out using the implicit LU-SGS scheme. In simulating the flow field disturbances caused by urban buildings and rotors, the coupled solution of the flow around large building obstacles and the shear flow on the rotor surfaces was addressed. Subsequent sections will address the accuracy analysis of the Realizable k ε two-layer model [26], the k ω SST model, and the Spalart–Allmaras turbulence model.

2.2. Atmospheric Boundary Layer

The similarity in the characteristics of the incoming flow employed in simulations with natural flow fields is of paramount importance. Within the atmospheric boundary layer, the average wind speed is influenced by surface friction and atmospheric stability, with wind speed increasing with height. The variation in mean wind speed is described by an exponential law, mathematically expressed as follows [27]:
U ¯ ( z ) = U ¯ 0 ( Z Z 0 ) α
where Z 0 represents the standard reference height, generally taken as 10 m; U ¯ 0 represents the mean wind speed at the standard reference height, and the value is selected based on the Beaufort wind scale. Z and U ¯ ( z ) denote any height being considered for study and the mean wind velocity at that height. α is the surface roughness index, and this value is often predetermined depending on the nature of the landscape (trees, urban environment, etc.) [25].
In turbulent wind fields, random vortex structures and energy dissipation occur. To characterize the intensity of turbulent motion and the conversion process of turbulent energy, the turbulence kinetic energy and the turbulence dissipation rate of the incoming flow are specified. The turbulence kinetic energy k is defined as follows:
k = 1.5 U I 2
Here, I denotes the turbulence intensity, with values as follows:
I = I 0 0.1 Z Z C β 0.1 , Z Z b Z b < Z < Z C Z C < Z
For the wind field around tall buildings, the values are as follows: I 0 = 0.31 , β = 0.5 , Z b = 5   m , Z C = 450   m .
The turbulence dissipation rate ε is defined as follows:
ε = 0.09 0.75 k 1.5 l
Here, l represents the turbulent scale:
l = Z 30 0.5
The atmospheric boundary layer (ABL) is utilized as the inflow at the velocity inlet boundary, whereas a pressure outlet is applied at the outflow boundary. Symmetry conditions are imposed on the top and sides of the computational domain, and the surfaces of buildings and the ground are modeled as no-slip walls.

2.3. Physical Model and Mesh

A full-scale building model ( L 0 × W 0 × H 0 ) was established with dimensions of 30.48 m (length), 45.72 m (width), and 91.44 m (height). The size of the domain affects the solution time and the accuracy of the results [28,29]. Here, the size of the domain was 1400 m (x) × 1000 m (y) × 300 m (z), where x, y, and z represent the streamwise, crosswind, and vertical directions, respectively. The surrounding terrain conditions were characterized as D-type (which refers to urban areas with dense buildings in Chinese standard [30], and its value was set as α = 0.3 ). A model rotor based on the SA365N helicopter [31] was developed, featuring a 4-blade configuration with a diameter of 11.93 m, blade chord length of 0.385 m, linear twist of −10°, and a sweep distribution from 0.98R to the blade tip. Further details on the parameters are provided in Table 1.
Utilizing the overset grid method, the large-scale rotational motion of the rotor is achieved, employing a grid system comprising four C-H-type blade grids and one background grid. The blade grids are structured with a grid point count of 131 × 90 × 170 (corresponding to the streamwise, normal, and spanwise directions, respectively). The height of the first grid layer near the blade surface is set to 5   ×   10 5 c ( c being the blade’s chord length) to capture the flow characteristics near the blade tip, and the region from 0.8 R ( R being the blade’s radius) to the blade tip is refined to an approximate value of 0.02 c . Within the background domain, the finest grid scale for capturing the rotor wake is 0.1 c , and it gradually transitions to the outer zone. The grid system configuration is illustrated in Figure 1.
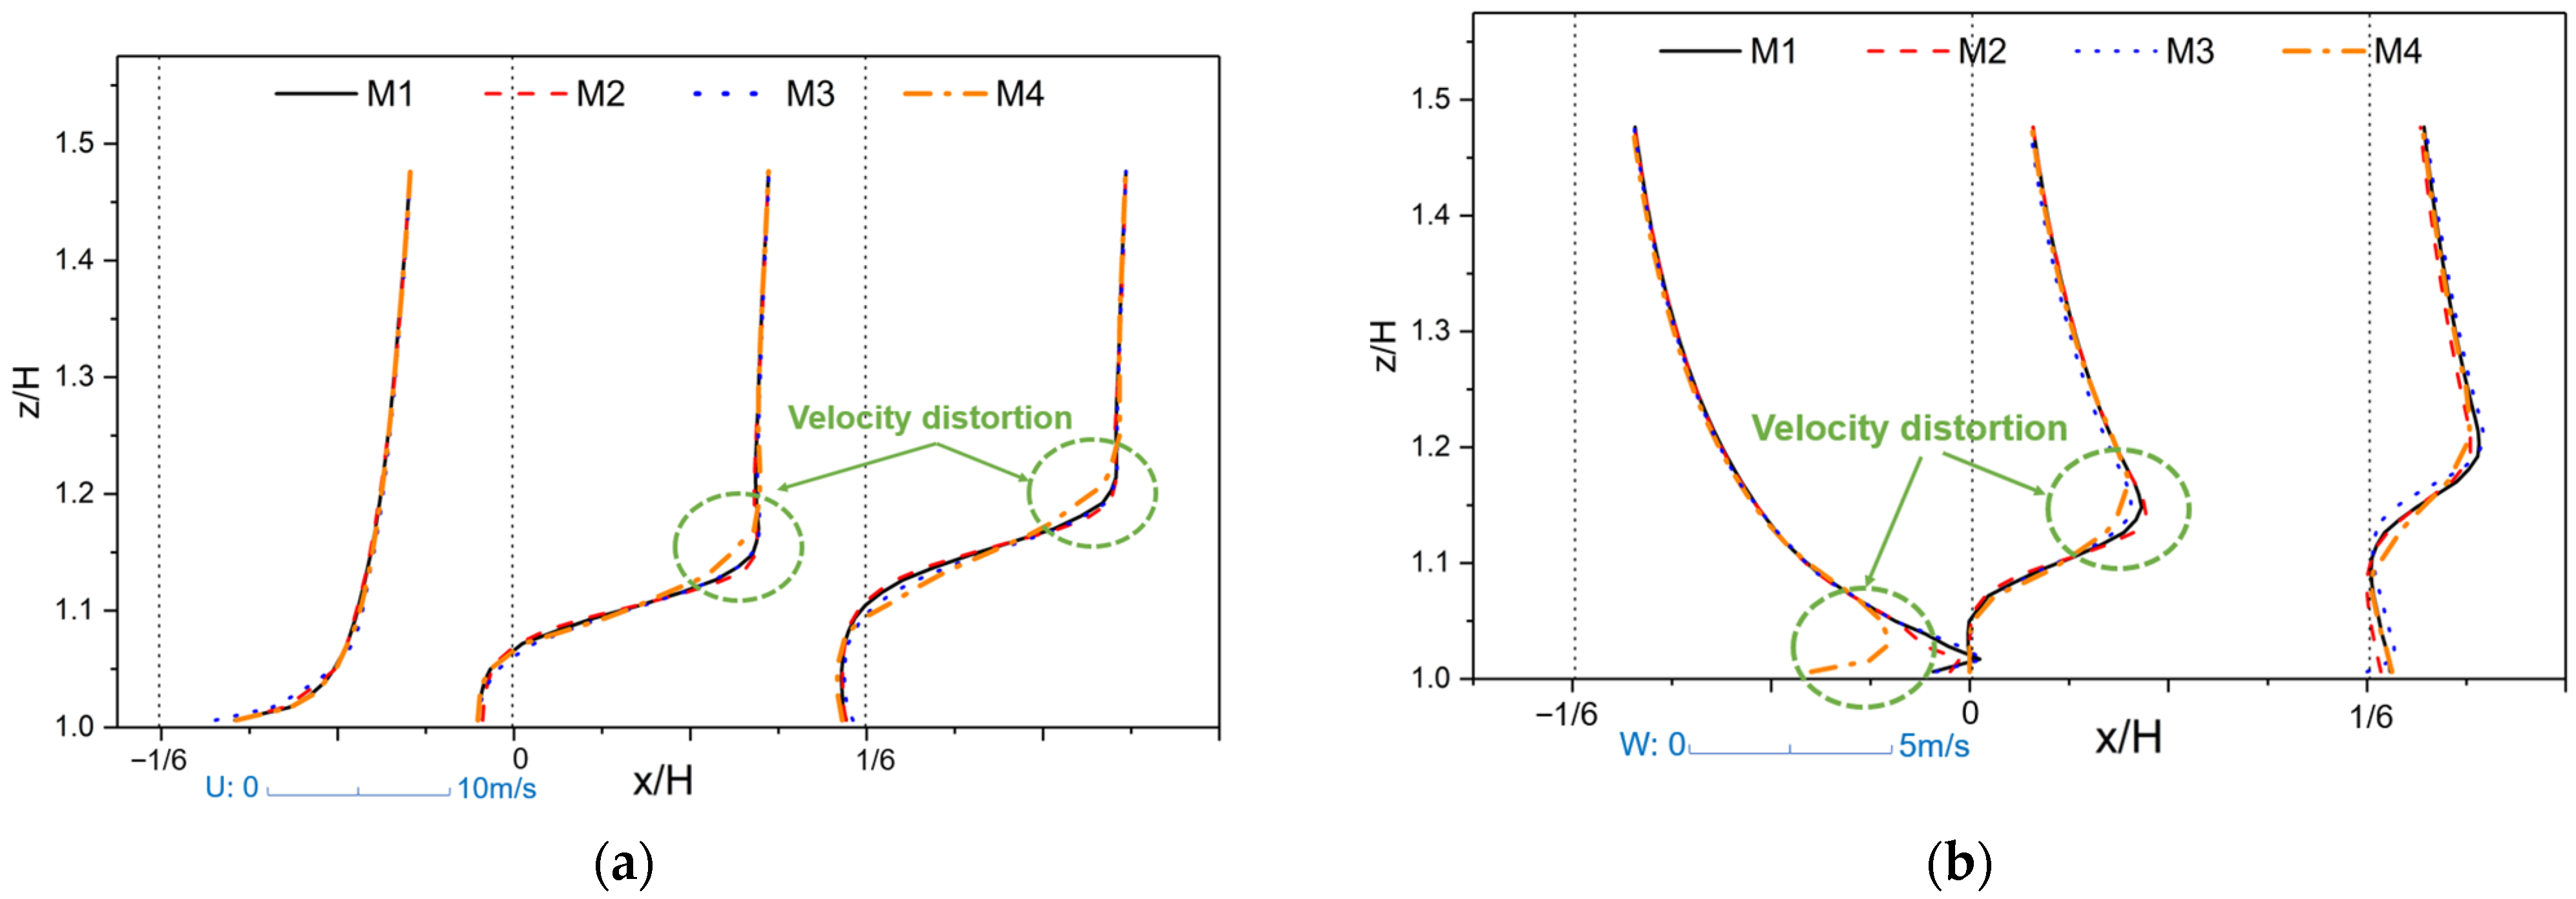
In the building wake, complex flow separation and reattachment phenomena appear. To accurately capture the wind field characteristics in the vicinity of the building wake and rotor coupling region, the grid scale of the building surface and wake region is discussed. Taking the building height H 0 as the base value, the building surface grid scale was defined as Δ x 1 , while the grid scale in the wake region of the building was Δ x 2 . Four sets of grid sizes were established: M1: Δ x 1 = 0.005 H 0 , Δ x 2 = 0.02 H 0 ; M2: Δ x 1 = 0.0025 H 0 , Δ x 2 = 0.015 H 0 ; M3: Δ x 1 = 0.02 H 0 , Δ x 2 = 0.02 H 0 ; M4: Δ x 1 = 0.005 H 0 , Δ x 2 = 0.04 H 0 . The building is surrounded by 8 layers of orthogonal prismatic cells with a growth rate of 1.2 and a total thickness of 0.5 m, where the first layer of the grid has a height of approximately 0.02 m. Figure 2 shows the velocity distribution on the roof of the building under different grid systems. The cases of M1 and M2 exhibit similar wind field characteristics, demonstrating good grid independence characteristics. M3 shows that the grid scale of the building surface has less influence on the spatial velocity distribution, and for the case of M4, strong recirculation of the flow is observed in the wake region, resulting in a distortion in wind velocity captured. Meanwhile, the grid was configured according to the M1 parameters for the simulation of the building/rotor coupled flow field.
To ensure the complete development of the building’s wind field, the flow field was initialized using the steady RANS method. The iteration step was set to 1000, with a residual of less than 10 e 5 . Once the velocity distribution of the flow field stabilizes, the unsteady RANS method is employed to perform the rotor–building coupled flow field calculations. The accuracy of the steady and unsteady RANS methods will be analyzed in the following validation section. For the unsteady computational requirements of the rotor, the physical time step was the time taken for each 1-degree rotation of the blade, and the number of sub-iterations within each timestep was 5. The unsteady solution time was 13 revolutions, corresponding to approximately 2.3 s. During the discussion of the results, the final transient flow field is shown and the rotor load data for the last revolution is used.

3. Validation

In the absence of experimental data for the coupled rotor–building flow field, validation was conducted using cases of flow around an isolated building and rotor–obstacle interference experiments. The computational results are compared with the corresponding experimental values for validation purposes.

3.1. Validation of Building Flow Field

The Architectural Institute of Japan [32] carried out a high-rise building model flow field measurement test with a cubical building model with dimensions of 80 mm × 80 mm × 160 mm. The wind tunnel entrance had a uniform inflow velocity of 6.75 m/s, resulting in a Reynolds number of 2.4 × 10 4 . The spikes and roughness elements were placed upstream to simulate atmospheric turbulence. Following the exponent law atmospheric boundary layer, the average wind profile generated by turbulent winds was characterized by U ¯ 0 = 7.5   m / s , Z 0 = 1   m , α = 0.239 . The geometry was made non-dimensional by utilizing the reference length b = 80   mm . Figure 3 illustrates the wind velocity distribution. The established simulation method can capture the spatial distribution of the flow around the building, and both the steady and unsteady RANS methods effectively reflect the velocity distribution within 3-times the height of the building, which guarantees the feasibility of first initializing the flow field through the steady RANS in the following coupled flow field calculation. Figure 4 compares the results of different turbulence models depicting the S-A model to overestimate the turbulent kinetic energy at separation points, leading to an increase in wind velocity in the wake recirculation region and an underestimation of far-field wake velocities. Meanwhile, the k w SST and Realizable k ε models exhibit good agreement with experimental values. Therefore, the Realizable k ε two-layer model is employed herein for calculations in the subsequent sections.

3.2. Validation in Rotor–Obstacle Interference Flow Field

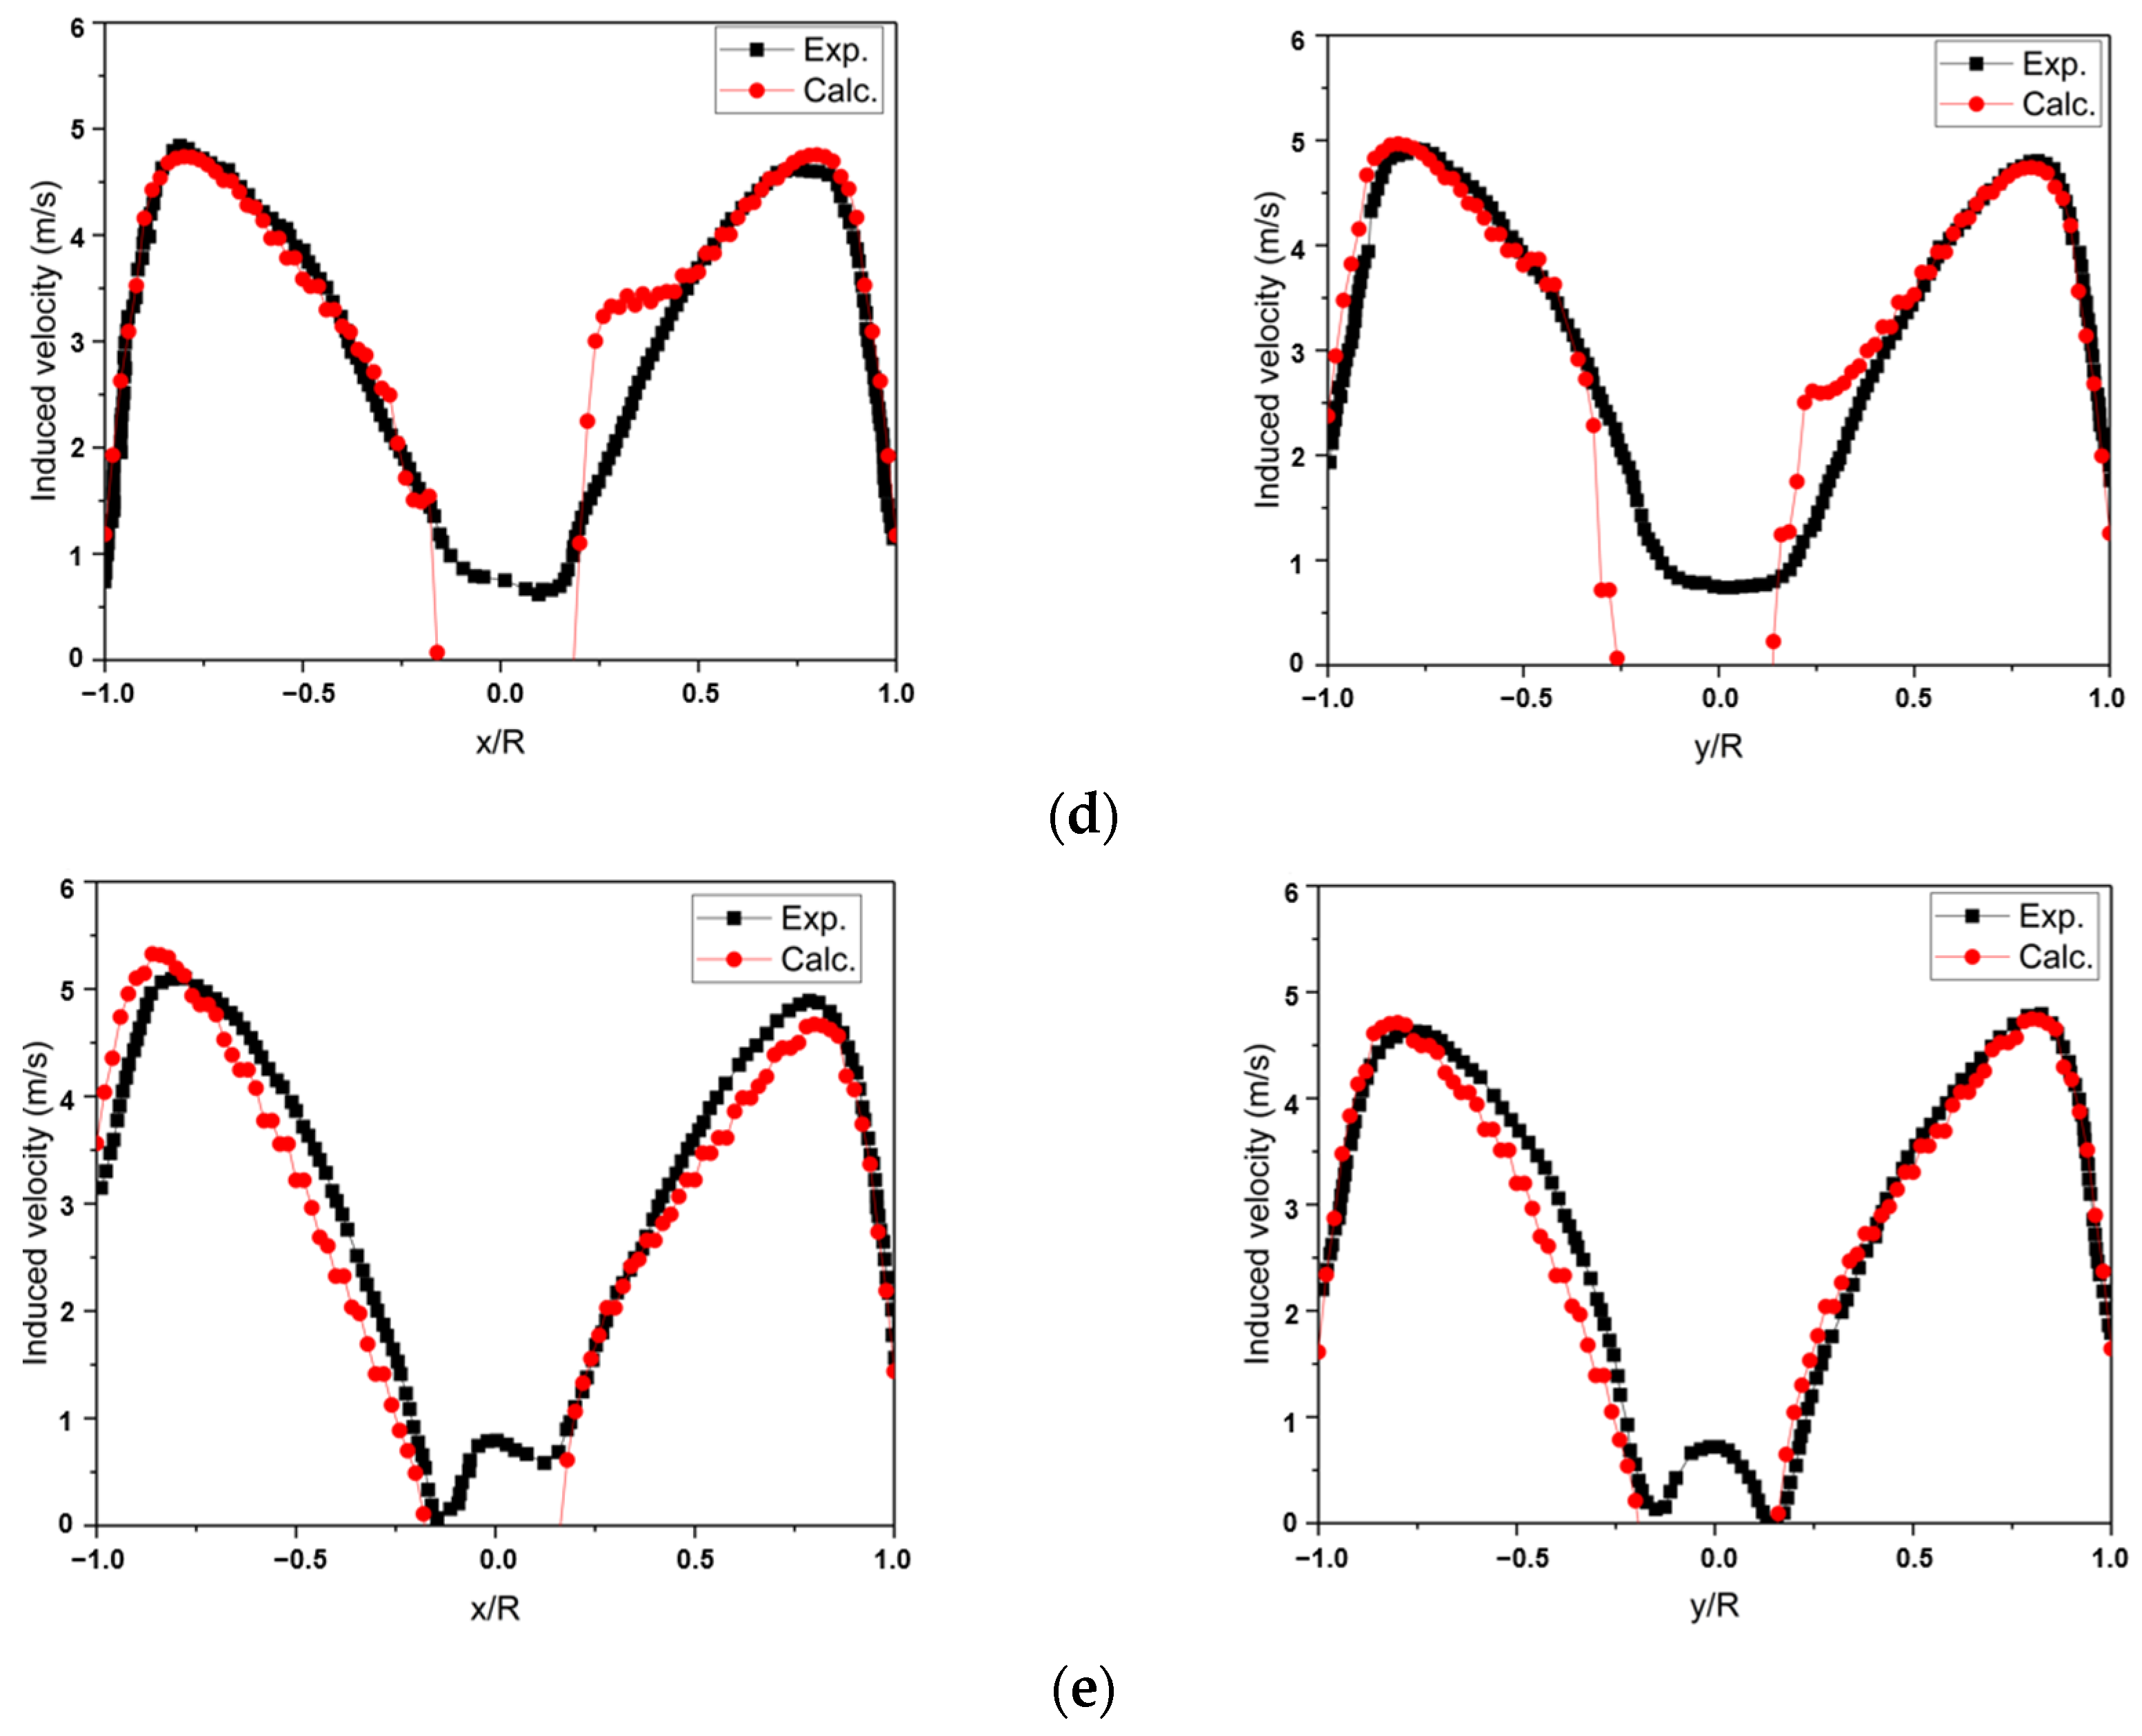
Validation of rotor–obstacle interference case [33] was carried out, utilizing a model rotor with a radius of 0.5 m and chord length of 0.053 m, with four rectangular blades with zero twist and NACA0012 airfoil cross-section. The blades were fixed at a collective angle of 8°, rotating at a velocity of 1200 RPM. The obstacle was a cube with dimensions of 1.0 m in length, width, and height. Figure 5 illustrates the geometric model and the results of the flow field, with the induced velocity probe line positioned 4 cm above the rotor. Hub effects were neglected during the present simulations, resulting in significant discrepancies between calculated and experimental values within 0.2R from the hub. However, at other spanwise locations, the obtained results produced a good agreement with the available experimental data, accurately reflecting the variations in inflow velocity due to the presence of the obstacle. Therefore, the established numerical simulation method proves to be suitable for flow field calculations under rotor–obstacle interference conditions.

4. Results

The investigation of the interference characteristics of rotor–building coupled flow field under atmospheric boundary conditions was carried out step-wise in the present study. At first, the analysis was conducted for the key parameters and characteristics to study the flow field disturbance generated around an isolated building, followed by a study of transient flow around different locations, vortex structure characteristics, and time-averaged load characteristics of the rotor in various key regions.

4.1. Isolated Building Flow Field

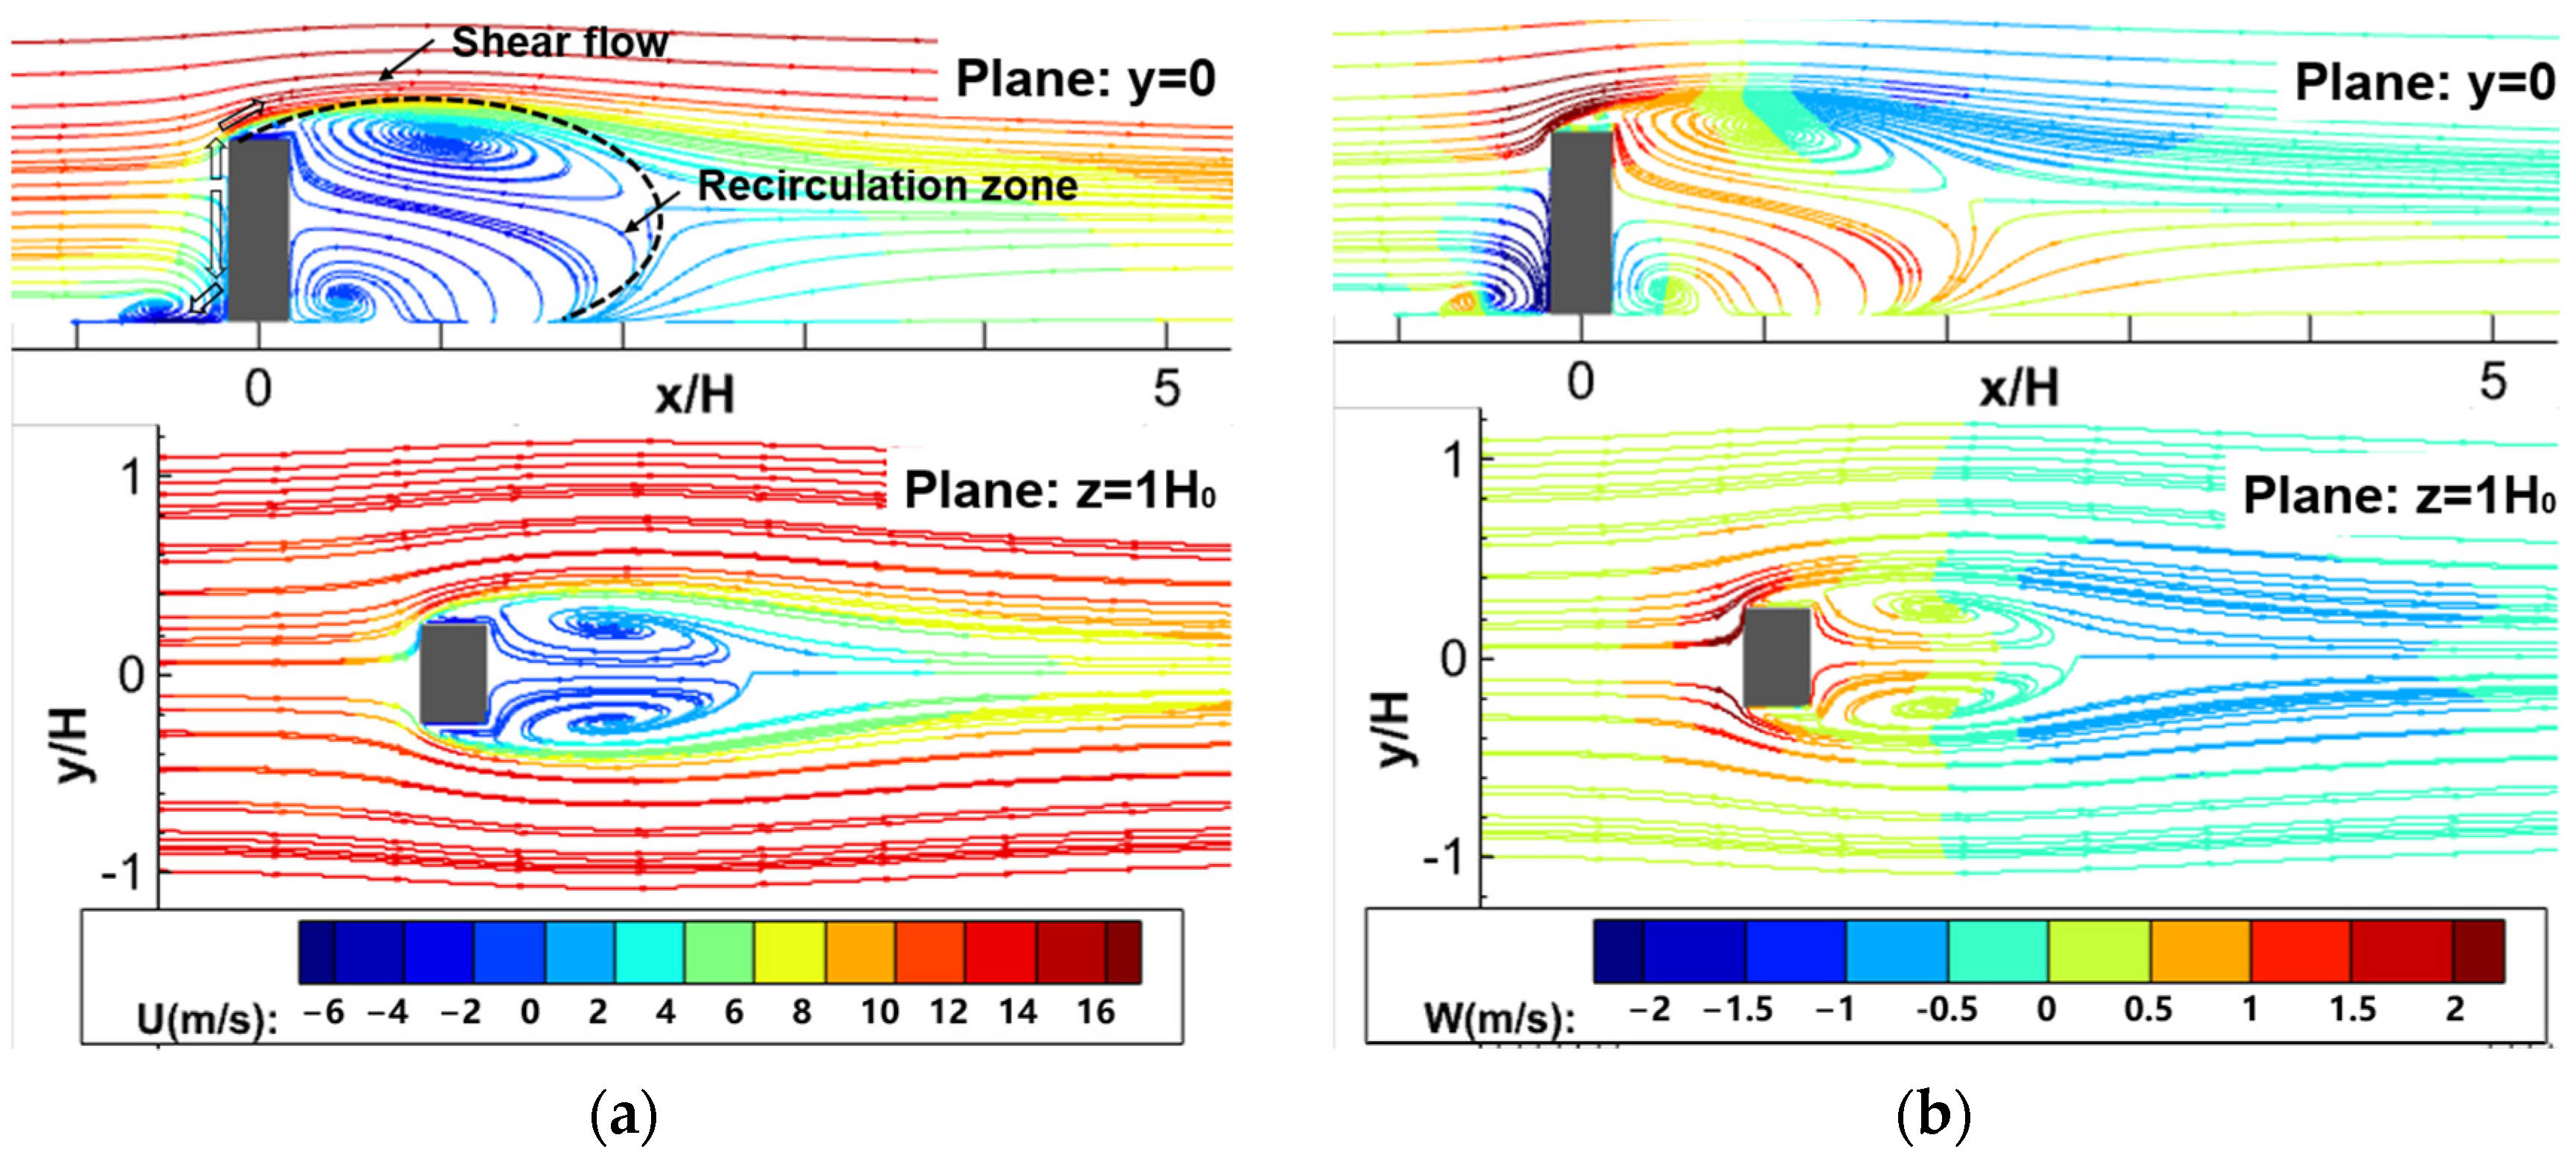
The flow field structure around an isolated building was studied by using the numerical model established above. The velocity at the reference height was U ¯ 0 = 6.5   m / s , and the wind direction angle was 0 degree. Figure 6 depicts the streamlines on the planes y = 0 and z = 1 H 0 . It is noteworthy that a stratification phenomenon generated by the atmospheric boundary layer is clearly visible in the far upstream region of the building. Approximately 2 / 3 H 0 above the headwind face of the building, a stagnation point is observed, from which the airflow radially diffuses outward. Below this point, the airflow descends along the wall towards the ground, creating a counter-flowing pattern. Another portion ascends and passes over the roof, leading to flow separation and the formation of a shear layer, generating a recirculation zone at the upper part of the roof and the leeward face.
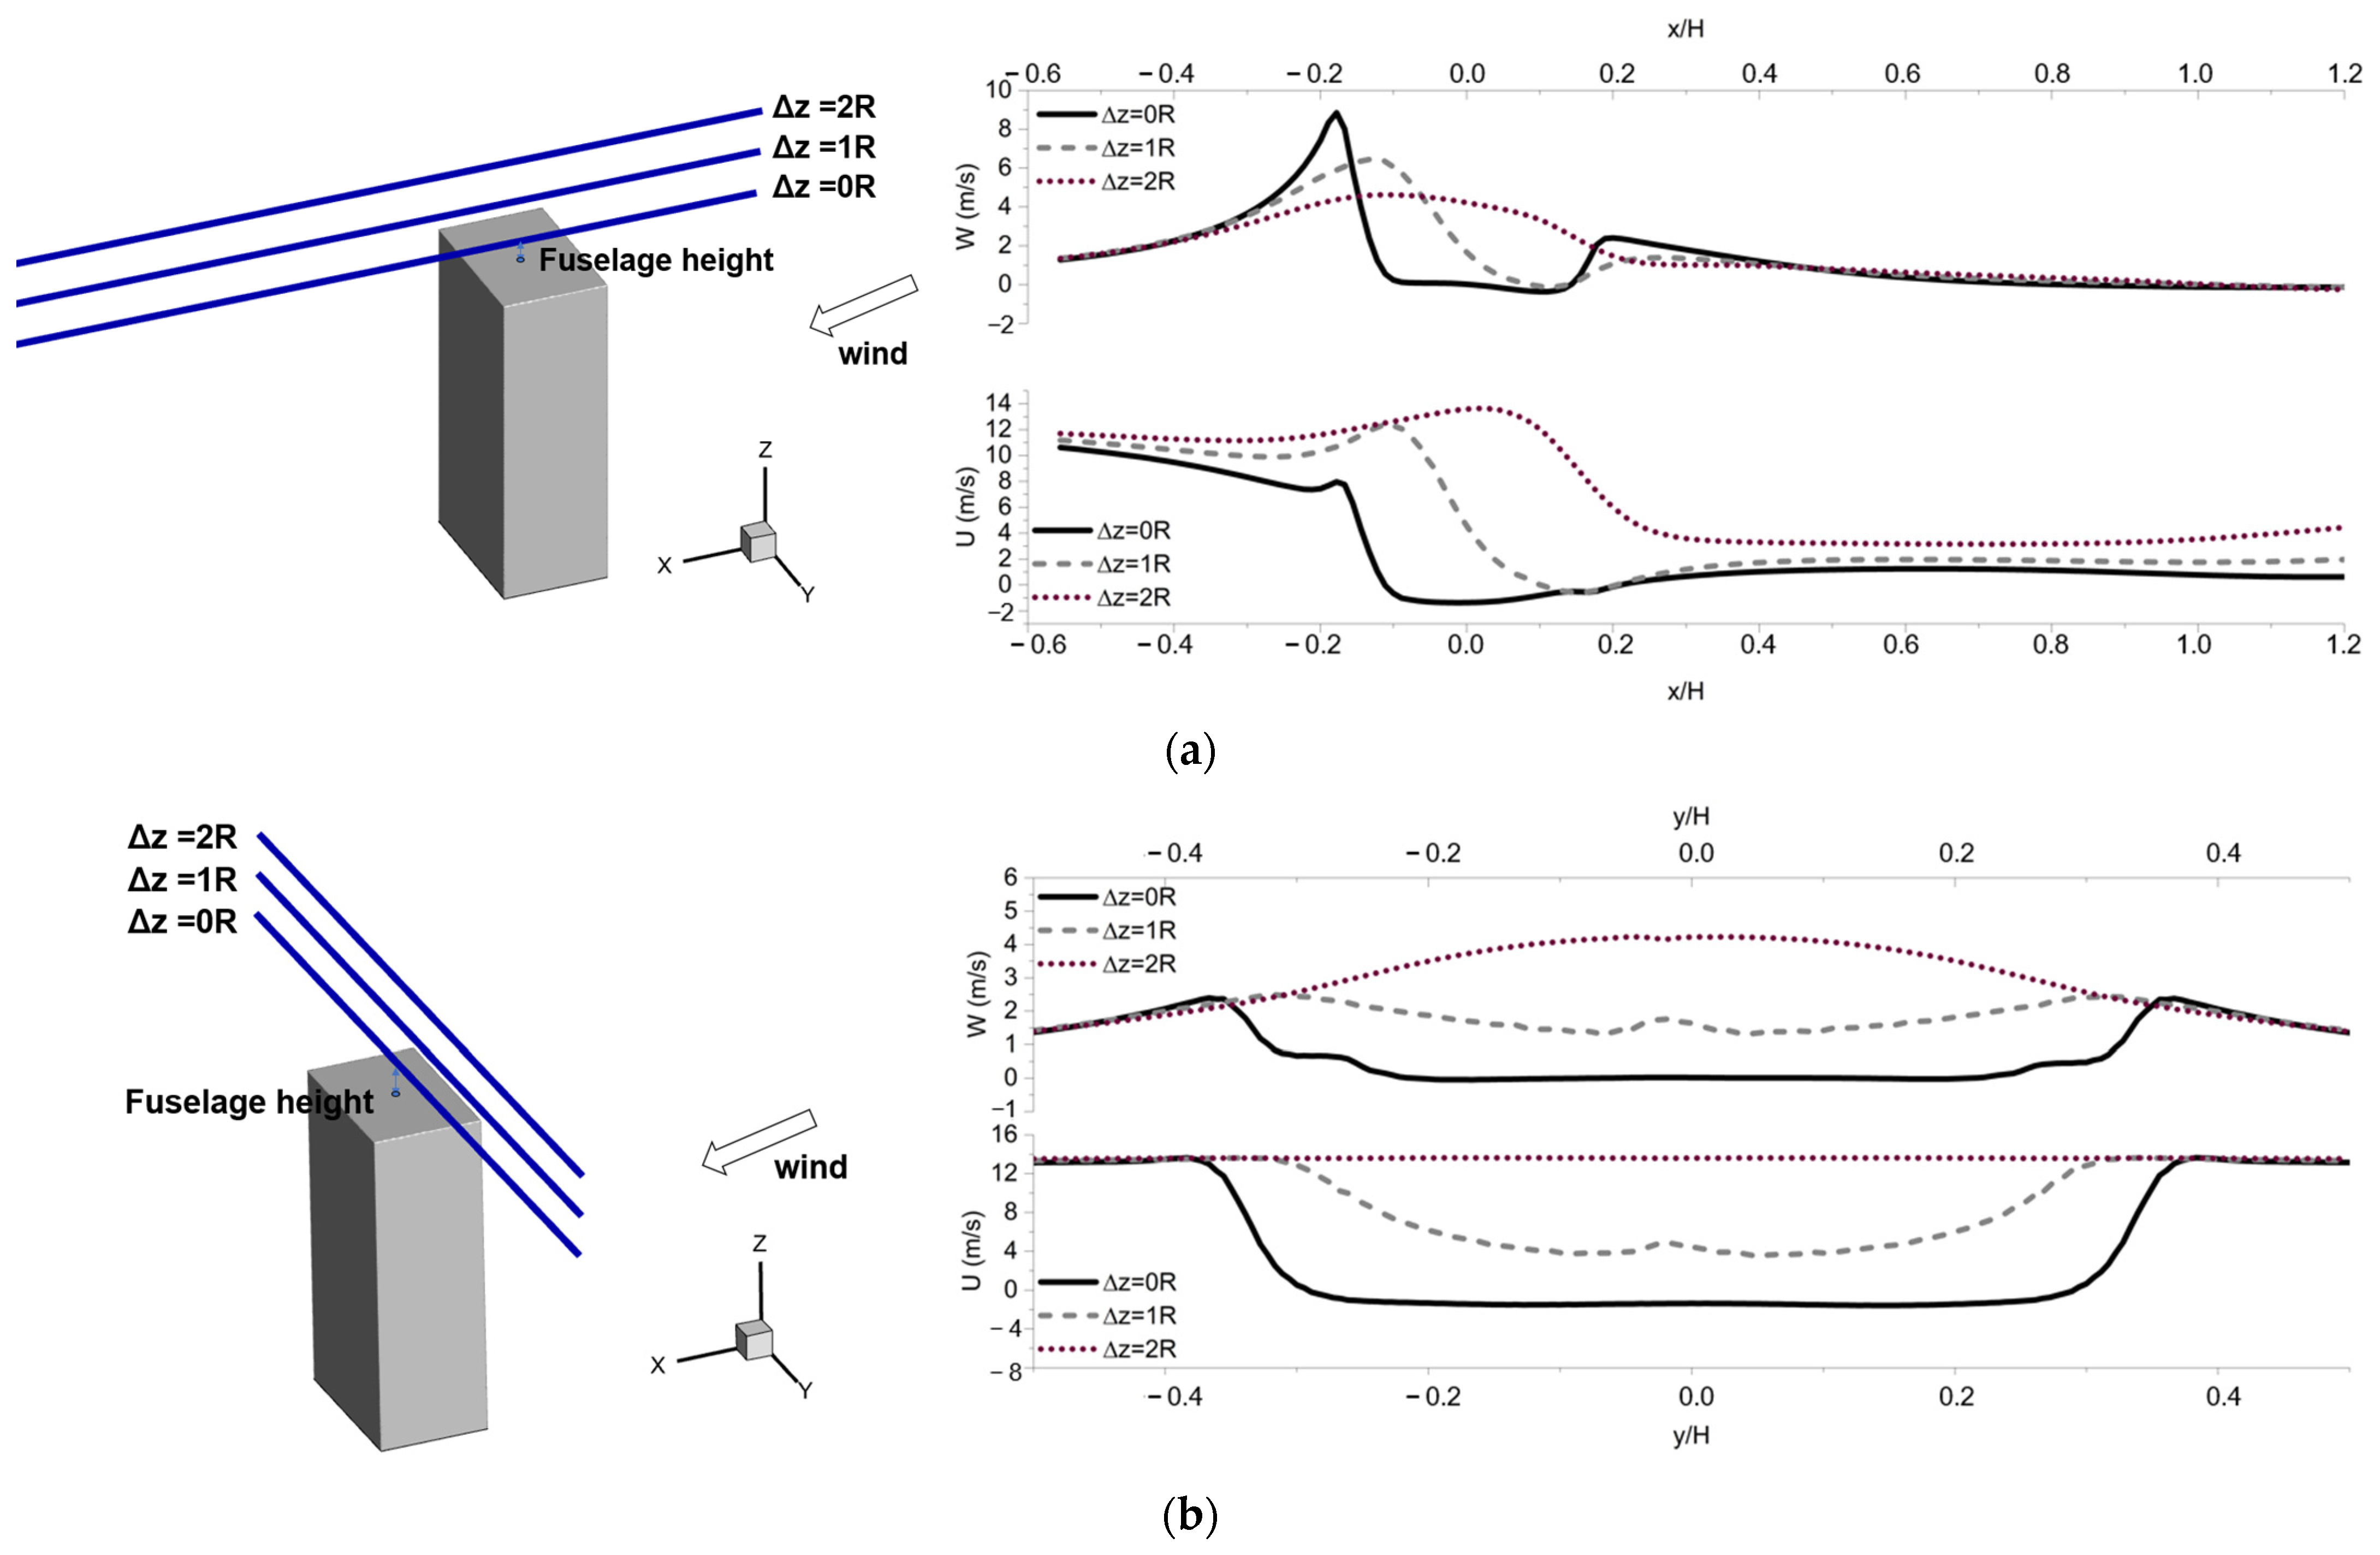
In particular, Figure 7 displays the vertical and longitudinal velocities at different detection lines on the roof of the building, with the location of the detection lines first given schematically. During the process from the headwind position to the upper roof, the vertical velocity experiences a sudden increase, followed by a descent and eventual stabilization, while the streamwise velocity sharply drops upon encountering the inflow boundary. Notably, at the eave of the headwind side, the maximum velocity of the upward airflow reaches 75.2% of the incoming flow. At higher positions above the roof, as the airflow enters the free shear layer, the changes in all velocity components become more gradual.
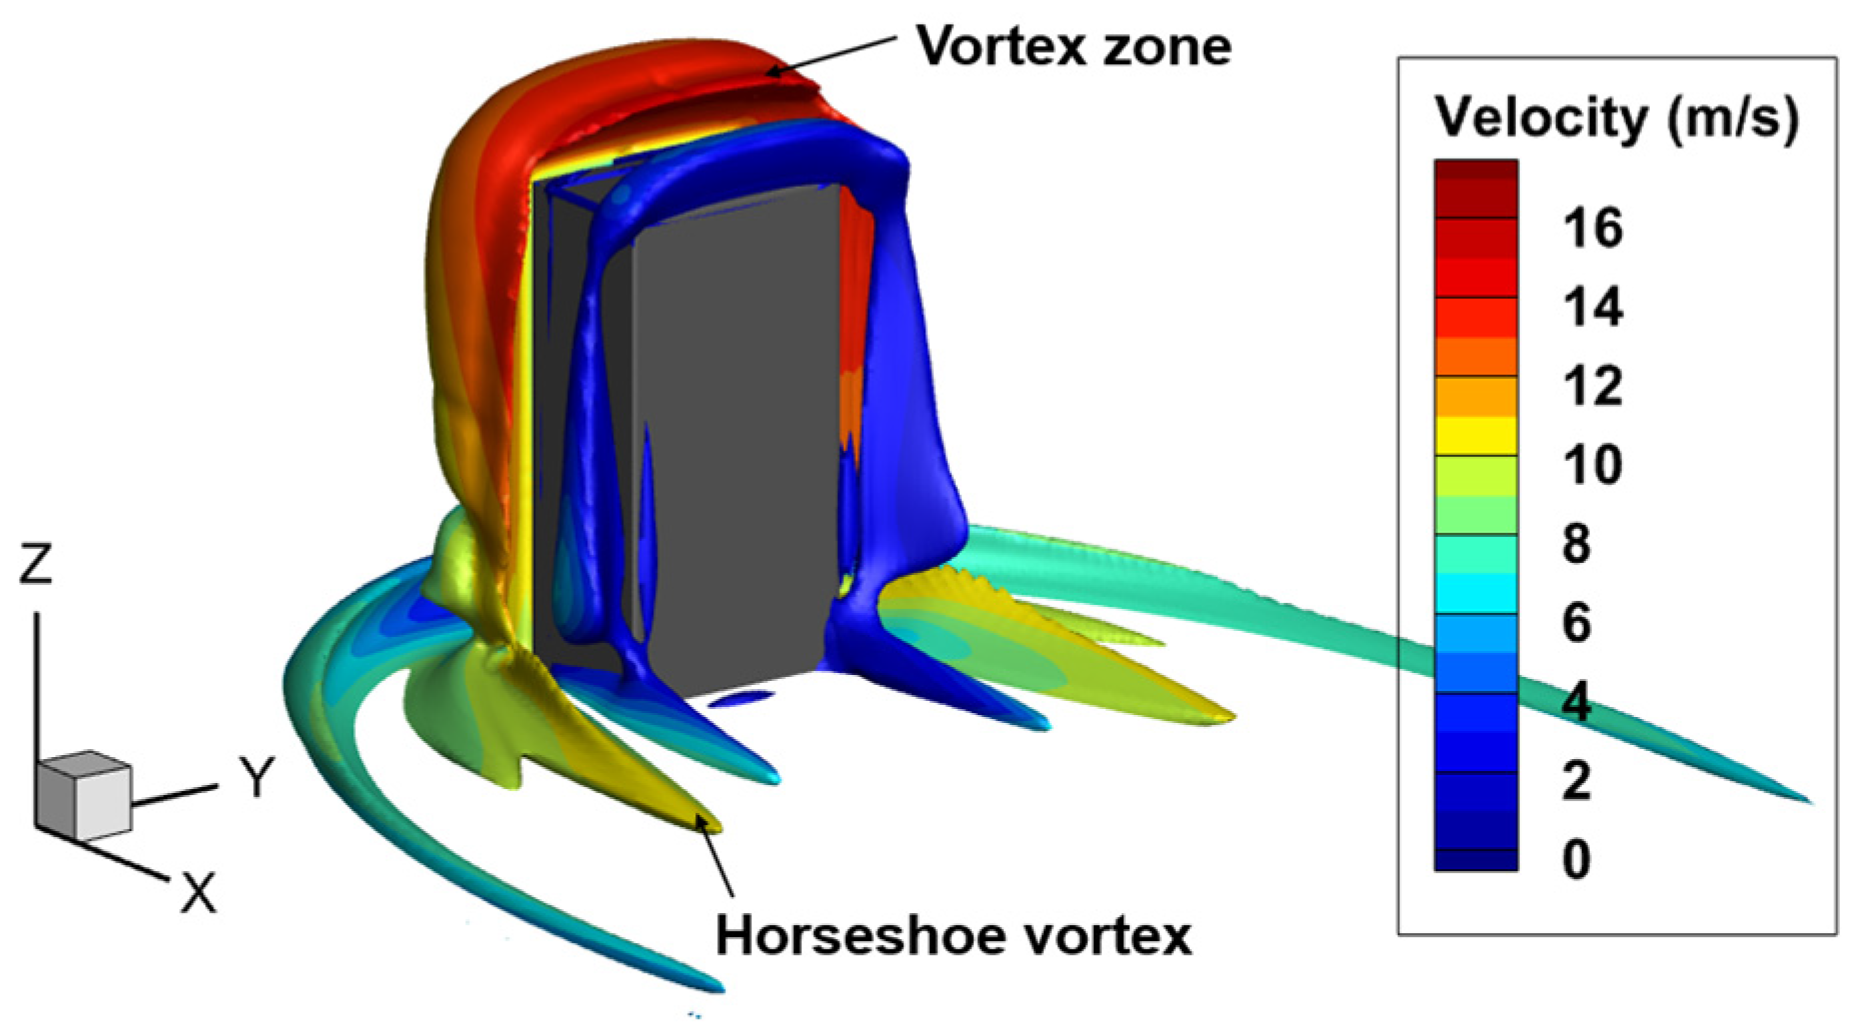
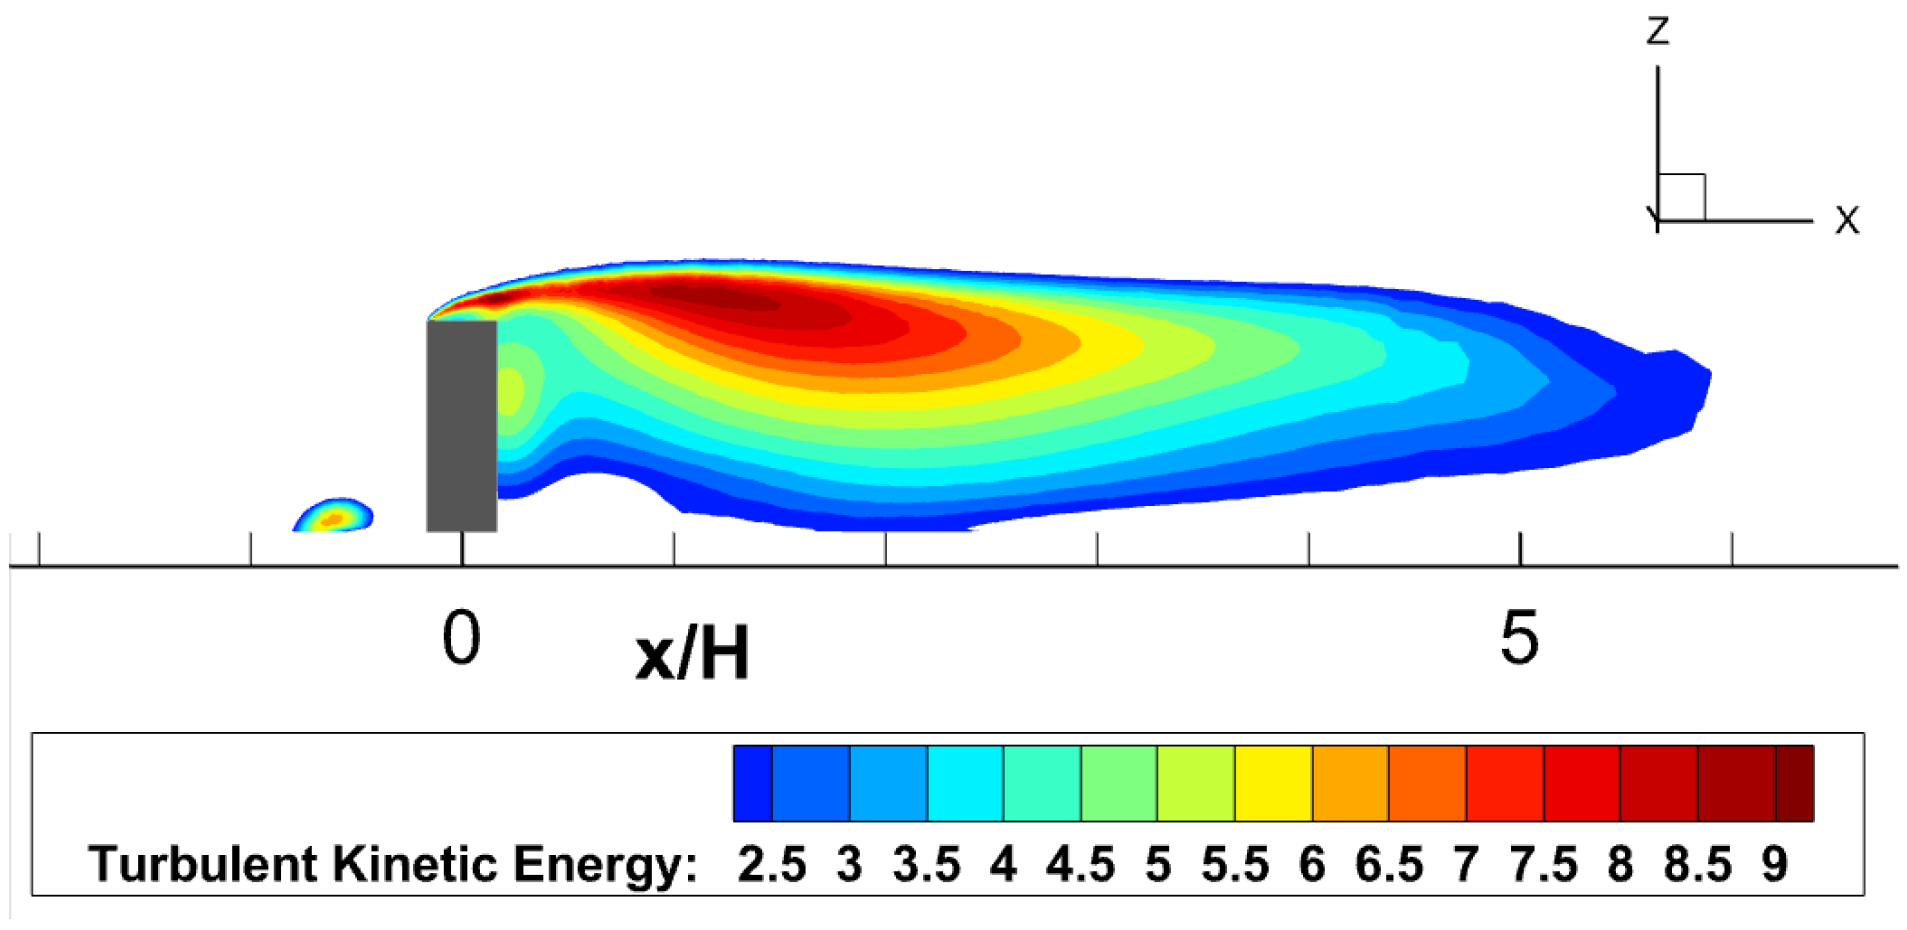
The Q-criterion isosurface of the isolated building is demonstrated in Figure 8, showing that the airflow around the building experiences separation at the roof due to the wall’s blockage effect and develops vertical vortices on both sides of the building. Moreover, a fixed vortex similar to a secondary flow at the base of the building subsequently splits into two horseshoe vortices flowing towards the sides of the structure. Turbulence intensity can partially reflect the standard deviation of vertical velocities in the flow field. Figure 9 illustrates the distribution of turbulence kinetic energy in the plane y = 0 . Since turbulence kinetic energy reflects the variance characteristics of the velocity, it can be seen that within 2 H 0 downstream of the roof height position, the airflow velocity pulsation is significant, which may cause unsteady disturbances when acting on the helicopter.
Further investigation into the flow field characteristics around an isolated building under different incoming wind velocity was conducted, categorized according to a meteorological wind velocity of 3.4   m / s U ¯ 0 17.1   m / s (from level 3 to level 7 of Beaufort), with a wind direction angle of 0 degrees. Figure 10 illustrates the flow velocity distribution around the isolated building, where detection lines x / H 0 = 1.0 , 2.0 , 3.0 , 4.0 are sequentially taken along the streamwise direction on the plane y = 0 . In Figure 10a, the streamwise distribution at the detection line reveals consistent features of the building wake under various incoming flow conditions. Velocities gradually approach zero due to viscous effects near the ground, with the return flow velocity increasing with height, and following a logarithmic profile development above 1.75 H 0 height as it interacts with the free shear layer. The flow velocity gradually recovers as the airflow moves away from the building. Figure 10c presents the vertical velocity distribution along the streamwise detection line x / H 0 = 0.25 ,   0.0 ,   1.0 on the plane h = H 0 , where the updraft and downdraft velocity magnitudes are positively correlated with the incoming flow velocity. After normalizing the wind velocities by undisturbed incoming velocities at the corresponding heights, it was found that with increasing incoming flow velocity, the dimensionless velocity distributions across all monitoring profiles are nearly identical. This indicates that the flow field enters a self-similar region of Reynolds number, where inertial forces dominate, maintaining the stability of the flow field structure. Due to this characteristic, obtaining the flow field velocity distribution at a specific relative incoming flow velocity allows for the derivation of the wake static velocity field characteristics at another wind velocity scenario through scaling transformations. This helps to study the flow disturbance characteristics of helicopters in a steady flow environment.

4.2. Rotor–Building Coupled Flow Field

Since the wind velocity is much slower than the rotational velocity of the rotor, current research on rotor/building coupled flow analysis puts its major focus on the changes introduced in the wind due to changes in the position of the rotor. According to the analysis in the previous section related to the complex flow state of vertical wind, lateral wind, and building-induced flow interference, the key influence region formed by the flow blockage effect of the building is divided into four regions: the headwind region of the building (H-region), the roof of the building (T-region), the downwind region of the building (D-region), and the side of the building (S-region). The rotor position is represented by 18 discrete points, and in the calculation, considering the height of the fuselage H F u l . The heights of the discrete points in the T area from the roof are 4 m ( H F u l ), 10 m ( H F u l + R ), and 16 m ( H F u l + 2 R ), and the discrete points in the H, D, and S areas are 10 m ( H F u l + R ) from the roof. The division of the wind influence area and the spatial position of the rotor discrete points are shown in Figure 11.
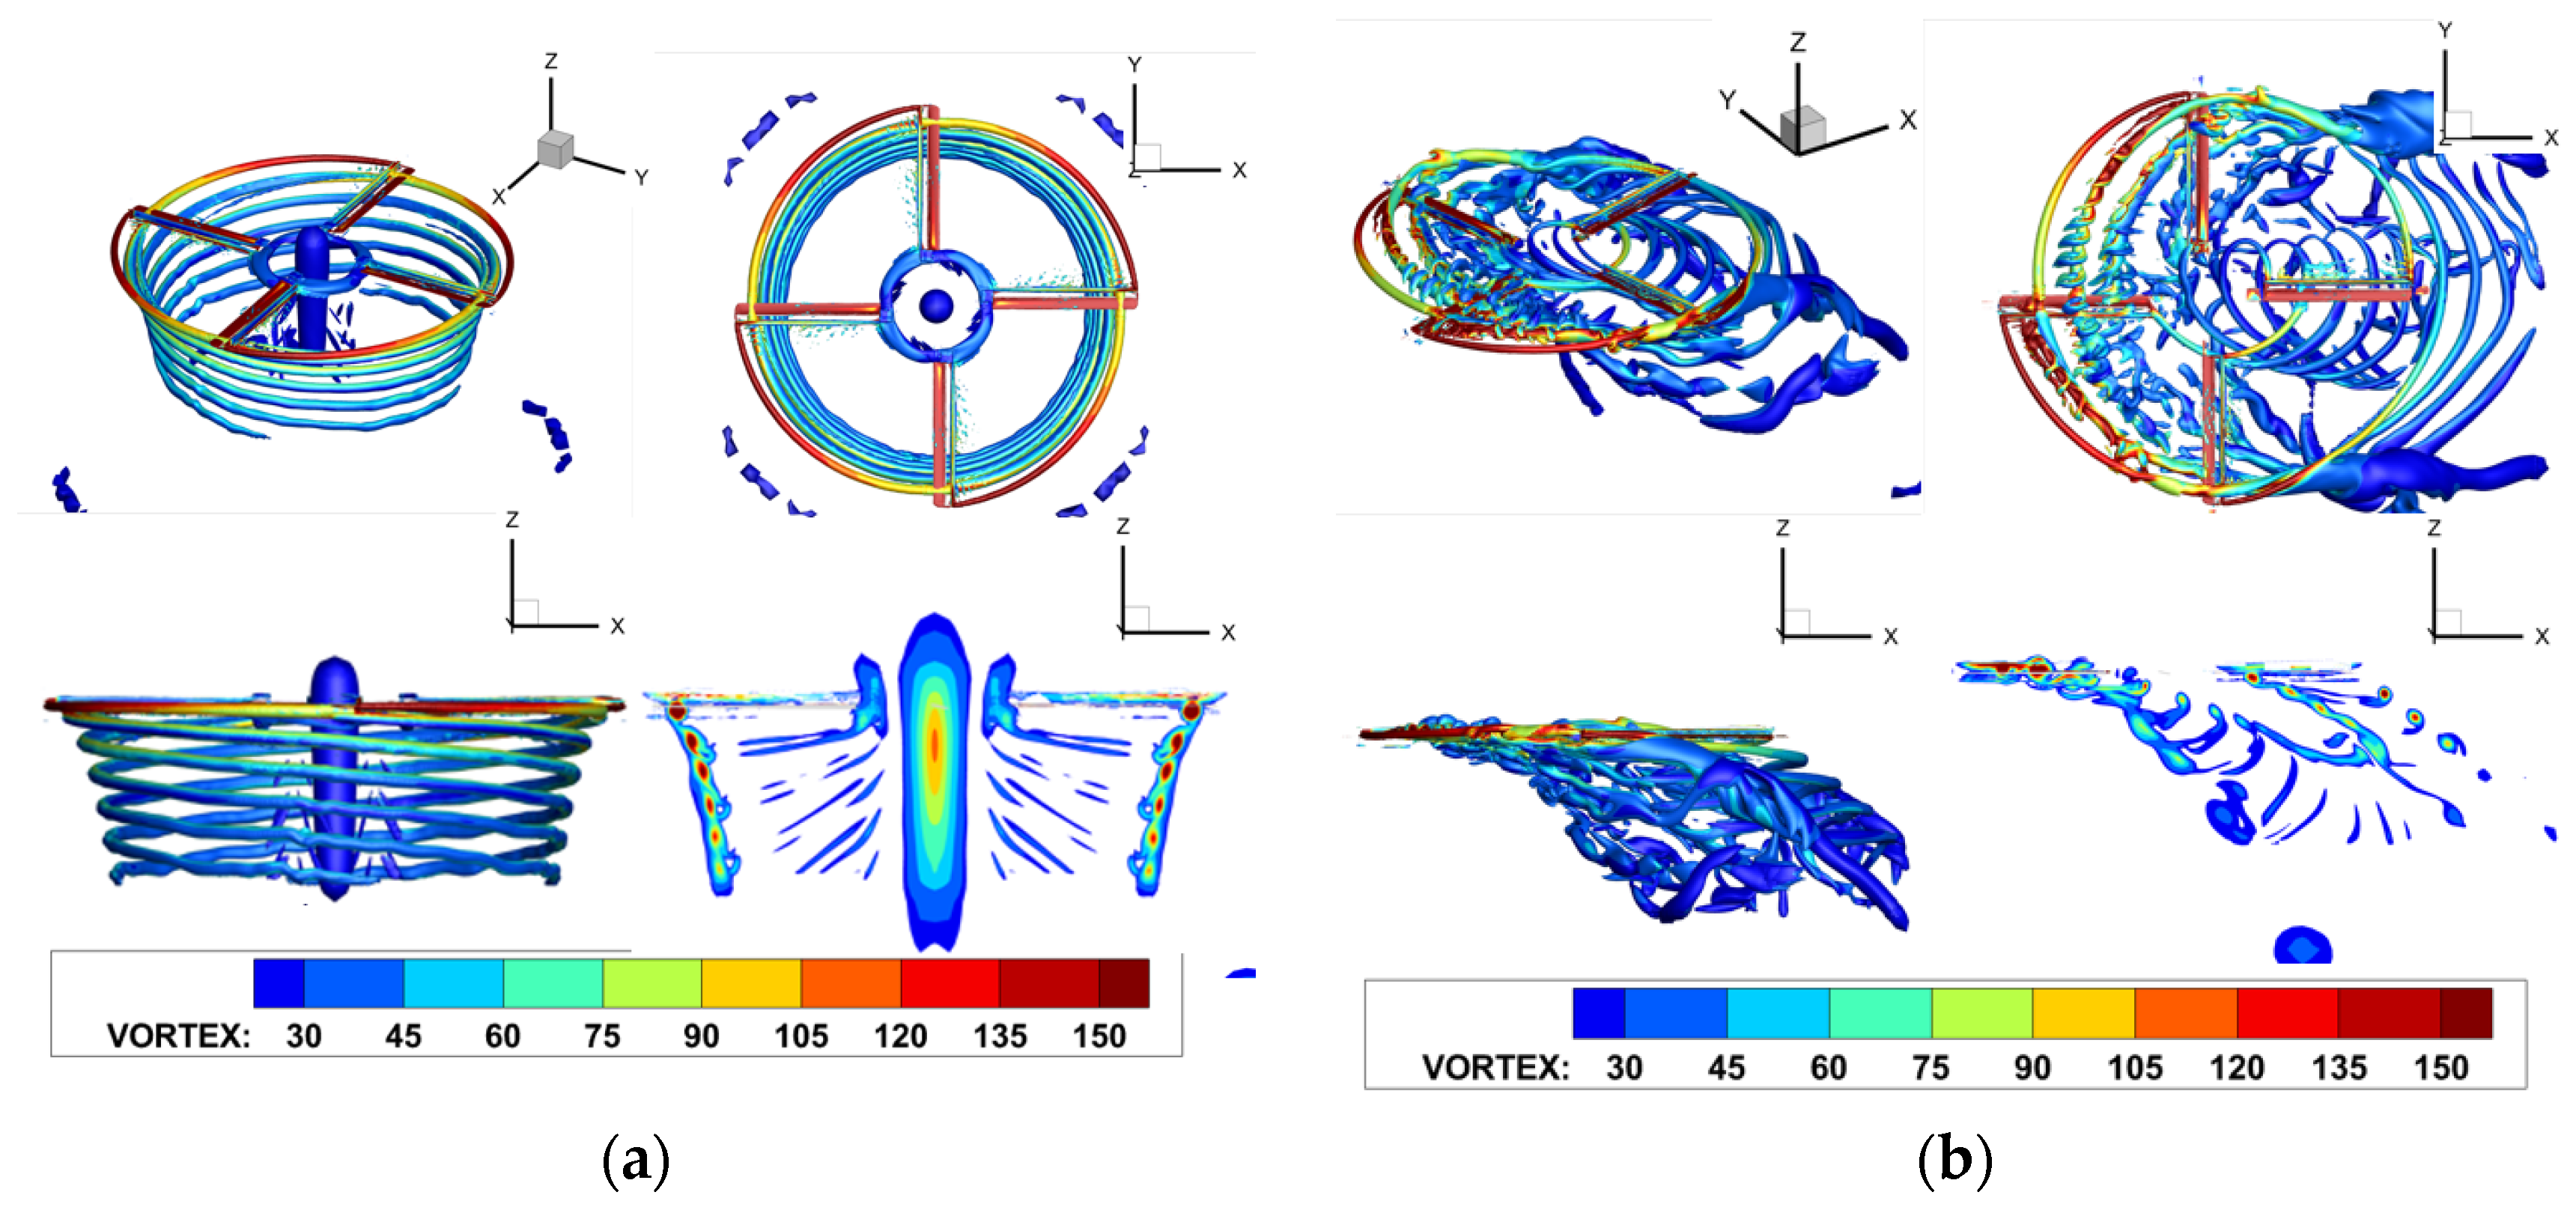
The rotor is in a hovering condition with 350 RPM, the collective is 10 degree, and the building model and wind field conditions are the same as aforementioned in Section 2.3. Figure 12 shows the Q-criterion isosurface of the tip vortex for both windless and ABL conditions during isolated rotor hovering, with the isosurface colored by vorticity magnitude (legend as VORTEX). In the absence of wind, the tip vortex continuously sheds during the periodic motion of the rotor, forming a stable and regular helical structure of wake. In the ABL interference, with a wind velocity of 12.9 m/s at the rotor location, similar to a low-velocity forward flight condition with a similar advance ratio μ = 0.06 , the upwind wake enters the rotor disk. This results in varying degrees of blade vortex interference (BVI) occurring within the 90° to 270° azimuth range of the rotor, with more severe effects observed on the advancing side.
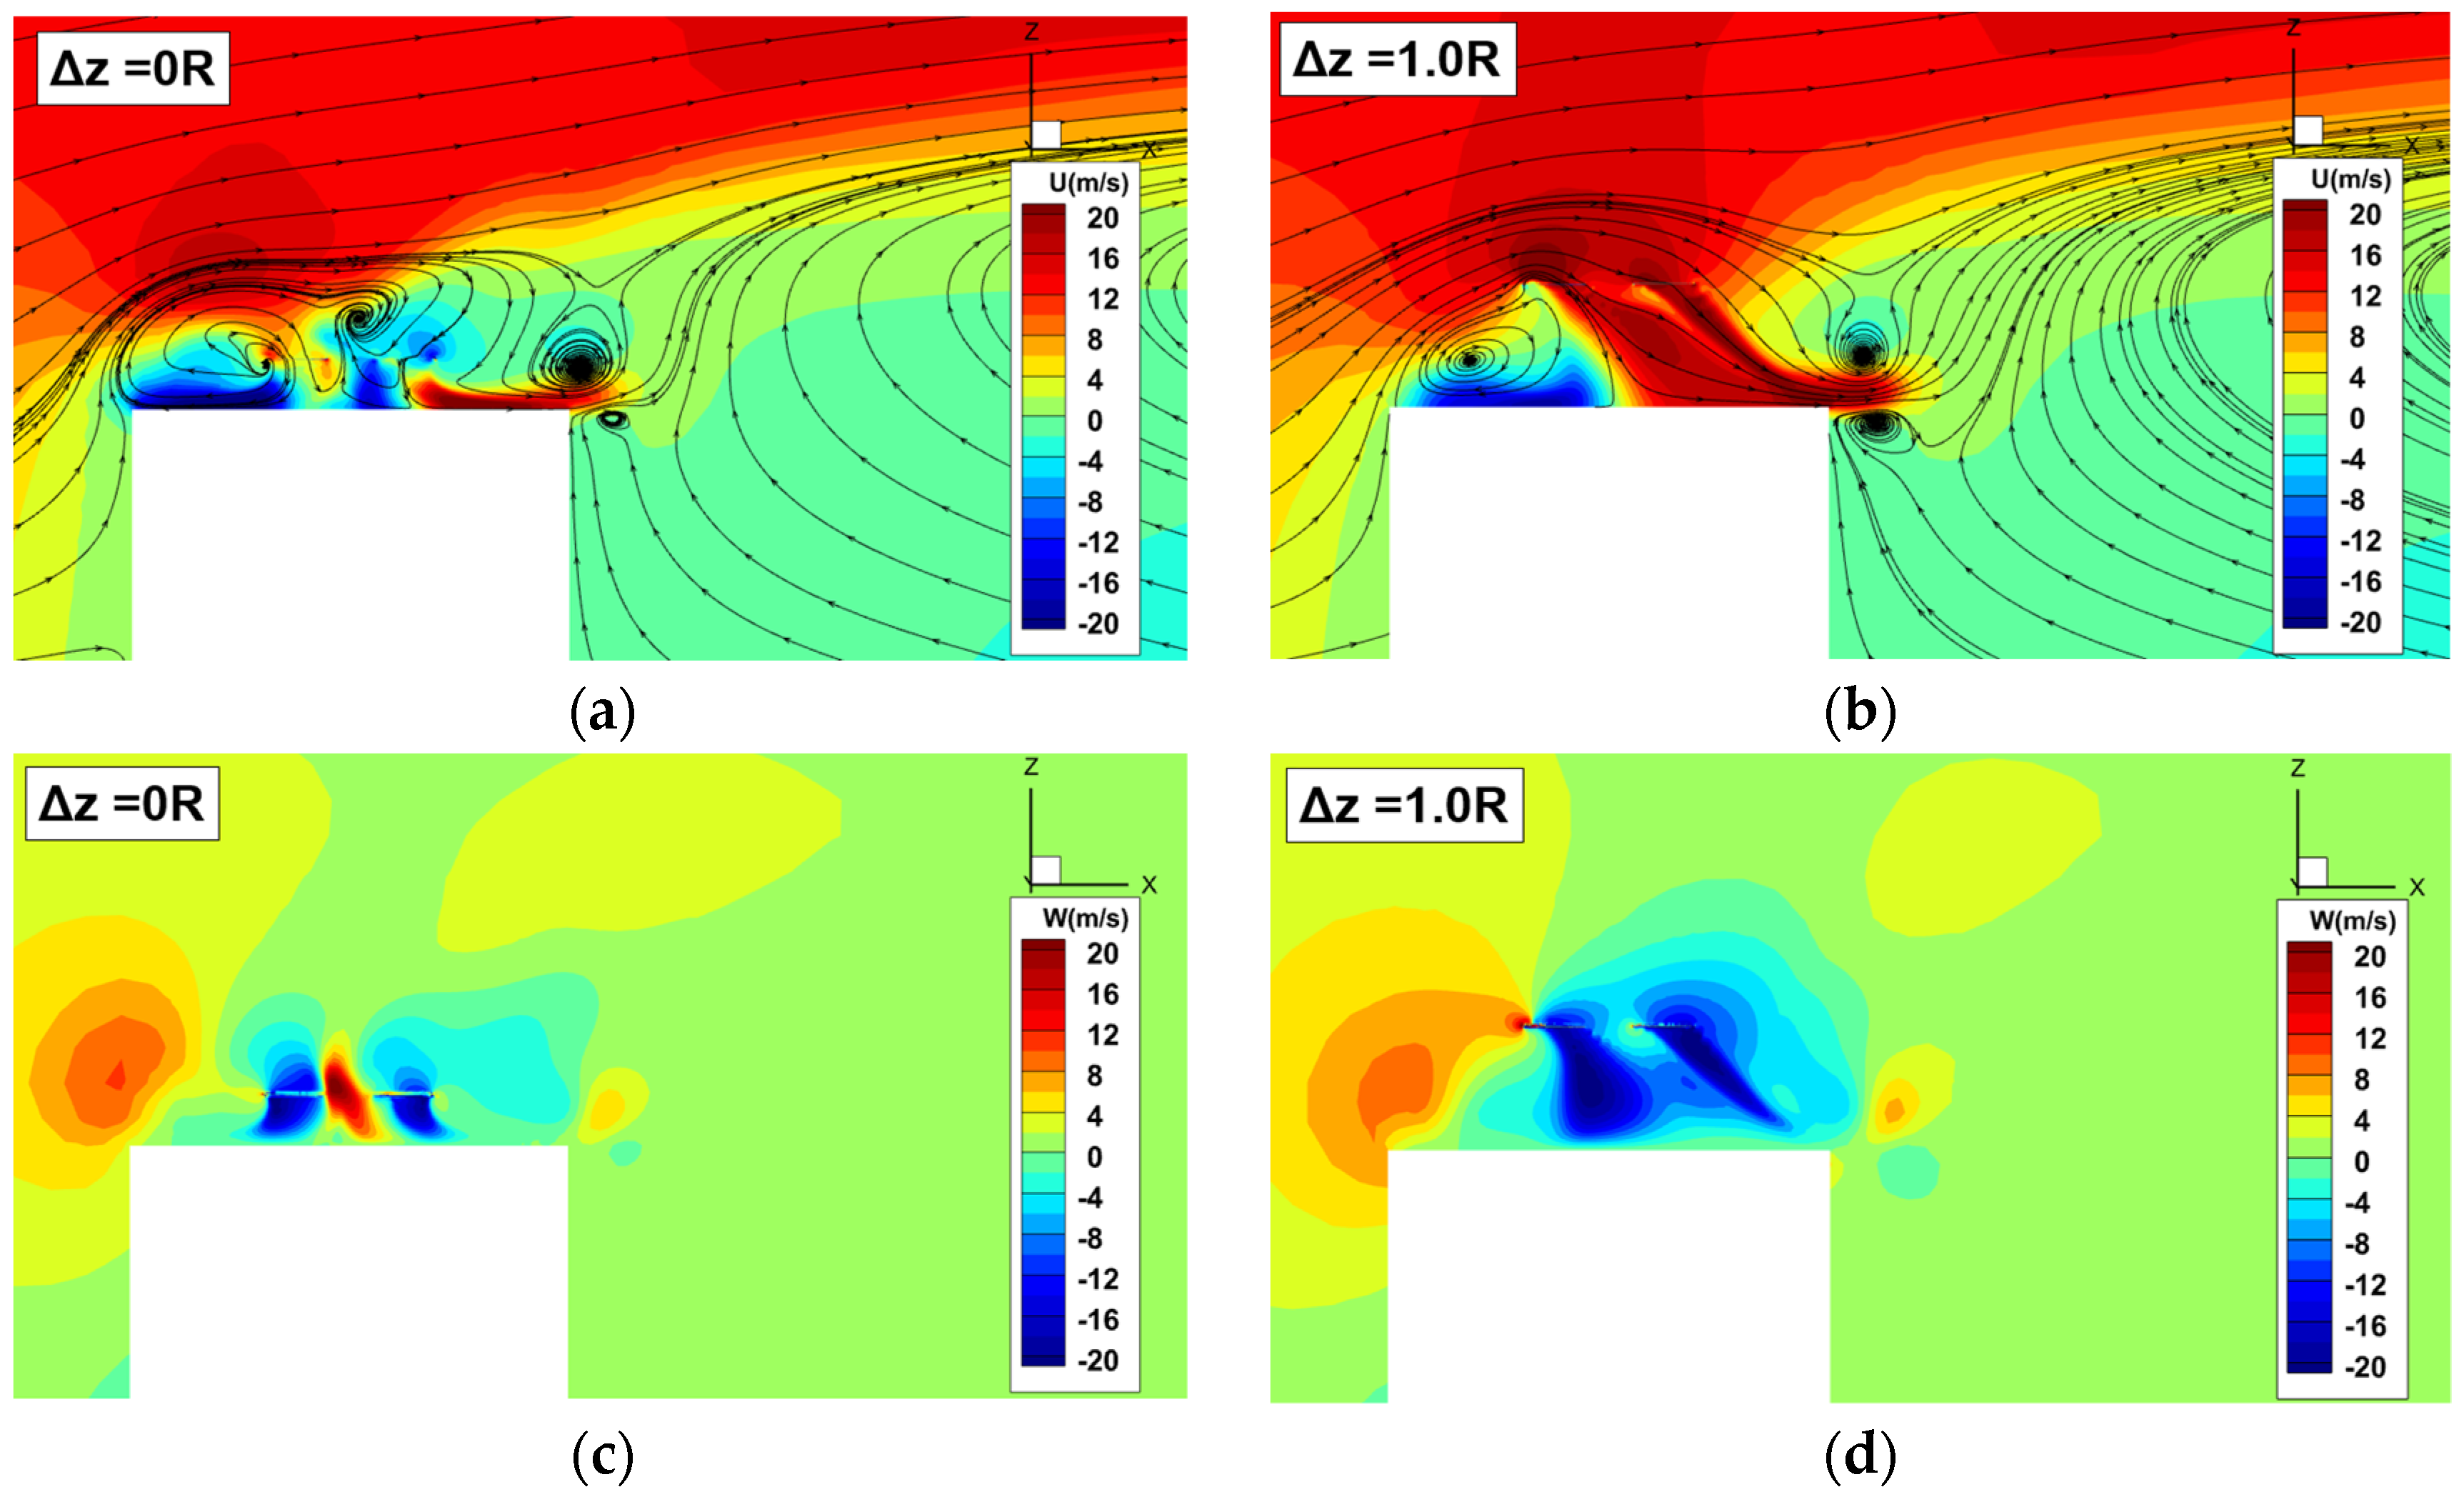
When the rotor is positioned at the top of a building, it encounters both building-induced flow interference and roof ground effect. Figure 13 illustrates the velocity and streamlines distribution in the flow field at different heights in the T-region around the rotor. When Δ z = 0 R ( Δ z denotes the vertical distance from the bottom of the fuselage to the roof of the building), where the rotor is within the recirculation boundary, the wake structure remains approximately symmetrical at small vortex age angles. As the downwash flow approaches the wall surface, an unsteady wall jet appears on the rooftop. As the rotor ascends, the rotor enters the free shear layer of the wind field, causing the wake to tilt downwind, resembling a low-velocity forward flight condition similar to the ground effect.
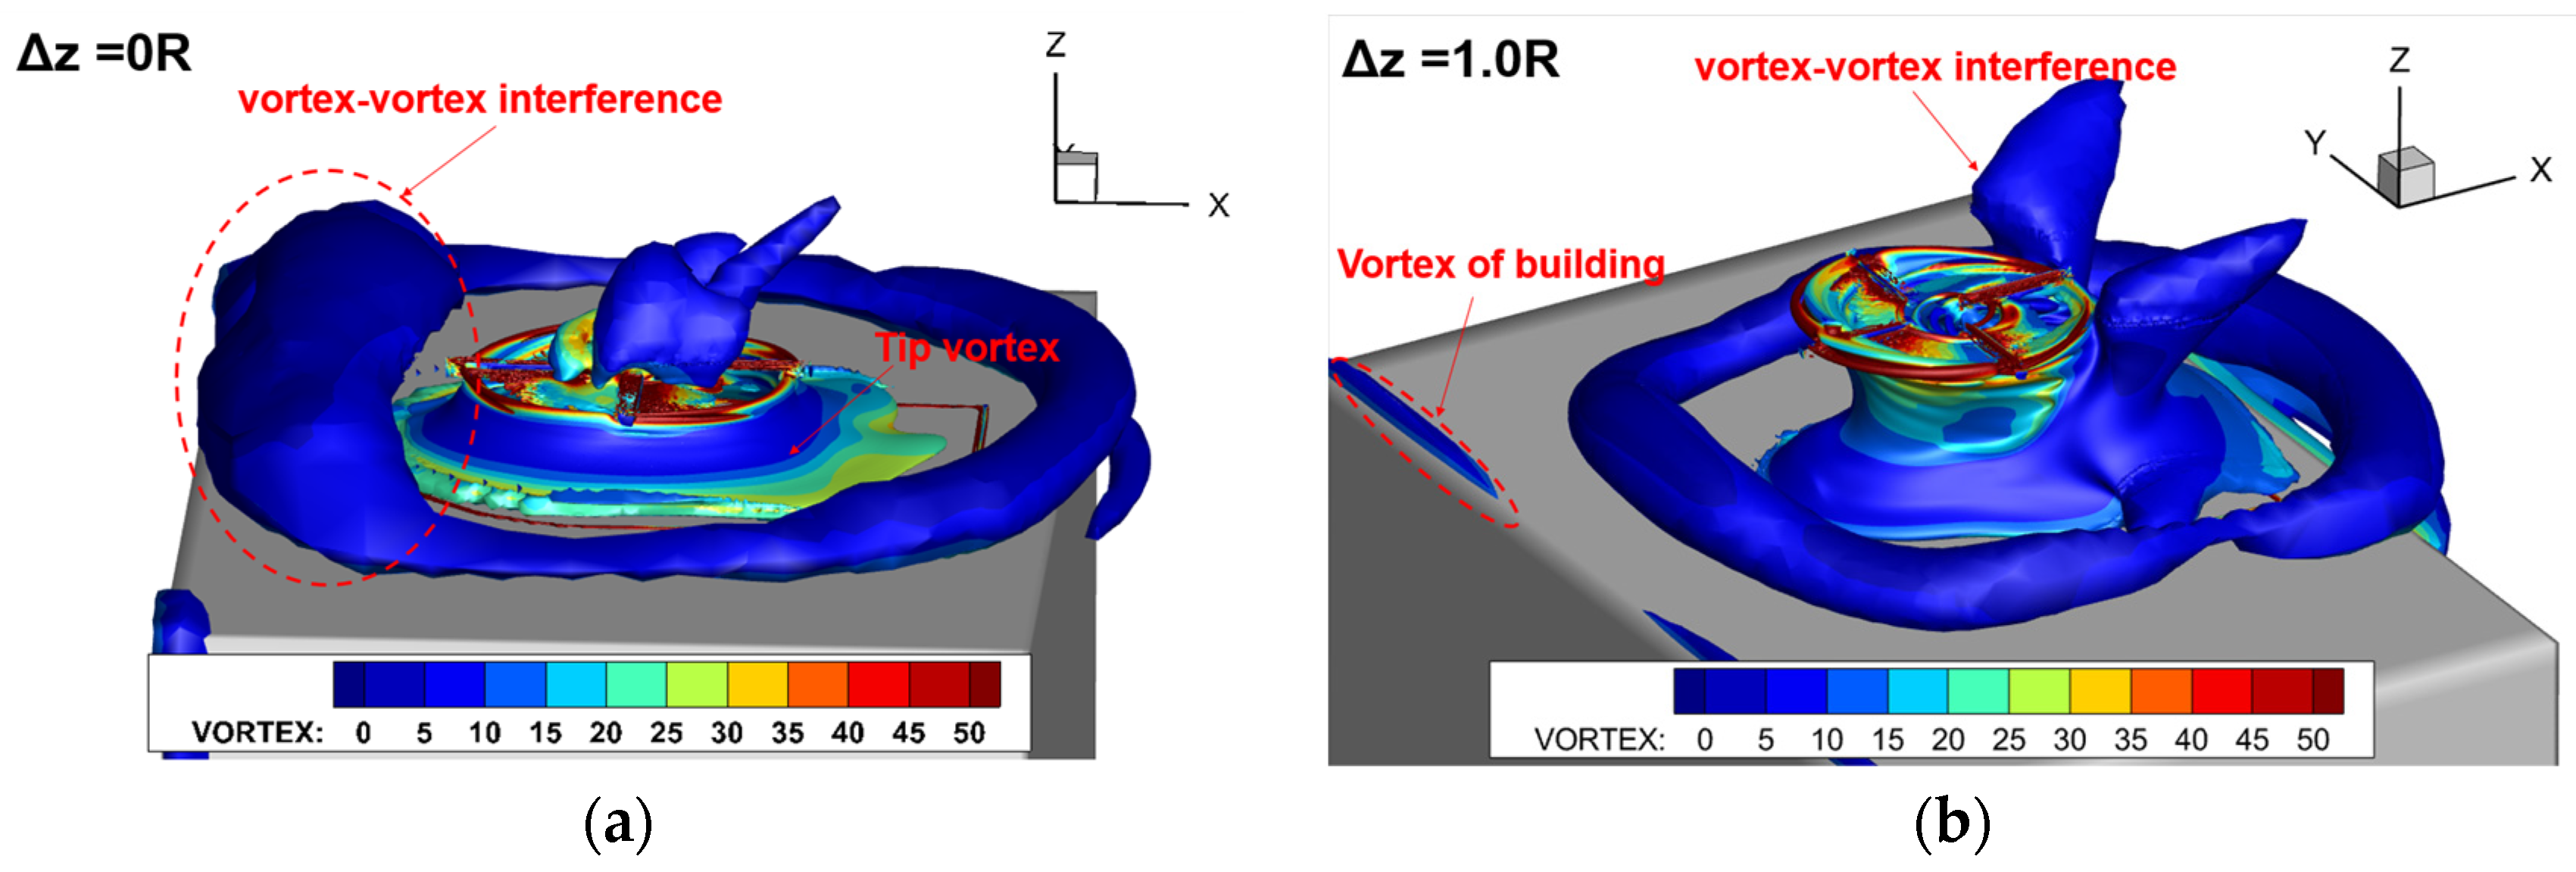
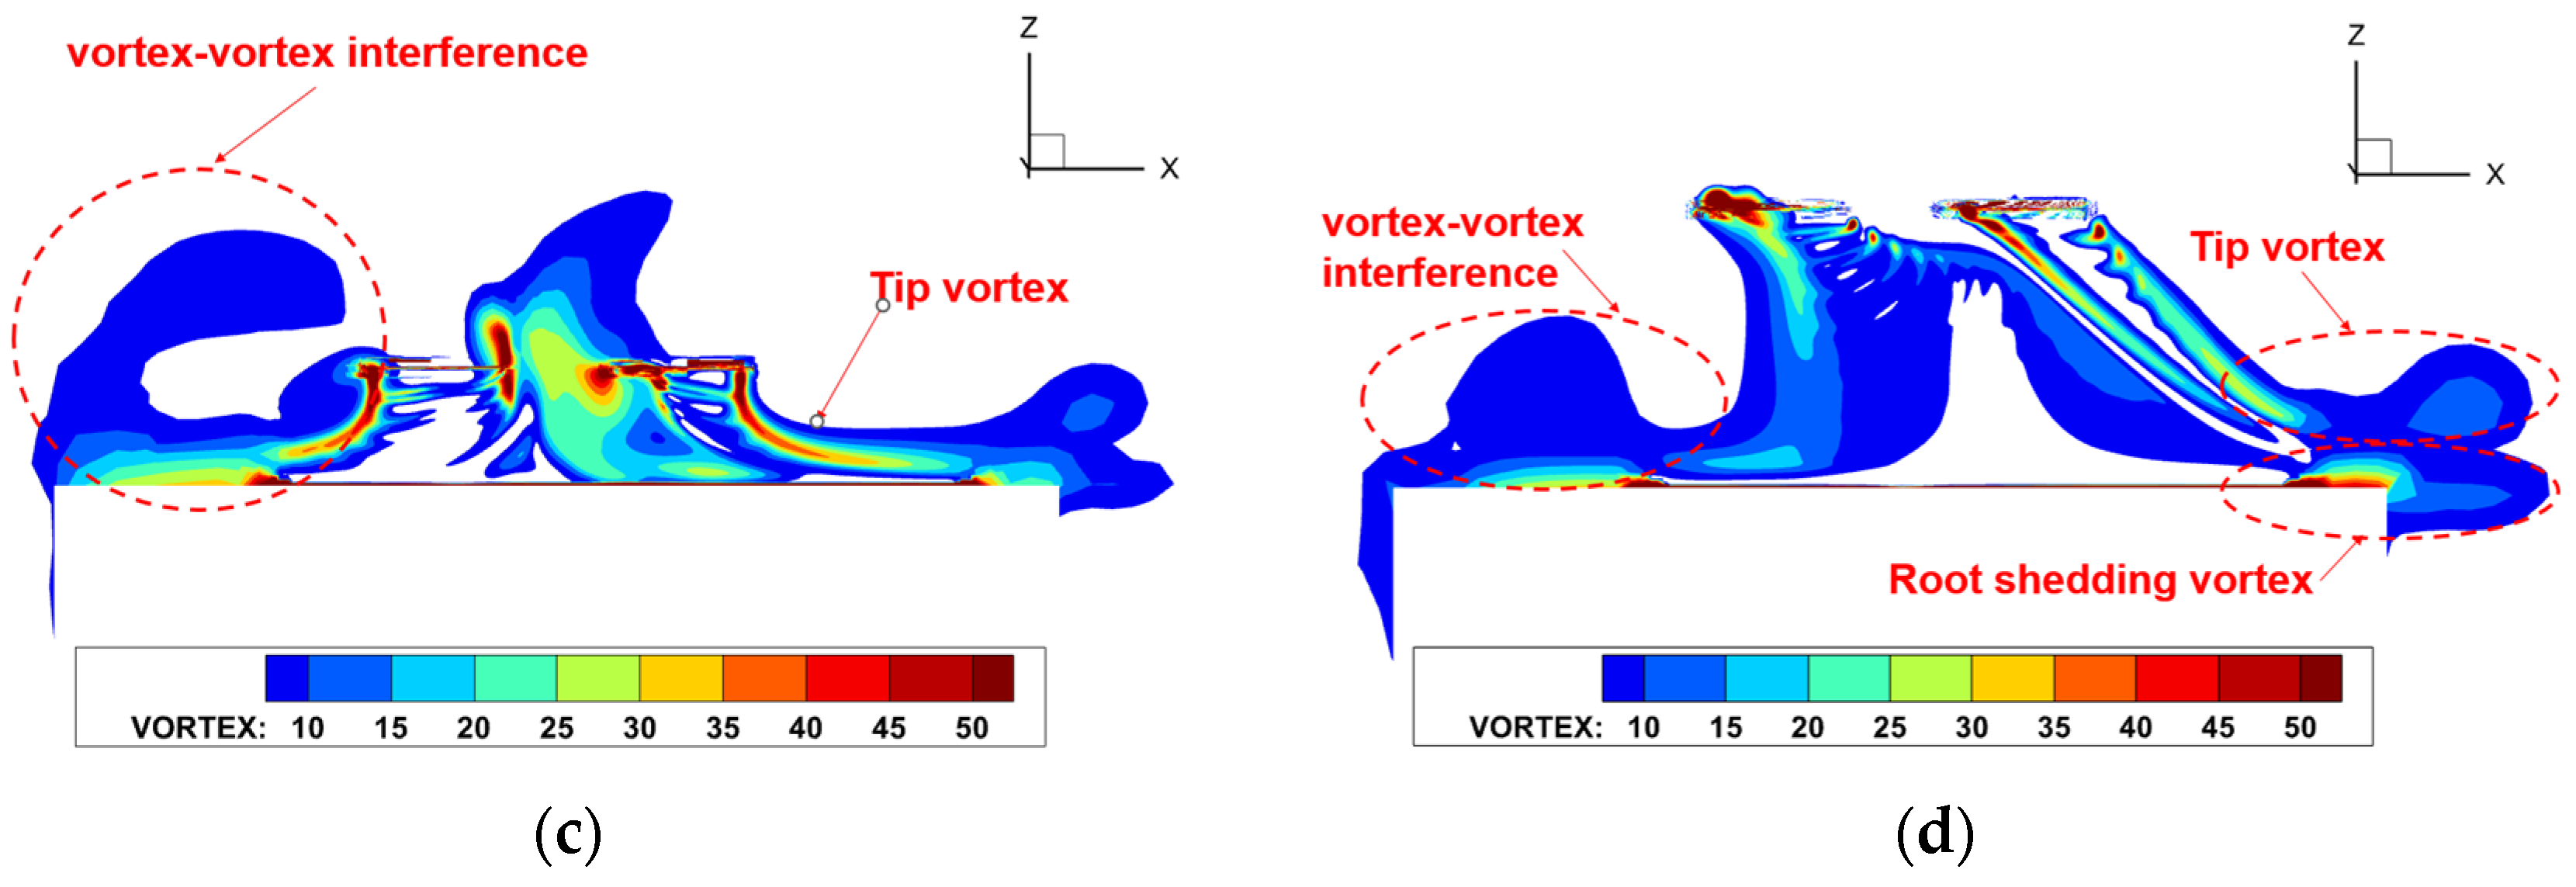
Figure 14 displays the isosurfaces of vorticity around the rotor at different positions in the T-region. When the rotor is positioned above the rooftop, ring vortices form on either side of the rotor, which then expand and diffuse as they approach the wall surface. The forward-flowing wake vortices interact and couple with the shed vortices from the building, rolling upward to form larger coupled vortex structures. There is a tendency for the coupled vortices on the advancing side to enter the rotor disk again, leading to a circulation phenomenon that can induce sudden changes in pitching moments. At the rotor root, some of the shed vortices reach the ground as the flow progresses, gradually approaching the region where the shed vortices from the rotor tip interact. These vortical structures, hindered by the ground, can lift the rotor tip vortices at certain moments, causing the flow field on the leeward side to undergo vortex–vortex interactions and become more complex.
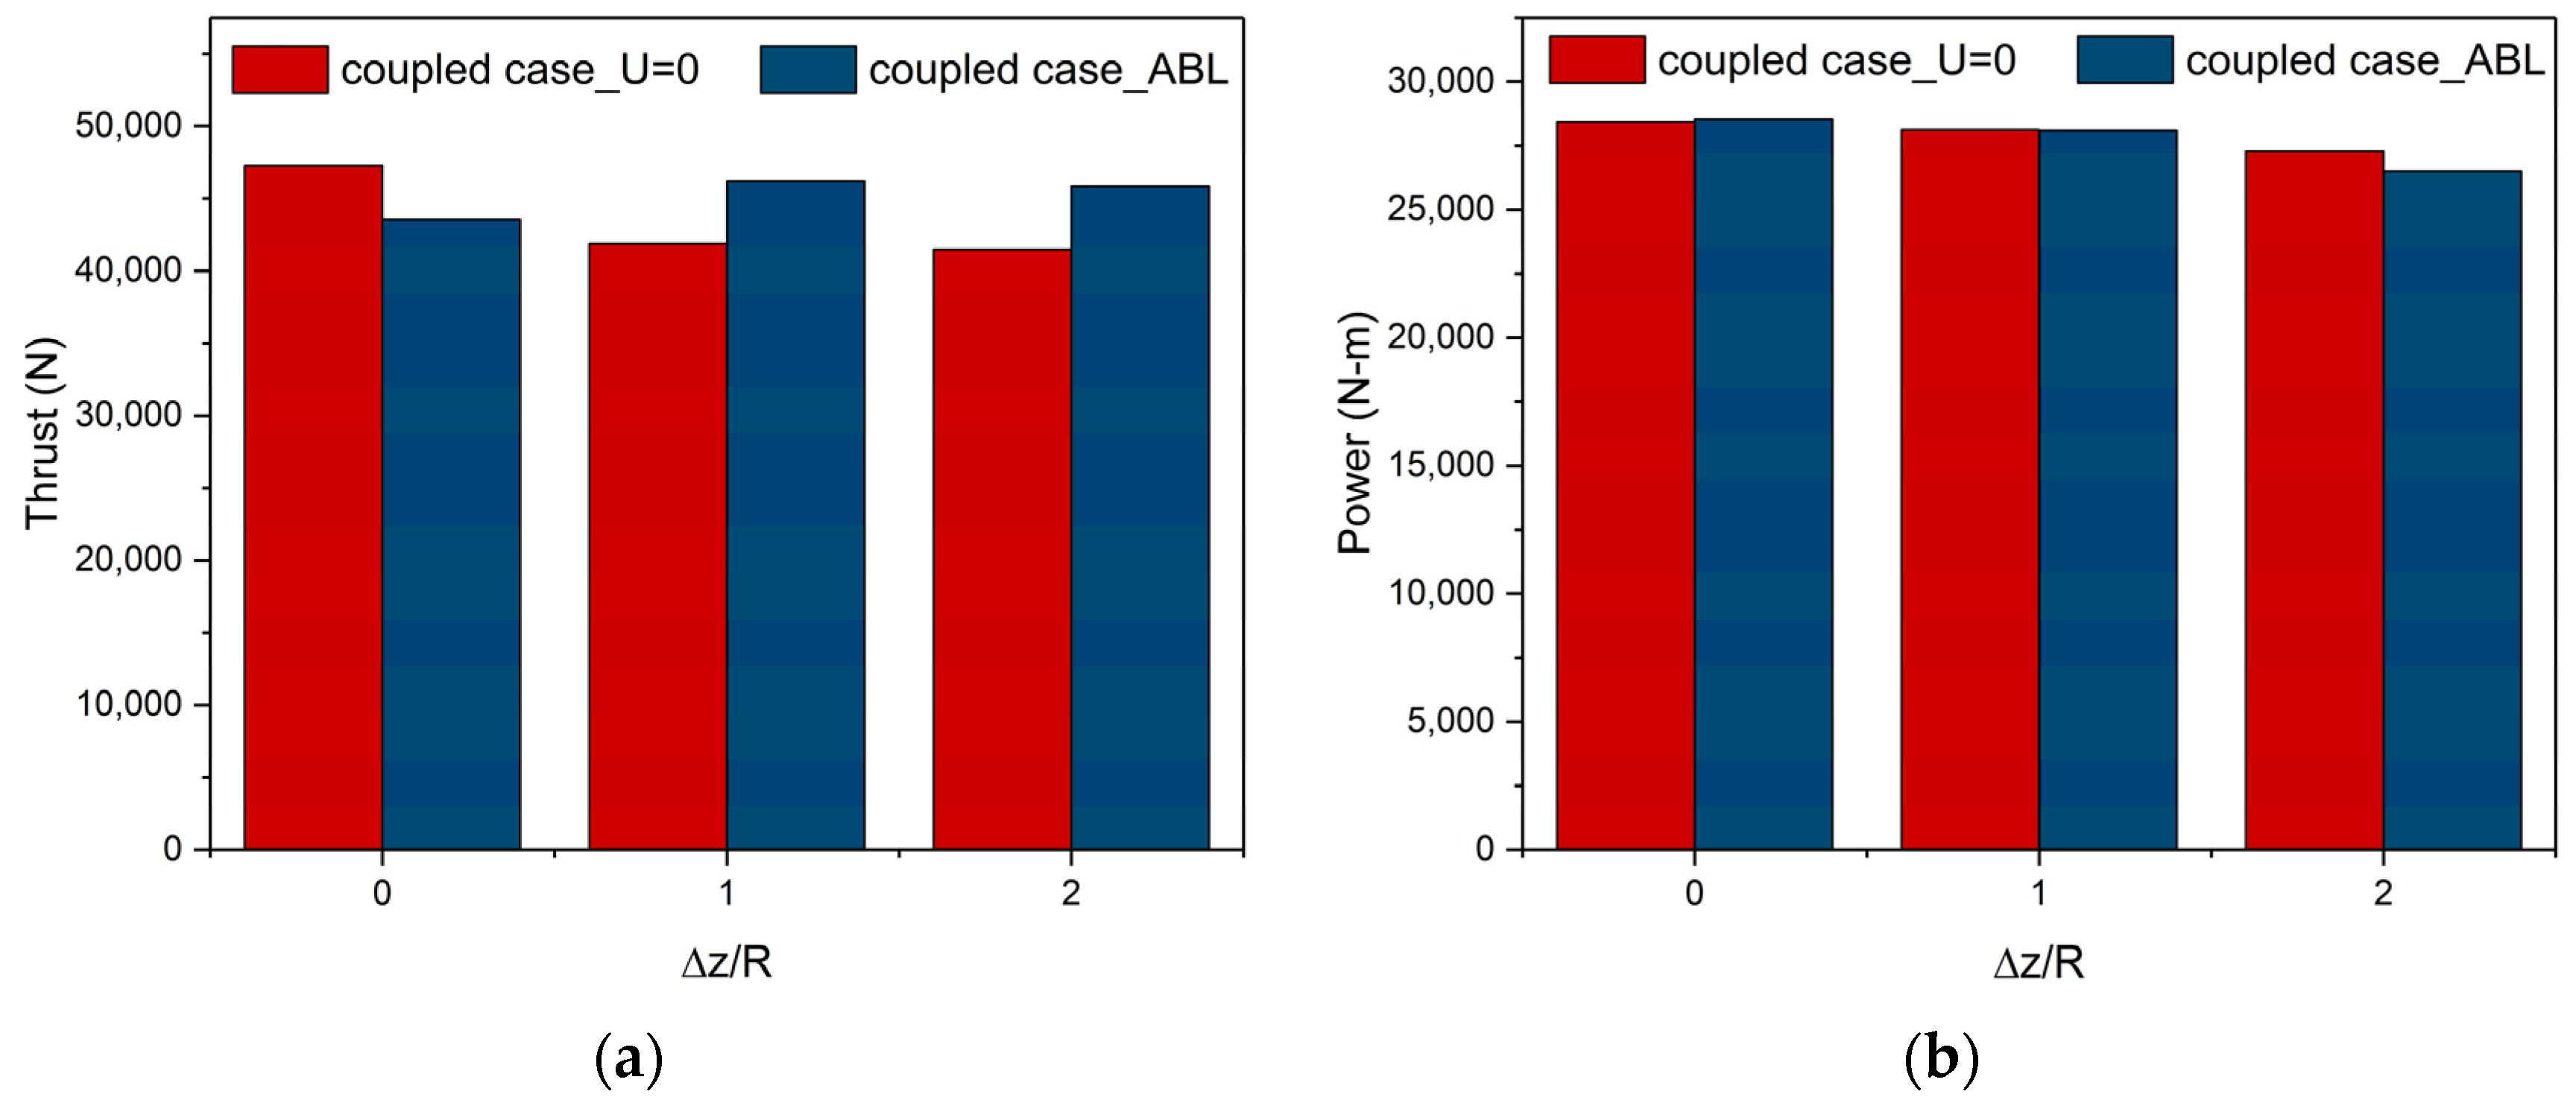
To analyze the time-averaged characteristics of rotor performance in the T-region, Figure 15 compares the rotor thrust and power at different hover positions under windless and ABL cases. At a 0 m/s incoming flow, as the hover height decreases, the benefit of the ground effect increases, leading to a gradual increase in thrust. However, in the presence of building-induced flow disturbances, the rotor experiences a 7.8% loss in thrust when hovering at low altitude due to the influence of circulations. As the hover height increases, the rotor transitions from the recirculation region to the free shear layer, where the increased inflow velocity compensates for the loss of benefit from the ground effect caused by the height variation. At the position Δ z = 1.0 R , a combination of the free shear layer inflow and ground effect gain results in a peak thrust, surpassing the windless state by 10.4%. With a further increase in height, the ground effect weakens, leading to a decrease in the wind entering the rotor from above. This results in no significant change in thrust but a reduction in power consumption after the combination of effects.
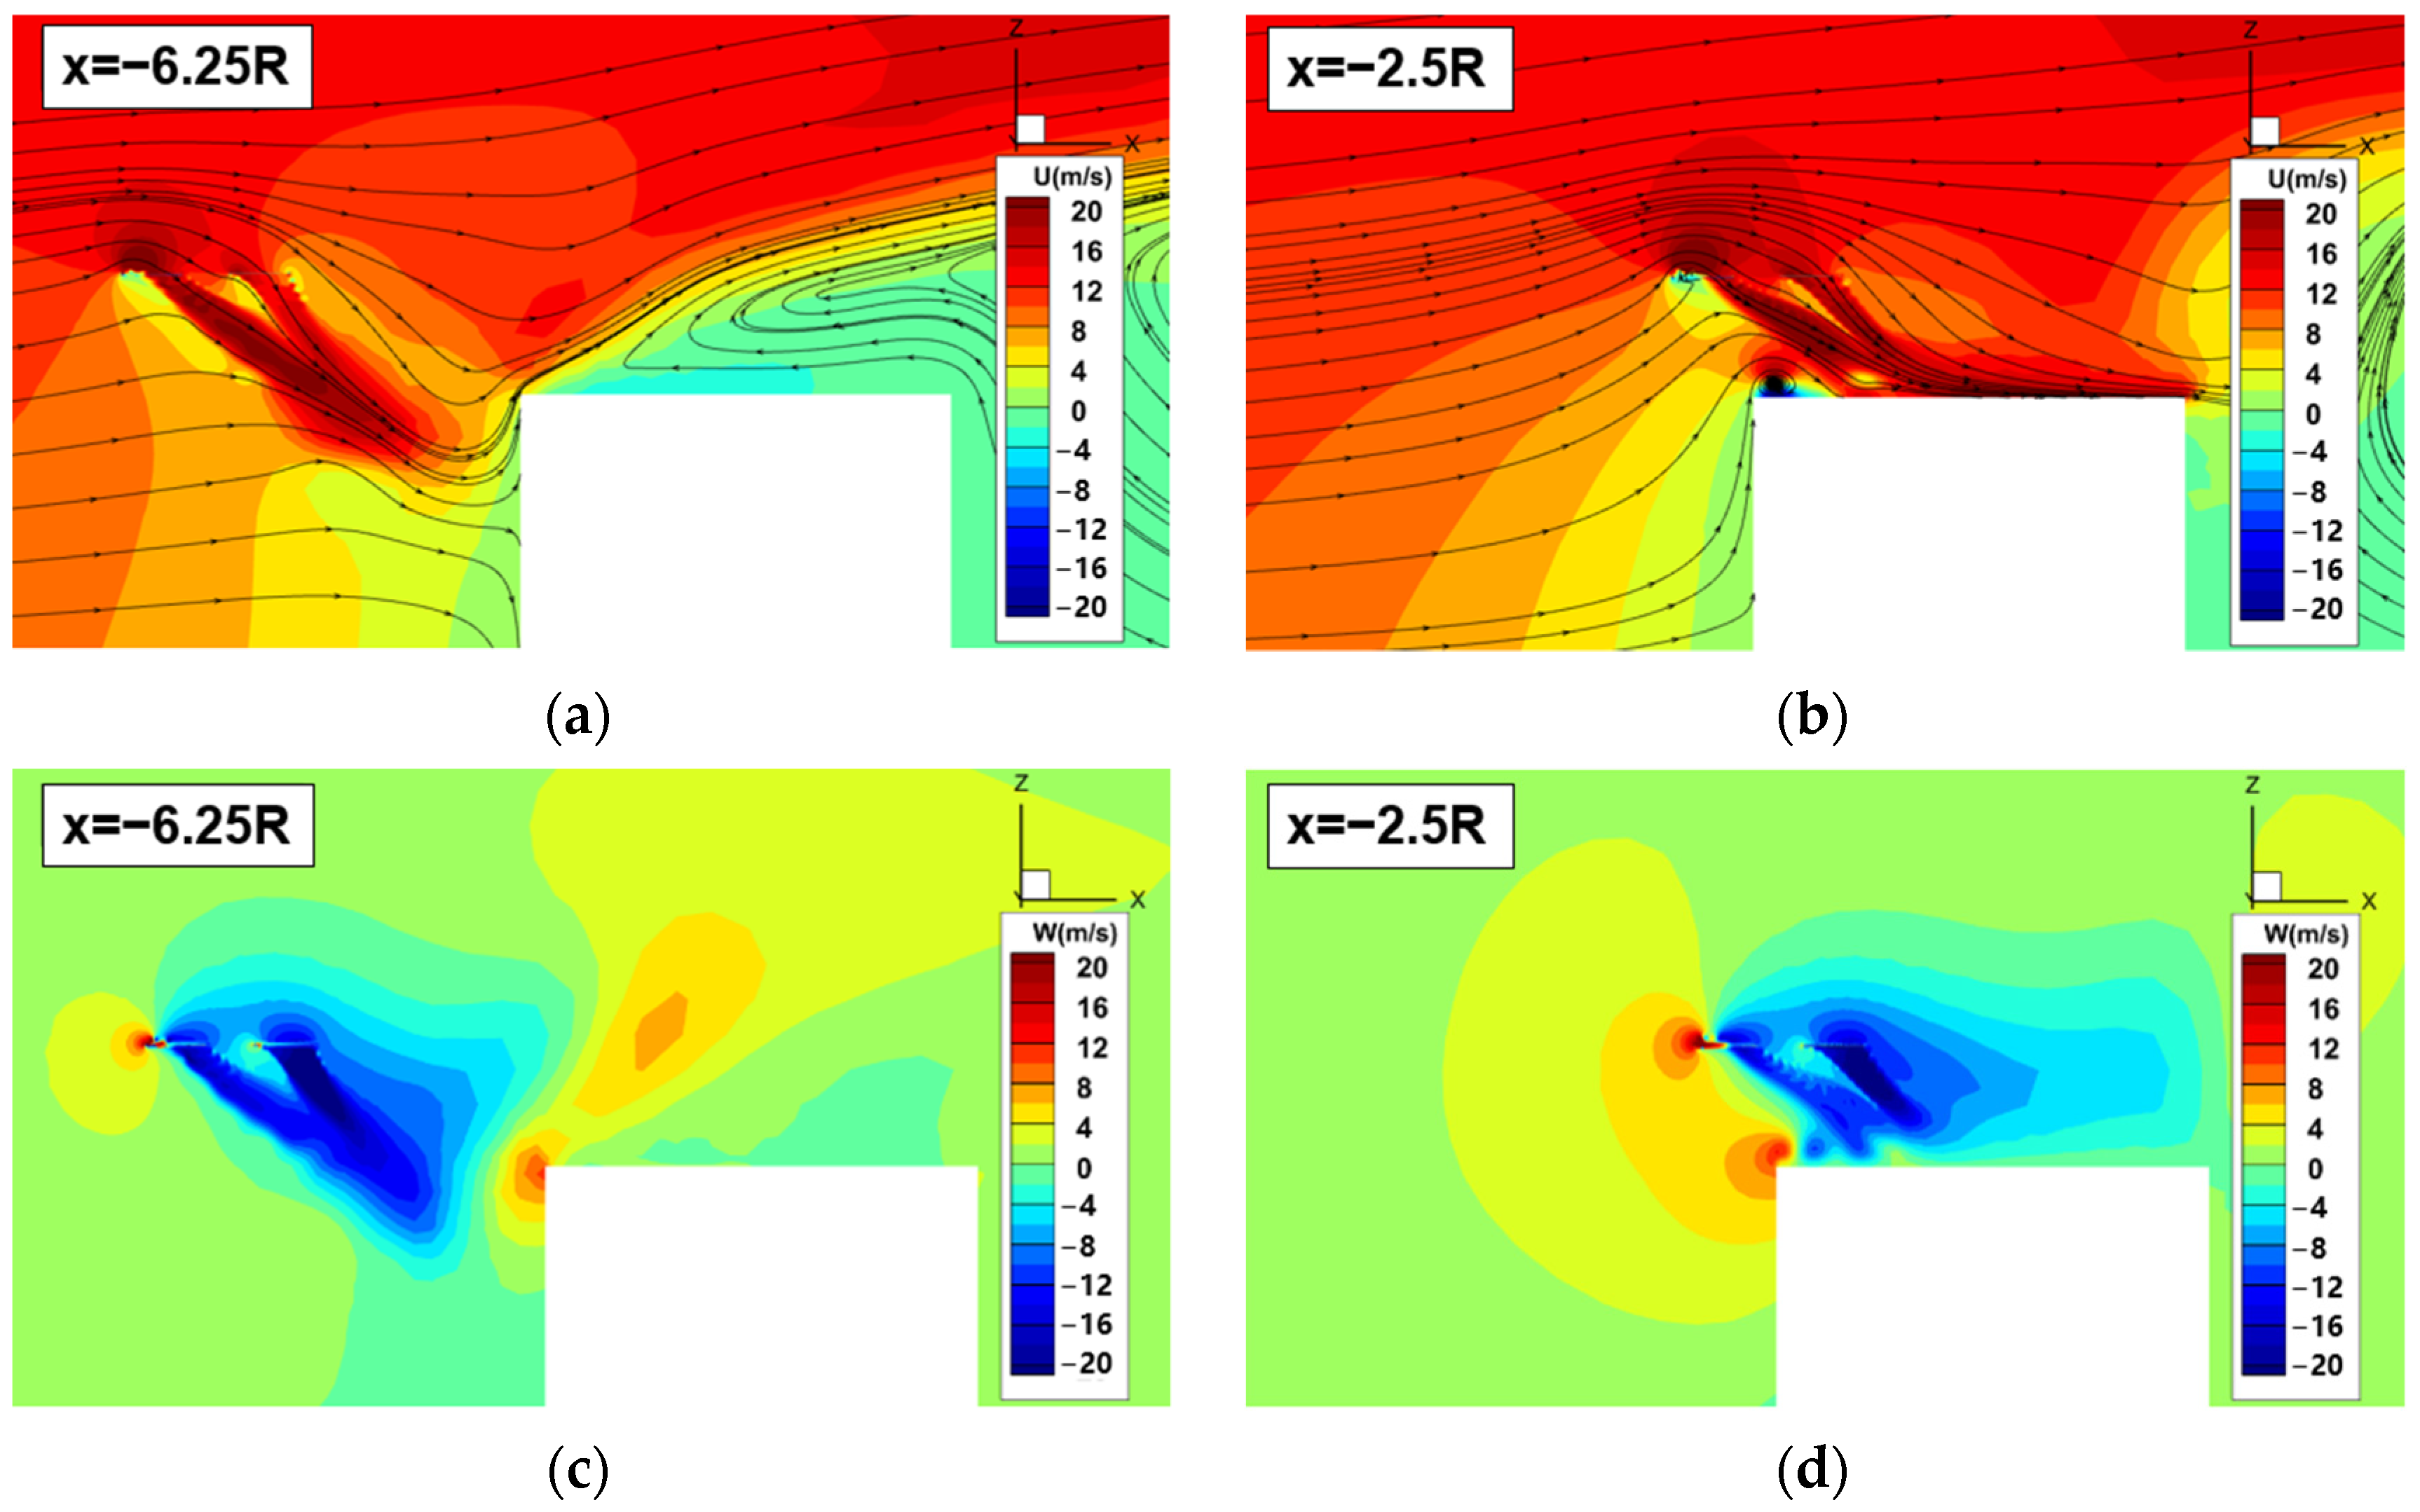
Figure 16 demonstrates the flow field when the rotor is located at the headwind side of the building. When the rotor is positioned significantly forward of the rooftop, the rotor disk is primarily present within the free shear layer. The downwash flow is blocked by the building, accelerating the upwash airflow on the headwind side and increasing the strength of the shedding vortices from the building. When the rotor is positioned above the headwind side of the building, the rotor disk is present at the boundary between the free shear layer and the recirculation region. The headwind side experiences a strong impact from the upward airflow along the building front, leading to significant asymmetry in the inflow that can affect the pitching moment, increasing the risk of rotor overturning. Moreover, the rotor’s strong downwash flow obstructs the downwind flow of shedding vortices on the windward side of the building, and the shedding vortices at the front edge of the roof accumulate above the roof, creating a stagnation zone. On the other hand, the downwash flow generates high-velocity flow across the entire rooftop, and the impact of the airflow has the potential to cause injury to individuals or objects.
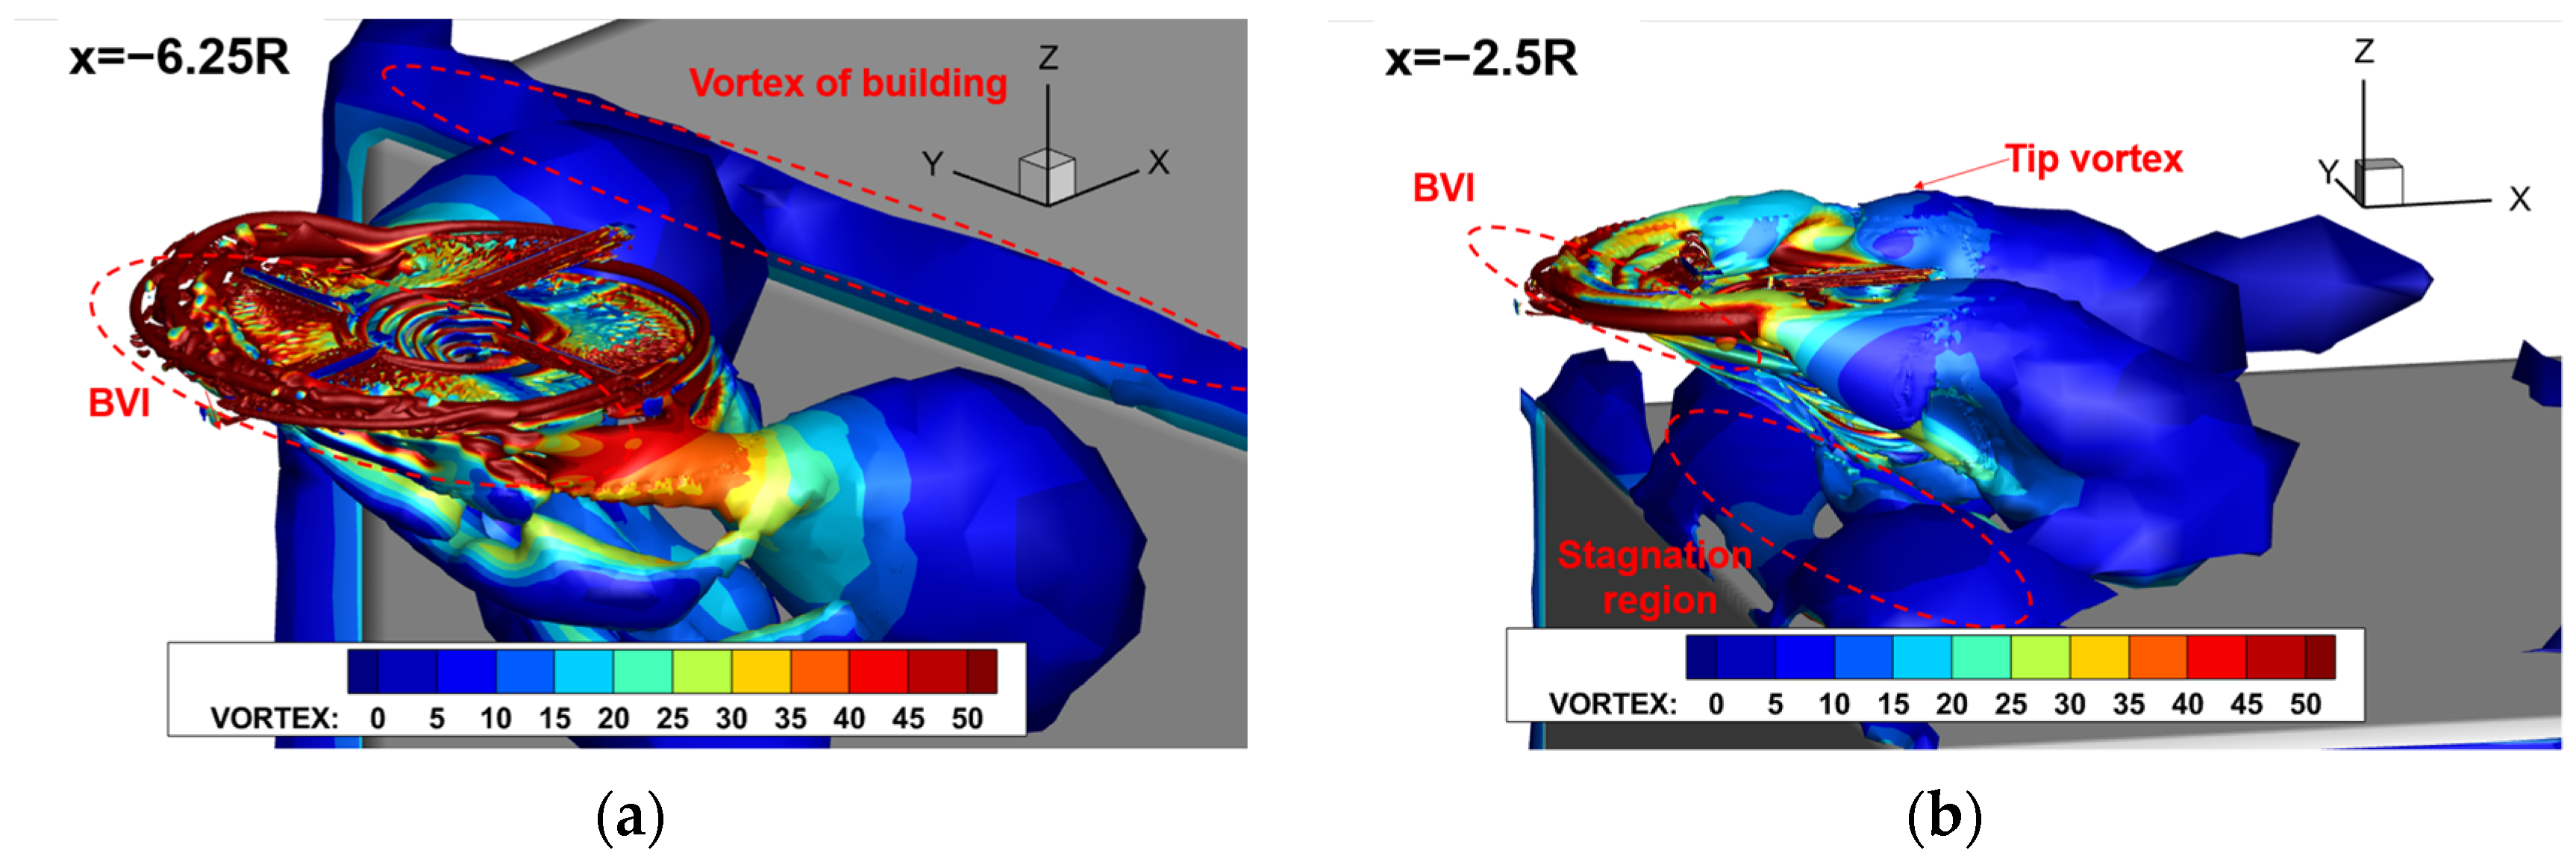
Figure 17 displays the vorticity isosurfaces when the rotor is positioned in the H-region. When x = −6.75R, the wake tilts away from the wind, and the airflow moving along the sides of the building forms a barrier, blocking the free spreading of the rotor wake. As the rotor approaches the building, the upwash airflow mixes with the horizontally blowing winds, and this mixed flow directs the blade tip vortices into the rotor, resulting in strong BVI in the 90° to 270° azimuth angles, causing severe load fluctuations and making the asymmetry of the rotor thrust distribution even worse. The downdraft and outward moving flow of the wake strongly impact the rooftop and merge with the shed vortices from the building, generating high negative pressure and rolling up vortices on the building surface.
When the rotor moves away from the building at the rear side, it enters inside the wake region of the building (Region D). Here, the peak longitudinal and vertical wind velocities are 15.5% and 10.9% of the incoming flow, respectively. As shown in Figure 18, the entire rotor is located within the low-velocity recirculation region. At the point x = 2.5R, the rotor on the headwind side experiences an increase in the ground effect and is simultaneously subjected to the upwash effect from the ambient airflow, leading to thrust loss, which to some extent diminishes the nose-up moment caused by the concentrated load on the headwind side. When the distance between the rotor rotation center and the building reaches 2R, the downwash flow becomes dominant, attracting the free shear flow outside the recirculation region above the rotor.
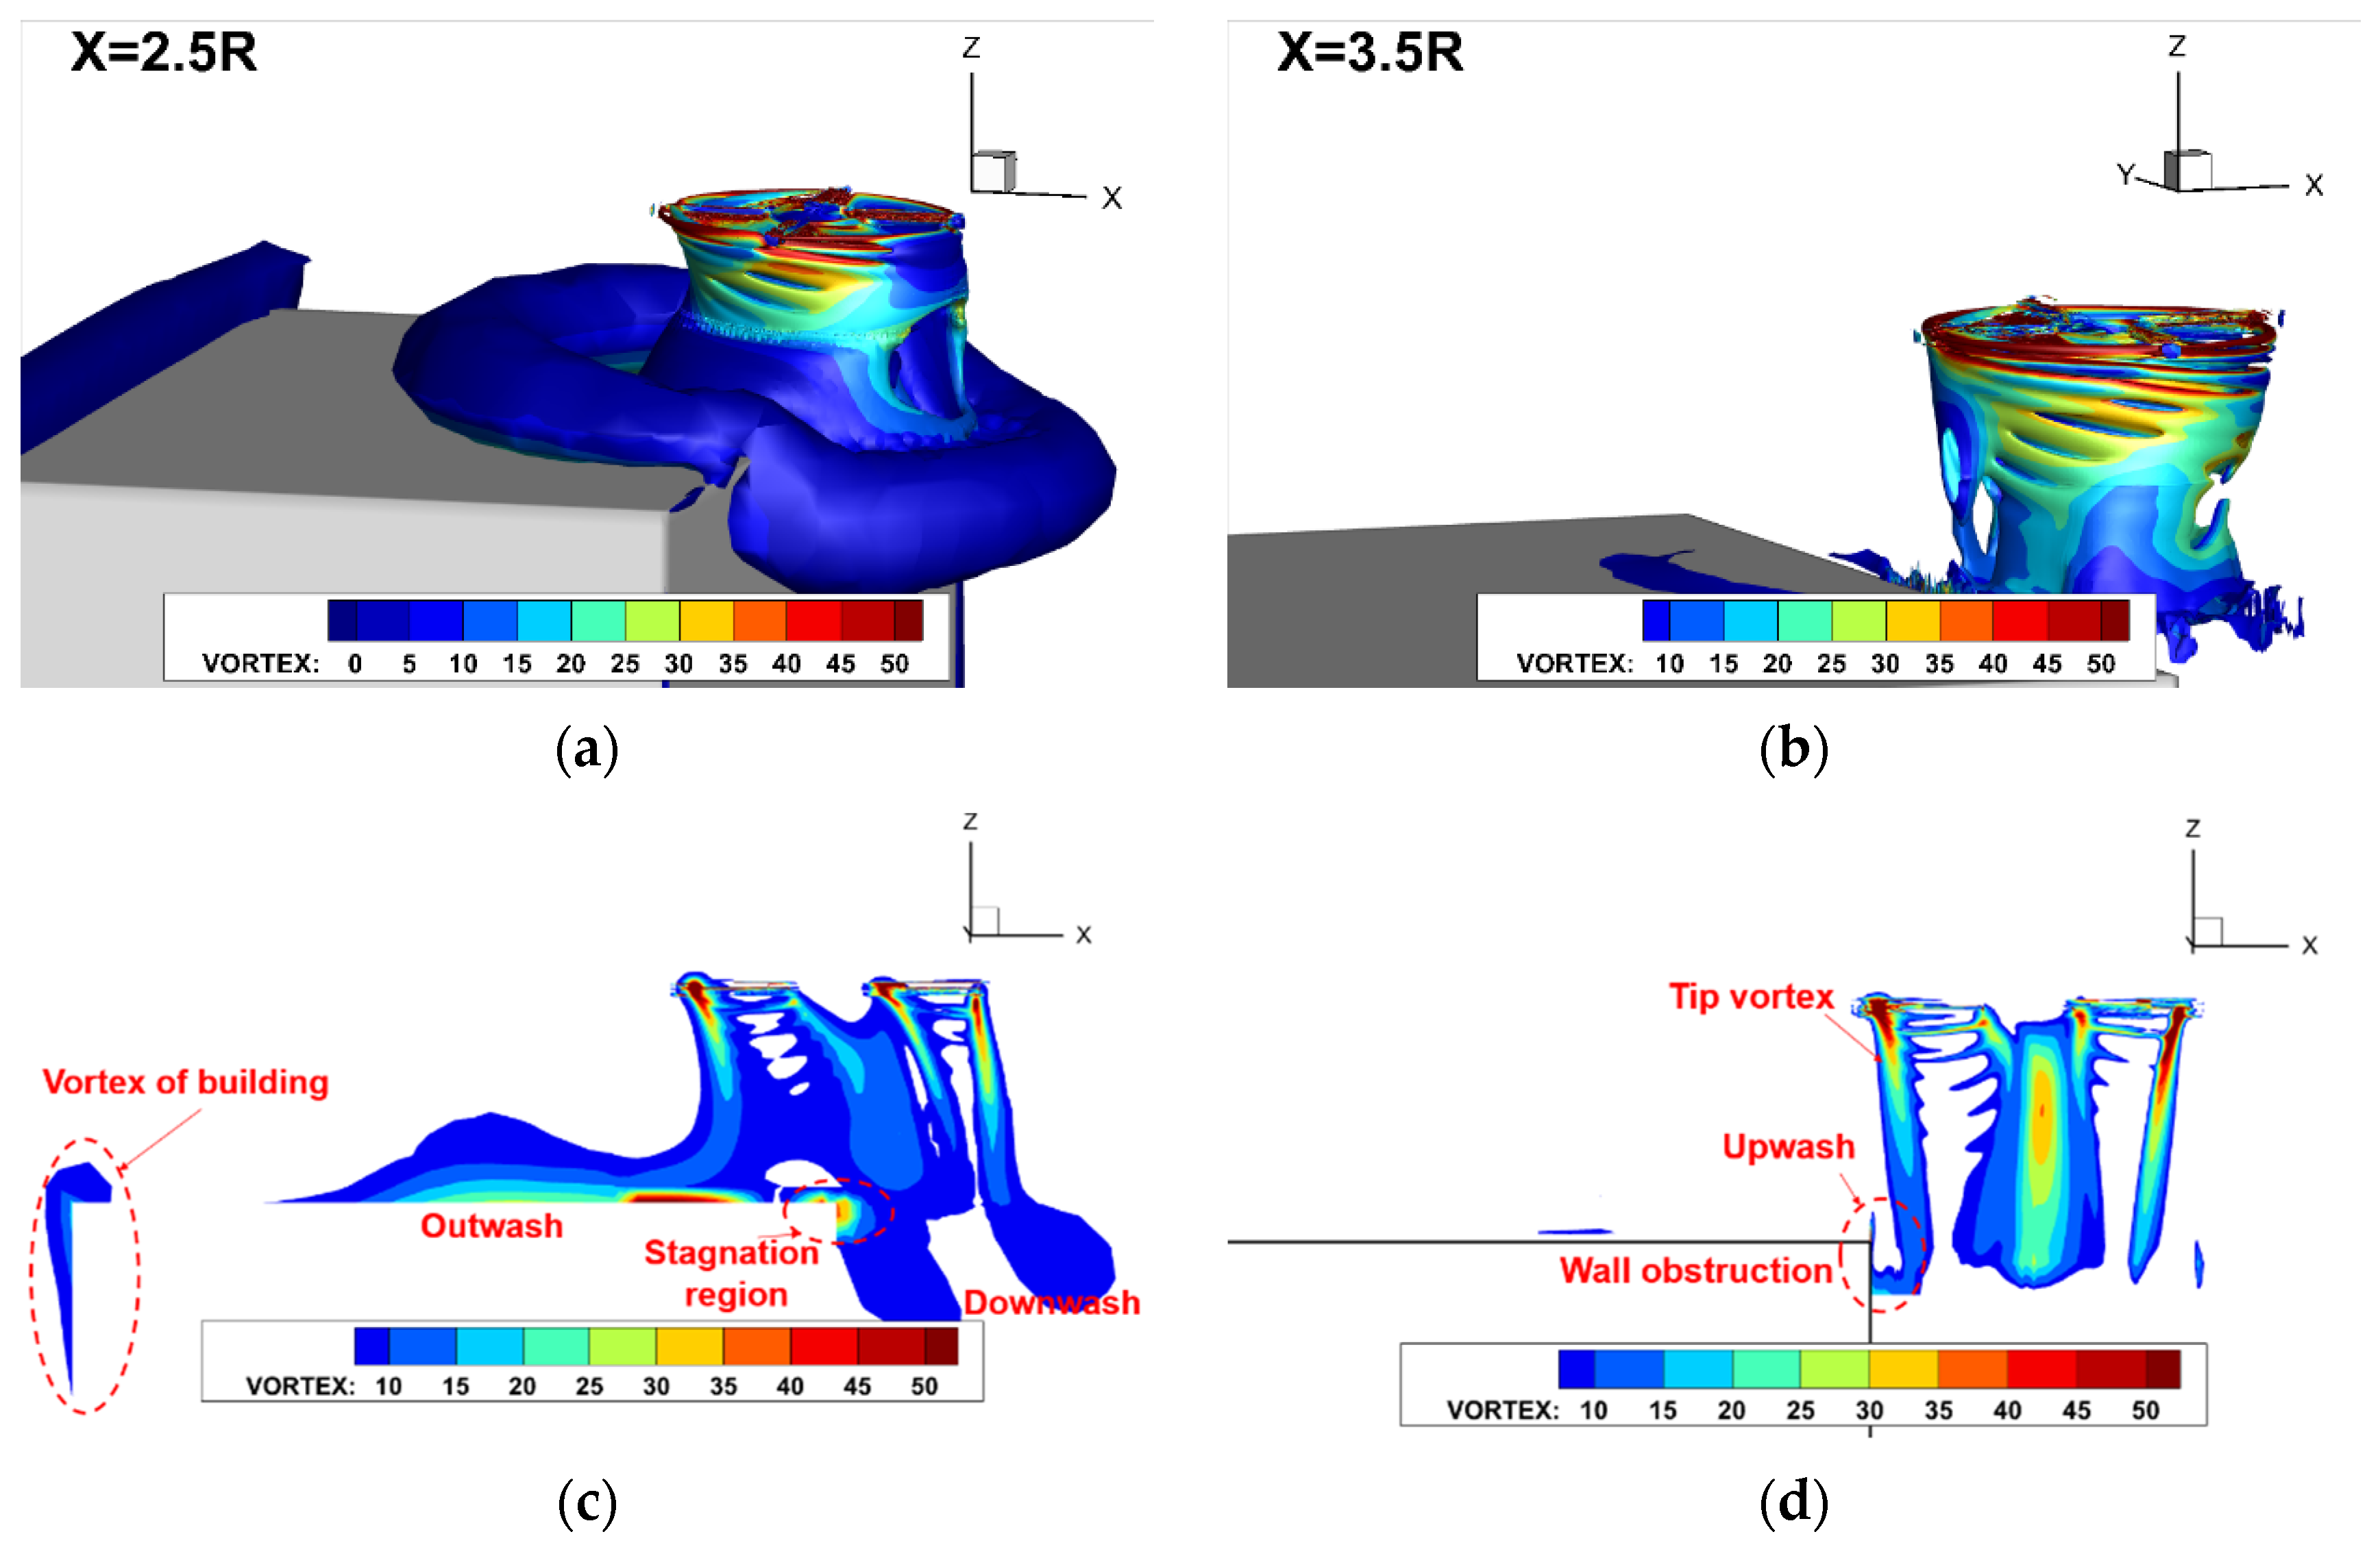
Figure 19 shows the isosurface of the Q-criterion and the distribution of the vorticity profiles for the rotor–building coupled flow field in Region D. When the rotor is positioned above the rear side of the building, the wake is irregularly blocked by the roof’s band-shaped structure, causing the downwash flow on the headwind side of the rotor to impact the roof. This results in a portion of the flow transitioning into high-velocity forward movement while another part forms vortices on the leeward wall of the building, compressing the root vortices of the rotor and the leeward wake, leading to the formation of a flow stagnation region at the building corner. As the rotor moves further away from the building, the wake’s shape becomes similar to that during hover, with a decrease in mutual flow interference in the flow field.
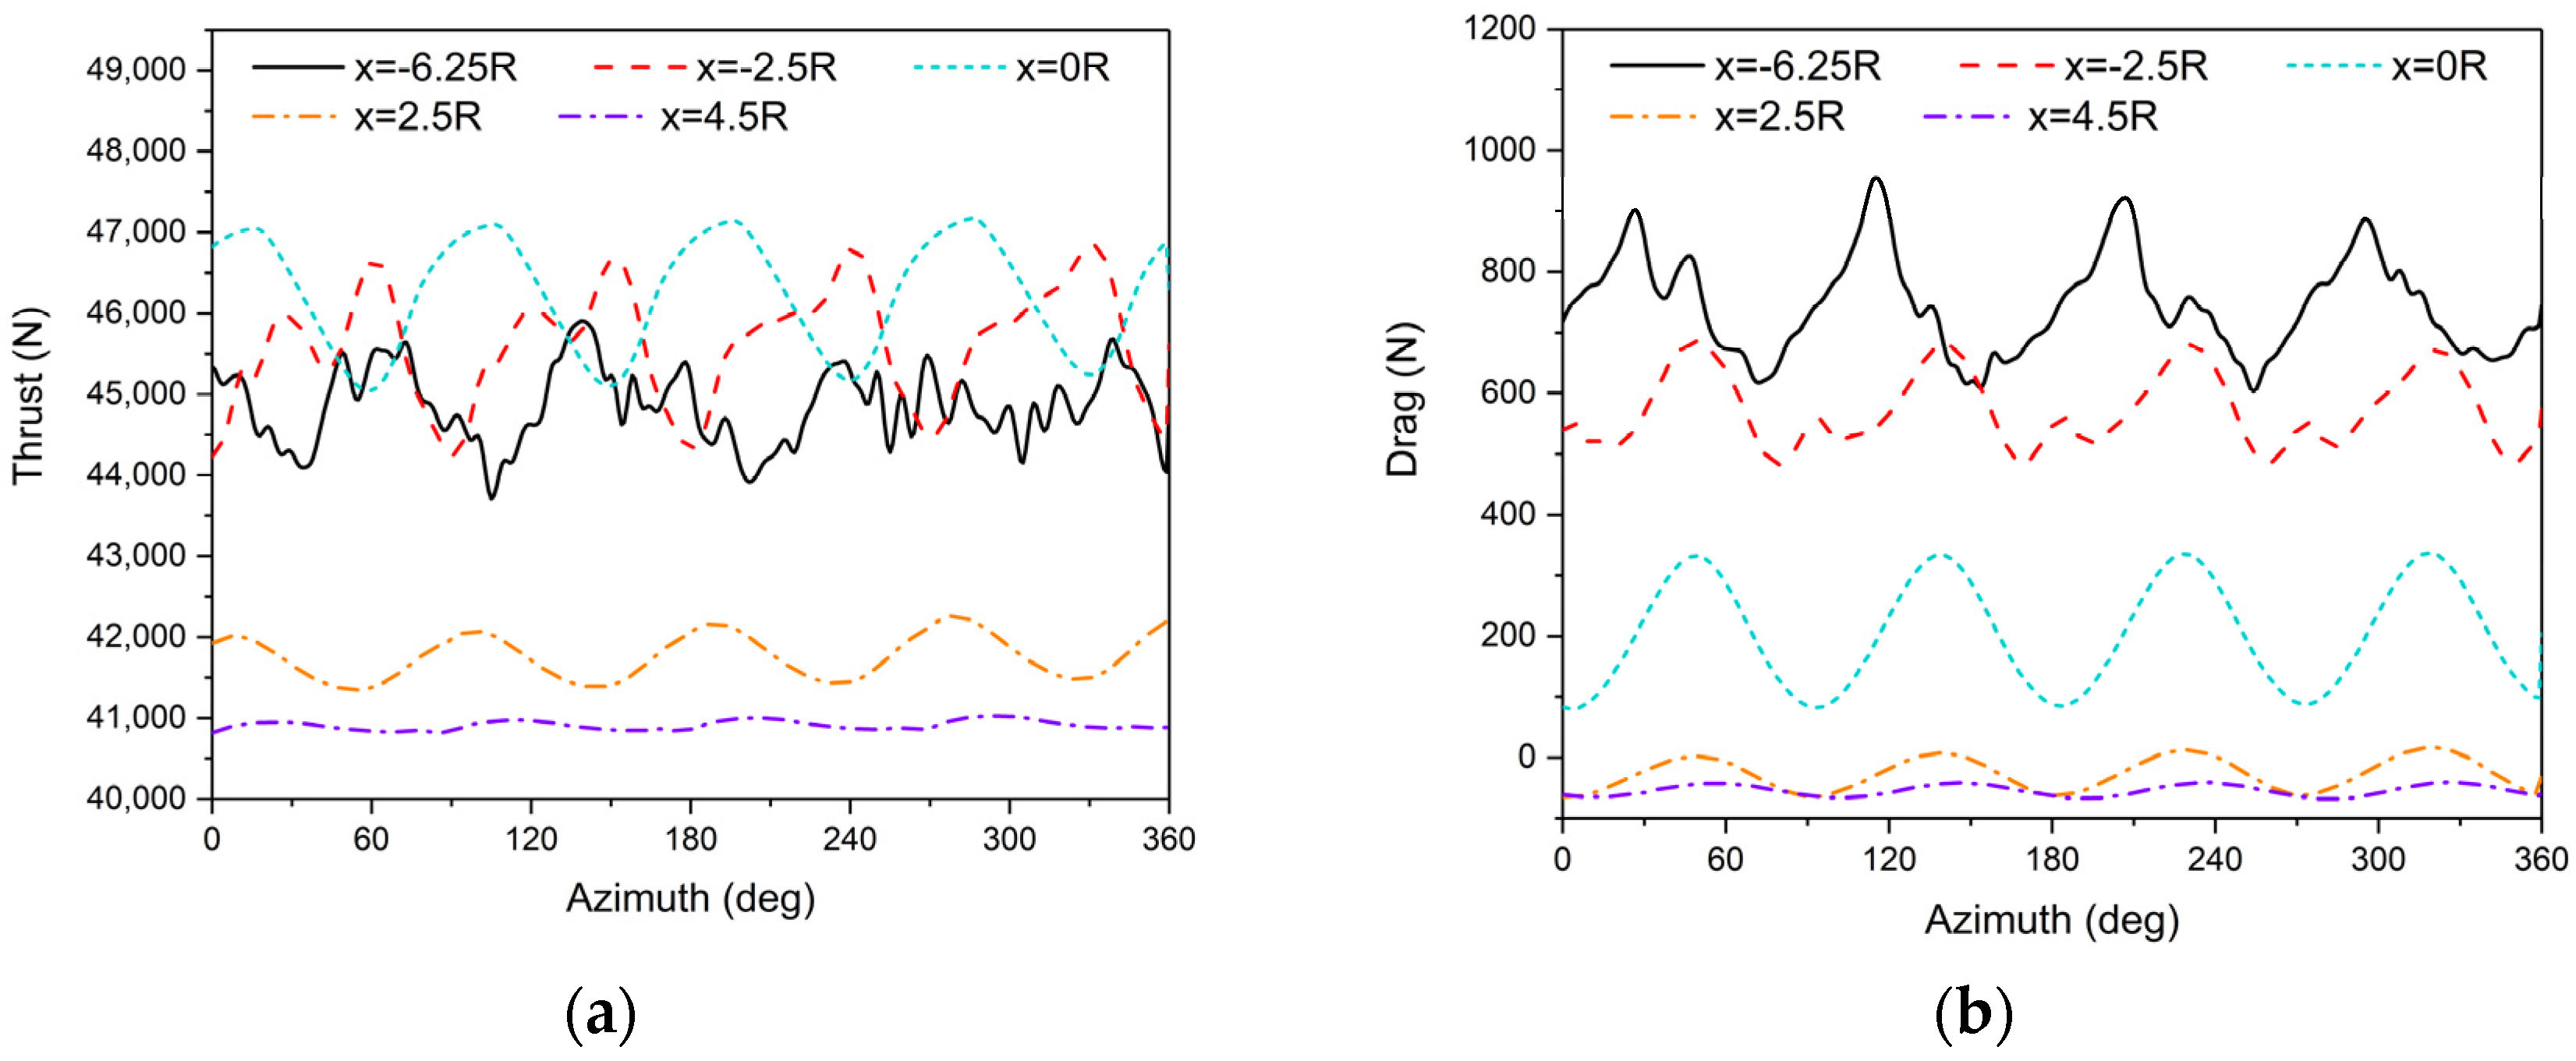
Quantitative variations in the rotor thrust and drag during one full rotation of the rotor are presented in Figure 20. In Region H, influenced by blade–vortex interaction (BVI), the rotor thrust exhibits significant unsteady fluctuations, disturbing the load distribution on the rotor and increasing drag. As the rotor enters Region D, having uniform velocity, the fluctuations in rotor thrust are reduced. The flow recirculation effect of the building causes the rotor drag to effectively point in the direction of the incoming flow.
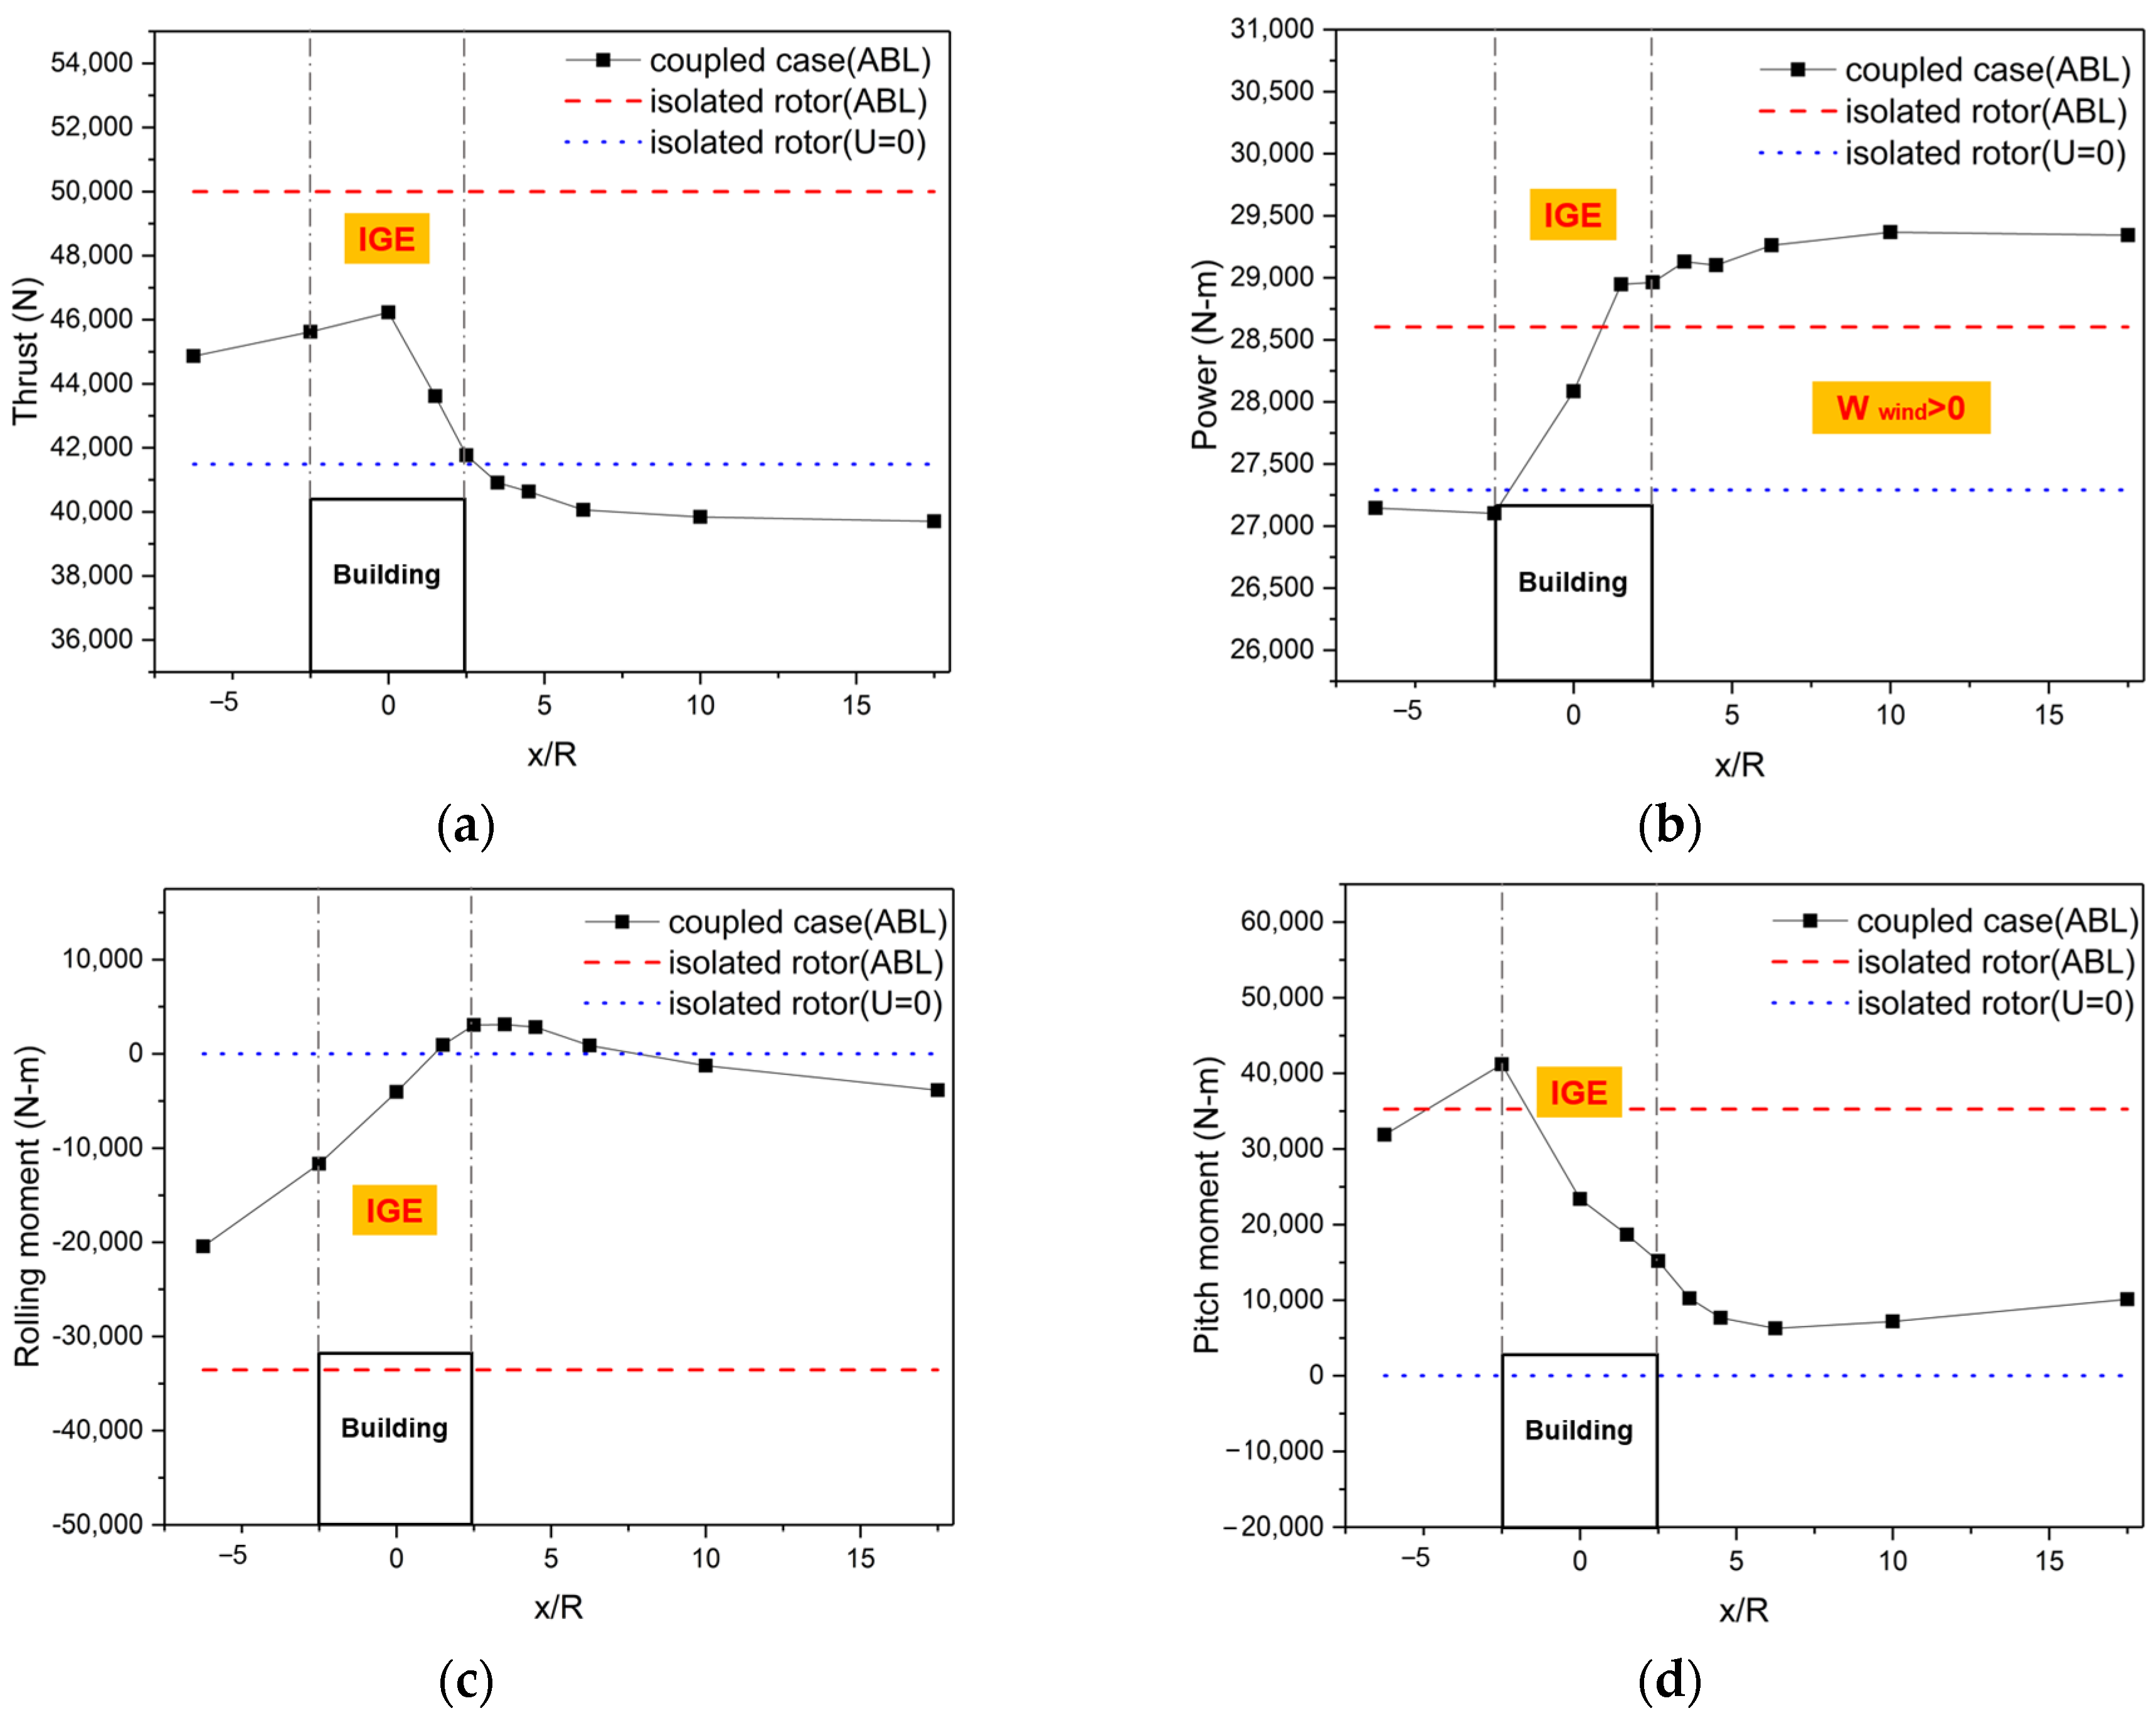
Further analysis was carried out on the interference characteristics of the rotor performance during the rearward approach process, as depicted in Figure 21. As the helicopter moves from Region D towards Region H, influenced by the headwind component of the airflow and experiencing the additional benefit of ground effect, the rotor thrust continuously increases when passing over the roof. Due to the presence of a significant +Z-direction airflow in the wake region, the rotor thrust decreases by 3.6% compared to the windless condition, resulting in a 6.5% increase in power consumption and a significant 11.4% decrease in average hover efficiency. As discussed earlier, an increase in the incoming flow velocity leads to a corresponding increase in the recirculation velocity, bringing about substantial power losses and potentially leading to a vortex ring state.
For the counterclockwise rotating rotor under consideration, during the process of approaching the building from the rear to the headwind region, the asymmetric inflow results in a continuous increase in the right roll moment. In the pitch direction, particular attention is required as a sudden increase in the pitching moment occurs when passing over the front side of the roof, with a magnitude increase of up to 76% compared to positions further back. When flight tasks necessitate passing over the headwind side, the helicopter must ascend to heights outside the upwash airflow influence region. Ultimately, during the rearward approach process, the rotor lift-to-drag ratio and hover figure of merit gradually increase, remaining in a state of thrust loss but in a relatively stable flow field environment.
Afterward, analysis was conducted on the coupled flow field interference characteristics and rotor performance variations during the lateral approach process. Figure 22 illustrates the vorticity isosurfaces at different positions of the rotor near the building’s side. On one hand, the rotor on the headwind side is influenced by the upwash airflow, exhibiting the BVI phenomenon; on the other hand, from the top view, it can be observed that the crosswind on the building side causes significant distortion of the wake. As the age angle of the vortices increases, the wake undergoes radial contraction, leading to the accumulation of root vortices beneath the rotor. Strong vortex–vortex interactions occur within the radial space enclosed by the tip vortices, with some of the wake vortices being pushed back into the rotor disk. This phenomenon is particularly pronounced at the 1R position on the building side.
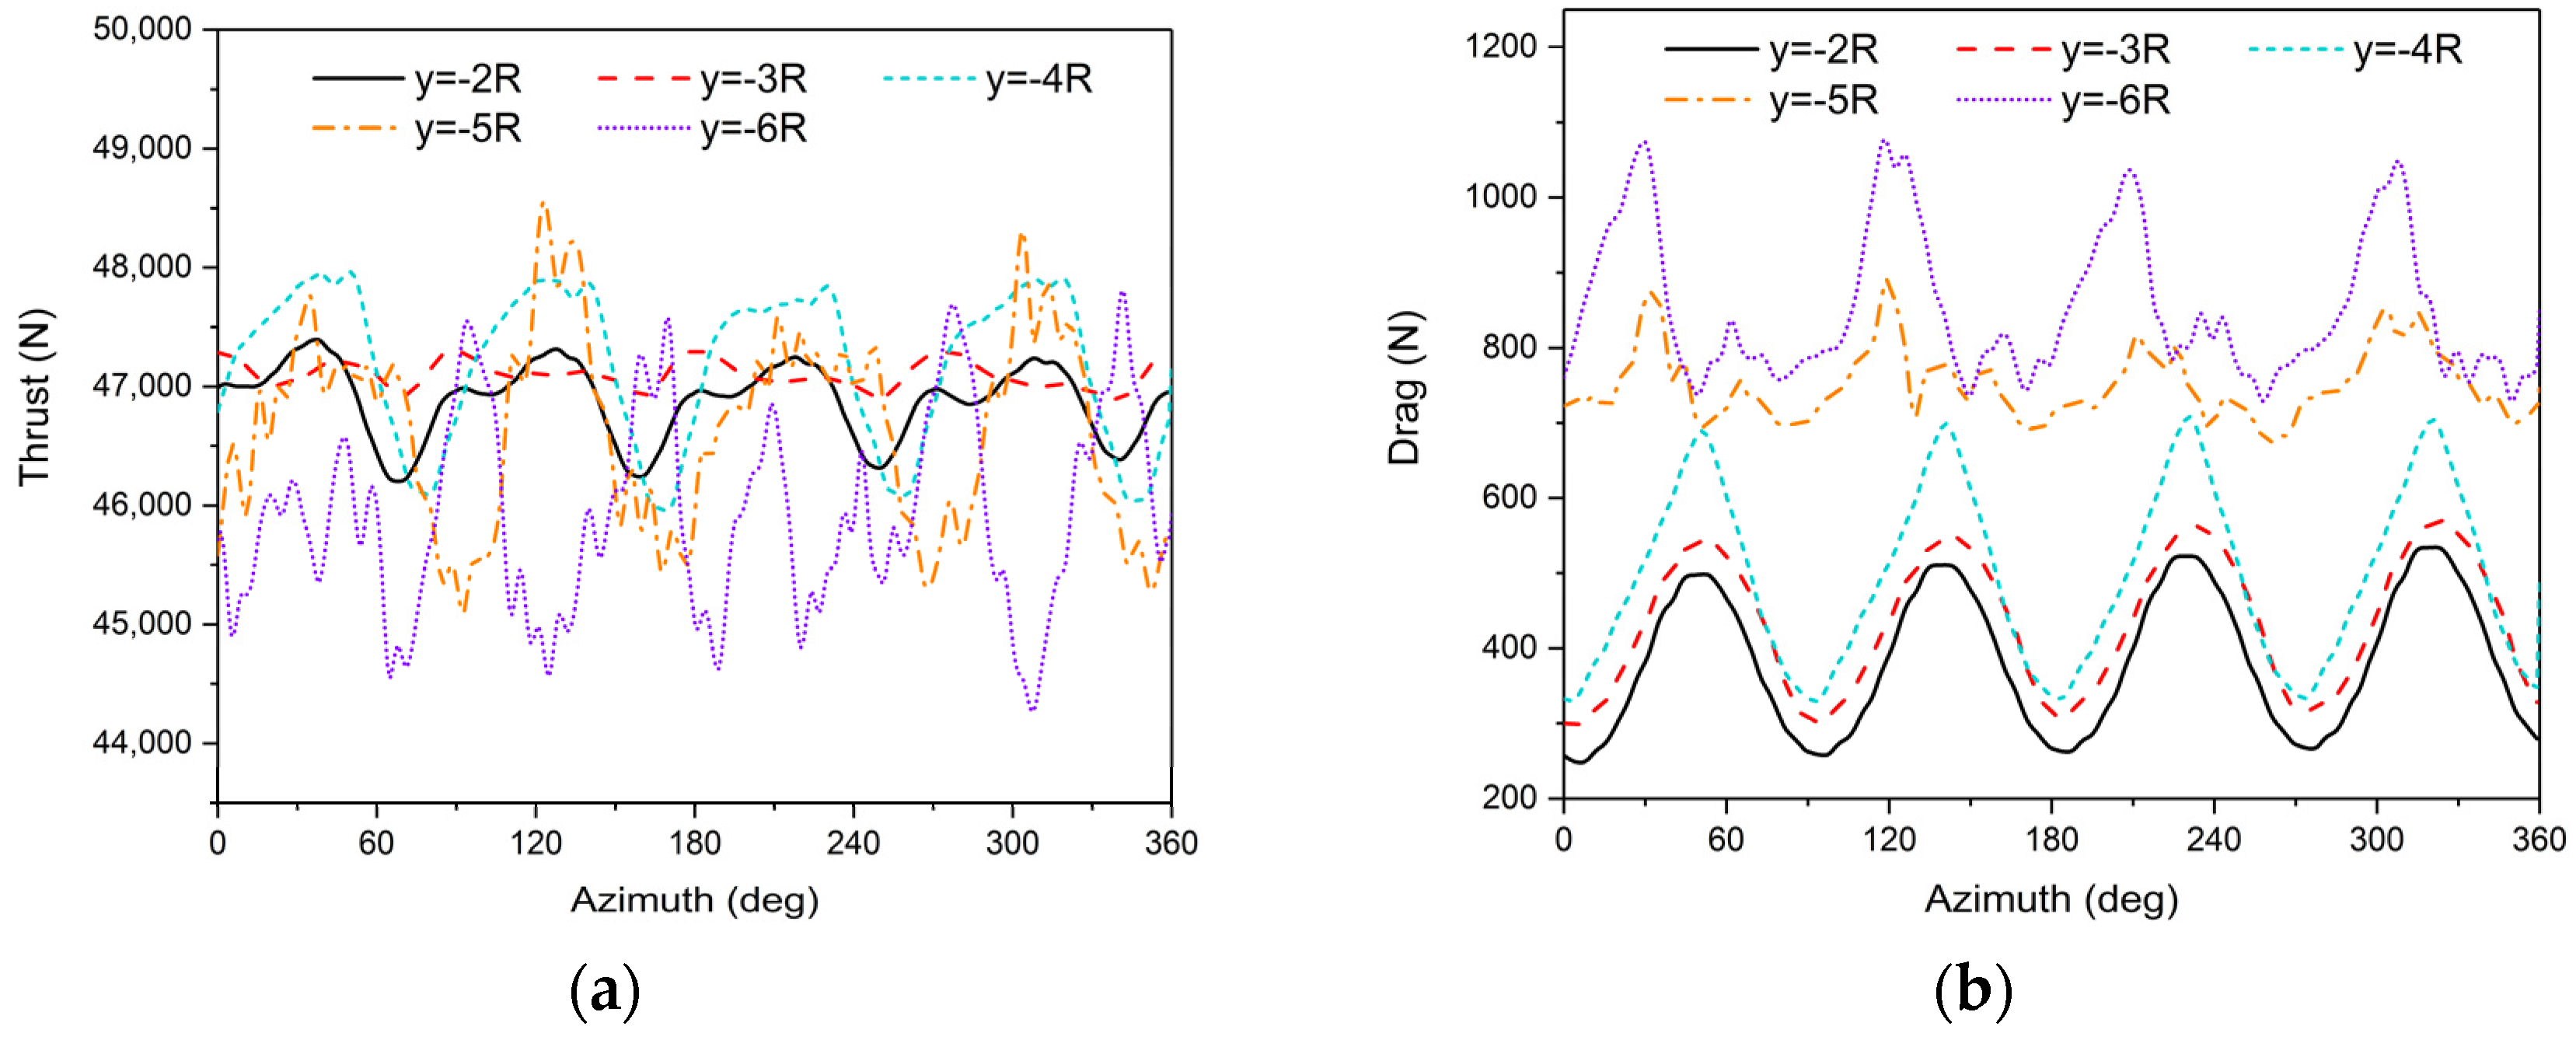
Figure 23 depicts the variations in rotor thrust and drag as the rotor completes one revolution at different lateral approach positions. The significant load fluctuations at the building side y = −5R and y = −6R positions clearly demonstrate the strong, unsteady characteristics induced by blade–vortex interaction (BVI) interference. As the rotor continues to move towards the area above the roof, the oscillations in rotor drag tend to stabilize, and throughout the entire lateral shift to the left side, the rotor drag gradually decreases.
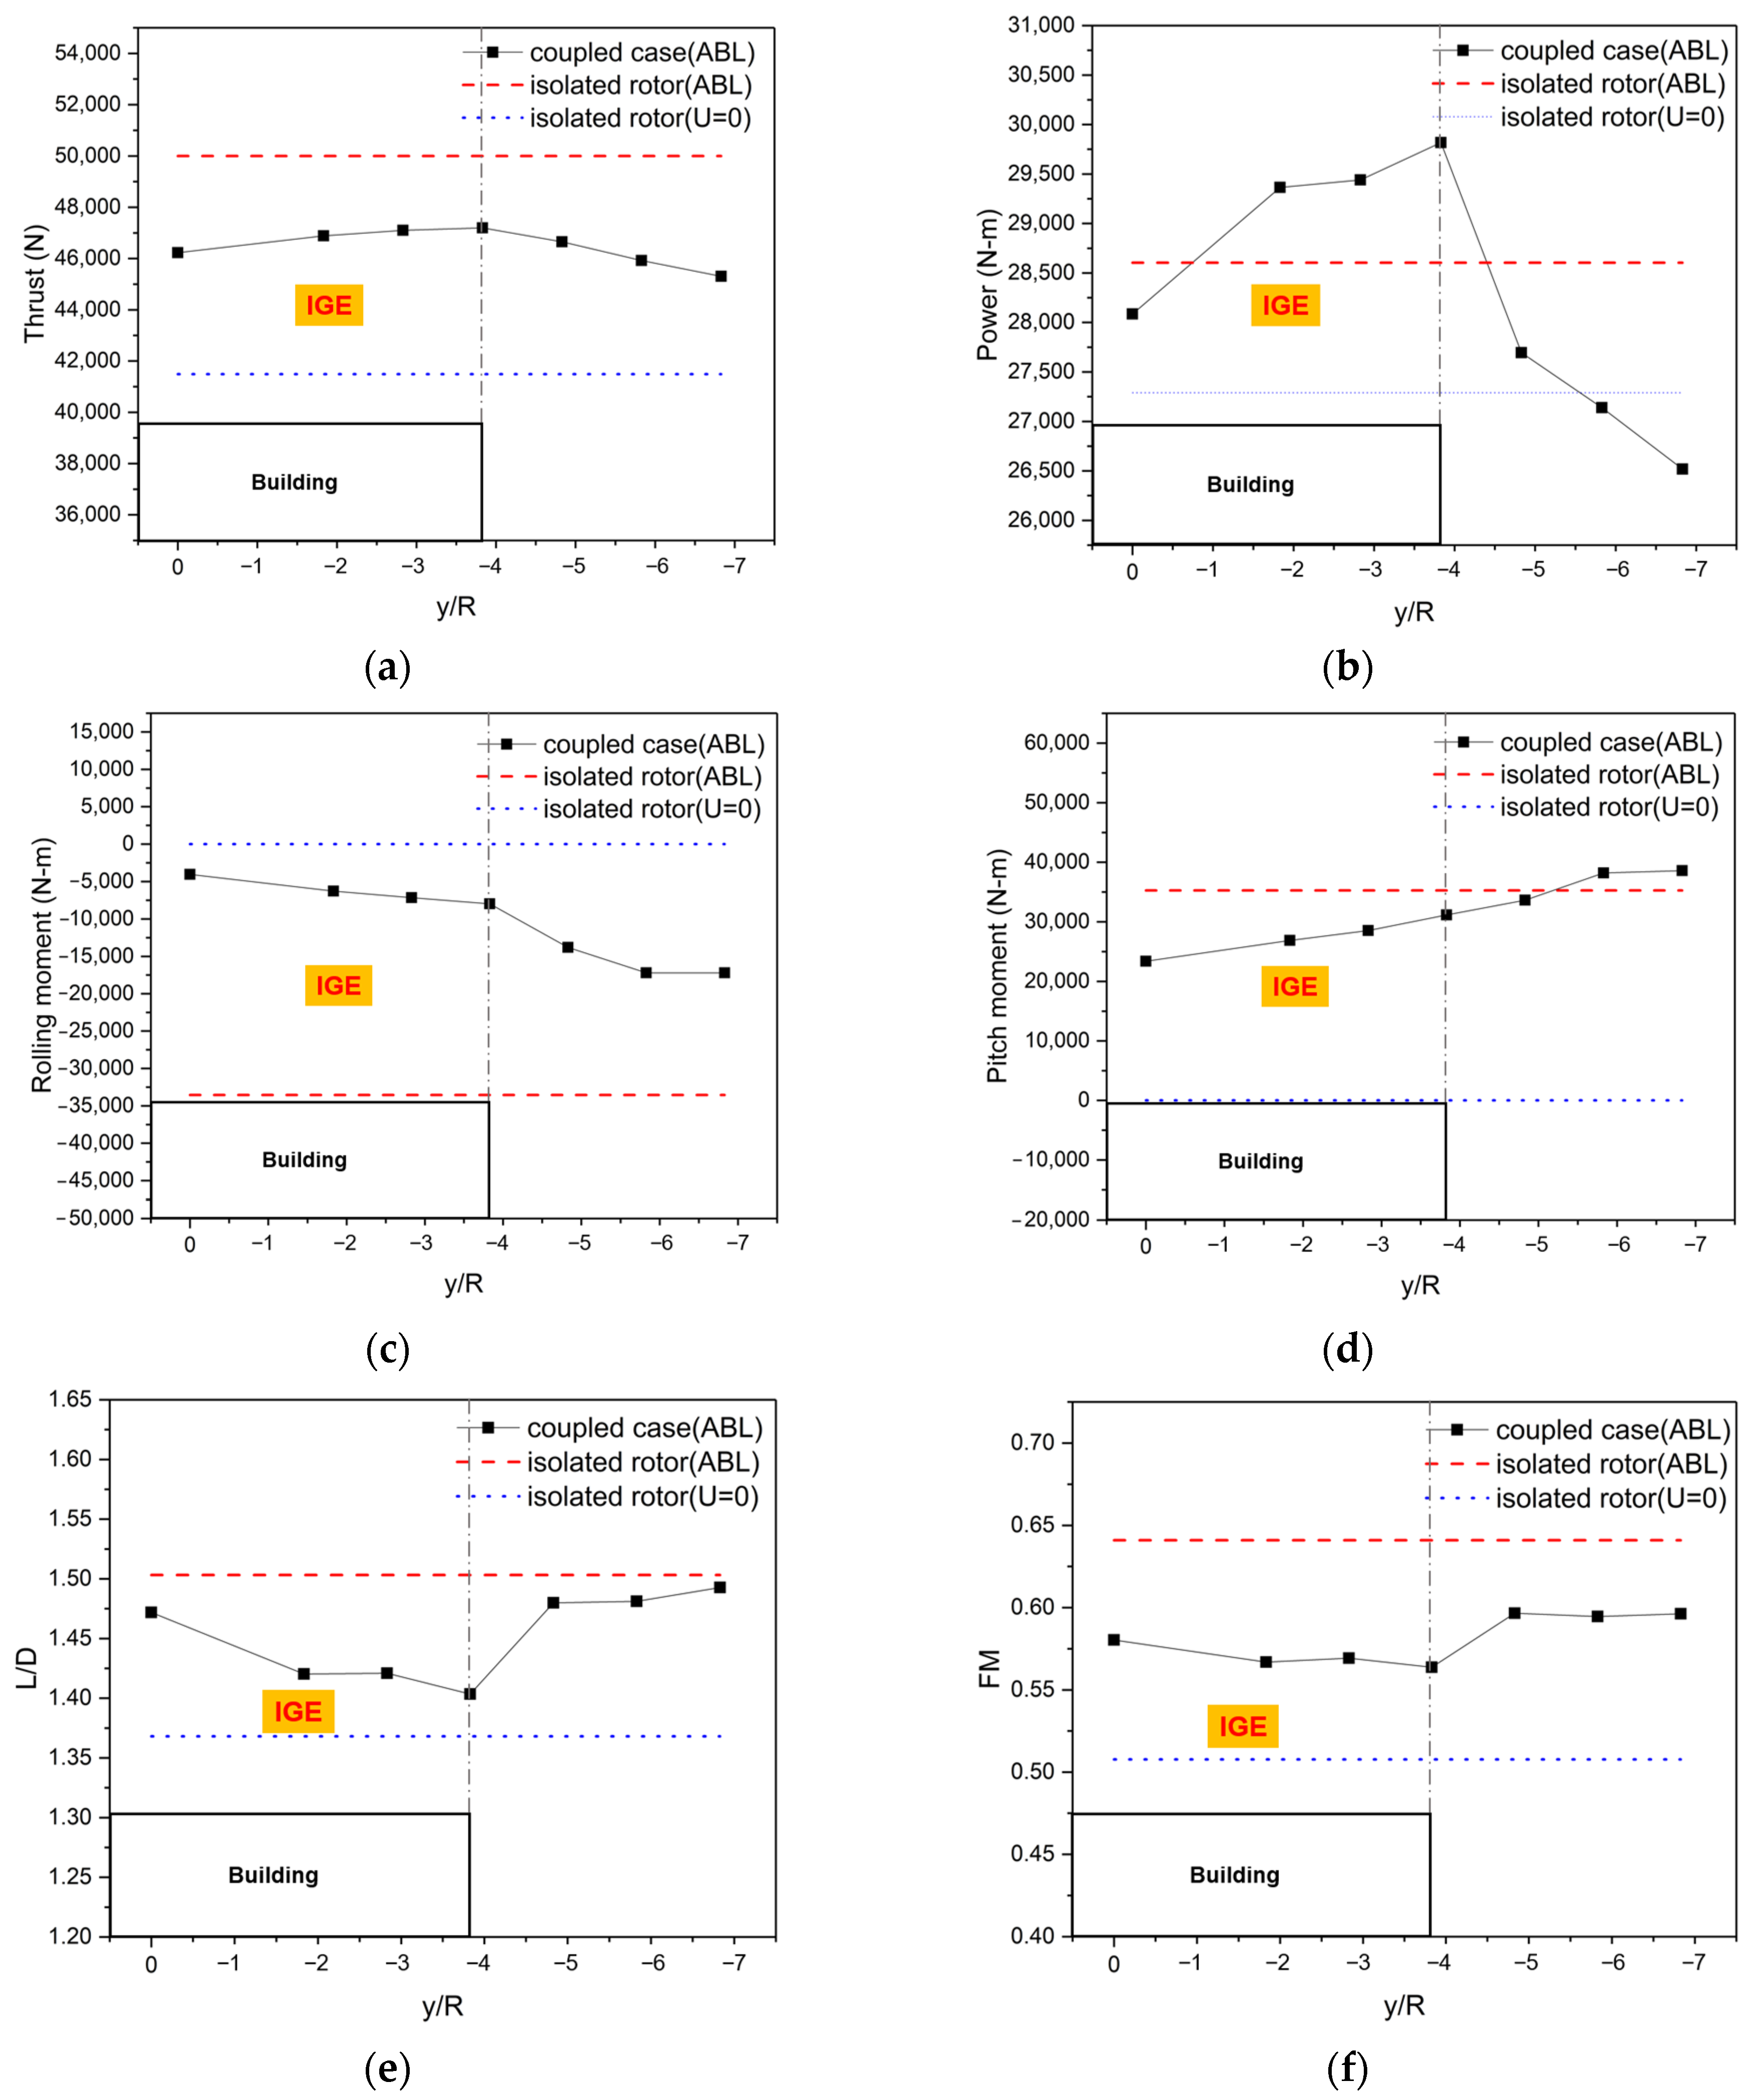
Figure 24 depicts a further analysis of averaged rotor performance when it moves in the lateral direction. The figure shows that the variations in rotor thrust, rolling, and pitching moments are smooth with respect to y, and that unsteady characteristics of the interaction between the flow field and building perimeter were not captured for the lateral movement of the rotor. When the rotor passes over the sides of the building, an increase in thrust is accompanied by a sudden increment in the associated power consumption. Therefore, during the left-sided approach, the rotor experiences a combined effect of lateral winds from the building side and wake suction in Region S, undergoing intense unsteady disturbances. The lift-to-drag ratio and figure of merit decrease initially, and then increase, reaching a minimum when passing over the lateral eaves.
It is noteworthy that the fluctuations in the rotor thrust in the advancing and retreating sides lead to a right-rolling moment. As the rotor approaches the rooftop from the left side, entering the semi-ground effect region, the retreating side downwash first encounters the ground. The ground effect gain partially increases the disruption in rotor load distribution without causing a sudden change in the rolling moment. It can be inferred that when approaching from the right side, the concentration of advancing side loads will be amplified by the ground effect, posing a risk of lateral overturning.

5. Conclusions

This study has developed a numerical simulation method suitable for simulating the coupled flow field of buildings and rotors under ABL. Research has been conducted through the simulation of isolated buildings, isolated rotors, and rotor–building coupled flow fields under the atmospheric boundary layer. This study focuses on building-induced velocity distribution and coupled vortex structures, analyzing the transient and time-averaged characteristics of rotors under flow field disturbances. The following conclusions have been drawn:
  • The numerical simulation method based on the RANS equations established in this study is suitable for calculating the coupled flow field disturbances between buildings and rotors. The overset grid method effectively handles the large-scale motion of rotors, while the Realizable k ε model accurately captures the flow separation on building surfaces and the shear flow around buildings, enabling the precise prediction of rotor load variations under building disturbances.
  • Under atmospheric boundary conditions, extensive low-velocity vortex regions are observed at the rooftop, building sides, and in the wake region, with significant flow separation within two times the height of the building downstream of the rooftop position. On the Beaufort wind scale of 3–7, the building flow field operates within a self-similar Reynolds number region, where normalized flow velocities remain mostly constant. This characteristic provides a convenient approach for studying the safe flight envelope of helicopters around buildings.
  • During low-altitude hovering over building-induced turbulent airflow, the forward flow wakes mix with the building shed vortices, leading to flow circulation entering the rotor’s advancing side, resulting in a thrust loss of approximately 7.8% and generating a strong pitching moment. During rooftop takeoff, the rotor experiences an initial increase, followed by a decrease in thrust. Peak thrust is observed near the 1R position above the rooftop.
  • Airflow on the headwind side of the building rises along the wall and impacts the rotor, leading to a 76% increase in pitching moment at the headwind eaves compared to the rearward positions. The area within 2R above the headwind eaves is identified as a hazardous region that must be avoided. The flow environment during the rearward approach is relatively stable, but the rotor consistently operates in a thrust loss state, with an average hover figure of merit loss of 11.4% in the wake region.
  • During the crosswind approach, the wake experiences distortion, with radial contraction occurring as the age of the vortices increases. Strong vortex–vortex interactions occur as the root vortices converge below the rotor, leading to severe BVI and intense unsteady oscillations in rotor loads. When a counterclockwise rotating rotor adopts a left-side path during a crosswind approach, the semi-ground effect gain can increase the load concentration caused by non-uniform inflow velocities and reduce the sudden changes in roll moment that could lead to lateral overturning hazards.

Author Contributions

Conceptualization, G.X.; methodology, Y.S.; validation, Y.L.; data curation, Y.L.; writing—original draft preparation, Y.L.; writing—review and editing, Y.L., A.A. and Y.S.; visualization, Y.L. and A.A. All authors have read and agreed to the published version of the manuscript.

Funding

This research was funded by National Natural Science Foundation of China: 11972190.

Data Availability Statement

The data that support the findings of this study are available on request from the corresponding author, upon reasonable request.

Conflicts of Interest

The authors declare no conflict of interest.

References

  1. Yi, Z.; Li, R.; Feng, L.; Wu, Y.; Niu, J.; Gao, N. Boundary Layer Wind Tunnel Tests of Outdoor Airflow Field around Urban Buildings: A Review of Methods and Status. Renew. Sustain. Energy Rev. 2022, 167, 112717. [Google Scholar]
  2. U.S. Joint Helicopter Safety Analysis Team. The Compendium Report: The U.S. JHAST Baseline of Helicopter Accident Analysis; U.S.-JHSAT: Alexandria, VA, USA, 2011. [Google Scholar]
  3. Michael, J.B.; Lawson, R.E. Comparison of Centerline Velocity Measurements Obtained around 2d and 3d Building Arrays in a Wind Tunnel. In Proceedings of the International Society of Environmental Hydraulics Conference, Tempe, AZ, USA, 5–8 December 2001. [Google Scholar]
  4. Zhao, Y.H.; Liu, J.; Carmeliet, J. Physics-Based Stitching of Multi-Fov Piv Measurements for Urban Wind Fields. Build. Environ. 2021, 205, 108306. [Google Scholar]
  5. Yan, M.; Hibi, K. Turbulent Measurments of the Flow Field around a High-Rise Building. Wind Eng. JAWE 1998, 76, 55–64. [Google Scholar]
  6. Shreya, A.; Wong, J.K.; Song, J.; Mercan, O.; Kushner, P.J. Assessment of the Aerodynamic Performance of Unconventional Building Shapes Using 3d Steady Rans with Sst K-Ω Turbulence Model. J. Wind Eng. Ind. Aerodyn. 2022, 225, 104988. [Google Scholar]
  7. Yoshihide, T. Flow around a High-Rise Building Using Steady and Unsteady Rans Cfd: Effect of Large-Scale Fluctuations on the Velocity Statistics. J. Wind Eng. Ind. Aerodyn. 2015, 142, 10. [Google Scholar]
  8. Yoshihide, T.; Stathopoulos, T. Cfd Simulation of near-Field Pollutant Dispersion in the Urban Environment: A Review of Current Modeling Techniques. Atmos. Environ. 2013, 79, 716–730. [Google Scholar]
  9. Abiy, F.M.; Bitsuamlak, G.T. Prospect of Les for Predicting Wind Loads and Responses of Tall Buildings: A Validation Study. J. Wind Eng. Ind. Aerodyn. 2024, 244, 105613. [Google Scholar]
  10. Fei, D.; Kareem, A. A Multi-Fidelity Shape Optimization Via Surrogate Modeling for Civil Structures. J. Wind Eng. Ind. Aerodyn. 2018, 178, 49–56. [Google Scholar]
  11. Liu, Y.S.; Miao, S.G.; Zhang, C.L.; Cui, G.X.; Zhang, Z.S. Study on Micro-Atmospheric Environment by Coupling Large Eddy Simulation with Mesoscale Model. J. Wind. Eng. Ind. Aerodyn. 2012, 108, 106–117. [Google Scholar] [CrossRef]
  12. Bert, B. Les over Rans in Building Simulation for Outdoor and Indoor Applications: A Foregone Conclusion? Build. Simul. 2018, 11, 821–870. [Google Scholar]
  13. Juan, M.G.; Bre, F. Optimization of Rans Turbulence Models Using Genetic Algorithms to Improve the Prediction of Wind Pressure Coefficients on Low-Rise Buildings. J. Wind Eng. Ind. Aerodyn. 2019, 193, 103978. [Google Scholar]
  14. Giulia, C.; Szubert, D.; Vigevano, L.; Barakos, G.N. Numerical Modelling of the Aerodynamic Interference between Helicopter and Ground Obstacles. CEAS Aeronaut. J. 2017, 8, 589–611. [Google Scholar]
  15. Johnson, C.S.; Barakos, G.N. Optimizing Rotor Blades with Approximate British Experimental Rotor Programme Tips. J. Aircr. 2014, 51, 447–463. [Google Scholar] [CrossRef]
  16. Daniele, Z.; Gibertini, G.; Giuni, M.; Green, R. Experiments on the Helicopter-Obstacle Aerodynamic Interference in Absence of External Wind. In Proceedings of the 42nd European Rotorcraft Forum, Lille, France, 5–8 September 2016. [Google Scholar]
  17. Teresa, Q. Rotor Performance in the Wake of a Large Structure. In Proceedings of the American Helicopter Society 65th Annual Forun, Grapevine, TX, USA, 27–29 May 2009. [Google Scholar]
  18. Matthias, S. Simulation of Helicopter Aerodynamics in the Vicinity of an Obstacle Using a Free Wake Panel Method. In Proceedings of the 43rd European Rotorcraft Forum, Mailand, Italien, 12–15 September 2017. [Google Scholar]
  19. Feng, T.; Sun, Y.M.; Zhou, T.; Barakos, G.N.; Green, R. Simulation of the Aerodynamic Interaction between Rotor and Ground Obstacle Using Vortex Method. CEAS Aeronaut. J. 2018, 10, 733–753. [Google Scholar]
  20. Susan, P.; Wilkinson, C. A Computational Study of Outwash for a Helicopter Operating near a Vertical Face with Comparison to Experimental Data. In Proceedings of the AIAA Modeling and Simulation Technologies Conference 2009, Chicago, IL, USA, 10–13 August 2009. [Google Scholar]
  21. Bernardo, P.; Réamonn, M.R.; Patrick, Y.; Diarmuid, B.; Philip, C.; Jennifer, K. Investigation of Helicopter Downwash Effect on Pedestrian Comfort Using Cfd. Infrastruct. Asset Manag. 2019, 8, 7. [Google Scholar] [CrossRef]
  22. Adam, D. Cfd Analysis of Rotor Wake Influence on Rooftop Helipad Operations Safety. Trans. Inst. Aviat. 2016, 242, 7–22. [Google Scholar]
  23. James, S.F.; Owen, I. An Investigation of Ship Airwakes Using Detached-Eddy Simulation. Comput. Fluids 2010, 39, 656–673. [Google Scholar]
  24. Watson, N.A.; Kelly, M.F.; Owen, I.; Hodge, S.J.; White, M.D. Computational and Experimental Modelling Study of the Unsteady Airflow over the Aircraft Carrier Hms Queen Elizabeth. Ocean Eng. 2019, 172, 562–574. [Google Scholar] [CrossRef]
  25. Regis, T.; Murman, S.M.; Horn, J.; Schmitz, S. Effects of Atmospheric Turbulence Unsteadiness on Ship Airwakes and Helicopter Dynamics. J. Aircr. 2020, 57, 534–546. [Google Scholar]
  26. Shih, T.H.; Liou, W.W.; Shabbir, A.H.; Yang, Z.; Zhu, J. A New K-ϵ Eddy Viscosity Model for High Reynolds Number Turbulent Flows. Comput. Fluids 1995, 24, 227–238. [Google Scholar] [CrossRef]
  27. Smedman-Högström, A.S.; Högström, U. A Practical Method for Determining Wind Frequency Distributions for the Lowest 200 M from Routine Meteorological Data. J. Appl. Meteorol. Climatol. 1978, 17, 942–954. [Google Scholar] [CrossRef]
  28. Frank, B.; Werner, H.; Wengle, H. Numerical Simulation of Turbulent Flow over Surface-Mounted Obstacles with Sharp Edges and Corners. J. Wind Eng. Ind. Aerodyn. 1990, 35, 129–147. [Google Scholar]
  29. Oliveira Paulo, J.; Younis, B.A. On the Prediction of Turbulent Flows around Full-Scale Buildings. J. Wind Eng. Ind. Aerodyn. 2000, 86, 203–220. [Google Scholar] [CrossRef]
  30. Fan, X.H.; Ma, C.Y.; Su, B. Introduction and Comparison of Wind Load Codes for Advanced Structure between Chinese, American and British. Adv. Mater. Res. 2013, 700, 85–88. [Google Scholar]
  31. Philippe, R. Aerodynamic Design of the Aerospatiale Sa 365n Dauphin 2 Helicopter. J. Am. Helicopter Soc. 1982, 27, 27–33. [Google Scholar]
  32. Tamura, Y.; Kawai, H.; Uematsu, Y.; Marukawa, H.; Fujii, K.; Taniike, Y. Wind Load and Wind-Induced Response Estimations in the Recommendations for Loads on Buildings, Aij 1993. Eng. Struct. 1996, 18, 399–411. [Google Scholar] [CrossRef]
  33. Daniele, Z.; Giuni, M.; Green, R. Rotor-Obstacle Aerodynamic Interaction in Hovering Flight: An Experimental SurveyIn. In Proceedings of the AHS 72nd Annual Forum, West Palm Beach, FL, USA, 17–19 May 2016. [Google Scholar]
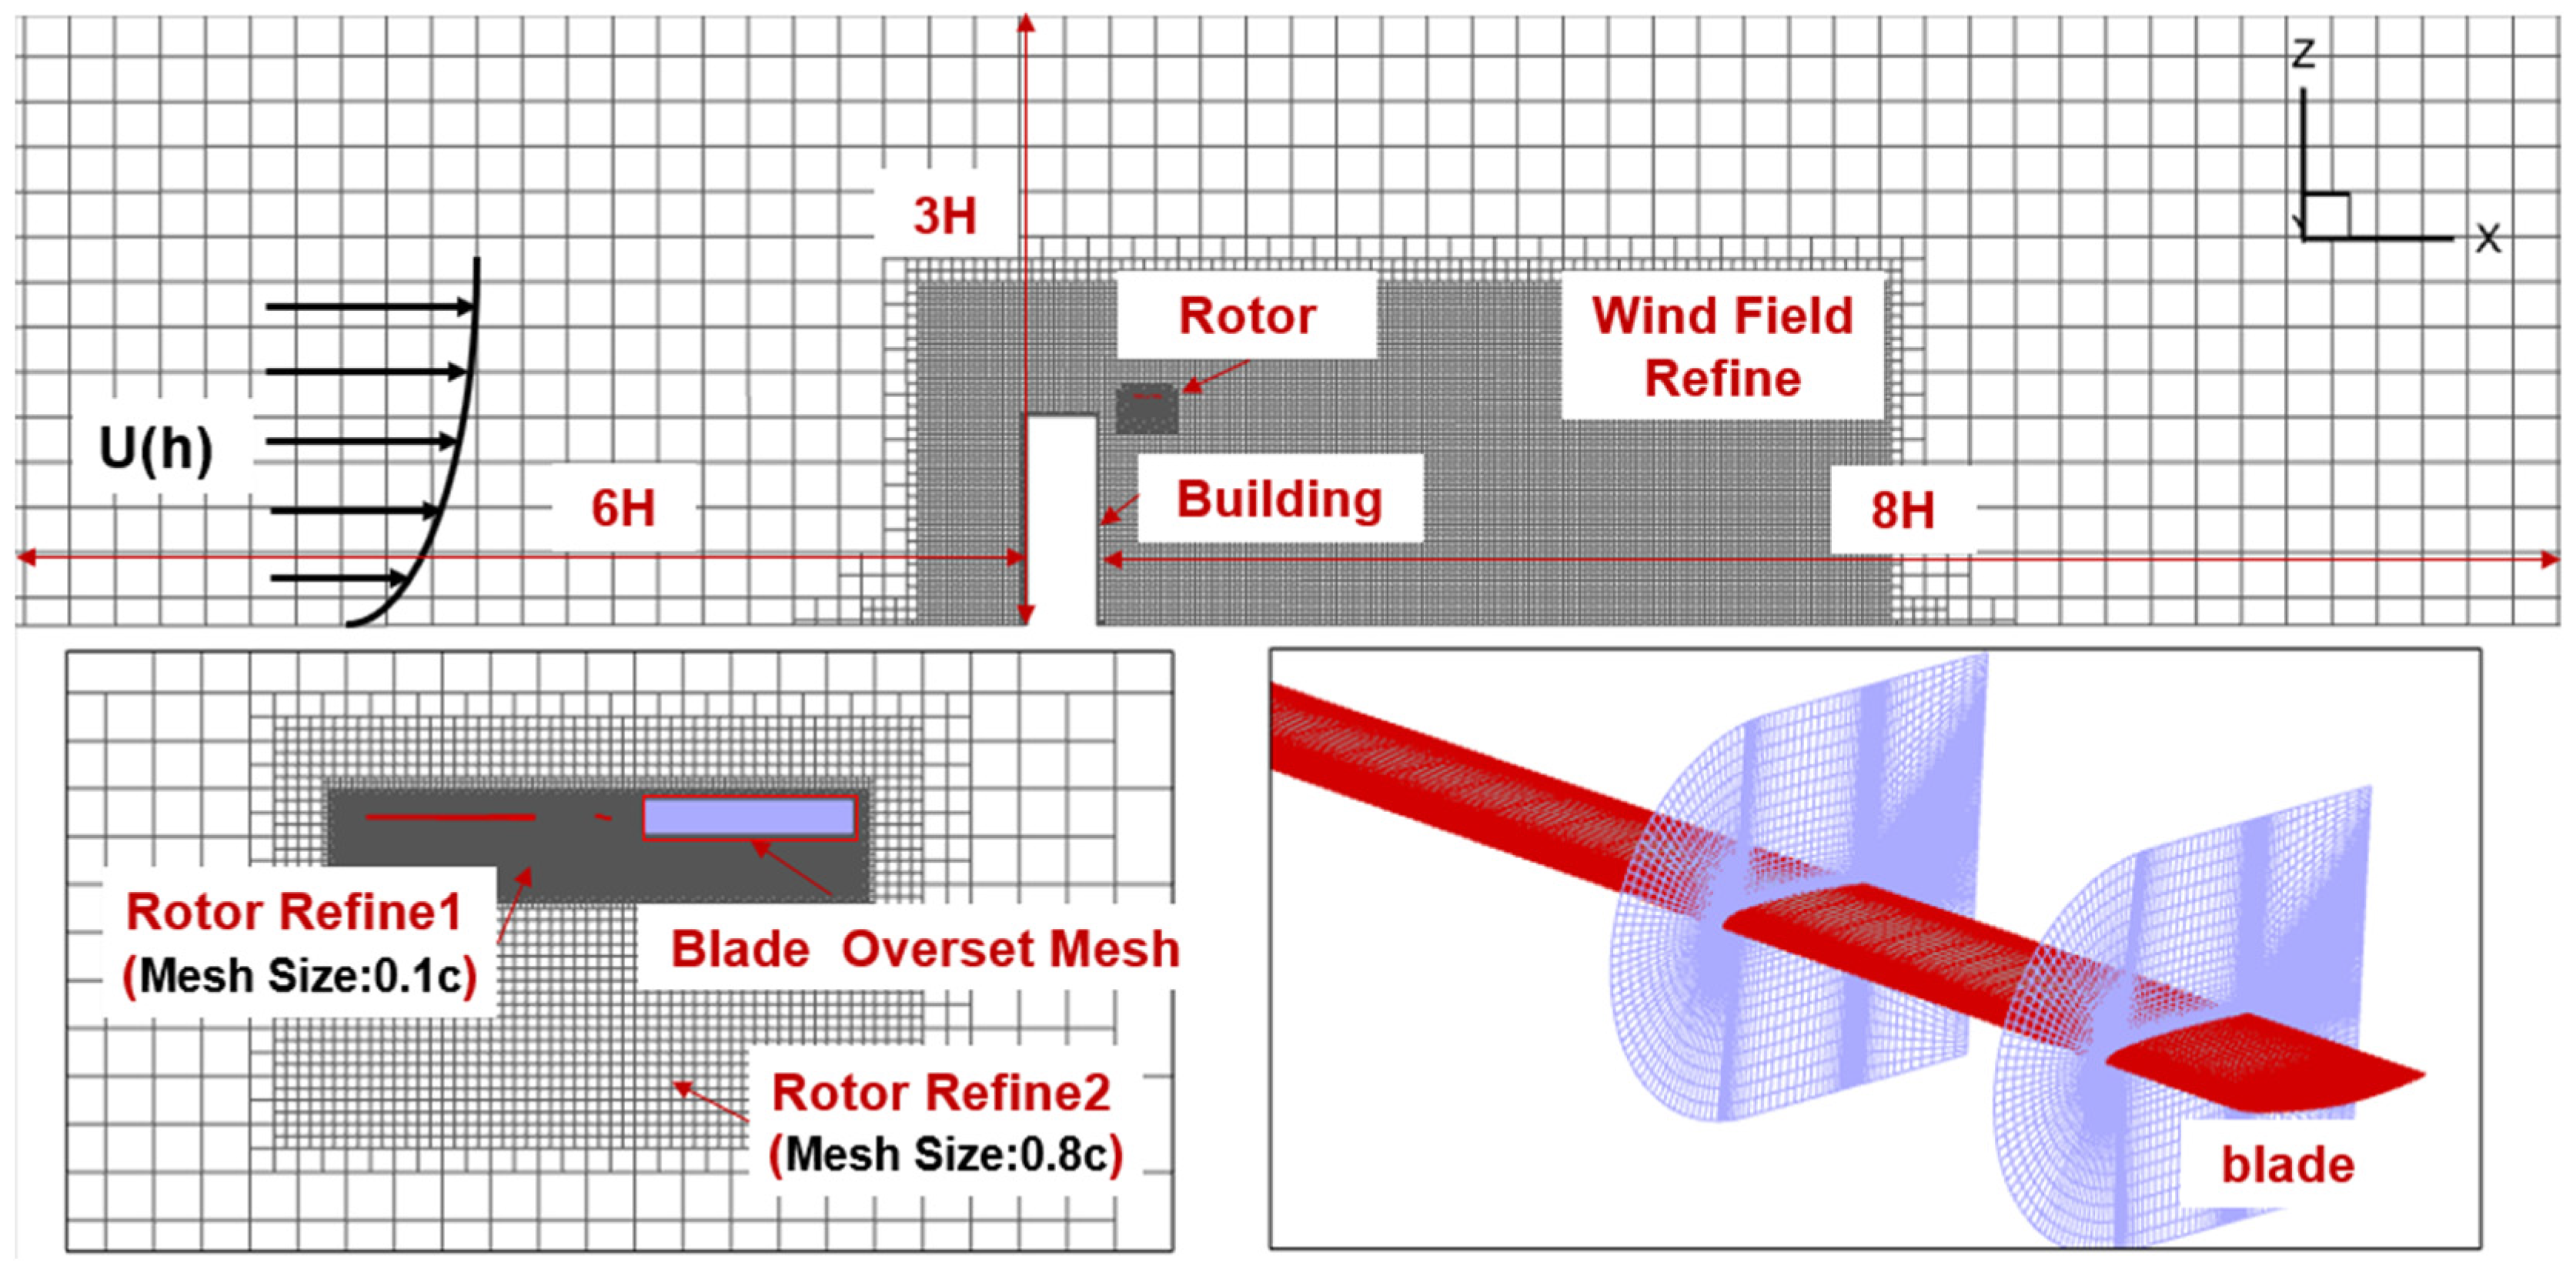
Figure 1. Grid system for coupled rotor–building flow field simulation.
Aerospace 11 00521 g001
Figure 2. Wind velocity distribution for different grid systems: (a) longitudinal velocity; (b) vertical velocity.
Aerospace 11 00521 g002
Figure 3. Average velocity distribution of the building.
Aerospace 11 00521 g003
Figure 4. Comparison of the average velocity distribution around the building for different turbulence models.
Aerospace 11 00521 g004
Figure 5. Rotor–obstacle interference flow field validation: (a) schematic of a rotor–obstacle interference test; (b) Q-criterion isosurface for rotor–obstacle interference flow field; (c) position A (X = 0R, Y = −1R, Z = 3R); (d) position B (X = 0R, Y = 1.5R, Z = 2R); (e) position C (X = 0R, Y = 1.5R, Z = 1.5R).
Aerospace 11 00521 g005aAerospace 11 00521 g005b
Figure 6. Isolated building wind field velocity and streamline distribution: (a) longitudinal velocity; (b) vertical velocity.
Aerospace 11 00521 g006
Figure 7. Velocity distribution at different heights on the roof: (a) velocity distribution at the plane y = 0; (b) velocity distribution at the plane x = 0.
Aerospace 11 00521 g007
Figure 8. Q-criterion isosurface of isolated building.
Aerospace 11 00521 g008
Figure 9. Turbulent kinetic energy in downwind profiles of isolated buildings.
Aerospace 11 00521 g009
Figure 10. Characteristics of building wind field distribution: (a) longitudinal velocity distribution; (b) normalized longitudinal velocity distribution; (c) vertical velocity distribution; (d) normalized vertical velocity distribution.
Aerospace 11 00521 g010
Figure 11. Schematic illustration of building wind impact region delineation and rotor discrete points.
Aerospace 11 00521 g011
Figure 12. Q-criterion isosurface of isolated rotor: (a) windless; (b) ABL.
Aerospace 11 00521 g012
Figure 13. Velocity and streamline the distribution of the coupled rotor–buildings flow field in the T-region: (a) longitudinal velocity at Δ z = 0 R ; (b) longitudinal velocity at Δ z = 1.0 R ; (c) vertical velocity at Δ z = 0 R ; (d) vertical velocity at Δ z = 1.0 R .
Aerospace 11 00521 g013
Figure 14. Q-criterion isosurface and vorticity magnitude of the coupled rotor–buildings flow field in the T-region: (a) Q-criterion isosurface at Δ z = 0 R ; (b) Q-criterion isosurface at Δ z = 1.0 R ; (c) vorticity magnitude at Δ z = 0 R ; (d) vorticity magnitude at Δ z = 1.0 R .
Aerospace 11 00521 g014aAerospace 11 00521 g014b
Figure 15. Time-averaged characteristics of rotor performance in T-region: (a) thrust; (b) power.
Aerospace 11 00521 g015
Figure 16. Velocity and streamline distribution of the coupled rotor–buildings flow field in the H- region: (a) longitudinal velocity at x = −6.25R; (b) longitudinal velocity at x = −2.5R; (c) vertical velocity at x = −6.25R; (d) vertical velocity at x = −2.5R.
Aerospace 11 00521 g016
Figure 17. Q-criterion isosurface and vorticity magnitude of the coupled rotor–buildings flow field in the H-region: (a) Q-criterion isosurface at x = −6.25R; (b) Q-criterion isosurface at x = −2.5R; (c) vorticity magnitude at x = −6.25R; (d) vorticity magnitude at x = −2.5R.
Aerospace 11 00521 g017aAerospace 11 00521 g017b
Figure 18. Velocity and streamline the distribution of the coupled rotor–buildings flow field in the D-region: (a) longitudinal velocity at x = 2.5R; (b) longitudinal velocity at x = 4.5R; (c) vertical velocity at x = 2.5R; (d) vertical velocity at x = 4.5R.
Aerospace 11 00521 g018
Figure 19. Q-criterion isosurface and vorticity magnitude of the coupled rotor–buildings flow field in the D-region: (a) Q-criterion isosurface at x = 2.5R; (b) Q-criterion isosurface at x = 3.5R; (c) vorticity magnitude at x = 2.5R; (d) vorticity magnitude at x = 3.5R.
Aerospace 11 00521 g019
Figure 20. Variation in rotor thrust and drag at downwind discrete points: (a) thrust; (b) drag.
Aerospace 11 00521 g020
Figure 21. Rotor performance at downwind discrete points: (a) thrust; (b) power; (c) rolling moment; (d) pitch moment; (e) lift-to-drag; (f) figure of merit.
Aerospace 11 00521 g021aAerospace 11 00521 g021b
Figure 22. Q-criterion isosurface and vorticity magnitude of the coupled rotor–buildings flow field in the S-region: (a) Q-criterion isosurface at y = −4.0R; (b) Q-criterion isosurface at y = −5.0R; (c) main view of vorticity magnitude at y = −4.0R; (d) main view of vorticity magnitude at y = −5.0R; (e) side view of vorticity magnitude at y = −4.0R; (f) side view of vorticity magnitude at y = −5.0R.
Aerospace 11 00521 g022aAerospace 11 00521 g022b
Figure 23. Variation in rotor thrust and drag at crosswind discrete points: (a) thrust; (b) drag.
Aerospace 11 00521 g023
Figure 24. Rotor performance at crosswind discrete points: (a) thrust; (b) power; (c) rolling moment; (d) pitch moment; (e) lift-to-drag; (f) figure of merit.
Aerospace 11 00521 g024
Table 1. Model parameters.
Building
ParametersValue
L 0 × W 0 × H 0 30.48 m × 45.72 m × 91.44 m
LandformD-type
Domain1400 m × 1000 m × 300 m
Rotor
ParametersValue
Number of blades4
Diameter/m11.93
Chord/m0.385
Twist of blade/deg−10 (linear)
rotational direction clockwise
AirfoilOA212, from 0.2R to 0.73R
Linear tapering from 0.73R (OA212) to 0.88R (OA209)
Linear tapering from 0.88R (OA209) to R (OA207)
Tip shape45° swept leading edge from 0.98R
Disclaimer/Publisher’s Note: The statements, opinions and data contained in all publications are solely those of the individual author(s) and contributor(s) and not of MDPI and/or the editor(s). MDPI and/or the editor(s) disclaim responsibility for any injury to people or property resulting from any ideas, methods, instructions or products referred to in the content.