Article

Numerical Analysis of the Water Entry Process of the Cabin Structure of the Trans-Domain Morphing Aircraft Considering Structural Deformation

1
College of Aerospace Engineering, Nanjing University of Aeronautics and Astronautics, Nanjing 210016, China
2
China Special Vehicle Research Institute, Jingmen 448035, China
*
Author to whom correspondence should be addressed.
Aerospace 2024, 11(8), 611; https://doi.org/10.3390/aerospace11080611
Submission received: 13 June 2024 / Revised: 19 July 2024 / Accepted: 24 July 2024 / Published: 25 July 2024
(This article belongs to the Special Issue Structures, Actuation and Control of Morphing Systems)

Abstract

:
During the water entry process of a trans-domain morphing aircraft, significant impact forces are generated when the aircraft hits the water surface, which will potentially cause the deformation of the cabin structure and might damage the structure or onboard devices. Thus, it is necessary to investigate the water entry process of the cabin structure. This paper analyses changes in fluid loads and the corresponding structural responses during the water entry process. Firstly, the numerical model is established for the water entry process and the modeling method is validated by comparing the results to the experimental data. An empirical formula is developed to correlate the impact loads with the water entry velocities. Then, fluid–structure interaction analysis of the water entry process is performed using a two-way coupling approach. The relationship between structural deformation and the water entry process is then investigated. The results are compared with those without considering the structural deformation. The empirical formula is then modified to reflect the effects of the deformation. The results show that structural deformation will disperse the impact load, which represents different responses compared to the rigid cabin structure.

1. Introduction

A trans-domain morphing aircraft is a new type of flight vehicle [1], which can change its configuration to accommodate different flight conditions adaptively and can fly in more than one domain, such as water and air, while maintaining optimal performance and efficiency [2,3]. The development of trans-domain morphing aircraft can help to enlarge the mission profile and reduce the operation cost in the entire process of design, manufacturing, and maintenance.
Trans-domain morphing aircraft have attracted the attention of researchers. Fabian et al. [4] developed a micro amphibious unmanned aerial vehicle. This vehicle can increase lift by fully extending its wings during airborne flight, and the wings will be folded when it enters the water to minimize the loads caused by water. Feng Jinfu et al. [5] proposed a trans-domain aircraft capable of shape-shifting by folding its wings, which can be launched into the air from underneath the water. William Stewart et al. [6] developed a fixed-wing trans-domain aircraft inspired by seabirds. A comprehensive cyclic test process, encompassing out-of-water, airborne flight, in-water, and underwater motions, was conducted on a test prototype. The results demonstrated its capability to perform transitions between airborne and underwater environments [7] and also indicated the importance of improved structural performance.
Different from conventional aircraft, the cabin structure of trans-domain morphing aircraft needs to carry the loads when it crosses the boundary of different domains. In this paper, the water entry process of the trans-domain morphing aircraft is shown in Figure 1. In the first stage, when the aircraft flies in the air, the wings unfold. In the second stage, when the aircraft enters the water, the bottom cabin structure collides with the water surface. In the third stage, when the aircraft sails underwater, the wings are swept back, which helps to reduce the drag caused by the water [8].
During the water entry process, the cabin structure interacts with the water surface, causing changes in the surface morphology. Additionally, water exerts reactive forces on the cabin structure, illustrating a typical fluid–structure interaction phenomenon. The significant impact force resulting from the aircraft’s contact with the water surface may cause deformation in the cabin structure skin and malfunction of internal instruments. Hence, investigating the water entry process of the cabin structure and the consequential effects of structural deformation is of great importance.
The water entry of cabin structures serves as a typical example in the study of water entry phenomena in structures, which has a long-standing research history. Von Karman [9] employed an added mass algorithm to analyze the impact problem of water entry for structures. Following the principle of momentum conservation, the momentum lost due to the incoming structure deceleration was converted into an increase in the induced flow field’s momentum. Wagner [10] proposed an approximate blunt body flat plate theory for small inclination models to address the overall forces involved in the water entry process of structures. However, in Wagner theory, pressure and velocity solutions can contain singular terms, potentially causing these values to approach infinity at the interface between the structure and the fluid. Shiffman et al. [11] modified some of Wagner’s theories and employed the additional mass method to thoroughly investigate the formulas for the impact pressures of conical and spherical structures upon vertical water entry. Trilling et al. [12] derived a linear analytical calculation method for the impact force by examining the structure’s water entry at various angles.
The experimental study of structures’ water entry has garnered increasing attention to obtain more reliable data. Steiner [13] established dynamic models of many aircraft, conducting forced landing experiments over water at Langley Laboratory. Various parts of the aircraft models, such as the front wheels, ventral compartments, and dropping windows, incurred damage to differing extents. Fisher and Windham [14] developed a 1/10 scale model of the space shuttle and performed landing experiments in both calm and wave water, which concluded that waves would influence the water landing of the space shuttle. Shibue [15] and Arai [16] conducted water entry tests on cylindrical shells of varying thicknesses and materials. They primarily investigated the strain response at different locations within the shell cross-section. Their studies offer insights for analyzing structural responses in various water entry scenarios.
Since the 1980s, with the advancement in computer technology, many scholars have begun to use numerical simulation technology to study the problem of structure water entry. Smith et al. [17] utilized the finite element method to simulate the vertical water entry process of a helicopter, proposing a crash-resistant design to reinforce its underside. Sun et al. [18] examined the thumping process of a wedge entering the water surface of a Stokes wave at constant velocity. They suggested that gravity influences the free liquid surface profile around the hull and the fluid force on its surface. Based on velocity potential theory, Wu et al. [19] analyzed the decoupling of fluid force and object acceleration by introducing a two-dimensional wedge free-falling into water. Zhao and Faltinsen [20] employed a boundary element method to address the impact of the two-dimensional wedge entering the water, neglecting gravity, and accounting for nonlinear boundary conditions. A method was utilized to handle the thin jet layer and avoid the numerical singularity.
Nonetheless, the research in the field of water entry process faces challenges when the structure geometry is complex. Thus, further investigation into coupling technology based on computational fluid dynamics (CFD) and finite element analysis (FEA) is necessary, where separate solutions for the flow and structure field are coupled via data transfer [21]. Complex geometry can then be handled since commercial software can be adopted. This paper examines the water entry of the cabin structure using the approach based on the FEA and CFD coupling. Initially, research is focused on rigid cabin structure water entry, and data fitting is applied to derive a general formula to predict peak impact load. Subsequently, a fluid–structure interaction approach based on CFD and FEA coupling is adopted to investigate the water entry process of the cabin structure. Finally, the different response of the cabin structure is shown by comparing the results between the rigid and elastic cabin structure.

2. Model Definition

2.1. Problem Description

This paper utilizes a CFD method to predict the fluid dynamic loads and capture changes in the multiphase flow interface during the water entry process of the cabin structure.

2.2. CFD Model

This paper employs the finite volume method to discretize the fluid domain into a series of control volumes. The conservation equations are integrated over each control volume, and numerical flux approximations are used to obtain the discretized equations.
This paper employs a Volume of Fluid (VOF) model [22] to describe the multiphase flow of water and gas. In this model, the phases are governed by a common set of momentum equations, and the phase distribution and position are determined by the phase volume fraction. The volume fraction of the phase α i can be expressed as follows:
α i = V i V
i = 1 N α i = 1
where V i represents the volume of phase i within the grid cell, V denotes the volume of the grid cell, and N signifies the total number of phases. The sum of volume fractions of each phase within every grid cell equals 1. The composite medium resulting from phase combination adheres to the following governing equations:
ρ t + d i v ( ρ u ) = 0
( ρ u ) t + d i v ( ρ u ) = p x + τ x x x + τ y x x τ z x x
( ρ v ) t + d i v ( ρ v u ) = p y + τ x y x + τ y y y + τ z y z ρ g
( ρ w ) t + d i v ( ρ w u ) = p z + τ x z x + τ y z y + τ z z z
where Equation (3) represents the mass conservation equation denoting the fluid density. Equations (4a)–(4c) represent the momentum conservation equations in the x , y , and z directions, respectively, which p signifies the pressure on the fluid microelement. Additionally, τ x x , τ x y , τ x z , and so forth represent components of the viscous force acting on the microelement surface. Given that the y direction is considered the gravity direction in this study, the term influenced by gravity is incorporated into Equation (4b).
This paper employs a realizable k-ε two-equation turbulence model [23] to simulate the flow field in water entry problems. The density of the fluid can be controlled using a custom field function, and other fluid properties are set as constants. The Reynolds averaging method is applied to compute the turbulent viscous term, and the RANS equation expressing the time-averaged and fluctuation values (without indicating the average signs) is as follows:
ρ m u i t + ( ρ m u i u j ) x j = p x i + x j ( τ i j ρ m u i u j ¯ ) + ρ m g i
where ρ m u i u j ¯ represents the Reynolds stress term. Employing the Boussinesq eddy-viscosity model, the expression is derived as follows:
ρ m u i u j ¯ = μ t ( u i x j + u j x i ) 2 3 ( ρ m k + μ t u i x i ) δ i j
where k represents the turbulent kinetic energy and μ t denotes the turbulent viscosity coefficient.

2.3. Method Verification

This paper utilizes a CFD method to investigate the deformation of the multiphase flow interface and the morphological changes of the jet during free water entry of the wedge. The resulting phase diagrams are compared with experimental data from the literature [24] to validate the simulation modeling technique.
The upper surface of the wedge model is rectangular, measuring 0.3 m in length and 0.1 m in width. The wedge is inclined at an angle of 30° and has a mass of 4 kg. The pool used in the experiment measures 1 m in length, 0.35 m in width, and 1 m in height. Initially, the wedge is positioned 0.1 m away from the water surface. At the start of the experiment, the wedge is fixed, following which the high-speed camera and laser are activated. Subsequently, camera recording commenced and the electromagnet was deactivated, releasing the wedge. The high-speed camera is employed to capture phenomena of free-surface deformation and jet splashes. This paper simulates and analyzes the experiment using STAR-CCM+® [25]. Initially, the water surface is in contact with the wedge, and the wedge velocity is set to 1.4 m/s ( v 2 = 2 g h ). Since the experimental images are from a reference and only 2D images are available, we used 2D images from 3D simulations for comparison.
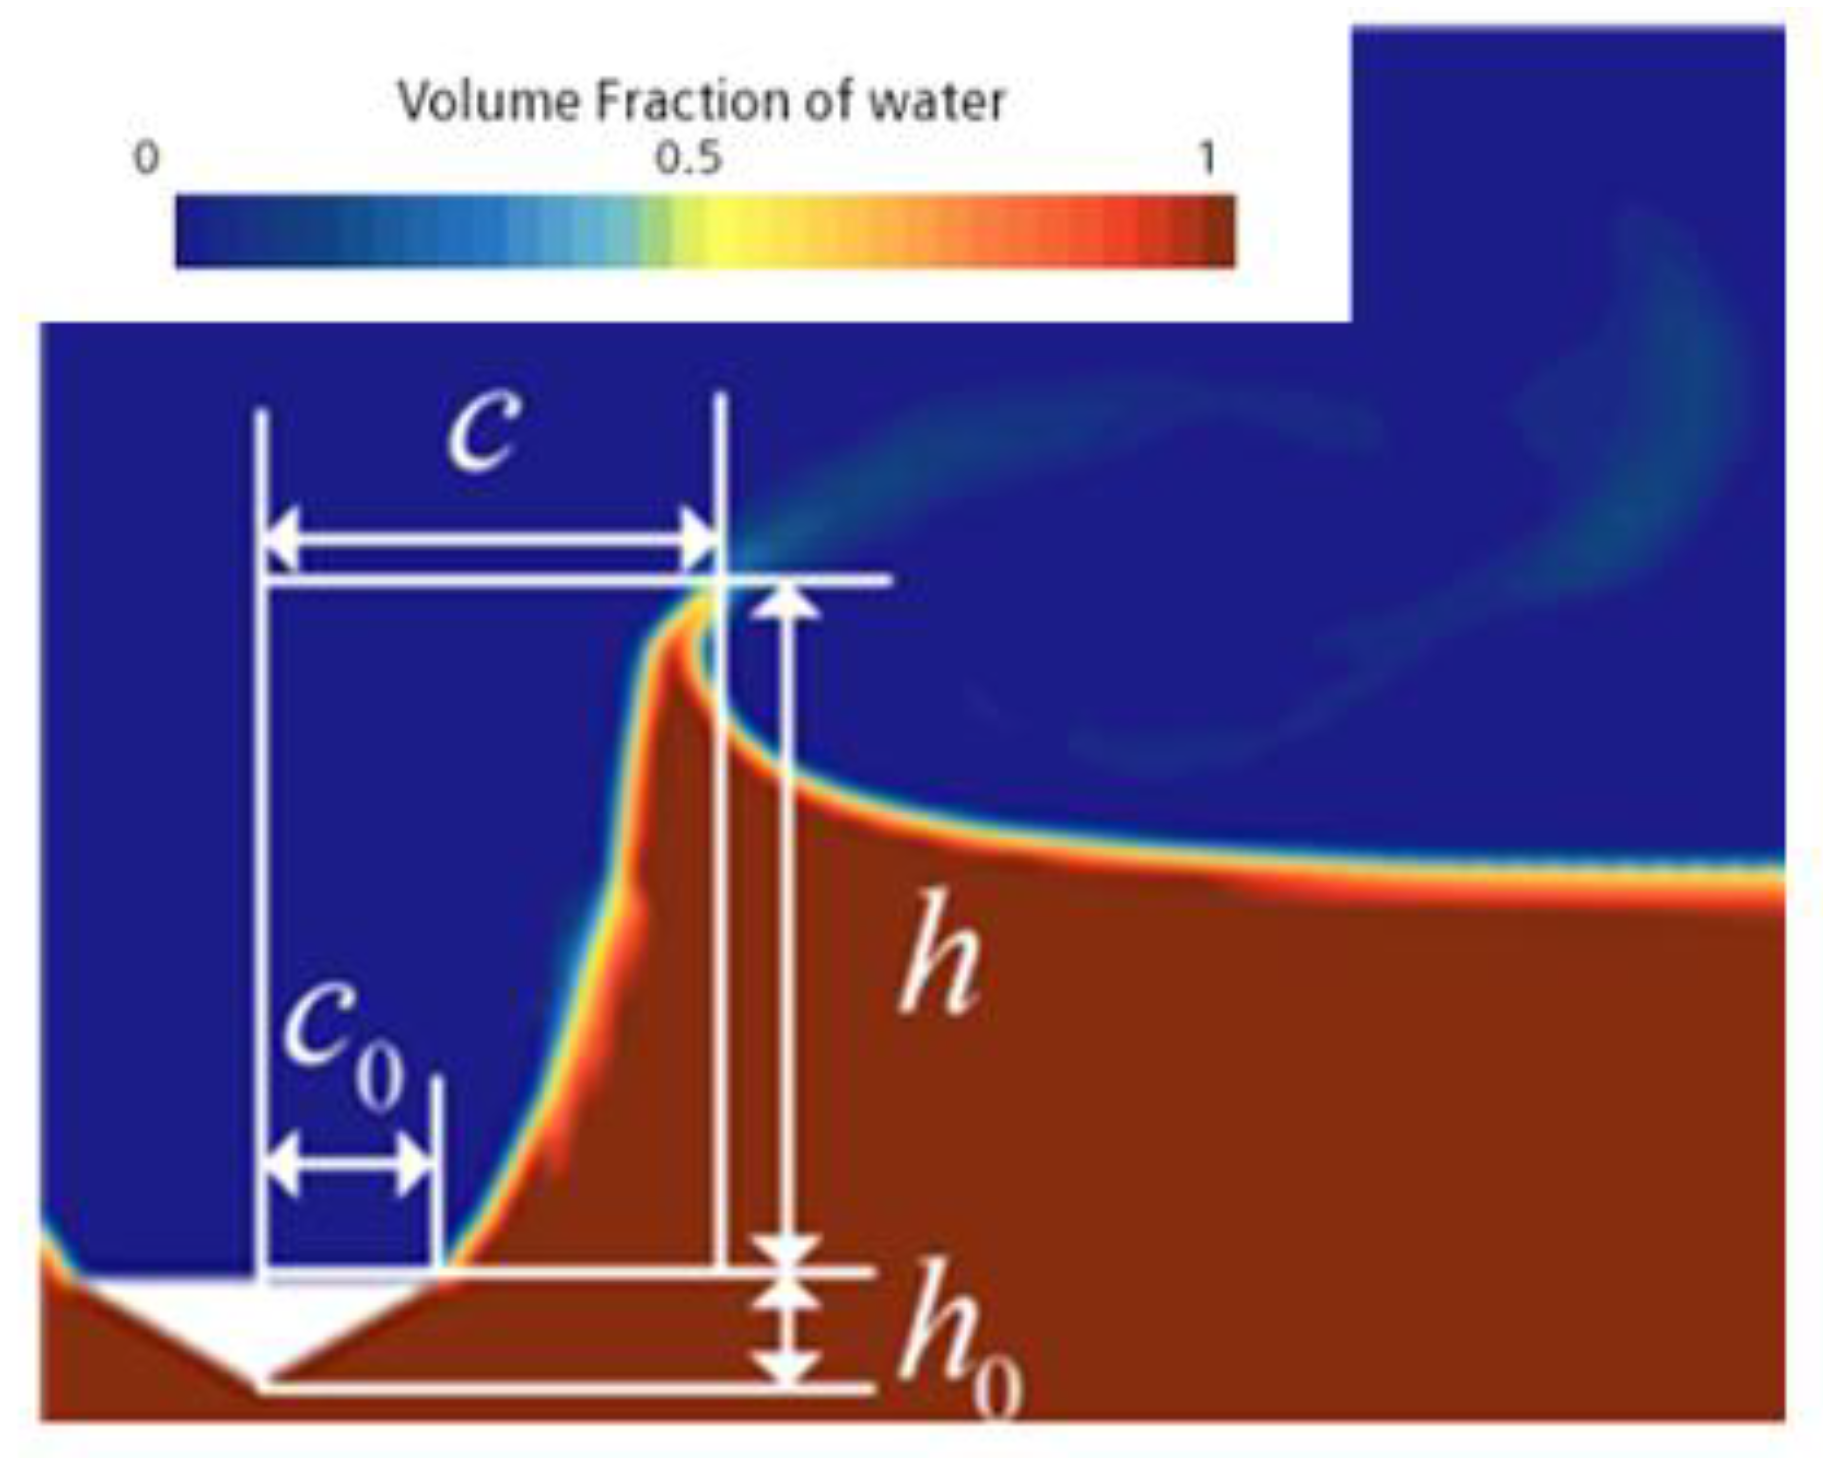
Dimensionless parameters α , γ are established. α = c 0 / c , γ = h 0 / h . c 0 represents the horizontal distance from the highest point of the free liquid surface to the center axis of the wedge. c represents half the length of the upper surface of the wedge. h 0 denotes the vertical distance between the highest point of the free liquid surface and the upper surface of the wedge. h represents the distance from the top surface to the bottom of the wedge, as shown in Figure 2.
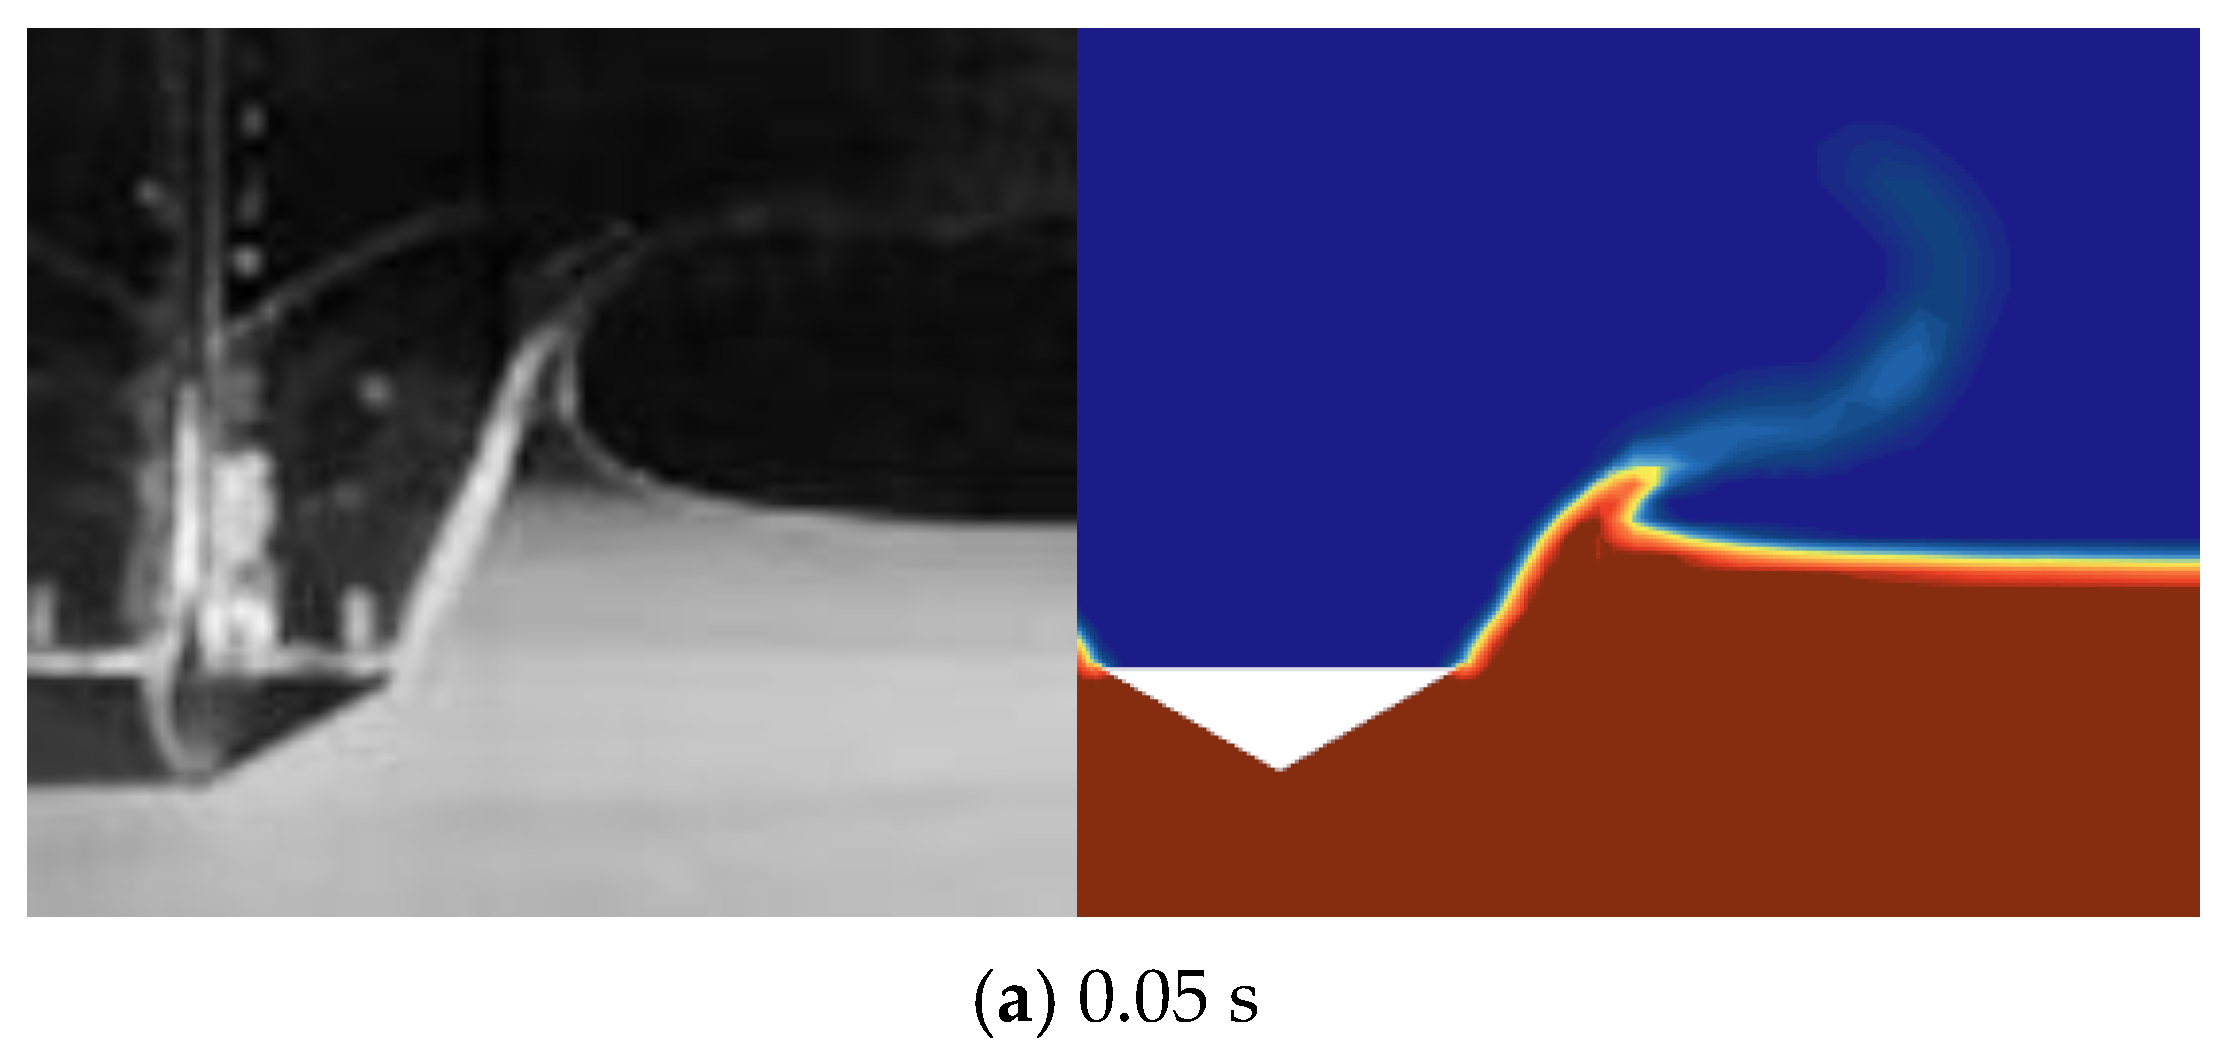
Figure 3 illustrates the comparative analysis between experimental and simulation results, with the left side presenting experimental results and the right side depicting simulation results. At 0.05 s, the free liquid surface undergoes deformation in both directions due to interaction with the wedge, leading to the generation of a high-velocity jet. By 0.136 s, the free surface deformation intensifies and the high-velocity jet becomes more prominent. With increasing entry depth, the ascending free surface starts converging towards the center. From the comparison, the following conclusions are drawn: the simulation accurately replicates the jet profile, aligning with the experimental results; however, the simulation of free surface deformation exhibits slight disparities compared to the experimental findings. The primary reason for this variance lies in the small size of the experimental pool, potentially causing wall reflection effects. Additionally, the CFD method employs a boundary condition of a symmetric plane to simulate infinite water.
Table 1 compares simulation and experimental results, showing errors within 15%, suggesting the suitability of the CFD method for simulating free surface changes during wedge water entry. The performance of the method is relative in terms of pure precision but relevant in terms of robustness.

3. Water Entry Process of Rigid Cabin Structure

3.1. Model Setup

The fluid simulation is performed using the commercial software STAR-CCM+ 2022.1(17.02.007-R8). Figure 4 illustrates the computational domain for the water entry analysis. The air domain has a height of 6 m, while the water domain has a depth of 6 m.
The model has a mass of 700 kg. The upper surface of the model is a rectangle measuring 3.3678 m in length and 1.539 m in width. The height of the model’s sides is 1.302 m. The lower surface of the model features a circular arc, with the center co-ordinates projected onto the XY plane being (1.37, 0.291 mm), and a radius of 440.45 mm. The length of the model’s bottom wedge is 1.27 m. Structural deformation during water entry is not considered; the model is assumed to be an ideal rigid structure.
The top surface of the boundary condition is set as the pressure outlet, the bottom surface is set as the wall condition, and symmetric planes are used in the remaining surfaces. The time step length is set to 2 × 10⁻⁴ and the number of internal generations is set to the 10th order. The number mentioned above is confirmed by multidimensional analysis and the calculation accuracy is verified by simultaneous calculations.
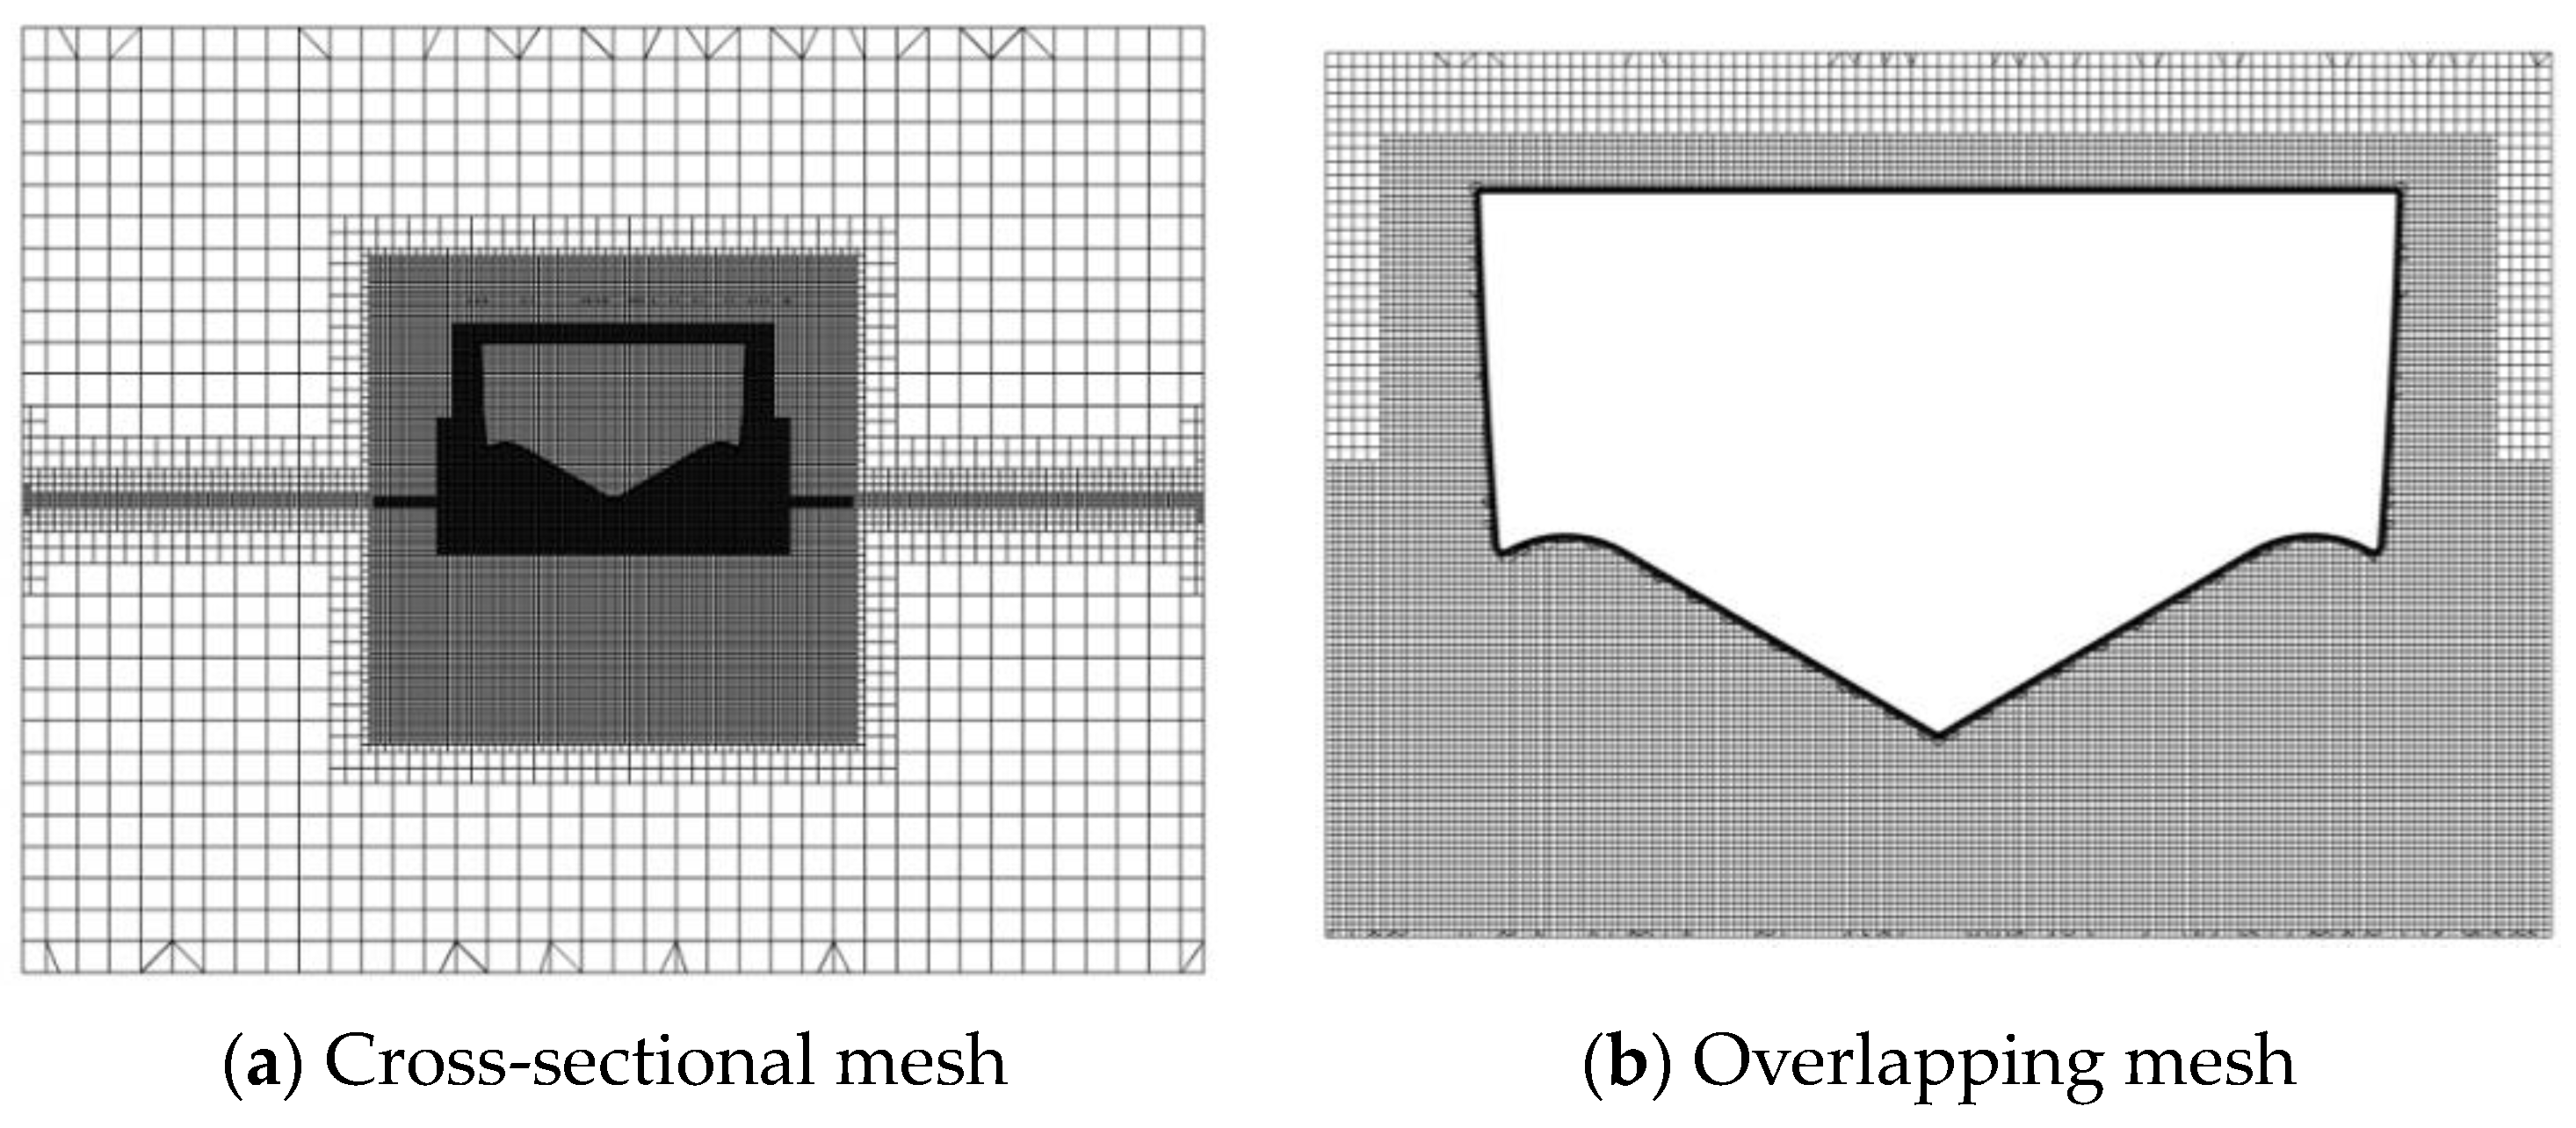
An overlapping mesh approach is employed to calculate the flow field during object motion. The overlapping mesh comprises a background mesh and sub-mesh that overlap. Although each mesh region spatially overlaps, they lack connectivity and exist independently. Connectivity needs to be established by preprocessing software after completing operations like digging holes and matching interpolation points. The benefits of overlapping meshes are primarily twofold. Firstly, it simplifies the meshing of complex geometries, allowing for the selection of the most suitable mesh for various calculation regions. Secondly, it facilitates mesh generation for parts in relative motion. Specifically, adjusting mesh positions for parametric studies is relatively straightforward. Figure 5 illustrates a schematic diagram of the mesh.
Three mesh densities are tried for the numerical simulation, which corresponds to different numbers of meshes ranging from 2.73 million to 5.12 million. For the same model, the number of meshes increases while the mesh size decreases. The mesh convergence analysis is performed to compare the responses of the structure. The cabin structure has an initial velocity of 5 m/s before it contacts the water surface. The y direction is defined as the vertical direction. Table 2 below presents a comparison of the peak vertical acceleration at different mesh numbers.
The differences caused by the increase in the number of meshes are not significant. Therefore, the numerical model for subsequent simulations uses 2.73 million grids, which can improve the computational efficiency while ensuring the robustness of the calculation.

3.2. Numerical Results of Rigid Cabin Structures

The trend of the vertical acceleration is obtained, together with the pressure distribution during the water entry process.
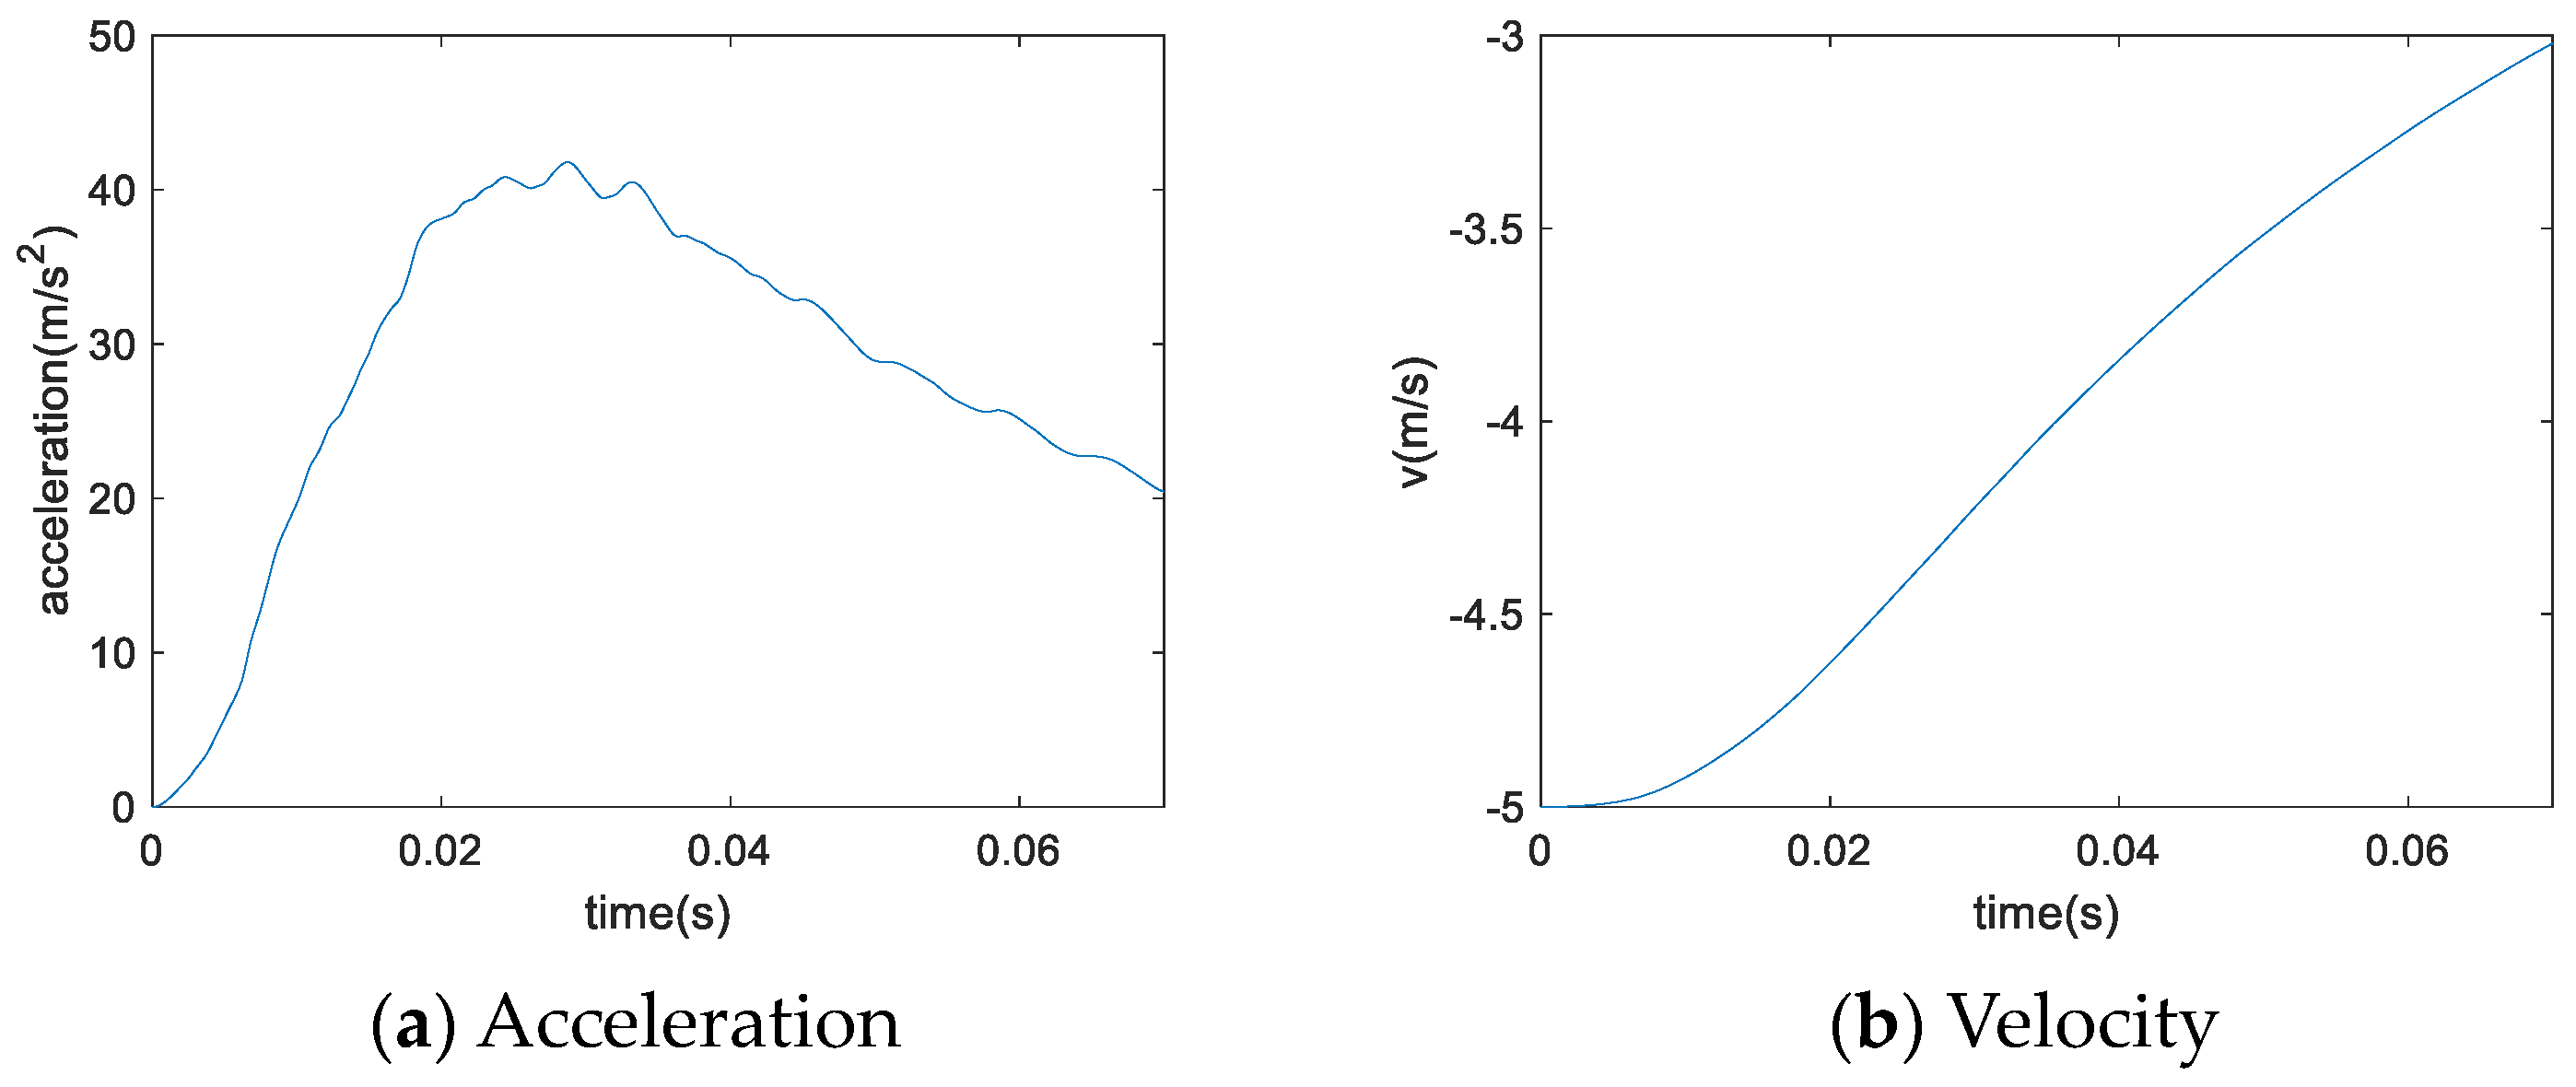
Figure 6 shows the change in acceleration and velocity of the rigid cabin structure, which has a mass of 700 kg and an initial velocity of 5 m/s. The acceleration increases rapidly once the structure enters the water and declines quickly after the peak value.
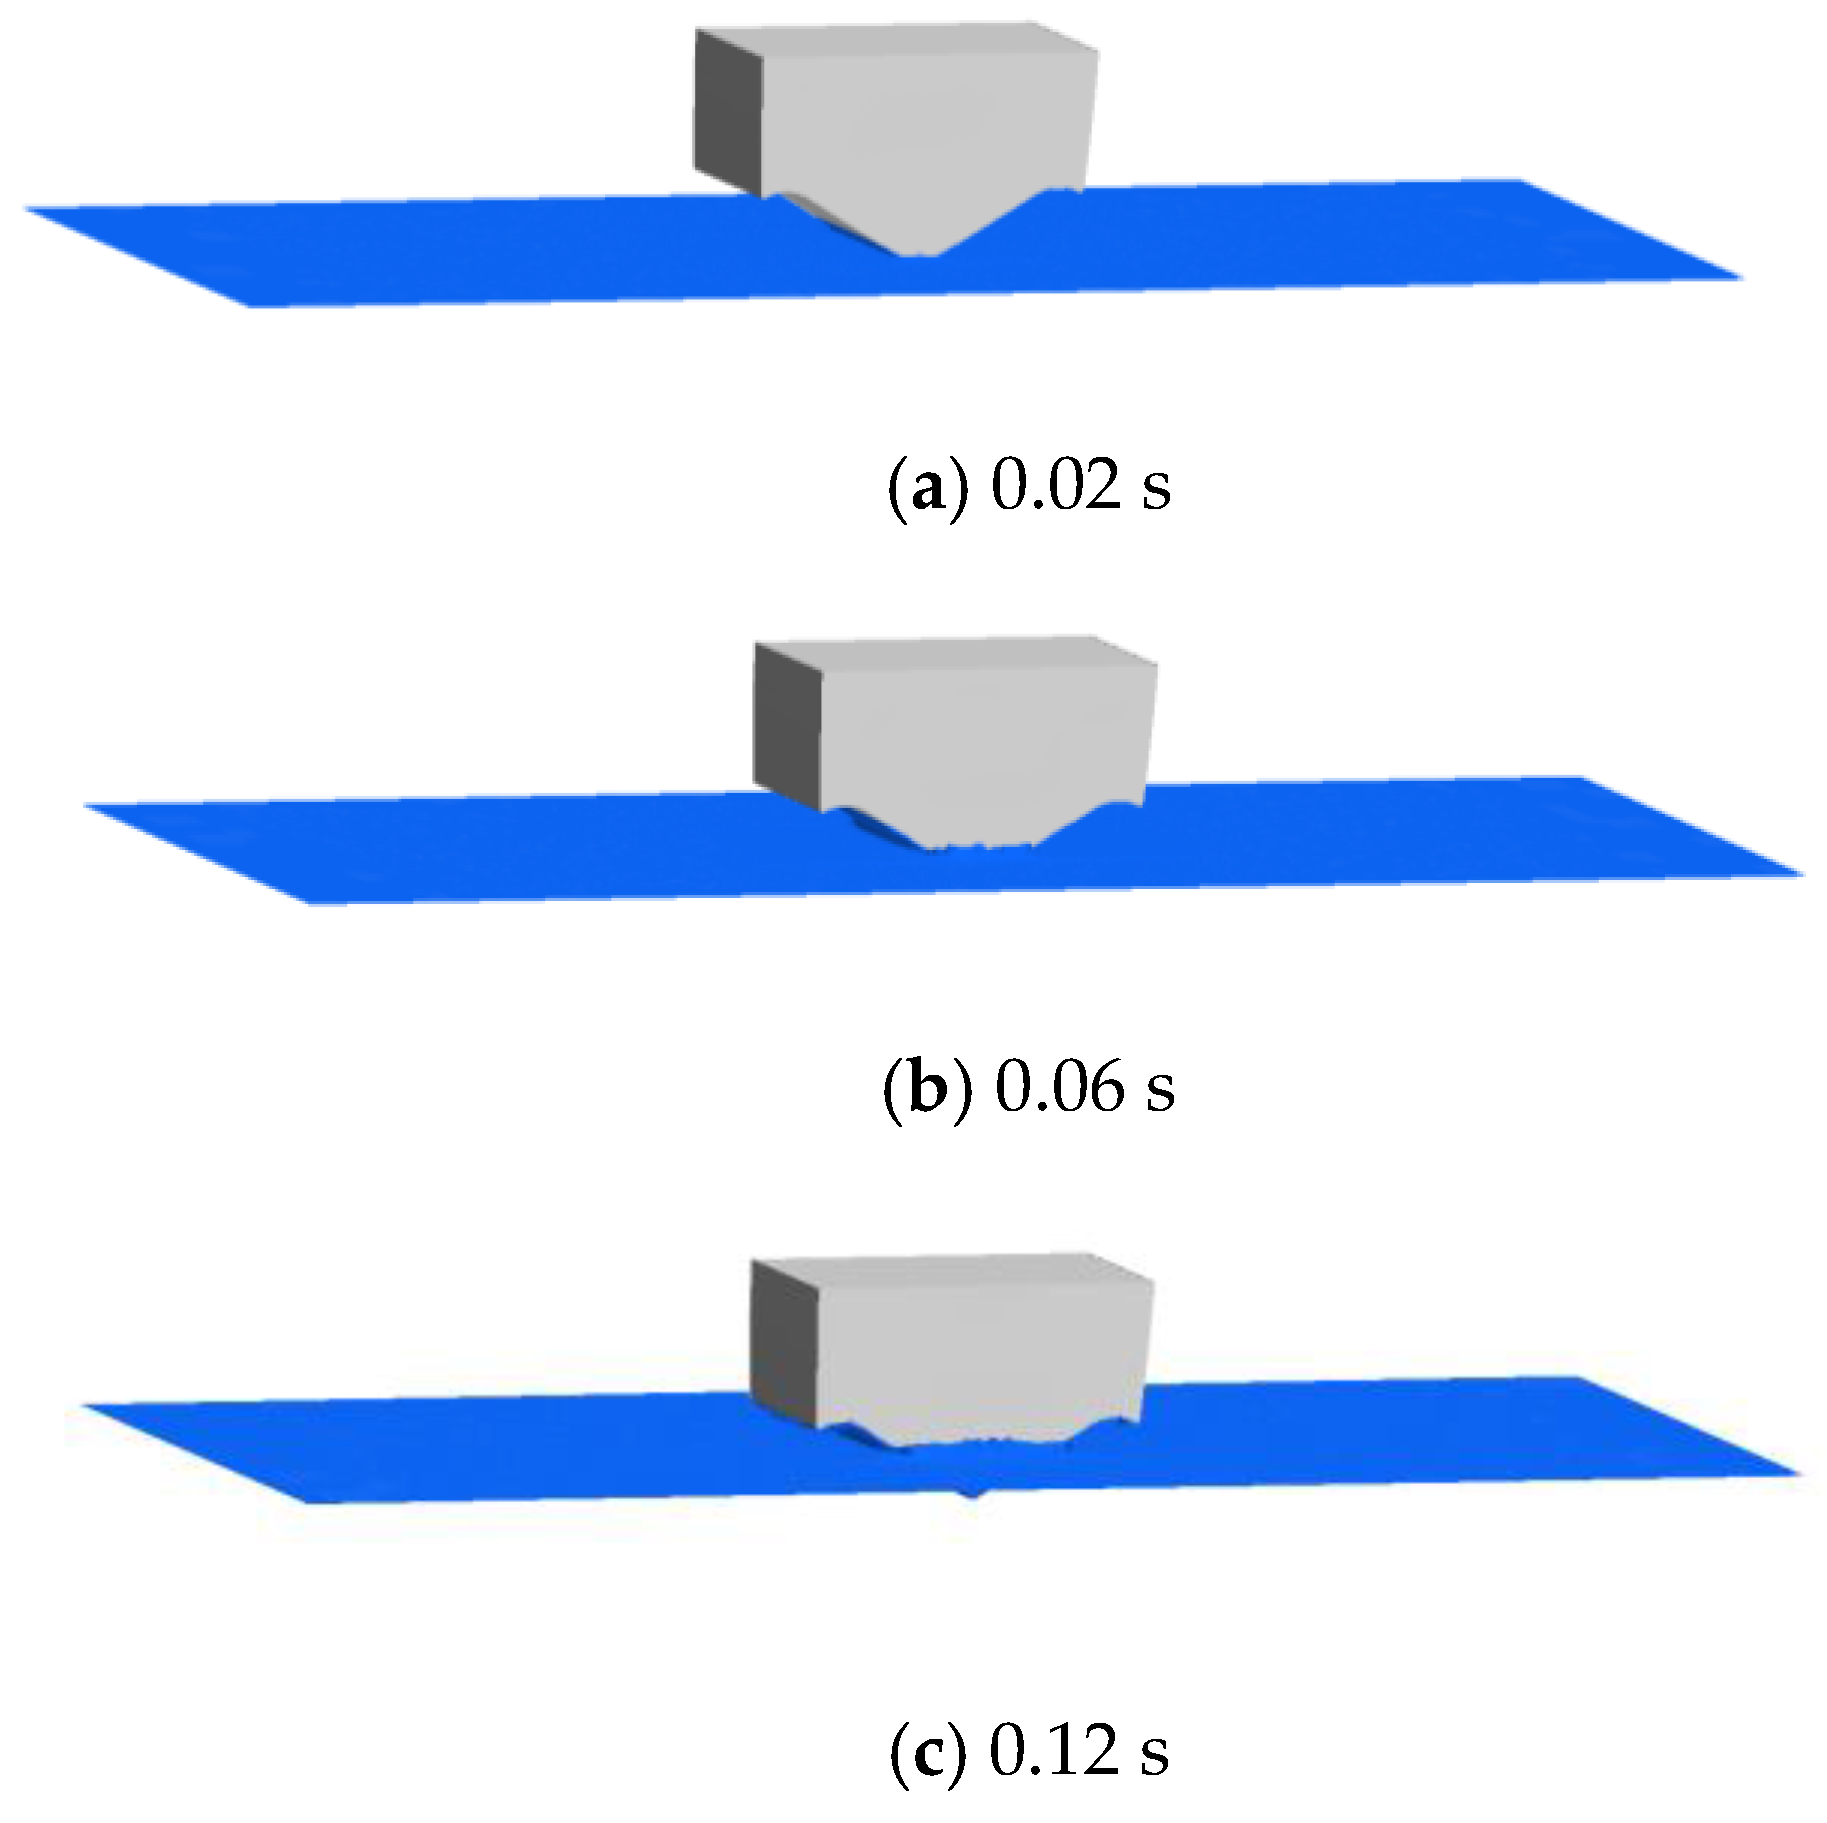
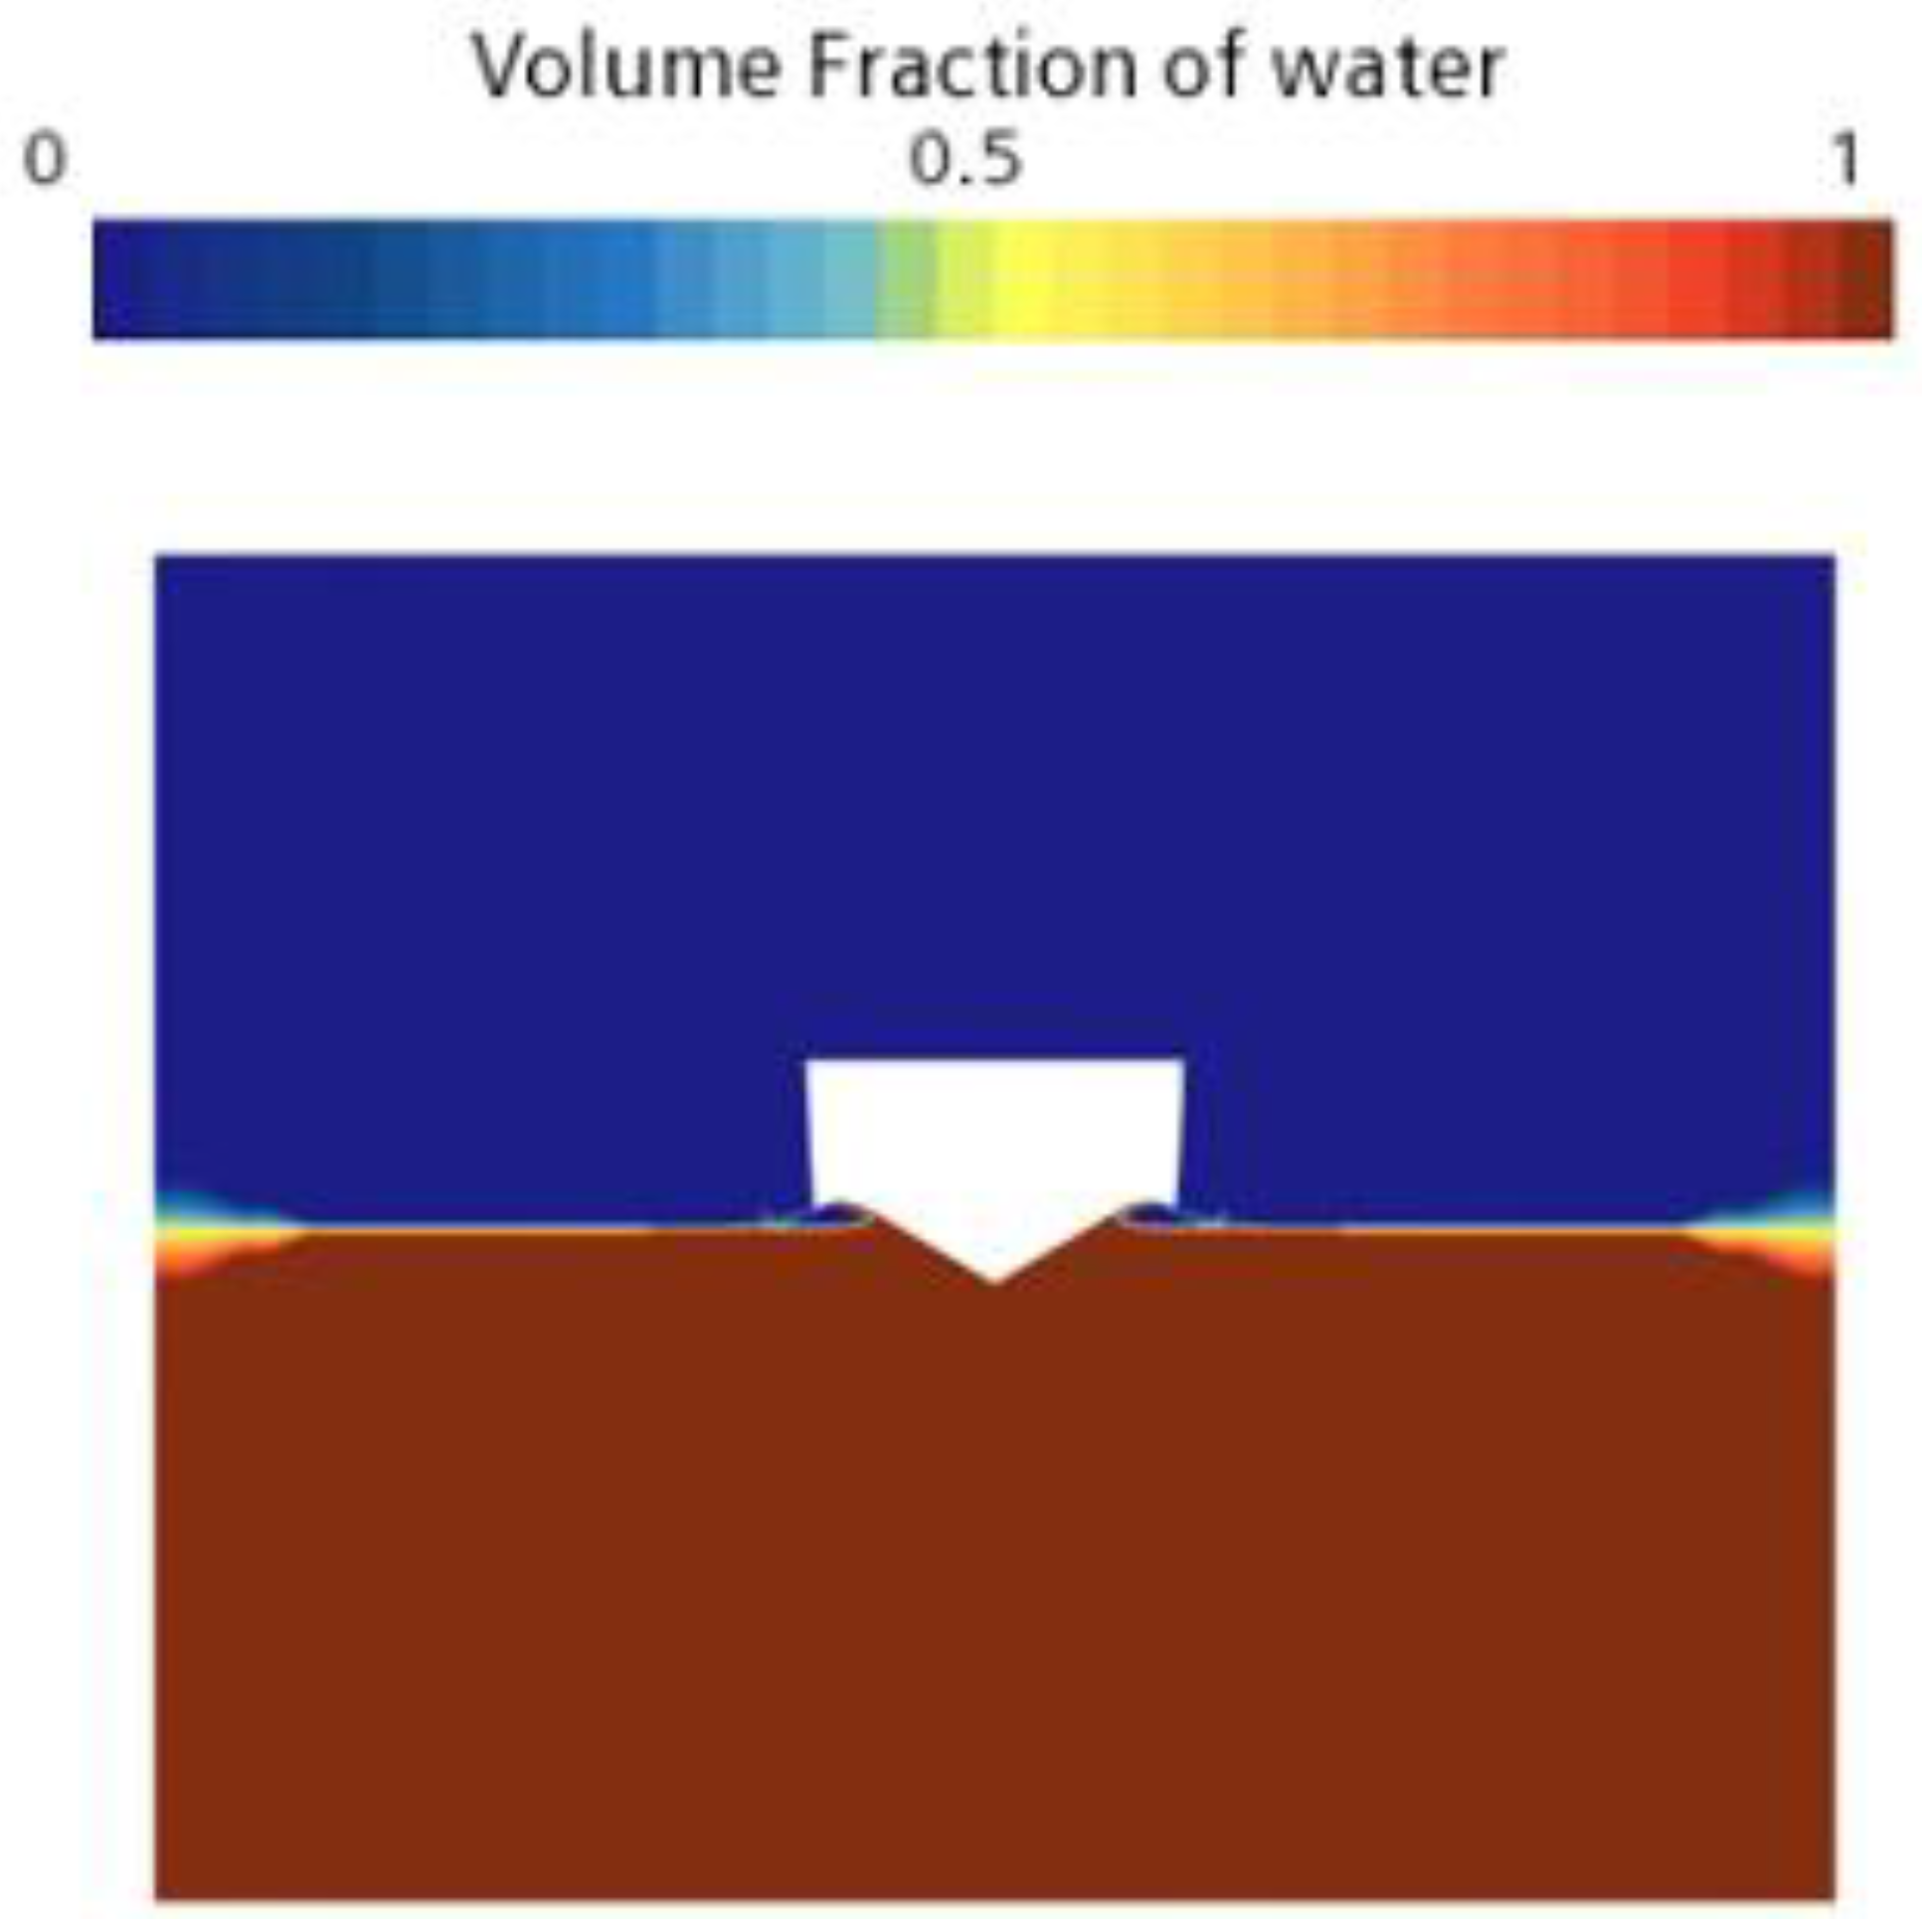
Figure 7 depicts 3D phase diagrams at various time points, illustrating the alterations in the shape of the free liquid surface as the entry depth increases. The parabolic bottom surface of the structure presented in this paper effectively suppresses the height of the jet if it is too high. Figure 8 showcases the phase diagram of the gas–liquid interface, providing a visual representation of the rational and effective design of this structure.

3.3. Empirical Formula

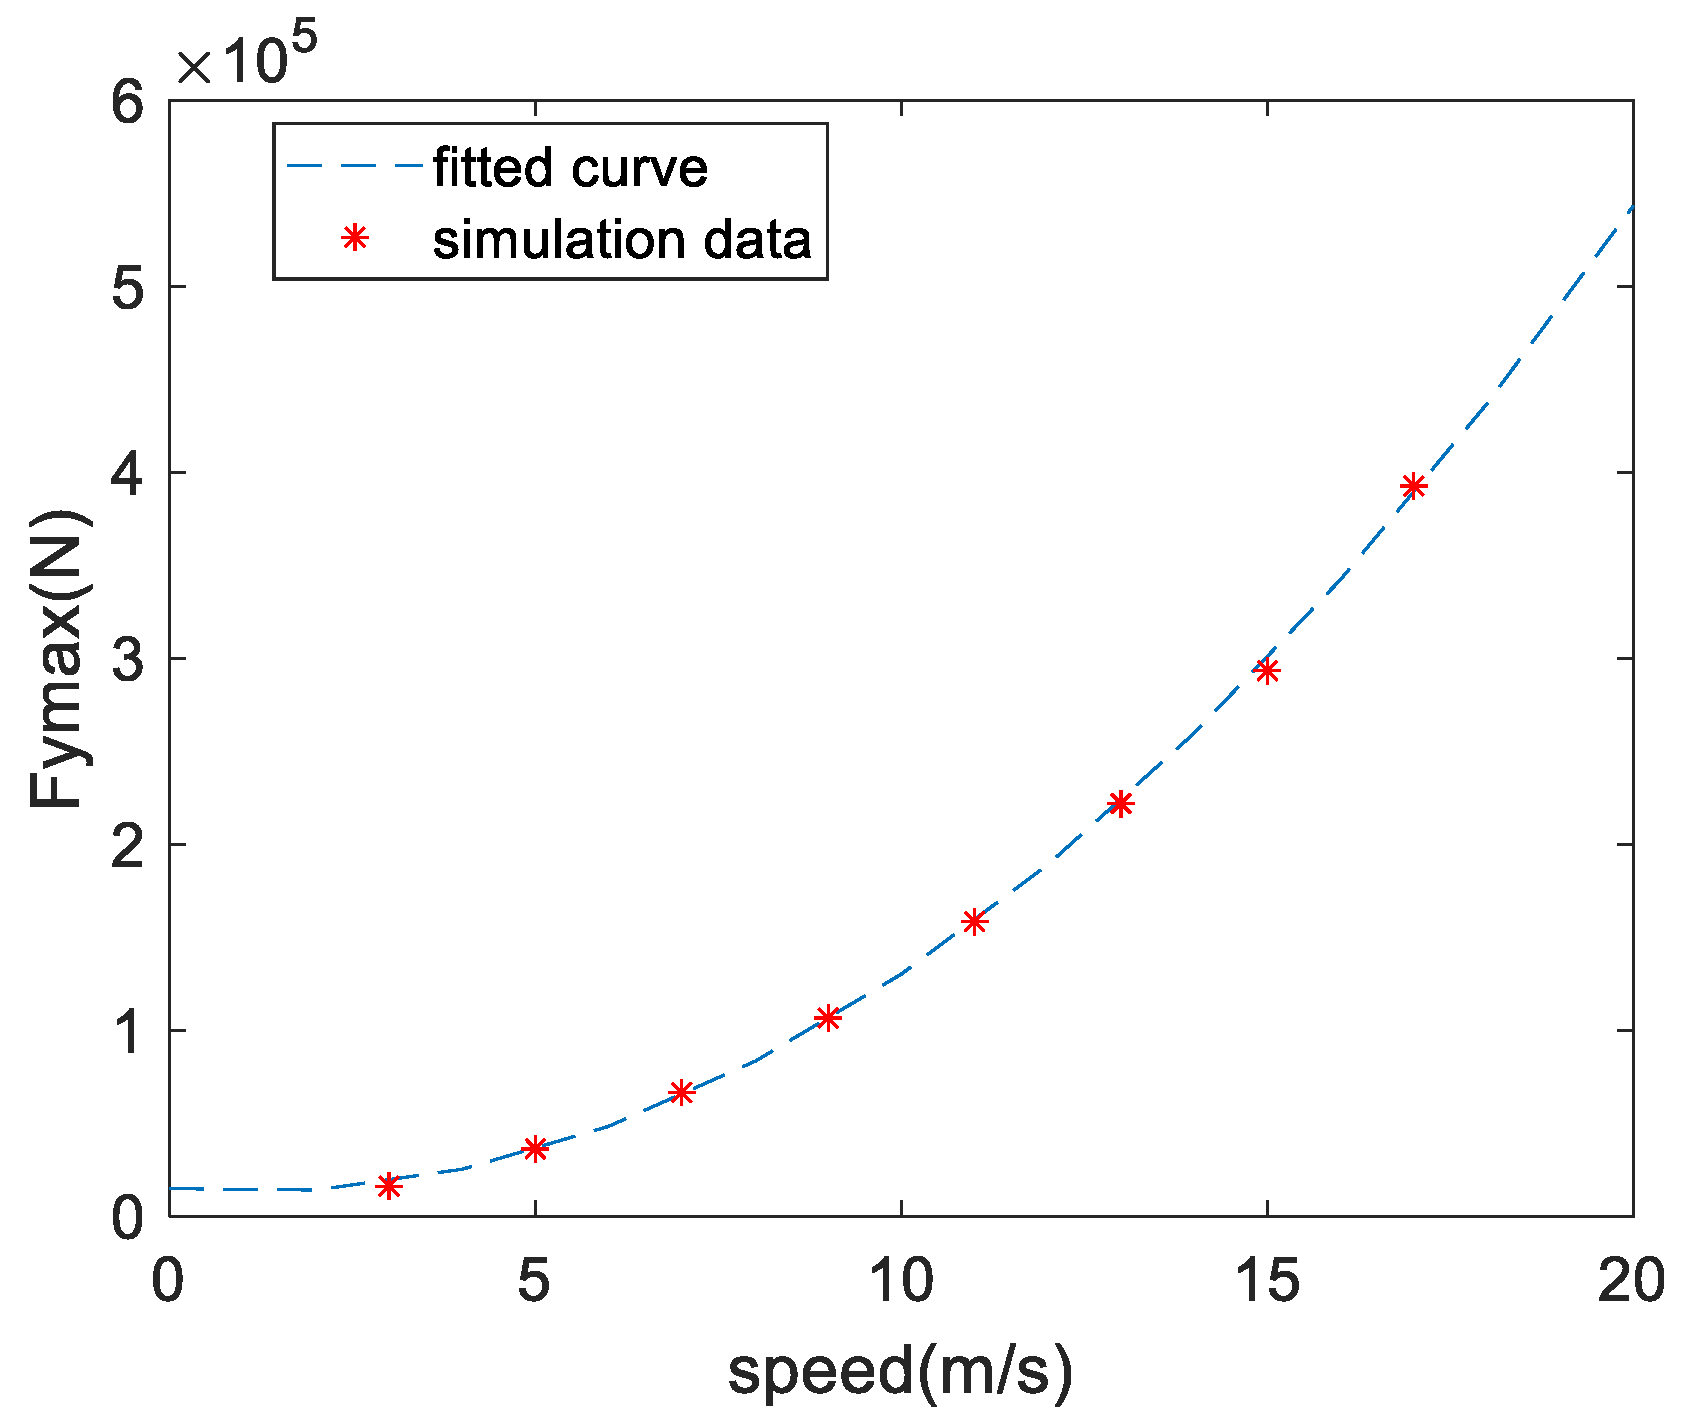
From the engineering perspective, the peak acceleration, which corresponds to the peak impact load, has the most significant effect on the structure design. Thus, the peak impact loads are summarized when different initial velocities are applied as shown in Figure 9.
The results indicate that a quadratic relationship exists between the initial velocities and the peak loads. Data fitting is performed to establish the relationship between the peak vertical impact load and the entry velocity. The coefficient of determination for the fit is 0.9987, which indicates a strong fit.
Datta et al. [26] suggests that the maximum impact pressure experienced by the wedge during constant velocity water entry process, without considering structural deformation, can be expressed as:
P p e a k = π 2 sin β 4 tan 2 β ρ v 2 2
where ρ is the density of the water, v is the velocity of entry, and β is the angle of inclination of the model. Hence, the approximate surface pressure profile upon the structure water entry can be determined. Combined with the numerical simulation results, the current paper presents a formula for the peak vertical water entry impact load in the cabin structure water entry problem:
F y = C β ρ v 2 2 S
where C β is the vertical impact load coefficient, which is primarily influenced by the shape characteristics of the cabin structure. S is the reference area, which pertains to the surface area of the structure submerged in water during peak impact loading. The obtained formula fitted by simulation data is a preliminary approach.
Similar results can be found in the study of Song et al. [27] on torpedo water entry. It is proposed that the maximum impact load of the structure water entry is proportional to the square of the velocity into the water.

4. Water Entry Process Considering Structural Deformation

4.1. Setup of the Fluid–Structure Interaction

The influence of the structural deformation is investigated by analyzing the fluid–structure interaction using a two-way coupling approach. As shown in Figure 10, the coupling approach is performed based on the data transfer between the CFD solver and the structural solver. The CFD solver can obtain the fluid loads during the water entry process, and the structural solver can obtain the structural deformation and change the geometry of the fluid domain.
The CFD model setup remains consistent with that outlined in Section 3.1. Abaqus is employed for finite element modeling of the cabin structure. Utilizing beam and shell elements for finite element analysis to mimic specific structural types can enhance computational efficiency. The cabin structure model contains numerous reinforcing structures, which are simplified using beam elements. This simplification ensures calculation accuracy while better representing the force characteristics of the actual structure. Components like skins and internal ribs, significantly thinner compared to other dimensions, are modeled with shell elements.
Figure 11 illustrates a schematic diagram of the cabin structure and its mesh. The steel frame structure of the actual cabin supports the fuselage mechanism, among other components. This paper employs concentrated mass points to simulate the steel frame structure, applied at the highlighted locations shown in Figure 11b. The cabin structure’s material is modeled using 7075 aluminum alloy, resulting in a total mass of 700 kg for the finite element model after incorporating the concentrated mass.
This paper employs an implicit dynamics analysis step to compute the structural response. The implicit solution uses an iterative method to solve the unknown quantity at the next incremental step. The iterative method is typically the Newton–Raphson method. Utilizing this approach facilitates the application of implicit coupling algorithms in CFD- and FEA-based coupled calculations, thereby enhancing computational accuracy through multiple data exchanges within a single time step.

4.2. Analysis of Calculation Results

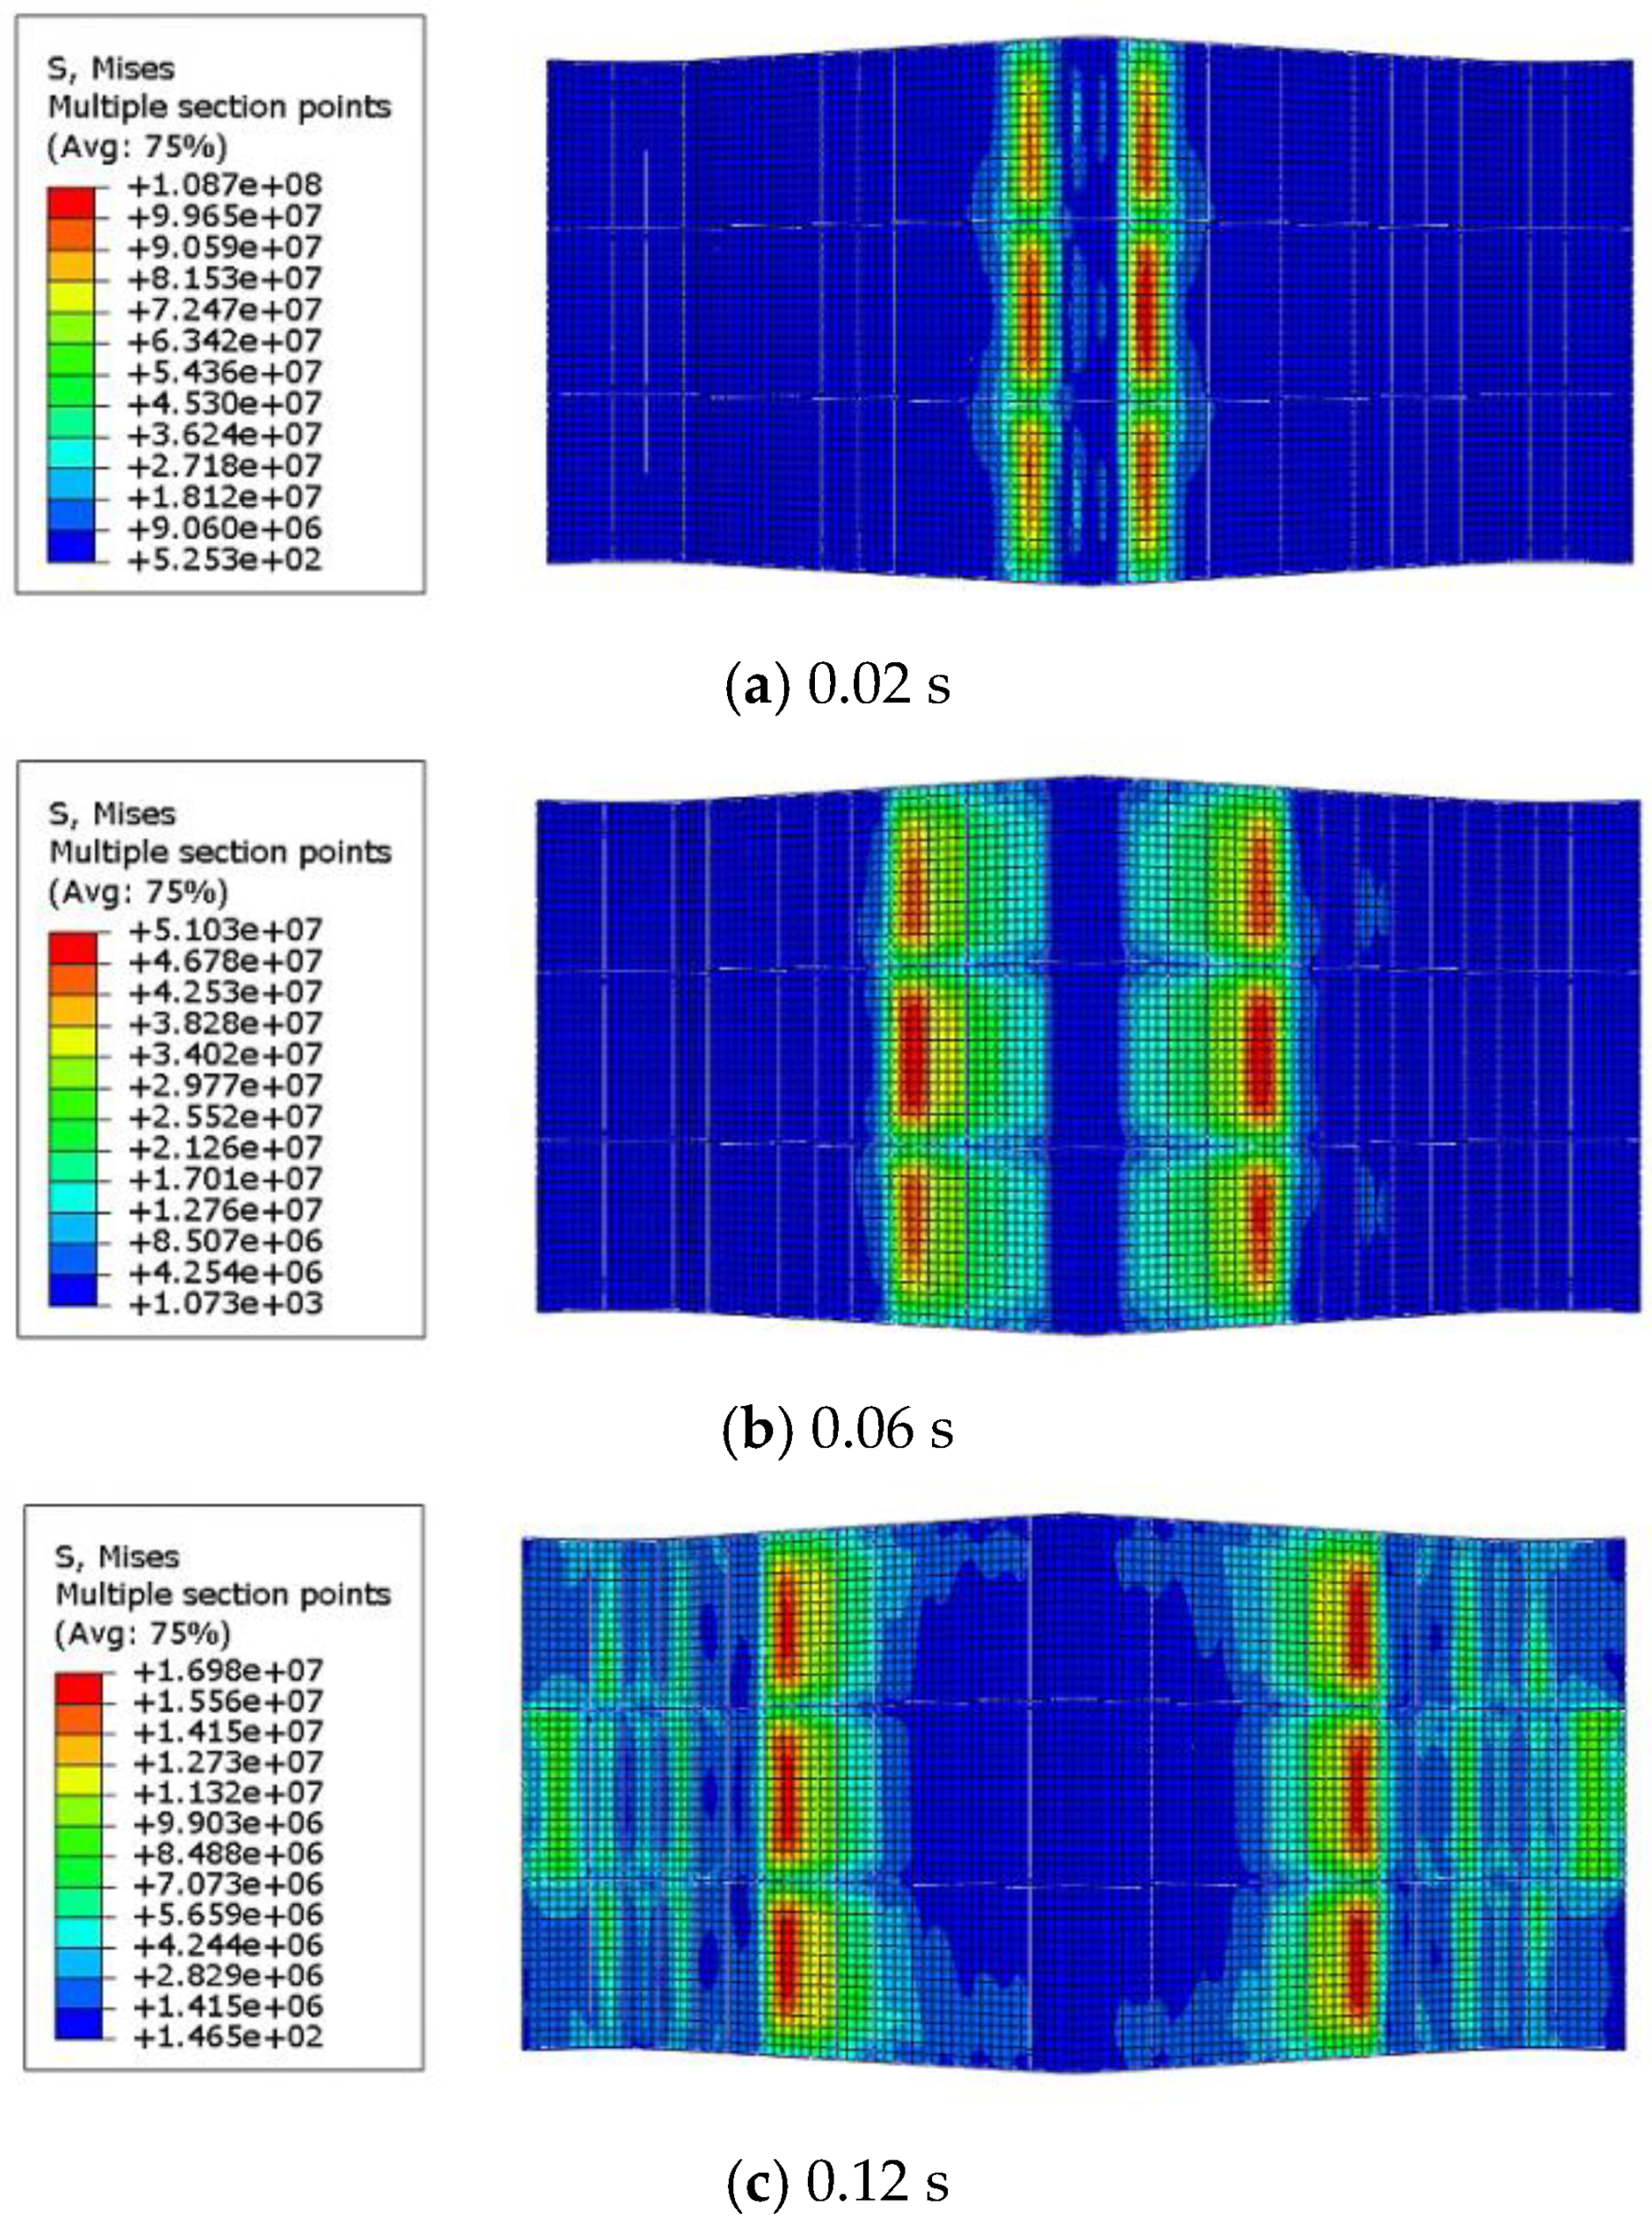
Figure 12 illustrates the stress diagram at various time points; the unit is Pascal (Pa). The location of maximum stress consistently shifts to both sides as the depth of water entry increases. Stresses within the submerged section of the structure steadily diminish with escalating depth of water entry.

4.3. Effects of the Structural Deformation

The aim of this paper is to propose a good compromise between the cost of the computation and accuracy; therefore, the impact of structural deformation is examined below.
The CFD model and FEA model were developed separately using the modeling approach in Section 4.1. The analysis of elastic cabin structure water entry at different velocities was carried out. The effect of deformation on the analysis of water entry is discussed concerning the relationship between the velocity of water entry and the peak vertical impact load.
Figure 13a compares the peak vertical impact loads at different velocities between the elastic and rigid cabin structure water entry analyses. Figure 13b illustrates the error between the elastic and rigid cabin structure under different velocities. With increasing water entry velocity, the error between elastic and rigid cabin structure water entry analyses grows.
To quantitatively analyze the effects of deformation, the dimensionless parameter δ is introduced as follows:
δ = 100 u max D
where u max is the maximum deformation of the structure during water entry of the cabin structure and D is the length of the bottom wedge of the cabin structure (1.27 m in the current study). To better illustrate the deformation trend, Figure 14 displays the maximum skin deformation magnified by a factor of 10.
The comparison yields the following conclusions:
(a)
At low speeds, the structural deformation is small ( δ 0.835 ) and the errors between the elastic and rigid cabin structure water entry analyses are kept below 5%. Conducting rigid cabin structure water entry analysis effectively reduces calculation costs while maintaining accuracy.
(b)
At high speeds, results from the rigid cabin structure water entry analysis exceed those from the elastic analysis and errors will increase as speed rises.
The analysis results show that the relationship between the maximum deformation and the geometric parameters can help to determine whether it is suitable to assume the structure is rigid. The structure investigated in the study is wedge-shaped and the relationship between the maximum deformation and the length of the wedge bottom can be reflected by calculating the dimensionless parameter δ . The threshold of the critical value δ is established based on the acceptable error. When δ is over the critical value, the structural deformation must be considered, which indicates the above empirical formula is not feasible. Thus, the empirical formula can be corrected by including the effect of the structural deformation:
F y = C β ρ v 2 2 S + Δ F y
where Δ F y is the function of the structural stiffness, which represents the error between elastic and rigid cabin structure. With the increased stiffness, the absolute value of Δ F y will be reduced. Analyzing the data against the results in this paper shows that Δ F y is proportional to the cube of velocity.
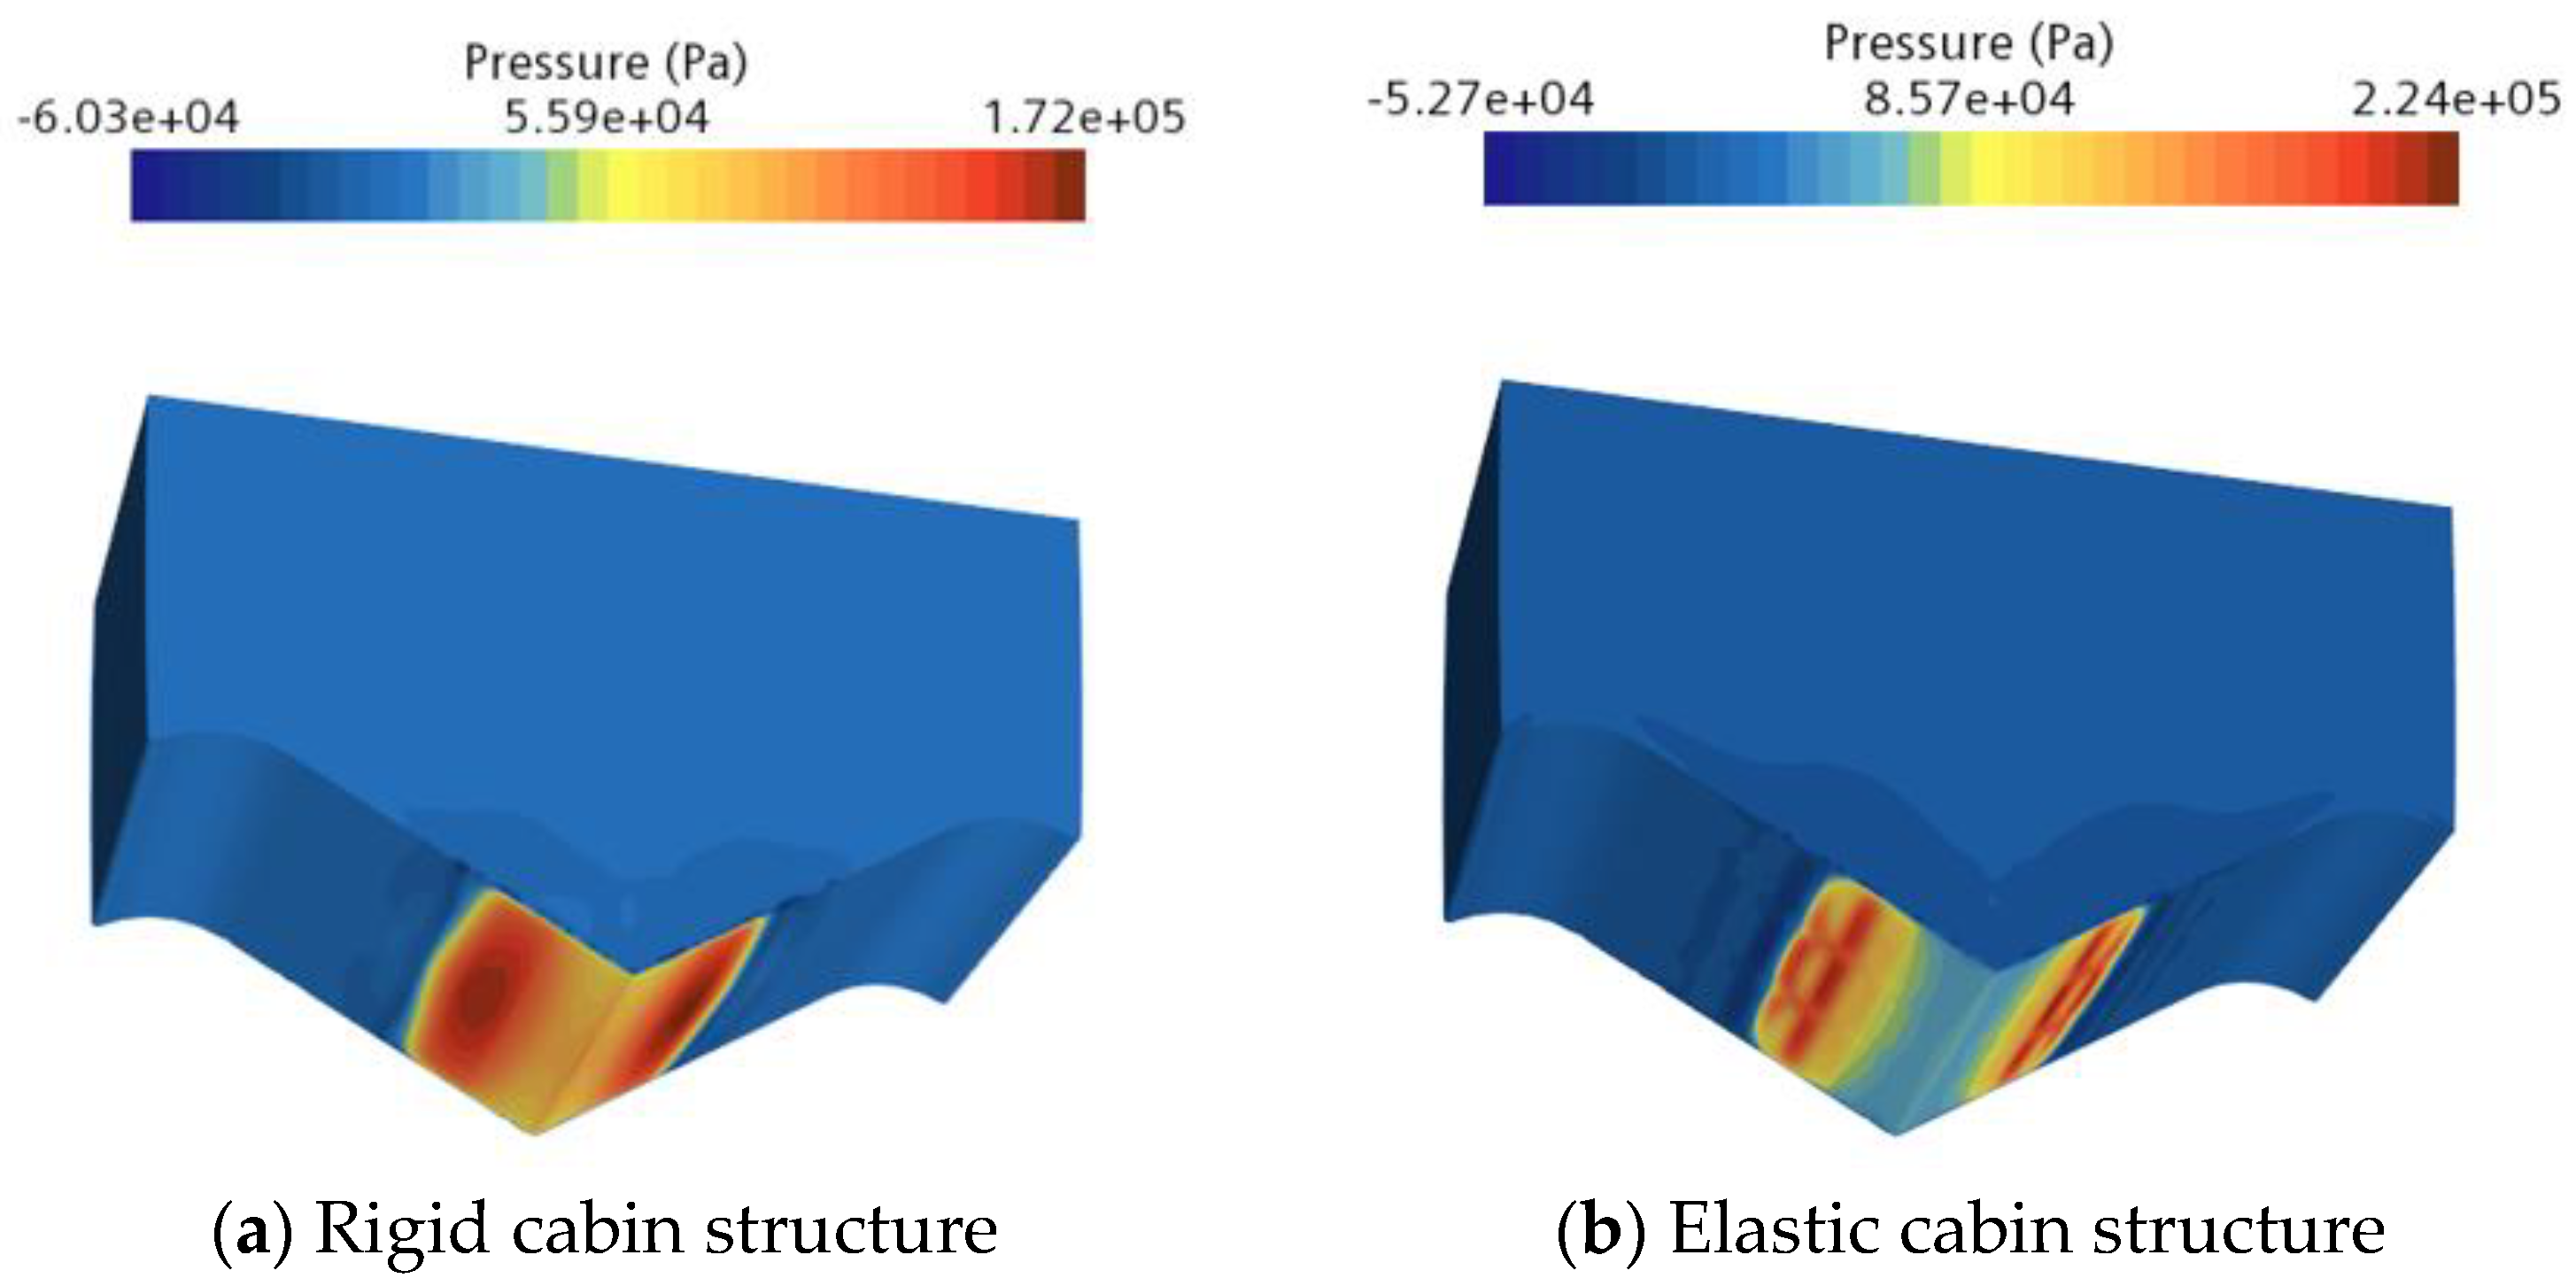
Figure 15 compares the surface pressure of elastic and rigid structures’ water entry, respectively. In the rigid structure results, the surface pressure distribution is more uniform. In contrast, in the elastic structure results, the surface pressure distribution is more dispersed due to the influence of structural deformation. The pressure is concentrated on the surface with smaller deformation, which indicates that the structural deformation helps disperse the impact load. For scenarios with high water impact intensity, a layer of elastic material can be applied to the surface of the structure to reduce the impact of water entry.

5. Conclusions

This paper focuses on investigating the cabin structure of trans-domain morphing aircraft. Numerical simulation and analysis of the cabin structure’s water entry process are conducted using a fluid–structure interaction method based on CFD and FEA. The following conclusions can be made:
  • The water entry velocity of the cabin structure positively correlates with the intensity of the water entry impact. Under similar model mass conditions, higher velocities result in larger impact response parameters, such as peak acceleration and maximum stress. Increased model mass makes it difficult to change the motion state due to inertia, resulting in decreased peak acceleration under identical velocity conditions.
  • An empirical formula is derived to predict vertical impact loads when the structural deformation is not considered. Additionally, a dimensionless parameter is introduced to quantitatively assess the relationship between maximum structural deformation and characteristic geometry parameters. The critical value of the dimensionless parameter can be determined based on acceptable error thresholds. The empirical formula, which includes the difference due to the structural deformation is proposed. This helps reduce computational costs while ensuring robustness.
  • Structural deformation helps to disperse the impact load. In the rigid structure, the surface pressure distribution is more uniform. In the elastic structure, the pressure is concentrated on the surface that is in contact with the water, where deformation is small.
In conclusion, the fluid–structure interaction method based on CFD and FEA coupling effectively conducts a numerical analysis of cabin structure water entry. It provides a design and analysis tool for the structural optimization for trans-domain morphing aircraft.
However, the current study only addresses static water entry analysis. Future research could consider the effects of waves for a deeper understanding of the water entry process.

Author Contributions

Conceptualization, Y.Z. and C.W.; methodology, Y.Z., C.W. and J.Z.; software, Y.Z. and Z.H.; validation, Q.H. and S.D.; formal analysis, Y.Z.; investigation, Y.Z. and Z.H.; resources, C.W. and X.S.; data curation, Q.H., S.D. and J.Z.; writing—original draft preparation, Y.Z.; writing—review and editing, C.W.; visualization, Z.H. and T.W.; supervision, C.W., X.S. and T.W.; project administration, Z.H.; funding acquisition, X.S. and Q.H. All authors have read and agreed to the published version of the manuscript.

Funding

This research was funded by the National Natural Science Foundation of China (Grant No. 52305262), the Starting Grant of Nanjing University of Aeronautics and Astronautics, and the State Key Laboratory of Aerodynamics (Grant No. RAL202204-5).

Data Availability Statement

The data presented in this study are available on request from the corresponding author.

Conflicts of Interest

The authors declare no conflicts of interest.

References

  1. Montano, F.; Dimino, I.; Milazzo, A. A Preliminary Evaluation of Morphing Horizontal Tail Design for UAVs. Aerospace 2024, 11, 266. [Google Scholar] [CrossRef]
  2. Wang, H.; Huang, Z.; Guo, Z. Numerical study on the influence of floating ice on the water-exit hydrodynamic characteristics of a trans-media vehicle. J. Phys. Conf. Ser. 2023, 2478, 112008. [Google Scholar] [CrossRef]
  3. Deng, F.; Sun, X.; Chi, F.; Ji, R. A Numerical Study on the Water Entry of Cylindrical Trans-Media Vehicles. Aerospace 2022, 9, 805. [Google Scholar] [CrossRef]
  4. Fabian, A.; Feng, Y.; Swartz, E.; Thurmer, D.; Wang, R. Hybrid Aerial Underwater Vehicle. MIT Lincoln Lab. Available online: https://phoenixfiles.olin.edu/ (accessed on 25 May 2024).
  5. Liao, B.; Feng, J.; Qi, D.; Li, Y.; Yu, Z. Aerodynamic/hydrodynamic characteristics analysis of a shape-variable transmedia vehicle. Flight Dyn. 2016, 34, 44–47, 57. [Google Scholar]
  6. Stewart, W.; Weisler, W.; MacLeod, M.; Powers, T.; Defreitas, A.; Gritter, R.; Anderson, M.; Peters, K.; Gopalarathnam, A.; Bryant, M. Design and demonstration of a seabird-inspired fixed-wing hybrid UAV-UUV system. Bioinspiration Biomim. 2018, 13, 056013. [Google Scholar] [CrossRef] [PubMed]
  7. Weisler, S.; Stewart, F.; Anderson, R.; Peters, K.J.; Gopalarathnam, A.; Bryant, M. Testing and characterization of a fixed wing cross-domain unmanned vehicle operating in aerial and underwater environments. IEEE J. Ocean. Eng. 2017, 43, 969–982. [Google Scholar] [CrossRef]
  8. Yao, G.; Li, Y.; Zhang, H.; Jiang, Y.; Wang, T.; Sun, F.; Yang, X. Review of hybrid aquatic-aerial vehicle (HAAV): Classifications, current status, applications, challenges and technology perspectives. Prog. Aerosp. Sci. 2023, 139, 100902. [Google Scholar] [CrossRef]
  9. Von Kármán, T. The impact on seaplane floats during landing. In National Advisory Committee for Aeronautics—Technical Note; NASA: Washington, DC, USA, 1929; p. 321. [Google Scholar]
  10. Wagner, H. Über Stoß- und Gleitvorgänge an der Oberfläche von Flüssigkeiten. Z. Für Angew. Math. Und Mech. 1932, 12, 193–215. [Google Scholar] [CrossRef]
  11. Courant, R.; Shiffman, M.; Spencer, D.C. The Force of Impact on a Sphere Striking a Water Surface; Creative Media Partners: London, UK, 1945. [Google Scholar]
  12. Trilling, L. The Impact of a Body on a Water Surface at an Arbitrary Angle. J. Appl. Phys. 1950, 21, 161–170. [Google Scholar] [CrossRef]
  13. Steiner, M. Ditching Behavior of Military Airplanes as Affected by Ditching Aids; Technical Report Archive & Image Library; NASA: Washington, DC, USA, 1945. [Google Scholar]
  14. Fisher, L.J.; Windham, J.O. Water-Landing Characteristics of a 1/10-Scale Model of a Winged Missile (Water Landing Characteristics of Winged Missile Scale Model); NASA: Washington, DC, USA, 1967. [Google Scholar]
  15. Shibue, T.; Ito, A.; Nakayama, E. Structural Response Analysis of a Cylinder under Water Impact. J. Soc. Nav. Archit. Jpn. 1993, 174, 479–484. [Google Scholar] [CrossRef] [PubMed]
  16. Arai, M.; Miyauchi, T. Numerical Simulation of the Water Impact on Cylindrical Shells Considering Fluid-structure Interaction. J. Soc. Nav. Archit. Jpn. 1997, 182, 827–835. [Google Scholar] [CrossRef] [PubMed]
  17. Wittlin, G.; Smith, M.; Sareen, A.; Richards, M. Airframe water impact analysis using a combined MSC/DYTRAN-DRI/KRASH approach. In Annual Forum Proceedings—American Helicopter Society; Vertical Flight Society: Fairfax, VA, USA, 1997; Volume 53, pp. 1138–1150. [Google Scholar]
  18. Sun, H.; Faltinsen, O.M. The influence of gravity on the performance of planing vessels in calm water. J. Eng. Math. 2007, 58, 91–107. [Google Scholar] [CrossRef]
  19. Wu, G.X.; Sun, H.; He, Y.S. Numerical simulation and experimental study of water entry of a wedge in free fall motion. J. Fluids Struct. 2004, 19, 277–289. [Google Scholar] [CrossRef]
  20. Zhao, R.; Faltinsen, O. Water entry of two-dimensional bodies. J. Fluid Mech. 1993, 246, 593–612. [Google Scholar] [CrossRef]
  21. Pantousa, D.; Mistakidis, E. Interface modeling between CFD and FEM analysis: The dual layer post-processing model. Eng. Comput. 1984, 34, 1166–1190. [Google Scholar] [CrossRef]
  22. Kang, T.; Tian, Z.; Zhang, Y.; Li, J. Numerical Wave Simulation using Geometrical VOF Method Based on OpenFOAM. Shànghăi Jiāotōng Dàxué Xuébào 2021, 55, 1–10. [Google Scholar]
  23. Fuhrman, D.R.; Li, Y. Instability of the Realizable k–ε Turbulence Model Beneath Surface Waves. Phys. Fluids 2020, 32, 115108. [Google Scholar] [CrossRef]
  24. Chen, G.M.; Zheng, X.B.; Wu, X.N.; Zhang, H.X.; Li, Y. Numerical and experimental study of water entry problem of two-dimensional wedge. Ship Sci. Technol. 2021, 43, 53–60. [Google Scholar]
  25. CD-adapco. 11.04_STAR-CCMP_Tutorial+Guide_ZH, A Siemens Business, Germany. 2016. Available online: https://oss.jishulink.com/upload/202012/a8a4fad57be24f3c8ff81740124ac327.pdf (accessed on 6 June 2024).
  26. Datta, N.; Siddiqui, M.A. Hydroelastic analysis of axially loaded Timoshenko beams with intermediate end fixities under hydrodynamic slamming loads. Ocean Eng. 2016, 127, 124–134. [Google Scholar] [CrossRef]
  27. Song, B.W.; Du, X.X.; Meng, R.; Li, J.W.; Shao, C. Numerical simulation of water-entry impact force for air-launched mine. Torpedo Technol. 2008, 3, 6–8, 12. [Google Scholar]
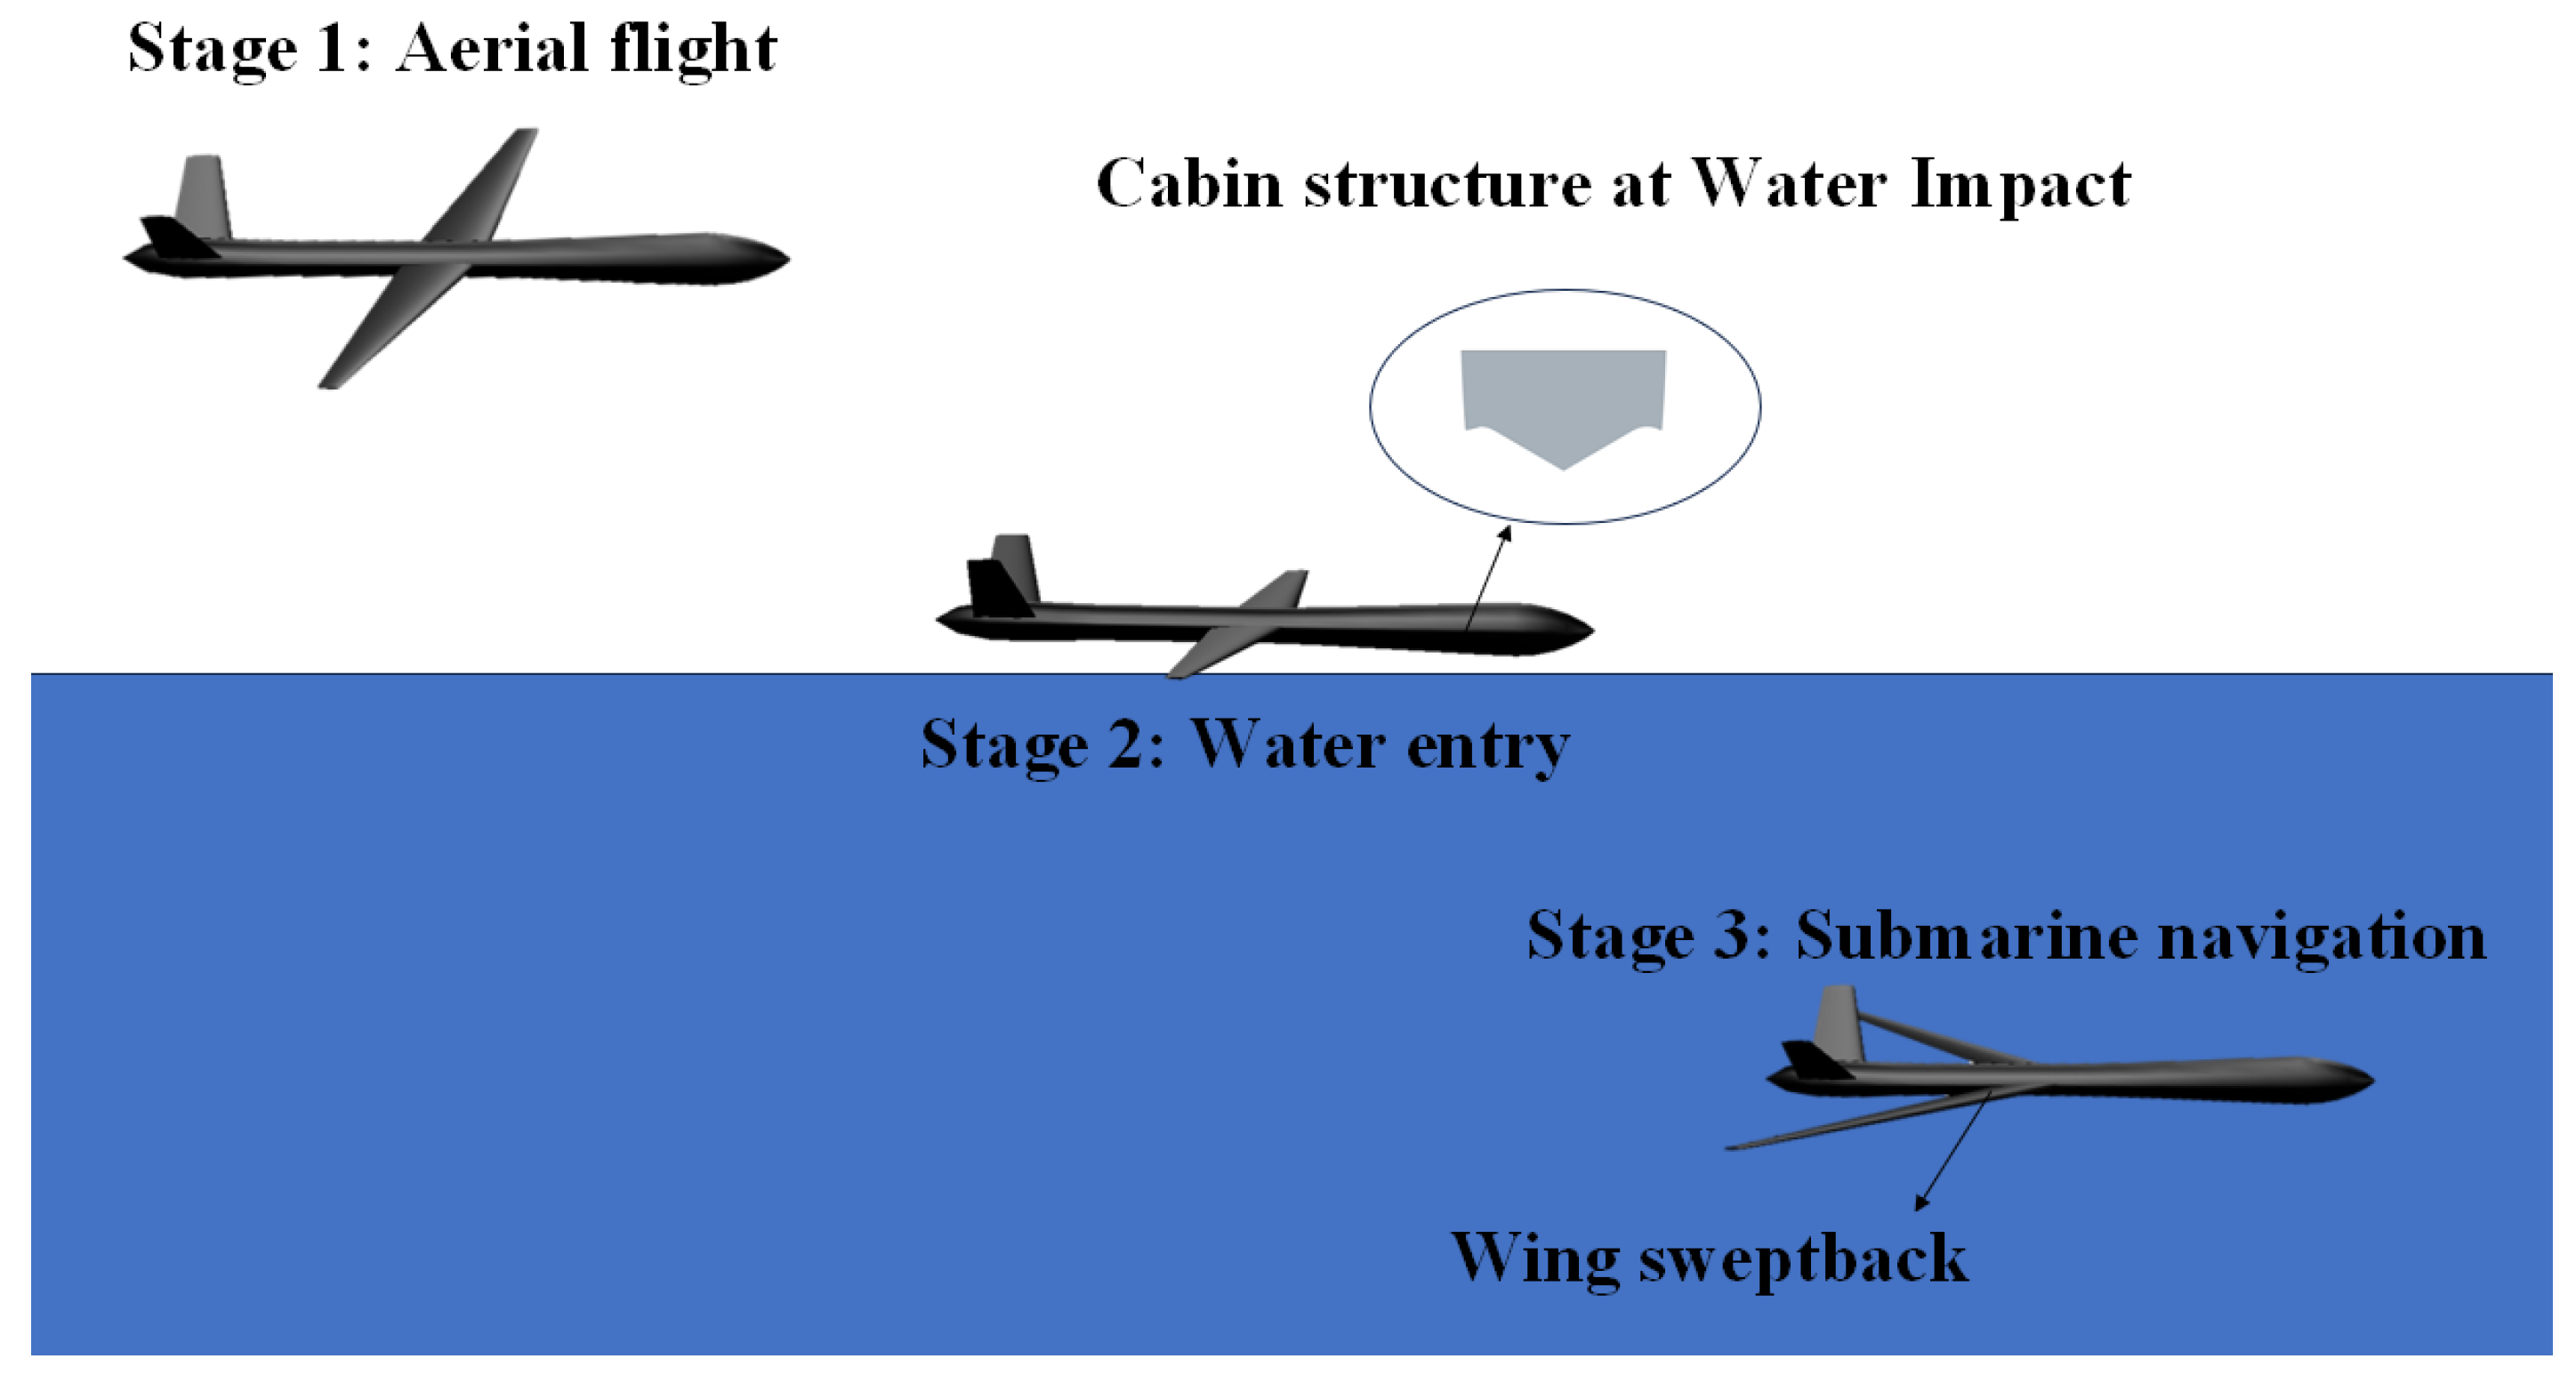
Figure 1. Water entry process of trans-domain morphing flight vehicle.
Aerospace 11 00611 g001
Figure 2. Schematic diagram of dimensionless parameters.
Aerospace 11 00611 g002
Figure 3. Comparison chart between experiment and simulation.
Aerospace 11 00611 g003aAerospace 11 00611 g003b
Figure 4. Computational domain.
Aerospace 11 00611 g004
Figure 5. CFD mesh.
Figure 5. CFD mesh.
Aerospace 11 00611 g005
Figure 6. Numerical results.
Aerospace 11 00611 g006
Figure 7. Three-dimensional phase diagram.
Aerospace 11 00611 g007
Figure 8. Phase diagram of the gas–liquid interface.
Aerospace 11 00611 g008
Figure 9. Data fitting curve.
Aerospace 11 00611 g009
Figure 10. Flowchart for coupling calculation.
Aerospace 11 00611 g010
Figure 11. Cabin structure.
Aerospace 11 00611 g011
Figure 12. Stress diagram.
Aerospace 11 00611 g012
Figure 13. Comparisons between rigid and elastic cabin structure water entry analyses.
Aerospace 11 00611 g013
Figure 14. Schematic diagram of structural deformation (magnified 10 times).
Aerospace 11 00611 g014
Figure 15. Rigid (a) and elastic (b) cabin structure water entry surface pressure diagrams.
Aerospace 11 00611 g015
Table 1. Comparison of results (the height of entry is 0.1 m).
Time/s α (Simulation) α (Experiment)Error β (Simulation) β (Experiment)Error
0.050.4840.5176.38%0.3040.2808.57%
0.1360.3260.3414.38%0.1160.1289.54%
Table 2. Comparison of vertical peak acceleration for different number of meshes.
Number of Meshes 2.73 Million3.73 Million5.12 Million
Vertical peak acceleration 41.79 m/s241.94 m/s241.78 m/s2
Disclaimer/Publisher’s Note: The statements, opinions and data contained in all publications are solely those of the individual author(s) and contributor(s) and not of MDPI and/or the editor(s). MDPI and/or the editor(s) disclaim responsibility for any injury to people or property resulting from any ideas, methods, instructions or products referred to in the content.