Article

The Bond Graph Modeling and Experimental Verification of a Hydraulic Inertial Vibration Isolator Including Nonlinear Effects

by
Niuniu Liu
1,
Cheng Li
1,
Liwei Zhang
1,
Zhiyang Lei
2,
Jing Yang
3 and
Fuqiang Lai
1,*
1
School of Mechanical Engineering and Automation, Fuzhou University, Fuzhou 350108, China
2
National Key Laboratory on Ship Vibration & Noise, China Ship Development and Design Center, Wuhan 430064, China
3
Longhe Intelligent Equipment Manufacturing Co., Ltd., Longyan 364101, China
*
Author to whom correspondence should be addressed.
Aerospace 2024, 11(8), 634; https://doi.org/10.3390/aerospace11080634
Submission received: 6 June 2024 / Revised: 25 July 2024 / Accepted: 31 July 2024 / Published: 2 August 2024

Abstract

:
Passive vibration isolation techniques with low-frequency characteristics have been a hot topic in the aerospace field. A hydraulic inertial vibration isolator is a highly effective type of isolator for controlling low-frequency vibrations. It typically consists of a main spring, a minor spring, an inertial mass, and a fluid domain. Due to its multi-domain nature, analyzing the isolation mechanism of this type of isolator is challenging. The bond graph method is employed to establish the dynamic model of the isolator. Subsequently, the state equations of the isolator are derived, and the energy equations of both the mechanical and the fluid parts of the isolator are obtained. Based on this, the energy transfer characteristics between the mechanical and fluid domains inside the isolator under external excitation are discussed. The time-domain response of the forces transmitted to the foundation is analyzed. It is shown that the anti-resonance frequency occurs when the forces transmitted to the foundation generated by the main spring and the fluid pressure are equal to that of the minor spring. To verify the proposed method’s correctness, a prototype of the isolator is designed and a carefully designed experiment is conducted. The acceleration transmissibility of the isolator is used to conduct a comparative study. The results show that the theoretical results are in good agreement with the experimental results. To depict the dynamic characteristics of the isolator under large amplitude vibration, the nonlinear dynamic model of the isolator is developed, and the corresponding force transmissibility of the isolator is formulated. The energy flow between the mechanical and the fluid domains under this condition is also analyzed. The results indicate that the energy flow responses exhibit a similar change tendency to the force transmissibility. However, the peak of the energy ratio between the mechanical subsystem and the fluid is the same as the linear condition, suggesting that this value is determined by the amplification ratio of the isolator. This research provides enhanced physical insight to understand the dynamic characteristics of this type of isolator and will help to shorten the design cycle of the isolator.

1. Introduction

Reducing vibration in the low-frequency range has become a hot topic in recent years. One type of band-stop vibration isolator is formed by anti-resonance frequencies. One method to achieve an anti-resonance frequency is by using the dynamic anti-resonance vibration isolator (DAVI). The development of this new type of vibration isolator stemmed from the stringent requirements for the stiffness and mass of isolators used in the aerospace industry. Anti-resonance occurs when the inertial force generated by the leveraged mass cancels the spring force. The introduction of the lever allows the isolator to use a small mass to generate a large inertial force. This superiority has made the isolator widely used in the aerospace industry [1,2,3].
To broaden the bandwidth of the DAVI, many scholars had conducted extensive research. Long [4] demonstrated that by coupling the DAVI with a nonlinear vibration absorber, the numerical and experimental results show that the proposed isolator can increase its stopband width. Deng [5] designed a tunable lever-type anti-resonant isolator by adding a electromagnetic spring between the isolator mass and its base. The results show that a broad stop-band can be obtained by altering the current in the electromagnetic spring. Yan [6] proposed a new lever-type vibration isolator with an eddy current. The theoretical and experimental studies show that the new isolator can improve the vibration suppression performance compared to traditional DAVI. He also introduced an electromagnet shunt damping [7] between the main mass and the inertial mass to improve the isolation performance of the traditional DAVI. Yilmaz [8] designed a self-tuning adaptive DAVI by introducing an elastic-fin-type actuator under the payload mass hinge, and the experimental results validate its effectiveness. However, there are some drawbacks for the mechanical type of the DAVI. Due to the introduction of the lever, a large space is required to install it. Furthermore, the forces transmitted to the foundation by the spring and the inertial mass do not act on the same point. This leads to a dynamic moment on the foundation, which deteriorates the vibration isolation.
To overcome the drawbacks, some hydraulic types of DAVI has been developed. Braun [9] presented a fluid-type DAVI, essentially composed of two different sectional bellows, where the ratio between the two sectional areas is equivalent to the lever ratio of the mechanical DAVI. The prototype of the isolator is manufactured and the experimental is conducted; the results show good agreement with the theoretical results. Halwes [10] utilized the hydraulic fluid as the vibration absorber mass, resulting in a compact arrangement. Building on this isolator, Plooy [11] employed two adjustable air springs positioned at the two ends of the isolator to make its isolation frequency tunable. Liu [12] used a hydraulic cylinder and a small bellow to design the fluid-type DAVI and proposed a new mathematical model to predict its isolation performance. Gao [13] proposed a novel bellow-type hydraulic inertia-based DAVI; the numerical and experimental results show good agreement. The numerical and experimental results of the fluid-type DAVI show that they can provide the same level of isolation performance as the mechanical-type DAVI, but in a more compact size.
However, the dynamic modelling of the fluid-type DAVI is more challenging than its mechanical counterpart. According to the references [9,11,13,14,15], there are mainly two different methods to establish the dynamic equations of the isolator. One approach is to simplify the fluid-type DAVI to a lumped parameter model and then use D‘Alembert’s principle or Lagrange’s equations to derive the dynamic model. The other approach is to use the fluid–structure interaction (FSI) finite element analysis (FEA) method to simulate the fluid–structure interaction process during vibration. The former lumped parameter model cannot reflect the energy transfer process between the structure and the fluid inside it during the vibration process. The finite element fluid–structure method is computationally intensive, requires high computer specifications, and involves complex parameter settings. Therefore, it is necessary to seek compromises between an accurate and a detailed representation of this multi-domain field analysis.
The bond graph method [16,17,18,19] is a modeling technique that visually represents energy flow within a dynamic system. It utilizes elements such as inertia, a capacitor, a resistor, and energy conservation to depict the system’s behavior. This method is characterized by its emphasis on connectivity, ensuring a consistent model representation across different energy domains. It also aids in identifying appropriate state variables and resolving system causality issues. Additionally, the bond graph method facilitates the generation of the system’s state equations in a straightforward manner. The bond graph method, by supporting and encouraging multidisciplinarity and object-oriented modeling, offers a flexible foundation for constructing and exploring models of different complexities. Up to now, to the authors’ knowledge, no one has used this method to model the dynamic behavior of the fluid-type DAVI.
Considering thickness effects and out-of-plane loads (including torsion), a mechanical DAVI [20] exhibits nonlinear characteristics, which necessitates the construction of a nonlinear dynamic model [21,22,23] for analysis. As mentioned, the rubber ring is usually used as the main source of stiffness in the hydraulic DAVI. It is well known that under large deformation, the rubber [24] exhibits nonlinear characteristics. Therefore, nonlinear computational methods have been developed to predict the dynamic characteristics of these nonlinear systems. In the frequency domain, the harmonic balance method [25,26] is typically used to calculate the amplitude–frequency responses of the nonlinear systems. In the time domain, the Runge–Kutta method [27] and the Newmark-β method [28] are used to obtain the time responses of the nonlinear structures. These methods are effective when the main system is in the single energy domain; however, they become ineffective when the system spans multiple energy domains. Conversely, the bond graph method, by using state equations, can establish the nonlinear dynamic model of a multi-domain system in a unified form. Therefore, the bond graph method is used in this paper to investigate the nonlinear effects of the hydraulic DAVI due to a rubber ring.
In this study, a fluid-type of DAVI, composed of a hydraulic cylinder with a small bellow inside, is taken as an example to use the bond graph method to establish its dynamic model. The remainder of this paper is organized as follows: In Section 2, the coupled model of the fluid-type DAVI is established. Section 3 formulates the force transmissibility of the isolator and derives the power and energy flow between the mechanical part and fluid during the vibration process. Section 4 describes the construction of a prototype isolator and the experimental verification of the method presented in this paper. Section 5 investigates the nonlinear effects of the hydraulic DAVI under large amplitude vibration. Finally, Section 6 provides some concluding remarks.

2. Fluid–Structure Interaction Modeling

Figure 1 shows the diagram of the hydraulic DAVI. It can be seen that the isolator is mainly composed of a main mass, a rubber ring, a hydraulic cylinder, and a small bellow with inertial mass. The interior of the isolator is filled with incompressible liquid. The effective cross-sectional area ratio between the cylinder and the bellow is the amplifier ratio acting as the lever ratio of the mechanical-type DAVI. The rubber ring acts as the main stiffness of the isolator, and it is also used to seal the incompressible fluid inside.

2.1. Mechanical Subsystem Modeling

As mentioned earlier, the mechanical part of the isolator can be divided into two parts: one represented by subsystem 1, consisting of the main mass M , a rubber ring characterized by its stiffness K 1 and damping B r 1 , and the other denoted as subsystem 2, composed of an inertial mass m i s , and a small bellow characterized by its stiffness K 3 and damping B r 3 .
Figure 2 shows the flowchart of the bond graph modeling process for mechanical subsystem 1. In Figure 2a, a 1 junction is shown such that any bonds that are connected to this junction will have the velocity V M , and a second 1 junction is shown such that any bonds connected to it will have the reference velocity of zero. The main mass is a inertia I that has the absolute velocity, V M , so the I element is attached to that 1 junction. The harmonic force, S e , is modeled as an effort source in the bond graph (any force that is a known input to a system, whether time varying or constant, is modeled as an effort source in a bond graph). Since this force is moving at the velocity V M , the effort source S e is attached to the 1 junction representing this velocity. A flow source S f equal to zero is attached to the reference 1 junction to enforce that the velocity is zero.
For step 2, shown in Figure 2b, 0 junctions are used to establish the relative velocity across the rubber ring V M V r e f , attached to the corresponding capacitor and resistor. Thus, the complete model of mechanical subsystem 1 is constructed. However, there are some simplifications that could be carried out for this model. The flow source S f could be removed because it is a zero-power bond. The relative velocity is established using a single 0 junction, and then a 1 junction is used to ensure that any bond attached to that 1 junction will have the relative velocity, V M V r e f . Since both the C and R elements have this relative velocity, they both get attached to the 1 junction, as shown in Figure 2c.
Similarly, the bond graph model for mechanical subsystem 2 can be established using the aforementioned method, as shown in Figure 3.

2.2. Hydraulic Subsystem Modeling

The incompressible fluid in the isolator is characterized by its liquid damping B r 2 , and the volume flexibility C 21 and C 22 represent the volumetric compliance of the rubber ring and the small bellow, respectively.
Figure 4 shows the flowchart of the bond graph modeling process for the hydraulic subsystem. The compliance of the rubber ring and the bellow generates pressures P 1 and P 2 , respectively, in the dynamic response of the net flow. These pressures and the corresponding compliance are displayed in Figure 4a. The elements are inserted as shown in Figure 4b. The resistance effect is inserted directly between the pressures P 1 and P 2 by the 1 junction.

2.3. Mechanical–Hydraulic Coupling

The aim of this section is to couple the hydraulic part and the mechanical part of the isolator.
A hydraulic piston transducer can be used for coupling by the bond graph theory. The bond graph model of the hydraulic piston transducer is shown in Figure 5.
In the figure, m 1 represents the effective cross-sectional area of the hydraulic cylinder, and m 2 represents the effective cross-sectional area of the bellows. The physical meaning is represented by these two transducers T F as follows:
F 1 = m 1 P 1 ,   m 1 V 1 = Q 1 ,   F 1 V 1 = P 1 Q 1 P 2 = 1 m 2 F 2   ,   1 m 2 Q 2 = V 2   ,   P 2 Q 2 = F 2 V 2
where F 1 and V 1 are the force and velocity on the lower surface of the main mass, respectively. F 2 , and V 2 are the force and velocity on the upper surface of the inertial mass, P 1 and Q 1 are the pressures and flow rates of the liquid in the vicinity of the lower surface of the main mass, and P 2 and Q 2 are the pressures and flow rates of the liquid in the vicinity of the upper surface of the inertial mass.
Coupling the mechanical and hydraulic subsystems through transducers m 1 and m 2 , and adding causality according to the bond graph theory, a bond graph model of the hydraulic DAVI was established as shown in Figure 6. The red numbers in Figure 6 represent the serial numbers of the bonds.

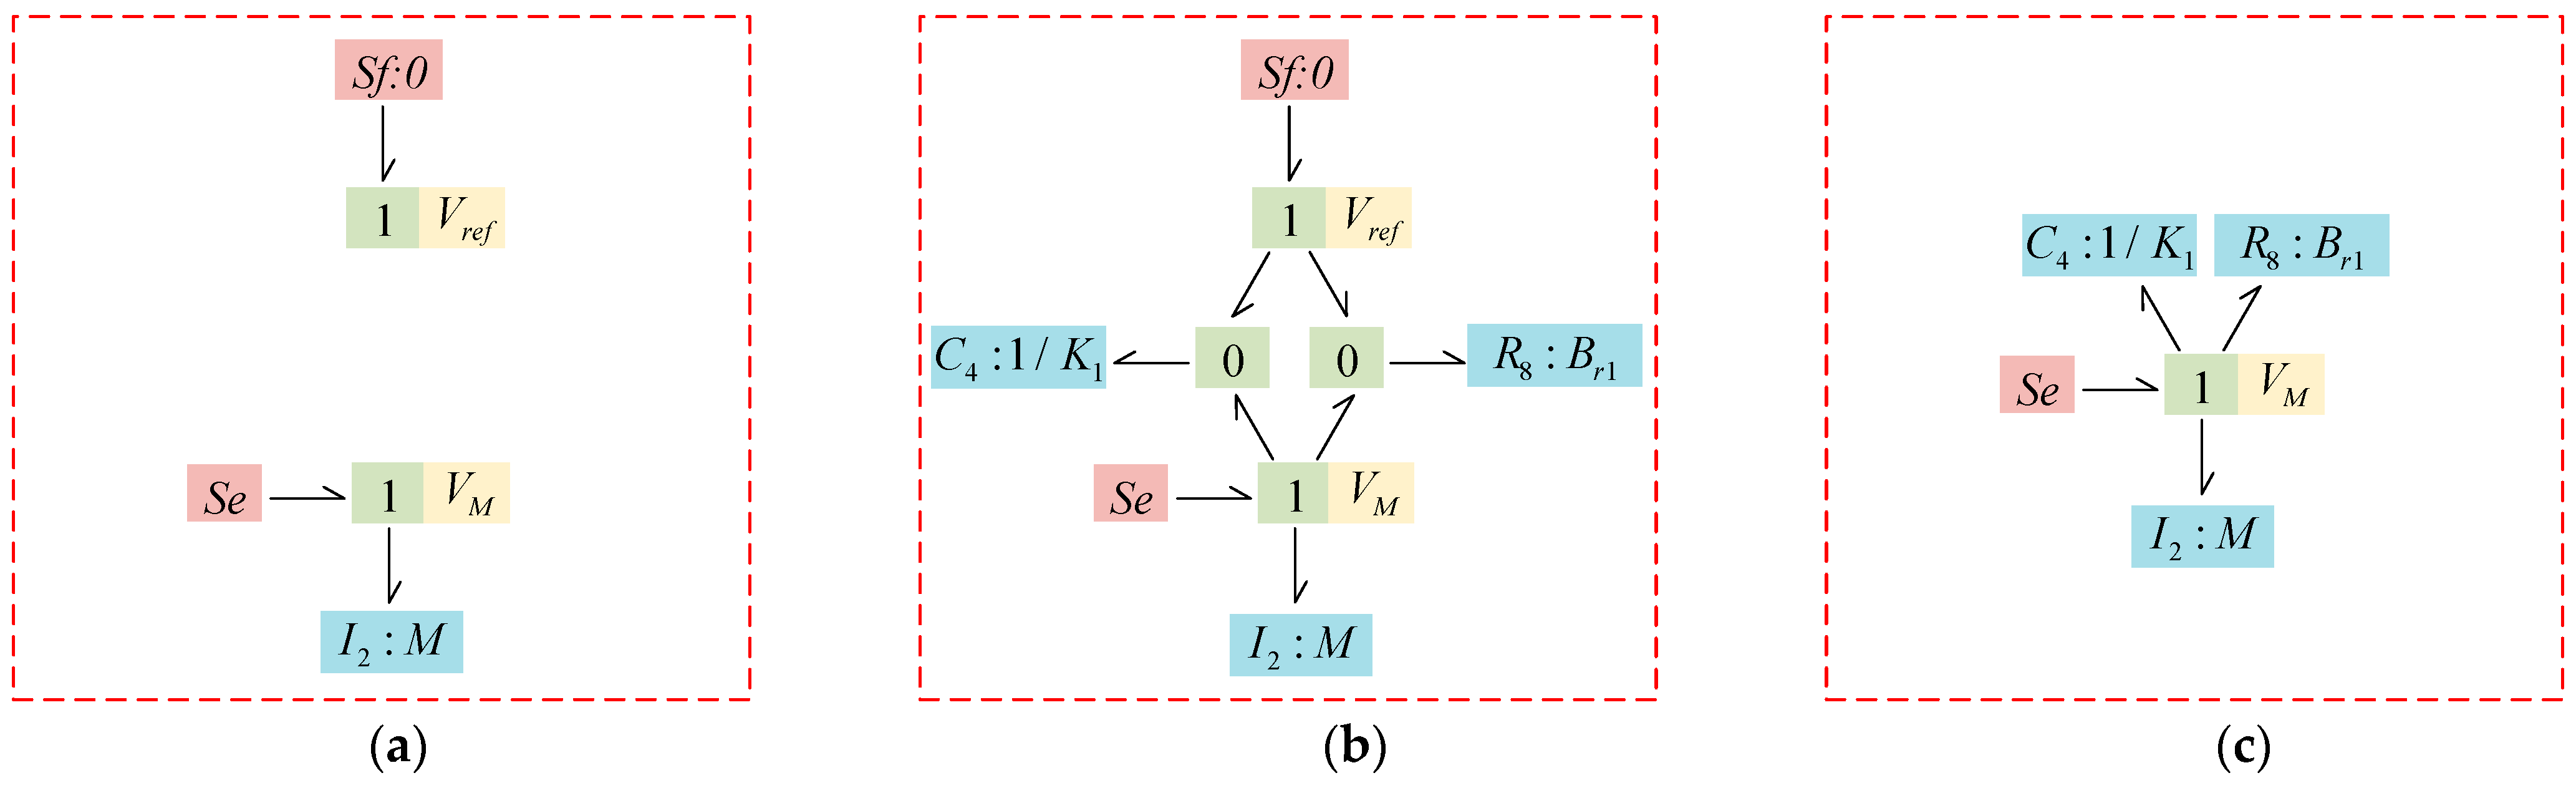
3. Dynamic Modeling and Energy Flow Analysis

3.1. Dynamic Modeling

Based on the bond graph model, a dynamic model of the vibration isolator system is derived. The first step is to determine the state variables X
X = p 2 p 3 q 4 q 5 q 6 q 7 T
where p 2 and p 3 are the momentum of the main mass and inertial mass, q 4 and q 7 are the relative displacements due to the stiffness of the rubber ring and bellows, and q 5 and q 6 are the volume of liquid due to the volumetric flexibility of the rubber ring and bellows.
Based on the bond graph theory, the system dynamics model can be represented as
X ˙ = A X + B S e
where X ˙ is the first-order derivative of the system state variable X , and A and B are the coefficient matrices of the system. S e is the input force acting on the upper end of the main mass.
The bond graph method is a modeling technique based on the principle of energy conservation. Its most fundamental components include a capacitor, inertia, and a resistor. The physical meaning of the capacitor, inertia, and resistor is expressed as
f ( t ) = p ( t ) I 0
e ( t ) = q ( t ) C 0
e ( t ) = R 0 f ( t )
where e ( t ) and f ( t ) are effort and flow variables, respectively; R 0 , I 0 , and C 0 are the resistor, the inertia, and the capacitor, respectively.
Based on the power flow principle of the bond graph and the power-energy characteristics of the common effort junction and common flow junction, the equations of state for p 2 , p 3 , q 4 , q 5 , q 6 , q 7 can be derived as
p ˙ 2 = S e R 8 I 2 p 2 1 C 4 q 4 m 1 C 5 q 5
p ˙ 3 = R 16 I 3 p 3 + m 2 C 6 q 6 1 C 7 q 7
q ˙ 4 = 1 I 2 p 2
q ˙ 5 = m 1 I 2 p 2 1 C 5 R 12 q 5 + 1 C 6 R 12 q 6
q ˙ 6 = m 2 I 3 p 3 + 1 C 5 R 12 q 5 1 C 6 R 12 q 6
q ˙ 7 = 1 I 3 p 3
where p ˙ 2 and p ˙ 3 are the inertial forces of the main and inertial masses, q ˙ 4 and q ˙ 7 are the relative velocities of the rubber ring and the bellows, and q ˙ 5 and q ˙ 6 are the liquid flow rates due to the volumetric flexibility of the rubber ring and the bellows.
Equations (7)–(12) are the six state equations for this system. Since this system is linear, the final step is to place these equations into the standard matrix form of Equation (3); thus, the coefficient matrix A is obtained as
A = R 8 I 2 0 1 C 4 m 1 C 5 0 0 0 R 16 I 3 0 0 m 2 C 6 1 C 7 1 I 2 0 0 0 0 0 m 1 I 2 0 0 1 C 5 R 12 1 C 6 R 12 0 0 m 2 I 3 0 1 C 5 R 12 1 C 6 R 12 0 0 1 I 3 0 0 0 0
The coefficient matrix B is expressed as
B = 1 0 0 0 0 0 T

3.2. Identification of the Viscous Damping

Due to the complex nature of damping, it is generally unknown in advance. In this paper, the half-power bandwidth method is used to identify the damping of the isolator.
According to the vibration theory, generally, the dynamic model of a vibration system can be written as a matrix form as
M x ¨ + C x ˙ + K x = F
where M = M 0 0 m i s m 1 m 2 2 , C = B r 1 + B r 2 B r 2 B r 2 B r 2 + B r 3 m 1 m 2 2 , x = q 4 q 7 , F = S e 0 , K = K 1 + m 1 2 C 21 + C 22 m 1 2 C 21 + C 22 m 1 2 C 21 + C 22 m 1 2 C 21 + C 22 + K 3 m 1 m 2 2 .
According to the given data, the modal shapes Φ and modal frequencies of the isolator are cleared. Then, the modal mass, modal stiffness, and modal damping can be obtained as
M ¯ = Φ T M Φ = m 1 r 0 0 m 2 r
K ¯ = Φ T K Φ = k 1 r 0 0 k 2 r
C ¯ = Φ T C Φ = b r 1 r 0 0 b r 2 r
According to the definition of the half-power bandwidth method, one can obtain
ζ i r = b r i r 2 m i r w i r = w i b w i a 2 w i r b r i r = w i b w i a m i r     i = 1 , 2
where ζ i r , w i r , m i r , and b r i r correspond to the damping ratio, mode frequency, mode mass, and mode damping of the i-th mode of the isolator, respectively.
Once the imaginary part of the frequency response function is given, B r 1 , B r 2 , and B r 3 in the mechanical domain can be obtained by Equations (18) and (19). Since B r 2 belongs to the hydraulic subsystem, it requires transformation according to Equation (20).
B r H = B r M m 1 2
where B r H is the hydraulic damping coefficient, and B r M is the mechanical damping coefficient.

3.3. Force Transmissibility Characteristics

Generally, force transmissibility is used as a quantity to evaluate the isolation performance of the isolator. Based on Equation (3), it can be denoted as
T = 20 L o g 10 A m p ( F F T ( F t ) ) A m p ( F F T ( S e ) )
where F t denotes the forces transmitted to the base of the isolator, and A m p stands for their amplitudes.
The F t contains the reaction force generated by the rubber ring, including its elastic force F K 1 and damping force F B r 1 , the hydraulic force F P and its corresponding damping force F B r 2 , the small bellow elastic force F K 3 and its corresponding damping force F B r 3 . According to Equation (2) to Equation (12), these forces can be obtained, and then F t can be determined as
F t = F K 1 + F B r 1 + F P + F B r 2 + F K 3 + F B r 3         = q 4 C 4 + R 8 q ˙ 4 + q 6 C 6 m 1 m 2 + R 12 q ˙ 5 q ˙ 6 + q 7 C 7 + R 16 q ˙ 7

3.4. Power and Energy Modeling

This subsection analyses the energy flow in the isolator under external excitation force S e . From the bond graph model of the isolator, it can be seen that the energy flows unidirectionally from the mechanical subsystem 1 to the hydraulic subsystem to the mechanical subsystem 2. The energy of the mechanical subsystem 1 is fed by S e , and the energy of the hydraulic subsystem and mechanical subsystem 2 is fed by the transducers m 1 and m 2 .
According to the energy flow characteristics of the vibration isolator system, from the perspective of effort and flow variables, the power models of the mechanical and hydraulic subsystems can be deduced as
P M 1 = P S e = S e f 2 = S e p 2 I 2
P H = e 9 f 9 = m 1 e 10 f 2 = m 1 p 2 q 5 I 2 C 5
P M 2 = e 15 f 15 = m 2 e 14 f 3 = m 2 p 3 q 6 I 3 C 6
where P M 1 and P M 2 are the power of mechanical subsystem 1 and mechanical subsystem 2, and P H is the power of the hydraulic subsystem.
By integrating power over time, the energy of the vibration isolator subsystems can be obtained as
E M 1 = P M 1 d t = S e p 2 I 2 d t
E H = P H d t = m 1 p 2 q 5 I 2 C 5 d t
E M 2 = P M 2 d t = m 2 p 3 q 6 I 3 C 6 d t
where E M 1 and E M 2 are the energy of mechanical subsystem 1 and mechanical subsystem 2, and E H is the energy of the hydraulic subsystem.

4. Numerical Simulations and Experimental Verification

To verify the accuracy of the constructed model, a prototype of the hydraulic DAVI is designed, and it is shown in Figure 7. The parameters of the isolator are listed in Table 1.

4.1. Test of the Transmissibility of the Isolator

Figure 8 shows the photograph of the experimental setup for the transmissibility testing of the hydraulic DAVI. The test setup can be divided into three parts: the excitation system, the data acquisition system, and the object under test.
The excitation system includes a signal generator, a power amplifier, and an electromagnetic vibration table. LMS SCADA is used as the signal generator, the random signal is used, and the excitation frequency range is 20~100 Hz. The electromagnetic vibration table is V8-640, and its useful frequency range is 5–2300 Hz. The vibration amplitude can be changed by adjusting the voltage of LMS; 0.5 V is settled here.
The data acquisition system includes a PC, an LMS data acquisition device, and two acceleration sensors placed on the main mass and base of the vibration isolator. In this test, the sampling frequency of the LMS is set to 400 Hz. The acceleration sensor model is HD-YD-213, which has an operating voltage of 18–28 V, a reference sensitivity of 10.31 mV/m·s−2, a frequency range of 0.5–6 kHz, and a maximum allowable acceleration of 500 m·s−2. The ratio of the signals measured by the two accelerometers is the acceleration transmissibility of the isolator. Since the base excitation is harmonic and the system is deemed linear, the transmissibility calculated by Equation (21) is equivalent to the acceleration transmissibility obtained from the test. Figure 9a shows the transmissibility of the isolator, and Figure 9b gives the imaginary part of the frequency response function. Based on the result, the half-power bandwidth method shown in Equation (15) to Equation (20) is used to obtain the damping of the isolator. The viscous damping coefficients of the isolator are given in Table 2.
According to the parameters given in Table 1 and Table 2, substituting these values into Equation (21), the acceleration transmissibility of the isolator can be obtained, as shown in Figure 10a. It can be observed that the result calculated by Equation (21) is in good agreement with the test result. Two peaks occur at 34.4 Hz and 58.7 Hz, and one anti-resonance peak occurs at 49 Hz. For simplicity, these three peaks are referred to as resonance frequency 1, resonance frequency 2 and anti-resonance frequency. The design principle of the hydraulic DAVI is to match the anti-resonance frequency with the line spectrum vibration frequency of the object. The frequency band where the transmissibility is less than 0 is generally considered the effective operating range of the isolator. Therefore, under the first set of parameter conditions, the effective operating range of the isolator prototype is approximately between 43.2 and 54.8 Hz.
To further verify the accuracy of the proposed model, a comparative analysis was conducted between the test values and the theoretical predictions of the acceleration transmissibility of the isolator under different parameter conditions. The parameters are listed in Table 3. By substituting the values from Table 3 into Equation (21), the theoretical acceleration transmissibility of the isolator for different parameter combinations is calculated, and the corresponding test results are provided. The comparison results presented as Figure 10b–d. As shown in the figure, the numerical results are in good agreement with the test results, indicating the accuracy of the proposed bond graph model. However, discrepancies between theoretical and experimental results remain at the anti-resonance and resonance positions. These discrepancies can be attributed to various factors. The main stiffness of the isolator is provided by the rubber ring. As is well known, its stiffness and damping characteristics are difficult to predict. In this study, the volume flexibility of the isolator is mainly attributed to the rubber ring. This makes the predicting of the precise value of the volume flexibility challenging, and furthermore, this value may change during the vibration process. Both of these have a significant impact on its isolation performance.

4.2. Analysis of Energy Flow and Dynamic Characteristics of the Isolator

The aim of this section is to analyze the characteristics of the energy flow between the mechanical part and the fluid part of the isolator during the vibration process. Using Equation (26) to Equation (28), to ensure the steady state is achieved through the responses of the isolator, the time parameter t in the equations is taken as 10 s, and the amplitude of S e is 1 N. The results are illustrated in Figure 11. It can be seen that E M 1 , E H , and E M 2 have similar trends, all showing two peaks occurring at 34.4 Hz and 58.7 Hz, which are consistent with the acceleration transmissibility of the isolator. The minimum energy occurs at 49 Hz, coinciding with the anti-resonance frequency of the isolator. The response curves of E H and E M 2 are nearly identical. Furthermore, the difference between E M 1 and E H is much larger than that between E H and E M 2 . The area between the three curves represents the energy dissipation by the corresponding damping. Thus, from the figure, it can be concluded that the energy is mainly dissipated by the rubber ring, while the energy dissipated by the fluid and metal bellow can be neglected. The results also indicate that the damping of the fluid and metal bellow can be neglected. The ratio between E M 2 and E M 1 , that is, E M 2 / E M 1 , represents the energy transfer rate. The results are depicted in Figure 12. It can be observed that a resonance occurs at about 52.2 Hz. At this frequency, about 95% of the input energy flows into mechanical subsystem 2, which is hereinafter referred to as resonance frequency 3 for simplicity.
To clearly reflect the vibration characteristics of the isolator at the resonance and anti-resonance frequencies, the time-domain responses of the main and inertial masses can be obtained using integral Equations (9) and (12). The time-domain responses can reach the steady state within 5 s. In this paper, 8–8.1 s are selected to extract the steady-state response of the system, and the results are shown in Figure 13.
The amplitude of q 4 and q 7 are denoted as A m p q 4 and A m p q 7 , respectively. According to the definition, the ratio between A m p q 4 and A m p q 7 denotes the amplification ratio or lever ratio of the isolator. Figure 13 depicts the time-domain responses of these two amplitudes at different characteristic frequencies. As observed from Figure 13, it is obvious that the ratio value is changing under different characteristic frequencies. This is attributed to the fact that the volumetric stiffness of the isolator is finite, not infinite. As a result, the lever ratio of the isolator is not a constant value. The relationship between the ratio and the frequency in the low-frequency range is shown in Figure 14. When analyzed in conjunction with Figure 12 in the original manuscript, it can be observed that the lever ratio of the isolator exhibits a similar trend to the energy transmission ratio, peaking at 52.2 Hz. It is evident that there is a resonance at about 52.2 Hz, which is slightly higher than the anti-resonance frequency of the isolator. This phenomenon indicates that at different frequencies, the proportion of internal energy transfer within the system can be characterized by the ratio of the vibration amplitudes of the main mass and the inertial mass. From Figure 13b,c it can be seen that at the anti-resonance frequency and resonance frequency 3, the amplitude of the inertial mass is much larger than that of the main mass, and from Figure 13c it is also observable that the phase of the main mass leads the inertial mass by 90. This means that at this frequency, the inertial mass resonates, which indicates that the energy is transferred to the inertial mass at this frequency. Further, from Figure 13a,d, it can be inferred that the main mass and the inertial mass vibrates in phase, and at resonance frequency 2 the main mass and the inertial mass vibrate out of phase.
To further explore the isolation mechanism of the fluid type isolator using Equation (22), the time history of the forces generated by the rubber ring, small bellow, and the inner fluid pressure can be depicted in Figure 15. It can be deduced that, at the isolation frequency, the force generated by the inner fluid almost cancels the elastic forces generated by the rubber ring and small bellow. The net force transmitted to the base is primarily the damping force. From the figure, it can be observed that the amplitudes of the damping forces are small and can therefore be neglected. Hence, it can be concluded that the anti-resonance frequency band occurs when the elastic forces of the isolator and the hydraulic pressure are in balance.

5. Extension to Nonlinearity

The above analysis is based on the fact that the vibration isolator is a linear system under small amplitude excitation. However, under large deformation, the isolator exhibits nonlinear characteristics due to the rubber ring.
The force–displacement curve of the rubber ring was measured by MTS 793. The testing results can be fitted with a continuous restoring force P ( x ) through the polynomial fitting method. P ( x ) is expressed as Equation (29). The testing and fitting results are shown in Figure 16.
P ( x ) = B 1 x + B 3 x 3
where B 1 and B 3 are the coefficients of the first-order and third-order polynomials, respectively.
According to the restoring force for polynomial nonlinear stiffness, Equation (7) is replaced by Equation (30). Correspondingly, the dynamical model of the system is replaced by Equation (31)
p ˙ 2 = S e R 8 I 2 p 2 P ( q 4 ) m 1 C 5 q 5
f 1 ( p i , q j , S e ) = p ˙ 2 = S e R 8 I 2 p 2 ( 1 C 41 q 4 + 1 C 43 q 4 3 ) m 1 C 5 q 5 f 2 ( p i , q j , S e ) = p ˙ 3 = R 16 I 3 p 3 + m 2 C 6 q 6 1 C 7 q 7 f 3 ( p i , q j , S e ) = q ˙ 4 = 1 I 2 p 2 f 4 ( p i , q j , S e ) = q ˙ 5 = m 1 I 2 p 2 1 C 5 R 12 q 5 + 1 C 6 R 12 q 6 f 5 ( p i , q j , S e ) = q ˙ 6 = m 2 I 3 p 3 + 1 C 5 R 12 q 5 1 C 6 R 12 q 6 f 6 ( p i , q j , S e ) = q ˙ 7 = 1 I 3 p 3
where C 41 = 1 / B 1 , C 43 = 1 / B 3 ; i = 2, 3; j = 4, 5, 6, 7.
Due to the nonlinear effects, the equation of force transmissibility should be transformed to
T = 20 L o g 10 R M S ( F F T ( F N ) ) R M S ( F F T ( S e ) )
where F N denotes the nonlinear forces transmitted to the base of the isolator. According to Equation (30), F N can be expressed as
F t = F K 1 + F B r 1 + F P + F B r 2 + F K 3 + F B r 3         = ( q 4 C 41 + q 4 3 C 43 ) + R 8 q ˙ 4 + q 6 C 6 ( m 1 m 2 ) + R 12 ( q ˙ 5 q ˙ 6 ) + q 7 C 7 + R 16 q ˙ 7
Figure 17 gives the transmissibility of the isolator when the system is extended to be nonlinear, i.e., the rubber ring has polynomial stiffness characteristics. The amplitude of S e is taken as 100, 200, 300 N in order, and the other parameters are given in Table 1 and Table 2. It can be observed that the resonance and anti-resonance peaks move towards lower frequencies due to the polynomial stiffness of the rubber ring. The isolation frequency band is significantly broadened, and the anti-resonance peak is obviously dropped. As the excitation amplitude increases, the first resonance peak gradually moves to the high-frequency direction.
The introduction of nonlinear stiffness does not alter the structure of the bond graph model of the isolator depicted in Figure 6. This indicates that the energy flow routes within the isolator remain unchanged. Consequently, the energy model of the isolator under nonlinear conditions can still be represented by Equations (26)–(28).
The energy flow characteristics and the energy transfer ratio of the nonlinear isolator when the excitation amplitude is equal to 100 N are shown in Figure 18 and Figure 19, respectively. It can be observed that the introduction of nonlinearity does not alter the energy flow characteristics of the system. The input energy of the system, i.e., E M 1 , follows the same trend as the force transmissibility of the vibration isolator. From Figure 19, it can be found that the frequency at which the maximum energy transfer ratio occurs is consistent with that of the linear system, suggesting that this value is determined by the amplification ratio of the isolator.

6. Conclusions

This paper employs the bond graph theory to model the dynamic behavior of the hydraulic DAVI and discuss the energy transfer between the mechanical components and the fluid inside the isolator. A prototype of the isolator is fabricated to verify the theoretical results. Additionally, the nonlinear dynamic characteristics of the hydraulic DAVI under large amplitude vibration are investigated. The primary findings can be listed as follows:
(1)
The theoretical model of the mechanical subsystem and the fluid subsystem has been established using the bond graph method. Then, the mechanical–hydraulic coupling model is obtained by this method. The force transmissibility of the isolator is derived based on this model, and the force transmissibilities of the isolator under various parameters are calculated. The results are verified by a carefully designed experiment.
The vibration transmissibility of the isolator is predicted by a dynamic model deduced from the bond graph model. Experiments are conducted to validate the model.
(2)
The energy transfer between the mechanical part and its inner fluid part has been computed. The results show that the attenuation between the main mechanical system to the hydraulic subsystem is much larger than that between the fluid part and the sub-mechanical part. This illustrates that the energy dissipated by the rubber ring is much larger than that of its inner fluid. Furthermore, the damping of the fluid and the metal bellow can be neglected.
(3)
Around the isolation frequency, the inertial mass resonates; therefore, it can be inferred that at the anti-resonance frequency, the energy is transferred to the inertial mass.
(4)
Due to the finite volumetric stiffness of the isolator, its amplification ratio is not constant but varies with the external excitation frequency.
(5)
Based on the time-domain responses of the force transmitted to the base, it was found that anti-resonance occurs when the internal fluid pressure counteracts the elastic forces transmitted to the base of the isolator.
(6)
Under large deformations, the nonlinear stiffness from the rubber ring significantly alters the dynamics of the isolator, which reduces the resonance and anti-resonance frequencies and broadens the vibration isolation frequency band.

Author Contributions

Conceptualization, N.L. and C.L.; methodology, N.L. and C.L.; software, C.L.; validation, N.L., L.Z. and F.L.; formal analysis, C.L.; investigation, Z.L.; resources, N.L.; data curation, C.L.; writing—original draft preparation, C.L.; writing—review and editing, F.L.; visualization, J.Y.; supervision, L.Z.; project administration, F.L.; funding acquisition, N.L. All authors have read and agreed to the published version of the manuscript.

Funding

This work is supported by National Natural Science Foundation of China (Grant No.52105091), State Key discipline laboratory of noise and vibration control of ship equipment in Shanghai Jiaotong University under (Grant No. VSN 202103), Fujian Provincial Natural Science Foundation (Grant No. 2021J05115), Starting Grants of Fuzhou University under (Grant No. GXRC-20014), National Key Laboratory on Ship Vibration and Noise (Grant No. 6142204230403).

Institutional Review Board Statement

Not applicable.

Informed Consent Statement

Not applicable.

Data Availability Statement

The original contributions presented in the study are included in the article, further inquiries can be directed to the corresponding authors.

Conflicts of Interest

Author Jing Yang was employed by the company Longhe Intelligent Equipment Manufacturing Co., Ltd. The remaining authors declare that the research was conducted in the absence of any commercial or financial relationships that could be construed as a potential conflict of interest.

References

  1. Rita, A.D.; Mcgarvey, J.H.; Jones, R. Helicopter Rotor Isolation Evaluation Utilizing the Dynamic Antiresonant Vibration Isolator. J. Am. Helicopter Soc. 1976, 23, 22. [Google Scholar] [CrossRef]
  2. Feng, Z.; Liu, C.; Li, Z.; Xing, L.; Cheng, Q. Simulation and Experiment of Dual-Frequency Isolator for Variable Speed Helicopter. Adv. Transdiscipl. Eng. 2021, 20, 380. [Google Scholar]
  3. Simon, F. Overview of Onera acoustic active control activities in helicopter cabin. In INTER-NOISE and NOISE-CON Congress and Conference Proceedings; Institute of Noise Control Engineering: Chiba, Japan, 2023; pp. 1881–1892. [Google Scholar]
  4. Deng, J.; Yang, J.; Jiao, S.; Long, X. Band-stop characteristics of a nonlinear anti-resonant vibration isolator for low-frequency applications. Int. J. Mech. Sci. 2023, 240, 107914. [Google Scholar] [CrossRef]
  5. Deng, J.; Zhao, J.; Yang, J.; Tian, Y.; Long, X. Design and analysis of a tunable electromagnetic lever-type anti-resonant vibration isolator. Int. J. Mech. Sci. 2024, 263, 108787. [Google Scholar] [CrossRef]
  6. Yan, B.; Wang, Z.; Ma, H.; Bao, H.; Wang, K.; Wu, C. A novel lever-type vibration isolator with eddy current damping. J. Sound. Vib. 2021, 494, 115862. [Google Scholar] [CrossRef]
  7. Yan, B.; Wang, X.; Wang, Z.; Wu, C.; Zhang, W. Enhanced lever-type vibration isolator via electromagnetic shunt damping. Int. J. Mech. Sci. 2022, 218, 107070. [Google Scholar] [CrossRef]
  8. Özyar, O.; Yılmaz, Ç. A self-tuning adaptive-passive lever-type vibration isolation system. J. Sound Vib. 2021, 505, 116159. [Google Scholar] [CrossRef]
  9. Braun, D. Development of antiresonance force isolators for helicopter vibration reduction. J. Am. Helicopter Soc. 1982, 27, 37–44. [Google Scholar] [CrossRef]
  10. Halwes, D.R.; Simmons, W.A. Vibration suppression system. J. Acoust. Soc. Am. 1983, 73, 1886. [Google Scholar] [CrossRef]
  11. Du Plooy, N.F.; Heyns, P.S.; Brennan, M.J. The development of a tunable vibration absorbing isolator. Int. J. Mech. Sci. 2005, 47, 983–997. [Google Scholar] [CrossRef]
  12. Liu, N.; Jin, Z.; Hua, H. A new model of a hydraulic leveraged dynamic anti-resonance vibration isolator under base excitation: A theoretical and experimental study. J. Vib. Control 2019, 25, 2282–2292. [Google Scholar] [CrossRef]
  13. Teng, H.D.; Gao, X. The dynamic properties and performance of the bellows-type hydraulic inerter-based dynamic anti-resonance vibration isolator. J. Vib. Control 2024, 180920679. [Google Scholar] [CrossRef]
  14. Duan, N.; Yu, H.; Zhang, Z.; Hua, H. Study on the hydraulic leveraged dynamic anti-resonance vibration isolator with nonlinear damping characteristics. J. Vib. Control 2023, 29, 1229–1242. [Google Scholar] [CrossRef]
  15. Xiao, H. Investigation of Helicopter Main Reducer Dynamic Anti-Resonance Vibration Isolation Platform. Master’s Thesis, Shanghai Jiao Tong University, Shanghai, China, 2017. [Google Scholar]
  16. Karnopp, D.C.; Margolis, D.L.; Rosenberg, R.C. System Dynamics: Modeling, Simulation, and Control of Mechatronic Systems; John Wiley & Sons: Hoboken, NJ, USA, 2012. [Google Scholar]
  17. Boudon, B.; Malburet, F.; Carmona, J. Bond Graph Modeling and Simulation of a Vibration Absorber System in Helicopters. In Bond Graphs for Modelling, Control and Fault Diagnosis of Engineering Systems; Springer: Cham, Switzerland, 2017; pp. 387–429. [Google Scholar]
  18. Tabatabaei, S.K.; Behbahani, S.; de Silva, C.W. Self-adjusting multidisciplinary design of hydraulic engine mount using bond graphs and inductive genetic programming. Eng. Appl. Artif. Intell. 2016, 48, 32–39. [Google Scholar] [CrossRef]
  19. Tripathi, J.P.; Ghoshal, S.K.; Dasgupta, K.; Das, J. Bond graph modelling of a hydraulic cylinder-actuated planar manipulator. J. Braz. Soc. Mech. Sci. 2017, 39, 4275–4287. [Google Scholar] [CrossRef]
  20. Kocak, K.; Yilmaz, C. Design of a compliant lever-type passive vibration isolator with quasi-zero-stiffness mechanism. J. Sound. Vib. 2023, 558, 117758. [Google Scholar] [CrossRef]
  21. Wahl, A.M. Mechanical Springs; McGraw-Hill: New York, NY, USA, 1963. [Google Scholar]
  22. Iandiorio, C.; Salvini, P. An Engineering Theory of thick Curved Beams loaded in-plane and out-of-plane: 3D Stress Analysis. Eur. J. Mech. A/Solids 2022, 92, 104484. [Google Scholar] [CrossRef]
  23. Cadet, G.; Paredes, M. A new exhaustive semi-analytical method to calculate stress distribution on the surface of a curved beam with circular cross section, with an application to helical compression springs. Eur. J. Mech. A/Solids 2024, 103, 105191. [Google Scholar] [CrossRef]
  24. Xueqian, C.; Zhanpeng, S.; Qinshu, H.; Qiang, D.; Xin En, L. Influence of uncertainty and excitation amplitude on the vibration characteristics of rubber isolators. J. Sound Vib. 2016, 377, 216–225. [Google Scholar] [CrossRef]
  25. Chowdhury, S.; Banerjee, A.; Adhikari, S. Enhancing seismic resilience of structures through optimally designed nonlinear negative stiffness base isolators: Exact closed-form expressions. In Nonlinear Dynam; Springer: Berlin/Heidelberg, Germany, 2024; pp. 1–24. [Google Scholar]
  26. Ye, K.; Ji, J.C. Dynamic analysis of the effects of self-weight induced structural and damping nonlinearity on the performance of an origami-inspired vibration isolator. J. Sound Vib. 2023, 547, 117538. [Google Scholar] [CrossRef]
  27. Yao, H.; Cao, Y.; Zhang, S.; Wen, B. A novel energy sink with piecewise linear stiffness. In Nonlinear Dynam; Springer: Berlin/Heidelberg, Germany, 2018; Volume 94, pp. 2265–2275. [Google Scholar]
  28. Chowdhury, S.; Banerjee, A. The nonlinear dynamic analysis of optimum nonlinear inertial amplifier base isolators for vibration isolation. In Nonlinear Dynam; Springer: Berlin/Heidelberg, Germany, 2023; Volume 111, pp. 12749–12786. [Google Scholar]
Figure 1. Schematic model of the hydraulic anti-resonance vibration isolator.
Aerospace 11 00634 g001
Figure 2. Flowchart of bond graph modeling process for mechanical subsystem 1: (a) preliminary model; (b) complete model; (c) simplified model.
Aerospace 11 00634 g002
Figure 3. Bond graph model of mechanical subsystem 2.
Aerospace 11 00634 g003
Figure 4. Flowchart of bond graph modeling process for hydraulic subsystem: (a) preliminary model; (b) complete model.
Aerospace 11 00634 g004
Figure 5. Bond graph model of the hydraulic piston transducer.
Aerospace 11 00634 g005
Figure 6. Bond graph model of the coupled mechanical-liquid system.
Aerospace 11 00634 g006
Figure 7. Vibration isolator prototype.
Aerospace 11 00634 g007
Figure 8. The photograph of the experimental setup.
Aerospace 11 00634 g008
Figure 9. (a) Transmissibility of the isolator with the first set of parameters; (b) imaginary part of the frequency response function.
Aerospace 11 00634 g009
Figure 10. Experimental and theoretical transmissibility of the isolator with (a) parameter set 1; (b) parameter set 2; (c) parameter set 3; (d) parameter set 4.
Aerospace 11 00634 g010aAerospace 11 00634 g010b
Figure 11. Internal energy flow characteristics of the isolator.
Aerospace 11 00634 g011
Figure 12. Energy transfer ratio.
Aerospace 11 00634 g012
Figure 13. Displacement response of the isolator at (a) resonance frequency 1; (b) anti-resonance frequency; (c) resonance frequency 3; (d) resonance frequency 2.
Aerospace 11 00634 g013
Figure 14. Lever ratio of the isolator.
Aerospace 11 00634 g014
Figure 15. The force transmitted to the base of the isolator at anti-resonance frequency.
Aerospace 11 00634 g015
Figure 16. Vertical force–displacement curve for the rubber ring.
Aerospace 11 00634 g016
Figure 17. Transmissibility of the isolator when the system is extended to be nonlinear.
Aerospace 11 00634 g017
Figure 18. Internal energy flow characteristics of the isolator when the system is extended to be nonlinear.
Aerospace 11 00634 g018
Figure 19. Energy transfer ratio of the isolator when the system is extended to be nonlinear.
Aerospace 11 00634 g019
Table 1. The first set of parameters of the isolator.
ParametersValues
M (kg)10.3
m i s (kg)0.28
K 1 (N/m)3.9 × 105
K 3 (N/m)1.72 × 104
C 21 (m5/N)2.099 × 10−10
C 22 (m5/N)9.8 × 10−11
m 1 (m2)0.0106
m 2 (m2)0.002
Table 2. The first set of damping parameters of the isolator.
ParametersValues
B r 1 (N·s/m)174.079
B r 2 (N·s/m5)6.02 × 104
B r 3 (N·s/m)4.979
Table 3. The other sets of parameters of the isolator.
ParametersSet 2Set 3Set 4
M (kg)10.310.310.3
K 1 (N/m)3.9 × 1055.4 × 1055.9 × 105
B r 1 (N·s/m)257282270
C 21 (m5/N)2.099 × 10−101.364 × 10−109.0152 × 10⁻¹¹
B r 2 (N·s/m5)1.87 × 1056.14 × 1057.48 × 105
C 22 (m5/N)1.248 × 10−101.248 × 10−101.248 × 10⁻¹⁰
K 3 (N/m)2.43 × 1042.43 × 1042.43 × 104
B r 3 (N·s/m)141314
m i s (kg)0.540.540.54
m 1 (m2)0.01060.01060.0106
m 2 (m2)0.00380.00380.0038
Disclaimer/Publisher’s Note: The statements, opinions and data contained in all publications are solely those of the individual author(s) and contributor(s) and not of MDPI and/or the editor(s). MDPI and/or the editor(s) disclaim responsibility for any injury to people or property resulting from any ideas, methods, instructions or products referred to in the content.

