


Dispersion Analysis of Plane Wave Propagation in Lattice-Based Mechanical Metamaterial for Vibration Suppression

Abstract
:1. Introduction
2. Theoretical Formulation
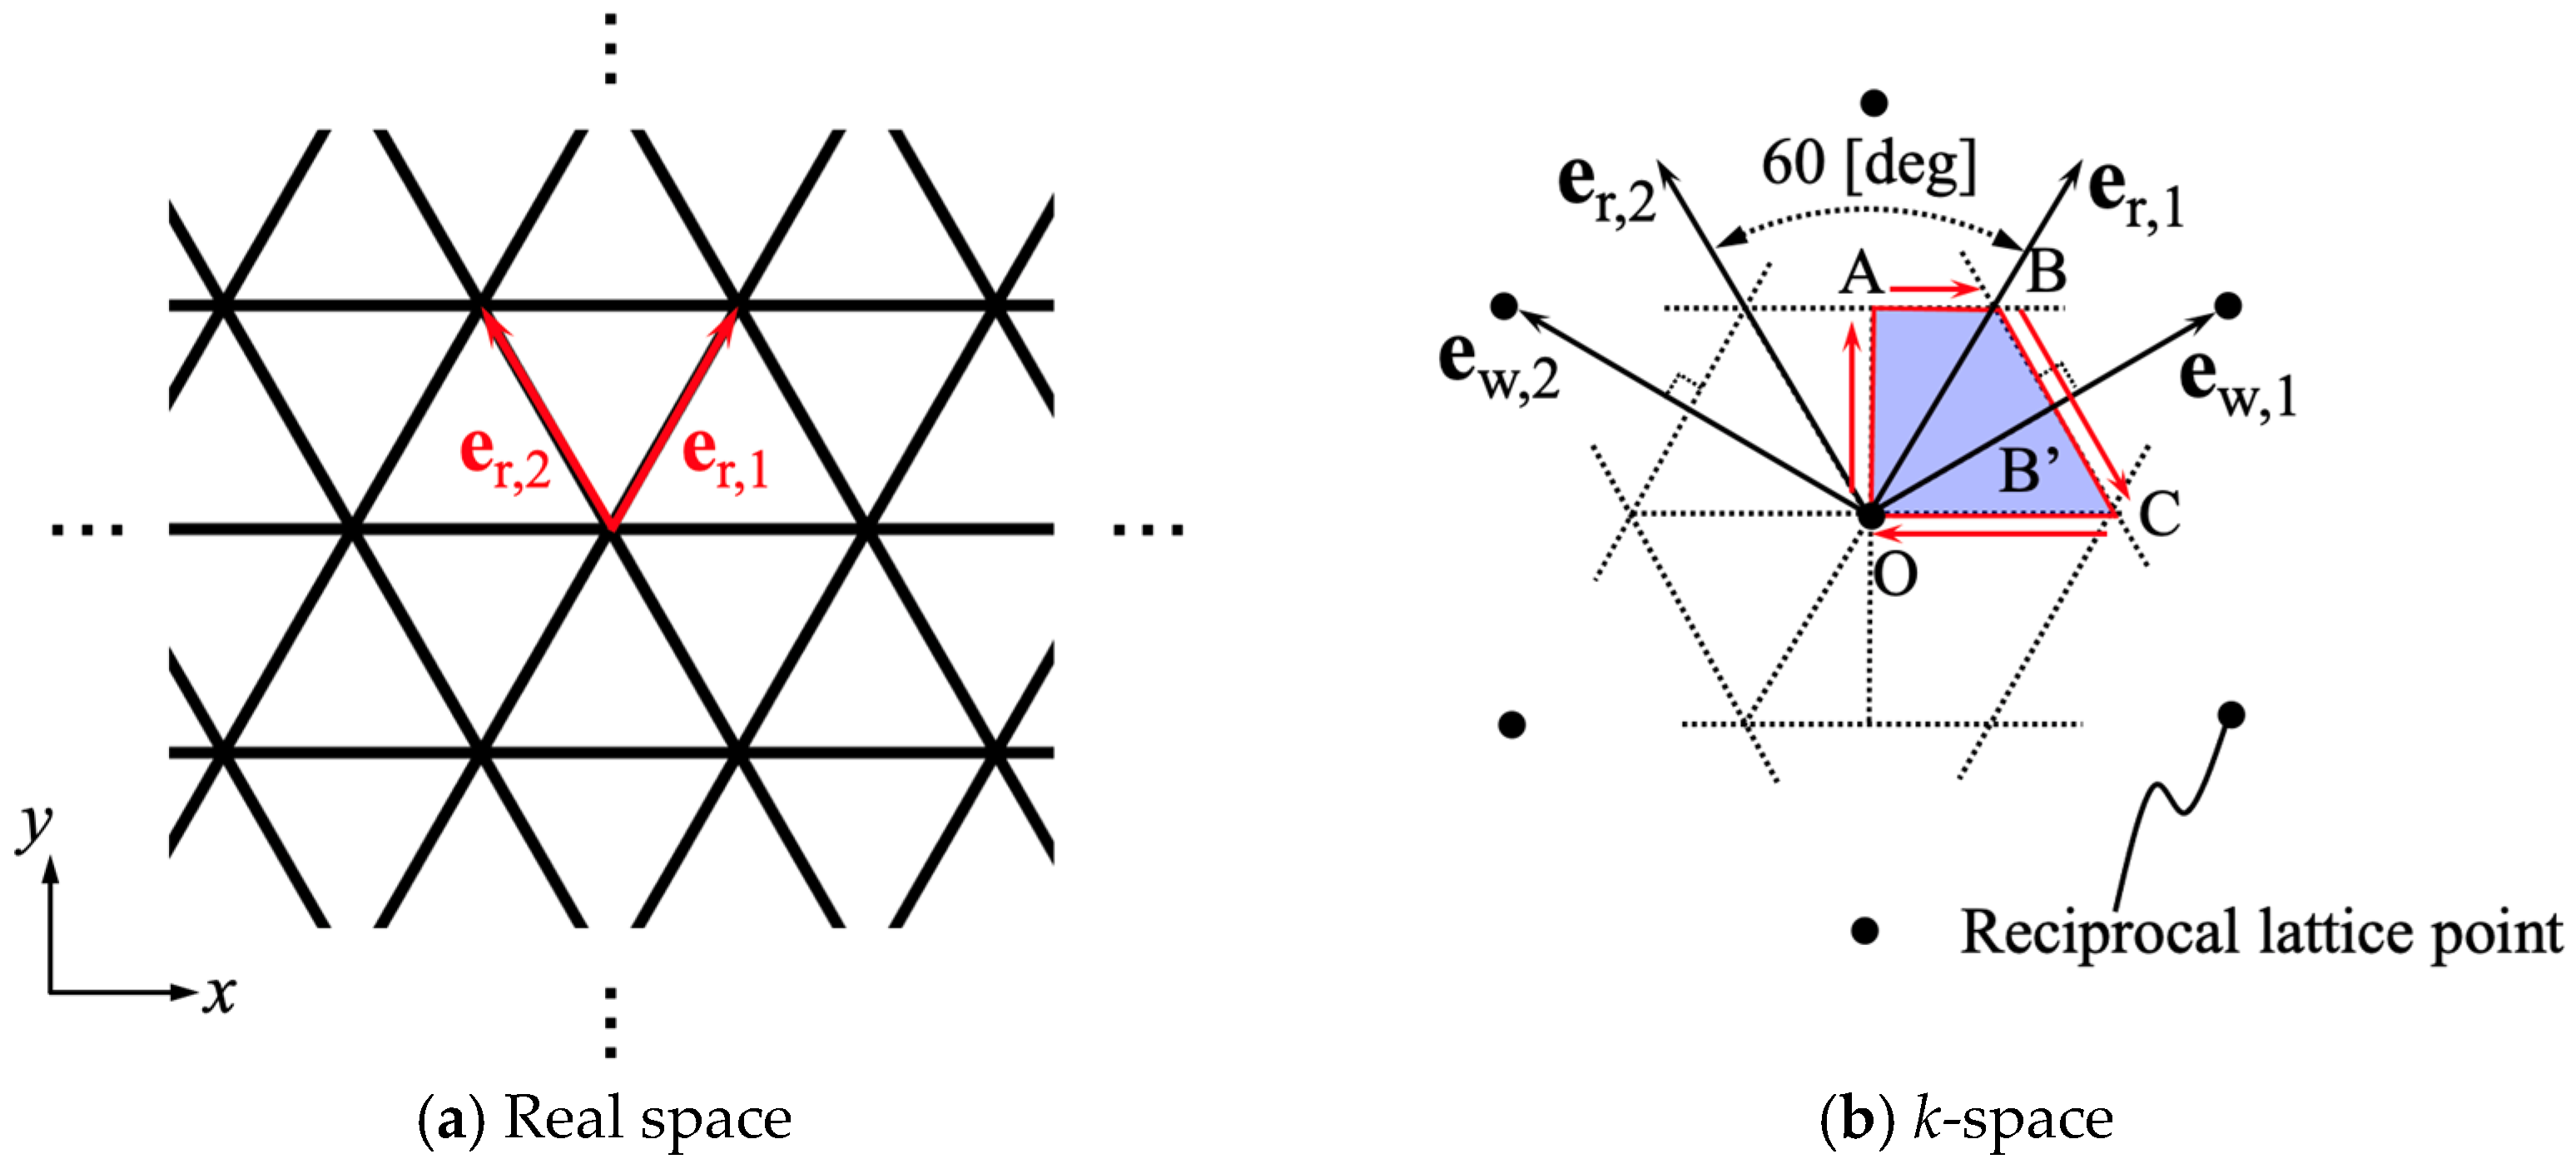
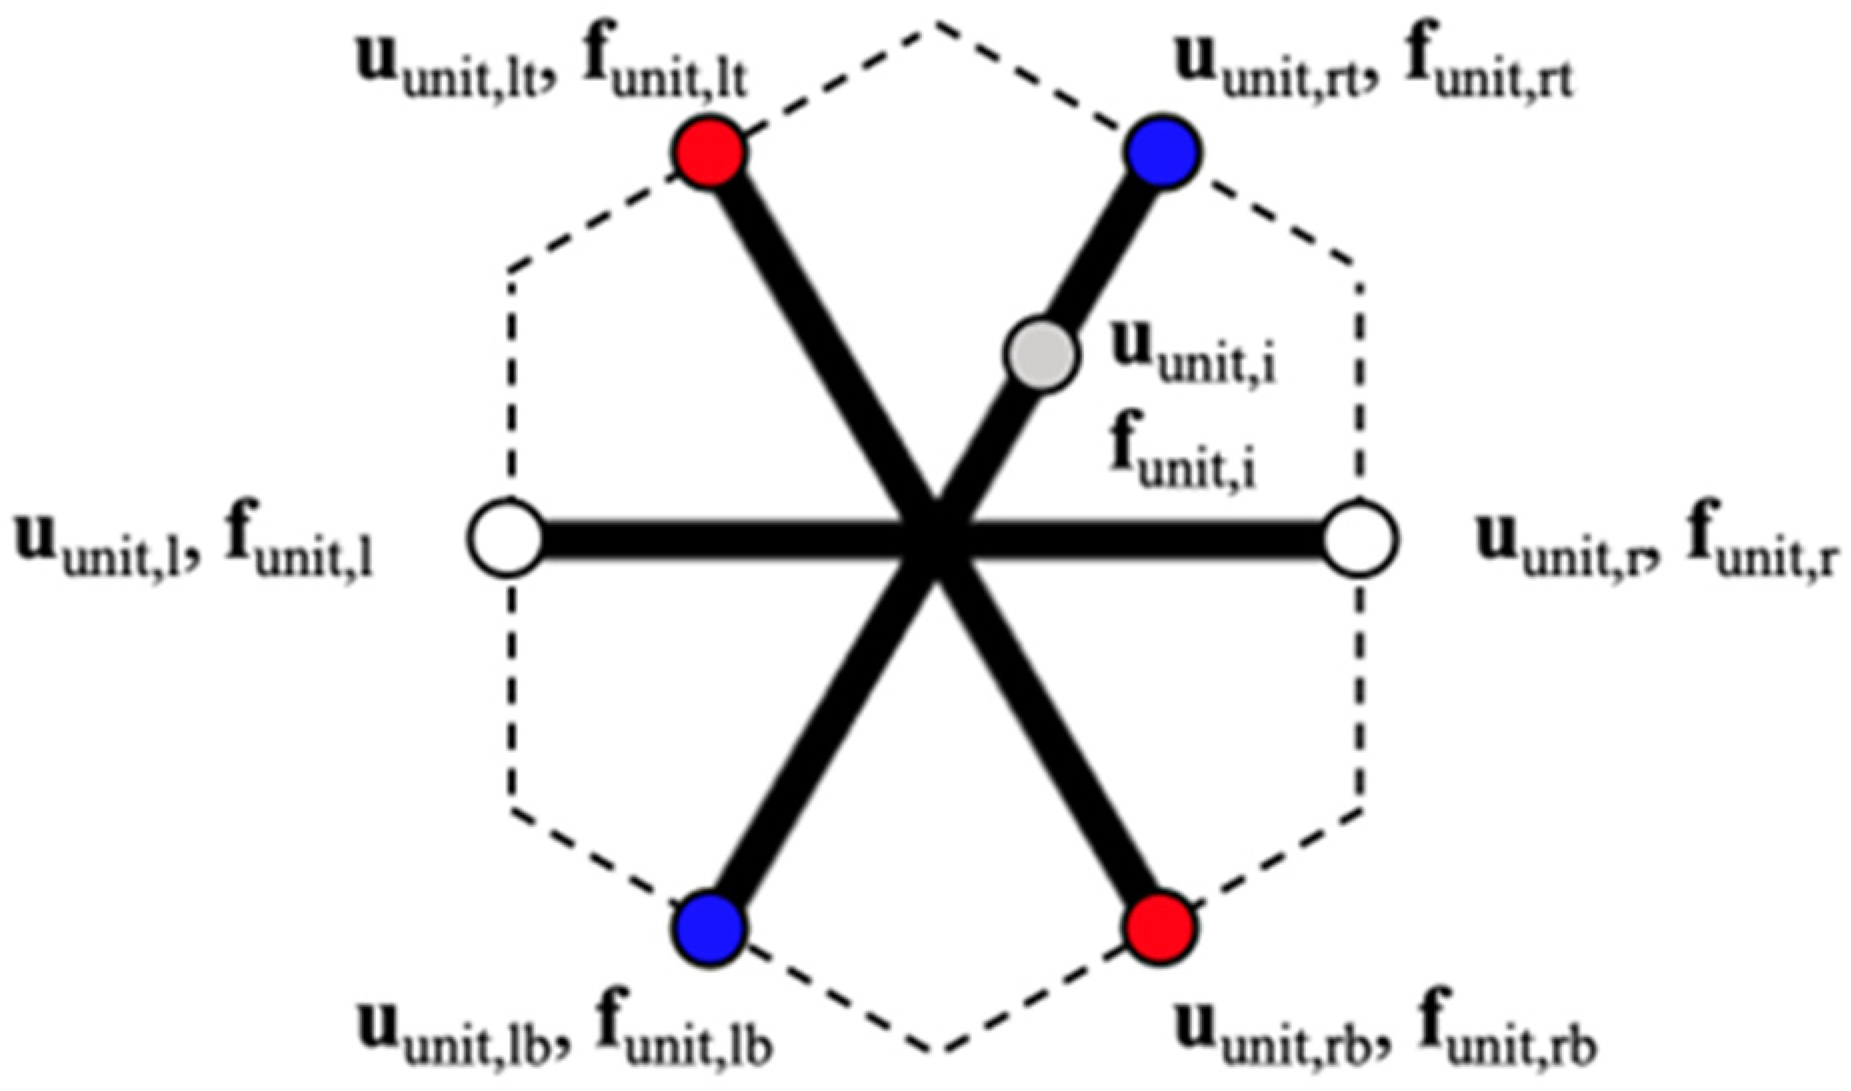
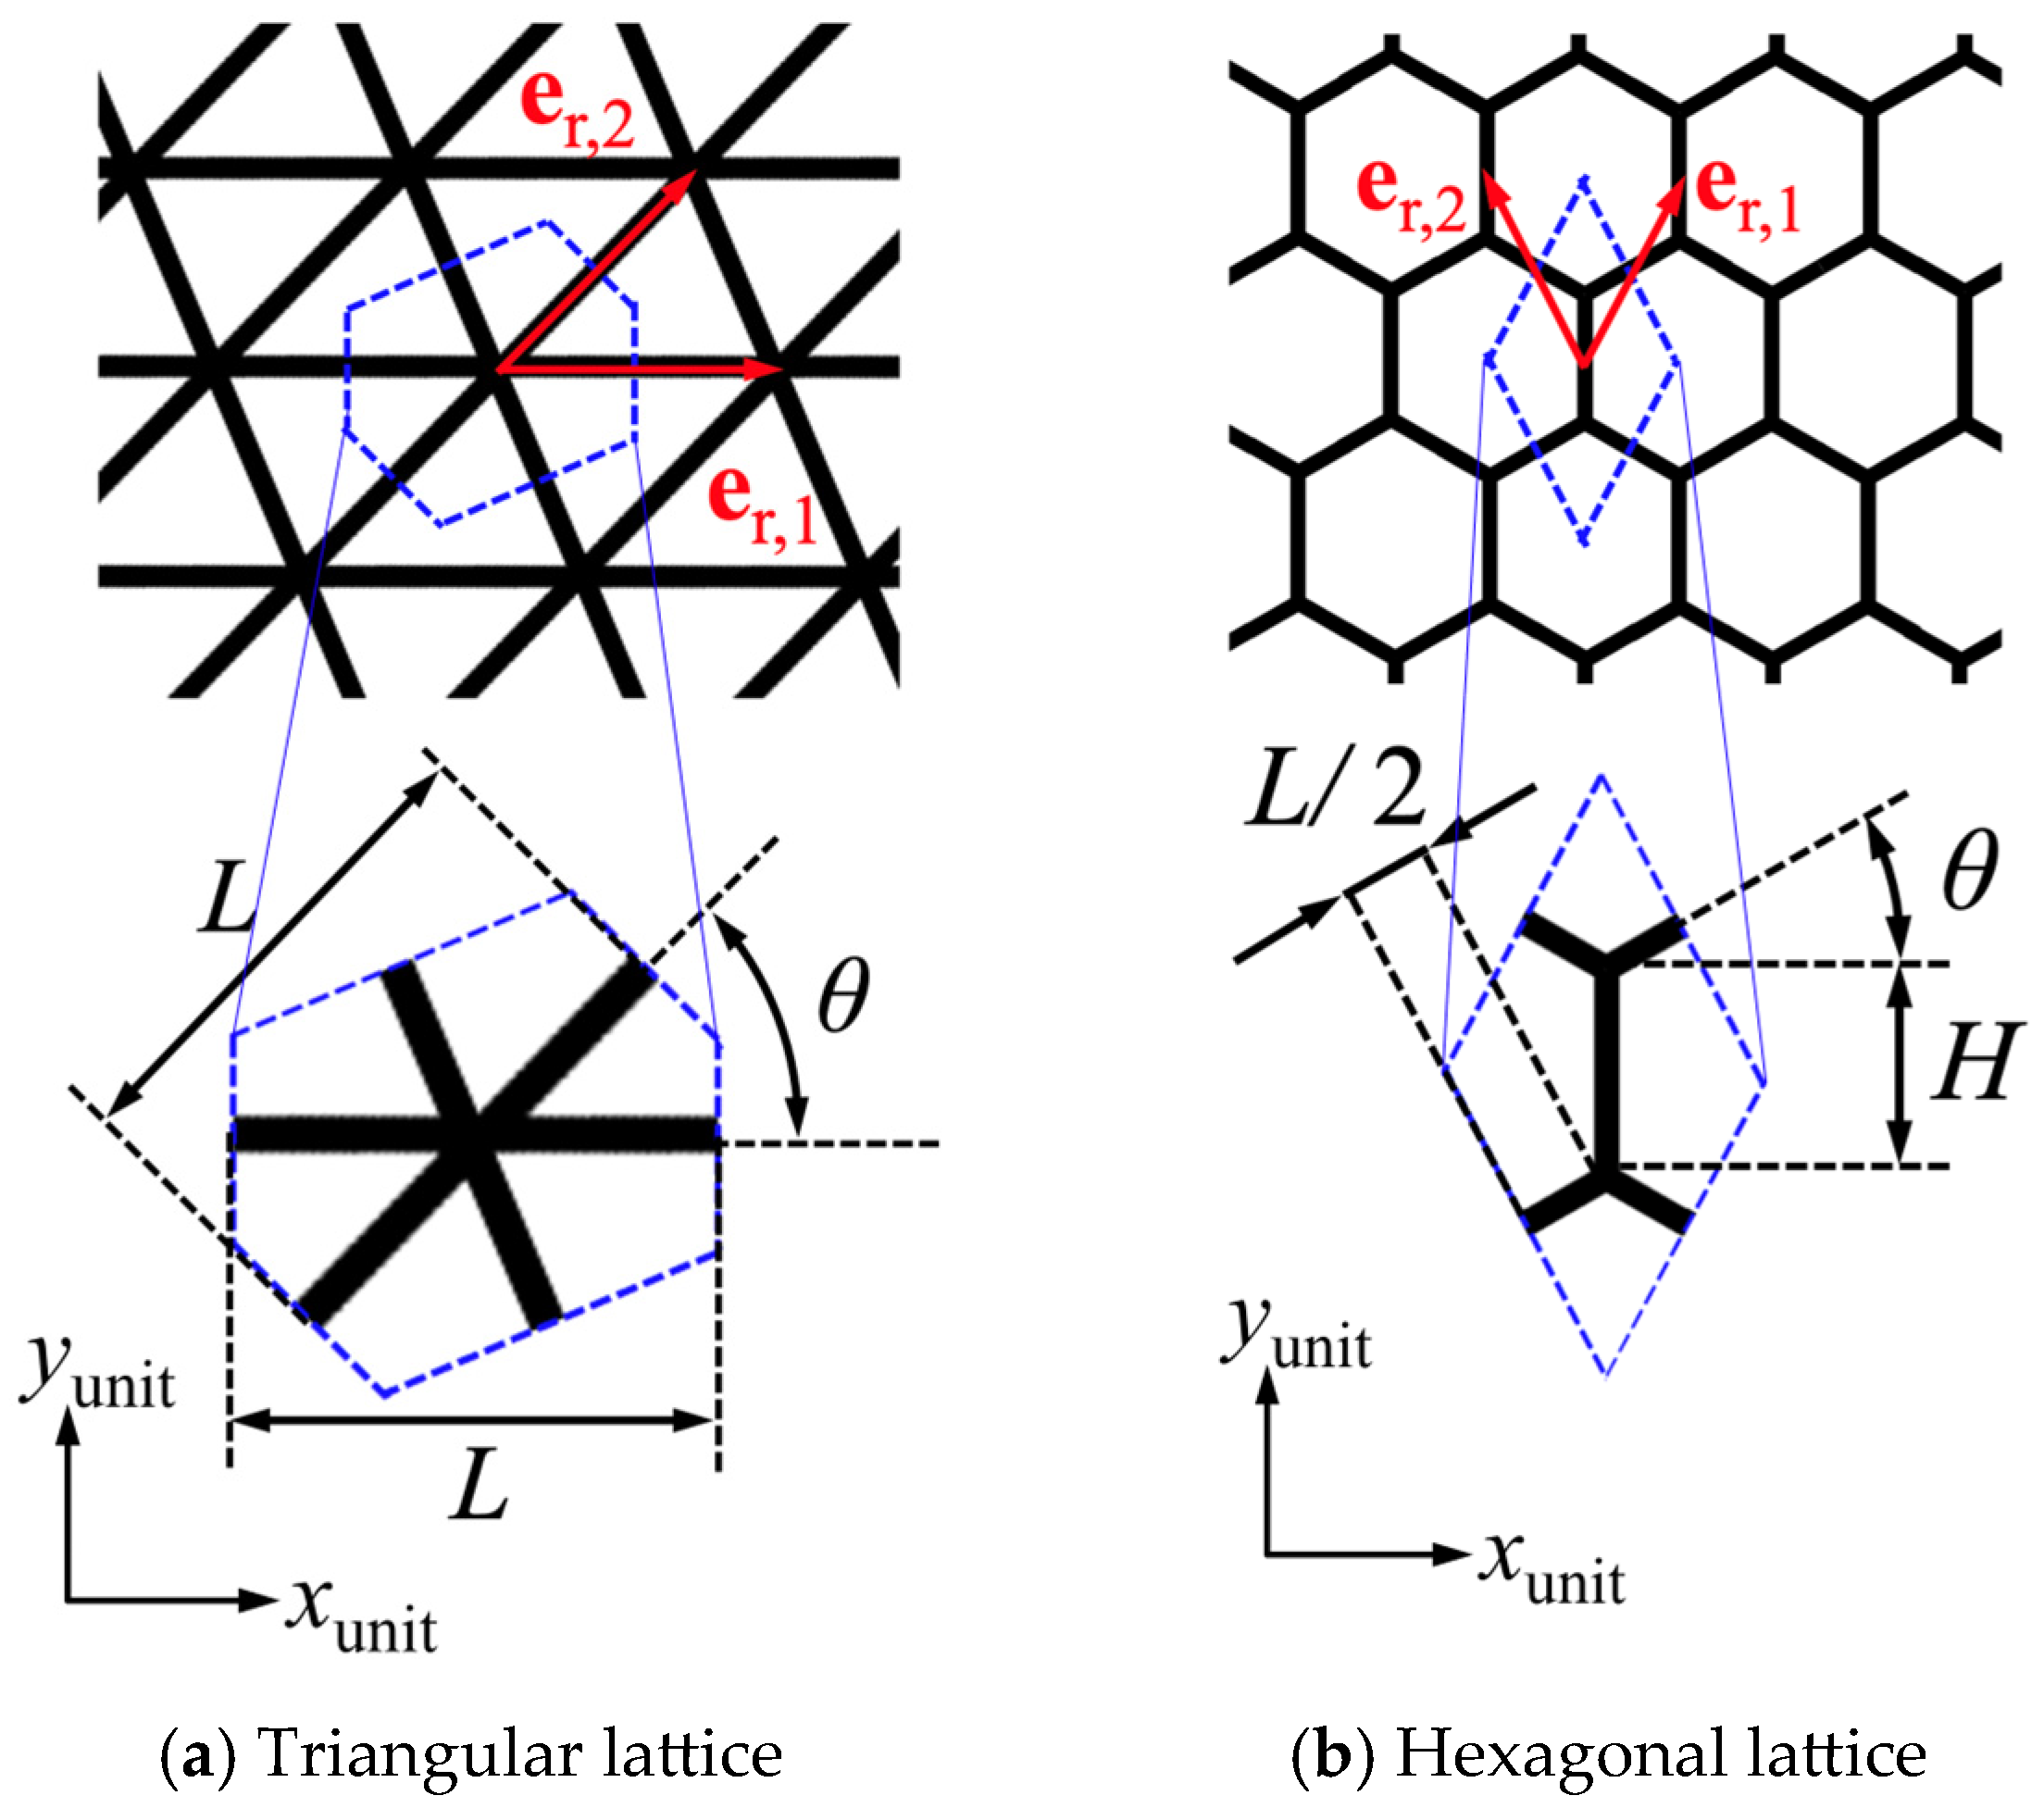
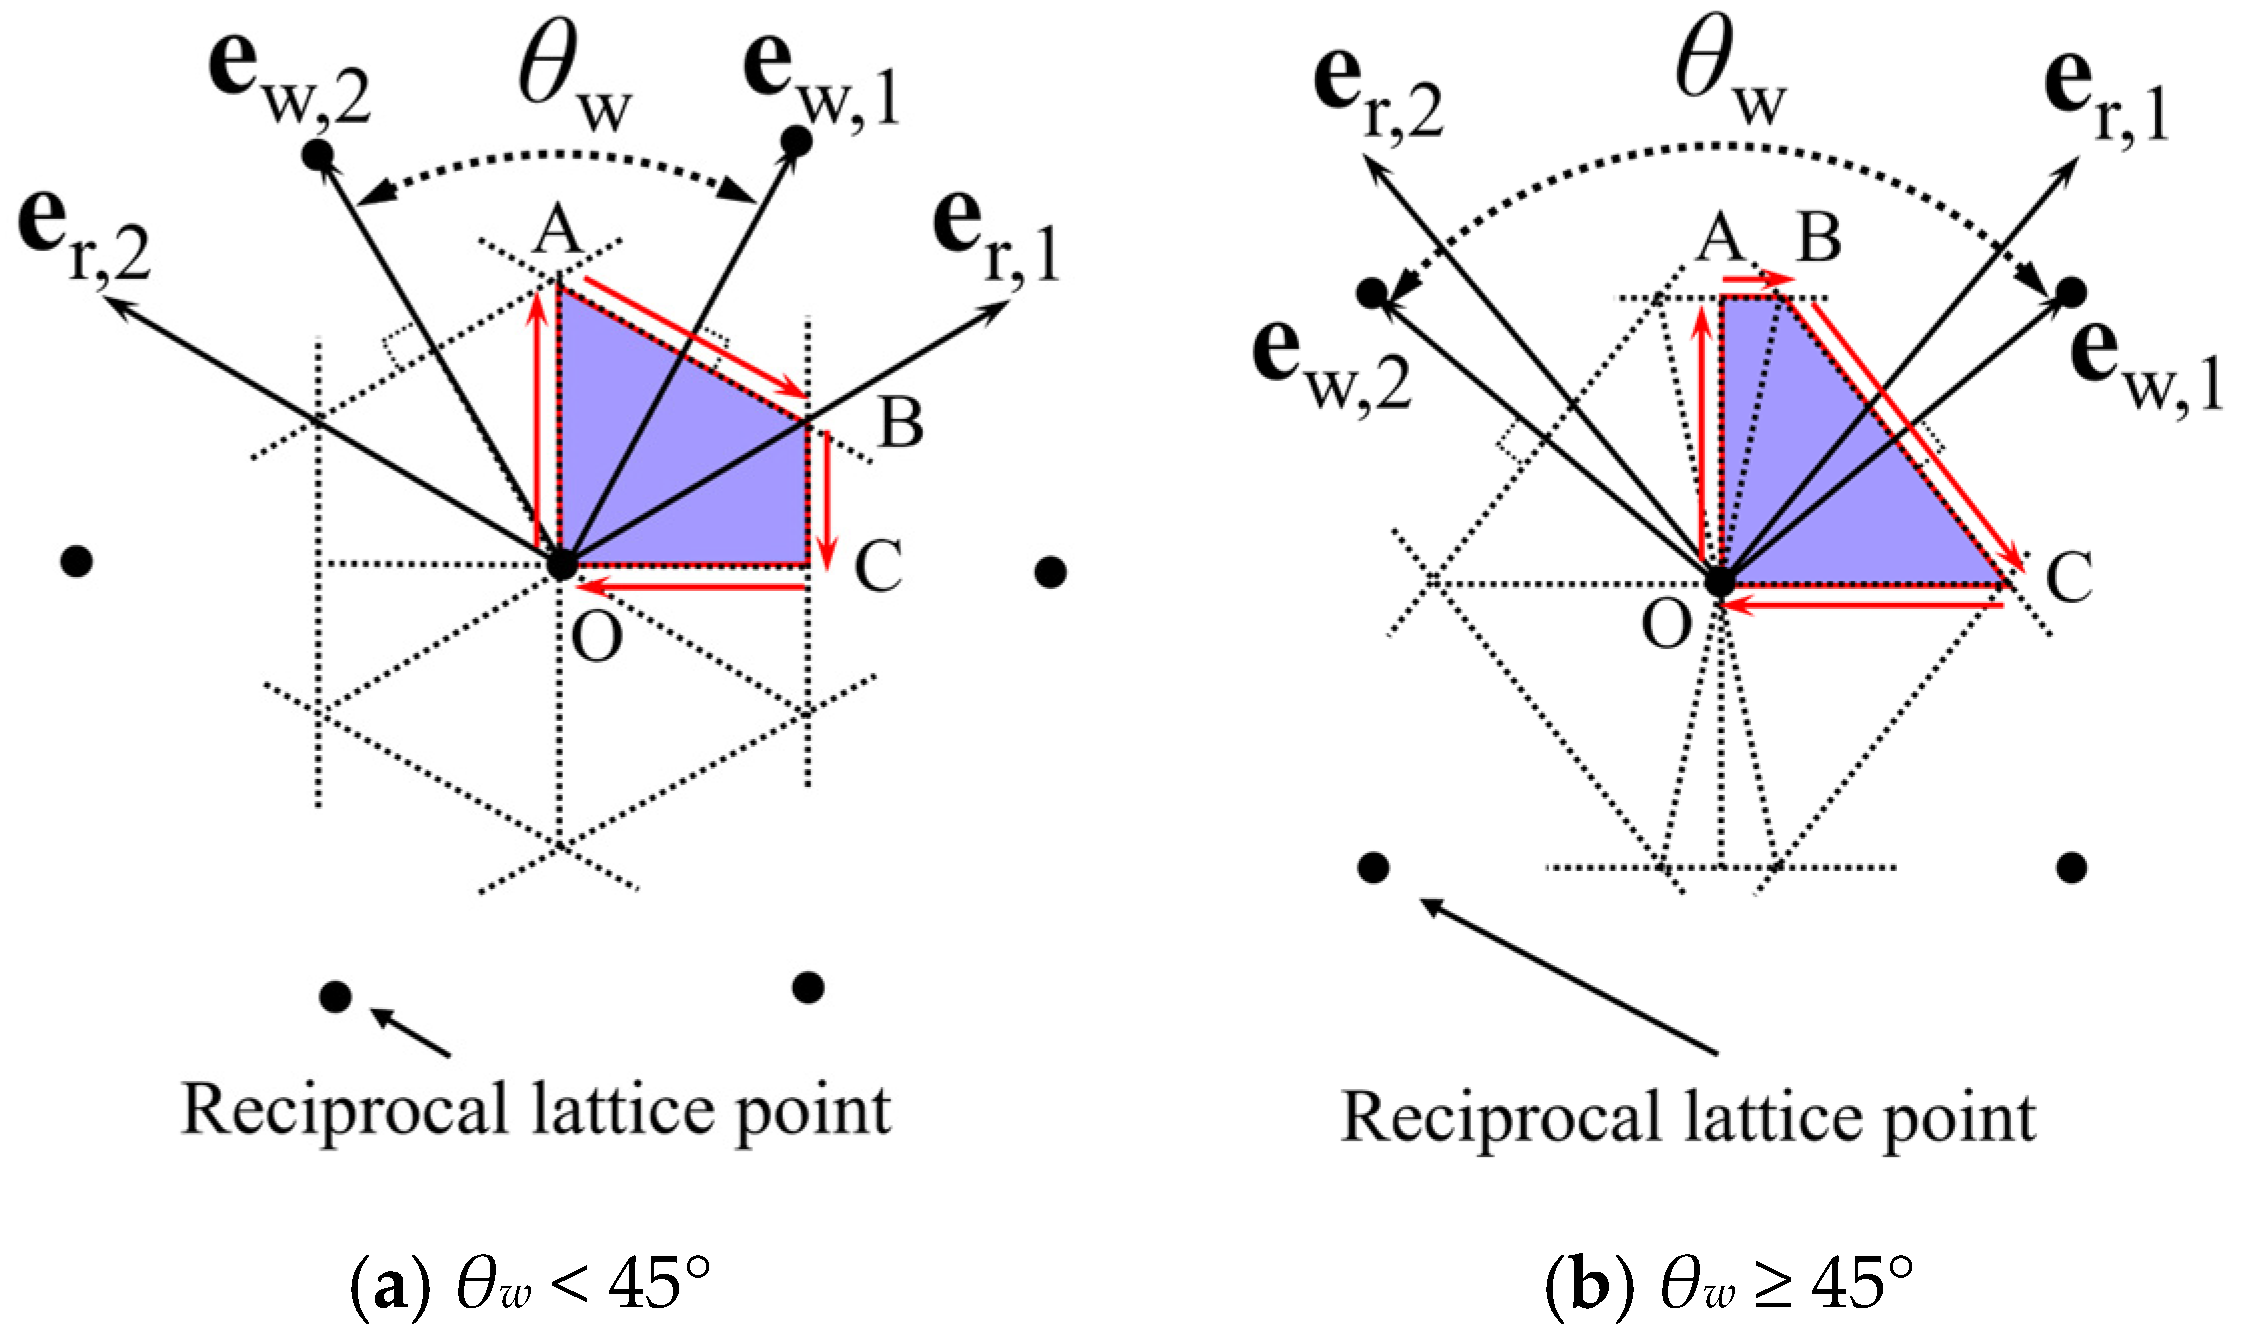
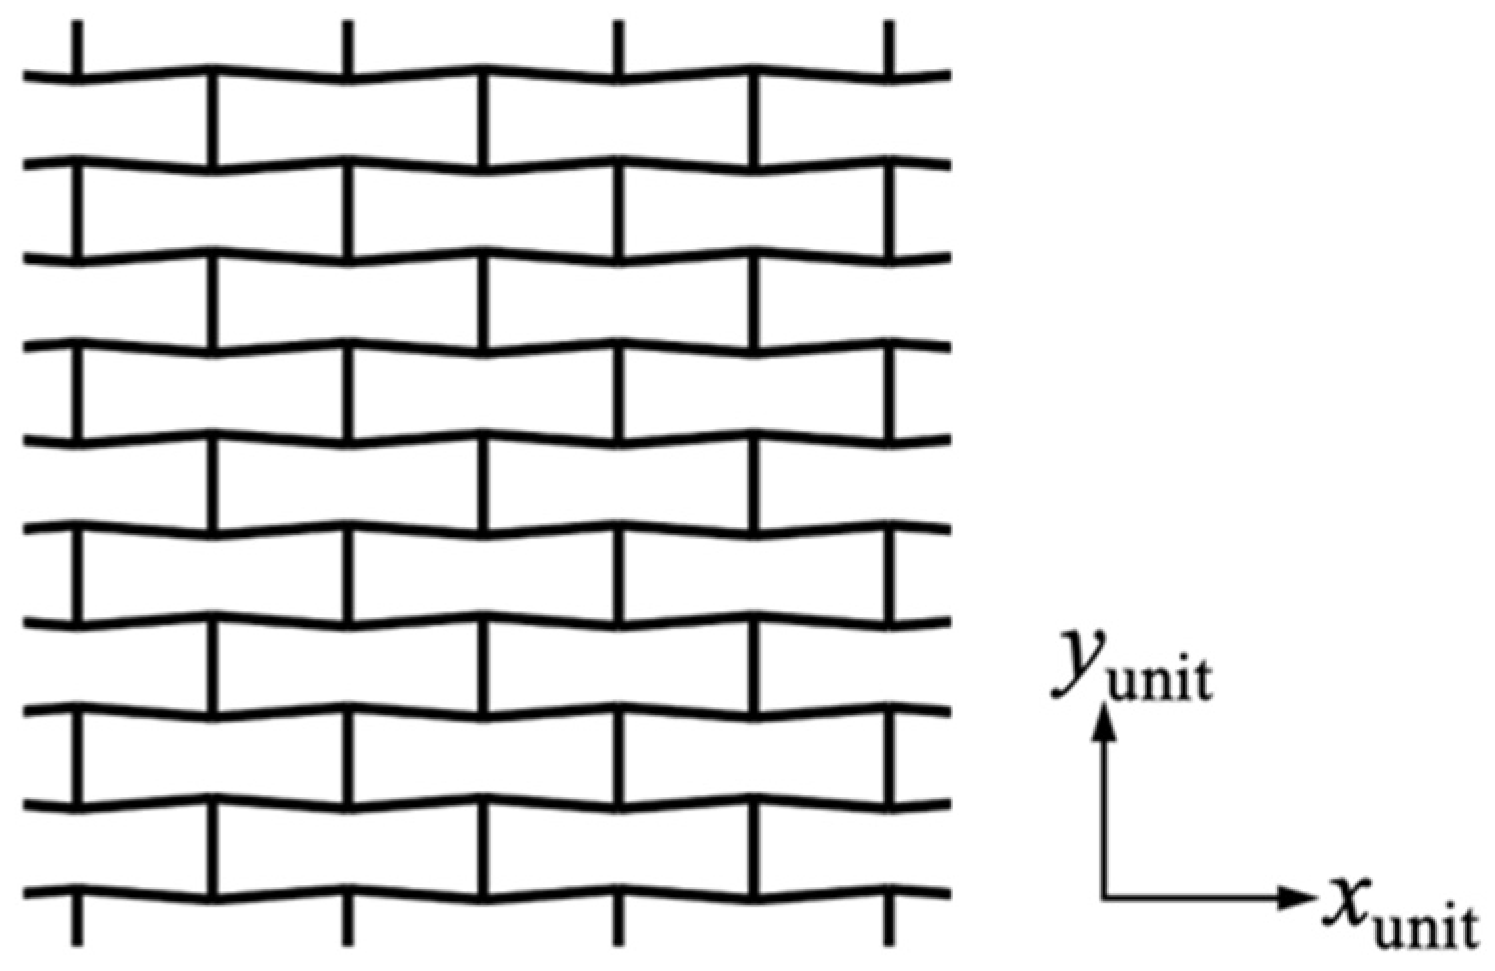
2.1. Periodic Lattice and Floquet–Bloch’s Principles
2.2. Plane Wave Propagation
3. Verification and Validation
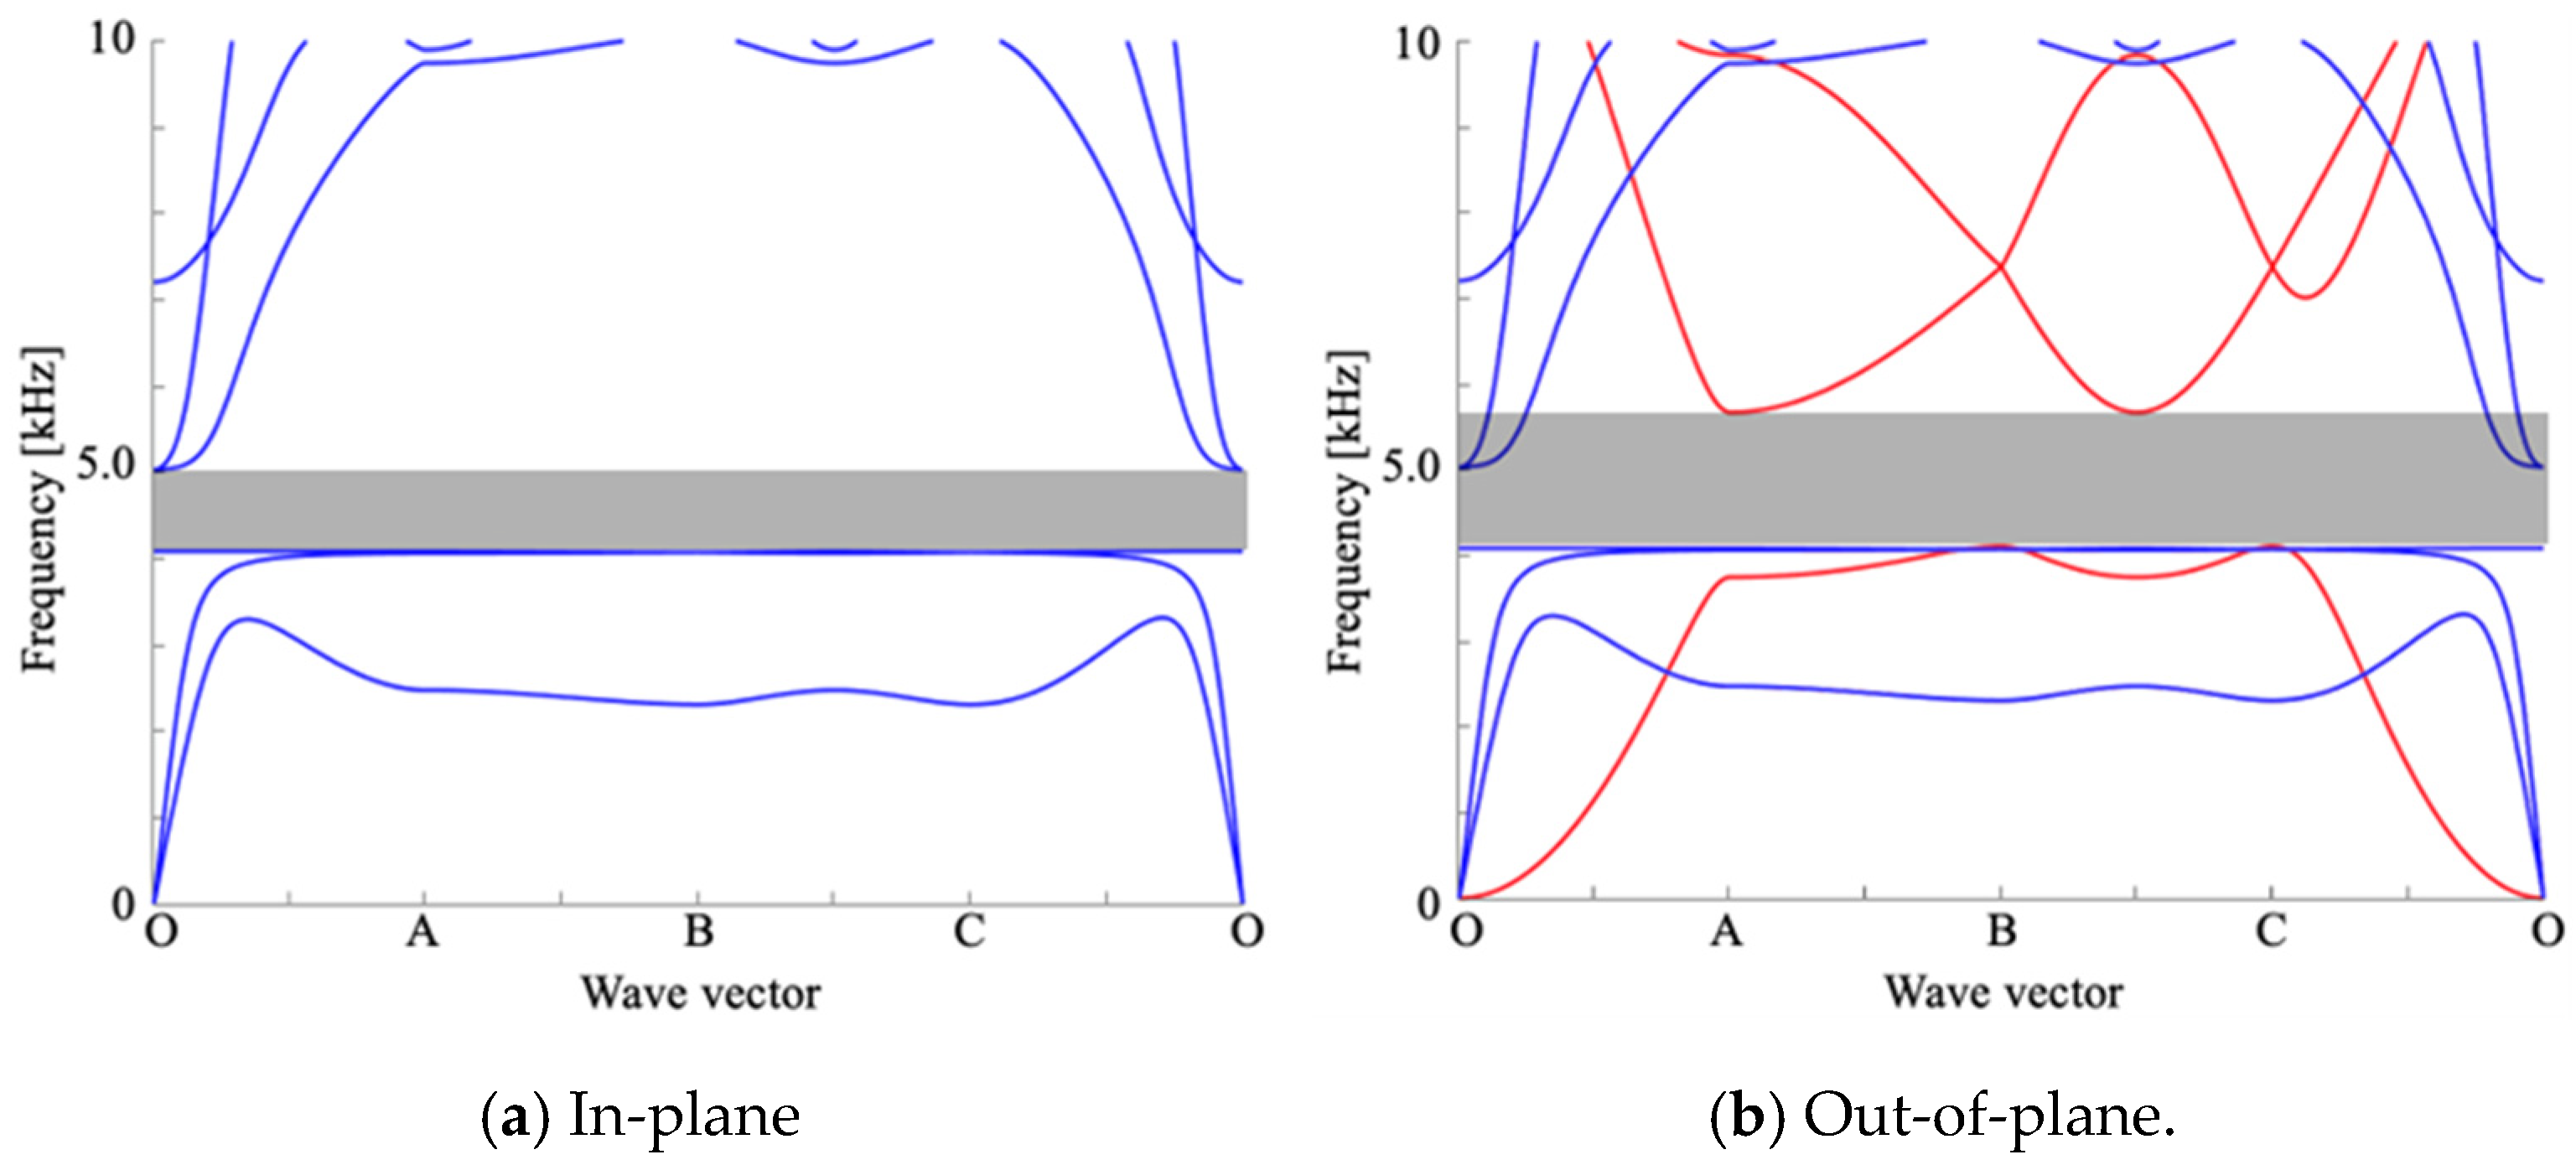
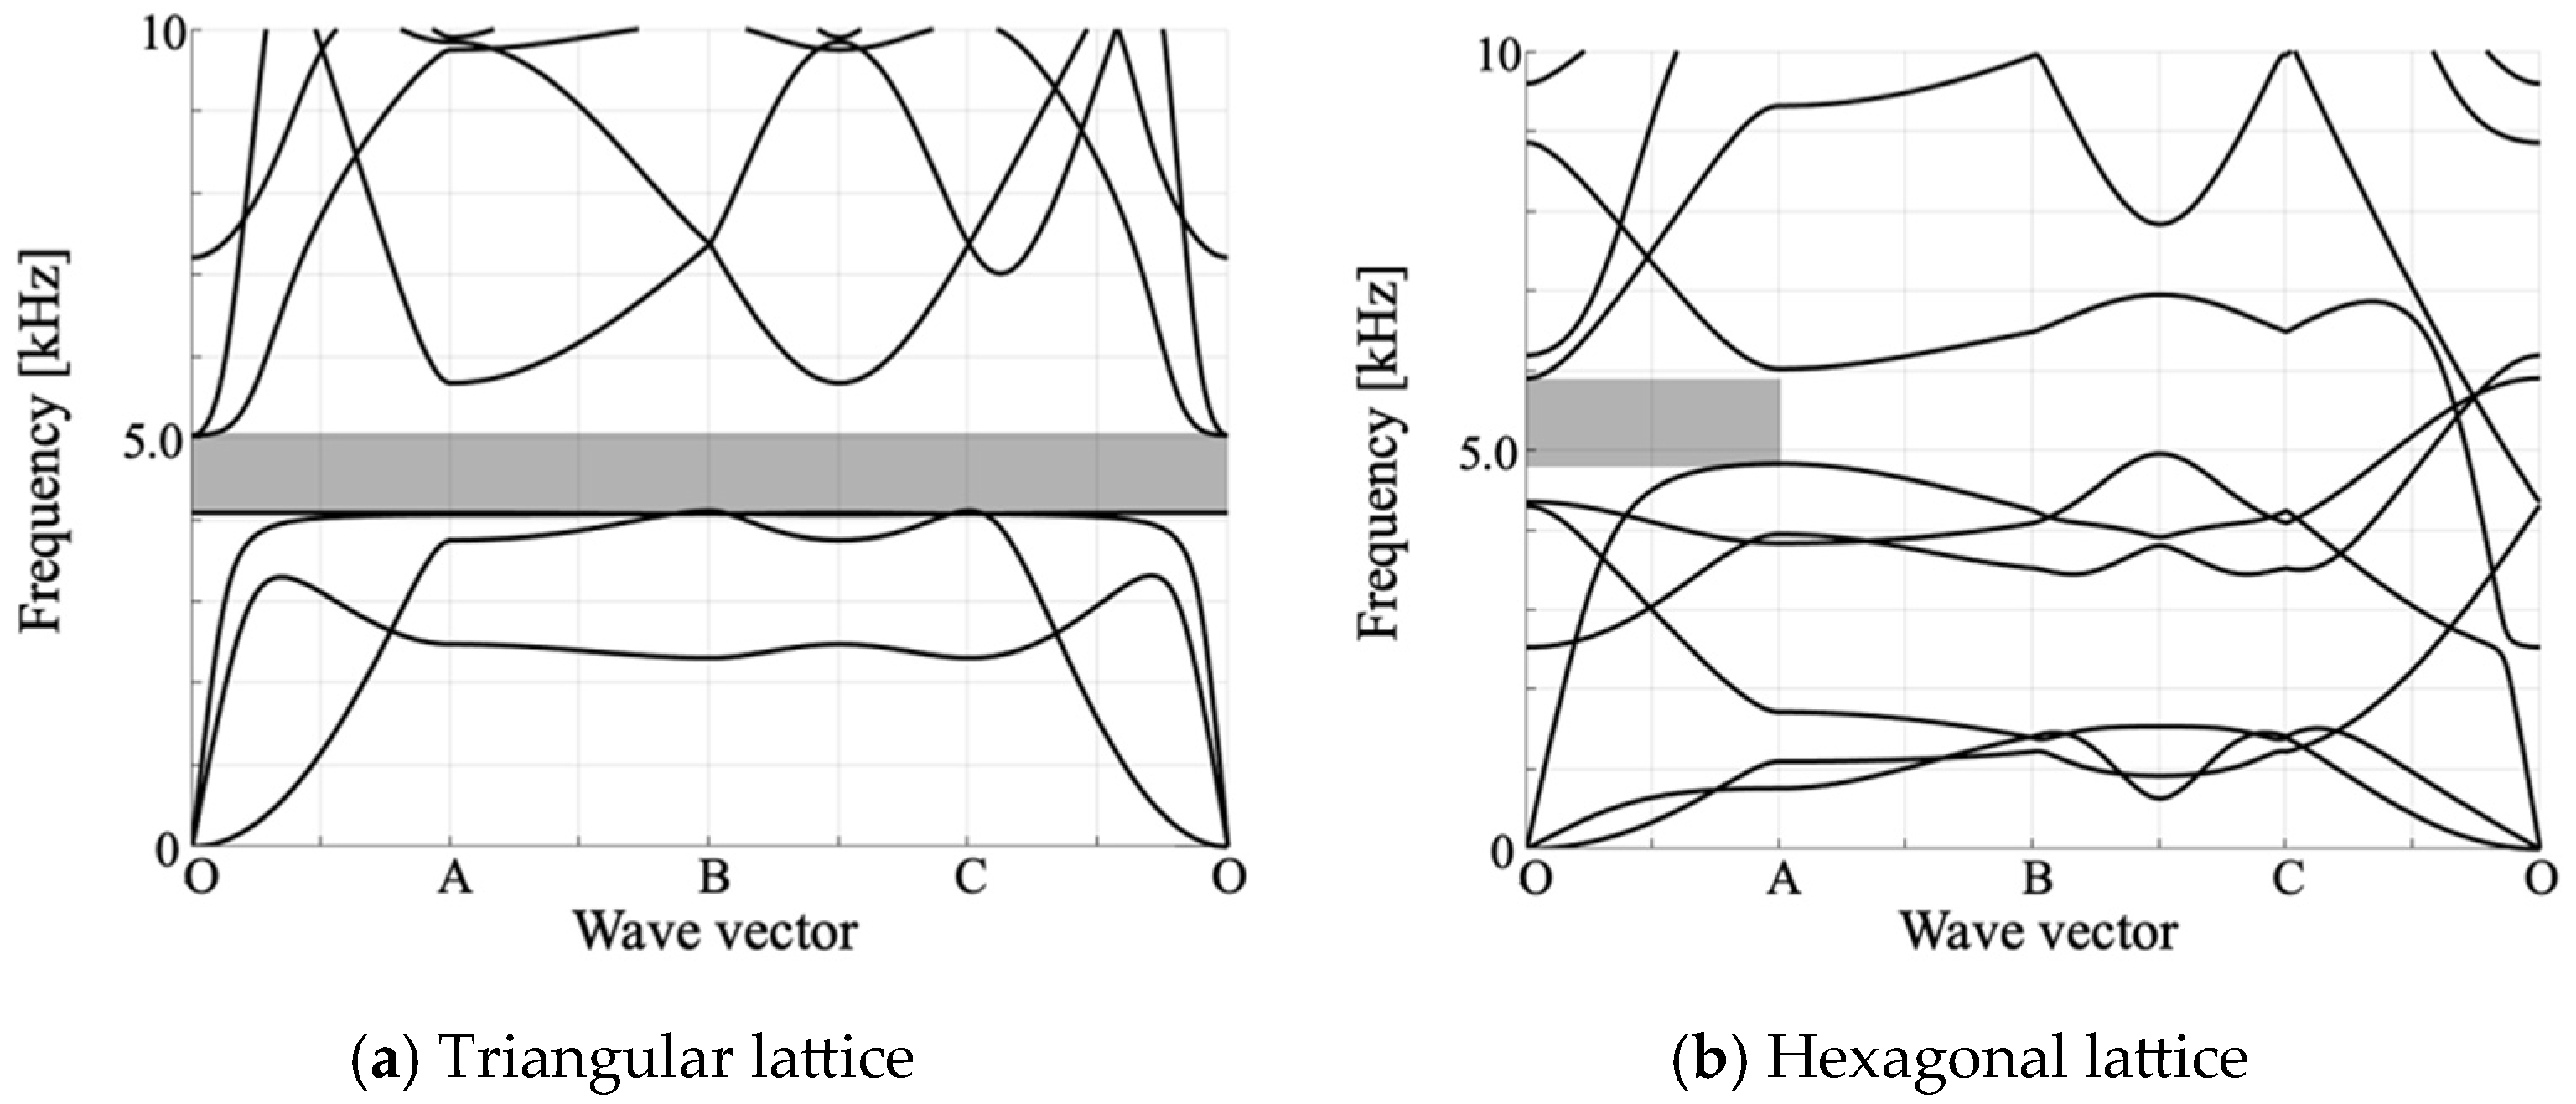
3.1. Dispersion Analysis of Lattice Structures
3.2. Verification of Dispersion Analysis with Transient Simulations
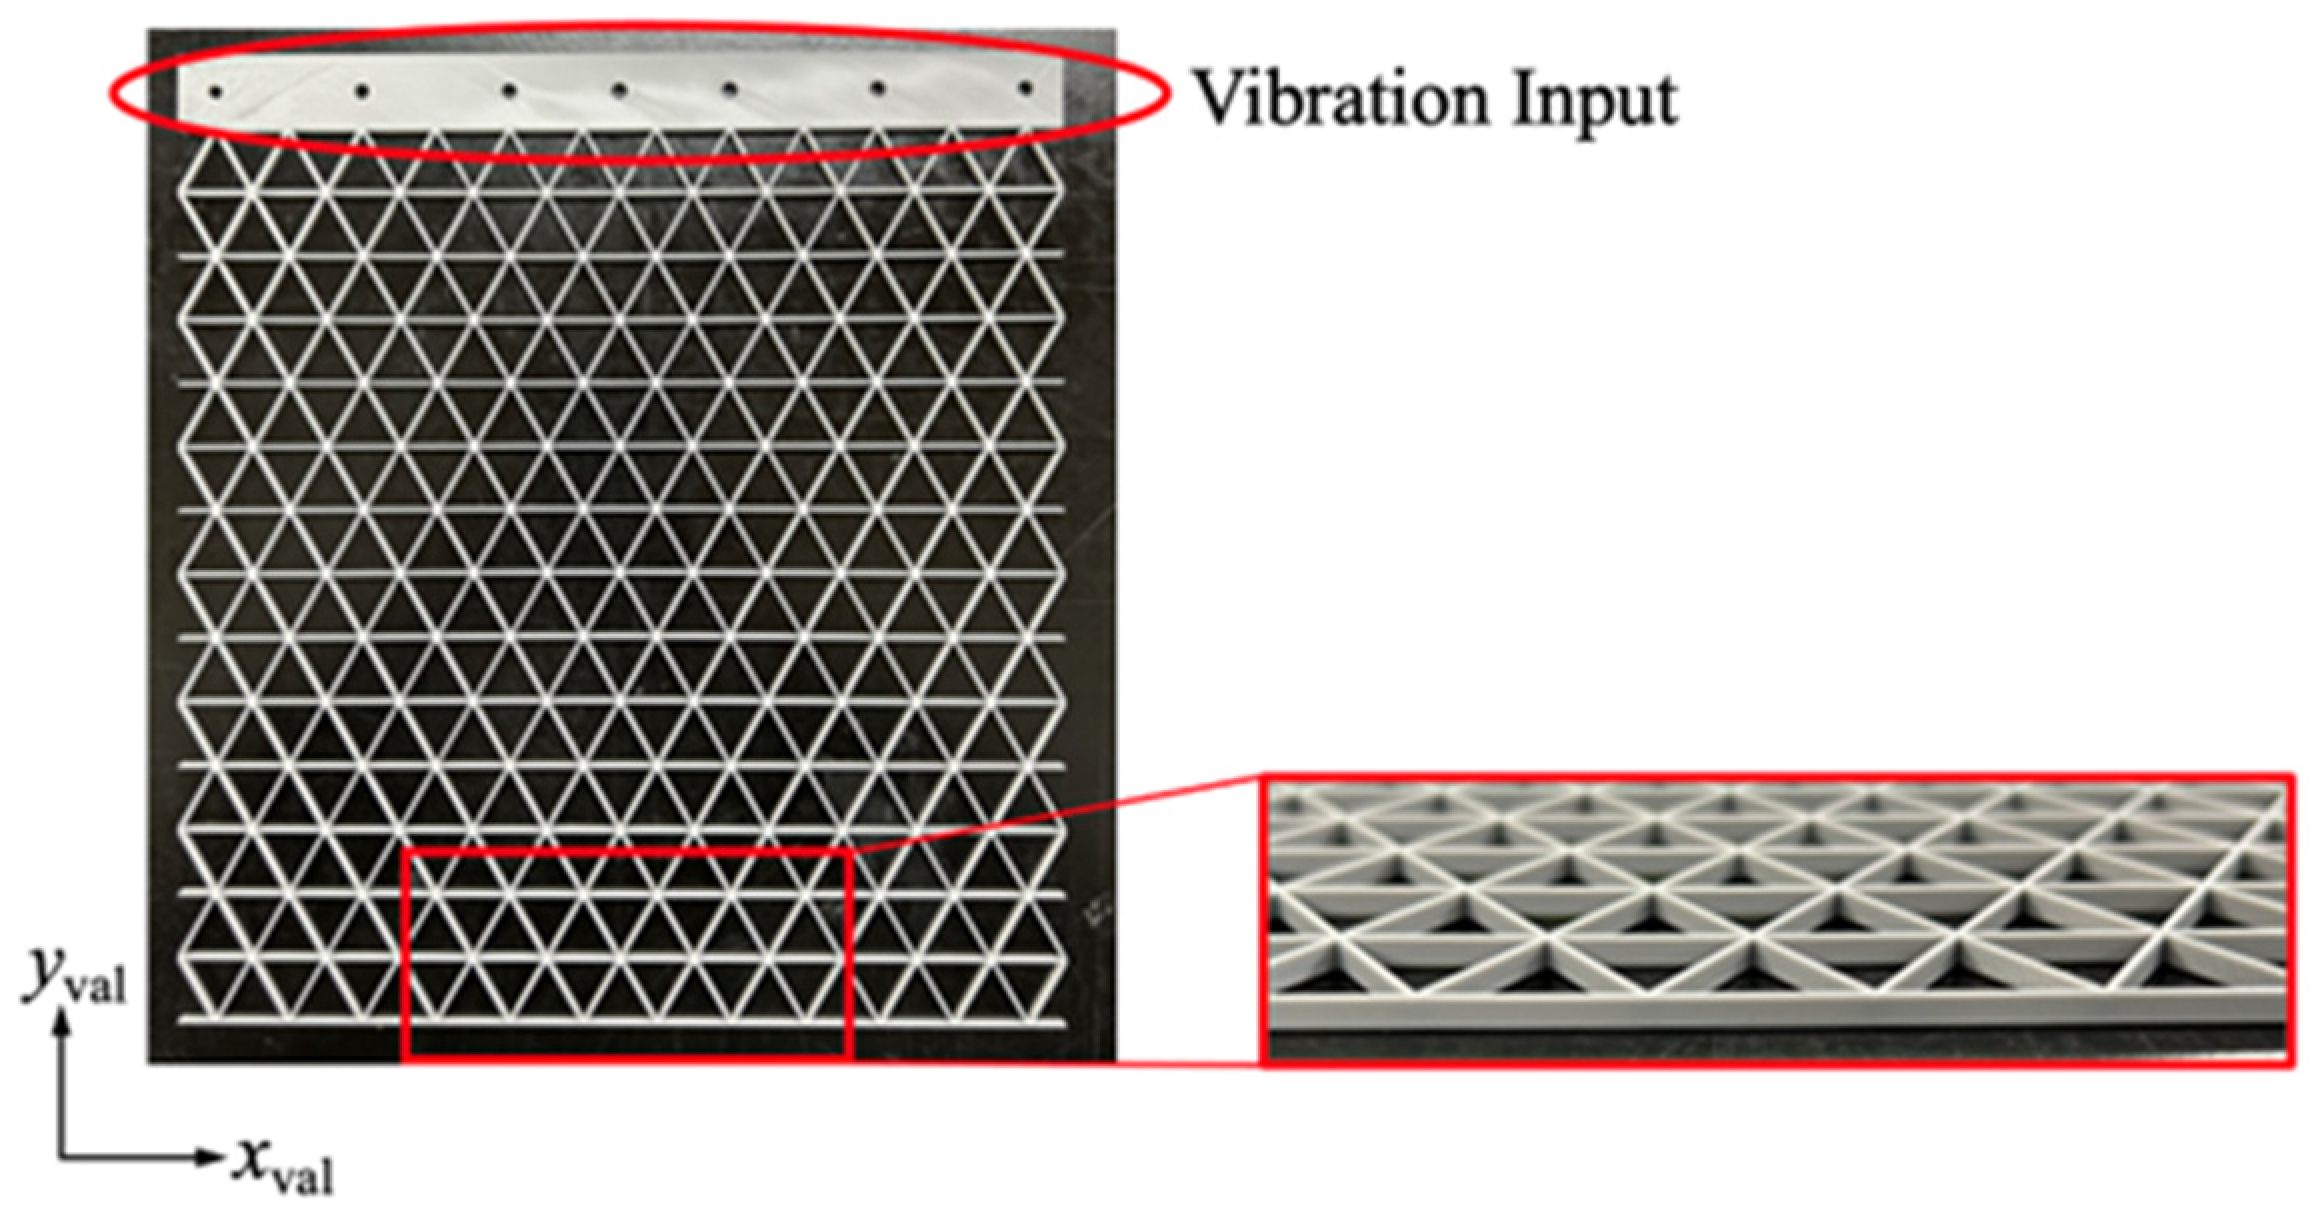
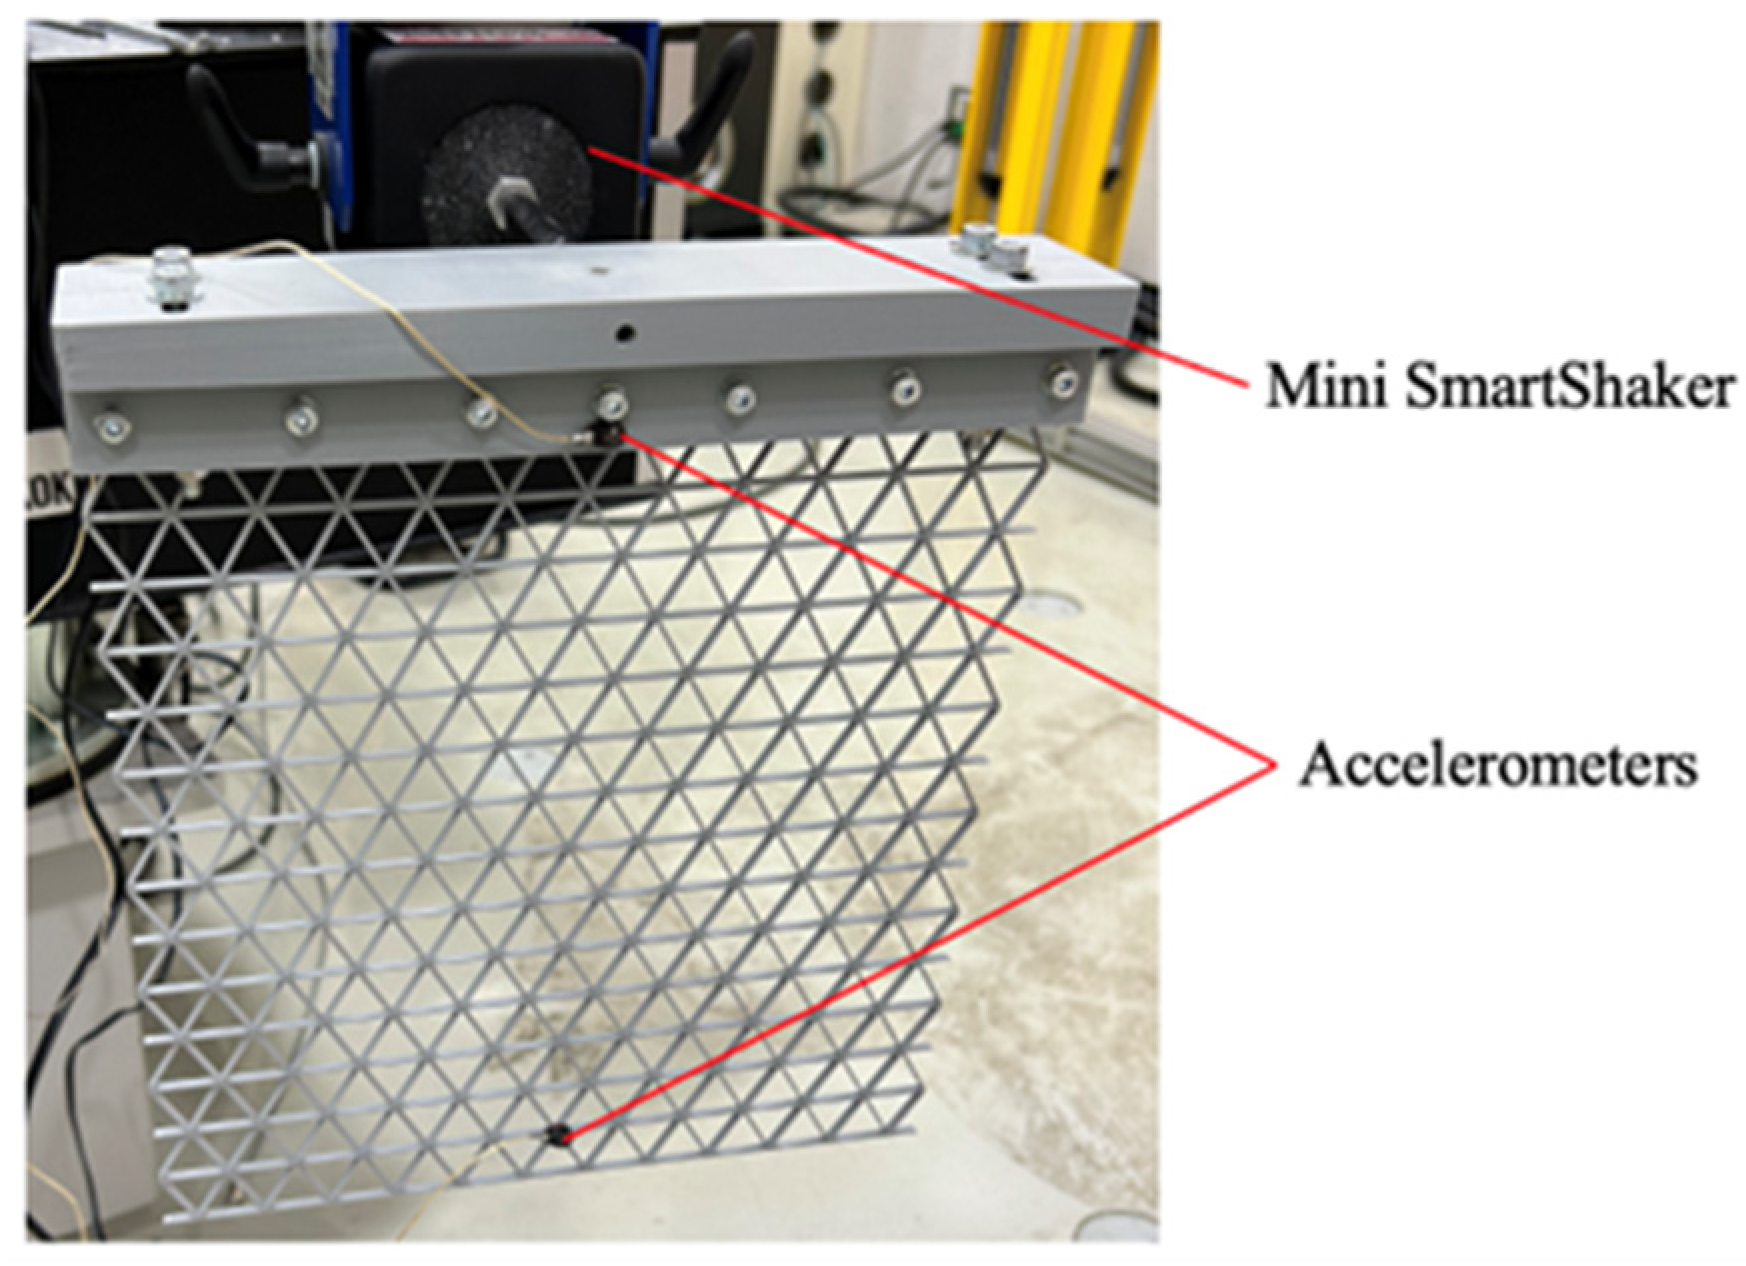
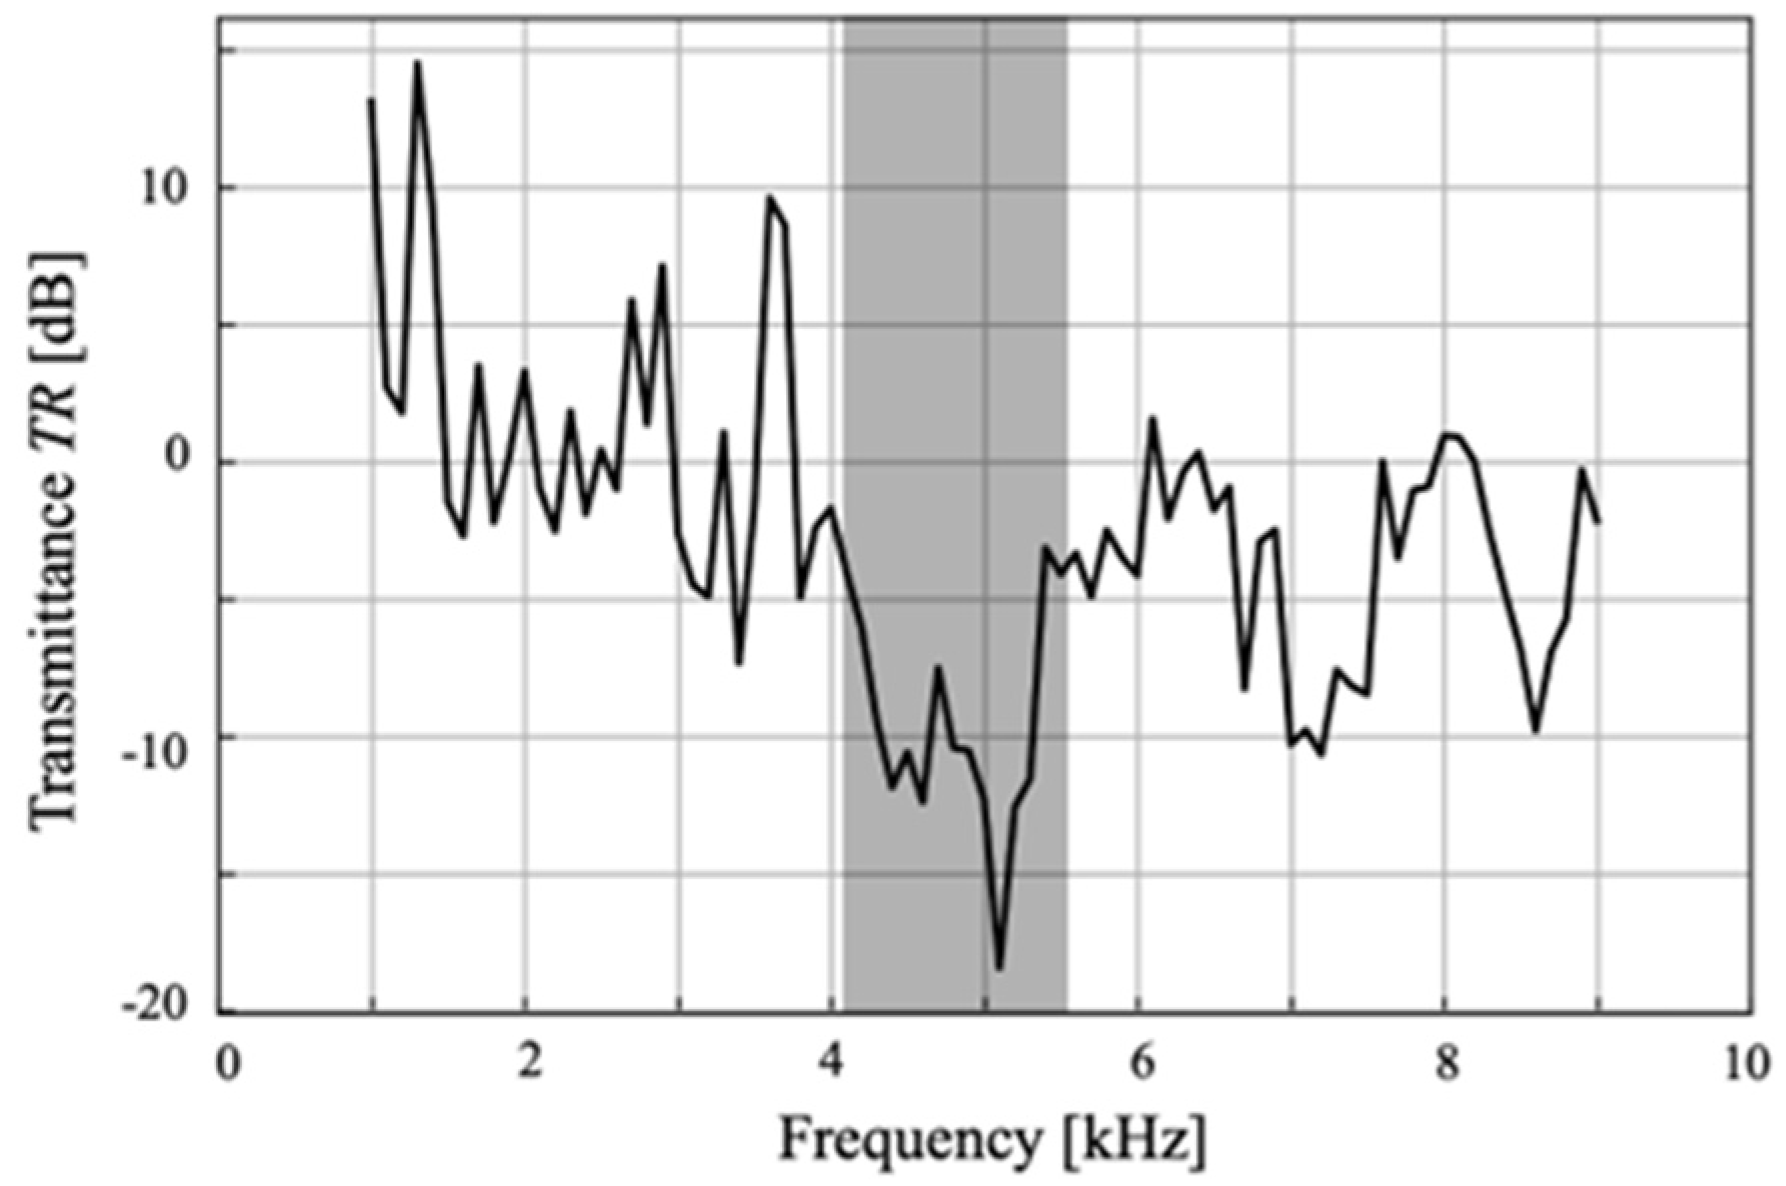
3.3. Experimental Validation
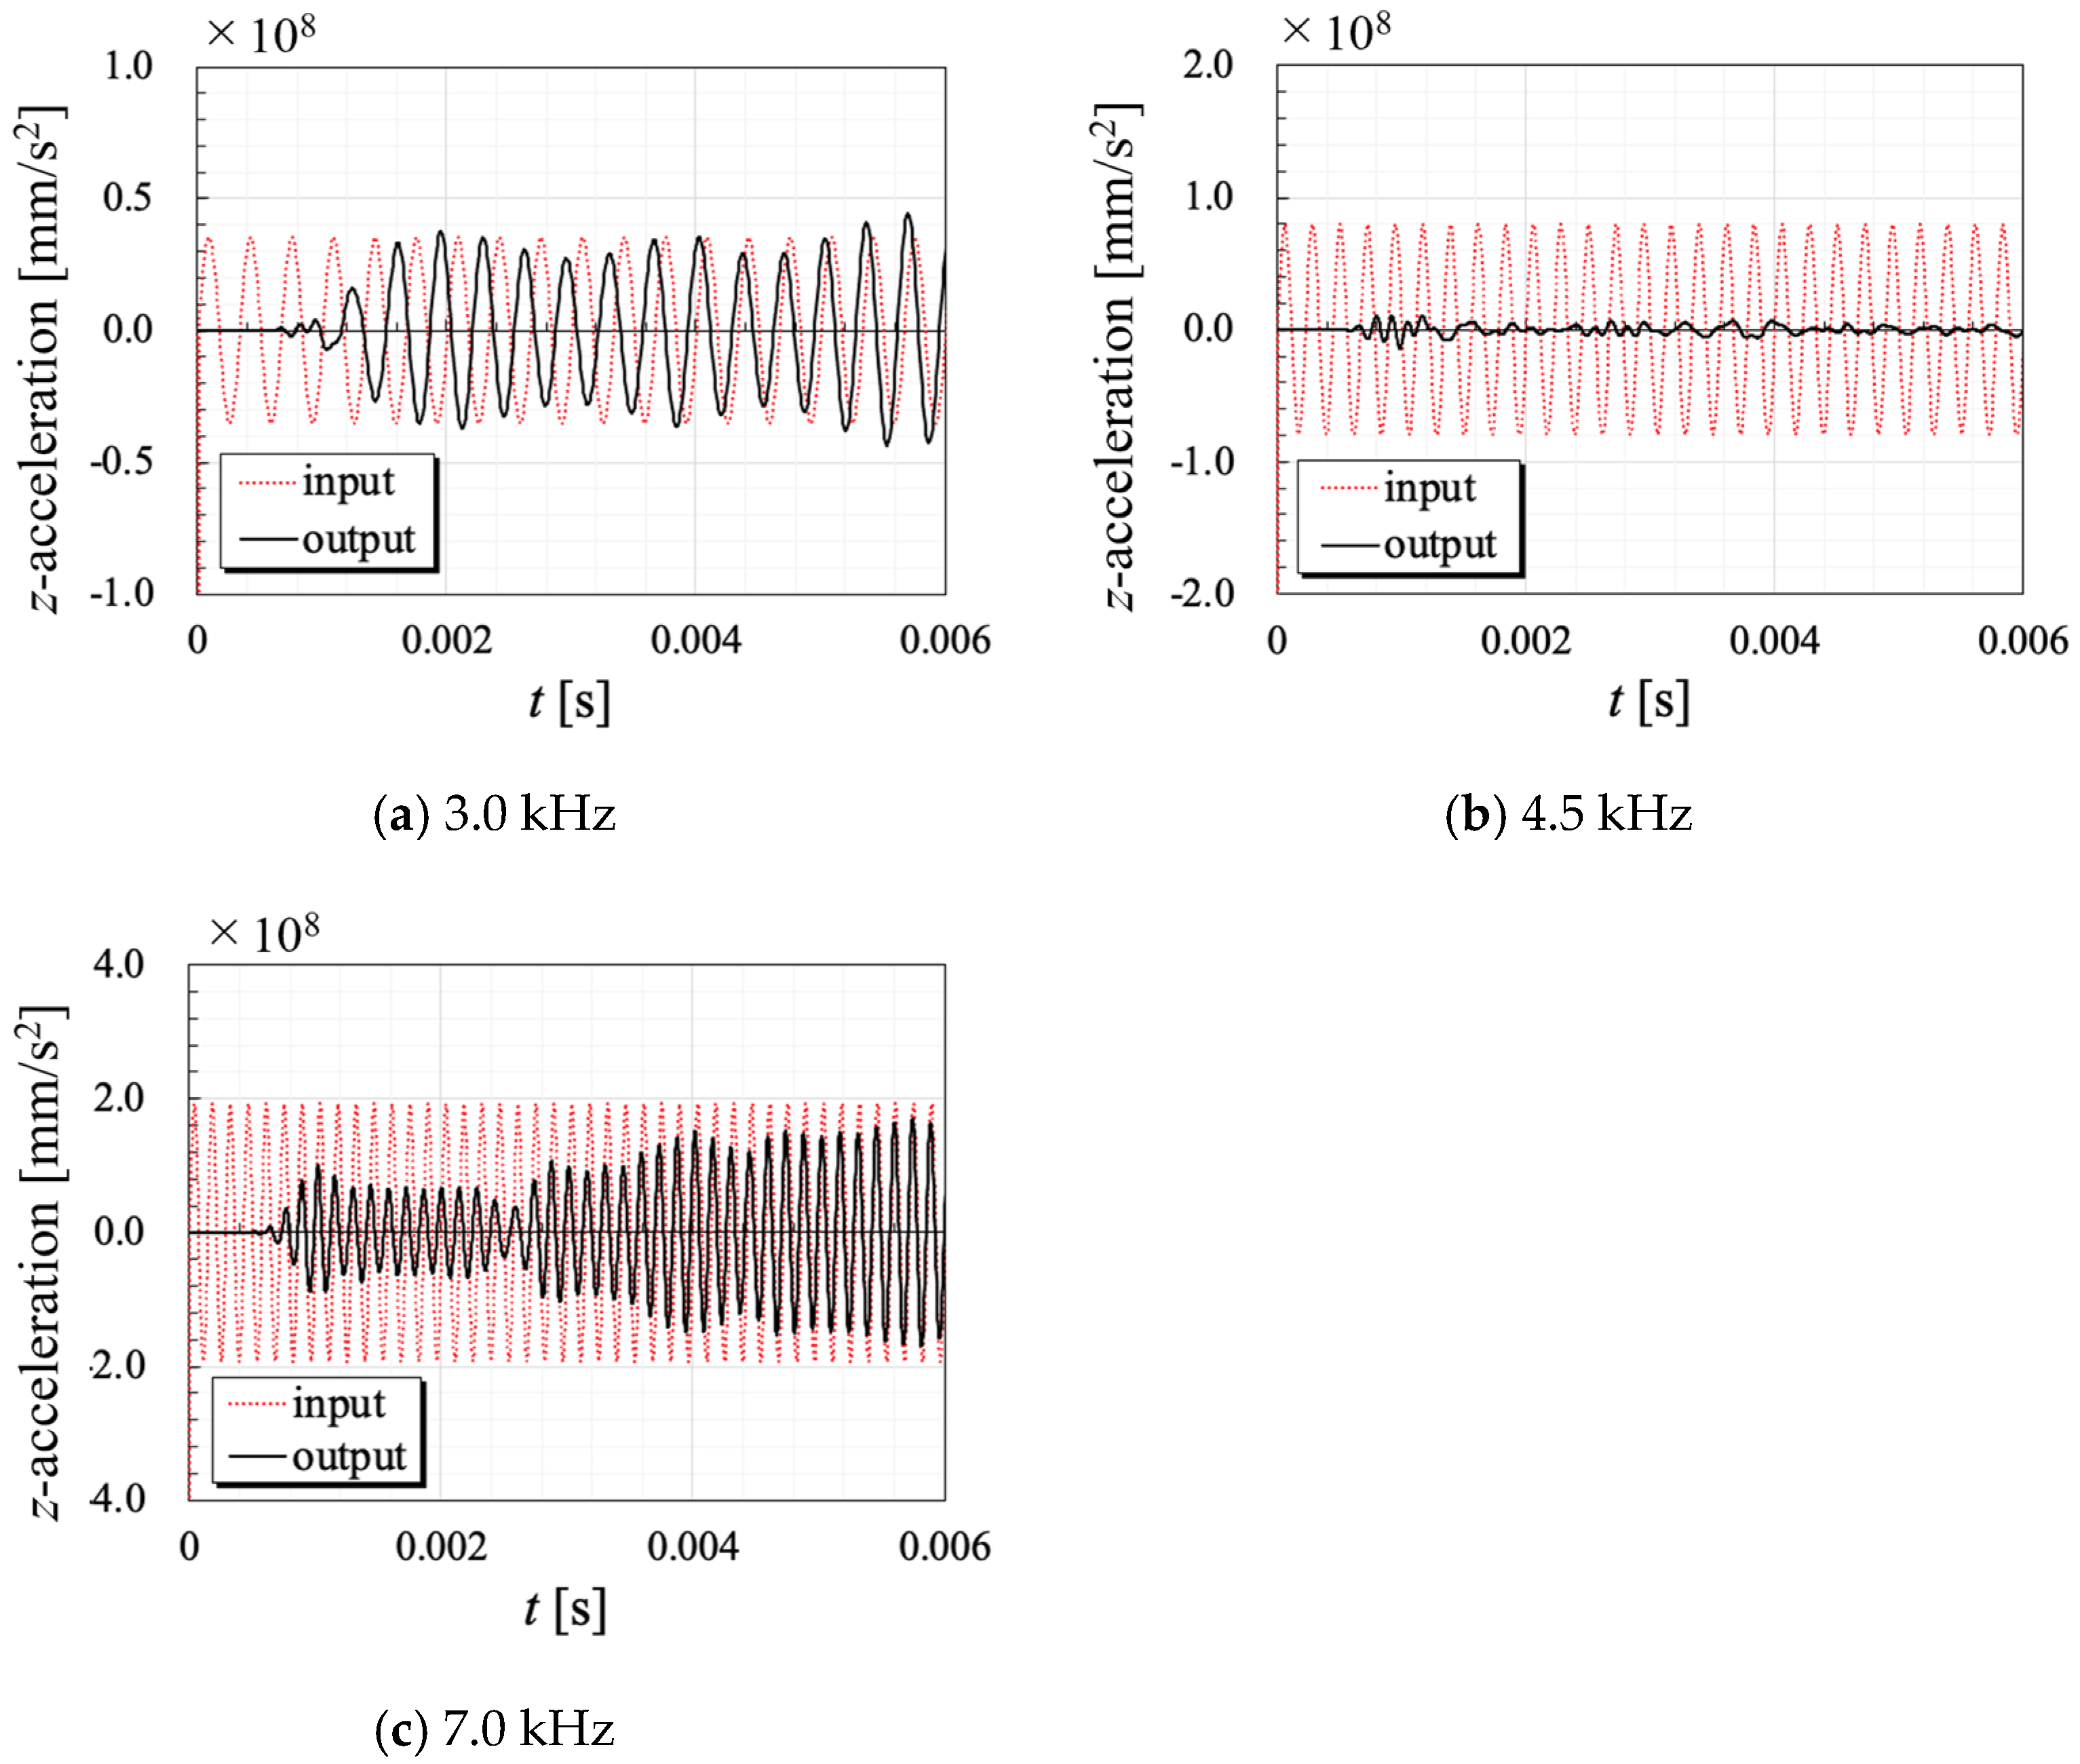
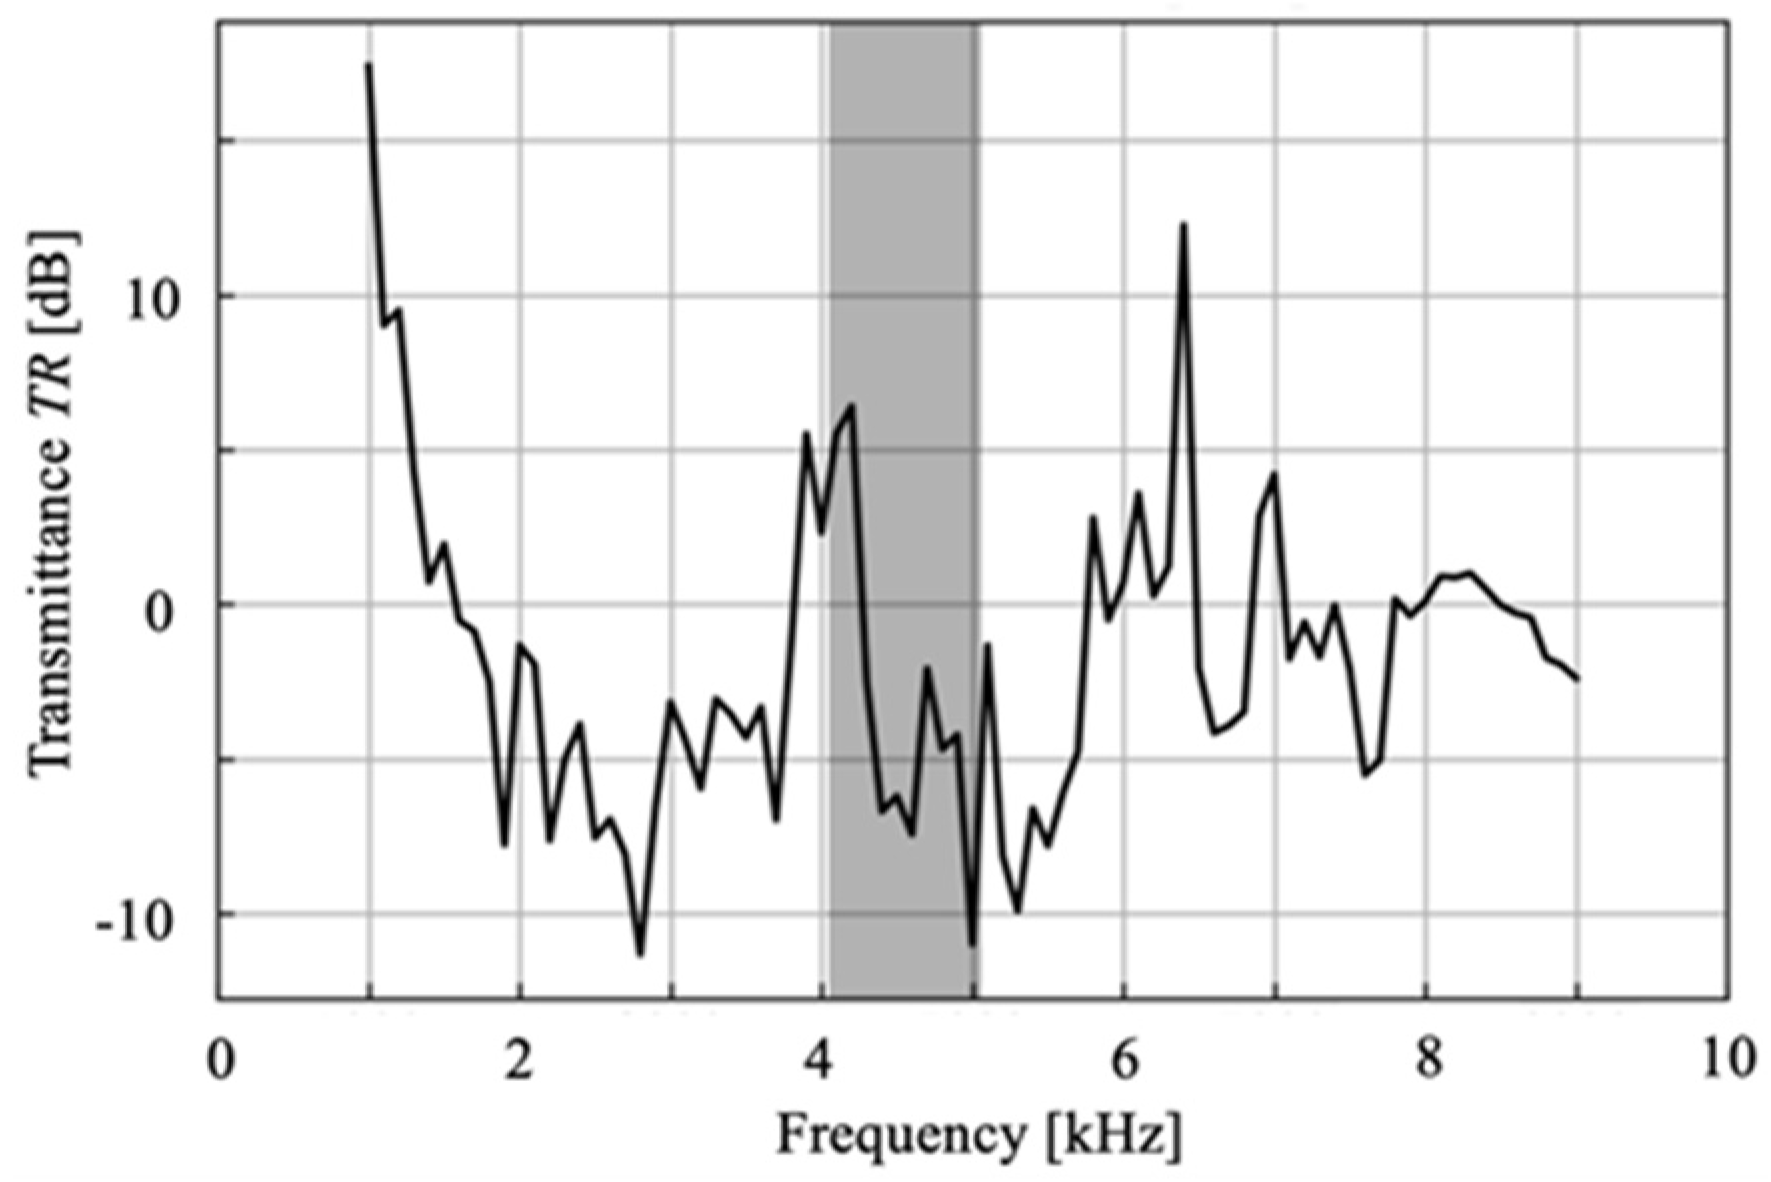
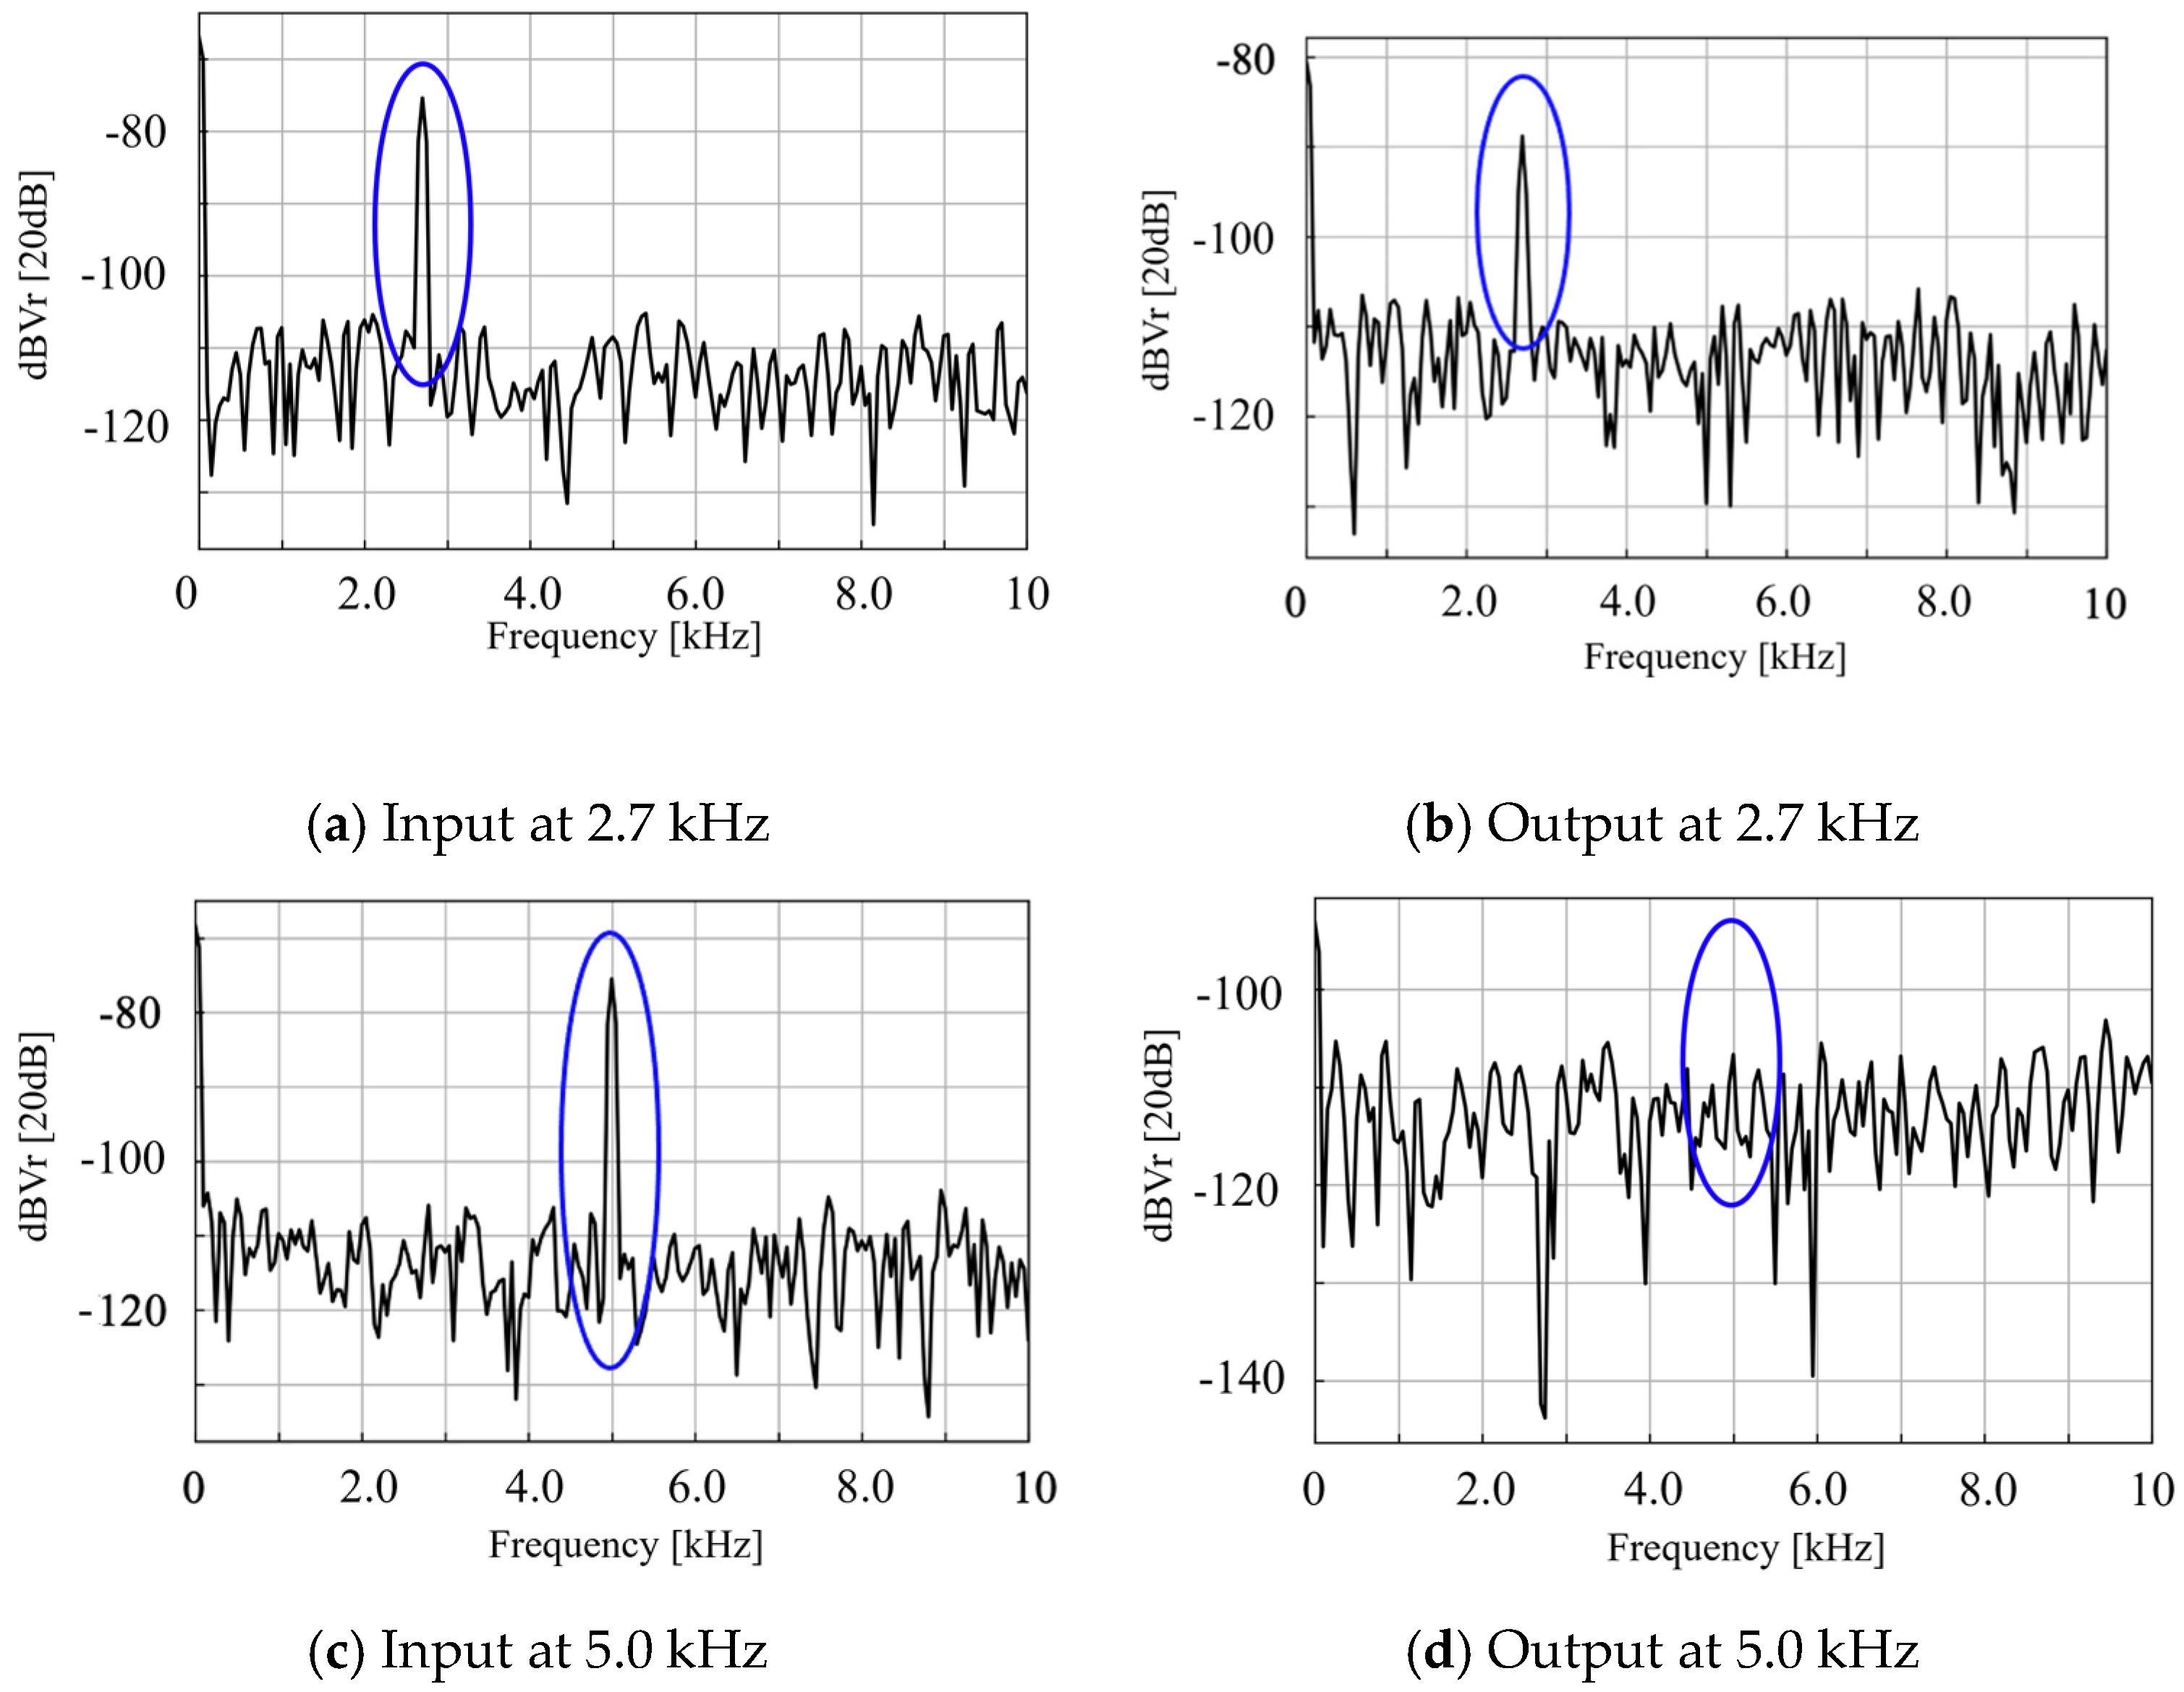
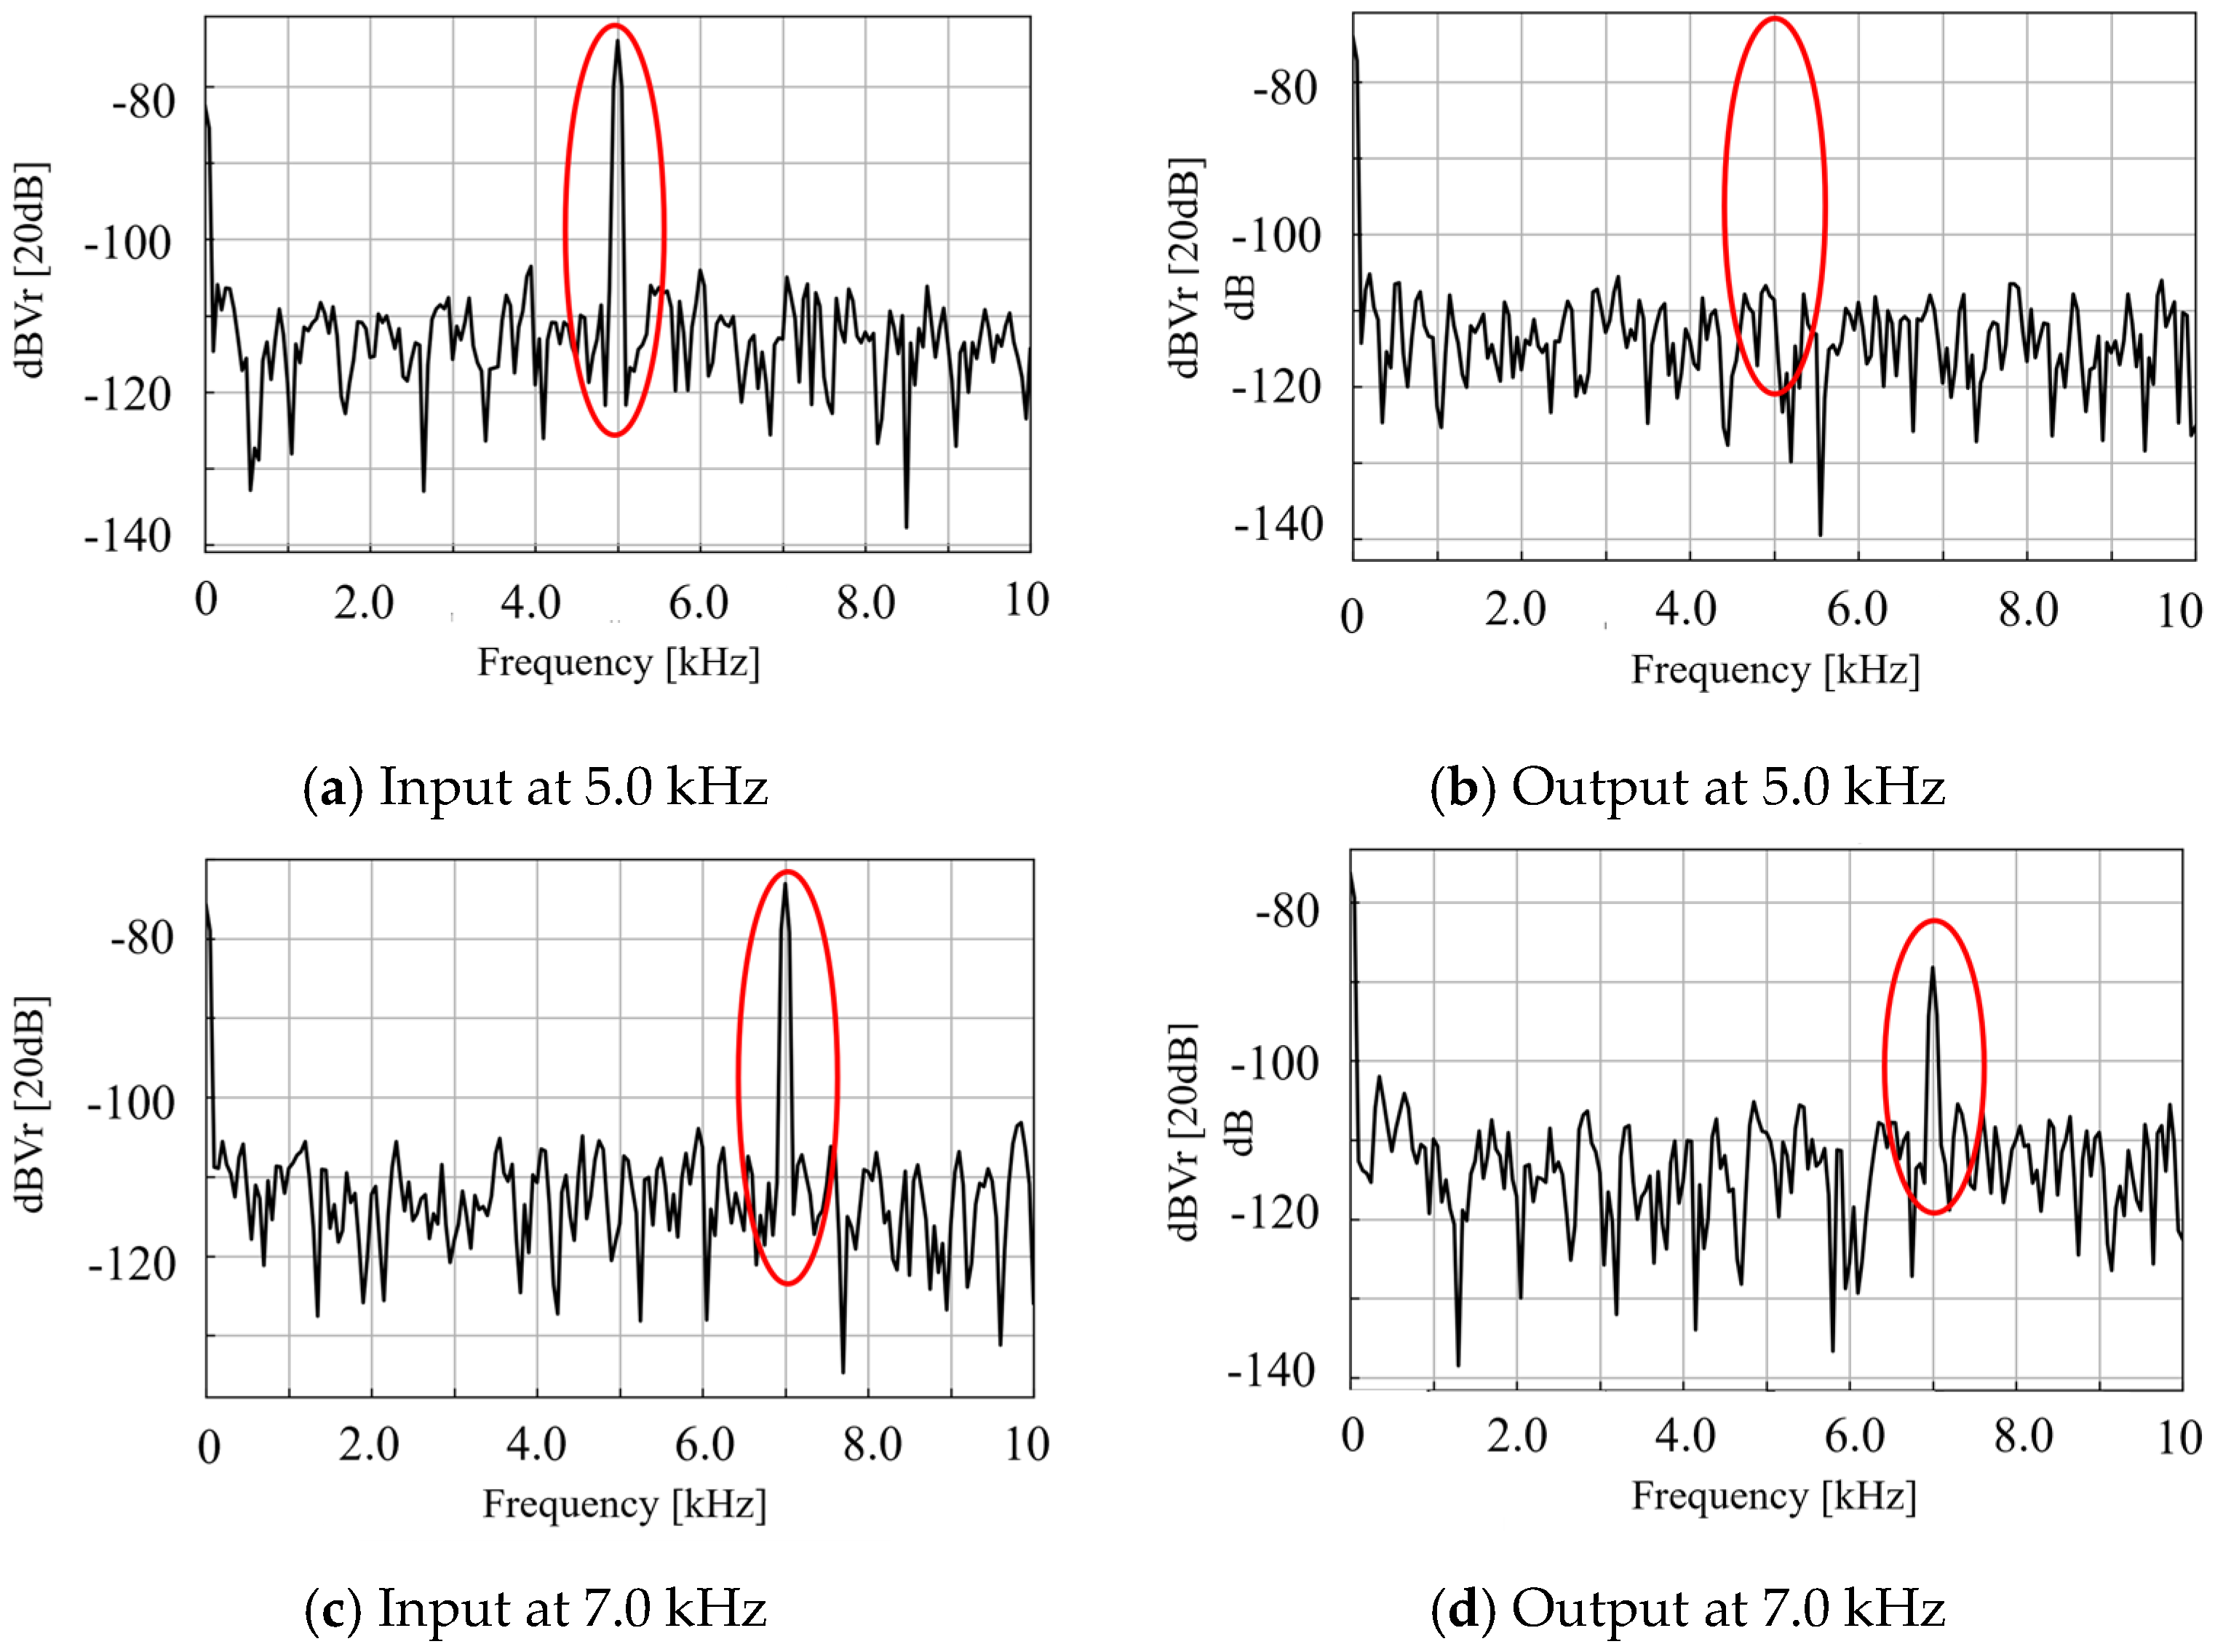
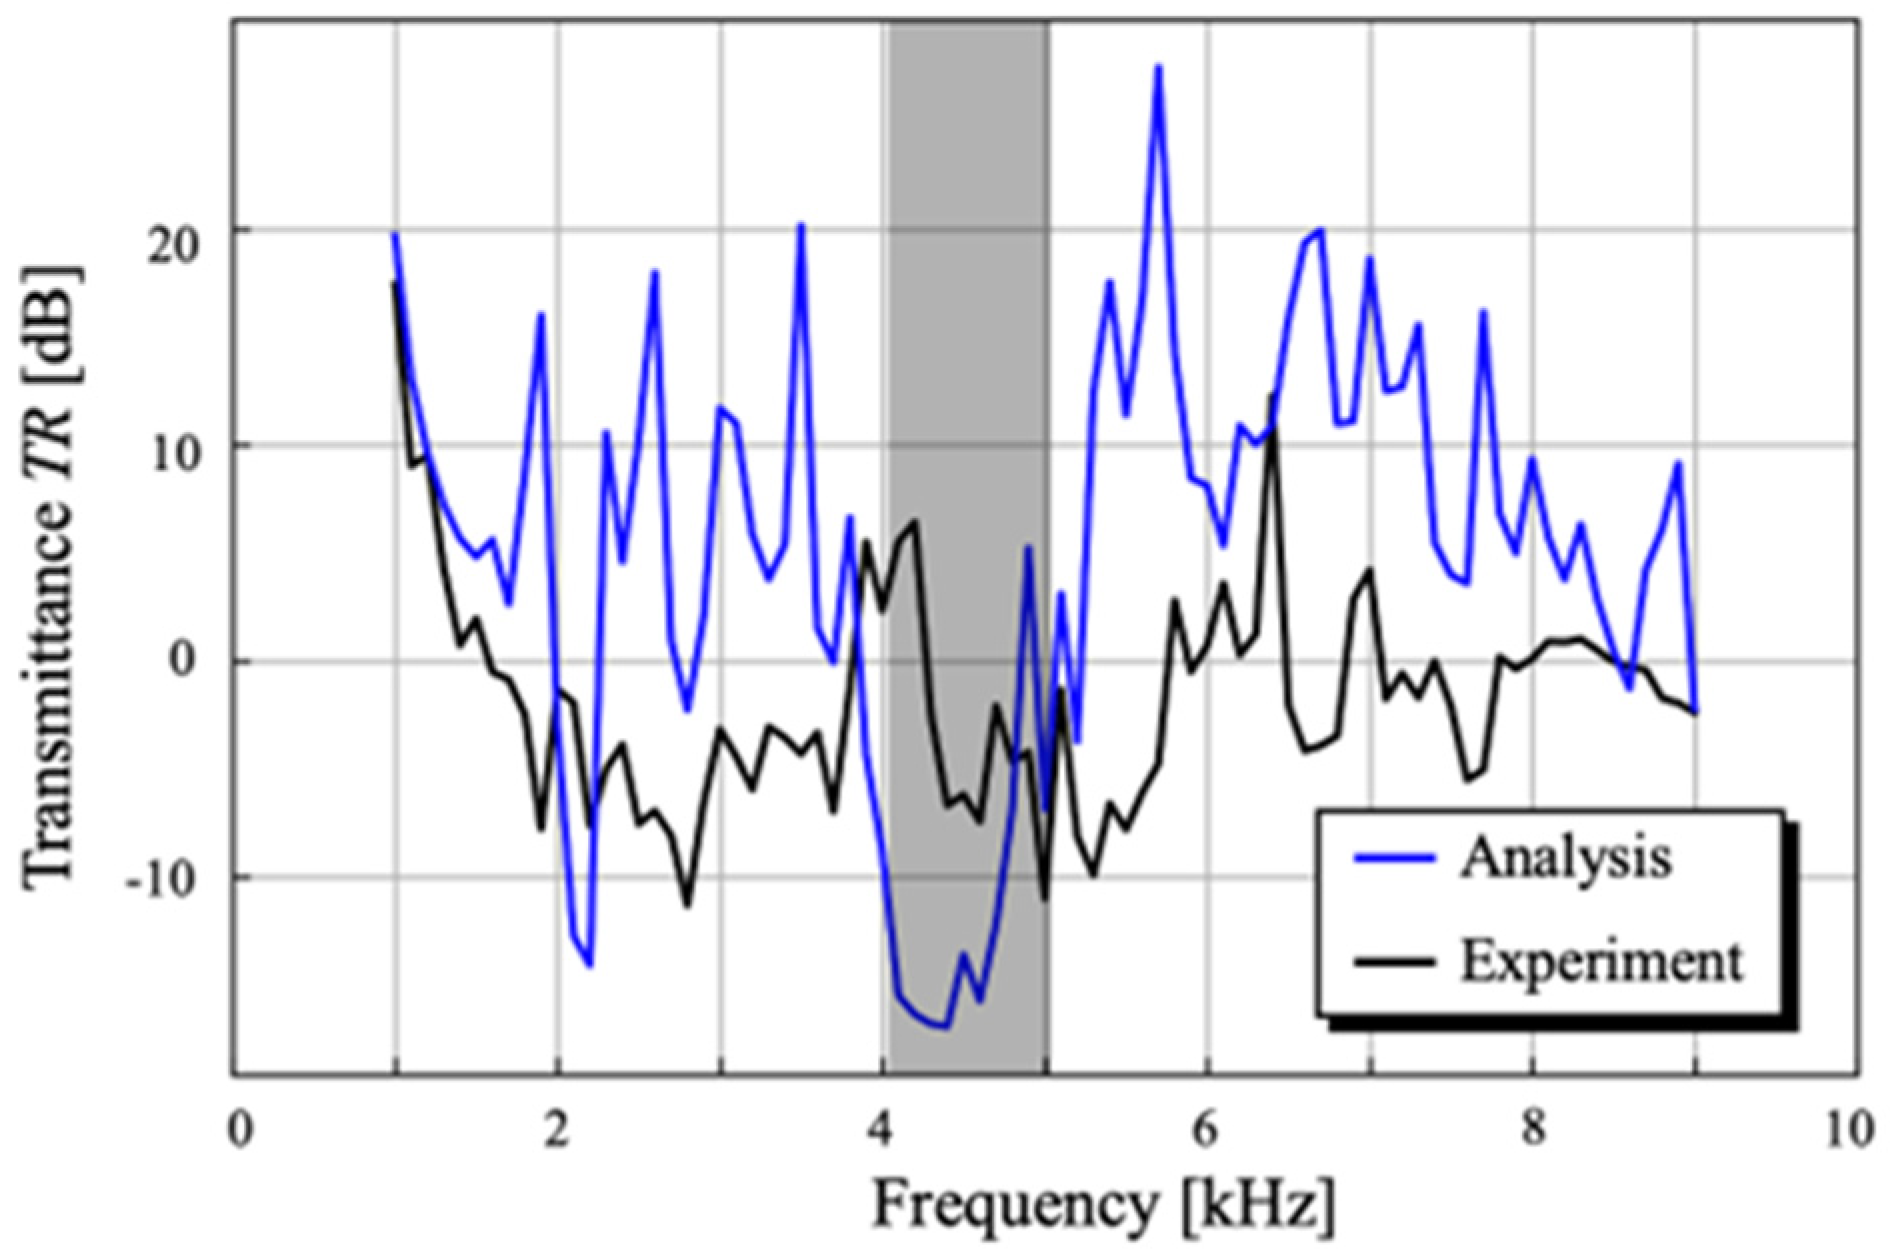
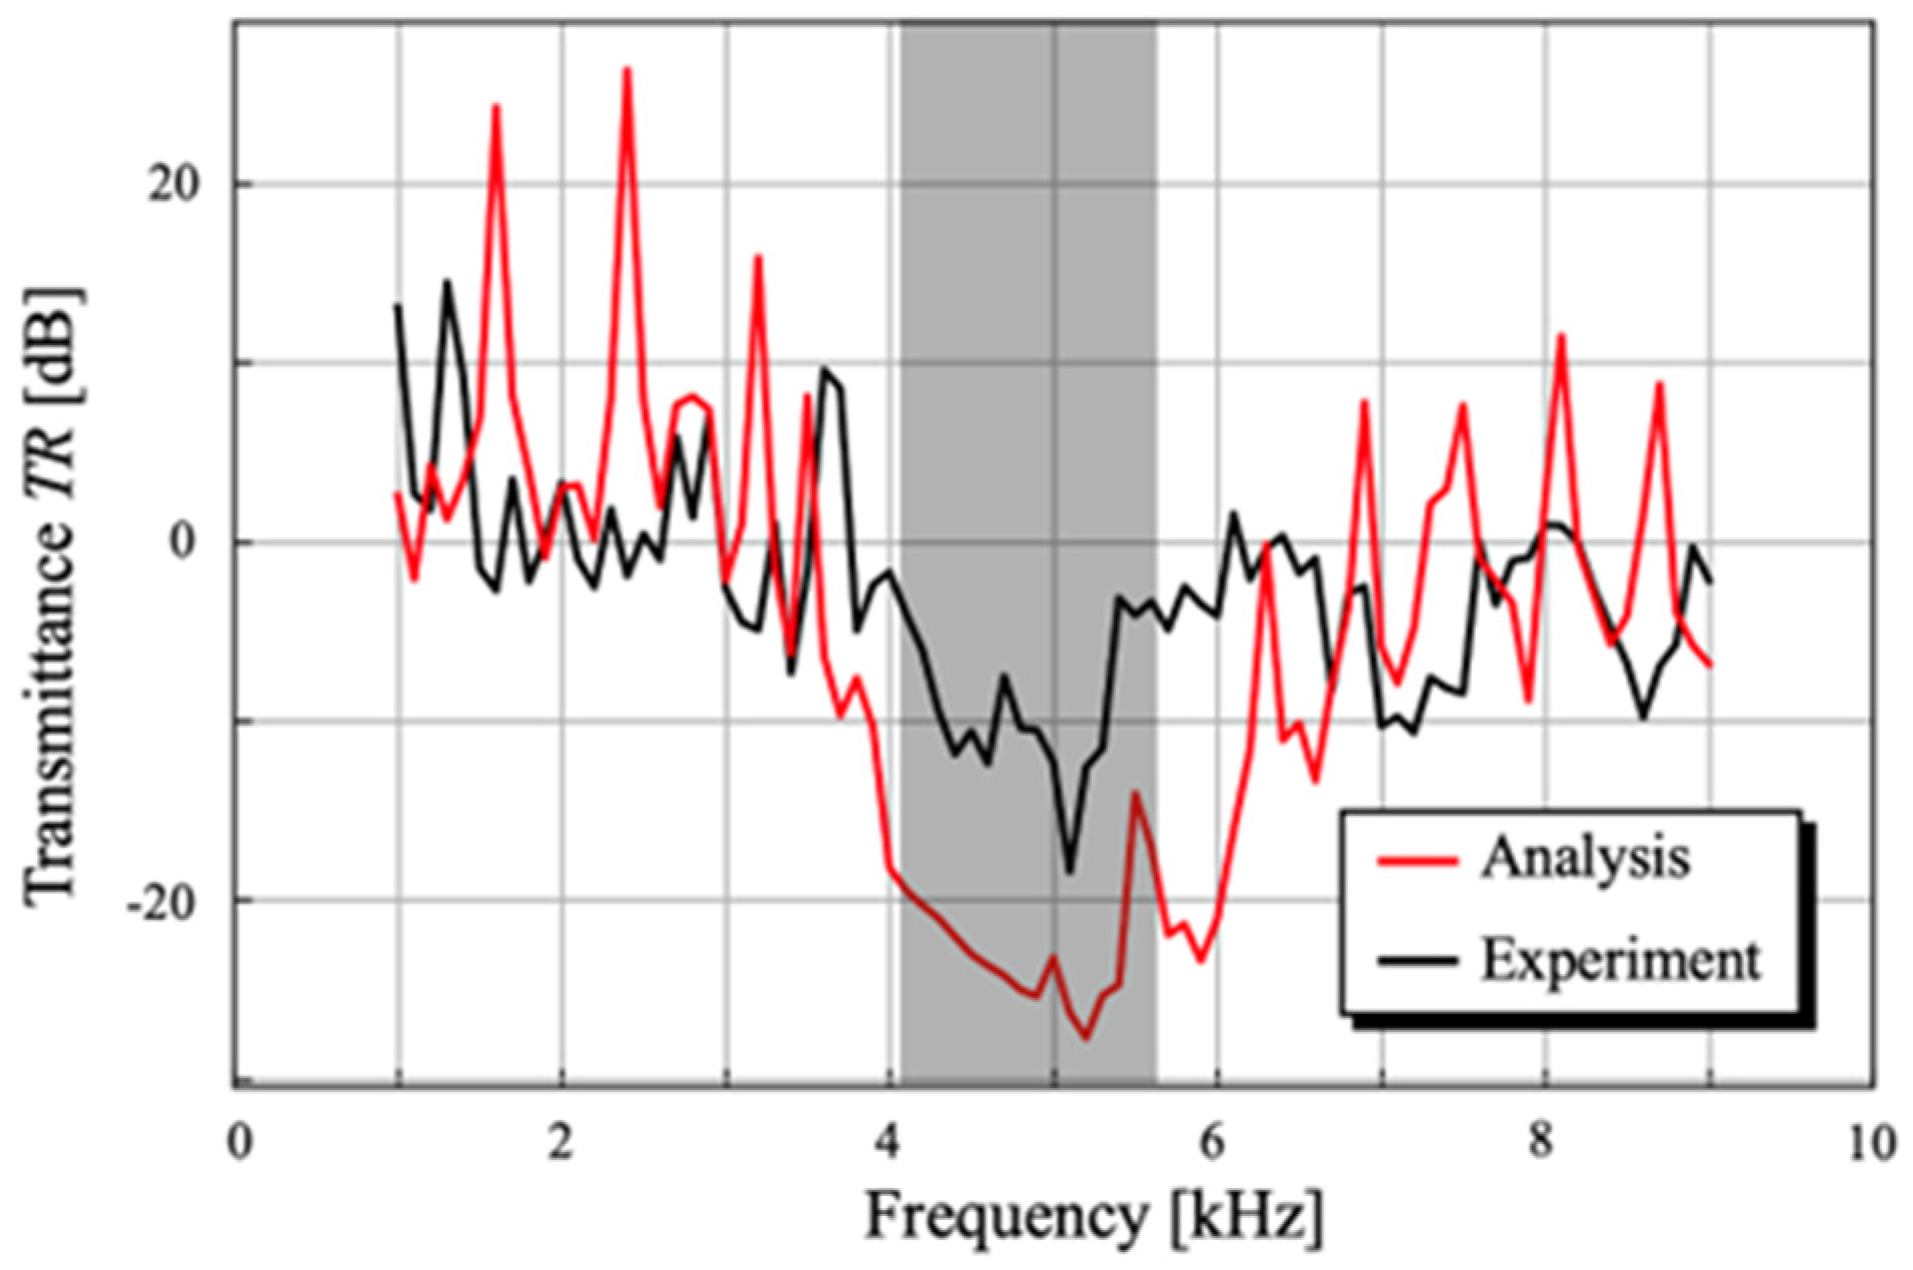
3.4. Comparison of Transient Simulations and Experimental Results
4. Numerical Studies
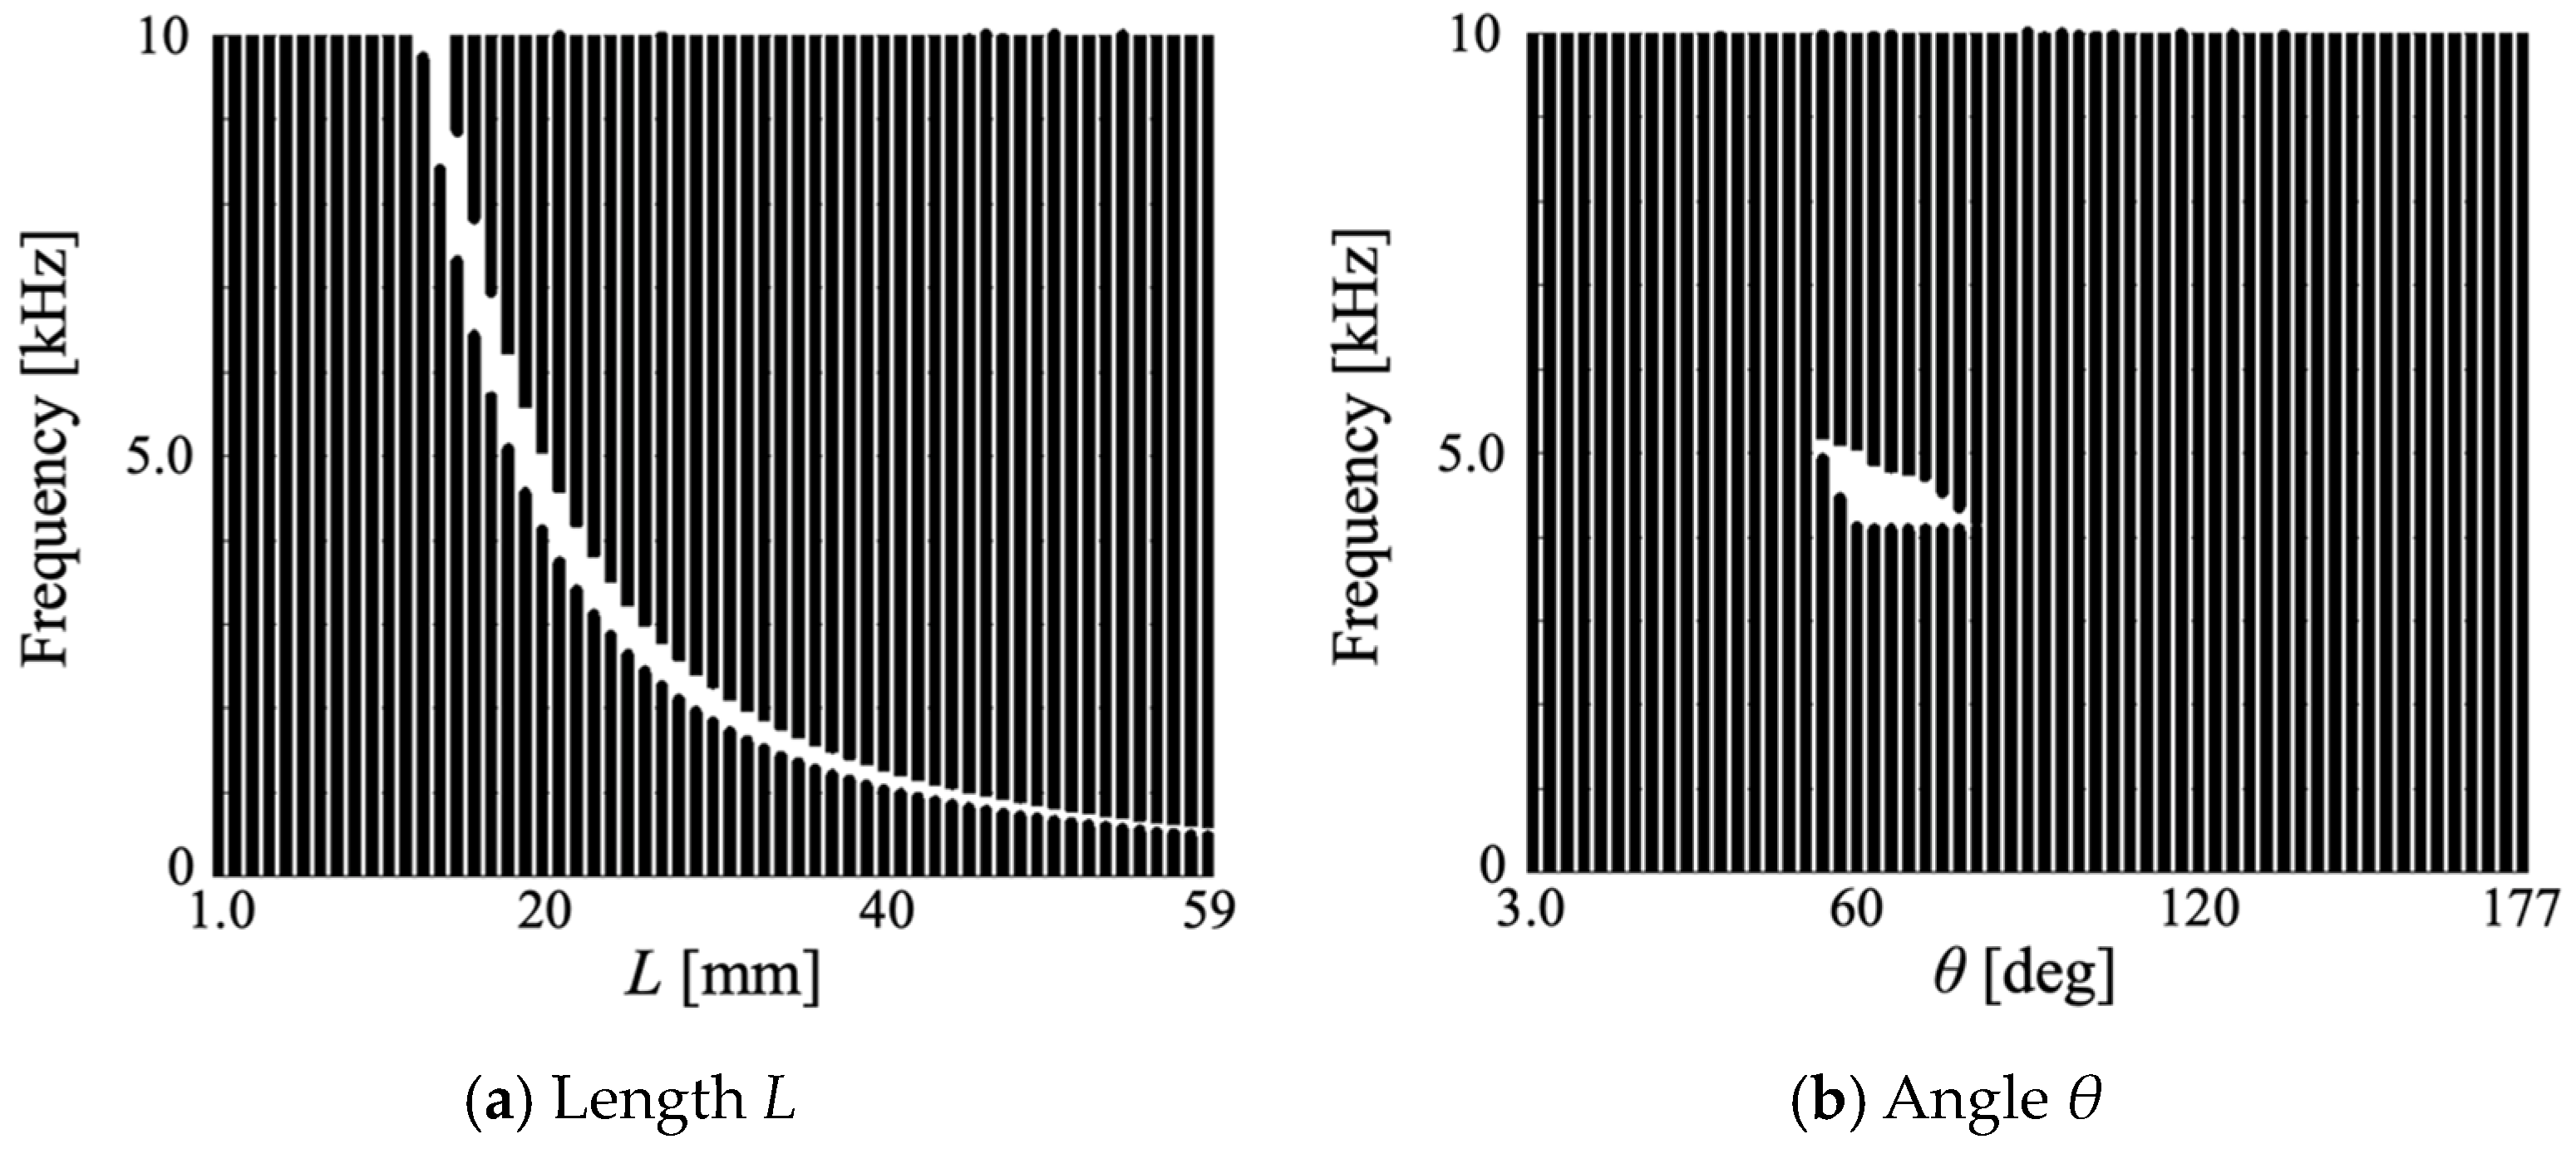
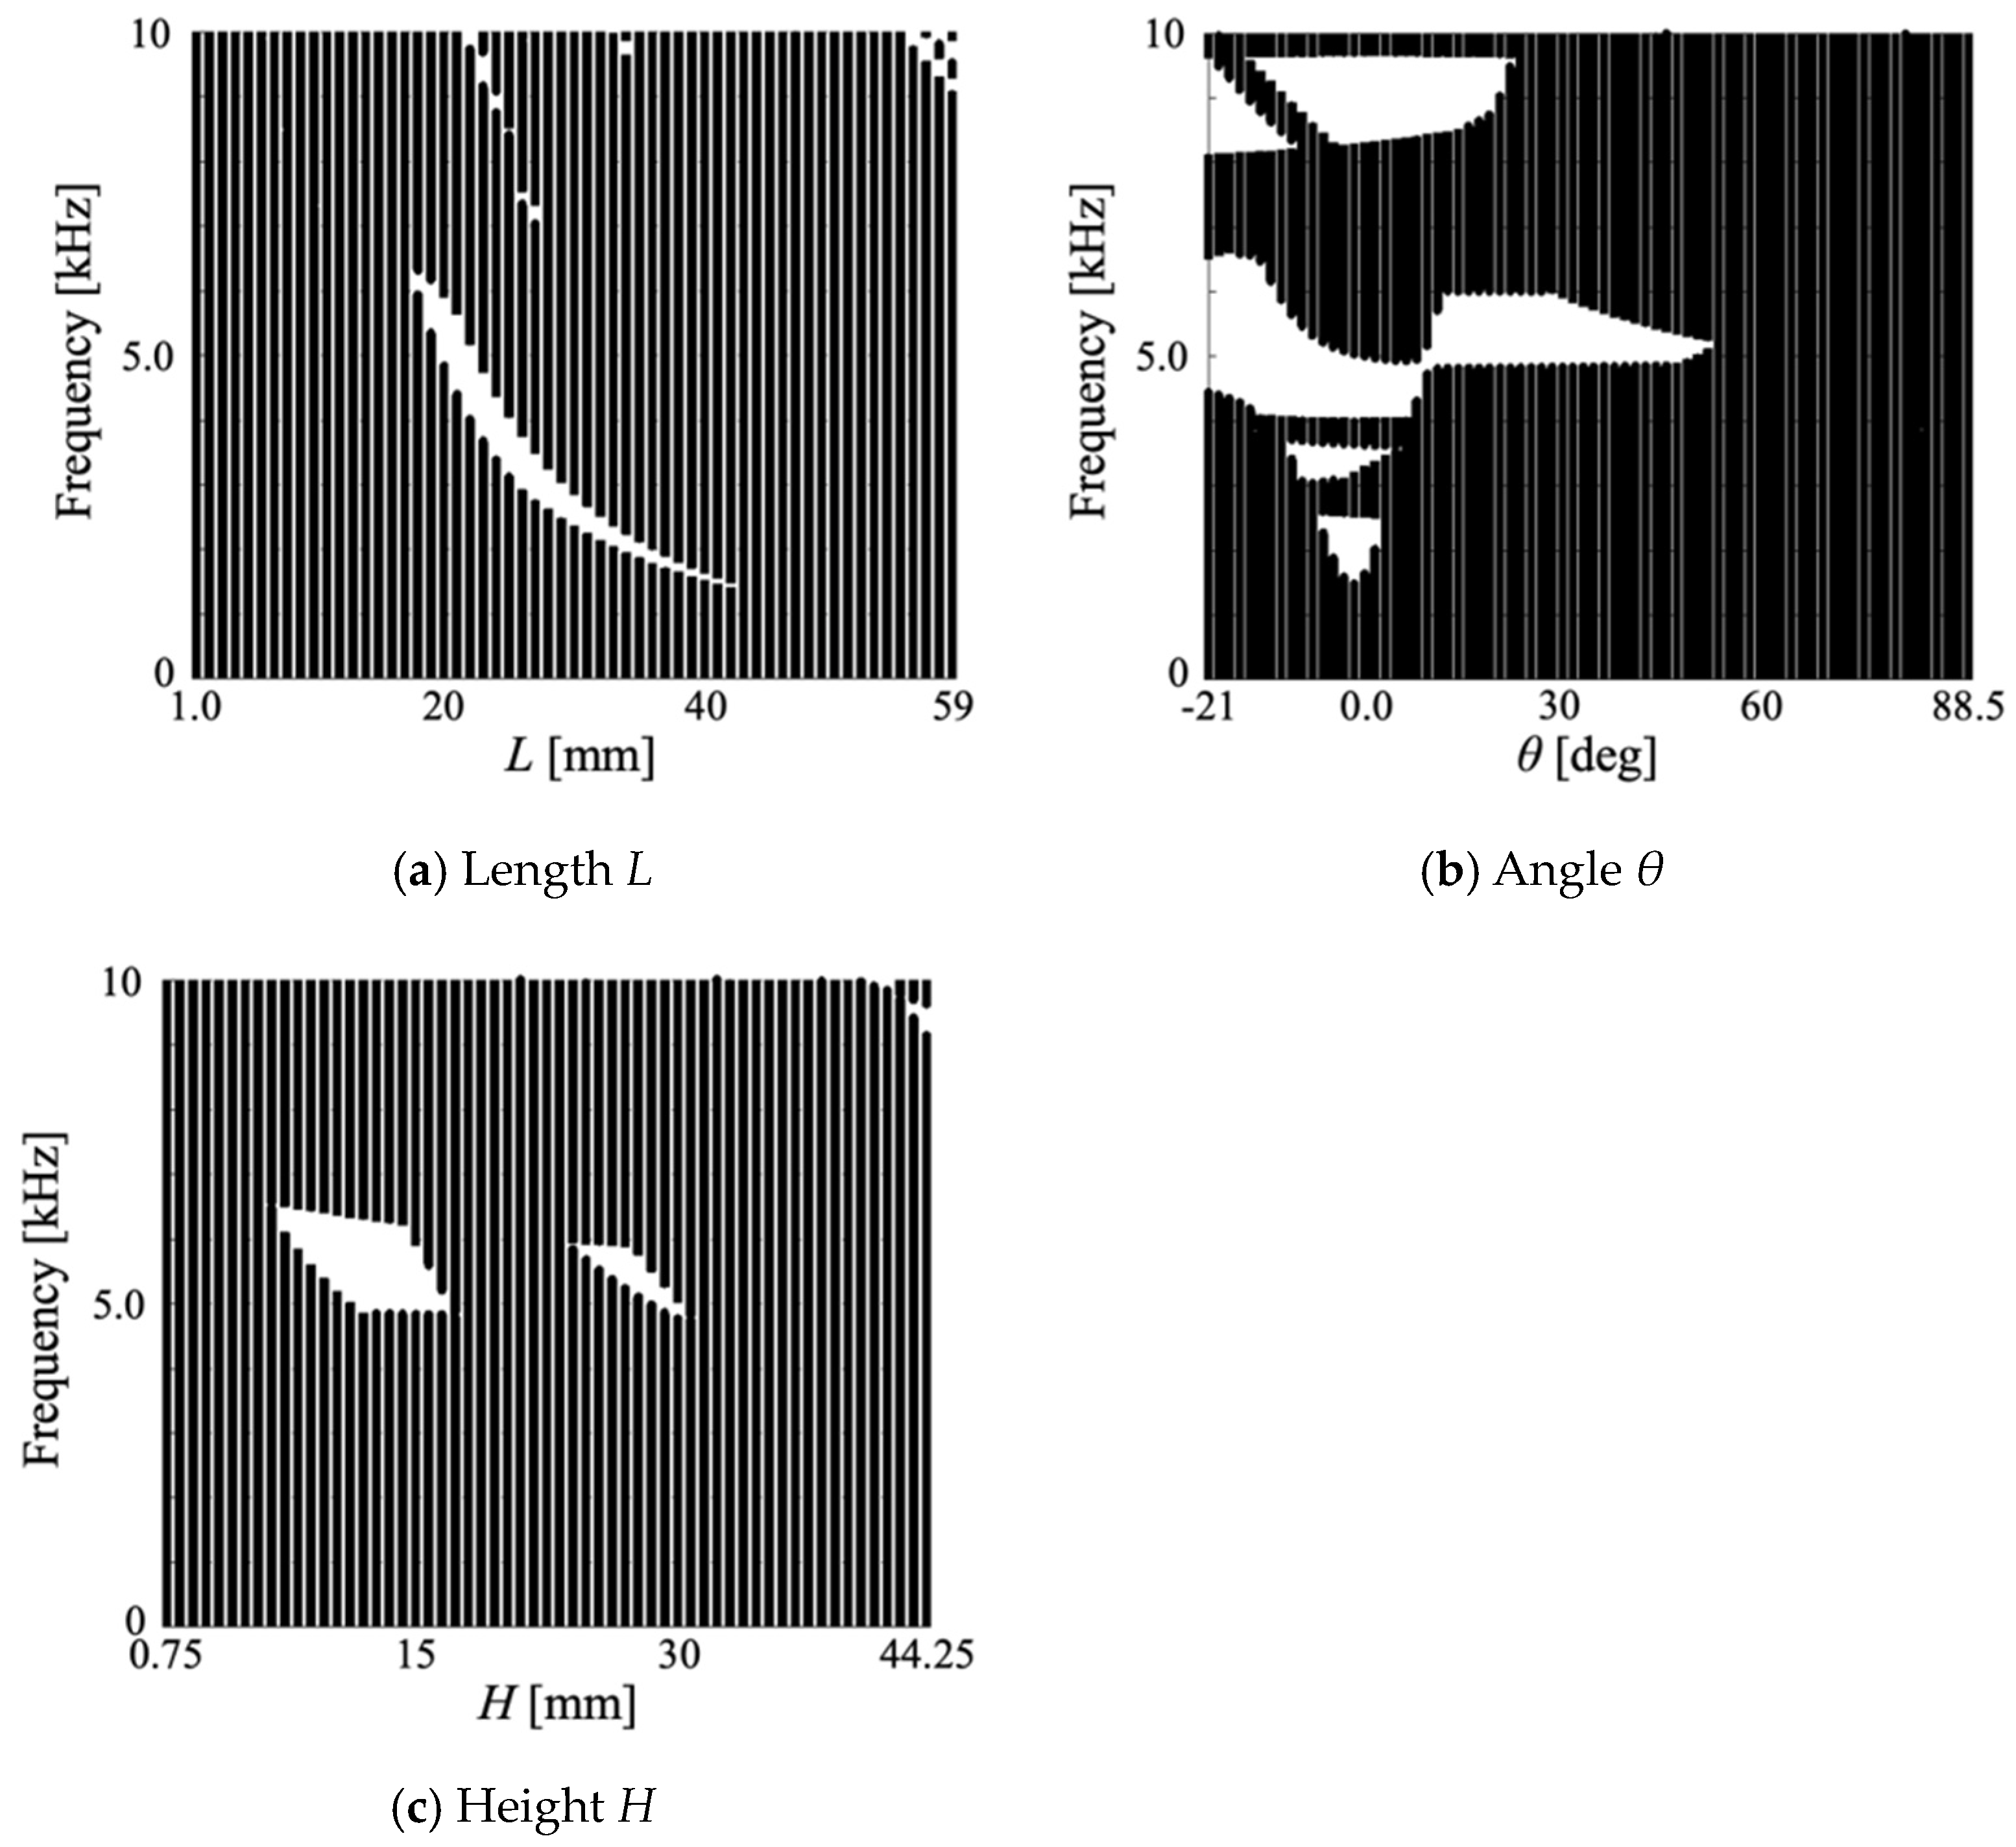
4.1. Influences of Geometric Parameters on Vibration Suppression with Lattice Structures
4.2. Design Approach for a Bandgap in a Specific Frequency Range
5. Conclusions
Author Contributions
Funding
Data Availability Statement
Conflicts of Interest
References
- Berger, J.B.; Wadley, H.N.G.; McMeeking, R.M. Mechanical Metamaterials at the Theoretical Limit of Isotropic Elastic Stiffness. Nature 2017, 543, 533–537. [Google Scholar] [CrossRef]
- Tsushima, N.; Higuchi, R. Stiffness and Strength Evaluation of Lattice-Based Mechanical Metamaterials by Decoupled Two-Scale Analysis. Mater. Today Commun. 2022, 31, 103598. [Google Scholar] [CrossRef]
- Tsushima, N.; Higuchi, R.; Yamamoto, K. Correlation Studies of Different Decoupled Two-Scale Simulations for Lattice Structures. Aerospace 2023, 10, 723. [Google Scholar] [CrossRef]
- Vasseur, J.O.; Deymier, P.A.; Djafari-Rouhani, B.; Pennec, Y.; Hladky-Hennion, A.C. Absolute Forbidden Bands and Waveguiding in Two-Dimensional Phononic Crystal Plates. Phys. Rev. B 2008, 77, 085415. [Google Scholar] [CrossRef]
- Lu, M.-H.; Feng, L.; Chen, Y.-F. Phononic Crystals and Acoustic Metamaterials. Mater. Today 2009, 12, 34–42. [Google Scholar] [CrossRef]
- Reichl, K.K.; Inman, D.J. Lumped Mass Model of a 1d Metastructure for Vibration Suppression with No Additional Mass. J. Sound Vib. 2017, 403, 75–89. [Google Scholar] [CrossRef]
- Bauer, J.; Meza, L.R.; Schaedler, T.A.; Schwaiger, R.; Zheng, X.; Valdevit, L. Nanolattices: An Emerging Class of Mechanical Metamaterials. Adv. Mater. 2017, 29, 1701850. [Google Scholar] [CrossRef]
- Fan, H.; Yang, L.; Tian, Y.; Wang, Z. Design of Metastructures with Quasi-Zero Dynamic Stiffness for Vibration Isolation. Compos. Struct. 2020, 243, 112244. [Google Scholar] [CrossRef]
- Augello, R.; Carrera, E. Nonlinear Dynamics and Band Gap Evolution of Thin-Walled Metamaterial-Like Structures. J. Sound Vib. 2024, 578, 118329. [Google Scholar] [CrossRef]
- Cai, C.; Zhou, J.; Wang, K.; Xu, D.; Wen, G. Metamaterial Plate with Compliant Quasi-Zero-Stiffness Resonators for Ultra-Low-Frequency Band Gap. J. Sound Vib. 2022, 540, 117297. [Google Scholar] [CrossRef]
- Li, N.; Bai, C.; Liu, M. Configuration-Controllable Porous Metamaterial and Its Bandgap Characteristics: Experimental and Numerical Analysis. J. Sound Vib. 2022, 535, 117107. [Google Scholar] [CrossRef]
- Yan, G.; Yao, S.; Li, Y. Propagation of Elastic Waves in Metamaterial Plates with Various Lattices for Low-Frequency Vibration Attenuation. J. Sound Vib. 2022, 536, 117140. [Google Scholar] [CrossRef]
- Darche, M.; Lopez-Caballero, F.; Tie, B. Modal Analysis of Waveguide for the Study of Frequency Bandgaps of a Bounded Periodic Medium. J. Sound Vib. 2024, 572, 118158. [Google Scholar] [CrossRef]
- Al Rifaie, M.; Abdulhadi, H.; Mian, A. Advances in Mechanical Metamaterials for Vibration Isolation: A Review. Adv. Mech. Eng. 2022, 14, 16878132221082872. [Google Scholar] [CrossRef]
- Essink, B.C.; Inman, D.J. Three-Dimensional Mechanical Metamaterial for Vibration Suppression; Springer International Publishing: Cham, Switzerland, 2020; pp. 43–48. [Google Scholar]
- Yasuda, H.; Yang, J. Tunable Frequency Band Structure of Origami-Based Mechanical Metamaterials. J. Int. Assoc. Shell Spat. 2017, 58, 287–294. [Google Scholar] [CrossRef]
- Saurabh, S.; Gupta, A.; Chowdhury, R. Impact of Parametric Variation to Achieve Extreme Mechanical Metamaterials through Topology Optimization. Compos. Struct. 2023, 326, 117611. [Google Scholar] [CrossRef]
- Andresen, S.; Bäger, A.; Hamm, C. Eigenfrequency Maximisation by Using Irregular Lattice Structures. J. Sound Vib. 2020, 465, 115027. [Google Scholar] [CrossRef]
- Baravelli, E.; Ruzzene, M. Internally Resonating Lattices for Bandgap Generation and Low-Frequency Vibration Control. J. Sound Vib. 2013, 332, 6562–6579. [Google Scholar] [CrossRef]
- Yin, S.; Rayess, N. Characterization of Polymer-Metal Foam Hybrids for Use in Vibration Dampening and Isolation. Proc. Mat. Sci. 2014, 4, 311–316. [Google Scholar] [CrossRef]
- Monkova, K.; Vasina, M.; Zaludek, M.; Monka, P.P.; Tkac, J. Mechanical Vibration Damping and Compression Properties of a Lattice Structure. Materials 2021, 14, 1502. [Google Scholar] [CrossRef]
- Syam, W.; Wu, J.; Zhao, B.; Maskery, I.; Leach, R. Design of Mechanically-Optimised Lattice Structures for Vibration Isolation. In Proceedings of the 17th International Conference of the European Society for Precision Engineering and Nanotechnology (EUSPEN 2017), Hannover, Germany, 29 May–2 June 2017; pp. 55–56. [Google Scholar]
- Hajhosseini, M. Analysis of Complete Vibration Bandgaps in a New Periodic Lattice Model Using the Differential Quadrature Method. J. Vib. Control 2020, 26, 1708–1720. [Google Scholar] [CrossRef]
- Magliacano, D.; Catapane, G.; Petrone, G.; Verdière, K.; Robin, O. Sound Transmission Properties of a Porous Meta-Material with Periodically Embedded Helmholtz Resonators. Mech. Adv. Mater. Struct. 2023, 1–9. [Google Scholar] [CrossRef]
- Poulton, C.G.; Movchan, A.B.; McPhedran, R.C.; Nicorovici, N.A.; Antipov, Y.A. Eigenvalue Problems for Doubly Periodic Elastic Structures and Phononic Band Gaps. Proc. R. Soc. Lond. Ser. A 2000, 456, 2543–2559. [Google Scholar] [CrossRef]
- Elmadih, W.; Chronopoulos, D.; Syam, W.P.; Maskery, I.; Meng, H.; Leach, R.K. Three-Dimensional Resonating Metamaterials for Low-Frequency Vibration Attenuation. Sci. Rep. 2019, 9, 11503. [Google Scholar] [CrossRef] [PubMed]
- Elmadih, W. Additively Manufactured Lattice Structures for Vibration Attenuation. Ph.D. Thesis, University of Nottingham, Nottingham, UK, 2019. [Google Scholar]
- Guo, J.C.; Li, J.R.; Wang, H.Y.; Dong, Z.Y.; Zhang, Z. High Strength Induced Wide Band Gap Formations in Additively Manufactured Cubic Metamaterial. Smart Mater. Struct. 2024, 33, 075019. [Google Scholar] [CrossRef]
- Liu, W.; Chen, J.-W.; Su, X.-Y. Local Resonance Phononic Band Gaps in Modified Two-Dimensional Lattice Materials. Acta Mech. Sin. 2012, 28, 659–669. [Google Scholar] [CrossRef]
- An, X.; Fan, H.; Zhang, C. Elastic Wave and Vibration Bandgaps in Planar Square Metamaterial-Based Lattice Structures. J. Sound Vib. 2020, 475, 115292. [Google Scholar] [CrossRef]
- Jiang, T.; Han, S.; Han, Q.; Li, C. Design and Optimization of the Dual-Functional Lattice-Origami Metamaterials. Compos. Struct. 2024, 327, 117670. [Google Scholar] [CrossRef]
- Rodriguez, J.; Thomas, J.; Renaud, J. Maximizing the Strength of Fused-Deposition ABS Plastic Parts. In Proceedings of the 10th Solid Freeform Fabrication Symposium (SFF), Austin, TX, USA, 9–11 August 1999; pp. 9–11. [Google Scholar]
- Adelnia, R.; Daneshmand, S.; Aghanajafi, S. Production of Wind Tunnel Testing Models with Use of Rapid Prototyping Methods. In Proceedings of the 6th WSEAS International Conference on Robotics, Control and Manufacturing Technology, Hangzhou, China, 16–18 April 2006. [Google Scholar]
- Cuan-Urquizo, E.; Barocio, E.; Tejada-Ortigoza, V.; Pipes, R.B.; Rodriguez, C.A.; Roman-Flores, A. Characterization of the Mechanical Properties of FFF Structures and Materials: A Review on the Experimental, Computational and Theoretical Approaches. Materials 2019, 12, 895. [Google Scholar] [CrossRef]
- Li, B.; Zhang, C.; Peng, F.; Wang, W.; Vogt, B.D.; Tan, K.T. 4d Printed Shape Memory Metamaterial for Vibration Bandgap Switching and Active Elastic-Wave Guiding. J. Mater. Chem. C 2021, 9, 1164–1173. [Google Scholar] [CrossRef]
- Singh, K.V.; Khan, F.; Veta, J.; Singh, A.K. Influence of Printing Orientation on the Dynamic Characteristics and Vibration Behavior of 3D Printed Structures. In Proceedings of the ASME 2017 International Design Engineering Technical Conferences and Computers and Information in Engineering Conference, Cleveland, OH, USA, 6–9 August 2017. [Google Scholar]
- Bin Azmi, M.S.; Ismail, R.; Hasan, R.; Alkahari, M.R.; Tokoroyama, T. Vibration Analysis of Fdm Printed Lattice Structure Bar. In Proceedings of the SAKURA Symposium on Mechanical Science and Engineering 2017, Nagoya, Japan, 12 September 2017. [Google Scholar]
- Budarapu, P.R.; Y B, S.S.; Natarajan, R. Design Concepts of an Aircraft Wing: Composite and Morphing Airfoil with Auxetic Structures. Front. Struct. Civ. Eng. 2016, 10, 394–408. [Google Scholar] [CrossRef]
- Soneda, K.; Tsushima, N.; Yokozeki, T.; Imamura, T. Aeroservoelastic Characteristics of a Corrugated Morphing Control Surface. Int. J. Aeronaut. Space Sci. 2022, 23, 723–733. [Google Scholar] [CrossRef]
- Tsushima, N.; Yokozeki, T.; Su, W.; Arizono, H. Geometrically Nonlinear Static Aeroelastic Analysis of Composite Morphing Wing with Corrugated Structures. Aerosp. Sci. Technol. 2019, 88, 244–257. [Google Scholar] [CrossRef]
- Airoldi, A.; Crespi, M.; Quaranti, G.; Sala, G. Design of a Morphing Airfoil with Composite Chiral Structure. J. Aircr. 2012, 49, 1008–1019. [Google Scholar] [CrossRef]
- Tsushima, N.; Su, W. Concurrent Active Piezoelectric Control and Energy Harvesting of Highly Flexible Multifunctional Wings. J. Aircr. 2016, 54, 724–736. [Google Scholar] [CrossRef]
- Tsushima, N.; Su, W. Flutter Suppression for Highly Flexible Wings Using Passive and Active Piezoelectric Effects. Aerosp. Sci. Technol. 2017, 65, 78–89. [Google Scholar] [CrossRef]
- Tsushima, N.; Su, W. A Study on Adaptive Vibration Control and Energy Conversion of Highly Flexible Multifunctional Wings. Aerosp. Sci. Technol. 2018, 79, 297–309. [Google Scholar] [CrossRef]
- Wang, R.; Shang, J.; Li, X.; Luo, Z.; Wu, W. Vibration and Damping Characteristics of 3D Printed Kagome Lattice with Viscoelastic Material Filling. Sci. Rep. 2018, 8, 9604. [Google Scholar] [CrossRef] [PubMed]
- Agnese, F.; Scarpa, F. Macro-Composites with Star-Shaped Inclusions for Vibration Damping in Wind Turbine Blades. Compos. Struct. 2014, 108, 978–986. [Google Scholar] [CrossRef]
- Brillouin, L. Wave Propagation in Periodic Structures: Electric Filters and Crystal Lattices; Dover Publications: Mineola, NY, USA, 1953; Volume 2. [Google Scholar]
- Phani, A.S.; Woodhouse, J.; Fleck, N.A. Wave Propagation in Two-Dimensional Periodic Lattices. J. Acoust. Soc. Am. 2006, 119, 1995–2005. [Google Scholar] [CrossRef]
- Mead, D.J. A General Theory of Harmonic Wave Propagation in Linear Periodic Systems with Multiple Coupling. J. Sound Vib. 1973, 27, 235–260. [Google Scholar] [CrossRef]
- Liu, X.N.; Hu, G.K.; Sun, C.T.; Huang, G.L. Wave Propagation Characterization and Design of Two-Dimensional Elastic Chiral Metacomposite. J. Sound Vib. 2011, 330, 2536–2553. [Google Scholar] [CrossRef]
- Li, H.; Hu, Y.; Huang, H.; Chen, J.; Zhao, M.; Li, B. Broadband Low-Frequency Vibration Attenuation in 3D Printed Composite Meta-Lattice Sandwich Structures. Compos. Part B-Eng. 2021, 215, 108772. [Google Scholar] [CrossRef]
- Kittel, C.; McEuen, P. Kittel’s Introduction to Solid State Physics; John Wiley & Sons: Hoboken, NJ, USA, 2018. [Google Scholar]
- Kittel, C. Introduction to Solid State Physics Eighth Edition; Wiley: Hoboken, NJ, USA, 2004. [Google Scholar]
- Marc® 2014 Volume A: Theory and User Information; MSC Software: Newport Beach, CA, USA, 2014.
- Tsushima, N.; Tamayama, M.; Arizono, H.; Makihara, K. Geometrically Nonlinear Aeroelastic Characteristics of Highly Flexible Wing Fabricated by Additive Manufacturing. Aerosp. Sci. Technol. 2021, 117, 106923. [Google Scholar] [CrossRef]
- Elmrabet, N.; Siegkas, P. Dimensional Considerations on the Mechanical Properties of 3D Printed Polymer Parts. Polym. Test. 2020, 90, 106656. [Google Scholar] [CrossRef]
- Comsol Multiphysics Reference Manual; COMSOL AB: Stockholm, Sweden, 2007.
- Olsson, R.H., III; El-Kady, I. Microfabricated Phononic Crystal Devices and Applications. Meas. Sci. Technol. 2009, 20, 13. [Google Scholar] [CrossRef]


| Property | Value |
|---|---|
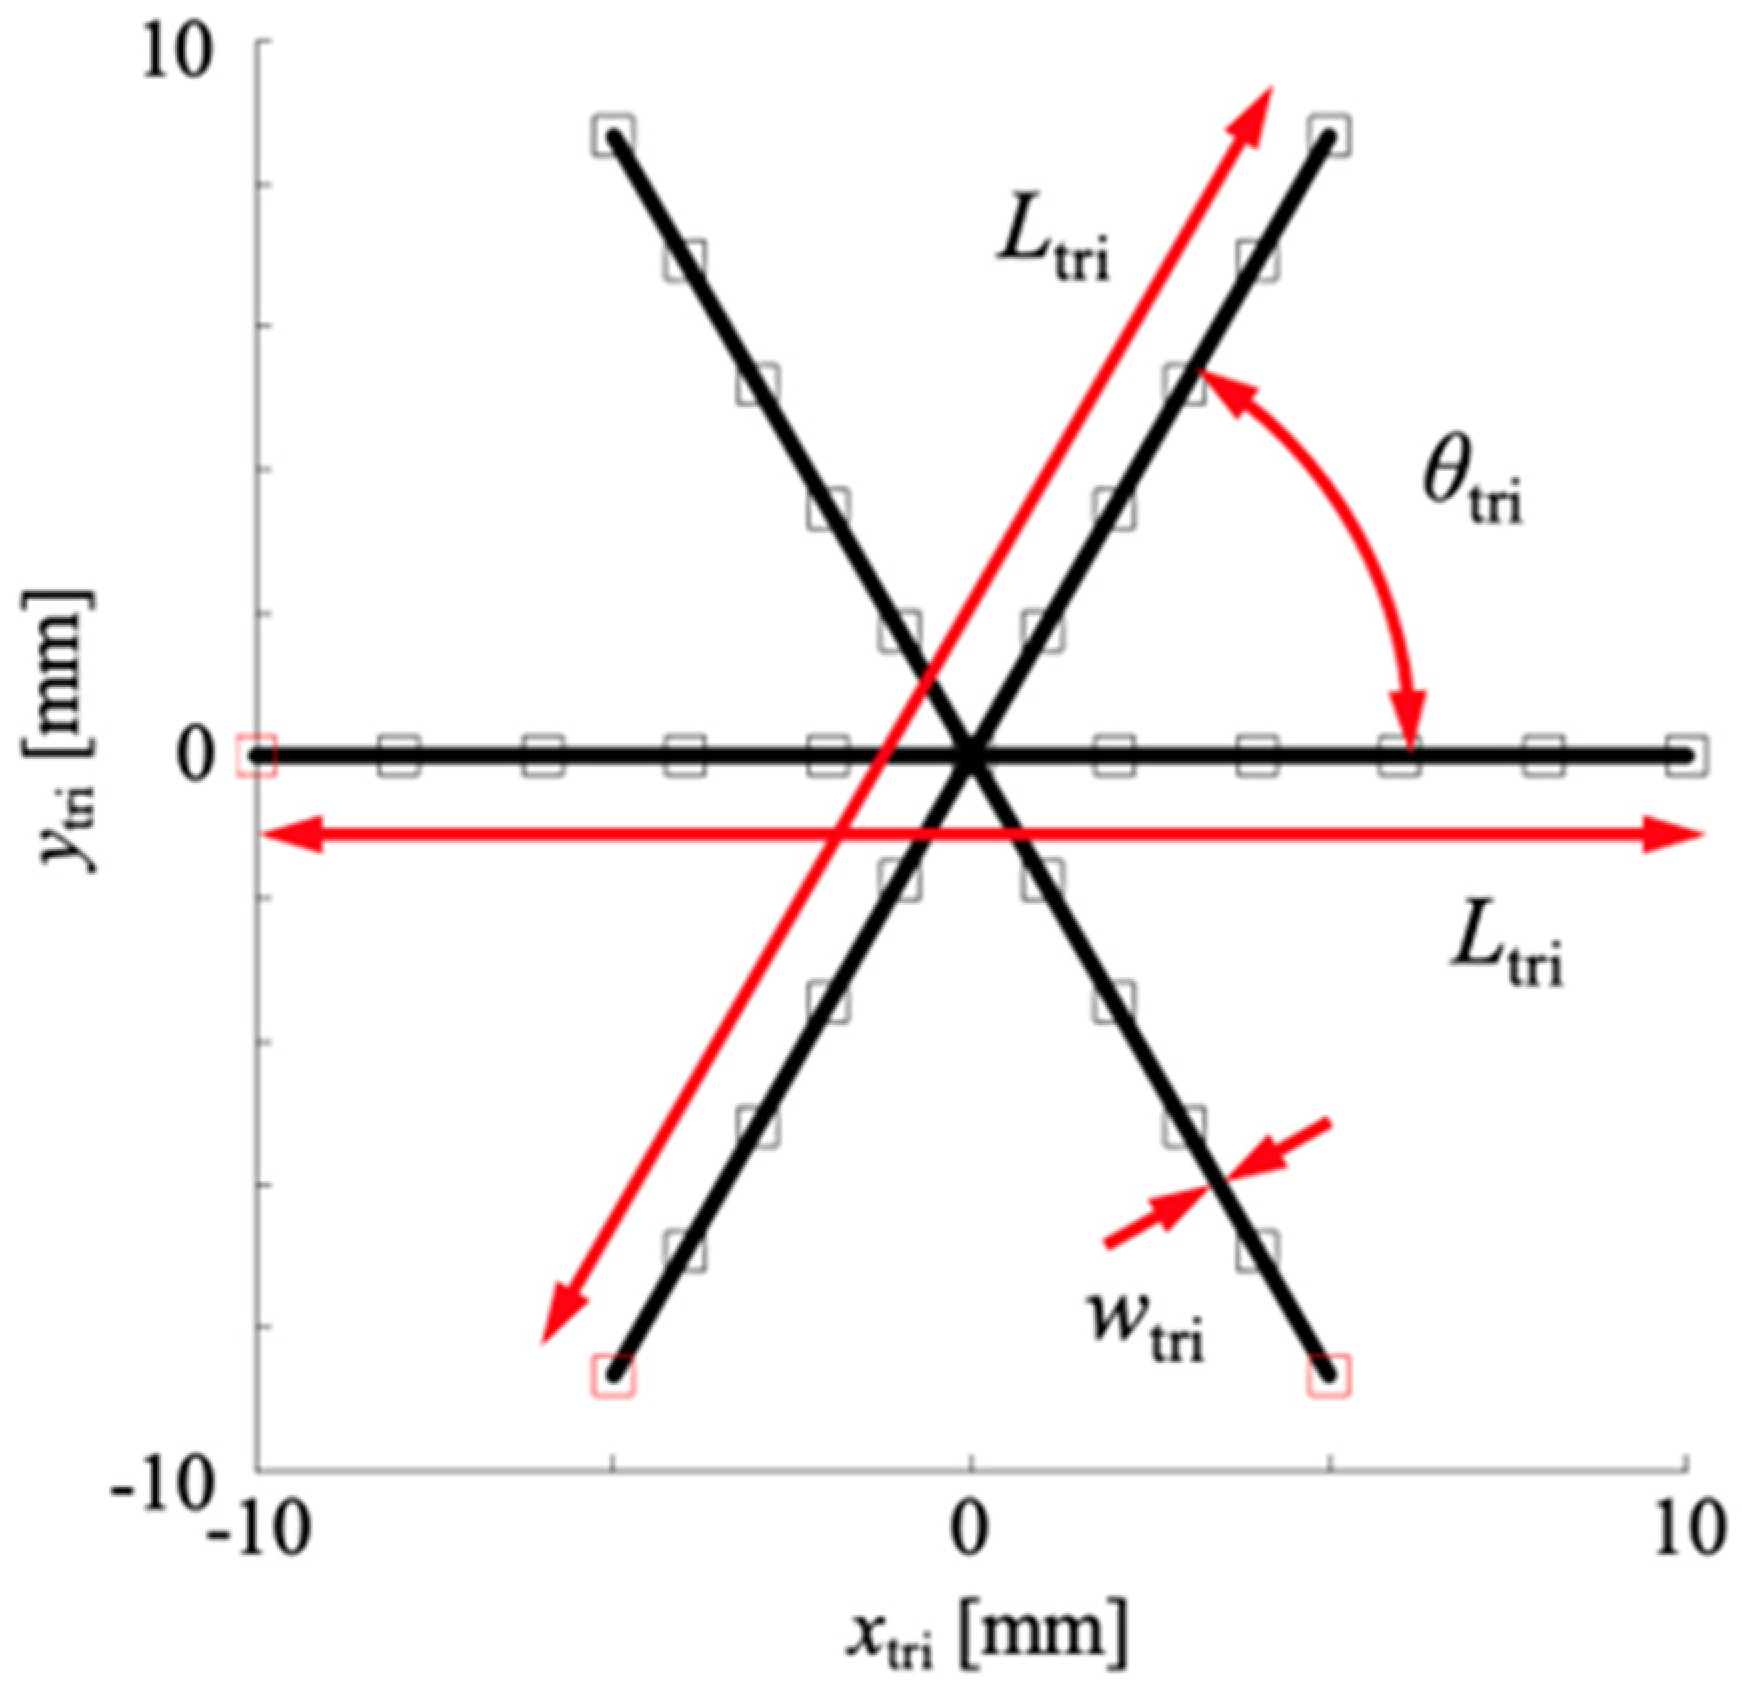
| Thickness, ttri, mm | 3.0 |
| Width, wtri, mm | 1.0 |
| Length, Ltri, mm | 20 |
| Angle, θtri, deg | 60 |
| Property | Value |
|---|---|
| Young’s modulus E, GPa | 2.944 |
| Poisson’s ratio ν | 0.2984 |
| Density ρ, kg/m3 | 1166.0 |
| Property | Triangular Lattice | Hexagonal Lattice |
|---|---|---|
| Beam thickness t, mm | 3.0 | 2.0 |
| Beam width w, mm | 1.0 | 1.2 |
| Beam length L, mm | 20 | 20 |
| Beam height H, mm | - | 15 |
| Beam angle θ, deg | 60 | 30 |
| Property | Triangular Lattice | Hexagonal Lattice |
|---|---|---|
| Beam length L, mm | 1.0–59 (1.0) | 1.0–59 (1.0) |
| Beam height H, mm | - | 0.75–44.25 (0.75) |
| Beam angle θ, deg | 3.0–177 (3.0) | −21–88.5 (1.5) |
Disclaimer/Publisher’s Note: The statements, opinions and data contained in all publications are solely those of the individual author(s) and contributor(s) and not of MDPI and/or the editor(s). MDPI and/or the editor(s) disclaim responsibility for any injury to people or property resulting from any ideas, methods, instructions or products referred to in the content. |
© 2024 by the authors. Licensee MDPI, Basel, Switzerland. This article is an open access article distributed under the terms and conditions of the Creative Commons Attribution (CC BY) license (https://creativecommons.org/licenses/by/4.0/).
Share and Cite
Tsushima, N.; Hayashi, Y.; Yokozeki, T. Dispersion Analysis of Plane Wave Propagation in Lattice-Based Mechanical Metamaterial for Vibration Suppression. Aerospace 2024, 11, 637. https://doi.org/10.3390/aerospace11080637
Tsushima N, Hayashi Y, Yokozeki T. Dispersion Analysis of Plane Wave Propagation in Lattice-Based Mechanical Metamaterial for Vibration Suppression. Aerospace. 2024; 11(8):637. https://doi.org/10.3390/aerospace11080637
Chicago/Turabian StyleTsushima, Natsuki, Yuta Hayashi, and Tomohiro Yokozeki. 2024. "Dispersion Analysis of Plane Wave Propagation in Lattice-Based Mechanical Metamaterial for Vibration Suppression" Aerospace 11, no. 8: 637. https://doi.org/10.3390/aerospace11080637
APA StyleTsushima, N., Hayashi, Y., & Yokozeki, T. (2024). Dispersion Analysis of Plane Wave Propagation in Lattice-Based Mechanical Metamaterial for Vibration Suppression. Aerospace, 11(8), 637. https://doi.org/10.3390/aerospace11080637