Abstract
The thrust reverser system stands as the critical component in contemporary large civil aviation, significantly impacting operational efficiency. Owing to their significant weight-reduction benefits, composite materials have emerged as a prominent trend in structural design in recent years. The aim of this research is to optimize the design of the thrust reverser cascade by replacing metal materials with composite materials and to propose a method for conducting mechanical tests on the cascade without a wind tunnel using a new loading scheme and a device that is simpler, more convenient, and less expensive. Focusing on a composite thrust reverser cascade with an inclined blade and beam, the structural and operational load characteristics of the cascade were analyzed and a finite element model incorporating progressive damage analysis was established. The progressive damage analyses of both the global and sub-model elucidated that initial structural degradation manifests near the mounting holes, with the matrix compression failure mode. In addition, a static test method was devised employing levers and hooks. Comparative analyses between test and numerical results demonstrate congruence. The research in this paper provides guidance for the design and testing of the composite thrust reverser cascade.
1. Introduction
The importance of the thrust reverser device as a component for an aeroengine cannot be overstated, especially in the current context of increasing aircraft speeds and extending landing roll distances. The thrust reverser device can shorten the aircraft’s landing distance, reduce the reliance on the brake system, extend the lifespan of brake components, and enhance the aircraft’s capability to manage emergencies, adverse weather conditions, and operations on short runways [1,2]. For the cascade thrust reverser, the cascade is the core component to change the airflow direction and generate reverse thrust. Thrust reverser cascades must meet stringent requirements for performance, weight, and reliability. These requirements span multiple disciplines, including aerodynamics, acoustics, and structural engineering. The parameters of the cascade are critical determinants of the overall performance of the thrust reverser device [3].
A light weight, long life, and high performance of aircraft in extended applications are increasingly demanded. Due to their enhanced mechanical properties and weight-reduction benefits, as well as sustainability factors [4], composite materials have taken the front seat in the aircraft industry as a better replacement for conventional metallic materials [5,6,7,8]. Compared to traditional thrust reverser structures employing materials such as magnesium, the adoption of composite materials in cascades offers a substantial reduction in the total weight, achieving reductions of 12% or more. Furthermore, the arrangement of continuous fibers along the direction of the maximum load significantly enhances the thrust reverser device’s overall structural strength, thereby enabling the cascade to achieve higher load capacities without necessitating modifications to its configuration. However, the application of composite materials also presents additional challenges for testing and analysis. According to previous studies, composite materials exhibit various damage modes, including fiber fragmentation, the splaying of lamina bundles, and wall buckling [9]. Therefore, numerical simulations should consider these failure modes correctly to ensure reliable results. Also, temperature has a great influence on the properties of composite materials [10], so the effect of temperature should be taken into account in the test.
Many scholars have conducted extensive work on the numerical analyses [11,12,13,14,15], loading system design [16,17,18], and test [19,20,21,22] of thrust reverser cascades, and have made some progress. However, numerical analyses have primarily focused on aerodynamic characteristics and optimization of the cascade, and most test methods are based on a wind tunnel. Studies on the mechanical behavior response and damage development of a thrust reverser cascade through static test and finite element analyses are relatively few. Butterfield et al. [23,24,25,26,27,28,29] have conducted several studies on the numerical analyses of the overall structure and mechanical properties of a thrust reverser cascade. The authors [25] established a method for structural analyses of the thrust reverser cascade, detailing the element types and load applications. The work illustrates the degree of idealization that can be applied to the structure while maintaining an acceptable level of accuracy. Structural models set up using beam, shell, and three-dimensional solid elements were in agreement for levels of displacement on the cascade vanes. Also, starting from a model for Bombardier Aerospace, aerodynamic and structural simulations were conducted using the methodologies established by Butterfield et al. [29]. By modifying the vane configurations, the weight was reduced by 5% and then 10%, while improving the structural performance; this result proved that the developed methodologies are applicable to future cascade designs. For detailed parts of the cascade, the failure behavior of a π-shaped laminated composite structure for a thrust reverser cascade was studied by Yang Jishen et al. [30]. A progressive damage model based on the three-dimensional Tsai–Wu failure criterion and a developed gradual degradation model was employed to simulate and assess the load-carrying capacity, the onset and propagation of damage, and the failure mechanisms. Disbonding was found to be the dominant damage mode for this structure under a bending load. Yang Huicheng et al. [31] reported that increasing the number of stiffeners proves to be more effective than increasing the thickness of the cascade in terms of reducing maximum stress and strain. Additionally, increasing both the number of stiffeners and the thickness of the cascade contributes to an enhancement in the first-order natural vibration frequency of the cascade.
The aim of this research is to establish a test method for composite thrust reverser cascades for various aerodynamic loads. Therefore, according to 14 CFR §25.933 for the reversing systems, the airplane is capable of continued safe flight and landing under any possible position of the thrust reverser; under this situation, the thrust reverser cascade needs to be able to withstand the normal structural loads, as well as those induced by failures and forced vibration when landing. Therefore, a landing condition was chosen for the study of this paper. Also, according to the AC20-107B for composite structures on aircrafts, potential failure modes and damage tolerance need to be taken into consideration.
A progressive damage model of the thrust reverser cascade under both an operational and an ultimate load is also employed. The results obtained are compared to experimentally measured results using the established method to prove the efficiency of the test method and to achieve further optimization of the composite thrust reverser cascade.
2. Composite Thrust Reverser Cascade Structure
Thrust reverser cascades are positioned on the outer bypass duct of the engine in a segmented structure along the annulus. To decelerate the aircraft, the cold air flow in the outer bypass duct is deflected forward at an angle greater than 90°, generating a reverse thrust opposite to the direction of engine. Aerodynamic loads on cascades are transmitted through the cascades’ stiffeners to the mounting edges, and then to the outer bypass duct’s wall panel through bolts. Shown in Figure 1a is an example of cascade placement around the nacelle; the thrust reverse system of a single engine consists of six cascades on each side, with slightly different shapes depending on their positions.
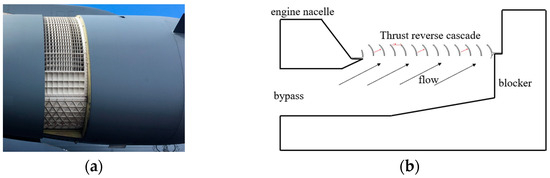
Figure 1.
Cascade placement on the nacelle: (a) example of cascade placement around the nacelle [3]; (b) cross section of a single cascade.
The object of this research is a single thrust reverser cascade component of the whole thrust reverse system. This cascade is designed for large transport aircrafts such as C17, Y20, C919, etc. The geometric model of the cascade is shown in Figure 2a, where S1 to S6 stand for stiffener numbers 1 to 6 and H1 to H8 for hole 1 to hole 8. The cascade is redesigned using carbon fiber composite without changing its configuration. The new structure comprises 10 longitudinally arranged vanes, five transversely arranged reinforcement stiffeners, and surrounding frames. The vanes deflect the airflow passing through the outer bypass duct, primarily influencing the performance of the cascade. The stiffeners reinforce the cascade and help divert airflow within the inclined cascade configuration. Additionally, mounting edges on both the left and right sides are responsible for fastening the cascade to the outer bypass duct of the engine. Each mounting edge has four holes for bolting to secure the cascade to the outer bypass duct. Figure 2b presents a schematic diagram illustrating the connection between the vane and the stiffeners. The vane and the flange are fabricated using a composite material layup process and are then bonded to the stiffeners.
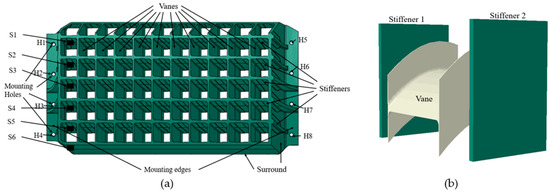
Figure 2.
Structural model of composite thrust reverser cascade: (a) whole structural model; (b) details of vane and stiffeners connection.
The composite thrust reverser cascade studied in this paper is formed by an epoxy resin reinforced with carbon fibers, utilizing two different materials: T300 carbon fiber composite laminate and composite woven material, with different layups at various positions. The material parameters of these two materials are detailed in Table 1 and Table 2. The layup angle proportions of different areas are also provided in Table 3. The thrust reverser cascade was manufactured using a hand layup method with prepreg materials, followed by autoclave curing.

Table 1.
Properties of T300 composite laminate.
Table 2.
Properties of composite woven material.
Table 3.
Layup angle proportions of different areas.
3. Finite Element Modeling of Composite Thrust Reverser Cascade
3.1. Structure and Mesh Modeling
To compare and verify the experimental results, the finite element calculation results of the thrust reverser cascade are needed. However, the structural complexity of the composite cascade necessitates a simplified approach to modeling due to the potential computational challenges associated with using solid models, including excessive computational workload and prolonged processing times. Therefore, it is imperative to simplify the model while ensuring the accuracy of the computational results.
It is noticed that the aspect ratio (length/width and length/depth) of the vanes and stiffeners makes the cascade structure well-suited for analysis using shell elements. Moreover, previous studies [29] have indicated that the use of a shell model for analyzing cascades has little impact on the accuracy of the analytical results. The authors set up structural models of a thrust reverser cascade using beam, shell, and three-dimensional elements. Their results indicated that displacement and stress levels of these three models showed a reasonable agreement. The maximum displacement deviation among the three models is within a range of 4%. Additionally, the stress levels obtained from shell elements and solid elements are generally consistent, with a maximum deviation in blade stress of 2.6%. However, there is a significant difference in the total degrees of freedom among different element models. Utilizing shell elements for calculations can greatly reduce the computational time.
The shell geometry was constructed by first identifying the centerline of each vane section. The centerline is determined by a series of horizontal, trimmed profile lines that traverse the height range of each vane section, as shown in Figure 3. Since vane parts have a relatively uniform thickness on most of their cross-sections, the geometric representation of each vane can be completed by adding thickness as a geometric attribute. The same simplification approach is applied to other parts of the cascade, thereby transforming the structure from a solid model to a shell model. Abaqus (2020) is used for modeling and meshing. After modeling and assigning material parameters to each part, the structure is meshed using a four-node, quadrilateral, shell element with reduced integration and a large-strain formulation (S4R). The mesh sensitivity of this model is also included, as seen in Figure 4a; the X-axis represents the number of elements in the model, while the Y-axis represents the maximum stress of the model under an operational load. According to the simulation results, the mesh size is considered to be converged when the elements number near 60,000. Therefore, for the accuracy of the model, 70,470 elements and 73,358 nodes were used, as shown in Figure 4b.
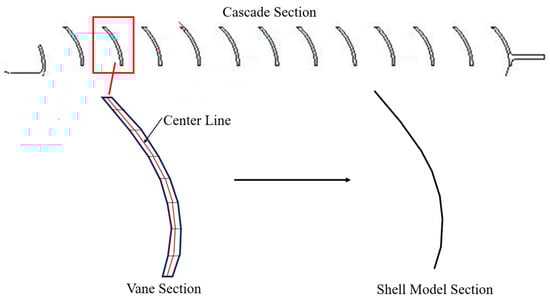
Figure 3.
Centerline used to establish shell model.
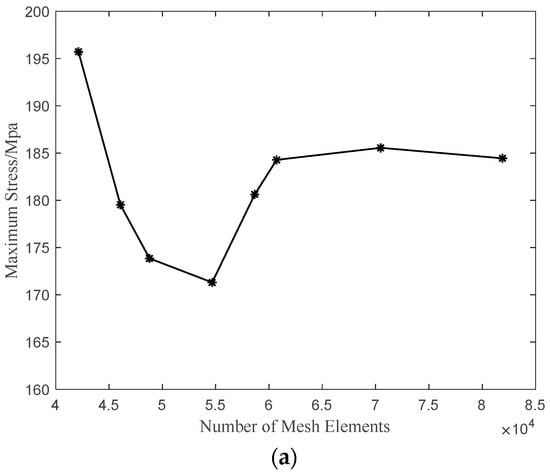
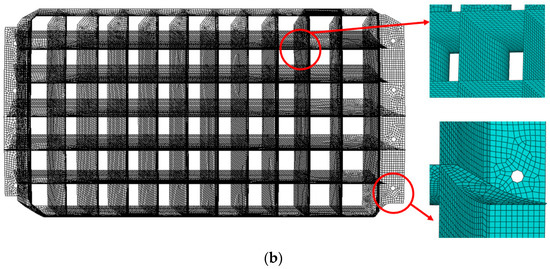
Figure 4.
Meshed model of composite thrust reverser cascade: (a) mesh sensitivity study; (b) meshed model and focus to local area.
Although the shell model computes the overall mechanical performance and in-plane damage of the cascade, it fails to accurately simulate delamination damage and damage in specific planes. To address this limitation, a sub-modeling approach can be employed. Sub-models are constructed for specific regions such as the mounting holes, using the computation results from the corresponding positions in the global model as boundary conditions. This modeling method can simplify the calculations while maintaining the result accuracy.
3.2. Boundary Conditions and Loads Simplification
The method to secure the cascade within the aeroengine involves using bolts to fasten the eight mounting holes on both sides of the mounting edge, thereby fastening the cascade inside the engine nacelle. Consequently, in the finite element model, each of the eight mounting holes is coupled with a corresponding reference point located at its center. These reference points are then fixed to simulate the actual boundary conditions of the cascade.
This study examines the operational state of the thrust reverser cascade during a standard landing of an aircraft at a speed of 0.2 Mach. At this time, the working environment of the thrust reverser cascade is 60 °C, which differs from the experimental ambient temperature of 23 °C. According to previous studies, temperature has a great influence on the properties of the composites [10]. To ensure that the experimental results meet the requirements of the operational environment, it is necessary to apply an environmental correction factor to the load under working conditions. Based on the comparison of material properties tested at the operational temperature of 60 °C and the test temperature of 23 °C, the maximum reduction ratio of the material performance in tension, compression, and shear is taken as the environmental correction factor for the load, which is 1.24.
Therefore, the operational load of thrust reverser cascade is defined as an aerodynamic load at the speed of 0.2 Mach multiplied by the environmental correction factor of 1.24.
The loads acting on the reverse thrust cascade came from aerodynamic calculations conducted on the cascade during operational conditions, which are given by aerodynamic load points on both the pressure side and the suction side. For simplification, the loads on both sides are summed, and the load condition of each grid is represented by applying the resultant force on the pressure side. Given the similarity in the magnitude and direction of aerodynamic loads across the same grid, it is reasonable to assume a uniform distribution of loads within each vane and stiffener grid. Therefore, the aerodynamic loads on the cascade were simplified to obtain the uniform normal loads applied on the pressure side surface of each vane and stiffener grid, as shown in Figure 5. The uniform normal loads were applied to the finite element model. Figure 6 illustrates the boundary conditions and loads on the finite element model.
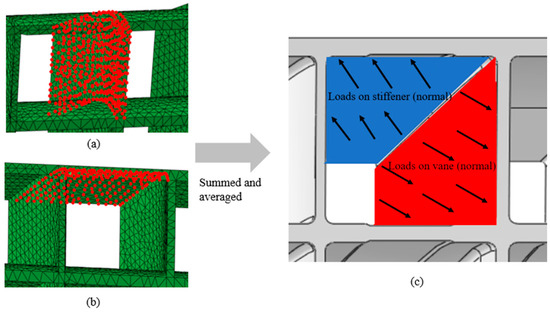
Figure 5.
Loads simplification process of one grid: (a) aerodynamic load points on vane; (b) aerodynamic load points on stiffener; (c) equivalent load.
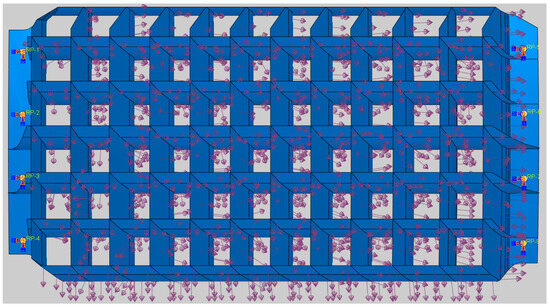
Figure 6.
Boundary conditions and loads of composite thrust reverser cascade.
3.3. Constitutive Model
Progressive damage modeling in composite materials is a crucial aspect of structural analysis and design, and includes three components: stress analysis, failure examination, and the characterization of material degradation in the failed area. The first component, stress analysis, is performed automatically using the finite element calculation program. The second stage failure examination is implemented using the Hashin failure criteria in this paper. The Hashin failure criteria [32,33] were used for the initiation of four different in-plane failure modes in each ply, including fiber tension and compression damage, matrix tension, and compression damage. As shown in Equations (1)–(4), damage occurs when either criterion reaches 1.
Fiber tension:
Following the onset of failure, the third component of the progressive damage, material degradation, begins. The mechanical properties of the affected areas experience degradation under subsequent loading. The stiffness matrix of the failed material is updated using the formula below.
The stiffness coefficient, , is expressed using the following formula:
Supposing linear damage evolution, the growth of each independent damage variable, and , associated with each failure mode was defined by the equivalent displacements.
Here, the equivalent displacement of the fully damaged ply, , can be defined using the following formula:
where is the equivalent stress at the initial point of damage and represents the critical energy release rate for failure mode one.
However, the equivalent displacement, , is different in different failure modes, as shown in Equations (10)–(13).
Fiber tension:
In conclusion, the schematic representation of the material’s constitutive model is illustrated in Figure 7; the fully damaged equivalent displacement, ; the initial equivalent displacement damage, ; and the initial stress damage, are also shown on this figure.
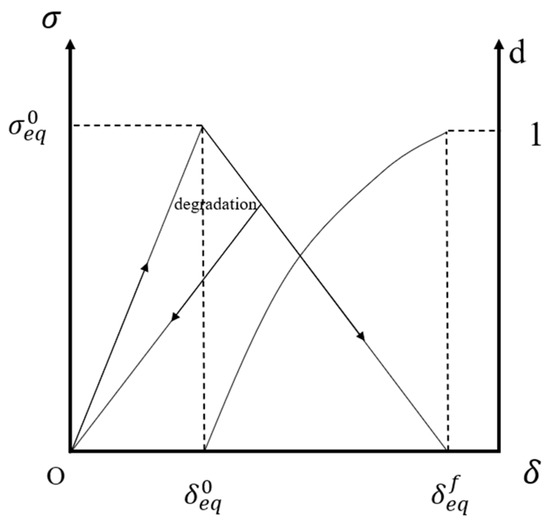
Figure 7.
Constitutive model.
In this section, only the three-dimensional form of the failure criteria and material degradation is presented for clarity and simplification. The three-dimensional progressive damage model is employed to conduct the progressive damage analyses of the solid models. For the two-dimensional shell model calculation, a simplified two-dimensional failure criterion and linear stiffness degradation is used by taking all values involving the third direction to be 0.
In this paper, the progressive damage modeling is performed using user defined material (UMAT) of the Abaqus (2020) commercial FE package, encompassing the three primary components.
4. Numerical Results of Composite Thrust Reverser Cascade
4.1. Operational Condition Results
For comparison and validation against the experimental results, it is imperative to perform finite element simulation to assess the performance of the composite thrust reverser cascade under the operational loads. Figure 8 shows the contours of stress and displacement for static structure analyses under operational loads.
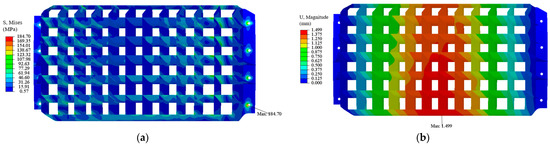
Figure 8.
Contour of the cascade under operational load: (a) contour of stress; (b) contour of displacement.
The stress and strain values on both sides of the mounting edge areas of the thrust reverser cascade are notably high, with concentrations observed near the eight mounting holes. Significant stress values are also observed at the interface between stiffeners and vanes. The maximum stress value of 184.7 MPa is situated near mounting hole H8. Regarding displacement, the cascade exhibits an increasing trend laterally from the mounting edges towards the cascade’s center and longitudinally from top to bottom, with the maximum displacement of 1.499 mm located at the center of the lower frame. These results suggest that the mounting edges are the most vulnerable areas, potentially susceptible to failure and warranting focused attention during simulation and experimental analyses.
Considering the loads on the mounting holes, as seen in Figure 9, the horizontal axis gives the mounting hole positions and the vertical axis gives the load on each mounting hole divided by total load. The maximum load value is observed at mounting hole H4, and the load on the left-side mounting edge (from H1 to H4) is greater than that on the right-side mounting edge (from H5 to H8).
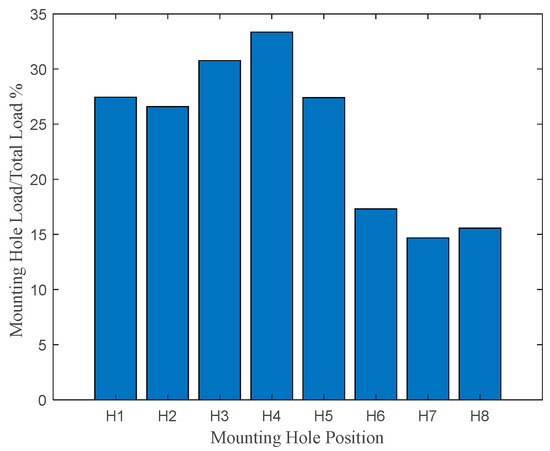
Figure 9.
Loads on mounting holes.
To further understand the load transfer paths on the thrust reverser’s cascade, it is necessary to analyze the distribution of loads. The contribution of stiffeners and the surrounding structure to the load transfer is analyzed by extracting the loads near the endpoints of the load transfer on the stiffeners and surrounding structure, specifically, the loads near the left mounting edge, as shown at the positions S1 to S6 in Figure 2. It should be noted that, given the negligible role played by the upper surround in the load transfer—comprising less than 2% of the total load—it may be disregarded. As shown in Figure 10, the load magnitudes at each location are depicted accordingly, the horizontal axis gives stiffeners 1 to 6, and the vertical axis gives the load on each stiffener divided by total load. The load magnitudes on the surround are observed to be smaller than those on the stiffeners. On the stiffeners, there is a noticeable increasing trend from the top to the bottom, specifically, from S1 to S6.
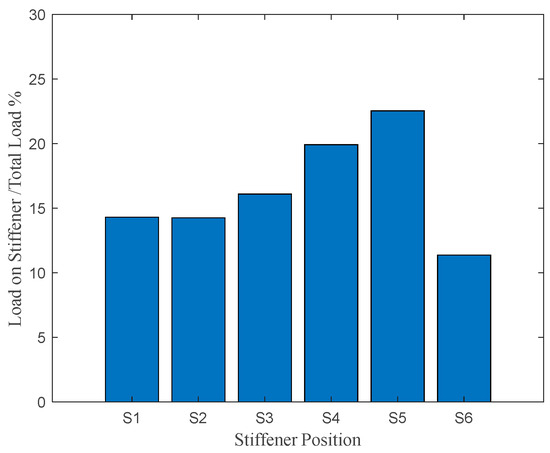
Figure 10.
Load distribution on stiffeners and surround.
4.2. Ultimate Load Condition Results
4.2.1. Global Model Results
As shown in Figure 11, the structure exhibits linear elasticity until reaching 3.01 times the operational load (point A in Figure 11a), during which the load monotonically increases. At 3.01 times the operational load, damage initiates, causing noticeable load fluctuations. However, after initial failure, stress redistribution from damaged areas mitigates the impact on overall load-bearing capacity. Although there is a slight decrease in stiffness, the overall load-bearing capacity remains largely unaffected, and the total load continues to increase. It is only when the total load reaches 4.10 times the operational load (point B in Figure 11a) that extensive damage occurs, resulting in a notable decrease in the total load, which is much higher than the required safety coefficient.
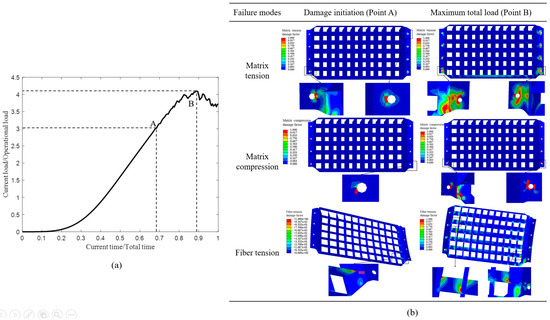
Figure 11.
Global model numerical results under ultimate load: (a) total load curve; (b) damage variables of different failure modes.
As demonstrated in Figure 11b, the status of the tension and compression damage variables for fiber and the matrix damage variables for the structure at damage initiation and at the point of maximum total load are shown. During the loading process, fiber tensile damage, matrix tensile damage, and matrix compressive damage were observed on the cascade, while no fiber compressive damage was observed. The earliest and most severe type of damage was matrix tensile damage, initially manifesting near mounting holes H4 and H5 on both sides of the mounting edge and propagating along the hole perimeters. Matrix compressive damage first appeared near mounting hole H8, similar to matrix tensile damage, predominantly occurring along the hole perimeters and partially distributed at the interfaces between the vanes and the frames. Fiber tensile damage was initially observed at the interfaces between the vanes and the stiffeners, extending along these interfaces.
4.2.2. Sub-Model of the Mounting Hole
The damage initiation around the mounting hole was analyzed using a sub-model. Taking mounting hole H5 as an example, the load-displacement curve for this region is illustrated in Figure 12a. After contact stabilizes, the load increases linearly with the displacement until point A, where damage initiation occurs, corresponding to point A in Figure 11a. Between points A and B, damage propagation leads to stress redistribution and load fluctuation. Beyond point B, the damage zone expands rapidly, resulting in a loss of load-bearing capacity in the mounting hole.
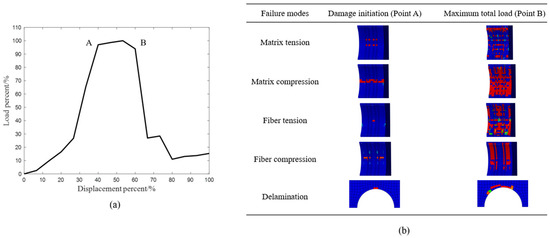
Figure 12.
Numerical results of the mounting hole: (a) load-displacement curve of the mounting hole; (b) damage variables of mounting hole.
The damage mode within this region is primarily dominated by in-plane damage. Figure 12b demonstrates the status of the tension and compression damage variables for the fiber and matrix damage variables for the sub-model at damage initiation and at the point of maximum total load. Fiber damage predominantly occurs in the epoxy resin woven layers, where both tensile and compressive failures of the fibers are first observed. Conversely, matrix tensile damage is primarily localized within the T300 laminate layers. Delamination damage is observed alongside the mounting hole and is mainly associated with the onset of in-plane damage.
5. Composite Thrust Reverser Cascade Test Scheme Design
5.1. Load Simplification and Load Scheme Design
Experimental investigations on the thrust reverser cascade have traditionally been conducted within wind tunnel environments. However, wind tunnel tests require stringent environmental conditions and incur relatively high costs. Furthermore, they pose challenges in analyzing damage patterns, stress–strain relationships, and other factors associated with the cascade under extreme loading conditions. Hence, there is a pressing need to develop a method for static testing of the cascade. Such a method should effectively analyze its maximum load capacity and potential damage scenarios while mitigating testing expenses.
In designing the test method, it is crucial to account for the load distribution on the thrust reverser cascade. As outlined in Section 3.2, the aerodynamic loads on the cascade can be simplified as varying uniform loads applied to each cascade vane and stiffener, as seen in Figure 5c. Consequently, the test fixture must be capable of independently applying different loads to each vane and stiffener.
The most straightforward loading method involves using a separate servo motor for each vane and stiffener to apply loads corresponding to the actual operating conditions, with varying magnitudes and directions. However, implementing this method in the design of the test fixture is highly challenging. It requires individualized loading designs for each cascade vane and stiffener, significantly increasing the complexity of the test fixture and rendering the testing process less feasible. Also, multi-channel simultaneous loading will bring many more problems such as load asynchronism, mutual interference, and so on. Therefore, alternative methods that may combine the loads need to be considered.
For a simpler loading method, further analysis of the load characteristics on the cascade is necessary. Figure 13 illustrates the angles between the resultant load directions on various vanes and stiffeners and the XYZ coordinate axes; the angle definitions are given in Figure 13a. It can be observed that the resultant load directions on both the blades and the reinforcing ribs cluster around a relatively consistent angle, with only minor variations. Therefore, it can be approximated that the load directions on the thrust reverser cascade are uniform, significantly simplifying the loading method.
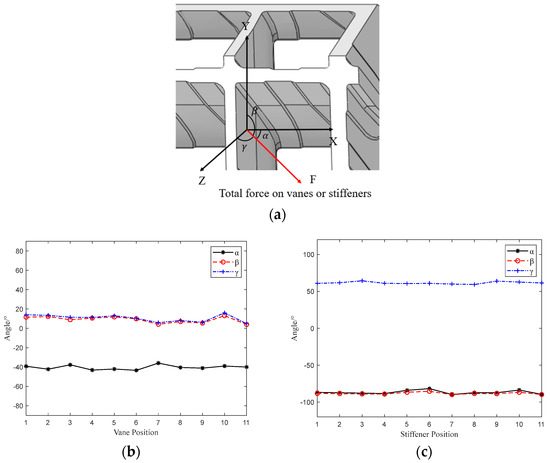
Figure 13.
Resultant load angle on vanes and stiffeners: (a) angle definitions (b) resultant load angle on vanes; (c) resultant load angle on stiffeners.
Assuming the same direction of resultant load, a lever hook system can be applied to the loading of the thrust reverser cascade. This loading method offers advantages such as simplicity in design, ease of implementation, and accurate load transmission. The system utilizes hooks and loading blocks to individually load each vane and stiffener. The loads from each hook are then aggregated using a lever system. For a row of cascade vanes, two separate lever systems apply the total load on vanes and stiffeners to the cascade from two distinct directions. The total load is distributed to the hooks in a stepwise manner through the levers.
However, during the actual loading process, the small dimensions of the cascade grids present significant design challenges if two hook spacers are required within a single grid. This configuration would severely limit the design of the hooks and cause interference between the lever systems used for loading vanes and the stiffeners. Additionally, having two independent loading systems may lead to synchronization and coordination problems.
To address these challenges, further simplification is necessary beyond the initial design. The proposed solution, as illustrated in Figure 14, utilizes a single hook and loading block to simultaneously load both the vane and the stiffener. The loading block features two surfaces that contact both the vane and the stiffener surfaces of the thrust reverser cascade, with the backside connected to the hook. Due to the varying shapes of the cascade grid and the differing ratios between the load magnitudes of vanes and stiffeners at different grids, it is essential to design loading blocks of different shapes tailored to their specific positions. This ensures compatibility with the varying geometries and load ratios of the cascade grids, as depicted in Figure 14a. A representation of the hook and loading block after being connected with the cascade is provided in Figure 14c.
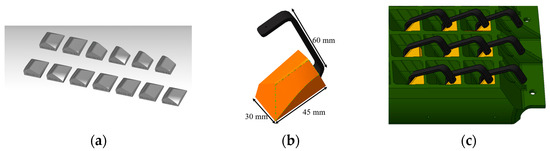
Figure 14.
Hook and loading block design: (a) loading blocks; (b) hook and loading block; (c) hooks and blocks connected to cascade.
After the design of the hook and loading block, for each row of the cascade, the loads from each hook and loading block are then aggregated using an adjustable lever system, as seen in Figure 15. The lever system can divide the total load on the row into 11 parts to ensure that the load distribution on the cascade is consistent with the aerodynamic conditions. Subsequently, the six lever systems corresponding to the six transverse rows of grids on the thrust reverser cascade are aggregated using a similar lever system. The schematic diagram of the load distribution lever is illustrated in Figure 16. In conclusion, the load on every grid is summed to a single resultant force point. Using the lever system, we can closely approximate the load distribution experienced by the cascade under operational conditions by applying the load at this single point.
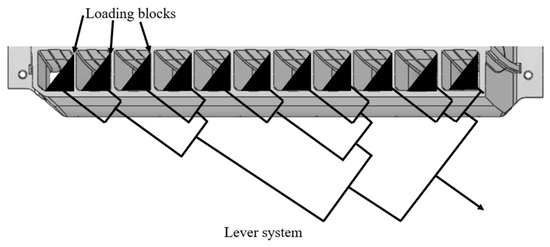
Figure 15.
Schematic diagram for lever system on each row.
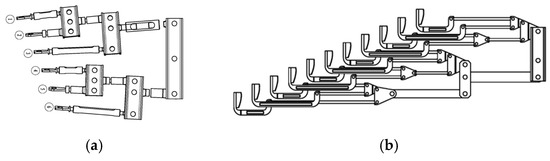
Figure 16.
Loading lever system: (a) lever system for aggregation; (b) lever system on each row.
It is important to note that the ratio of each lever stage is adjustable, facilitating the application of varying load magnitudes to different cascade vane and stiffener areas. This design, which allows for adjustable load ratios, ensures that the loading lever system can accommodate a wide range of load distributions and different shapes of thrust reverser cascades.
5.2. Fixture Design
To accommodate loading using the lever system discussed above, it is essential to design fixtures for the thrust reverser cascade that adjust the direction of the total load to be vertically oriented and upward. Consequently, based on the prior analysis of the total load direction, the experimental fixture tilt angle is determined to ensure the vertical orientation of the total load on the cascade. The design of the cascade fixture is shown in Figure 17. To address the constraints, a curved surface corresponding to the curvature of the mounting edge of the cascade is incorporated. The cascade is secured using four bolts on each side of the mounting edge, simulating the mounting configuration typically found in the engine nacelle.
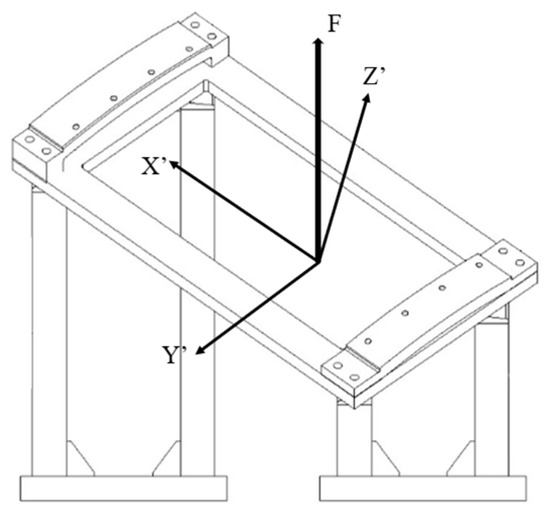
Figure 17.
Thrust reverser cascade fixture.
5.3. Summary
As demonstrated in previous chapters, a hydraulic actuator is then connected to the upper part of the loading system for load application. The photo of the loading system configuration for the thrust reverser cascade during experimentation can be seen in Figure 18. The magnitude of strain at various locations is measured by strain gauges. This test device is very practical and less expensive.
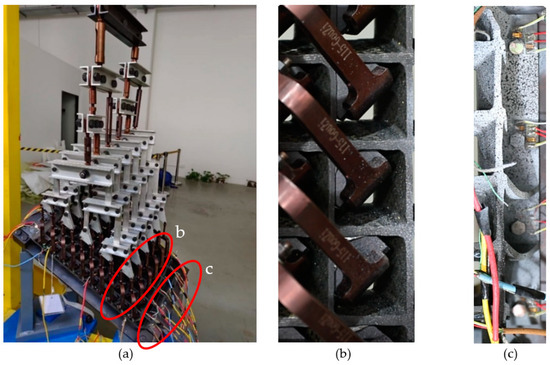
Figure 18.
Photo of thrust reverser cascade loading system: (a) loading system; (b) details of hooks and loading blocks; (c) details of fastening.
6. Test Results and Discussion
6.1. Operational Condition Test Results and Discussion
The load–strain curve of four typical positions with relatively high strain values under operational condition testing for the thrust reverser cascade is shown in Figure 19. The test results are compared with those obtained from finite element analysis, and the positions of the strain gauges are also indicated in the figure. The structure is still in the elastic stage; therefore, the relationship between the strain and the load is linear. A comparative analysis is performed between the test and the finite element-calculated strains at four specific positions. The maximum strain measured during the test is located at the edge of the H4 mounting hole, which is point A, as illustrated in Figure 19a. Point D is where the difference between the experimental strains and the finite element analysis strains is at a maximum, as shown in Figure 19d. A, B, C, and D reveal differences of 3.26%, 2.38%, 3.12%, and 6.09%, respectively. Notably, these variations at critical locations with higher strains are relatively minor, meeting the precision criteria of the experiment. Furthermore, the strains measured at other positions exhibit good correspondence, indicating that this test method can simulate the operational load distribution on the cascade well.
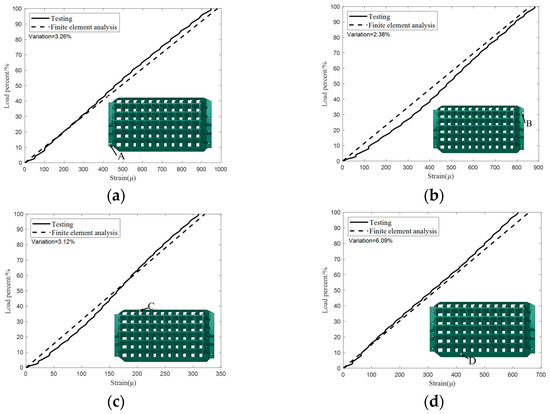
Figure 19.
Strains of thrust reverser cascade under operational load: (a) position A; (b) position B; (c) position C; (d) position D.
To analyze the distribution of loads, the contribution of stiffeners and surrounds to the load transfer is analyzed using strain data at corresponding positions from S1 to S6, as shown in Figure 2. As shown in Figure 20, the load magnitudes at each location are depicted accordingly. Compared to the results obtained from finite element analysis in Figure 10, the results are relatively similar. The load magnitudes increase from the top to the bottom on the stiffeners and are observed to be larger than those on the surrounds.
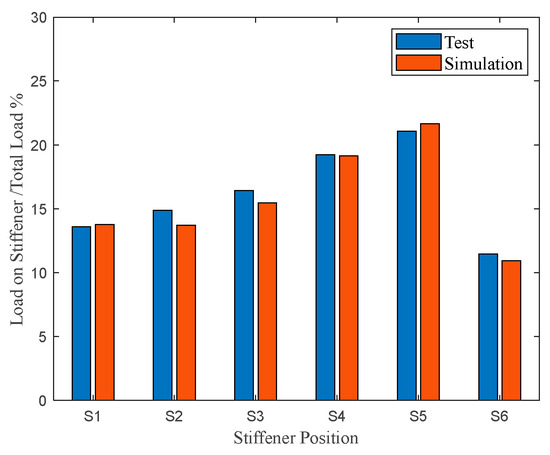
Figure 20.
Load distribution on stiffeners and surround.
6.2. Ultimate Load Condition Test Results and Discussion
As shown in Figure 21, consistent with the results of finite element analysis, the thrust reverser cascade remained within the linear elastic region until the applied load reached 2.97 times the operational load (point A in Figure 21), showing no signs of damage. Beyond this load level, at 2.97 times the operational load, the structure began exhibiting damage, evidenced by fluctuations in the load–displacement curve. Audible indications of structural damage were observed at this time, and visual evidence from video recordings revealed the initial occurrence of damage near the mounting holes. With continued load increase, the damage progressed along the mounting edge, culminating in complete structural failure when the load reached 3.48 times the operational load (point B in Figure 21), characterized by delamination and detachment damage between the mounting edge and the entire structure. The photos of damage of the thrust reverser cascade are shown in Figure 22.
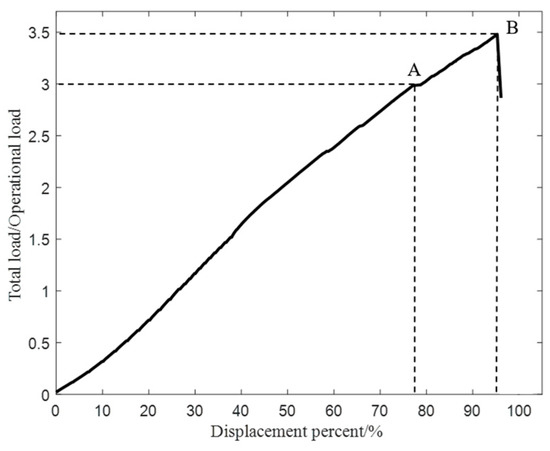
Figure 21.
Total load curve under ultimate load calculation.
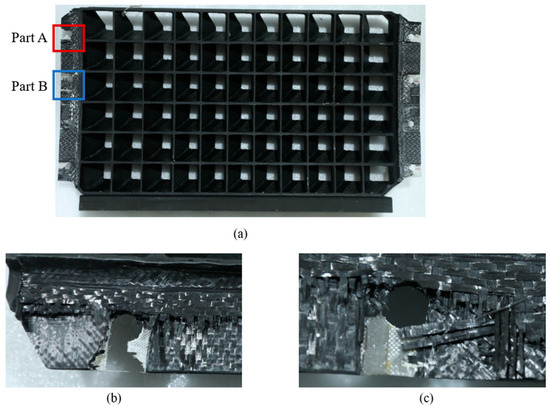
Figure 22.
Damage of the thrust reverser cascade (reversed to better show the damaged area): (a) damage of the whole structure; (b) enlargement of part A; (c) enlargement of part B.
Referring to the results obtained from the finite element analysis, the onset of failure for the thrust reverser cascade was observed at a load of 3.01 times the operational load, with a negligible deviation of 1.3% from the experimental finding of 2.97 times. Remarkably, the initiation position of damage in both the test and the numerical calculation was localized at the edges of the mounting holes. This congruence underscores the efficacy of the test method in faithfully reflecting the initiation of damage under ultimate loading conditions for the cascade. However, during the test, the structure withstood a maximum load of 3.48 times the operational load, presenting a notable difference from the numerical prediction of 4.10 times. Although the results in the initial damage stage were quite close to the simulation’s expected results, the vibration of the tooling during the experiment caused the performance of the cascade in the final damage stage to differ from the expected results. This disparity signals the necessity for further refinement in the test method to meticulously scrutinize the progressive phase of damage propagation.
For further discussion, take the initiation point of damage, which is near the H5 mounting hole, as shown in position B of Figure 19b, as an example. Figure 23 illustrates the comparative analyses between the test and the numerical calculation data of the strain where the initial structural failure occurred. Preceding the onset of failure, although the linearity of the experimental strain curve was slightly compromised due to load stability during the test, the load–strain behavior displayed linear-elastic characteristics. The test and numerical simulation results indicated structural failure at strain levels of 5596 με and 5738 με, respectively. The corresponding total load of failure was measured at 3.08 times the operational load in the test and 3.15 times in finite element analysis, indicating a minor discrepancy of 2.27% at the point of damage initiation near the hole. This outcome underscores the precision of the test method in simulating the initiation of damage in the thrust reverser cascade. However, post-damage, the experimental stiffness degradation rate exceeded that predicted by the finite element analysis.
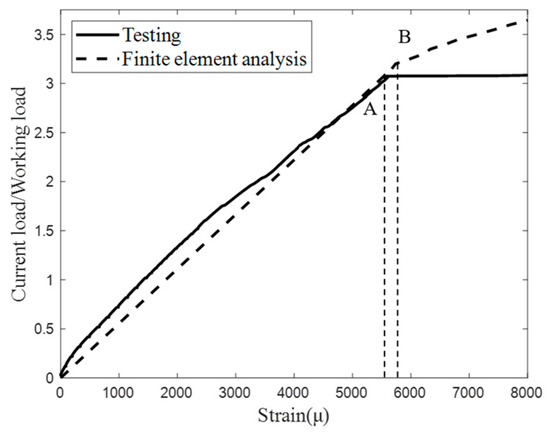
Figure 23.
Load–strain curve at the mounting hole.
7. Conclusions
In this paper, a finite element model and a static test method were developed for an inclined composite thrust reverser cascade. The progressive damage model, based on the Hashin criterion and a linear degradation progressive damage model, was employed to analyze the maximum load-bearing capacity and damage of the structure. A test method using levers and hooks to simulate the load conditions on the thrust reverser cascade was established for static testing. The predictions obtained from the existing models are in good agreement with the experimental results, especially at the damage initiation points. The initiation positions of damage in both the test and the numerical calculation concurred at the edges of the mounting holes, where the corresponding total load was measured to be 3.08 times and 3.15 times the operational load, respectively, indicating a minor discrepancy of 2.27%. The main failure mode of the cascade is matrix compression damage near the mounting holes. However, due to tooling vibrations during the experiment, there is a certain discrepancy between the test performance and the simulation results in the post-damage stages, indicating the need for further improvement. Future studies will focus on optimizing the finite element model and the test method for more accurate results in the post-damage phase.
Author Contributions
Conceptualization, X.C.; methodology, D.W. and X.C.; formal analysis, D.W.; investigation, D.W. and H.Q.; writing—original draft preparation, D.W.; writing—review and editing, X.C.; supervision, X.C. All authors have read and agreed to the published version of the manuscript.
Funding
This research received no external funding.
Data Availability Statement
The raw data supporting the conclusions of this article will be made available by the authors on request.
Conflicts of Interest
Author Hongyan Qiu was employed by the company Aero Engine Corporation of China. The remaining authors declare that the research was conducted in the absence of any commercial or financial relationships that could be construed as a potential conflict of interest.
References
- Yetter, J.A. Why Do Airlines Want and Use Thrust Reversers? A Compilation of Airline Industry Responses to a Survey Regarding the Use of Thrust Reversers on Commercial Transport Airplanes; NASA: Hampton, Virginia, 1995. [Google Scholar]
- Atanasov, G.; Silberhorn, D. Hybrid aircraft for improved off-design performance and reduced emissions. In Proceedings of the AIAA Scitech 2020 Forum, Orlando, FL, USA, 6–10 January 2020; p. 0753. [Google Scholar] [CrossRef]
- Santin, M.A.; Barbosa, J.R.; Bontempo, L.P.; Silva, F.D.S.; Jesus, A.B.; Trapp, L.G.; Oliveira, G.L. Overview on thrust reverser design. In Proceedings of the 18th International Congress of Mechanical Engineering, Minas Gerais, Brazil, 6–11 November 2005; pp. 1–8. [Google Scholar]
- Filippatos, A.; Markatos, D.; Tzortzinis, G.; Abhyankar, K.; Malefaki, S.; Gude, M.; Pantelakis, S. Sustainability-driven design of aircraft composite components. Aerospace 2024, 11, 86. [Google Scholar] [CrossRef]
- Saboktakin, A. 3d textile preforms and composites for aircraft strcutures: A review. Int. J. Aviat. Aeronaut. Aerosp. 2019, 6, 2. [Google Scholar] [CrossRef]
- Zimmermann, N.; Wang, P.H. A review of failure modes and fracture analysis of aircraft composite materials. Eng. Fail. Anal. 2020, 115, 104692. [Google Scholar] [CrossRef]
- Parveez, B.; Kittur, M.I.; Badruddin, I.A.; Kamangar, S.; Hussien, M.; Umarfarooq, M.A. Scientific advancements in composite materials for aircraft applications: A review. Polymers 2022, 14, 5007. [Google Scholar] [CrossRef] [PubMed]
- Sioutis, I.; Tserpes, K. A literature review on crack arrest features for composite materials and composite joints with a focus on aerospace applications. Aerospace 2023, 10, 137. [Google Scholar] [CrossRef]
- Falaschetti, M.; Rondina, F.; Zavatta, N.; Troiani, E.; Donati, L. Effective implementation of numerical models for the crashworthiness of composite laminates. Eng. Fail. Anal. 2024, 160, 108196. [Google Scholar] [CrossRef]
- Zavatta, N.; Rondina, F.; Falaschetti, M.P.; Donati, L. Effect of thermal ageing on the mechanical strength of carbon fibre reinforced epoxy composites. Polymers 2021, 13, 2006. [Google Scholar] [CrossRef]
- Nobel, T.; Wooden, P.; Arledge, R. Experimental thrust reverser design with computational analysis. In Proceedings of the 32nd Aerospace Sciences Meeting and Exhibit, Reno, NV, USA, 10–13 January 1994; p. 21. [Google Scholar] [CrossRef]
- Strash, D.J.; Summa, J.M.; Frank, J.H.; Standish, R. Aerodynamic analysis of an installed thrust reverser. J. Propuls. Power 2000, 16, 10–15. [Google Scholar] [CrossRef]
- Yao, H.; Raghunathan, S.; Cooper, R.; Benard, E.; Tweedie, J.; Riordan, D. Numerical simulation on flow fields of the nature blockage thrust reverser. In Proceedings of the 43rd AIAA Aerospace Sciences Meeting and Exhibit, Reno, NV, USA, 10–13 January 2005; p. 631. [Google Scholar] [CrossRef]
- Bdeiwi, H.; Ciarella, A. Computational fluid dynamics investigations of a thrust reverser unit flowfield. In Proceedings of the AIAA Scitech Forum, Online, 11–15 January 2021; p. 0244. [Google Scholar] [CrossRef]
- Bi, S.; Mao, J.; Han, X.; Cai, K.; Wang, F. Study of the aerodynamic characteristics on the computed flowfield during thrust reversers operation. J. Appl. Fluid Mech. 2021, 14, 1497–1509. [Google Scholar] [CrossRef]
- Zhao, J.; Wang, X.; Meng, C.; Song, H.; Luo, Z.; Han, Q. Dynamic modeling and analysis of thrust reverser mechanism considering clearance joints and flexible component. Aerospace 2022, 9, 611. [Google Scholar] [CrossRef]
- Liu, C.; Deng, J.; Su, S. Design of loading system for thrust reverser ground simulation test. In IOP Conference Series: Earth and Environmental Science; IOP Publishing: Bristol, UK, 2018; Volume 170, p. 042093. [Google Scholar] [CrossRef]
- Shi, G.-L.; Pan, J. Electro-hydraulic force servo system for simulating thrust in reverse of experimental systems on the ground for airplane. China Mech. Eng. 2010, 21, 42. [Google Scholar]
- Henzel, J.G., Jr.; McArdle, J.G. Preliminary Performance Data of Several Tail-Pipe-Cascade-Type Model Thrust Reversers; NASA: Washington, DC, USA, 1955. [Google Scholar]
- Anderson SB Cooper, G.E.; Faye, A.E., Jr. Flight Measurements of the Effect of a Controllable Thrust Reverser on the Flight Characteristics of a Single-Engine Jet Airplane; NASA: Washington, DC, USA, 1959. [Google Scholar]
- Romine, J.; Johnson, W. Performance investigation of a fan thrust reverser for a high by-pass turbofan engine. In Proceedings of the 20th Joint Propulsion Conference, Cincinnati, OH, USA, 11–13 June 1984; p. 1178. [Google Scholar] [CrossRef]
- Scott, C.A.; Jeffrey, A.Y. Static Performance of Six Innovative Thrust Reverser Concepts for Subsonic Transport Applications-Summary of the Nasa Langley Innovative Thrust Reverser Test Program; NASA: Washington, DC, USA, 2000. [Google Scholar]
- Butterfield, J.; Yao, H.; Price, M.; Armstrong, C.; Raghunatan, S.; Riordan, D.; Cathers, G. Methodologies for structural optimisation of a thrust reverser cascade using a multidisciplinary approach. In Proceedings of the 41st Aerospace Sciences Meeting and Exhibit, Reno, NV, USA, 6–9 January 2003; p. 107. [Google Scholar] [CrossRef]
- Butterfield, J.; Yao, H.; Benard, E.; Price, M.; Cooper, R.; Armstrong, C.; Raghunathan, S.; Monaghan, D. Optimisation of a thrust reverser cascade: An assessment of dynamic response during reverse thrust. In Proceedings of the AIAA’s 3rd Annual Aviation Technology, Integration, and Operations Forum, Denver, CO, USA, 17–19 November 2003; p. 6748. [Google Scholar] [CrossRef]
- Butterfield, J.; Yao, H.; Curran, R.; Price, M.; Armstrong, C.; Raghunathan, S. Integration of aerodynamic, structural, cost and manufacturing cosiderations during the conceptual design of a thrust reverser cascade. In Proceedings of the 42nd AIAA Aerospace Sciences Meeting and Exhibit, Reno, NV, USA, 5–8 January 2004; p. 282. [Google Scholar] [CrossRef]
- Butterfield, J.; Yao, H.; Price, M.; Armstrong, C.; Raghunathan, S.; Bénard, E.; Cooper, R.; Monaghan, D. Enhancement of thrust reverser cascade performance using aerodynamic and structural integration. Aeronaut. J. 2004, 108, 621–628. [Google Scholar] [CrossRef][Green Version]
- Yao, H.; Butterfield, J.; Raghunathan, S.; Cooper, R.; Benard, E. The aerodynamic performance of a thrust reverser cascade. In Proceedings of the 24th International Congress of Aeronautical Sciences, Yokohama, Japan, 29 August–3 September 2004; Volume 4. [Google Scholar]
- Yao, H.; Butterfield, J.; Raghunathan, S.; Wang, J.; Cooper, R.; Benard, E. Optimization design for thrust reverser cascade with a view to reduce noise. Multidiscip. Model. Mater. Struct. 2005, 1, 63–72. [Google Scholar] [CrossRef]
- Butterfield, J.; Yao, H.; Curran, R.; Price, M.; Armstrong, C.; Raghunathan, S. Integrated methods for the design of a thrust reverser cascade. J. Propuls. Power 2006, 22, 862–871. [Google Scholar] [CrossRef]
- Yang, J.S.; Qi, H.Y.; Yang, X.G.; Shi, D.Q. Progressive failure analysis of an integral composite joint for thrust reverser cascade. Key Eng. Mater. 2019, 795, 325–332. [Google Scholar] [CrossRef]
- Huicheng, Y.; Qingzhen, Y.; Canliang, W.; Jin, B. Parametric design optimization of reverse thrust blades and analysis of fluid-solid coupling. Front. Energy Res. 2022, 10, 860337. (In English) [Google Scholar] [CrossRef]
- Hashin, Z.; Rotem, A. A fatigue failure criterion for fiber reinforced materials. J. Compos. Mater. 1973, 7, 448–464. [Google Scholar] [CrossRef]
- Hashin, Z. Fatigue failure criteria for unidirectional fiber composites. J. Appl. Mech. 1980, 47, 329–334. [Google Scholar] [CrossRef]
Disclaimer/Publisher’s Note: The statements, opinions and data contained in all publications are solely those of the individual author(s) and contributor(s) and not of MDPI and/or the editor(s). MDPI and/or the editor(s) disclaim responsibility for any injury to people or property resulting from any ideas, methods, instructions or products referred to in the content. |
© 2024 by the authors. Licensee MDPI, Basel, Switzerland. This article is an open access article distributed under the terms and conditions of the Creative Commons Attribution (CC BY) license (https://creativecommons.org/licenses/by/4.0/).