Multiscale Modeling of Plasma-Assisted Non-Premixed Microcombustion


Abstract
:1. Introduction
- Thermal Effects: Plasma transfers energy to the gas, raising its temperature and thereby enhancing the rate of temperature-sensitive chemical reactions.
- Kinetic Effects: Plasma introduces alternative reaction pathways that are not present in pure combustion systems, altering the chemical kinetics.
- Transport Effects: Electric fields generated by the plasma influence charged particles through electric-field-driven drift, enhanced diffusion, and other bulk fluid processes, such as pressure waves, shock waves, and turbulence initiation.
2. Numerical Methods
2.1. Case Study, the Plasma Actuator
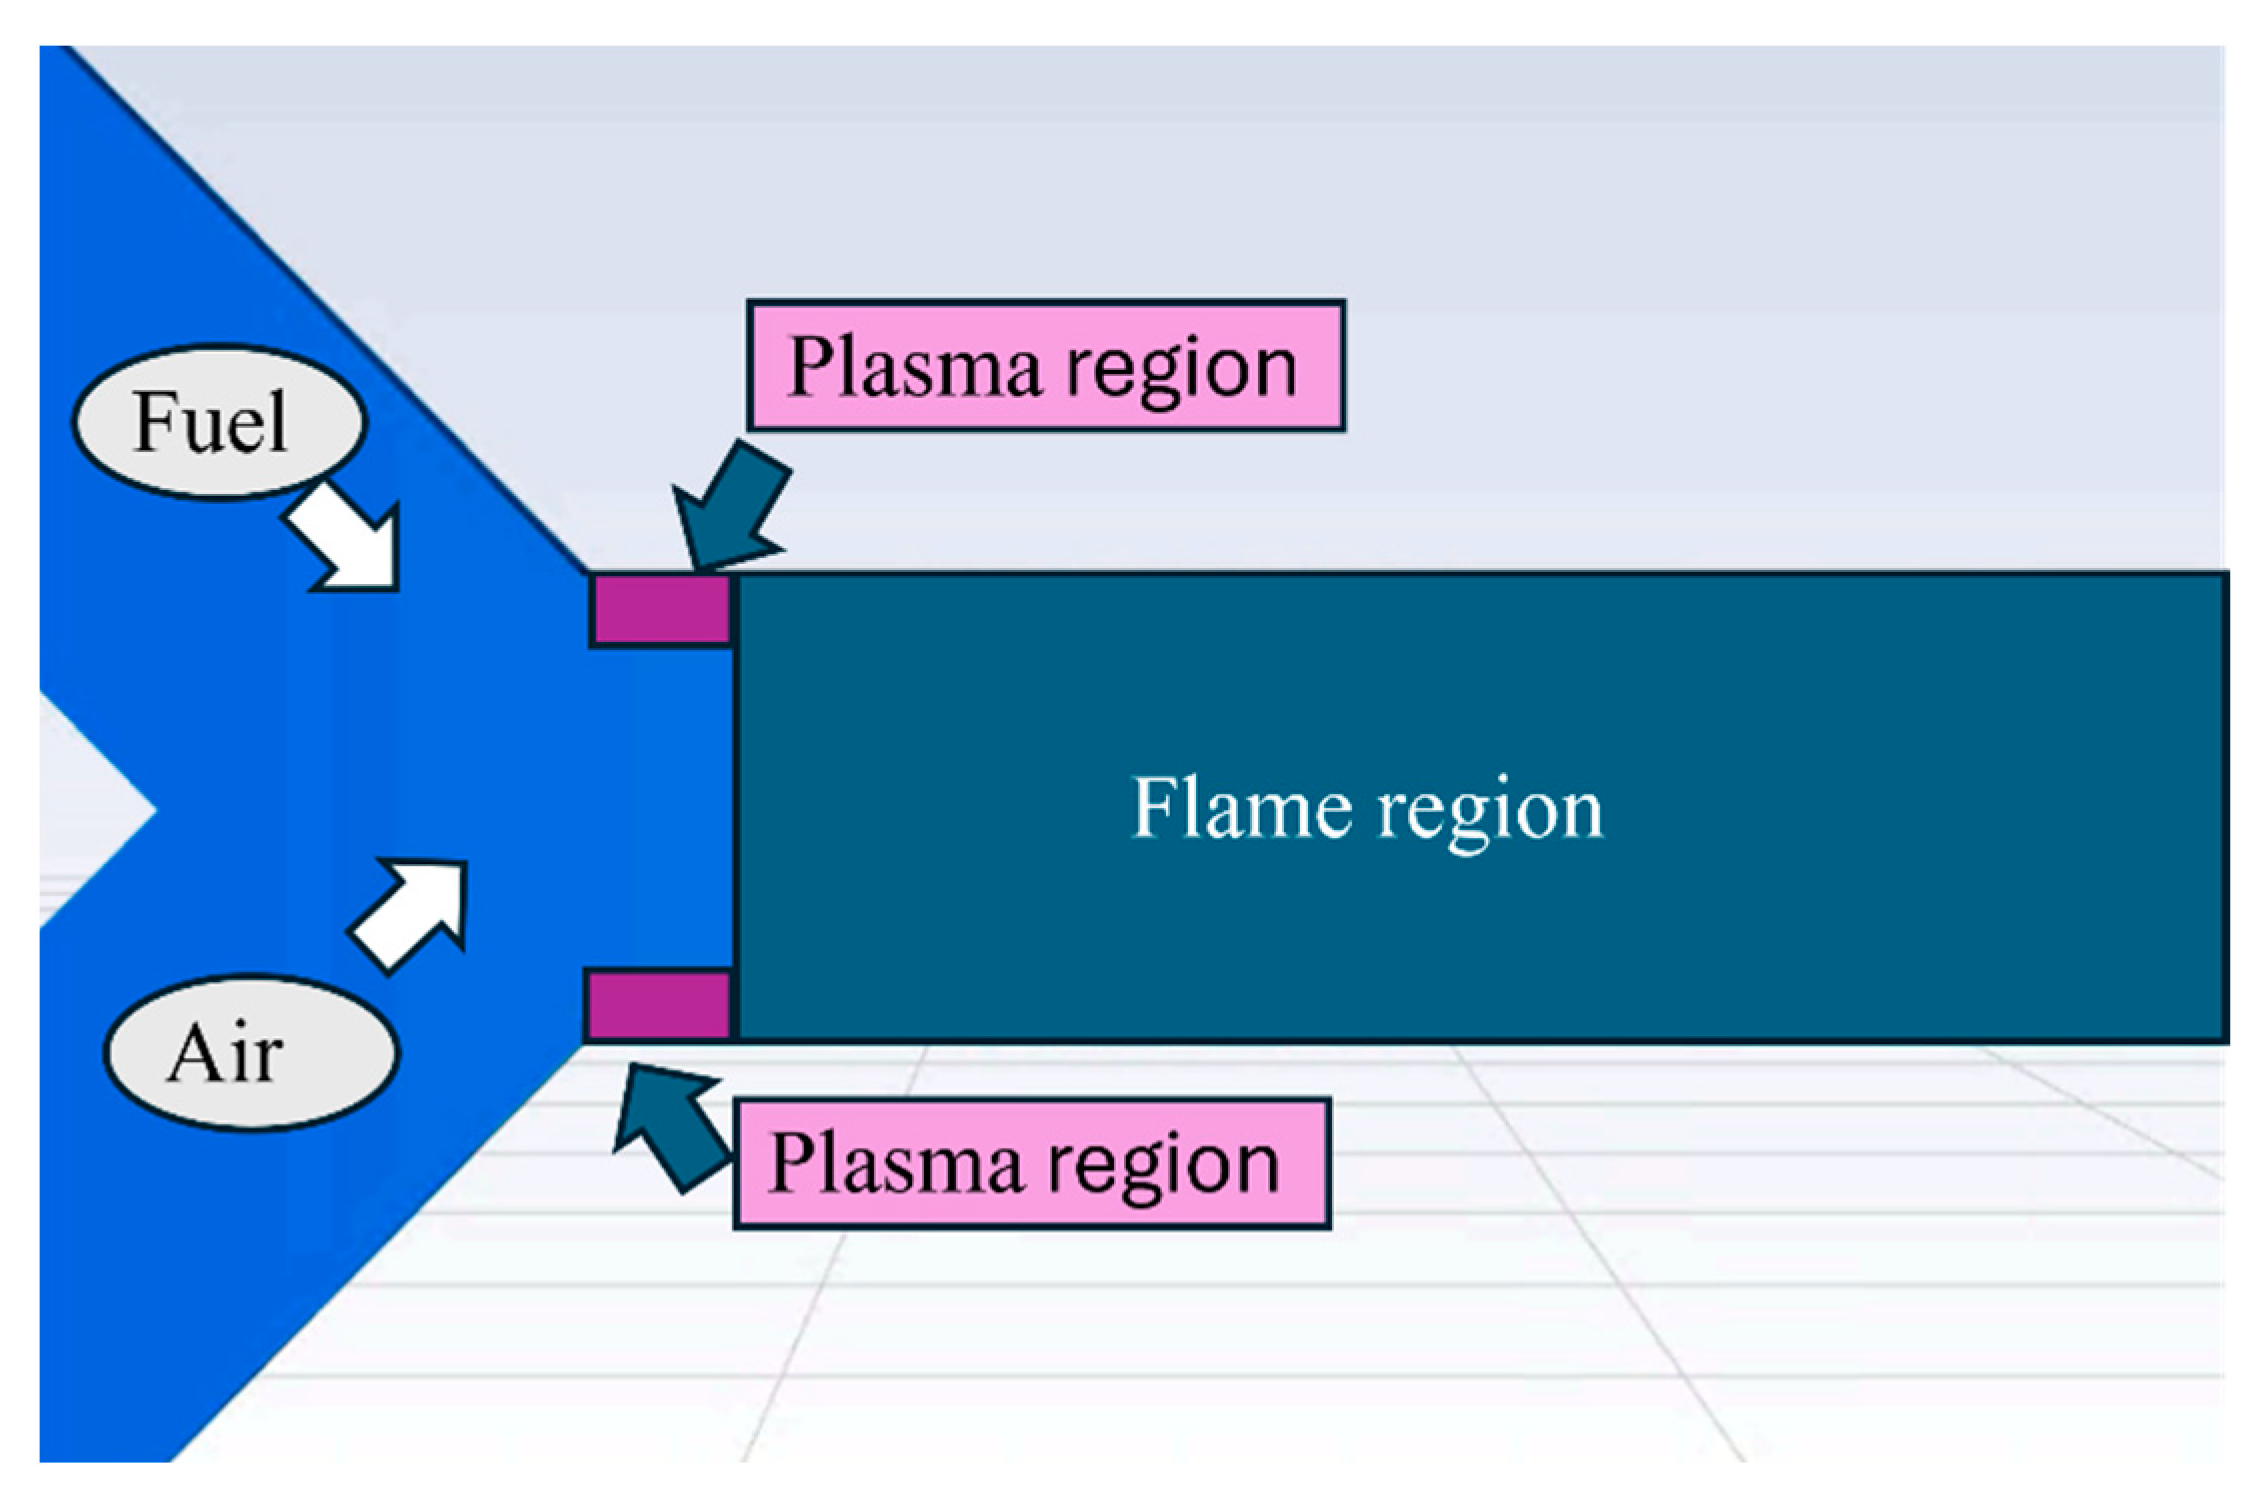
2.2. Geometric Features of the Microcombustor
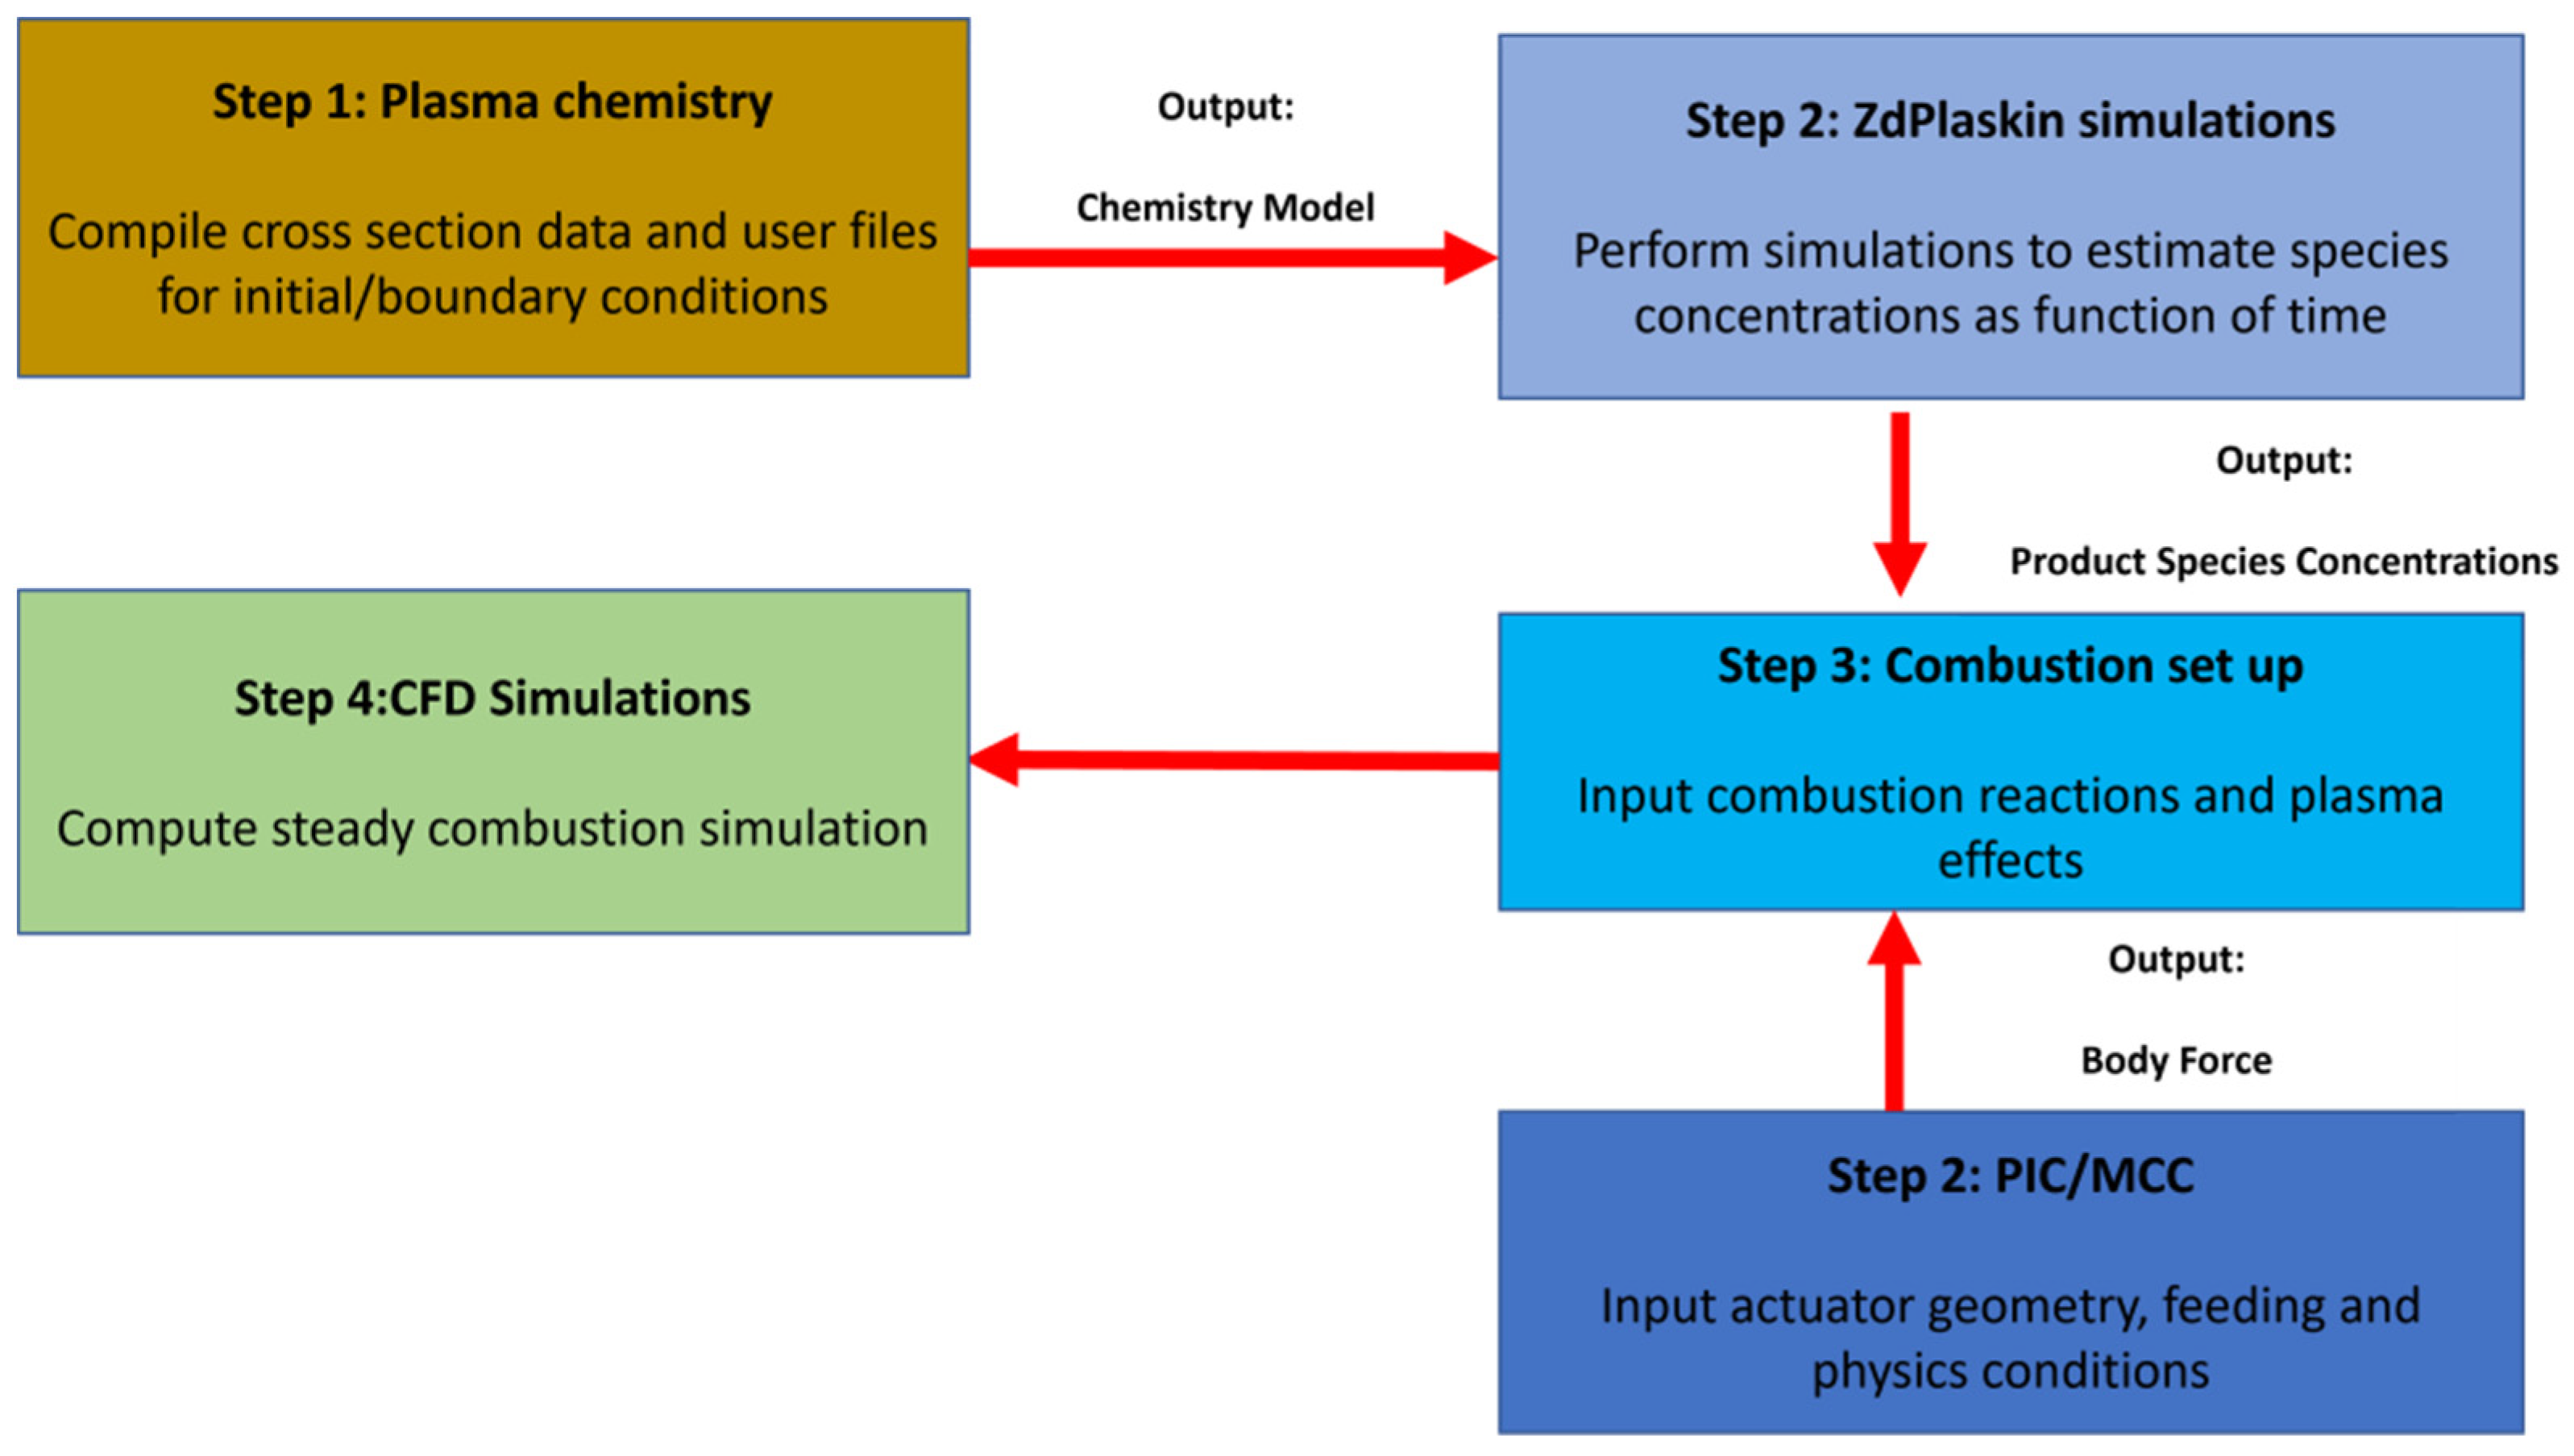
3. Modeling
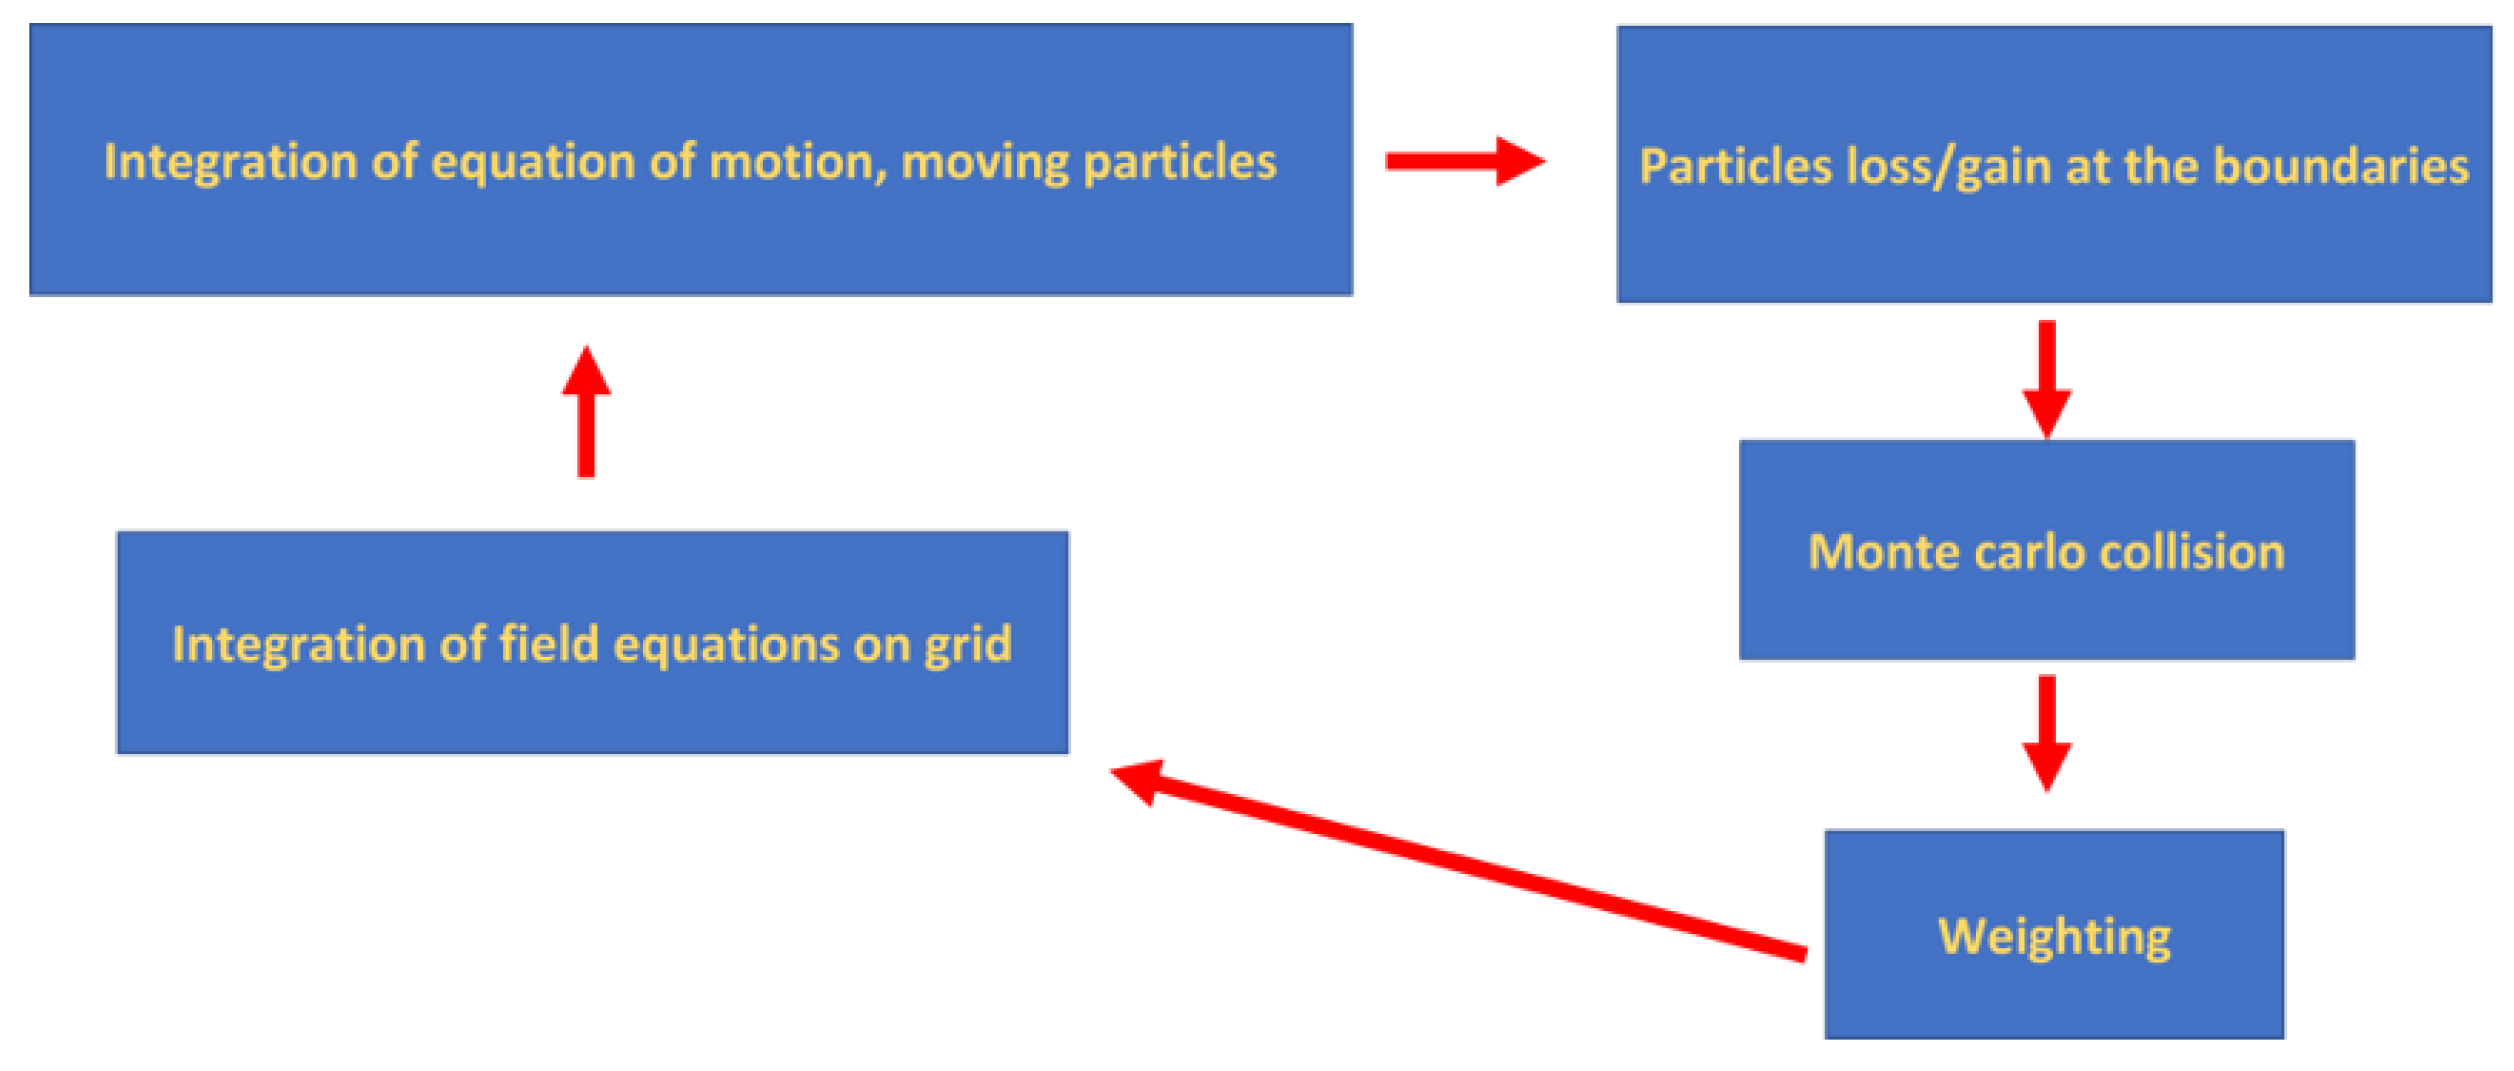
3.1. PIC
3.2. Chemistry Plasma Effect Modeling
3.3. Modelling Combustion
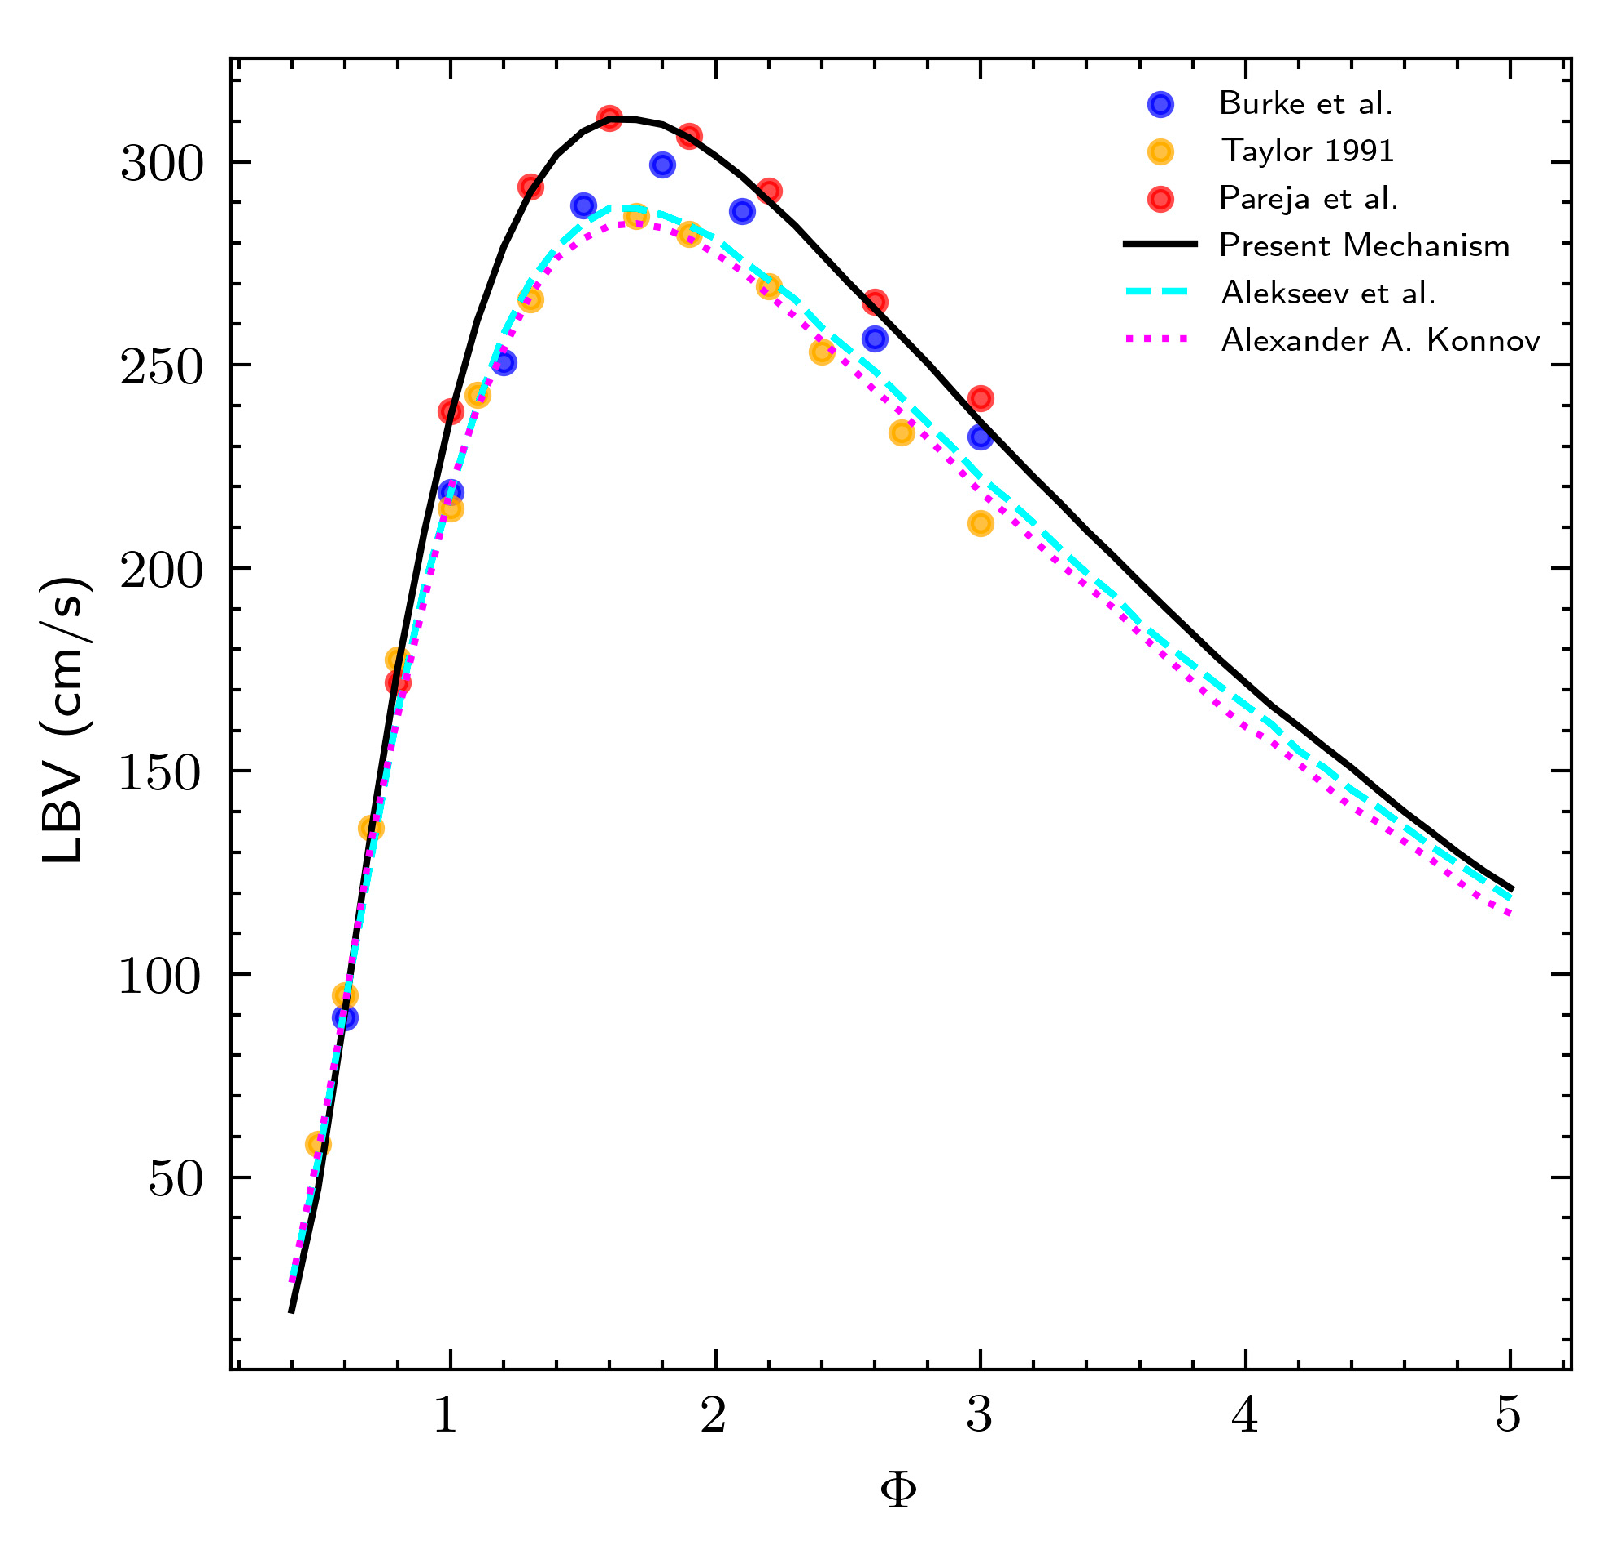
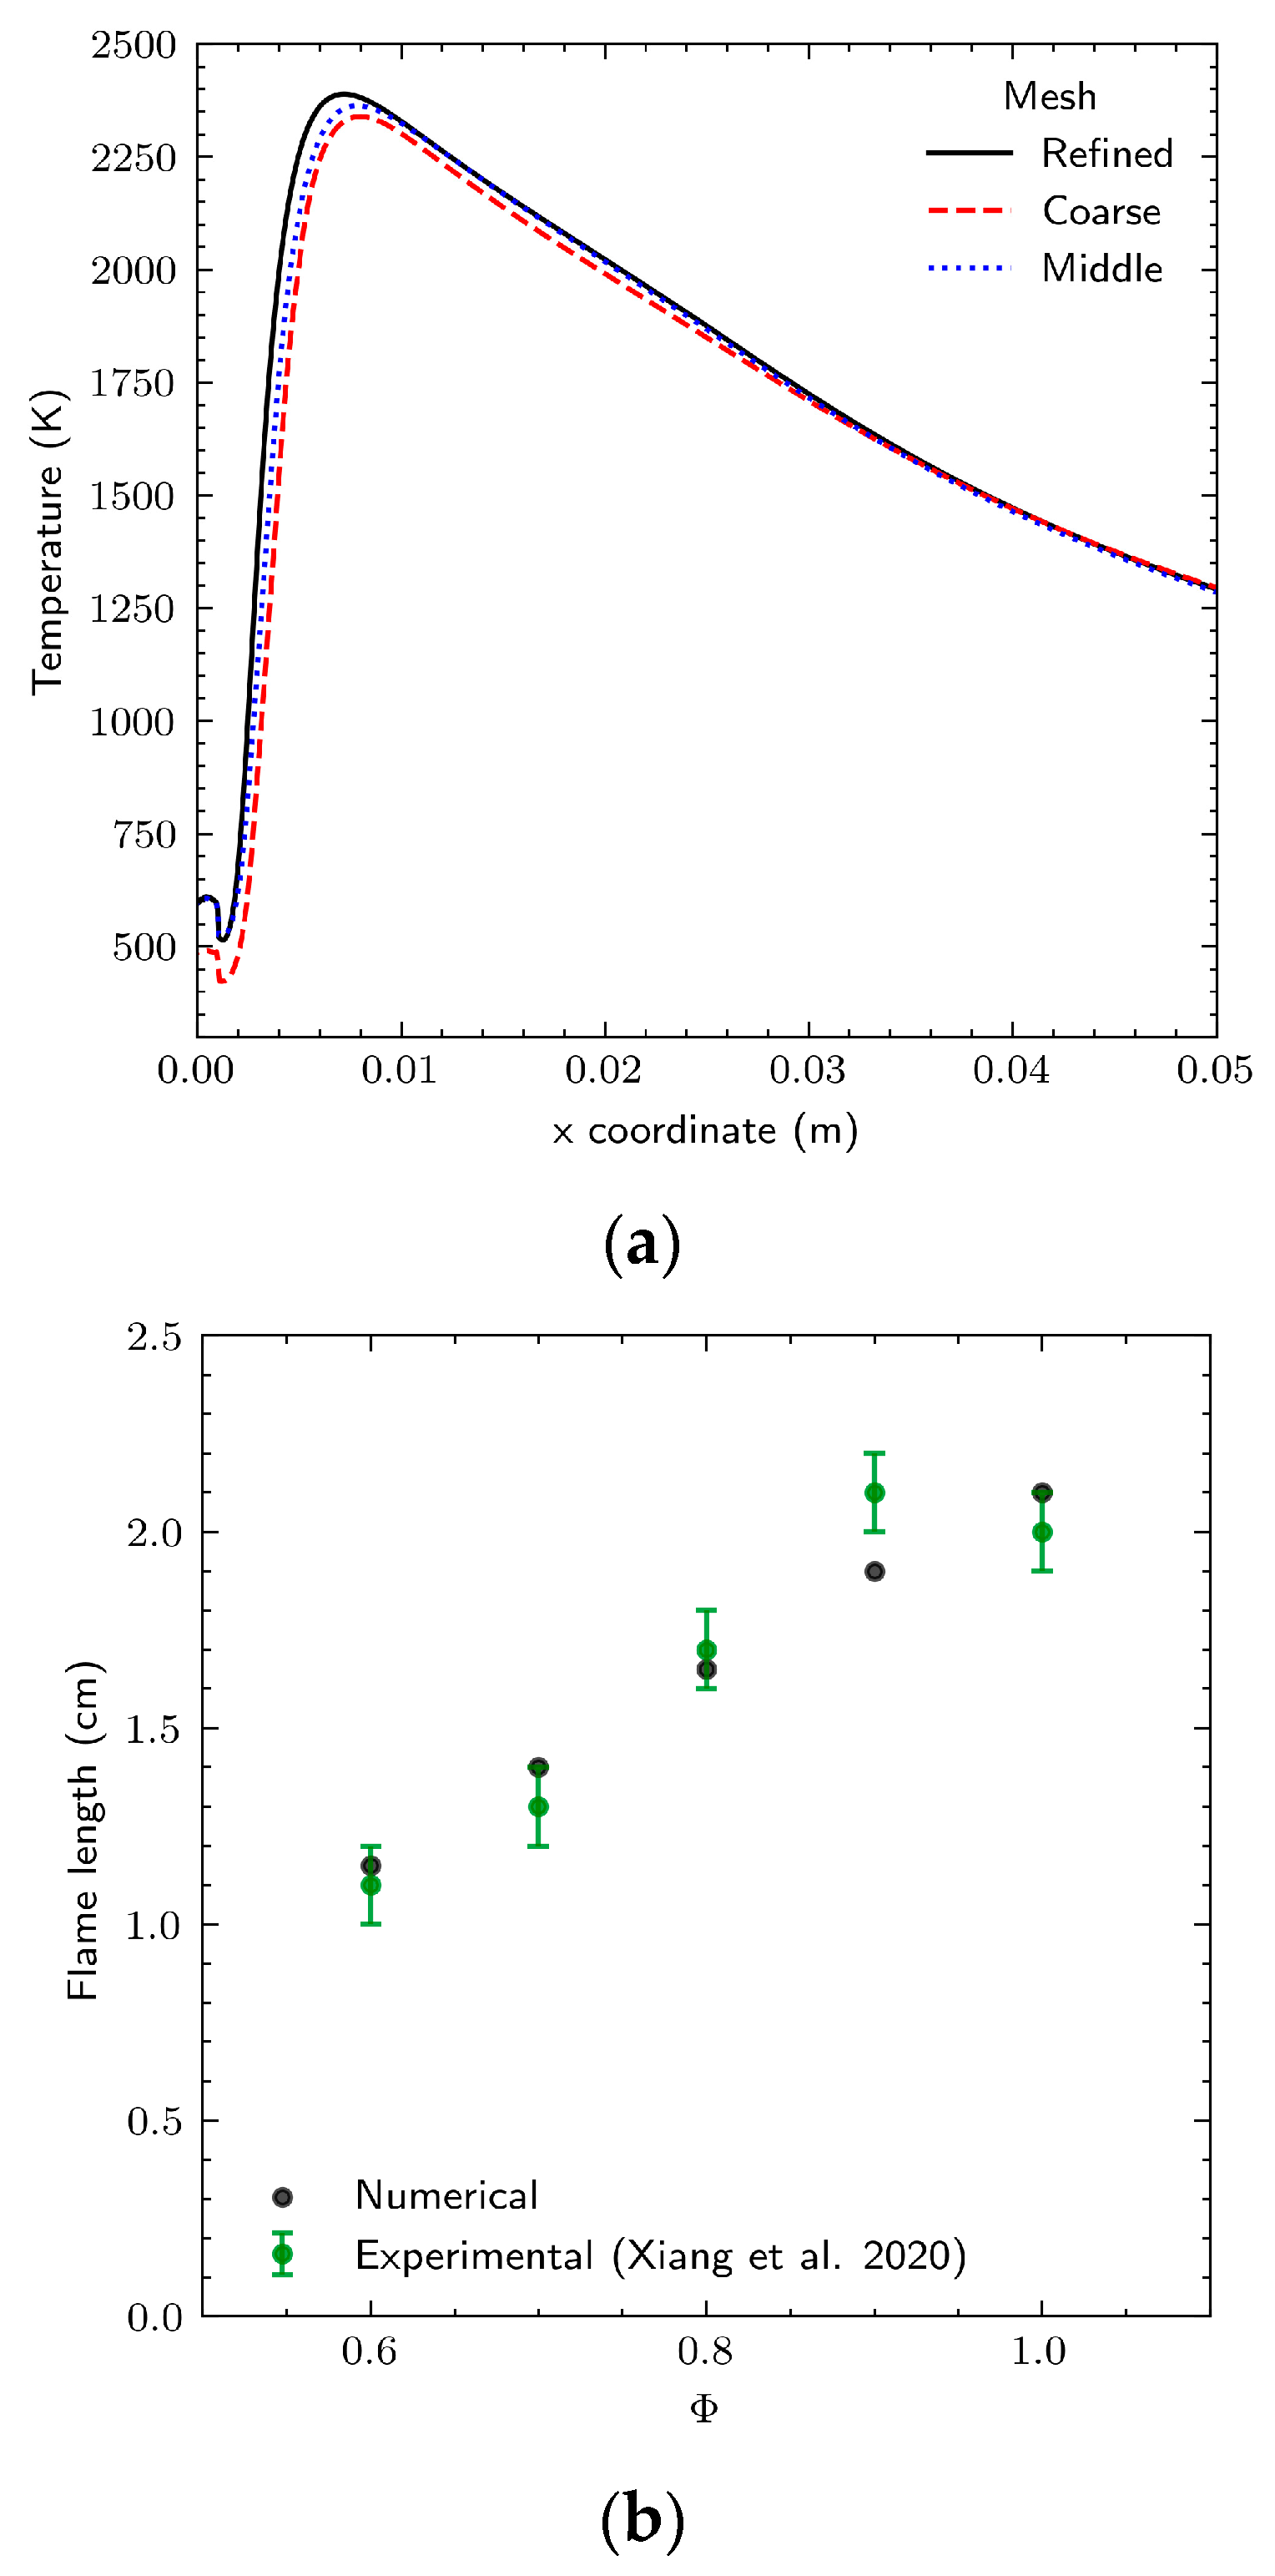
4. Validation
5. Results
5.1. Plasma Discharge Kinetic Results
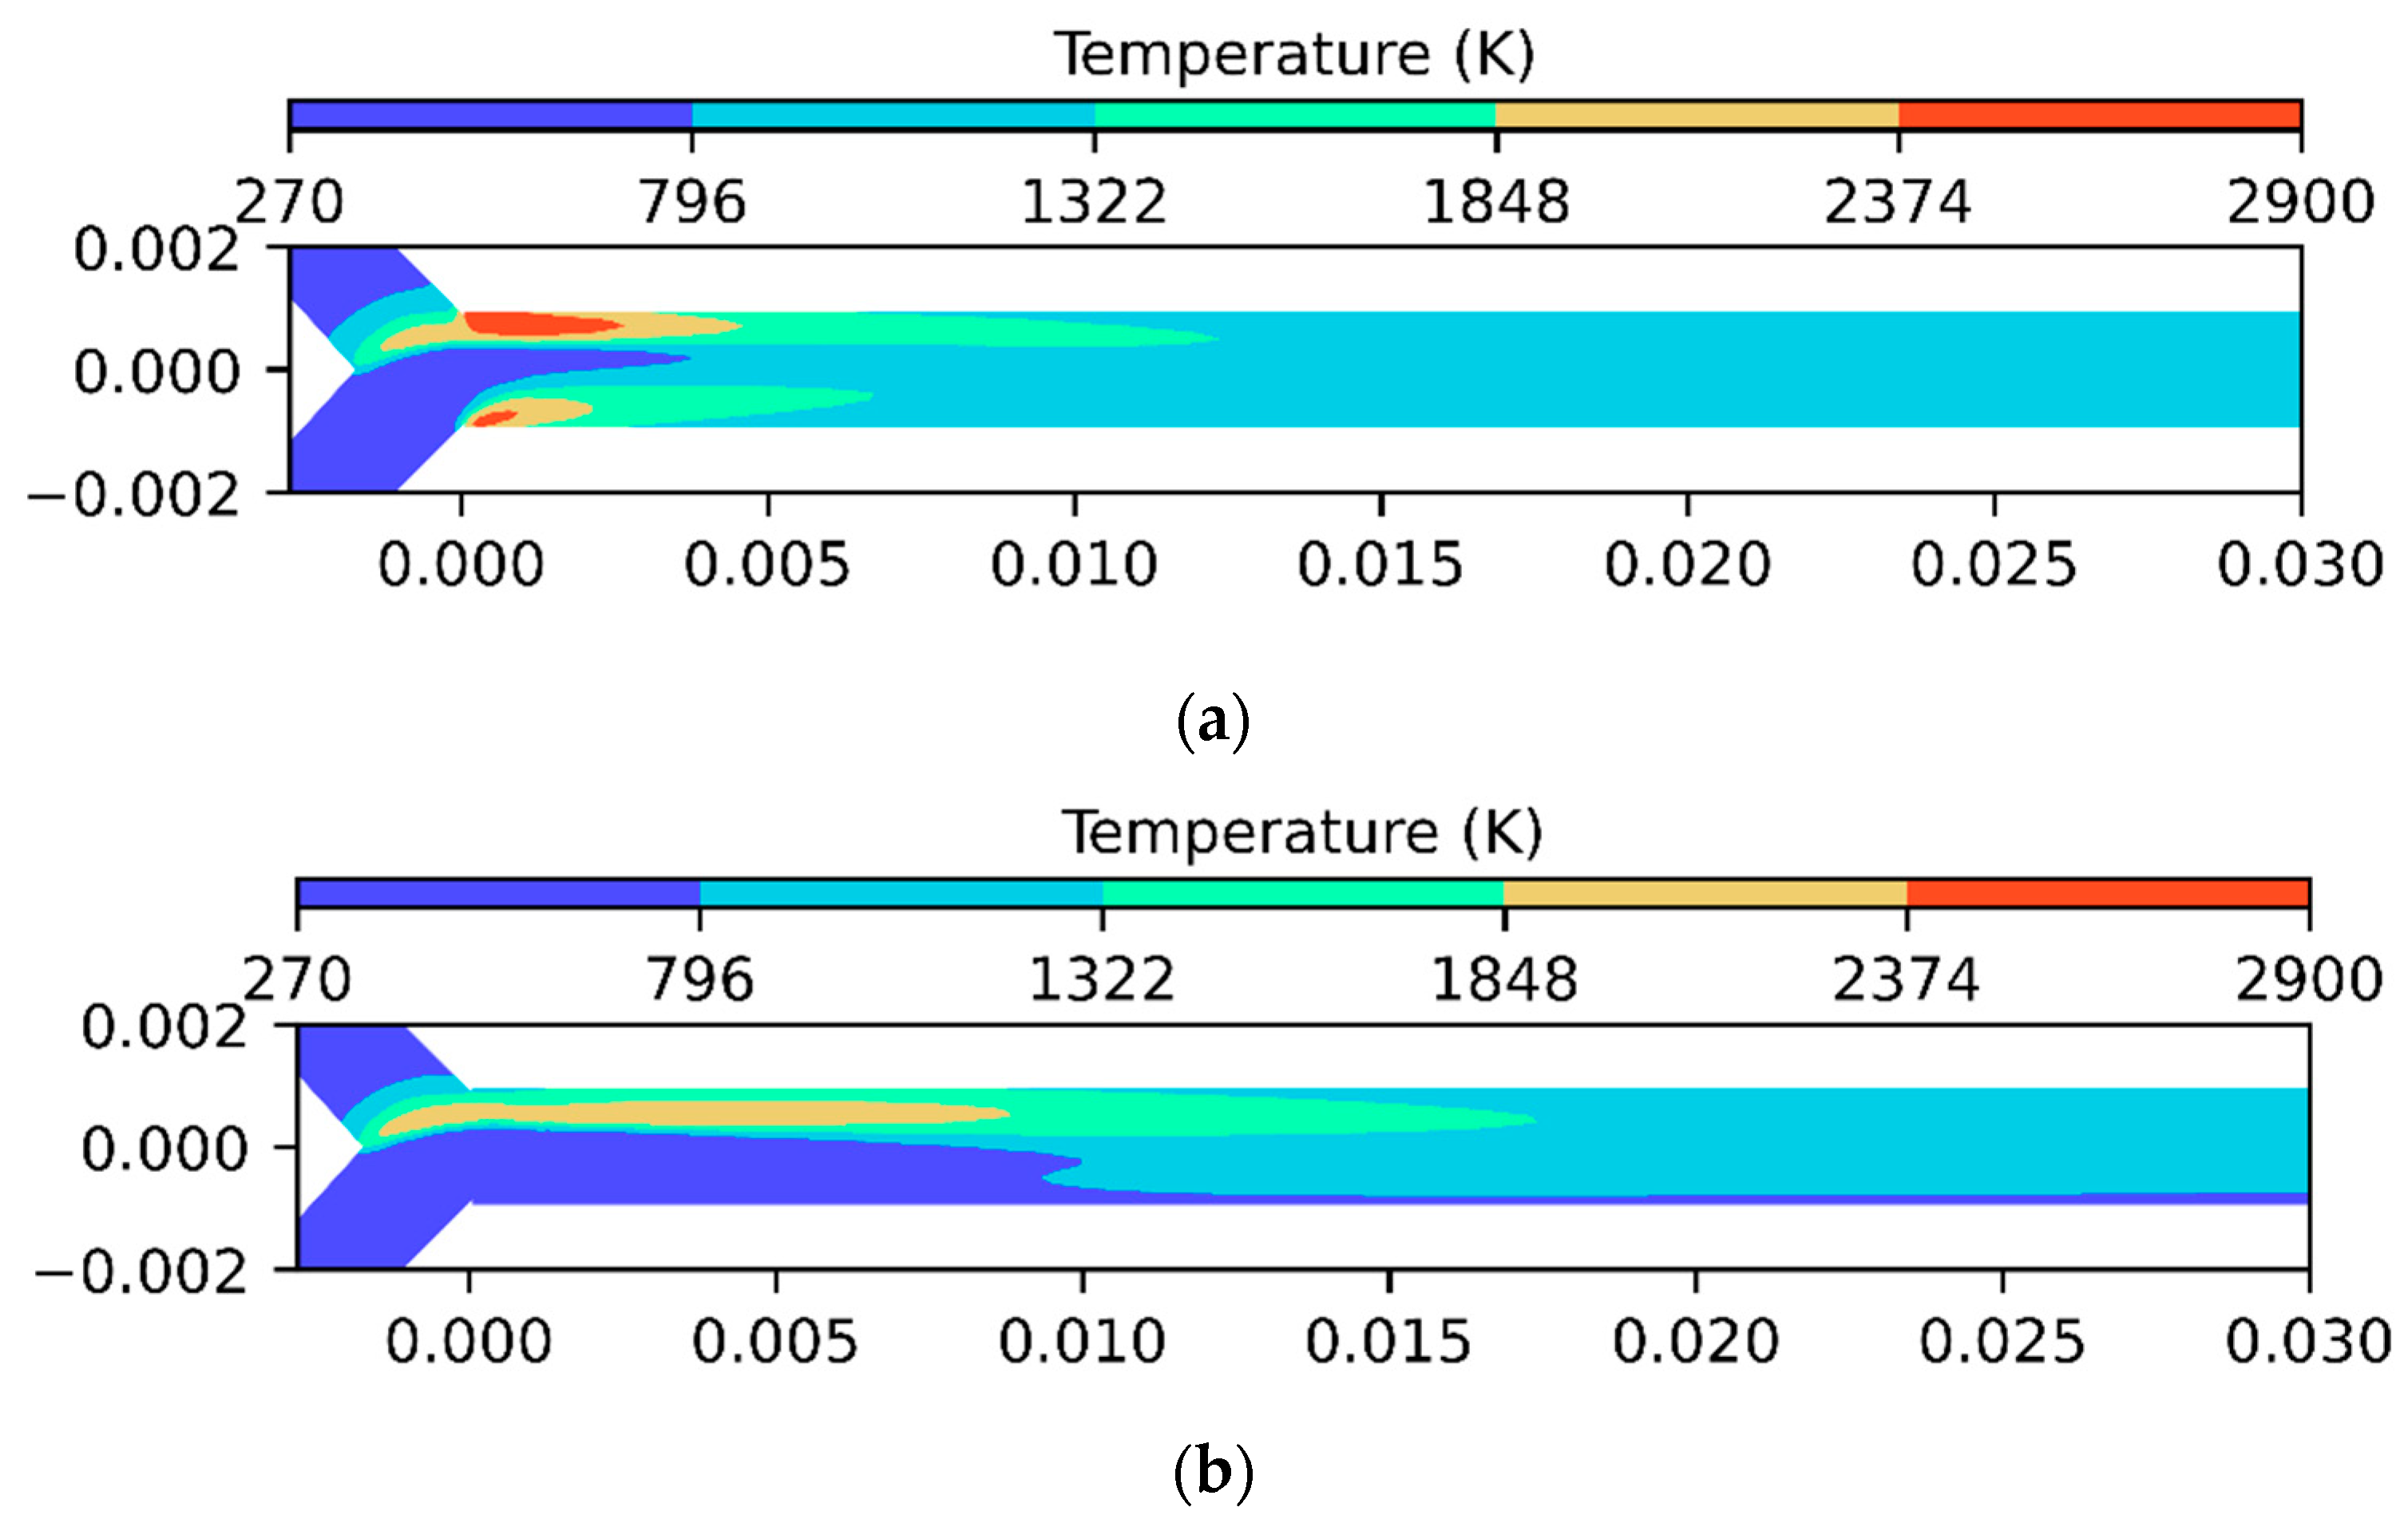
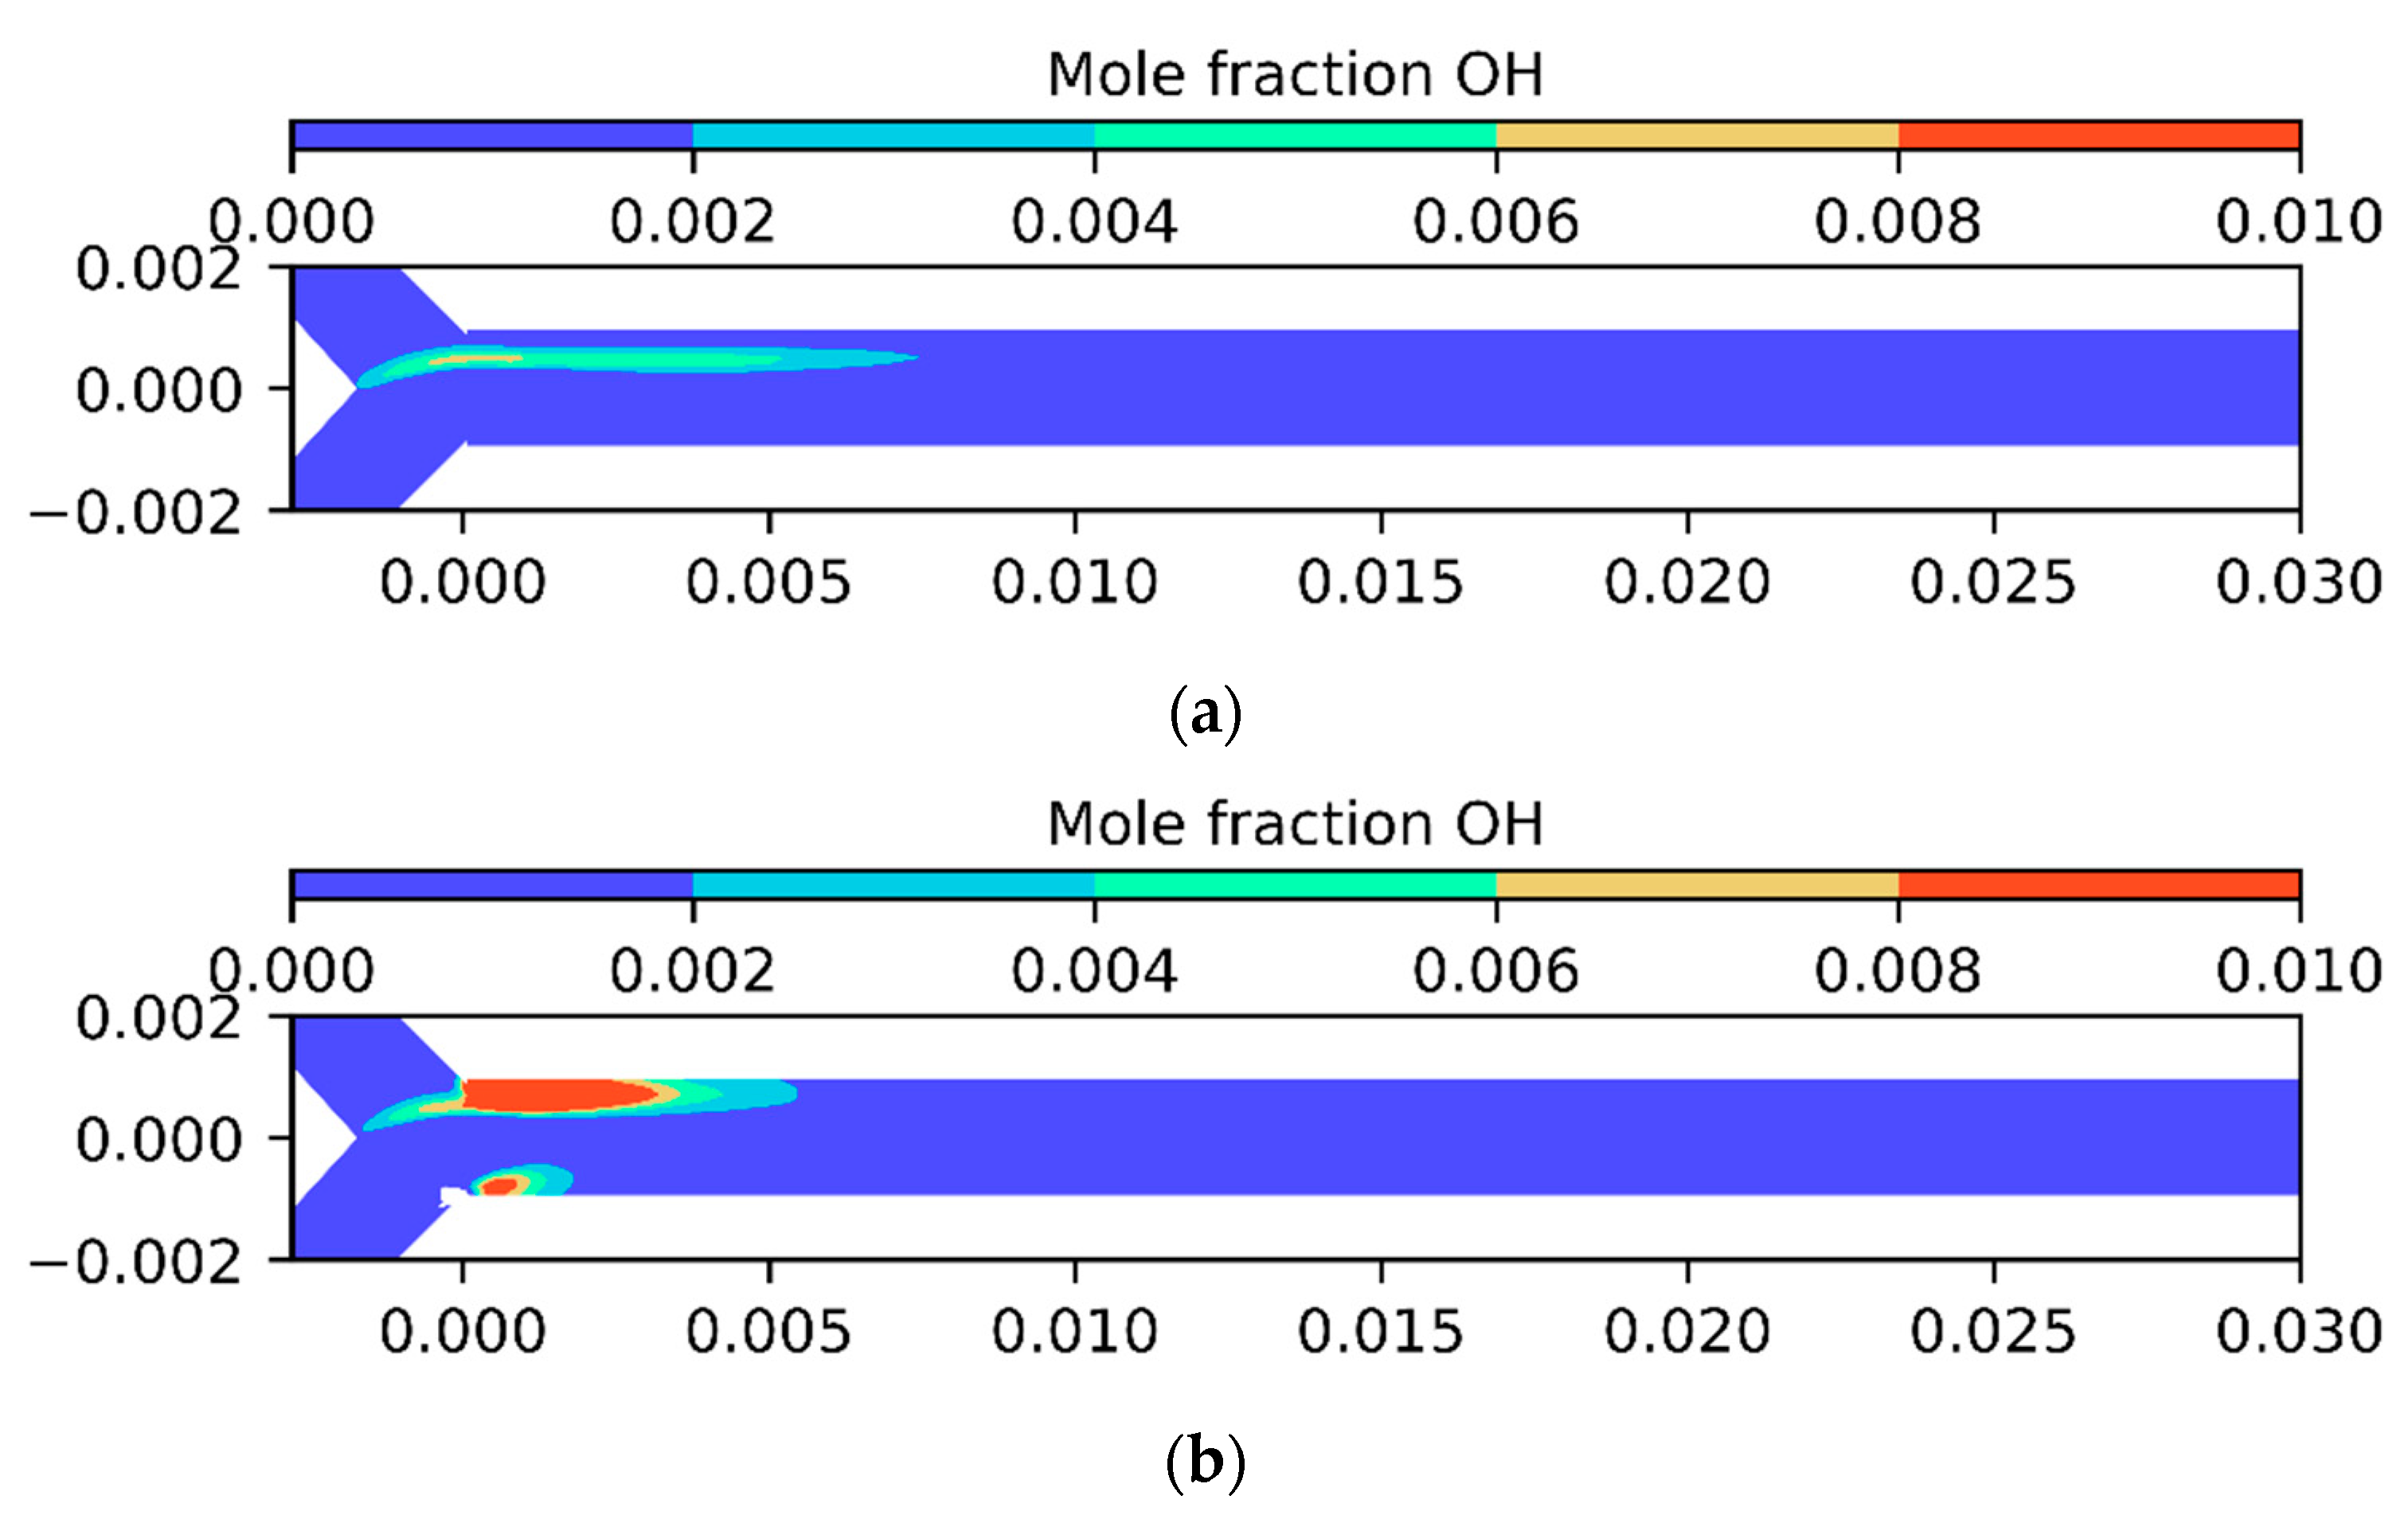
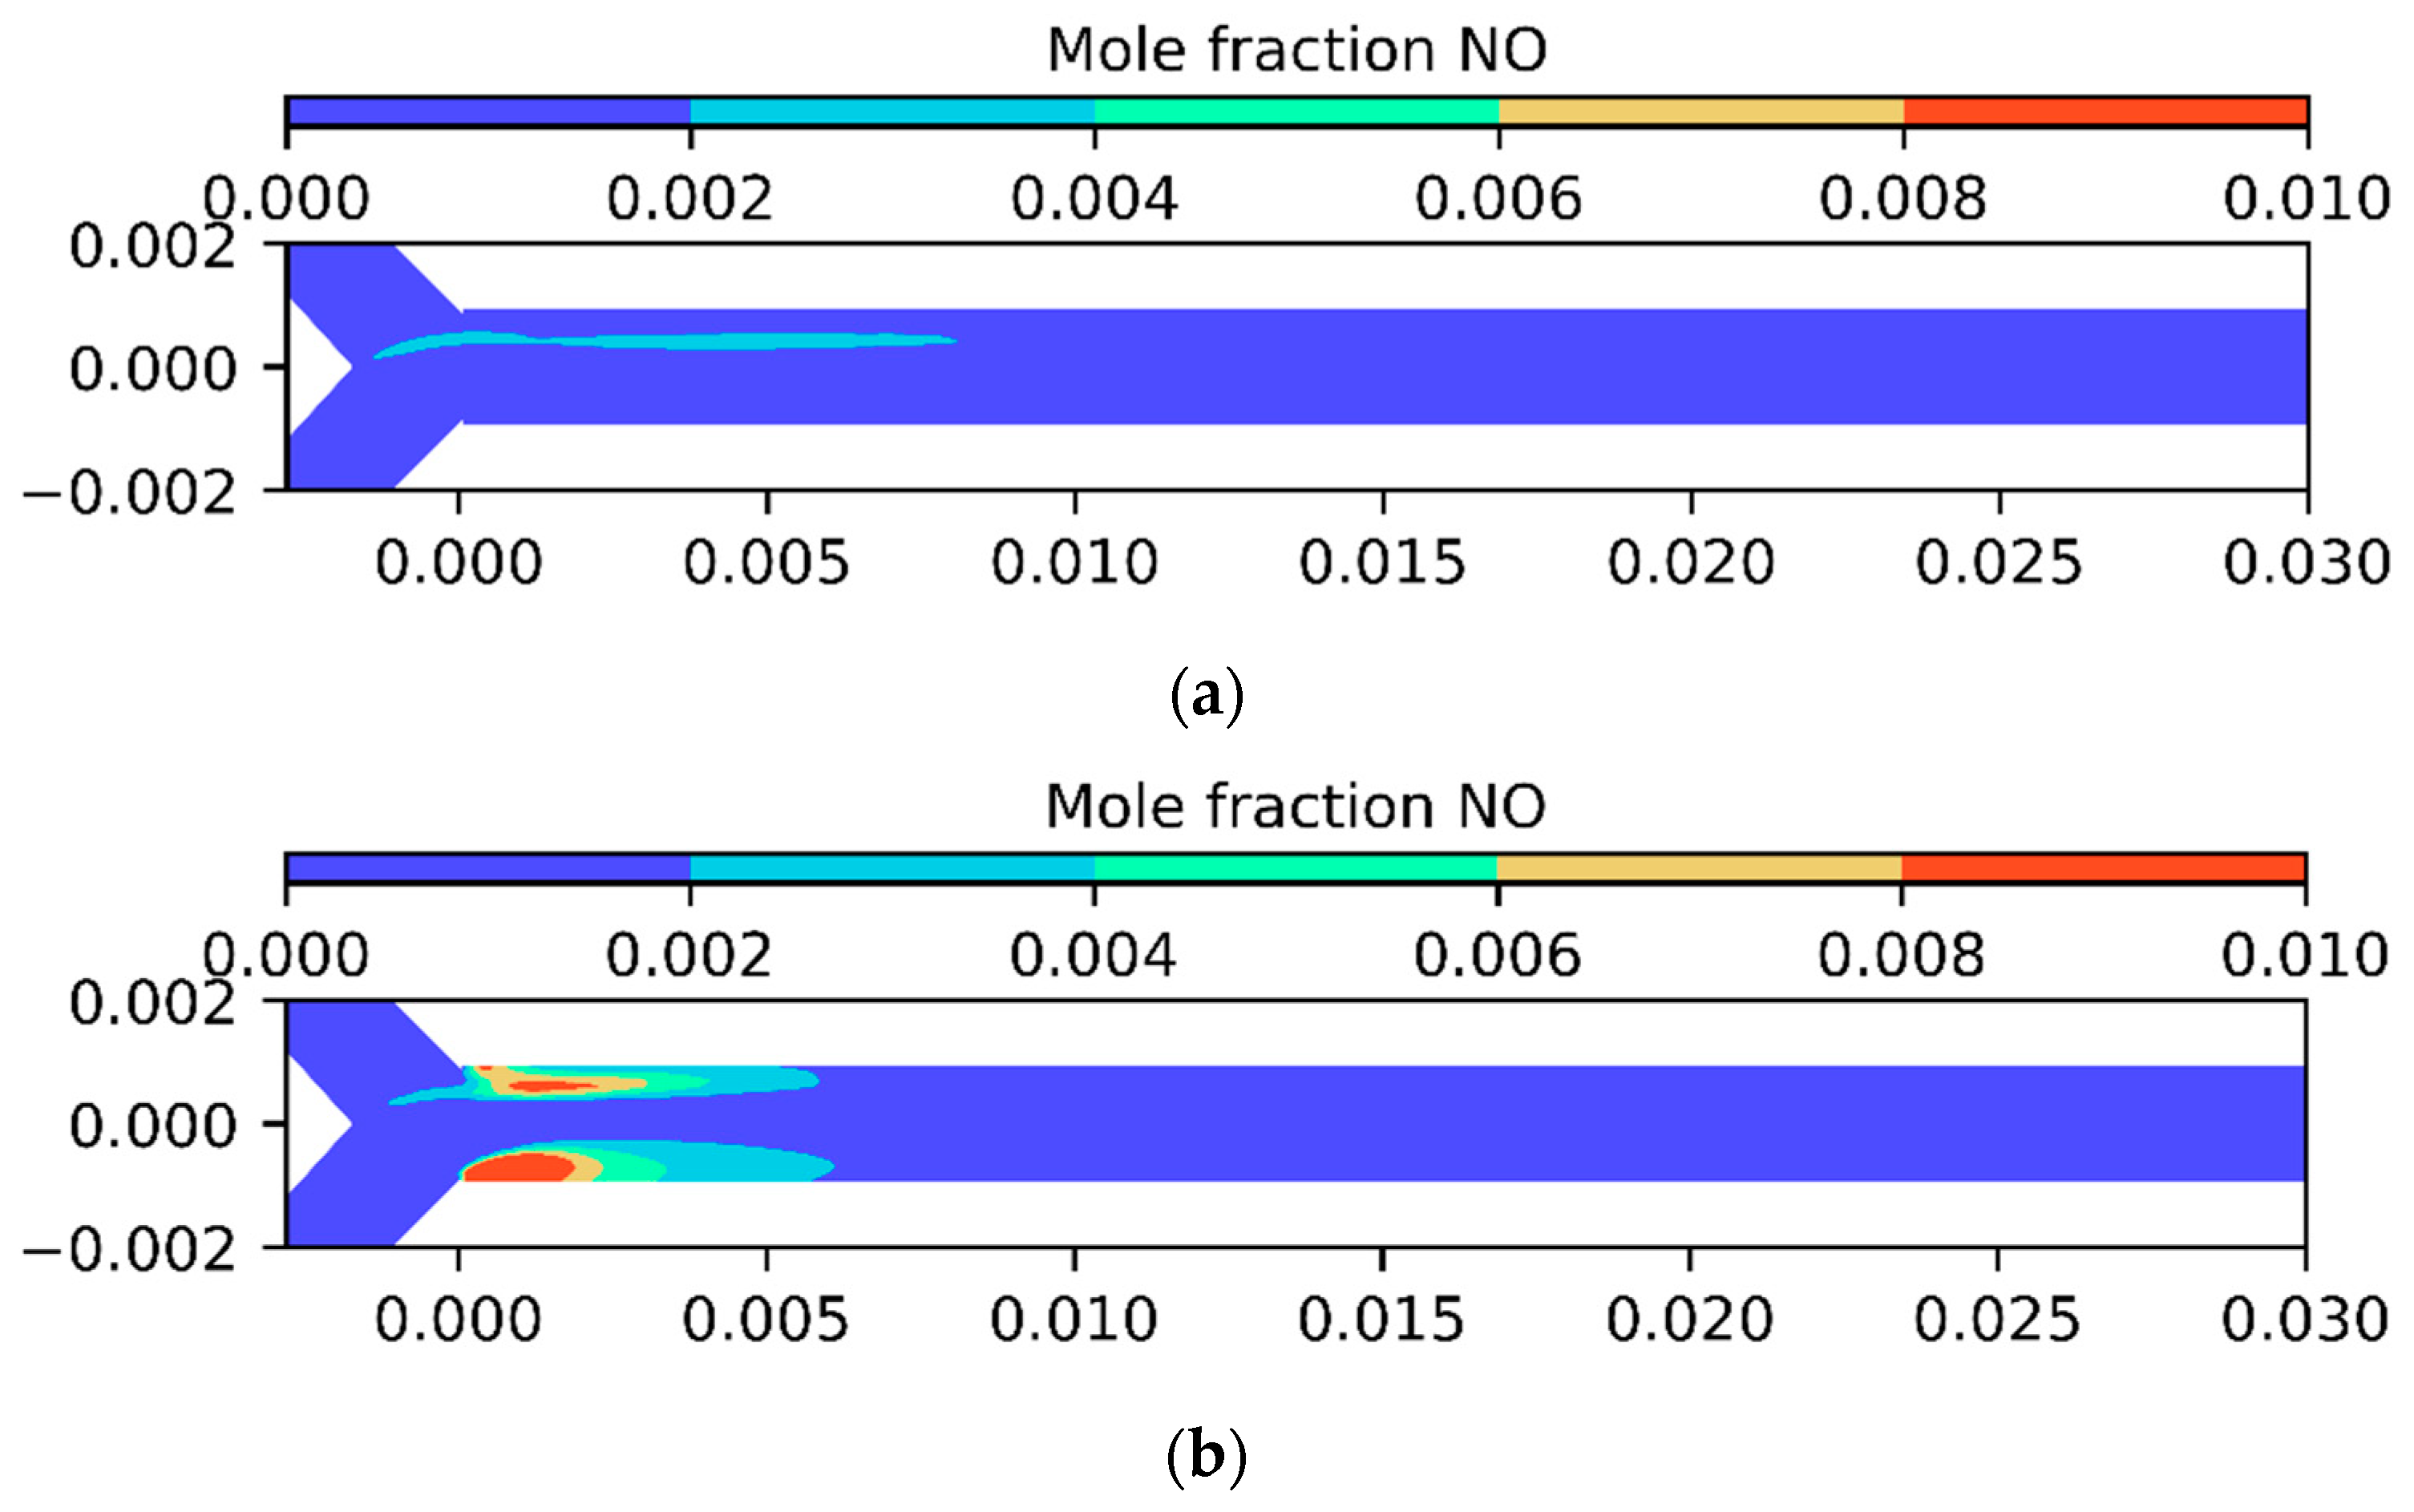
5.2. Plasma Assisted Combustion Results
6. Conclusions
- The influence of plasma is impactful, maintaining a stationary flame in the duct.
- The PAC model enhanced the reliability in non-premixed conditions considering the local plasma region.
- The results highlighted the fundamental role of kinetic effects, which cannot be neglected. This underscores the novelty of our approach compared to the PAC steady-state methods in the literature, which only consider momentum and energy effects in CFD models. The effect of plasma is also significant at very low equivalence ratios, such as 0.1.
- Additional experimental investigations are required to ensure comprehensive validation of the proposed model. Moreover, further studies on PIC are necessary for the function of the local concentration, providing a more comprehensive evaluation of the model’s effectiveness.
Author Contributions
Funding
Data Availability Statement
Conflicts of Interest
References
- Abdelbasir, S.M.; El-Sheltawy, C.T.; Abdo, D.M. Green Processes for Electronic Waste Recycling: A Review. J. Sustain. Metall. 2018, 4, 295–311. [Google Scholar] [CrossRef]
- Kaisare, N.S.; Vlachos, D.G. A review on microcombustion: Fundamentals, devices and applications. Prog. Energy Combust. Sci. 2012, 38, 321–359. [Google Scholar] [CrossRef]
- E, J.; Ding, J.; Chen, J.; Liao, G.; Zhang, F.; Luo, B. Process in micro-combustion and energy conversion of micro power system: A review. Energy Convers. Manag. 2021, 246, 114664. [Google Scholar] [CrossRef]
- Fu, L.; Feng, Z.; Li, G. Experimental investigation on overall performance of a millimeter-scale radial turbine for micro gas turbine. Energy 2017, 134, 1–9. [Google Scholar] [CrossRef]
- Giorgi, M.G.D.; Cinieri, G.; Marseglia, G.; Shah, Z.A.; Mehdi, G. Combustion Efficiency of Carbon-neutral Fuel using Micro-Combustor Designed for Aerospace Applications. J. Phys. Conf. Ser. 2024, 2716, 012091. [Google Scholar] [CrossRef]
- Fernandez-Pello, A.C. Micropower generation using combustion: Issues and approaches. Proc. Combust. Inst. 2002, 29, 883–899. [Google Scholar] [CrossRef]
- Walther, D.C.; Ahn, J. Advances and challenges in the development of power-generation systems at small scales. Prog. Energy Combust. Sci. 2011, 37, 583–610. [Google Scholar] [CrossRef]
- Bieri, J.A.; Matalon, M. Edge flames stabilized in a non-premixed microcombustor. Combust. Theory Model. 2011, 15, 911–932. [Google Scholar] [CrossRef]
- Nauman, M.; Pan, J.; Wang, Y.; Li, F.; Oluwaleke Ojo, A.; Raza, A. A review of recent advancements in micro combustion techniques to enhance flame stability and fuel residence time. Int. J. Hydrogen Energy 2024, 49, 1165–1193. [Google Scholar] [CrossRef]
- Peng, Q.; Yang, W.; E, J.; Xu, H.; Li, Z.; Yu, W.; Tu, Y.; Wu, Y. Experimental investigation on premixed hydrogen/air combustion in varied size combustors inserted with porous medium for thermophotovoltaic system applications. Energy Convers. Manag. 2019, 200, 112086. [Google Scholar] [CrossRef]
- Bani, S.; Pan, J.; Tang, A.; Lu, Q.; Zhang, Y. Micro combustion in a porous media for thermophotovoltaic power generation. Appl. Therm. Eng. 2018, 129, 596–605. [Google Scholar] [CrossRef]
- Rahbari, A.; Homayoonfar, S.; Valizadeh, E.; Aligoodarz, M.R.; Toghraie, D. Effects of micro-combustor geometry and size on the heat transfer and combustion characteristics of premixed hydrogen/air flames. Energy 2021, 215, 119061. [Google Scholar] [CrossRef]
- Qian, P.; Liu, M.; Li, X.; Xie, F.; Huang, Z.; Luo, C.; Zhu, X. Effects of bluff-body on the thermal performance of micro thermophotovoltaic system based on porous media combustion. Appl. Therm. Eng. 2020, 174, 115281. [Google Scholar] [CrossRef]
- Mehdi, G.; Bonuso, S.; De Giorgi, M.G. Plasma Assisted Re-Ignition of Aeroengines under High Altitude Conditions. Aerospace 2022, 9, 66. [Google Scholar] [CrossRef]
- Mehdi, G.; Fontanarosa, D.; Bonuso, S.; Giorgi, M.G.D. Ignition thresholds and flame propagation of methane-air mixture: Detailed kinetic study coupled with electrical measurements of the nanosecond repetitively pulsed plasma discharges. J. Phys. D Appl. Phys. 2022, 55, 315202. [Google Scholar] [CrossRef]
- Lacoste, D.A. Flames with plasmas. Proc. Combust. Inst. 2023, 39, 5405–5428. [Google Scholar] [CrossRef]
- Deng, J.; Wang, P.; Sun, Y.; Zhou, J.; Luo, Y.; He, D. Design and experimental investigation of a dual swirl combined DBD plasma combustor head actuator. Sens. Actuators A Phys. 2022, 344, 113707. [Google Scholar] [CrossRef]
- De Giorgi, M.G.; Ficarella, A.; Marra, F.; Pescini, E. Micro DBD plasma actuators for flow separation control on a low pressure turbine at high altitude flight operating conditions of aircraft engines. Appl. Therm. Eng. 2017, 114, 511–522. [Google Scholar] [CrossRef]
- Li, G.; Jiang, X.; Zhu, J.; Yang, J.; Liu, C.; Mu, Y.; Xu, G. Combustion control using a lobed swirl injector and a plasma swirler. Appl. Therm. Eng. 2019, 152, 92–102. [Google Scholar] [CrossRef]
- Feng, R.; Huang, Y.; Zhu, J.; Wang, Z.; Sun, M.; Wang, H.; Cai, Z. Ignition and combustion enhancement in a cavity-based supersonic combustor by a multi-channel gliding arc plasma. Exp. Therm. Fluid Sci. 2021, 120, 110248. [Google Scholar] [CrossRef]
- Zhao, Q.; Mao, B.; Bai, X.; Zhao, J.; Chen, C.; Zhang, X.; Wei, S.; Gao, Q. Experimental investigation of the discharge and thermal characteristics of an alternating current dielectric-barrier discharge plasma reactor. Appl. Therm. Eng. 2022, 217, 119276. [Google Scholar] [CrossRef]
- De Giorgi, M.G.; Traficante, S.; Ficarella, A. Performance Improvement of Turbomachinery Using Plasma Actuators. In Proceedings of the Volume 7: Turbomachinery, Parts A, B, and C; ASMEDC: Vancouver, BC, Canada, 2011; pp. 369–380. [Google Scholar]
- De Giorgi, M.G.; Pescini, E.; Marra, F.; Ficarella, A. Plasma actuator scaling down to improve its energy conversion efficiency for active flow control in modern turbojet engines compressors. Appl. Therm. Eng. 2016, 106, 334–350. [Google Scholar] [CrossRef]
- De Giorgi, M.G.; Motta, V.; Suma, A. Influence of actuation parameters of multi-DBD plasma actuators on the static and dynamic behaviour of an airfoil in unsteady flow. Aerosp. Sci. Technol. 2020, 96, 105587. [Google Scholar] [CrossRef]
- Pescini, E.; Marra, F.; De Giorgi, M.G.; Francioso, L.; Ficarella, A. Investigation of the boundary layer characteristics for assessing the DBD plasma actuator control of the separated flow at low Reynolds numbers. Exp. Therm. Fluid Sci. 2017, 81, 482–498. [Google Scholar] [CrossRef]
- Dou, S.; Tao, L.; Wang, R.; El Hankari, S.; Chen, R.; Wang, S. Plasma-Assisted Synthesis and Surface Modification of Electrode Materials for Renewable Energy. Adv. Mater. 2018, 30, 1705850. [Google Scholar] [CrossRef]
- Rodrigues, F.; Pascoa, J.; Trancossi, M. Heat generation mechanisms of DBD plasma actuators. Exp. Therm. Fluid Sci. 2018, 90, 55–65. [Google Scholar] [CrossRef]
- Ju, Y.; Sun, W. Plasma assisted combustion: Dynamics and chemistry. Prog. Energy Combust. Sci. 2015, 48, 21–83. [Google Scholar] [CrossRef]
- Plasma-Assisted Ignition and Combustion—ScienceDirect. Available online: https://www.sciencedirect.com/science/article/pii/S0360128512000354 (accessed on 29 July 2024).
- Plasma Supported Combustion—ScienceDirect. Available online: https://www.sciencedirect.com/science/article/pii/S0082078404003285 (accessed on 29 July 2024).
- A Review of Recent Studies and Emerging Trends in Plasma-Assisted Combustion of Ammonia as an Effective Hydrogen Carrier—ScienceDirect. Available online: https://www.sciencedirect.com/science/article/pii/S0360319923025909 (accessed on 29 July 2024).
- Feng, R.; Zhu, J.; Wang, Z.; Zhang, F.; Ban, Y.; Zhao, G.; Tian, Y.; Wang, C.; Wang, H.; Cai, Z.; et al. Suppression of combustion mode transitions in a hydrogen-fueled scramjet combustor by a multi-channel gliding arc plasma. Combust. Flame 2022, 237, 111843. [Google Scholar] [CrossRef]
- Li, Q.; Zhu, J.; Tian, Y.; Sun, M.; Wan, M.; Yan, B.; Luo, T.; Sun, Y.; Wang, C.; Tang, T.; et al. Investigation of ignition and flame propagation in an axisymmetric supersonic combustor with laser-induced plasma. Phys. Fluids 2023, 35, 125133. [Google Scholar] [CrossRef]
- Tian, Y.; Zhu, J.; Sun, M.; Wang, H.; Huang, Y.; Feng, R.; Yan, B.; Sun, Y.; Cai, Z. Enhancement of blowout limit in a Mach 2.92 cavity-based scramjet combustor by a gliding arc discharge. Proc. Combust. Inst. 2023, 39, 5697–5705. [Google Scholar] [CrossRef]
- Patel, R.; Peelen, R.; van Oijen, J.; Dam, N.; Nijdam, S. How pulse energy affects ignition efficiency of DBD plasma-assisted combustion. J. Phys. D Appl. Phys. 2023, 57, 025501. [Google Scholar] [CrossRef]
- Ignition of Ethylene–Air and Methane–Air Flows by Low-Temperature Repetitively Pulsed Nanosecond Discharge Plasma | IEEE Journals & Magazine | IEEE Xplore. Available online: https://ieeexplore.ieee.org/document/4392533 (accessed on 29 July 2024).
- Pavan, C.A. Nanosecond Pulsed Plasmas in Dynamic Combustion Environments. Ph.D. Thesis, Massachusetts Institute of Technology, Cambridge, MA, USA, 2023. [Google Scholar]
- Hazenberg, T.; Janssen, J.F.J.; van Dijk, J.; van Oijen, J.A. Consistent thermodynamics for plasma-assisted combustion. Proc. Combust. Inst. 2023, 39, 5541–5549. [Google Scholar] [CrossRef]
- Rekkas-Ventiris, G.; Duarte Gomez, A.; Deak, N.; Kincaid, N.; Pepiot, P.; Bisetti, F.; Bellemans, A. A novel machine learning based lumping approach for the reduction of large kinetic mechanisms for plasma-assisted combustion applications. Combust. Flame 2024, 260, 113252. [Google Scholar] [CrossRef]
- Shahsavari, M.; Konnov, A.A.; Bai, X.-S.; Valera-Medina, A.; Li, T.; Jangi, M. Synergistic effects of nanosecond plasma discharge and hydrogen on ammonia combustion. Fuel 2023, 348, 128475. [Google Scholar] [CrossRef]
- Mackay, K.K.; Johnson, H.T.; Freund, J.B. Field-emission plasma enhancement of H2–O2 micro-combustion. Plasma Sources Sci. Technol. 2020, 29, 045014. [Google Scholar] [CrossRef]
- Shivkumar, G.; Tholeti, S.S.; Alexeenko, A.A. Microchannel Flow Enhancement by Microplasma Actuation. In Proceedings of the ASME 2015 13th International Conference on Nanochannels, Microchannels, and Minichannels Collocated with the ASME 2015 International Technical Conference and Exhibition on Packaging and Integration of Electronic and Photonic Microsystems, American Society of Mechanical Engineers Digital Collection, San Francisco, CA, USA, 6–9 July 2015. [Google Scholar]
- Alexeenko, A.A.; Strongrich, A.D.; Cofer, A.G.; Pikus, A.; Sebastiao, I.B.; Tholeti, S.S.; Shivkumar, G. Microdevices enabled by rarefied flow phenomena. AIP Conf. Proc. 2016, 1786, 080001. [Google Scholar] [CrossRef]
- Xiang, Y.; Wang, S.; Yuan, Z.; Fan, A. Effects of channel length on propagation behaviors of non-premixed H2-air flames in Y-shaped micro combustors. Int. J. Hydrogen Energy 2020, 45, 20449–20457. [Google Scholar] [CrossRef]
- Xiang, Y.; Yuan, Z.; Wang, S.; Fan, A. Effects of flow rate and fuel/air ratio on propagation behaviors of diffusion H2/air flames in a micro-combustor. Energy 2019, 179, 315–322. [Google Scholar] [CrossRef]
- Cinieri, G.; Fontanarosa, D.; De Giorgi, M.G. Combustion Characteristics of Hydrogen/Air Mixtures in a Plasma-Assisted Micro Combustor. Energies 2023, 16, 2272. [Google Scholar] [CrossRef]
- Cinieri, G.; Shah, Z.A.; Marseglia, G.; De Giorgi, M.G. Toward Zero Carbon Emissions: Investigating the Combustion Performance of Shaped Microcombustors Using H2/Air and NH3/Air Mixtures. Aerospace 2023, 11, 12. [Google Scholar] [CrossRef]
- Dawson, J.M. Particle simulation of plasmas. Rev. Mod. Phys. 1983, 55, 403–447. [Google Scholar] [CrossRef]
- Hockney, R.W.; Eastwood, J.W. Computer Simulation Using Particles; CRC Press: Boca Raton, FL, USA, 2021; ISBN 978-0-367-80693-4. [Google Scholar]
- The Plasma Theory and Simulation Group. Available online: https://ptsg.egr.msu.edu/ (accessed on 17 July 2023).
- Pancheshnyi, S.; Eismann, B.; Hagelaar, G.; Pitchford, L.C. ZDPlasKin: A new tool for plasmachemical simulations. In Proceedings of the APS Meetings: 61st Annual Gaseous Electronics Conference, Dallas, TX, USA, 13–17 October 2008. [Google Scholar]
- Orlov, D.; Apker, T.; He, C.; Othman, H.; Corke, T. Modeling and Experiment of Leading Edge Separation Control Using SDBD Plasma Actuators. In Proceedings of the 45th AIAA Aerospace Sciences Meeting and Exhibit, Reno, NV, USA, 8–11 January 2007. [Google Scholar] [CrossRef]
- Ansys|Engineering Simulation Software. Available online: https://www.ansys.com/ (accessed on 20 July 2023).
- Burke, M.P.; Chen, Z.; Ju, Y.; Dryer, F.L. Effect of cylindrical confinement on the determination of laminar flame speeds using outwardly propagating flames. Combust. Flame 2009, 156, 771–779. [Google Scholar] [CrossRef]
- Pareja, J.; Burbano, H.J.; Ogami, Y. Measurements of the laminar burning velocity of hydrogen–air premixed flames. Int. J. Hydrogen Energy 2010, 35, 1812–1818. [Google Scholar] [CrossRef]
- Alekseev, V.A.; Christensen, M.; Konnov, A.A. The effect of temperature on the adiabatic burning velocities of diluted hydrogen flames: A kinetic study using an updated mechanism. Combust. Flame 2015, 162, 1884–1898. [Google Scholar] [CrossRef]
- Konnov, A.A. On the role of excited species in hydrogen combustion. Combust. Flame 2015, 162, 3755–3772. [Google Scholar] [CrossRef]
- Mao, X.; Chen, Q.; Rousso, A.C.; Chen, T.Y.; Ju, Y. Effects of controlled non-equilibrium excitation on H2/O2/He ignition using a hybrid repetitive nanosecond and DC discharge. Combust. Flame 2019, 206, 522–535. [Google Scholar] [CrossRef]


| Geometric Features | Test Case Geometric Parameters [m] |
|---|---|
| Streamwise Electrodes gap | 4 × 10⁻⁶ |
| Electrodes Thickness | 1 × 10⁻⁶ |
| Dielectric thickness | 1.2 × 10⁻⁵ |
| Electrodes length | 1 × 10⁻⁴ |
| Electrodes width | 1.57 × 10⁻³ |
| Frequency | 1 GHz |
| Amplitude | 162.5 V |
| Fowler-Nordheim Equation Constants | |
|---|---|
| AFN | 1.54 × 10⁻⁶ |
| βFN | 50.0 |
| CvFN | 0 |
| BvFN | 6.8308 × 10⁹ |
| CyFN | 3.79 × 10⁻⁵ |
| φVFN | 4.0 |
| Species Type | Molecules |
|---|---|
| Elements | N, H, O |
| Charged particles | N+ N2+ N3+ N4+ O+ O2+ O4+ O− O2− O3− O4− NO+ N2O+ NO− N2O− NO2− NO3− O2+ E H+ H2+ |
| Excited species | O2(V1), O2(V2), O2(V3), O2(V4), O2(A1), O2(B1), O2(4.5EV), N2(V1), N2(V2), N2(V3), N2(V4), OH* |
| Chemical Species | Molar Fraction |
|---|---|
| H | 2.67 × 10⁻¹ |
| H2 | 2.29 × 10⁻⁸ |
| O | 1.31 × 10⁻¹ |
| O2 | 1.01 × 10⁻⁴ |
| OH | 7.19 × 10⁻⁶ |
| H2O | 1.24 × 10⁻¹⁰ |
| HO2 | 3.61 × 10⁻⁵ |
| H2O2 | 4.13 × 10⁻¹⁹ |
| HE | 6.01 × 10⁻¹ |
| O2 | 1.31 × 10⁻³ |
| Hazenberg et al. [38] | Our Analysis Values [particles/m3] | |
|---|---|---|
| Max ions density | 3.6 × 10²⁰ | 6.0 × 10¹⁹ |
| Average ions density | 1.40 × 10¹⁸ | 1.41 × 10¹⁸ |
| Max electrons density | 2.0 × 10¹⁹ | 6.0 × 10¹⁹ |
Disclaimer/Publisher’s Note: The statements, opinions and data contained in all publications are solely those of the individual author(s) and contributor(s) and not of MDPI and/or the editor(s). MDPI and/or the editor(s) disclaim responsibility for any injury to people or property resulting from any ideas, methods, instructions or products referred to in the content. |
© 2024 by the authors. Licensee MDPI, Basel, Switzerland. This article is an open access article distributed under the terms and conditions of the Creative Commons Attribution (CC BY) license (https://creativecommons.org/licenses/by/4.0/).
Share and Cite
Cinieri, G.; Mehdi, G.; De Giorgi, M.G. Multiscale Modeling of Plasma-Assisted Non-Premixed Microcombustion. Aerospace 2024, 11, 697. https://doi.org/10.3390/aerospace11090697
Cinieri G, Mehdi G, De Giorgi MG. Multiscale Modeling of Plasma-Assisted Non-Premixed Microcombustion. Aerospace. 2024; 11(9):697. https://doi.org/10.3390/aerospace11090697
Chicago/Turabian StyleCinieri, Giacomo, Ghazanfar Mehdi, and Maria Grazia De Giorgi. 2024. "Multiscale Modeling of Plasma-Assisted Non-Premixed Microcombustion" Aerospace 11, no. 9: 697. https://doi.org/10.3390/aerospace11090697