Review

The Determination of Criticality for Ice Shapes Based on CCAR-25

1
School of Automation, Northwestern Polytechnical University, Xi’an 710072, China
2
Shanghai Aircraft Design and Research Institute, Shanghai 201210, China
3
School of Aerospace Engineering, Tsinghua University, Beijing 100084, China
*
Author to whom correspondence should be addressed.
Aerospace 2024, 11(9), 710; https://doi.org/10.3390/aerospace11090710 (registering DOI)
Submission received: 13 May 2024 / Revised: 20 August 2024 / Accepted: 26 August 2024 / Published: 31 August 2024
(This article belongs to the Special Issue Deicing and Anti-Icing of Aircraft (Volume III))

Abstract

:
Determining the criticality of ice shapes is a necessary condition for verifying compliance with icing airworthiness regulations. However, the clear, concise, and applicable criterion based on the geometric characteristics of ice shapes has not been clearly given out by current advisory circulars. To address this problem, this paper summarizes aerodynamic performance items and recommended ice shapes the latest version of CCAR-25 and corresponding advisory circulars for a variety of flight phases, including takeoff, holding, en route, DTO, etc., instead of the single phase of holding in the previous research. Based on the geometric classification of the ice shapes, the dominant parameters of various ice shapes are clarified by the correlation between the geometric parameters and aerodynamic effects. The geometric parameters to determine the criticality of specific ice shapes are defined as the roughness height and range for the roughness ice and the total projection height in the direction of lift for the horn ice. On this basis, the detailed determination criterion of critical ice shape geometries corresponding to different flight phases and aircraft components is formulated, which will provide an operational selection methodology for determining the geometries of critical ice shapes at the airworthiness certification stage.

1. Introduction

Icing is a serious threat to the safety of flight [1,2]. According to the databases of NTSB and ASRS, 228 icing-related accidents and 30 inflight-icing-related incidents were revealed from 2006 to 2010, and 40 accidents were related to inflight icing occurring on the wings, fuselage, or control surfaces [3]. The fatal accidents caused by icing in recent years include the crashes of the ATR-72-212 (ATR, Toulouse, France) in Cuba in 2010 and the Saab-340A (Saab AB, Linköping, Sweden) in Argentina in 2011, where the icing condition under the en route phase surpassed the ice protection and led to a loss of control [4], which indicates that flight safety under icing conditions still remains a focus concern. The verification of compliance with icing-related regulations is a key part of civil aircraft airworthiness certification. In the process of obtaining certification for icing airworthiness, it is necessary to check the controllability, stability, and performance of the aircraft after icing under each specific flight state so as to demonstrate the capability to ensure flight safety under the icing conditions [5,6,7].
Compliance with regulations on icing airworthiness is usually demonstrated based on a combination of computational analysis, wind tunnel testing, dry-air flight, and natural icing flight. The critical ice shape is the foundation as well as the basic input for this procedure. According to AC 25.1419 [8], in order to carry out the analysis of aerodynamic performance under icing conditions for the verification of airworthiness, the critical ice shapes must first be determined under various flight states and atmospheric conditions.
The definitions of critical ice shapes can be found in the corresponding advisory circulars. The AC 20-73A [9] defines the critical ice shape as the aircraft surface ice that forms under the required icing conditions and has the most adverse effects for specific flight safety requirements. AC 25-25 [10] states that the most critical ice shape in terms of handling characteristics and/or performance for each flight phase should be determined. Meanwhile, the advisory circulars not only provide the definition but also the important factors, such as flight conditions, that need to be considered when determining the critical ice shape. They also point out that the critical ice shapes of different components may be different for specific flight stages and configurations. AC 20-73A [9] states that it is necessary to determine the critical ice shape for the different flight characteristics according to the concerned flight phases. Based on the definition of ice shape for the various flight phases in AC 25-25 [10] provides recommendations of the appropriate ice shape for the subject to be examined. Some more detailed descriptions of the characteristics of ice shapes for the different flight phases are also provided.
In recent years, the sensitivity analysis of ice shapes on aerodynamic performance has been widely carried out, which forms an important background for this study about the determination of the criticality of ice shapes in view of geometry parameters. The effect of roughness parameters on aerodynamic degeneration was studied by Broeren [11]. A methodology for predicting the effects of glaze ice geometry on airfoil aerodynamic coefficients by using neural network prediction was proposed by Cao [12]. An available icing certification concerning the various critical ice shapes was outlined by Hu [13]. The sensitivity of ice shape attributes and ice mass to five critical physical and modeling parameters was investigated by Raj [14]. Oztekin [15] performed a parametric study on the aerodynamics of ice accretions on airfoils. A parametric investigation of aerodynamic performance degradation due to icing was carried out by Nath [16]. However, with the current engineering practice of airworthiness for civil aircraft, the following aspects of determining the criticality of ice shapes still remain to be solved:
(1)
Although the above advisory circulars have given a detailed explanation and analysis of the definition and application principles of critical ice shapes, while the aerodynamic effects of various ice shapes have been revealed in available literature [17], the applicable criterion of determining the critical ice shapes in terms of geometric characteristics has not been clearly given out, namely, how to determine the criticality for ice shapes with certain and limited geometric parameters from a variety of effect factors. Moreover, the previous works mainly focused on the selection of the critical icing conditions [18], where the aerodynamic effects are usually ignored, though it is the final step of the entire process.
(2)
According to the latest version of CCAR-25 and AC 20-73A, the determination of criticality for ice shapes should be performed under different flight phases, including takeoff, holding, en route, etc., instead of the previous requirement of only holding. According to the available results of aerodynamic performance after icing, even for the same flight phase, the corresponding critical ice shapes may be diverse for different configurations and components of aircraft; however, both the current airworthiness regulations and the related advisory circulars do not give corresponding guidance or suggestions about the geometric definition of critical ice shapes, which increases the complexity of the problem [19,20,21].
Therefore, to address these problems, according to the aerodynamic performance required to be examined under the icing conditions of different flight phases defined in CCAR-25, this paper sorted the ice shapes according to the factors to be considered in the advisory circulars in terms of geometry characteristics first. Then, the criticality of ice shapes is revealed according to the correlation between their geometric characteristics and aerodynamic performance. As a result, the criteria for determining the critical ice shapes corresponding to different flight phases and aircraft components are summarized so as to provide a reference for determining the critical ice shapes at the stage of airworthiness certification. It should be pointed out that the current study was mainly based on open publications and data; our own experiments in wind tunnels and numerical simulation were not conducted unless otherwise indicated.

2. The Classification of Ice Shapes According to the Airworthiness Regulations

In the latest version of CCAR-25, the icing conditions used to demonstrate compliance with Division B are defined, and requirements for the contents to be examined and verified after icing are also given, which mainly include performance, stability, controllability, trimming and stalling, etc. [7]. For the contents of stability and maneuvering involved in Division B, as well as the ice shapes defined for each phase of flight, AC 25-25 [10] gives recommendations for the corresponding ice shapes for each subject. Thus, according to the flight performance in the icing airworthiness validations under each phase of flight, the concerned aerodynamic performance is summarized, respectively, as shown in Table 1.
According to geometric characteristics, the ice shapes can be defined as roughness ice, horn ice, and streamwise ice [17]. Thus, the recommended ice shapes listed in Table 1 can be further classified according to the geometric characteristics and statistics of ice accretion in each flight phase, as shown in Table 2, where the small or large size of horn ice is a relative quantification that depends on the height of the horn generated in a specific meteorological condition. Then, by analyzing the effect of ice shapes with different geometric parameters on aerodynamic performance, the criticality of ice shapes under the corresponding flight phase can be determined. For each flight phase, a certain geometric parameter will be given to determine the criticality of the ice shapes.

3. The Criticality of Ice Shapes with Different Geometric Characteristics

The effect on the aerodynamic performance of different geometric characteristics is the basis for the determination of the critical ice shapes. NASA has conducted a comprehensive study on ice accretion and the corresponding aerodynamic effect [17,22]. Based on these studies, this paper will discuss the criticality of ice shapes according to the aerodynamic effect.

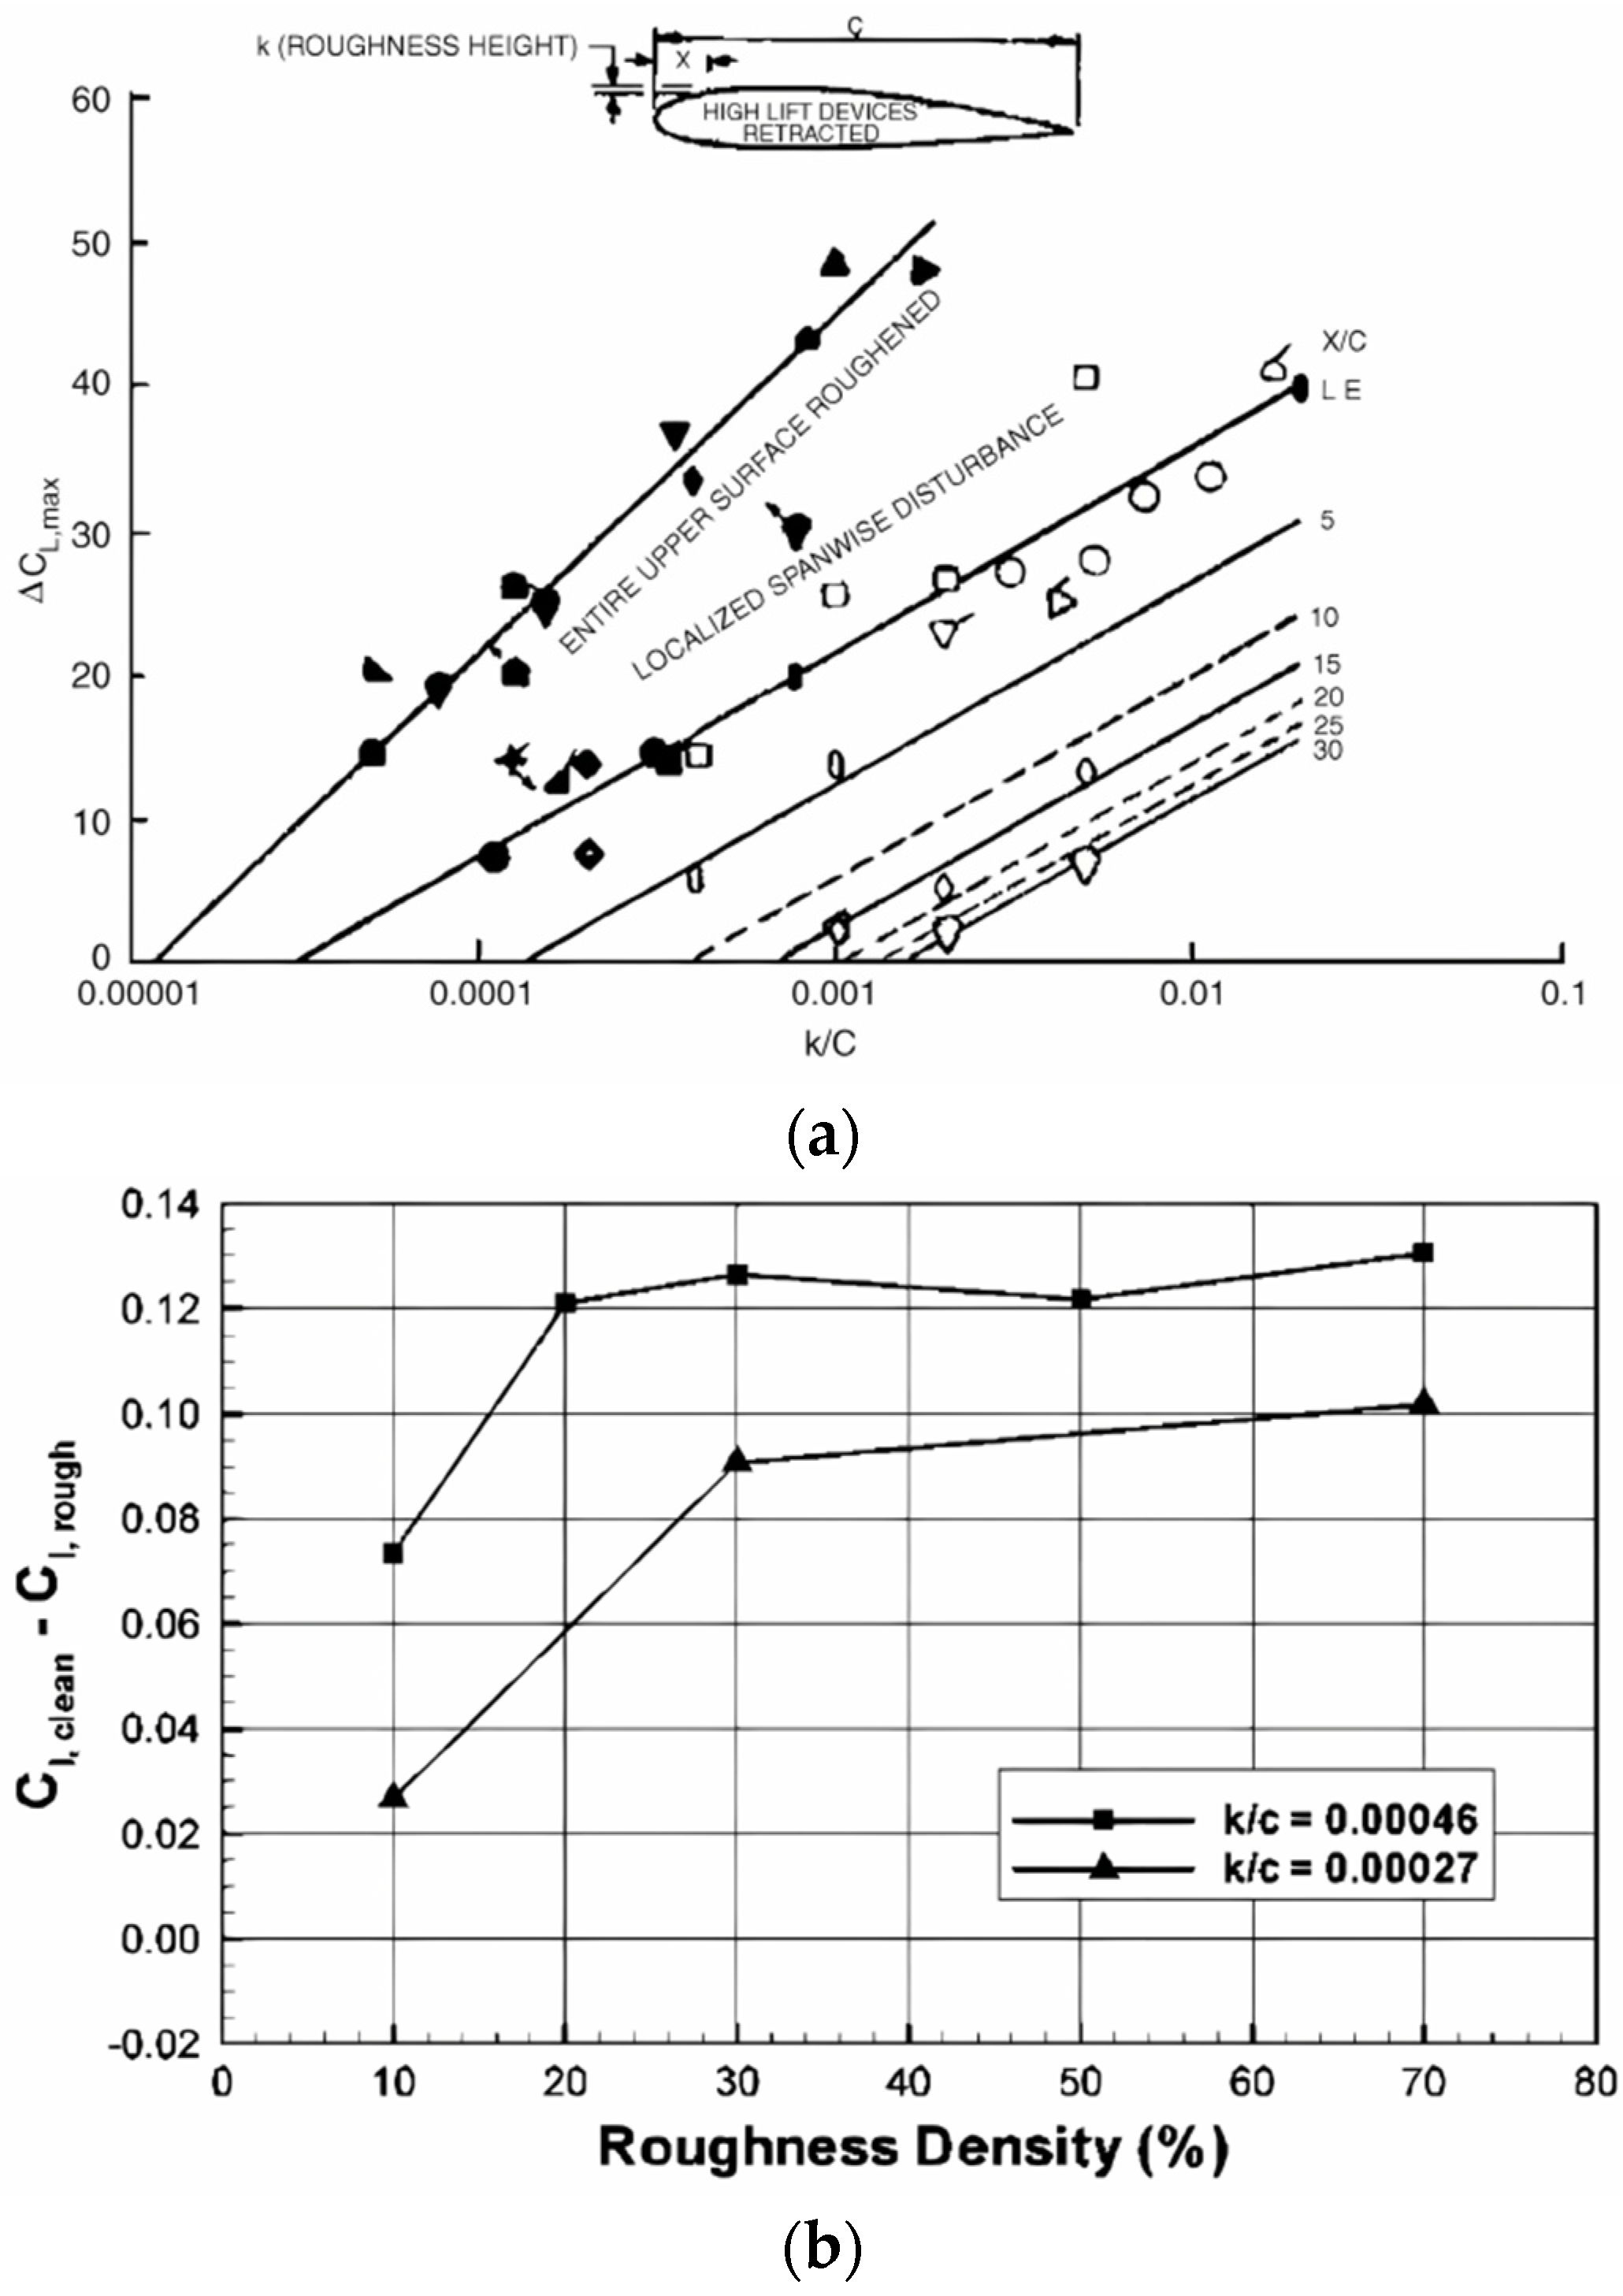
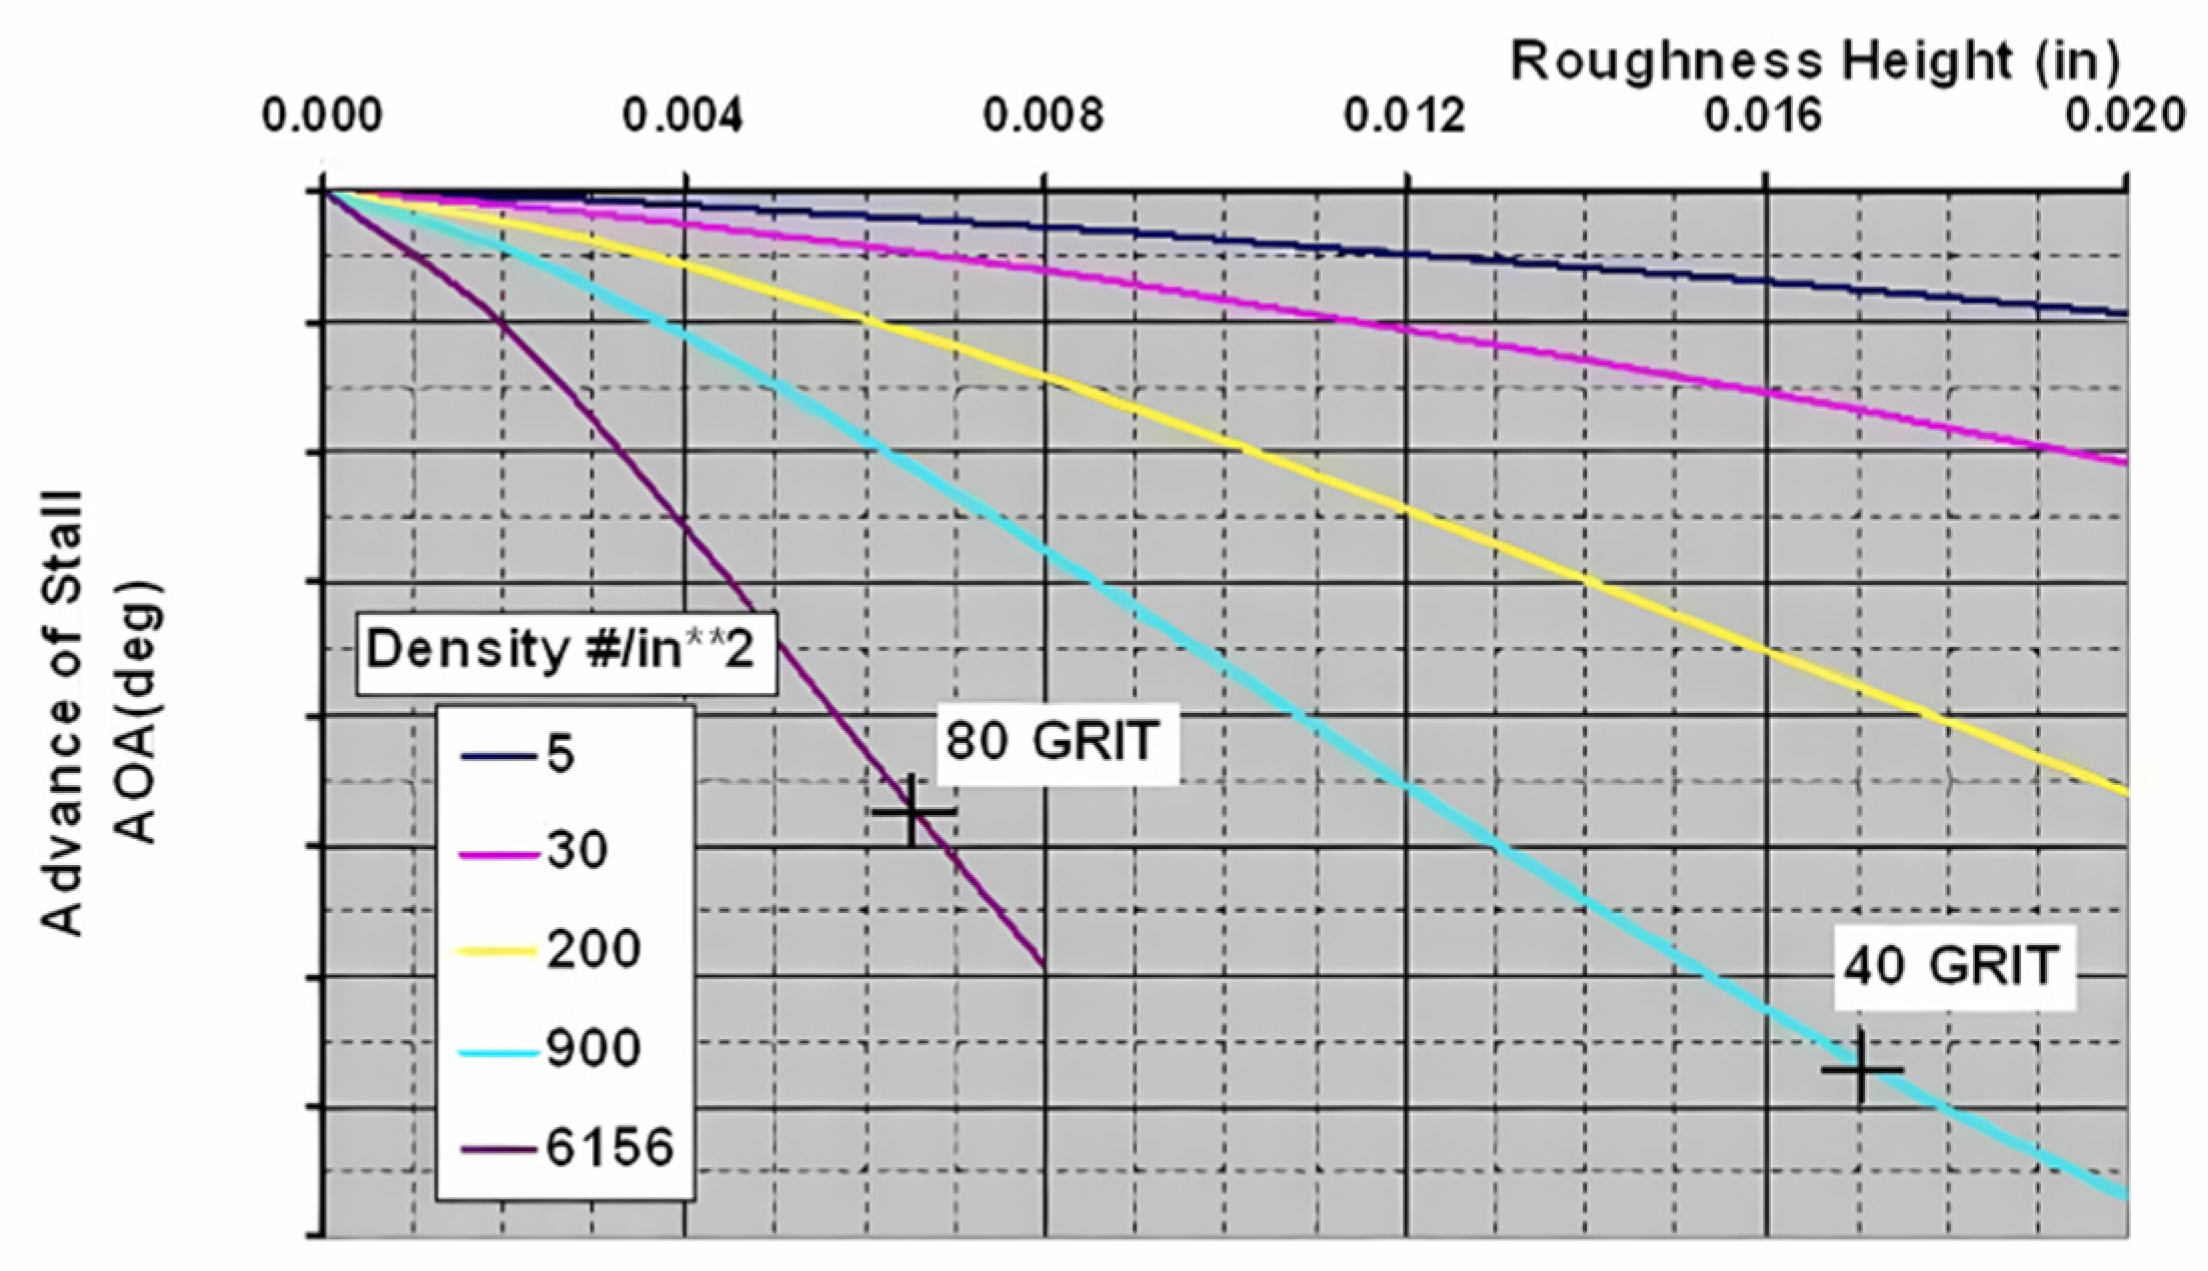
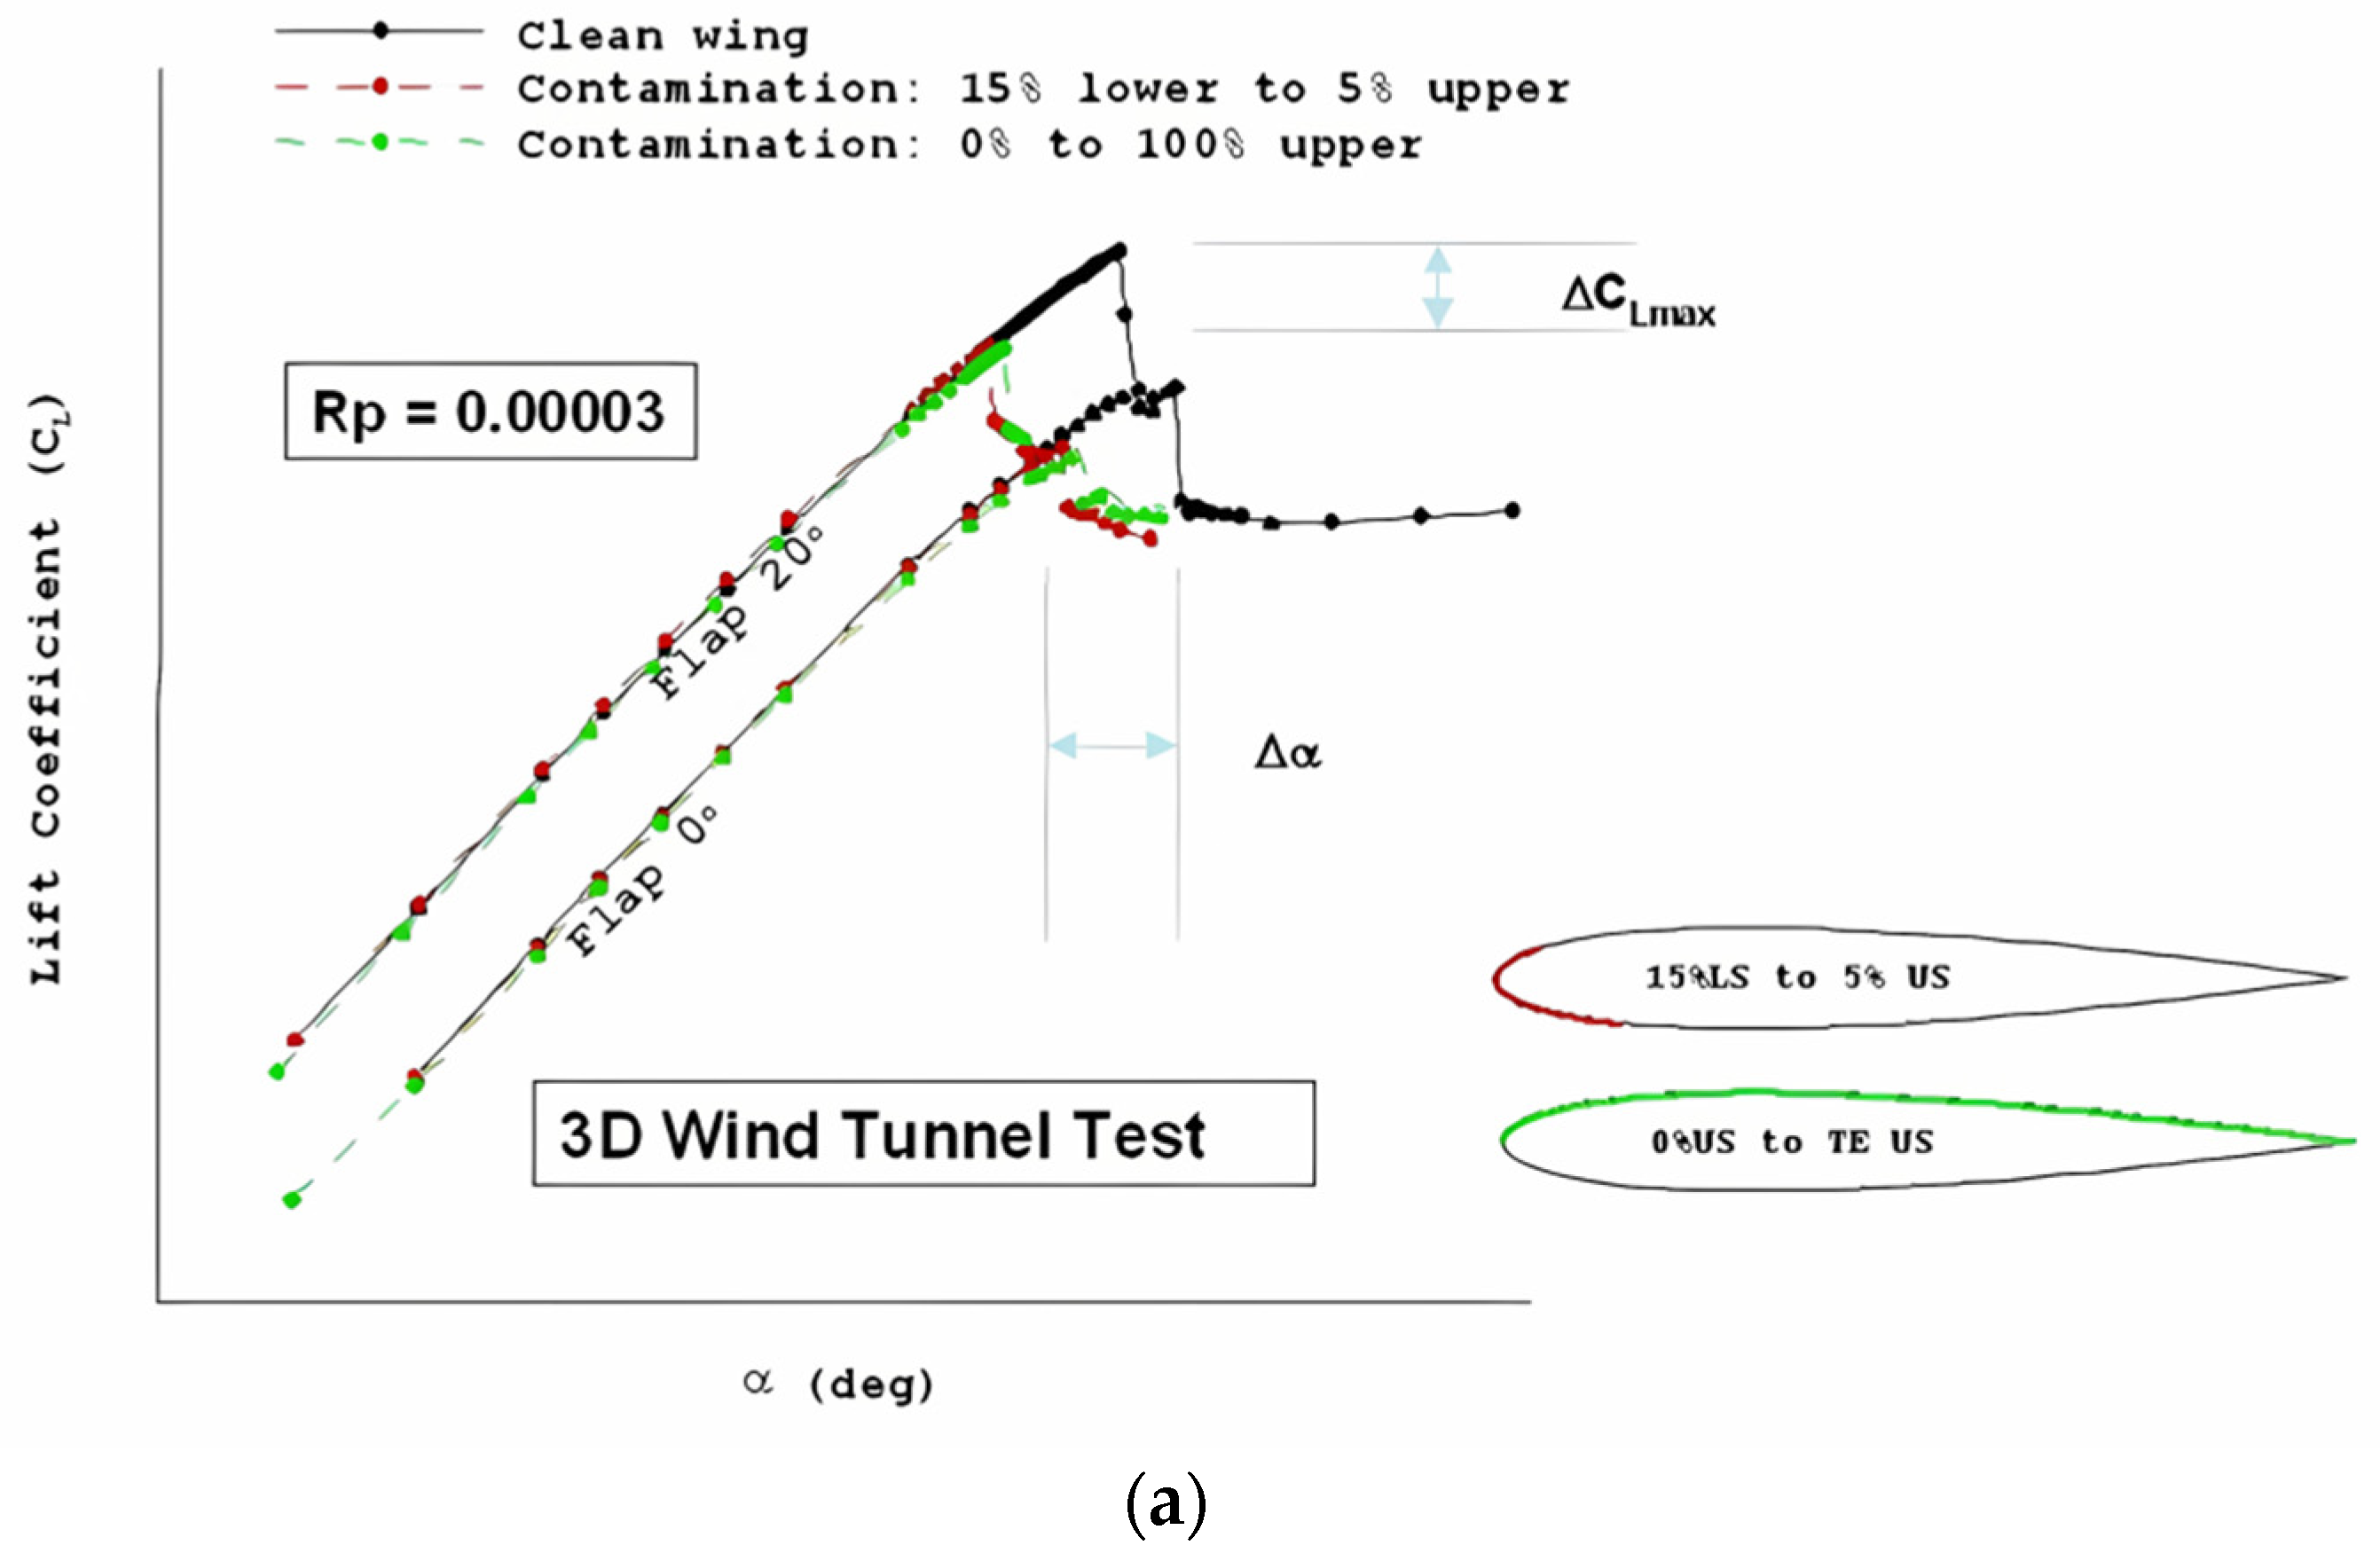
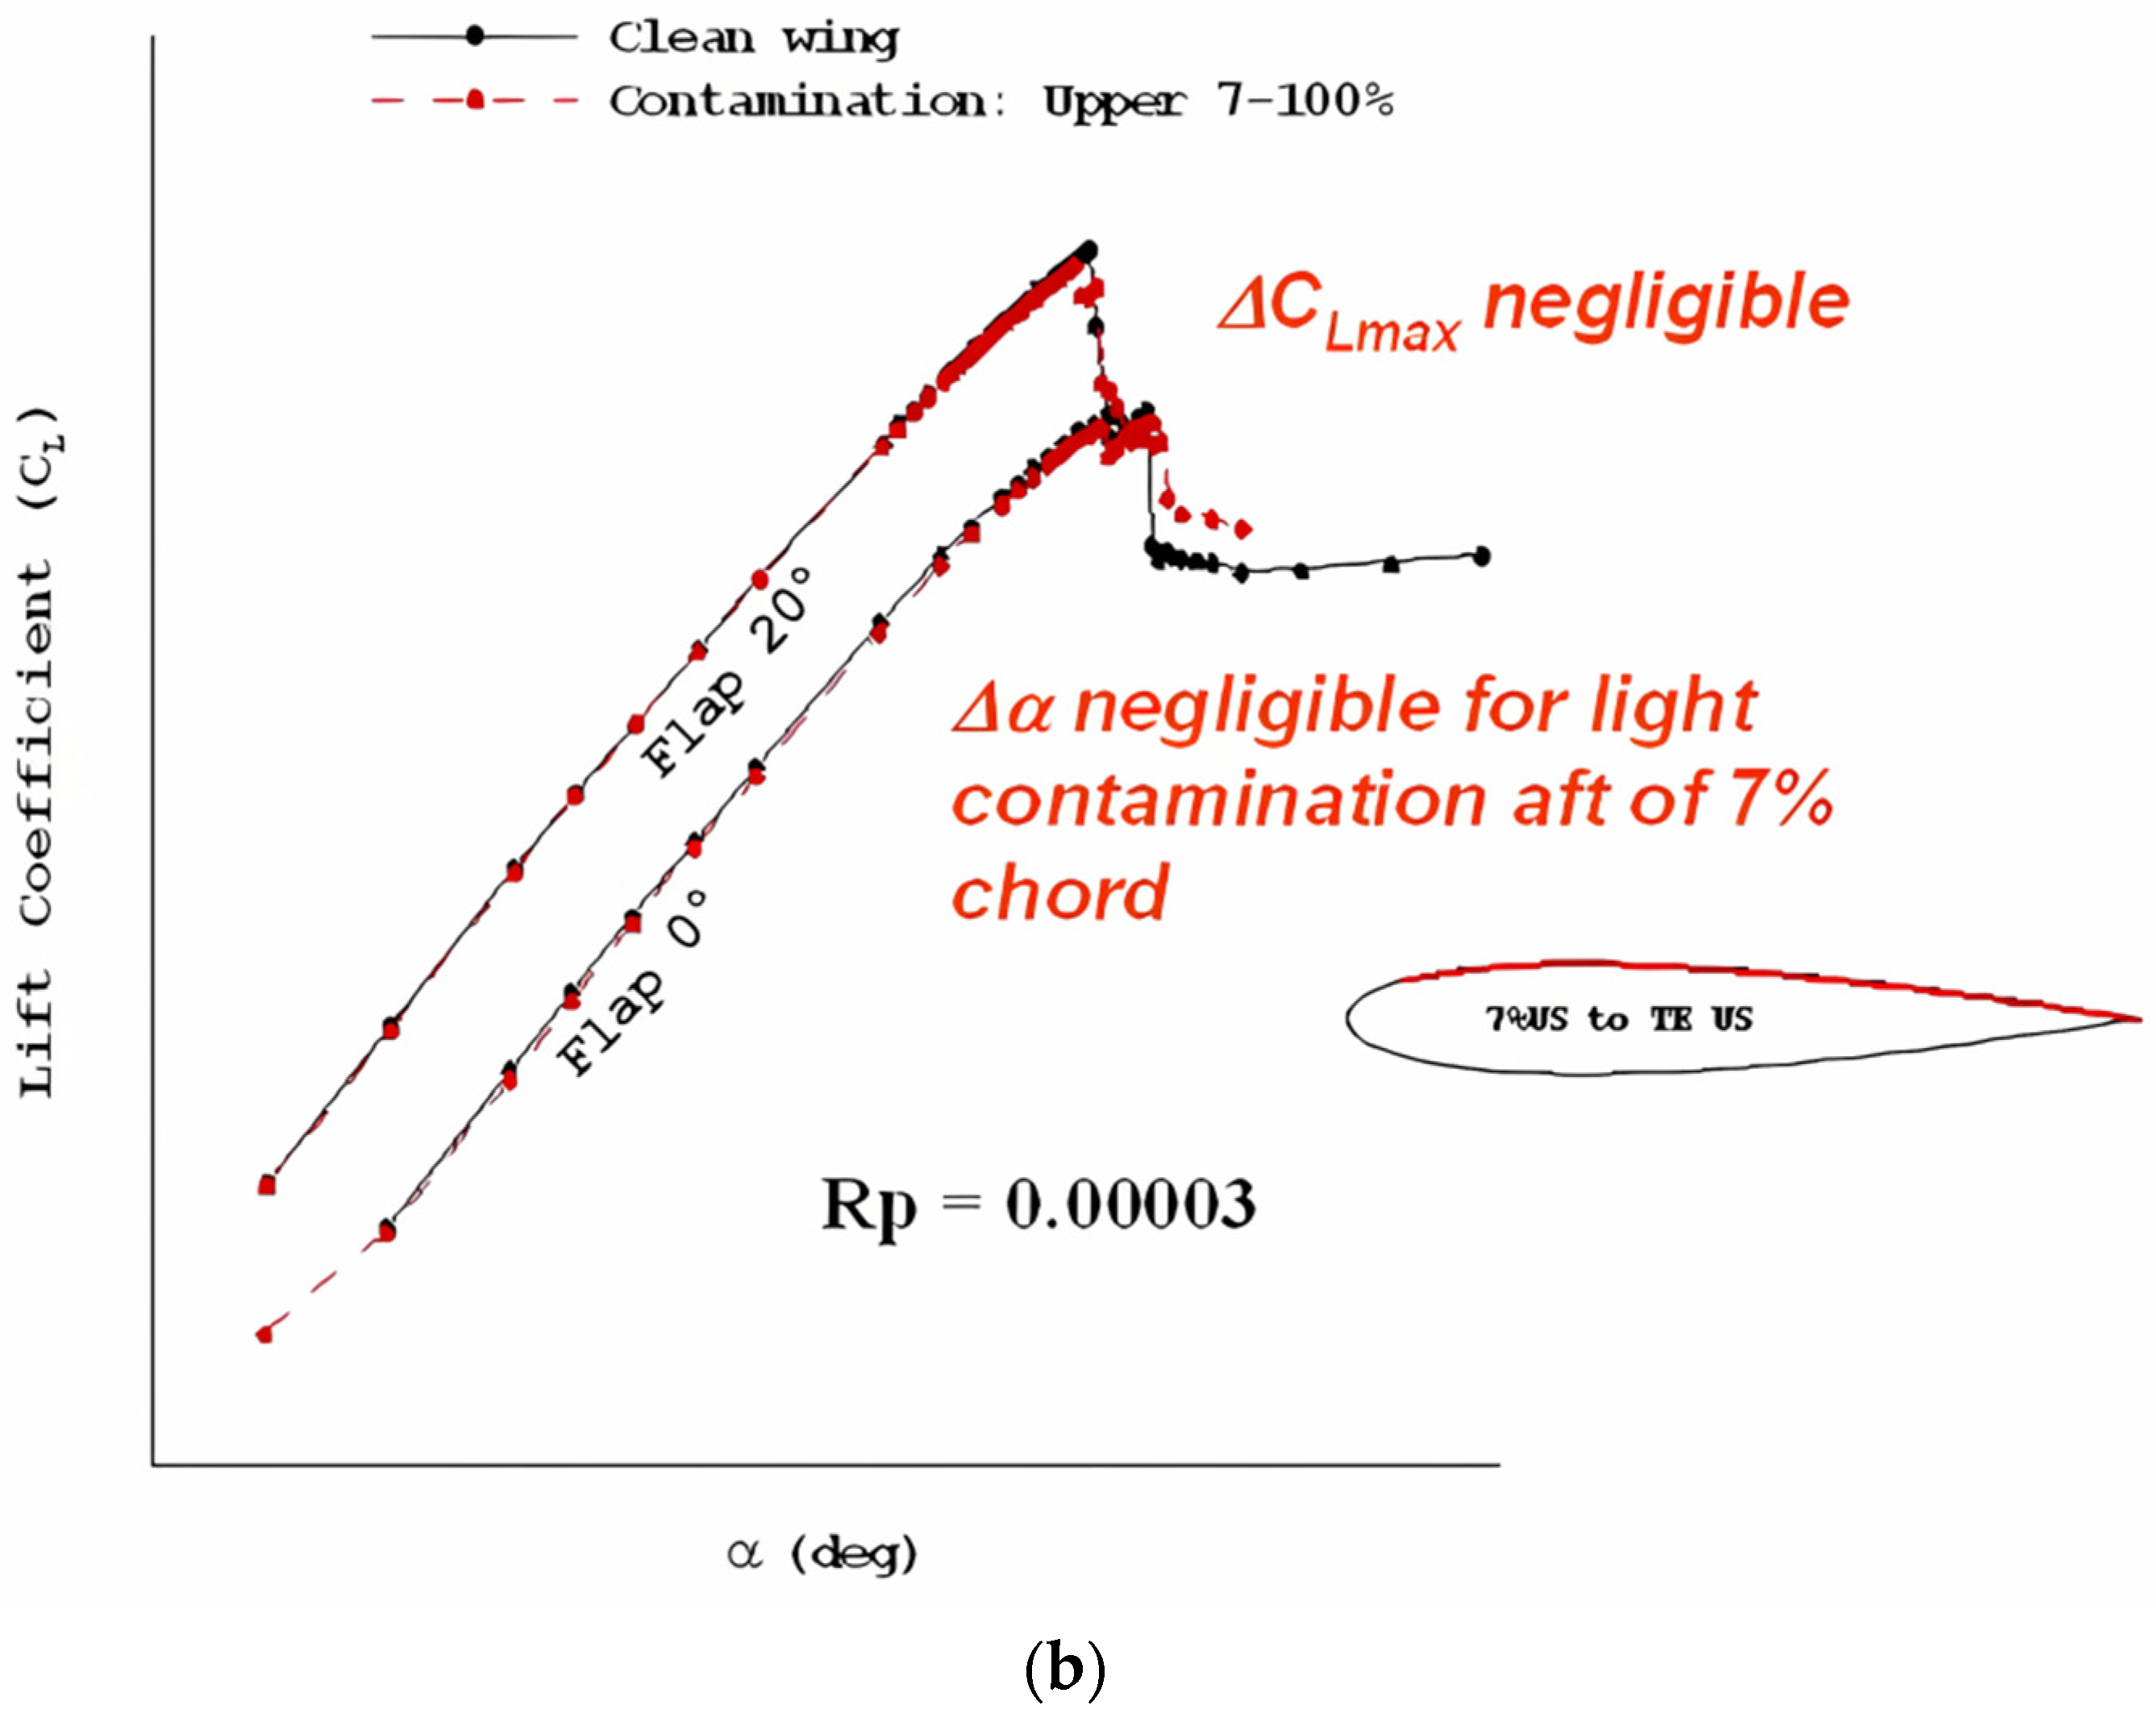
3.1. The Roughness of the Ice

The roughness of ice mainly occurs in the initial stage of icing accumulation or generates as rime ice, which tends to form at combinations of low ambient temperature, low speed, and/or a low value of cloud water concentration [23]. The early transition and the increasing of the boundary layer thickness will be introduced by this type of ice, which directly increases the profile drag of the airfoil and enhances the trailing edge separation, resulting in a reduction in the aerodynamic efficiency of the airfoil.
The effect of roughness ice on aerodynamic performance is closely related to the roughness height and distribution location. The definition of roughness height is shown in Figure 1, which is generally expressed as the ratio k/c of the absolute roughness height k to the airfoil chord length c. Shin [24] measured the absolute roughness height of the icing surface and showed that the height of roughness elements is generally within the range of 0.3–0.8 mm. Bragg [17] concluded that the roughness height is positively related to the degradation amount of maximum lift, which is shown in Figure 1, where the symbols represent discrete points of ΔClmax with corresponding k/c. The effects of height, chordwise extent, and location of roughness are all demonstrated in Figure 1a, where a wide range of roughness types and locations for a variety of airfoils and Reynolds numbers were considered. For the same height, the roughness effect increases as the range moves from x/c = 0.3 toward the leading edge, especially in the region ahead of x/c = 0.1. When the roughness height is fixed, the maximum lift decreases with the increasing roughness density until it reaches 30%, which is demonstrated in Figure 1b, where the effects of modifying the roughness density were examined on an NLF0414 airfoil.
In Figure 2, based on a typical commuter-sized aircraft with a critical wing chord of 90 inches, where the roughness effects were induced by spherical-shaped leading edge contamination, Tanner [25] further confirmed the notable positive correlation between the degeneration of stall AOA and the increasing roughness density as well as height, where the in**2 mean square inches. Bowden [26] found that roughness has the greatest effect on aerodynamic performance when the roughness elements are distributed at the point of minimum pressure or maximum velocity. From Figure 3, it can be seen that the leading edge of the airfoil is the most sensitive to the distribution of roughness, and the effect of roughness on the aerodynamic performance is the most obvious within the range of 5% chord length, where the effects of height and density of the roughness are measured comprehensively under the same Rp of 0.00003, which is an empirically derived parameter developed by Bombardier that relates the aerodynamic effect of distributed leading edge roughness to the geometric qualities of the roughness elements. Tanner [25] has also shown that the roughness of the ice within 5% of the chord length of the leading edge has a significant effect on the stall AOA and maximum lift. Within this range, the wider the distribution of rough ice is, the more critical the aerodynamic effect will be. It is noticed that the degradation of stall performance is not completely consistent between the two results due to the inevitable difference between the wind tunnel and the flight test; however, the current results have qualitative consistency and support the criterion of criticality.
Based on the above analysis, the following conclusions can be obtained:
(a)
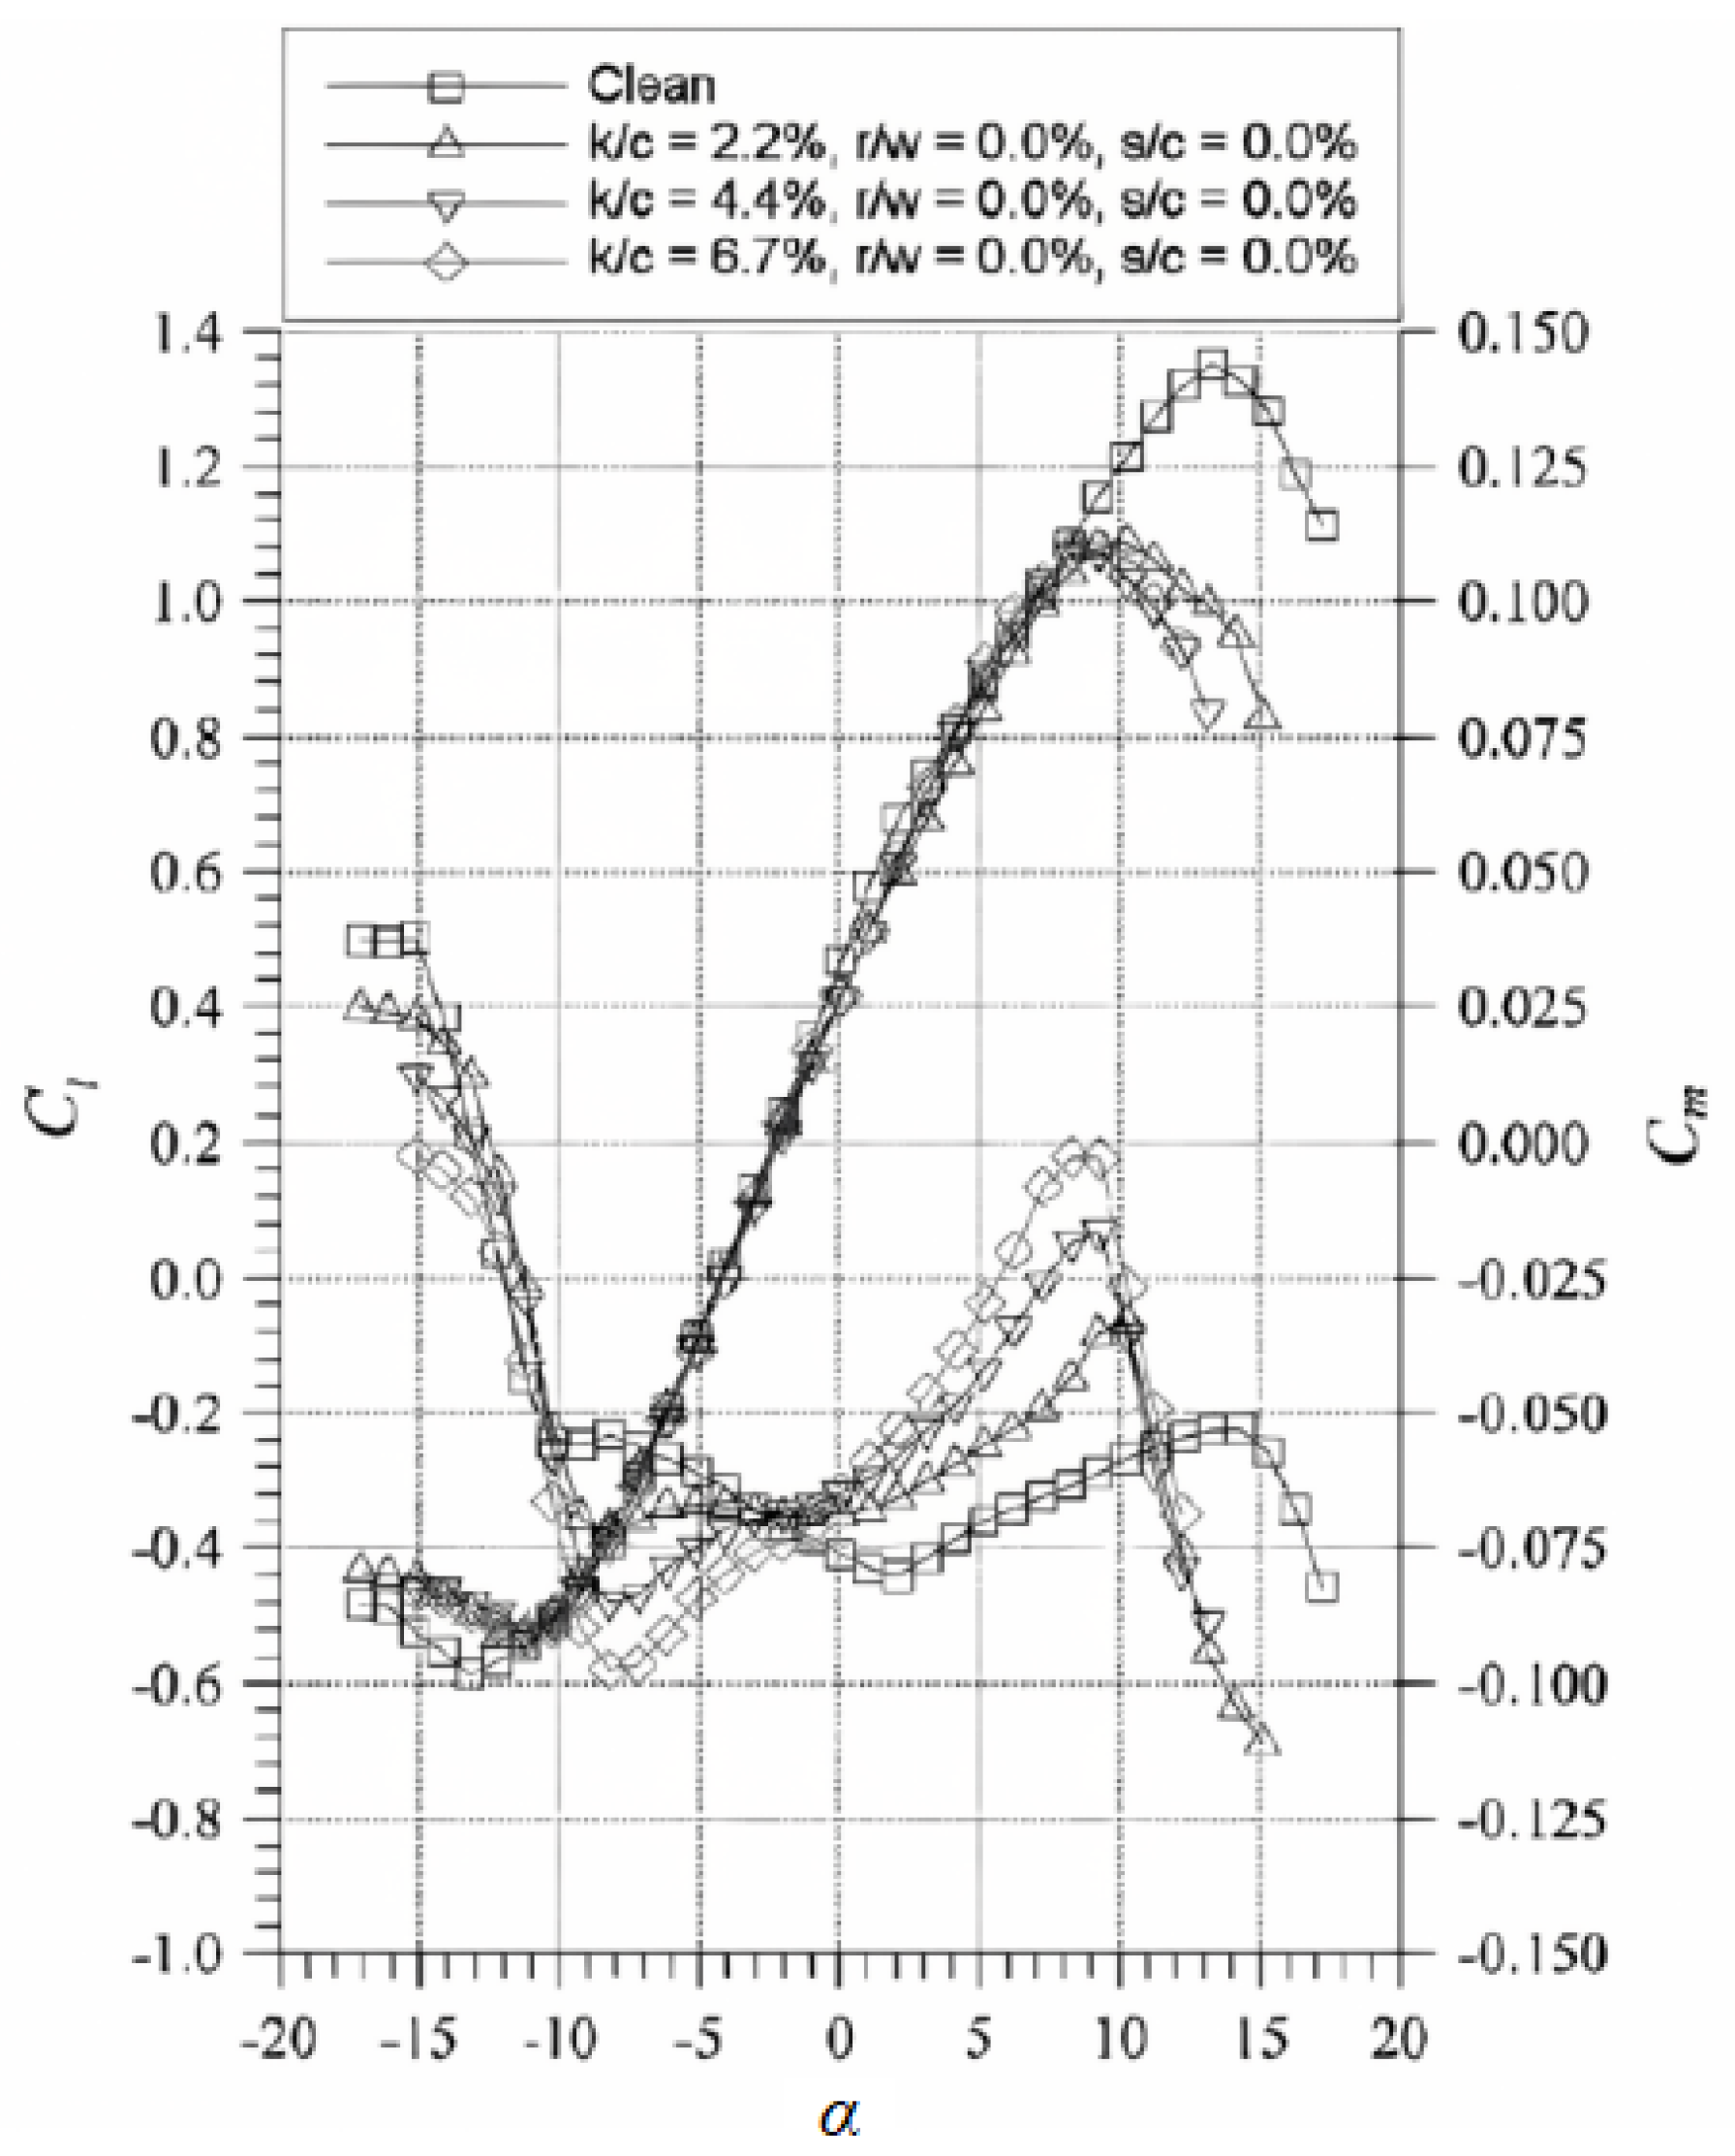
The larger the roughness height, the more critical the effect on the aerodynamic performance of the airfoil will be. The effect will no longer increase after the roughness density reaches 30%.
(b)
The effect of roughness on the stall AOA and the maximum lift is most critical within 5% of the chord direction of the upper surface of the airfoil, and the wider the distribution range, the more critical it is. Thus, the geometric parameters to determine the criticality of the roughness of the ice can be defined as the roughness height and range.
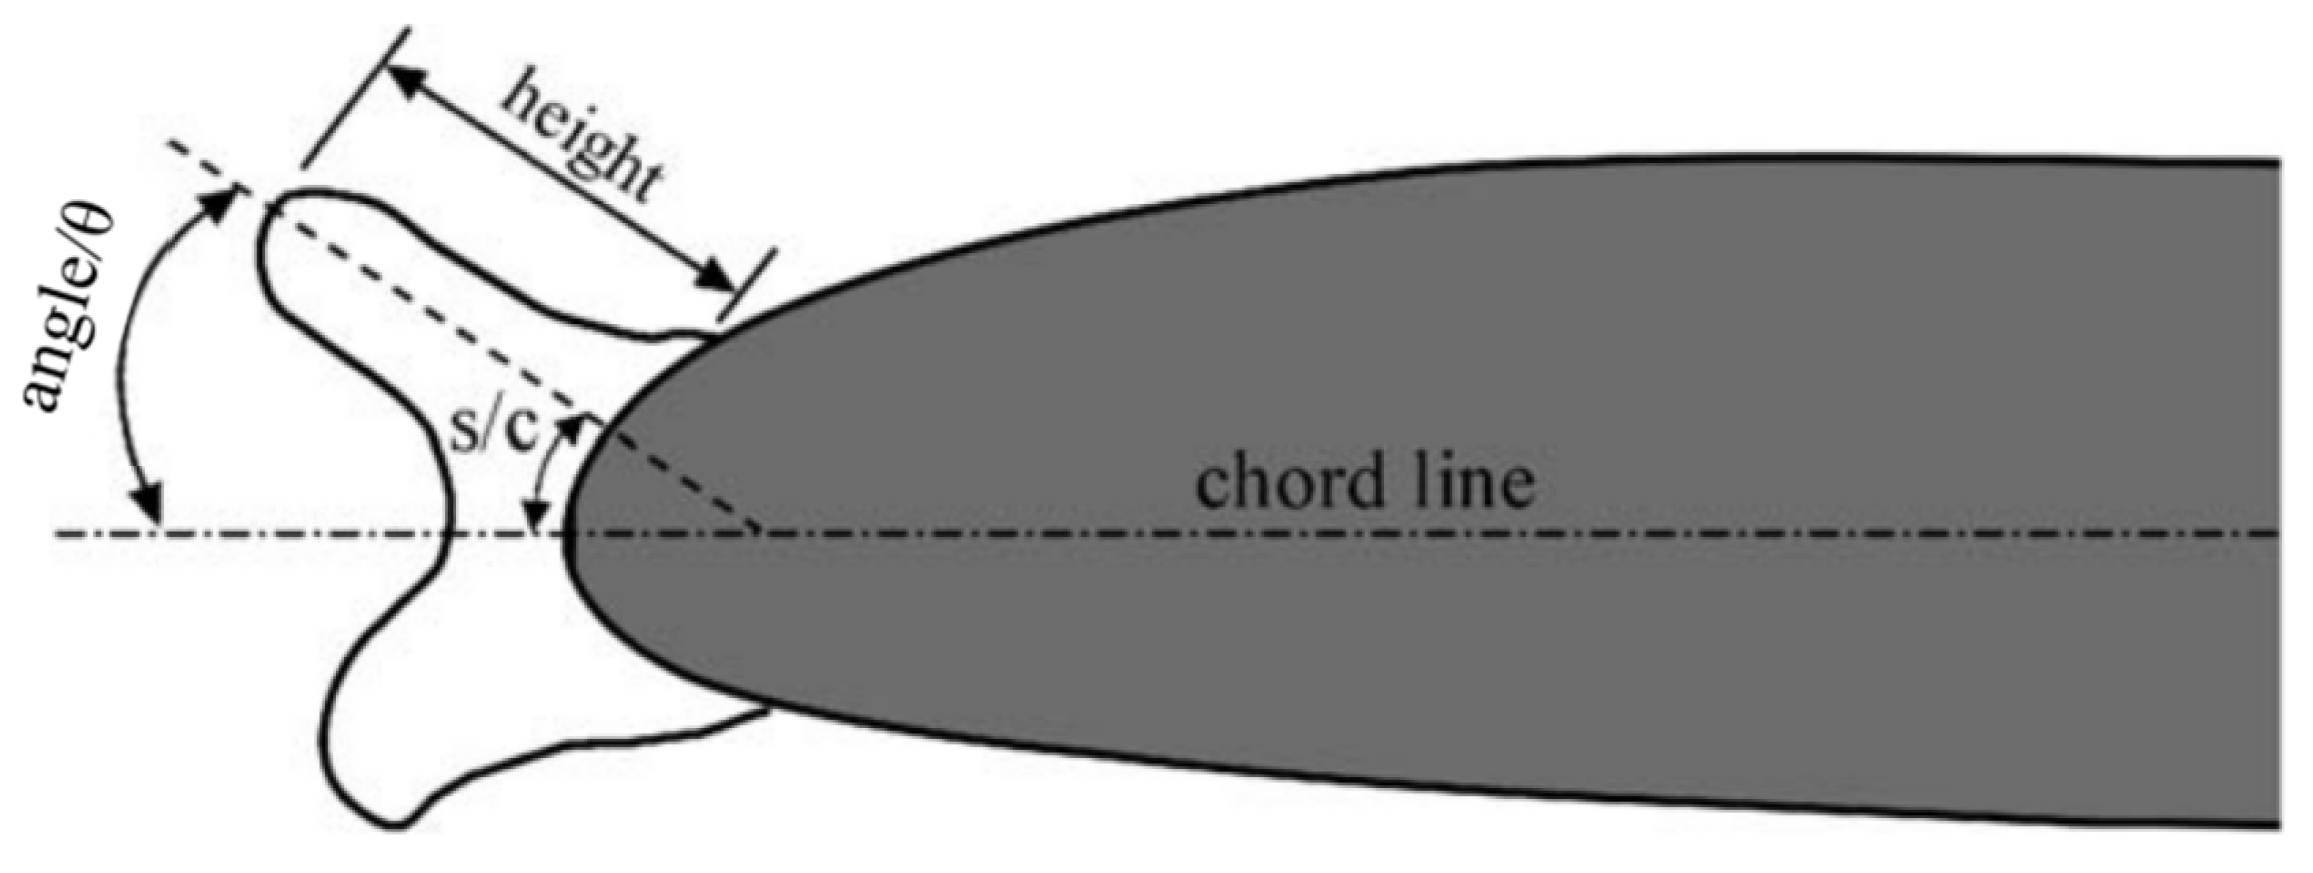
3.2. The Horn Ice

Horn ice refers to a class of ice shape with horn-like geometric features along the normal direction, which can be divided into single-horn ice and double-horn ice. This type of ice is usually generated at combinations of warm temperatures close to freezing, high speed, or high cloud water concentrations [23]. Horn ice will seriously damage the leading edge of the airfoil. A typical large-scale flow structure of separation bubbles usually forms behind the ice shape. The global flow characteristics are dominated by the generation, evolution, and development of the separation bubble, which has a great impact on the aerodynamic performance. Thus, the ice shape is the most concerned at the stage of airworthiness certification. The effect of horn ice on the aerodynamic performance is closely related to the parameters of the height, the angle, and the chord position of the horn, as shown in Figure 4.
A systematic study of the effect of simulated ice shape geometry on airfoil aerodynamics was performed by Kim [27] with the wind tunnel test based on a NLF-0414 airfoil. Firstly, the angle of the horn is given, and the effect of different heights of horn on the maximum lift, stall AOA, and pitching moment is analyzed. As shown in Figure 5a, it can be seen that the larger the relative height of the horn is, the more critical the aerodynamic effect will be. The horn angle can be defined as the angle θ between the chord lines of the horn and the airfoil. Similar to the above analysis, the height of the horn is given to analyze the effect of different angles on the aerodynamic performance. The results are shown in Figure 5b. It can be seen that when the horn is located below the leading edge point of the airfoil, the effect on the stall performance is negligible. When the horn is located above the leading edge point but still near the leading edge, the more backward the position is, the greater the effect on the maximum lift and the stall AOA will be.
Figure 6 gives more comprehensive data to analyze the correlation between the horn angle and stall performance for three heights of horn, which illustrates that the loss of maximum lift is linearly related to the horn angle. Based on the conclusion, the correlation between the loss of maximum lift ΔCLmax, the height k, and the angle θ of the horn can be obtained, i.e., ΔCLmax = f ((k + r) × sinθ). It can be seen from the equation that the larger the distance between the highest point of the ice shape and the chord line of the airfoil, the greater the loss of maximum lift and the corresponding stall AOA will be.
Kim [27] also analyzed the aerodynamic effect of the lower horn of ice. The upper horn mainly affects the maximum lift at positive AOA, while the lower horn has a small impact. Conversely, the lower horn mainly affects the maximum negative lift at negative AOA. Kim also analyzed the effect of the upper and lower horns on drag, indicating that the upper horn increases drag significantly only near the stall AOA, while the lower horn leads to a significant increase in drag at the small AOA.
During the process of airworthiness certification, there may be situations when one ice shape is characterized by a large, single upper horn while the other is characterized by a small double horn. For the two ice shapes, it is necessary to determine which ice shape is more critical. If the total projected height of the single-horn ice in the lift direction is greater, then it has the most critical impact on the maximum lift, stall AOA, and drag, and the corresponding ice shape is more critical. If the total projected height of the single-horn ice in the lift direction is smaller than the double-horn ice but greater than the upper horn, then from the perspective of lift and stall AOA, the single-horn ice is the most critical; but from the perspective of drag, the double-horn ice is the most critical. Thus, the critical ice shapes are inconsistent when the determination methods are different.
Figure 7 and Figure 8 show the effect of AOA on ice shapes simulated with LEWICE version 3.2 [28] under different icing conditions. It can be seen that when the AOA is large, on the one hand, a significant upper horn with a small angle will be generated; on the other hand, due to the effect of positive pressure and low speed on the lower surface of the airfoil, the local temperature is high and the convective heat transfer is relatively smooth, making it difficult to form a significant lower horn. As the AOA gradually increases, on the one hand, the height of the upper horn remains unchanged while the angle gradually increases; on the other hand, a significant lower horn gradually forms. Therefore, it can be concluded that larger single-horn ice generally corresponds to a smaller angle, while double-horn ice generally occurs at lower AOA, corresponding to a larger upper ice angle, and the total projection height of the upper and lower horns in the lift direction is also larger than that of single-horn ice. Therefore, for the same aircraft, flight envelope, and ice envelope, the maximum lift, stall AOA, and drag effect caused by double-horn ice are the most critical.
Although the effect of the roughness of ice on the aerodynamic performance of clean airfoils is not negligible, the effect of the roughness of horn ice is relatively small. Bragg [17] showed that the effect of the surface roughness of horn ice on the slope of the lifting line, the stall AOA, and the maximum lift is not significant. Addy [29] added roughness to the ice shapes of the GLC305 airfoil, but the aerodynamic performance did not change significantly. He also concluded that the roughness did not have a significant effect on the development of separation bubbles. Kim [27] also analyzed the effects of parameters such as horn height, top radius, and position on aerodynamic performance based on the NLF0414 airfoil. From Figure 9 to Figure 10, it can be seen that the shape of the horn tip has little effect on the maximum lift and stall AOA. From Figure 11, it can be seen that the shape of the cross-section of the horn also has less effect on the stall performance.
Based on the above analysis, the following conclusions can be obtained:
(a)
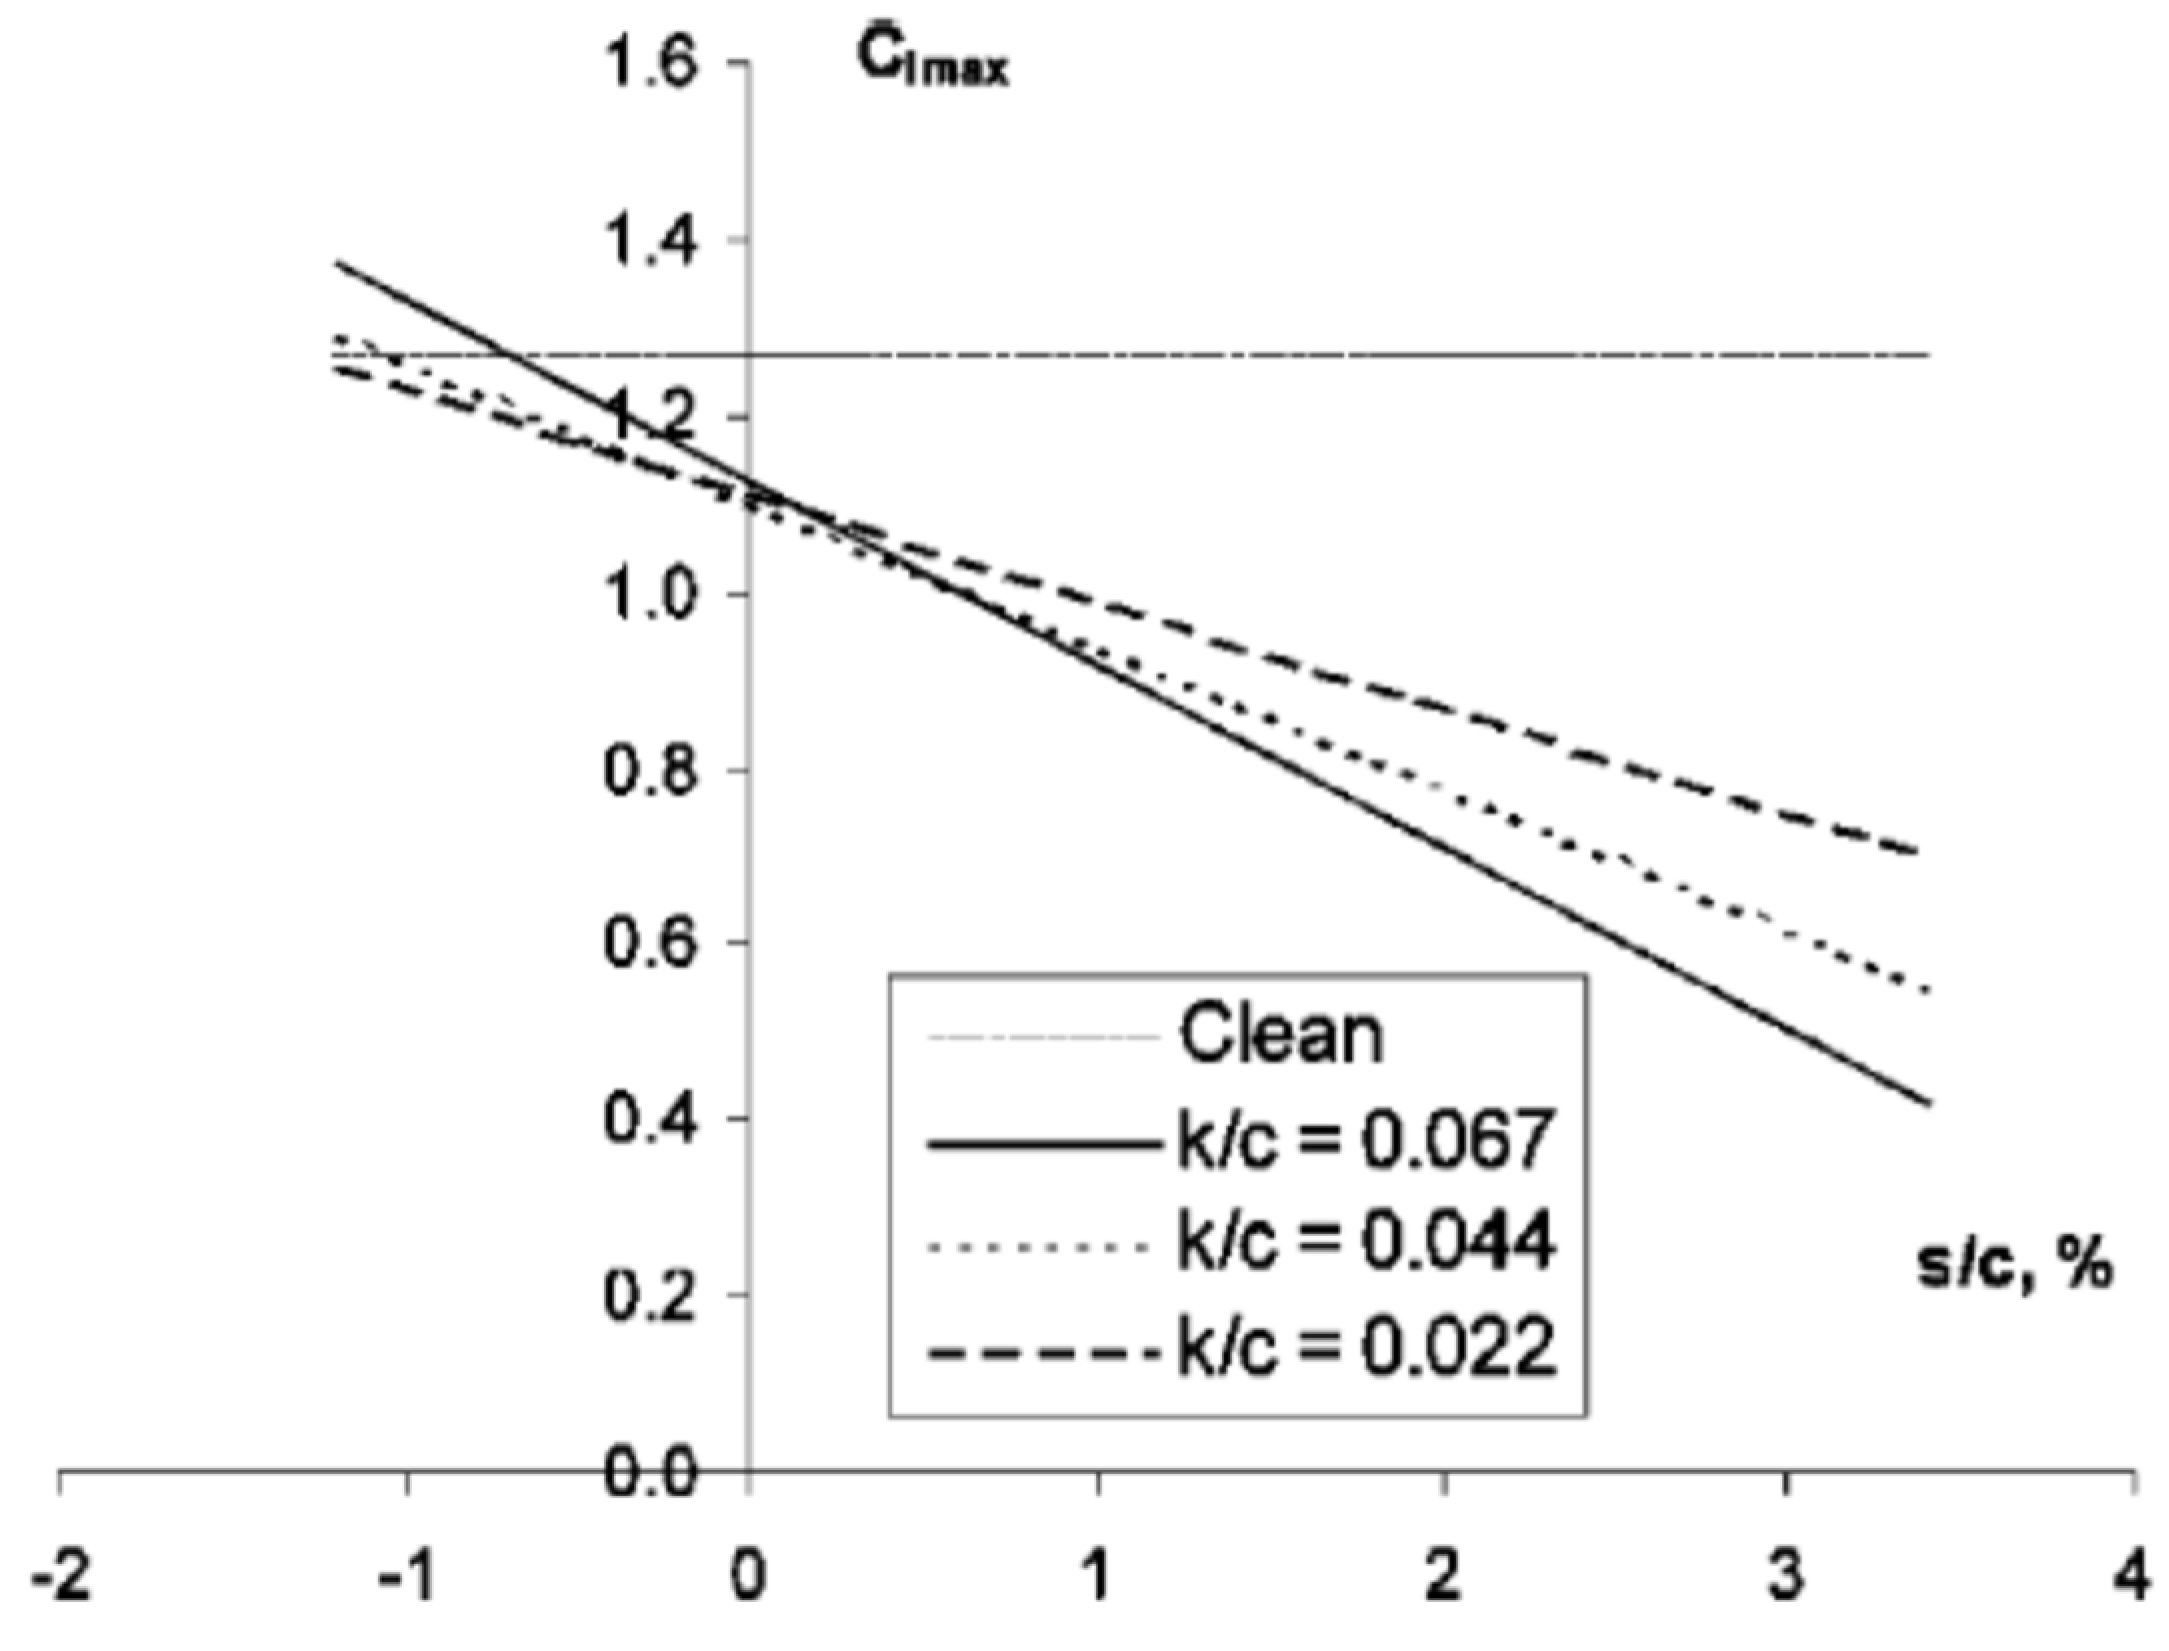
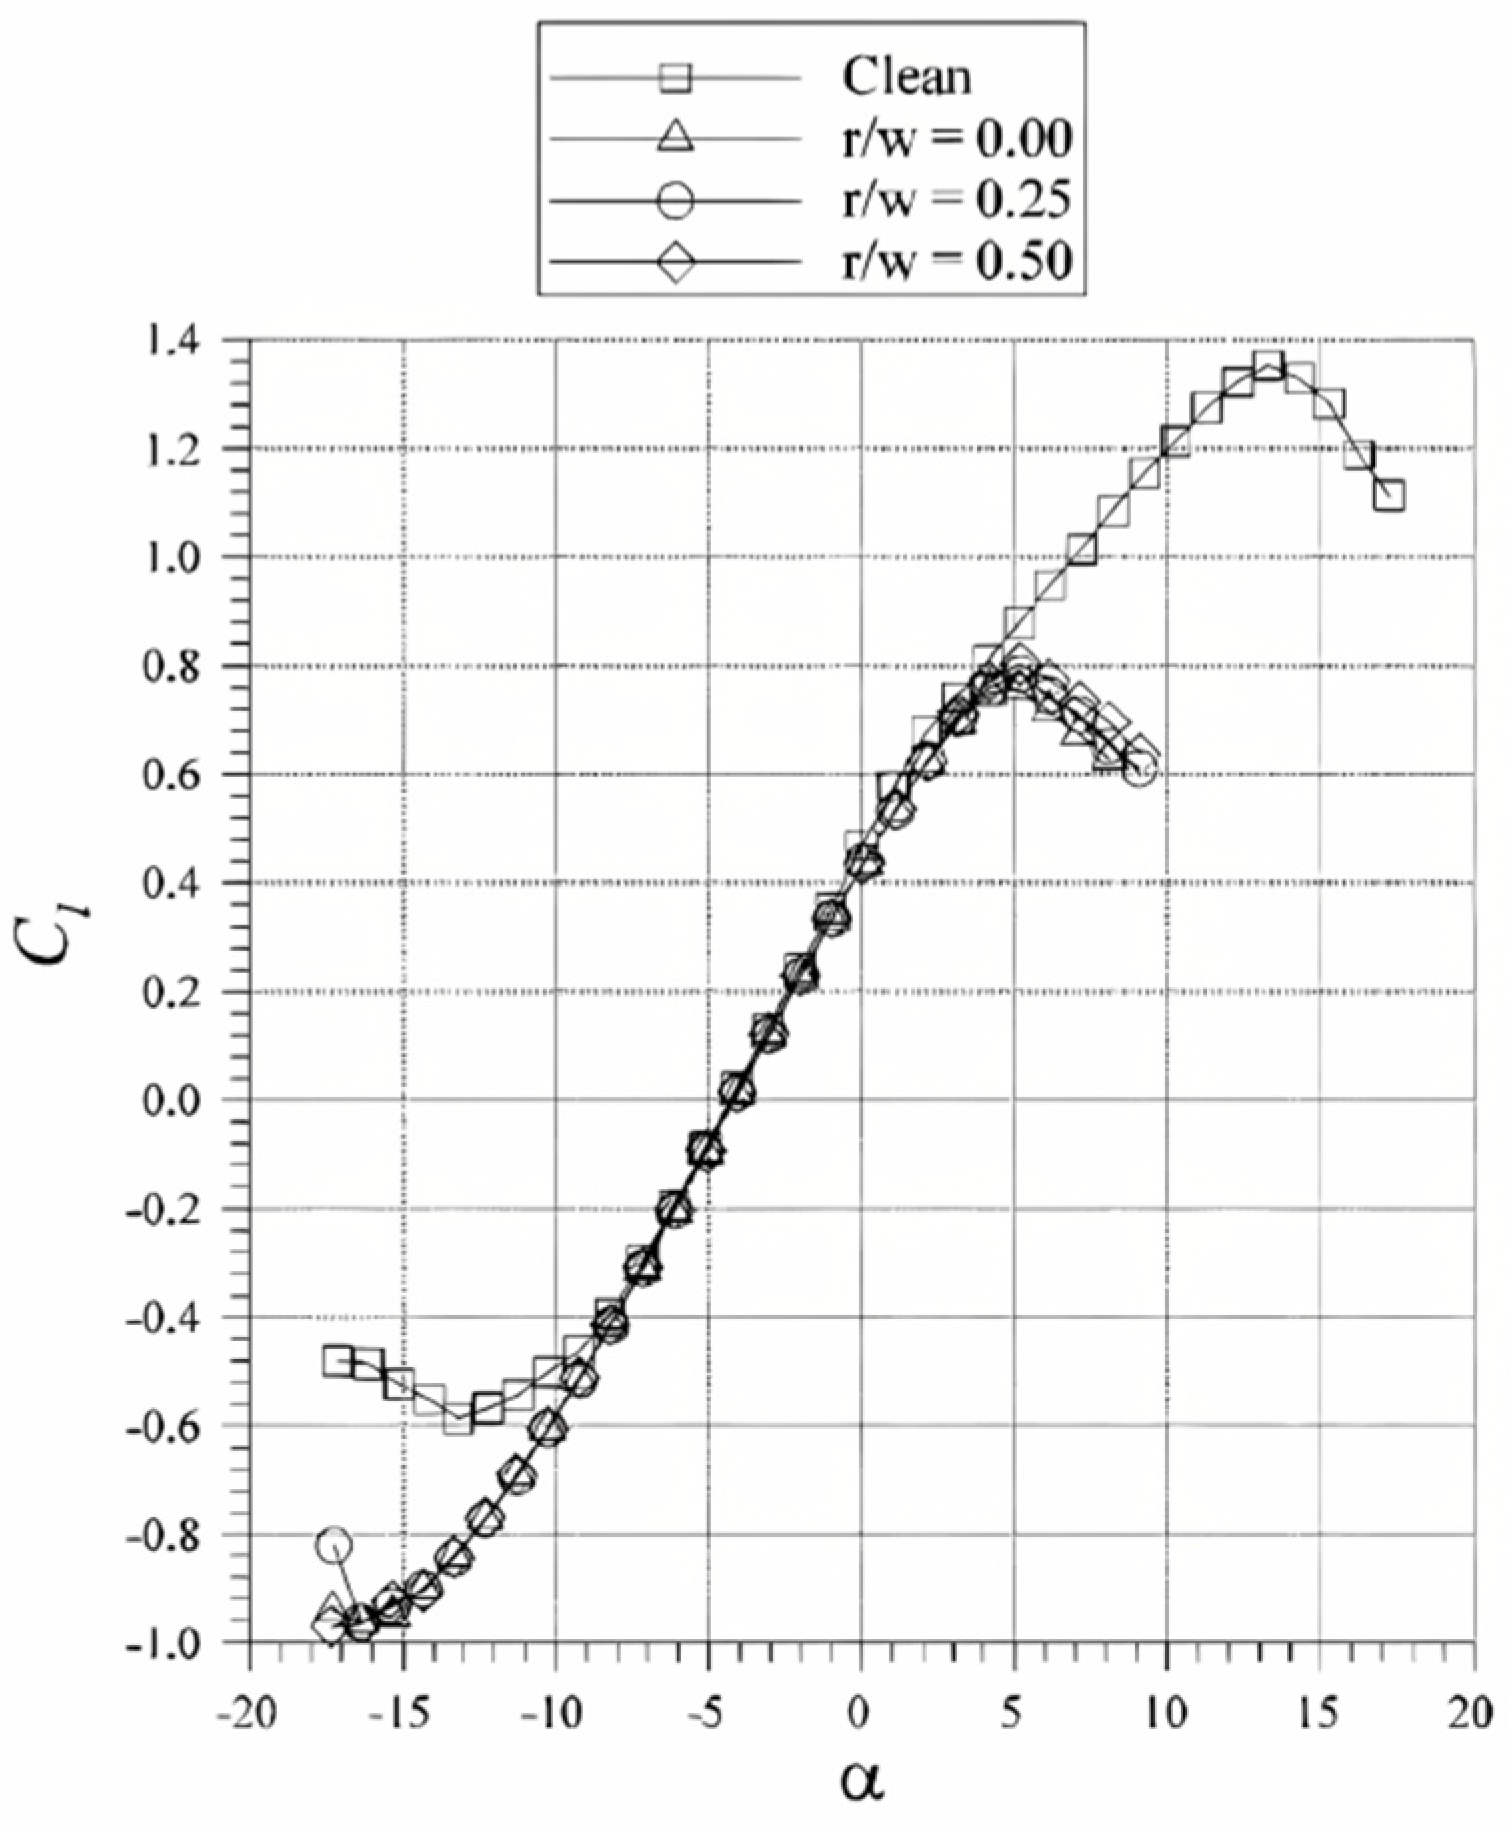
The height and angle of the horn are the main factors affecting the aerodynamic performance of iced airfoils. With a certain horn angle, the amount of effect increases with the height, but the correlation is non-linear. With a certain height, the amount of loss at the maximum lift is basically linearly related to the angle of the horn.
(b)
The larger the distance of the highest point of the horn from the chord line of the airfoil on the positive lift surface, the more critical the effect on the aerodynamic performance will be, i.e., the larger the height of the projection of the horn in the direction of lift, the more critical the effect on the aerodynamic performance will be. Thus, the geometric parameter to determine the criticality can be defined as the total projection height in the direction of lift for the horn ice.
(c)
The lower horn has a large effect on the drag of the airfoil but does not affect the stall performance. For the specified aircraft, flight envelope, and icing envelope, the maximum lift, stall AOA, and drag effects of double-horn ice are the most critical.

3.3. The Streamwise Ice

The streamwise ice can be regarded as a special kind of horn ice, in which the horn points to the direction of incoming flow, or the horn angle is considered to be near 0°. Since the geometry of the streamwise ice shape is similar to the leading edge of the airfoil, it is usually difficult to induce global separation, but the discontinuity at the junction of the ice shape and the airfoil may induce local separation, and the separation position may vary with the AOA and other flow parameters. As shown in Figure 12, the maximum lift of the airfoil is less affected by the height of the horn, but the pitching moment varies relatively significantly. Compared with the horn ice, the streamwise ice is more sensitive to surface roughness. Kim [27] studied the effects of streamwise ice and double-horn ice on aerodynamic performance and showed that the effects of streamwise ice on the maximum lift and the stall AOA are small. Since the loss of aerodynamic performance caused by streamwise ice is relatively limited, it is usually not a major concern in terms of airworthiness.

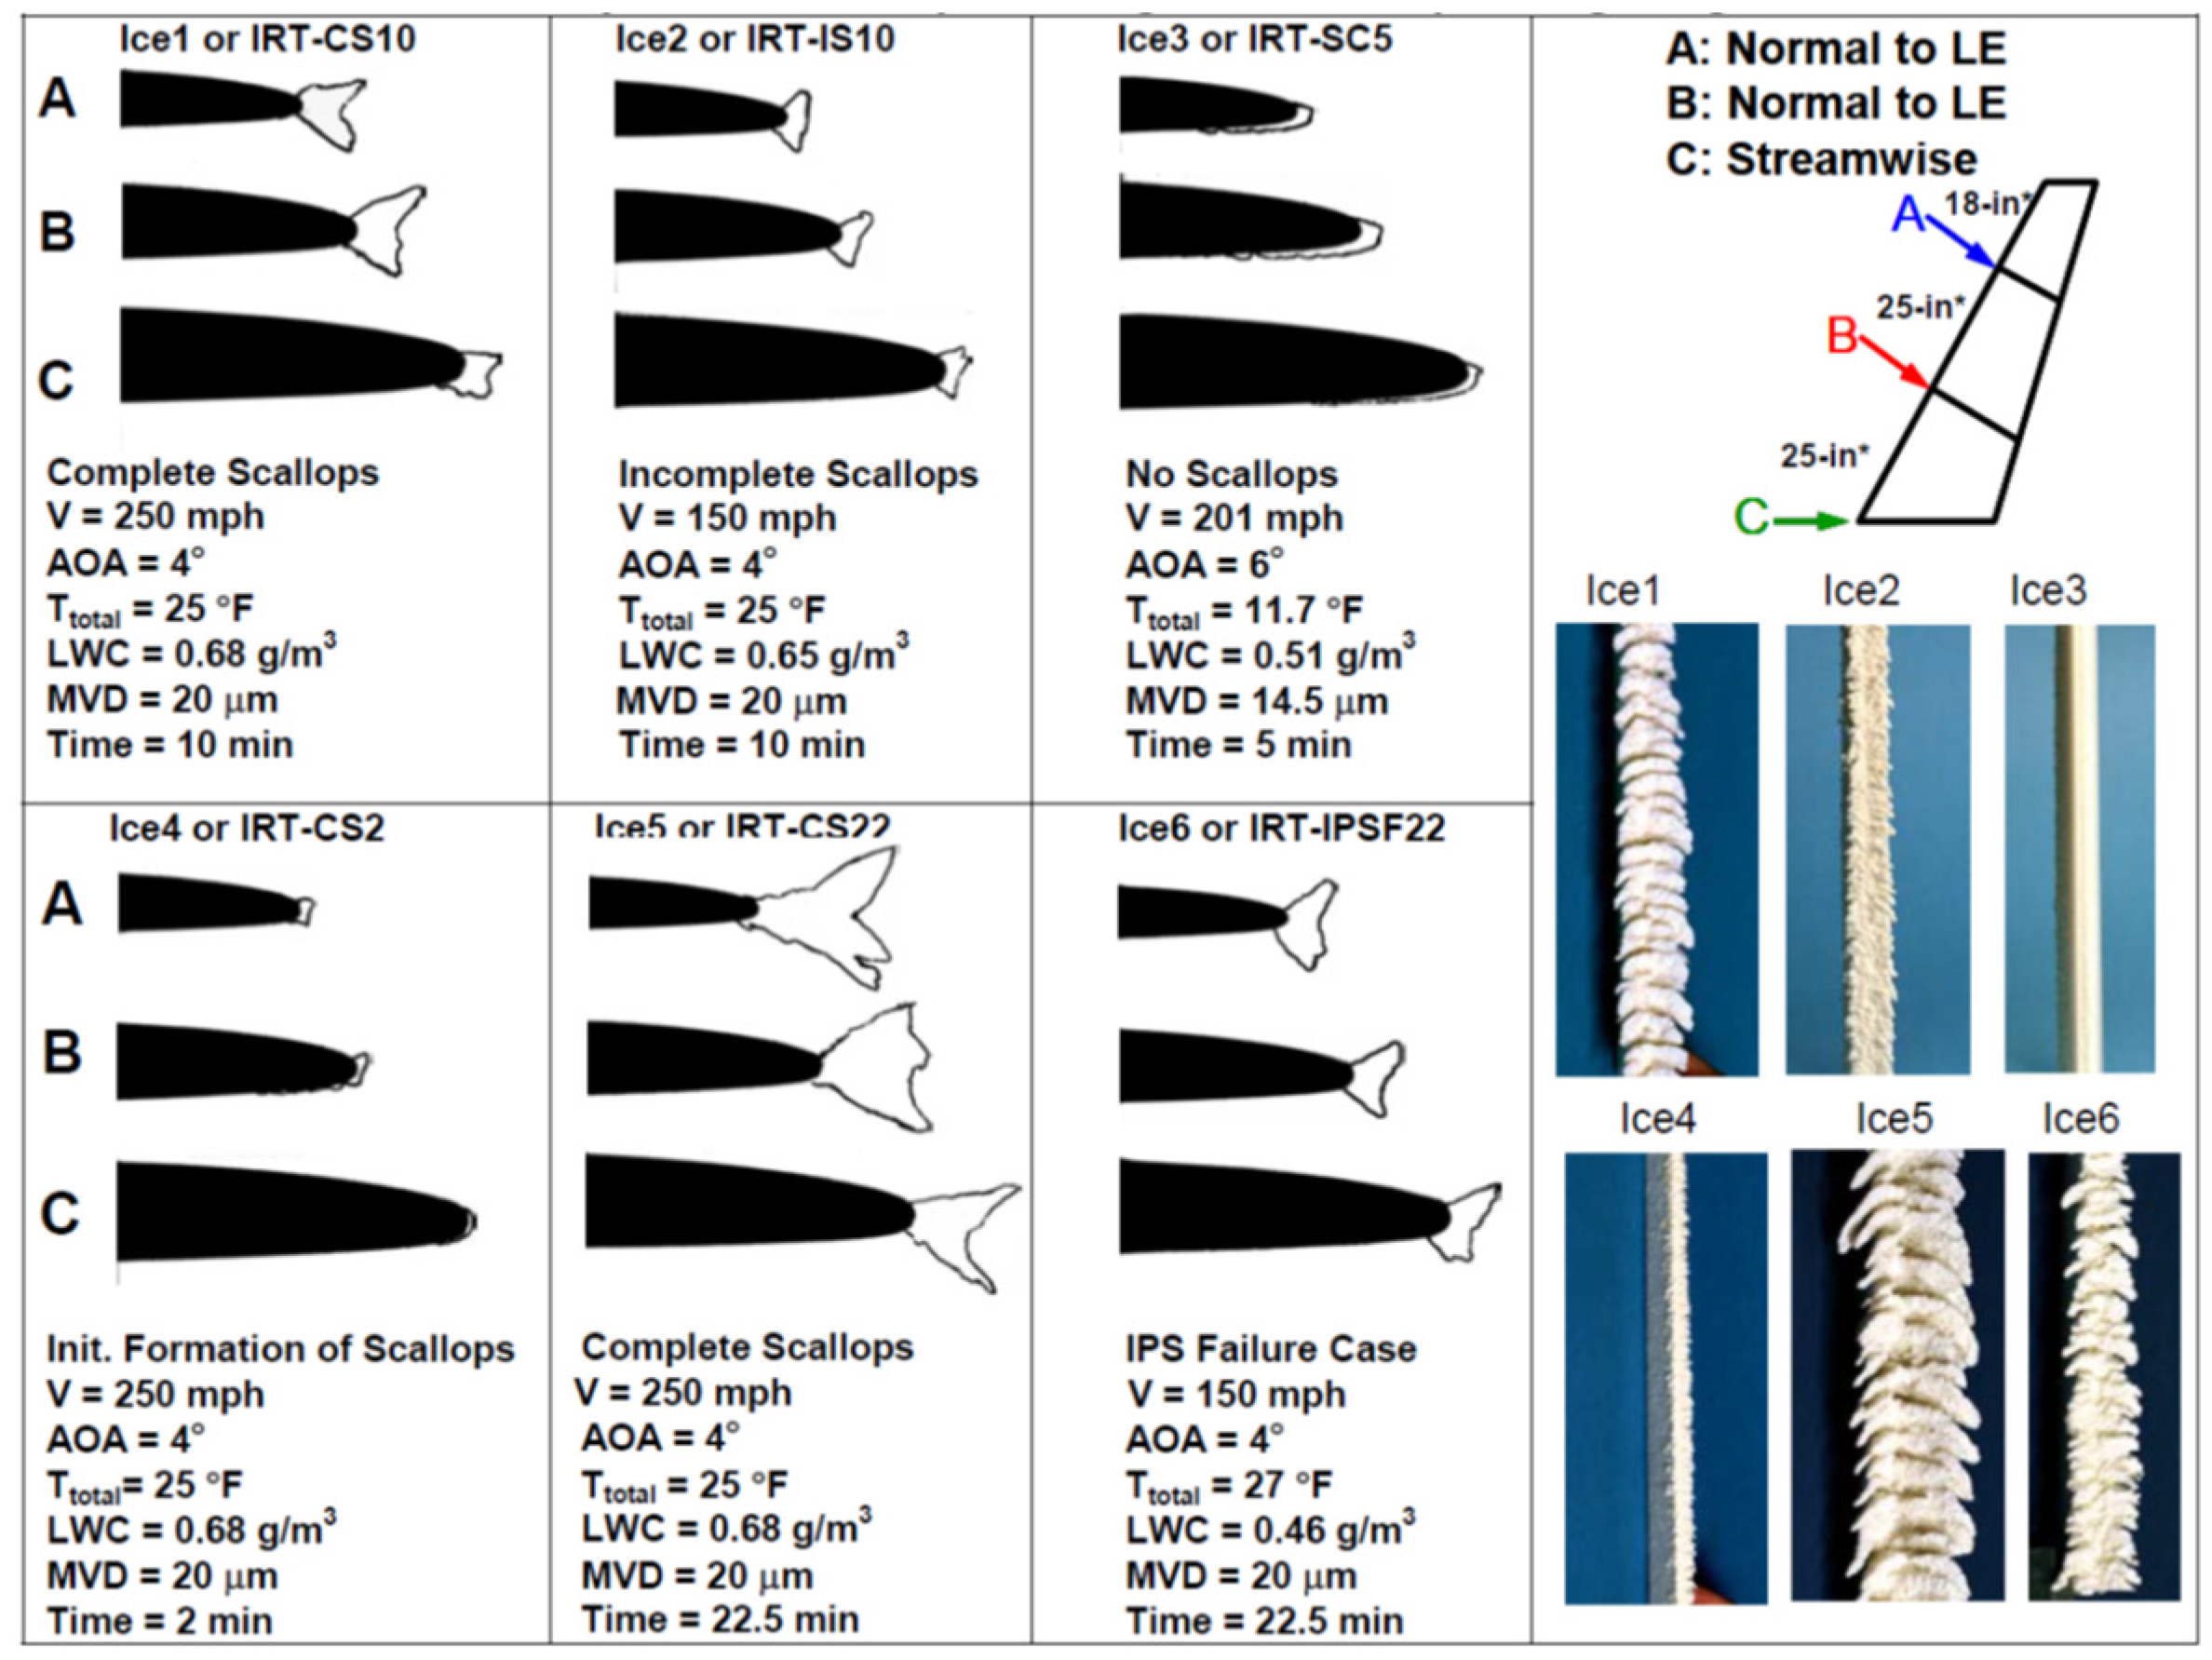
3.4. The Three-Dimensional Shrimp-Tail Ice

In a natural icing environment and an icing wind tunnel, flake ice is often generated on the swept-back wing, which is often called shrimp-tail ice. Compared between the shrimp-tail ice and the smooth ice, it remains to be investigated which one has a more critical effect on the aerodynamic performance. To address the problem, Papadakis [32] analyzed the aerodynamic performance of an iced swept-back wing, studied the sensitivity of the wing to various forms of ice shapes under typical conditions, compared the differences of ice shapes between the icing wind tunnel and the LEWICE simulation, and evaluated the effects of ice shape parameters such as height, angle, and surface roughness. As a result, an experimental database of the effect of ice shape on the aerodynamic performance of swept-back wings was established. Figure 13 shows the 2D profiles and 3D ice shapes. Figure 14, Figure 15 and Figure 16 summarize the amount of effect on the aerodynamic performance. It can be seen that the effect of shrimp-tail ice on the maximum lift and stall AOA is similar to that of the 2D ice shapes. The effect quantities of the ice shapes obtained from the icing wind tunnel and the LEWICE on the stall performance are basically the same; the loss of aerodynamic performance caused by the experimental ice shapes is slightly larger than that of the LEWICE. Therefore, the conclusion of determining the critical ice shapes based on the 2D profiles is still applicable for the swept-back wing.

3.5. The Comparison of the Criticality of Different Ice Shapes

NASA Glenn Research Center analyzed the effect of ice on aerodynamic performance under different icing stages [29]. Figure 17 and Table 3 show the effects of roughness ice, horn ice, and streamwise ice on the aerodynamic performance of the NLF0414 airfoil. It can be seen that the effect of horn ice on the maximum coefficient of lift and the stall AOA is the largest, followed by streamwise ice, and roughness ice is the smallest. The comparison of the effect of ice shapes on aerodynamic performance at different icing stages is given in Figure 18. It can be seen that the effect of ice shapes on aerodynamic performance is gradually increasing with the increase in icing time. During this process, the ice shape is evolving through the stages of roughness ice, streamwise ice, and double-horn ice, thus illustrating the magnitude of the effects of ice shapes. Shin [33] investigated the effect of different icing conditions on the drag coefficient increment of the airfoil. When the icing condition changed from rime ice to glaze ice, the increment of the corresponding ice shape on the drag also increased, and when the upper and lower horns had the maximum height of the projection in the direction of the lift, the corresponding drag increment reached the maximum value as shown in Figure 19.
Based on the above analysis, the criticality of different ice shapes on aerodynamic performance can be summarized as follows:
(a)
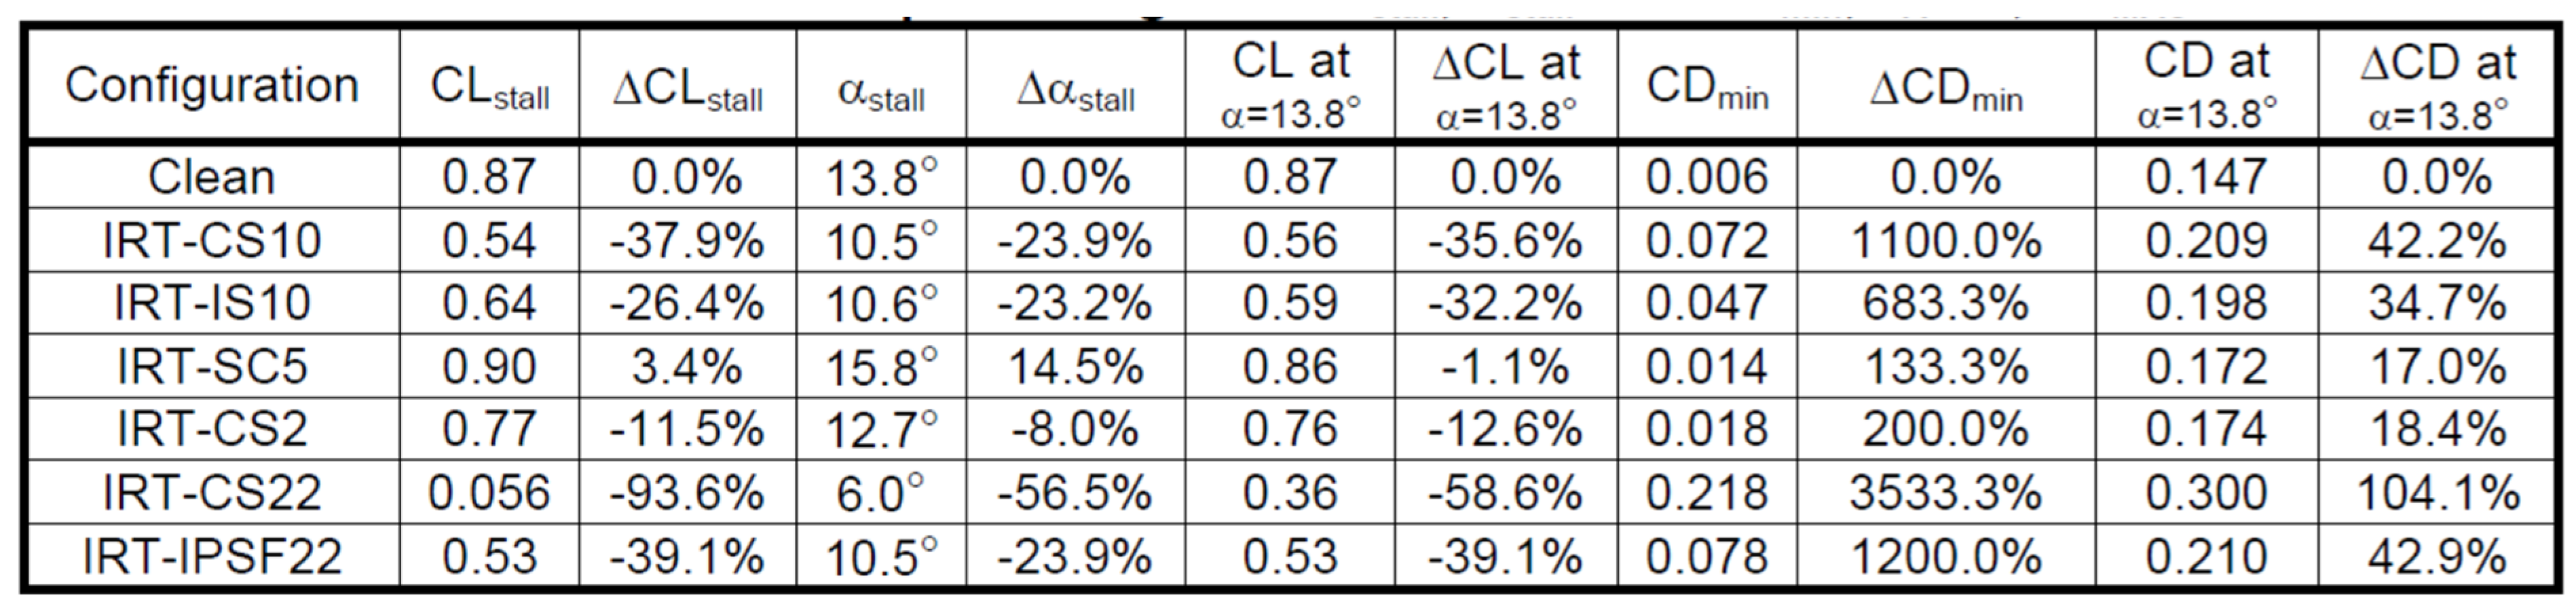
For the leading edge roughness ice, the larger the roughness height and the larger the distribution range near the leading edge on the upper surface, the more critical it will be.
(b)
For the leading edge horn ice, the larger the height of the upper horn and the further downstream it is, the more critical the effect on the maximum lift of the drag and the stall AOA will be. The larger the height of the projection of the lower horn in the opposite direction of the lifting force, the more critical the effect on the drag will be, which can be summarized as the larger the total height of the projection of the horn in the direction of the lifting force, the more critical it will be.
(c)
The effect of leading edge horn ice on the maximum lift and stall angle is greater than that of roughness ice and streamwise ice. For a given aircraft configuration, flight envelope, and icing condition, if the double-horn ice is generated, the corresponding effect on the maximum lift, the stall AOA, and the drag is the most critical.

4. The Determination of Criticality for Ice Shapes According to Flight Phases and Aircraft Components

4.1. The Determination of Criticality for Ice Shapes According to Flight Phases

According to the possible icing geometry characteristics of ice shape in different flight phases and the conclusion of this research on the criticality of ice shapes on aerodynamic performance, the criteria of critical ice shape are formulated for each flight phase, as shown in Table 4.

4.2. The Determination of Criticality for Ice Shapes According to Aircraft Components

According to the criterion of determining the criticality of the ice shape of each flight phase, combined with the main aerodynamic performance and the components of concern, the criterion of critical ice shape for each component is formulated.
(1)
For the regulation at 25.103 of stall speed, the main verification is the stall speed, and the corresponding aerodynamic parameters are the maximum lift and the stall AOA. According to the law of the effect of ice shapes on stall performance, the conclusion can be drawn as follows:
(a)
For the roughness ice of takeoff, whether for protected or unprotected areas, from the leading-edge stationing point of each component, the larger the distribution range of roughness ice on the positive lift surface, the more critical it will be.
(b)
For the ice of the take-off final stage, if it is roughness ice, the criterion is the same as (a). If other factors such as minimum overrun capability are taken into consideration, resulting in longer flight time to reach the maximum level altitude and obvious ice accretion having already been generated on the wing surface, according to the criterion of the criticality of horn ice, the larger the projection height of the horn in the direction of the positive lift, the more critical it will be.
(c)
For the en route ice and the holding ice, if obvious ice accretion has already been generated, the same as in the second case of (b), at this time, the larger the projected height of the horn on the positive lift surface is, the more critical it will be.
(2)
For the regulation at 25.111 of the takeoff path, the main verification is the effect of the change in drag on the takeoff path after icing, and the corresponding aerodynamic parameters are drag and lift-to-drag ratio. For the takeoff ice, the criterion of roughness can be applied. For the takeoff ice of the final stage, and the total projected height should be confirmed.
(3)
For the performance regulations at 25.119, 25.121, 25.123, and 25.125, the main aerodynamic parameter to be examined is the lift-to-drag ratio, and for the takeoff ice of the final stage, route ice and holding ice, the icing time is long, thus the critical ice is generally horn-like, thus the criterion of horn ice can be applied.
(4)
For the controllability regulations at 25.143, 25.145, 25.147, and 25.161, as well as the stability regulations at 25.171, 25.175, 25.177, and 25.181, the criticality of ice can be determined according to the focus performance of components. For the fixed lift components, the ice shape, which leads to a decrease in the maximum lift coefficient and stall AOA, is the most critical. For the movable lift components, besides the above mentioned, the decrease in the efficiency of the control surface and the increase in trailing edge separation are taken into consideration. For the horizontal tail, the ice accretion mainly affects the pitching moment and controls surface efficiency. The criticality can be determined by the decrease in trimming capability. For the vertical tail, the icing effect on side force and rudder efficiency is the most concerning. Since these characteristics are all directly related to the stall performance or separation characteristics of each component, the determination of the criticality of different components is consistent, i.e., the criterion of roughness ice and horn ice can be applied based on the required icing condition.
According to the above analysis, the criterion of critical ice for each component is summarized in Table 5.

5. Conclusions

Based on the aerodynamic performance required to be examined for each flight phase under icing conditions in the airworthiness regulation, the ice shapes are classified according to their geometric characteristics. With the correlation between the ice shape and aerodynamic performance, the criteria for critical ice shapes corresponding to different flight phases and components are summarized, and the following conclusions can be obtained:
(1)
Different from the previous study, which mainly focused on the ice shapes and effects of the holding flight phase, according to the aerodynamic performance required to be examined and the icing definition of each flight phase in the latest version of CCAR-25, the classification of the ice shapes in view of geometry characteristics and the corresponding aerodynamic performance to be examined is performed with the factors to be considered in the advisory circulars.
(2)
Based on the aerodynamic effect of ice shapes with different characteristics, the correlation between the geometric parameters and the criticality of ice shapes is clarified. According to the possible ice shapes in different flight phases, the criteria for determining the criticality of ice shapes corresponding to each flight phase and aircraft component are summarized.
(3)
The most critical geometry among various ice shapes is identified. For the specified aircraft, flight envelope, and icing envelope, the maximum lift, stall AOA, and drag effects of double-horn ice are the most critical. The conclusion of determining the critical ice shapes based on the 2D profiles is still applicable for the 3D swept-back wing.
(4)
The dominant geometric parameters to determine the criticality for typical ice shapes are defined. For the roughness of the ice, the larger the roughness height near the leading edge, the more critical it will be. For the horn ice, the larger the total height of the projection of the horn in the direction of the lifting force, the more critical it will be.
The current work will contribute to providing an operational selection criterion in terms of geometries for determining the critical ice shapes for different phases of flight and aircraft components at the airworthiness certification stage. In future research, with the icing condition and airworthiness regulations of 25.1420 in the latest version of CCAR-25, the current determination of criticality will be further extended to the field of SLD ice with corresponding investigations of the effect of ice shapes on the aerodynamic performance, which will provide a reference for the icing airworthiness certification of next-generation civil aircraft.

Author Contributions

Conceptualization, X.H.; methodology, X.H.; software, X.H.; validation, X.H.; formal analysis, X.H.; investigation, X.H.; resources, X.H.; data curation, X.H.; writing—original draft preparation, X.H. and H.Z.; writing—review and editing, F.Z. and Y.C.; visualization, X.H.; supervision, S.Q. and Y.C.; project administration, Y.C.; funding acquisition, H.Z. All authors have read and agreed to the published version of the manuscript.

Funding

This research was funded by National Natural Science Foundation of China grant number [12302300] and Key Laboratory of Icing and Anti/De-icing of Aircraft [IADL20220413].

Conflicts of Interest

Authors Xiong Huang, Feng Zhou and Yong Chen were employed by the company Shanghai Aircraft Design and Research Institute. The remaining authors declare that the re-search was conducted in the absence of any commercial or financial relationships that could be construed as a potential conflict of interest.

Abbreviations

The definition of acronyms
CCAR-25the part 25 of China civil aviation regulation
NTSBnational transportation safety board
ASRSaviation safety reporting system
ACadvisory circular
DTOdelayed turn on
NASANational Aeronautics and Space Administration
AOAangle of attack
Clcoefficient of lift
Clmaxmaximum coefficient of lift
Cdcoefficient of drag
L/Dlift to drag ratio
αstAOA at stall
Cnyaw moment coefficient
Cmpitching moment coefficient
Effcontrol effectiveness
Stablongitudinal and lateral directional stability
GLC305Gates Learjet Corporation-305
NLF414Natural Laminar Flow-414
LWCliquid water contents
MVDmedian volume diameter
ICTSice-contaminated tailplane stall
SLDsupercooled large droplets

References

  1. Cebeci, T.; Kafyeke, F. Aircraft icing. Annu. Rev. Fluid Mech. 2003, 35, 11–21. [Google Scholar] [CrossRef]
  2. Cao, Y.H.; Tan, W.; Wu, Z.L. Aircraft icing: An ongoing threat to aviation safety. Aerosp. Sci. Technol. 2018, 75, 353–385. [Google Scholar] [CrossRef]
  3. Appiah-Kubi, P. US Inflight Icing Accidents and Incidents, 2006 to 2010; The University of Tennessee: Knoxville, TN, USA, 2011. [Google Scholar]
  4. Aviation Safety Network (ASN) Database. Available online: https://asn.flightsafety.org/database/ (accessed on 1 August 2024).
  5. Joint Aviation Requirements (JAR)-25: Large Aeroplanes; Joint Aviation Authorities: Schiphol-Rijk, The Netherlands, 2022.
  6. Federal Aviation Regulations (FAR) Part 25: Airworthiness Standards Transport Category Aircrafts; Federal Aviation Administration: Washington, DC, USA, 2022.
  7. CCAR-25-R4; Airworthiness Standards: Transport Category Airplanes. China Civil Aviation Regulations: Beijing, China, 2016.
  8. AC25.1419; Certification of Transport Category Airplanes for Flight in Icing Conditions. Federal Aviation Administration: Washington, DC, USA, 1999.
  9. AC20-73A; Protection Aircraft Ice. Federal Aviation Administration: Washington, DC, USA, 2006.
  10. AC25-25; Performance and Handling Characteristics in the Icing Conditions Specified in Part 25. Federal Aviation Administration: Washington, DC, USA, 2007.
  11. Broeren, A.P.; Addy, H.E., Jr.; Bragg, M.B.; Busch, G.T.; Montreuil, E. Aerodynamic Simulation of Ice Accretion on Airfoils; NASA/TP-2011-216929; Glenn Research Center: Sandusky, OH, USA, 2011.
  12. Cao, Y.H.; Yuan, K.; Li, G. Effects of ice geometry on airfoil performance using neural networks prediction. Aircr. Eng. Aerosp. Technol. 2011, 83, 266–274. [Google Scholar] [CrossRef]
  13. Hu, T.; Lv, H.; Tian, B.; Su, D. Choosing critical ice shapes on airfoil surface for the icing certification of aircraft. Procedia Eng. 2014, 80, 456–466. [Google Scholar] [CrossRef]
  14. Raj, L.P.; Yee, K.; Myong, R.S. Sensitivity of ice accretion and aerodynamic performance degradation to critical physical and modeling parameters affecting airfoil icing. Aerosp. Sci. Technol. 2020, 98, 105659. [Google Scholar]
  15. Oztekin, E.S.; Riley, J.T.; Pellicano, P. A parametric study on the aerodynamics of ice accretions on surfaces with anti/de-icing systems. In Proceedings of the AIAA AVIATION 2020 FORUM, Virtual Event, 15–19 June 2020; p. 2844. [Google Scholar]
  16. Nath, P.; Lokanathan, N.; Wang, J.; Benmeddour, A.; Nichman, L.; Ranjbar, K.; Hickey, J.P. Parametric investigation of aerodynamic performance degradation due to icing on a symmetrical airfoil. Phys. Fluids 2024, 36, 75117. [Google Scholar] [CrossRef]
  17. Bragg, M.B.; Broeren, A.P.; Blumenthal, L.A. Iced-airfoil aerodynamics. Prog. Aerosp. Sci. 2005, 41, 323–362. [Google Scholar] [CrossRef]
  18. Parkins, D. Developing critical ice shapes for use in aircraft development and certification. In Proceedings of the 45th AIAA Aerospace Sciences Meeting and Exhibit, Reno, Nevada, 8–11 January 2007; p. 91. [Google Scholar]
  19. Zhou, F.; Feng, L.; Xu, C.; Zhao, K.; Han, Z. Determination and verification of critical ice shape for the certification of civil aircraft. J. Exp. Fluid Mech. 2016, 30, 8–13. [Google Scholar]
  20. Dongyu, Z.; Fukun, Z.; Runan, P.; Yuan, W.; Lei, Y.; Yijun, N.; Jun, D. Research on critical ice shape determination and its effects on aerodynamics. Acta Aerodyn. Sin. 2016, 34, 714–720. [Google Scholar]
  21. Zhang, Q. Determination method of critical ice shapes for large civil aircraft. Civ. Aircr. Des. Res. 2019, 1, 53–58. [Google Scholar]
  22. Lynch, F.T.; Khodadoust, A. Effects of ice accretions on aircraft aerodynamics. Prog. Aerosp. Sci. 2001, 37, 669–767. [Google Scholar] [CrossRef]
  23. Gent, R.W.; Dart, N.P.; Cansdale, J.T. Aircraft icing. Philosophical Transactions of the Royal Society of London. Ser. A Math. Phys. Eng. Sci. 2000, 358, 2873–2911. [Google Scholar] [CrossRef]
  24. Shin, J. Characteristics of surface roughness associated with leading-edge ice accretion. J. Aircr. 1996, 33, 316–321. [Google Scholar] [CrossRef]
  25. Tanner, C.E. The effect of wing leading edge contamination on the stall characteristics of aircraft. SAE Trans. 2007, 116, 576–588. [Google Scholar]
  26. Bowden, D.T. Effect of Pneumatic De-Icers and Ice Formations on Aerodynamic Characteristics of an Airfoil; National Advisory Committee for Aeronautics: Washington, DC, USA, 1956.
  27. Kim, H.; Bragg, M.B. Effects of leading-edge ice accretion geometry on airfoil performance. In Proceedings of the 17th Applied Aerodynamics Conference, Norfolk, VA, USA, 28 June–1 July 1999; p. 3150. [Google Scholar]
  28. Wright, W. User’s Manual for LEWICE Version 3.2; NASA E-15537; Glenn Research Center: Sandusky, OH, USA, 2008.
  29. Addy, H.E. Ice Accretions and Icing Effects for Modern Airfoils; National Aeronautics Administration, Glenn Research Center: Sandusky, OH, USA, 2000.
  30. Bragg, M.B.; Khodadoust, A. Experimental measurements in a large separation bubble due to a simulated glaze ice shape. NASA 19880034853. In Proceedings of the 26th Aerospace Sciences Meeting, Reno, NV, USA, 11–14 January 1988. [Google Scholar]
  31. Papadakis, M.; Gile Laflin, B.; Youssef, G.; Ratvasky, T. Aerodynamic scaling experiments with simulated ice accretions. In Proceedings of the 39th Aerospace Sciences Meeting and Exhibit, Reno, NV, USA, 8–11 January 2001; p. 833. [Google Scholar]
  32. Papadakis, M.; Yeong, H.W.; Vargas, M.; Potapczuk, M. Aerodynamic performance of a swept wing with ice accretions. In Proceedings of the 41st Aerospace Sciences Meeting and Exhibit, Reno, NV, USA, 6–9 January 2003; p. 731. [Google Scholar]
  33. Shin, J.; Bond, T.H. Experimental and computational ice shapes and resulting drag increase for a NACA 0012 airfoil. In Proceedings of the California State Univ., The Fifth Symposium on Numerical and Physical Aspects of Aerodynamic Flows, Long Beach, CA, USA, 13–15 January 1992. [Google Scholar]
Figure 1. The effect of roughness on Clmax [17]. (a) Effect of the height, the chordwise extent, and the location of roughness. (b) Effect of the density and the height of roughness.
Aerospace 11 00710 g001
Figure 2. The effect of roughness, density, and height on stall AOA [25].
Aerospace 11 00710 g002
Figure 3. The wind tunnel results from the roughness distribution effect on the aerodynamic performance [25]. (a) Effect of roughness distribution near the leading edge. (b) Effect of roughness distribution after the leading edge.
Aerospace 11 00710 g003aAerospace 11 00710 g003b
Figure 4. The schematic diagram of parameters characterizing the double-horn ice shape [17].
Aerospace 11 00710 g004
Figure 5. The effect of the height and angle of the horn on the aerodynamic performance [27]. (a) Horn height. (b) Horn angle.
Aerospace 11 00710 g005
Figure 6. The effect of the horn angle on the maximum lift [27].
Aerospace 11 00710 g006
Figure 7. The effect of AOA on the horn shape of a symmetric airfoil.
Aerospace 11 00710 g007
Figure 8. The effect of AOA on the horn shape of a supercritical airfoil.
Aerospace 11 00710 g008
Figure 9. The effect of surface roughness of horn on the aerodynamic performance [30].
Aerospace 11 00710 g009
Figure 10. The effect of the size of the horn tip on the aerodynamic performance [27].
Aerospace 11 00710 g010
Figure 11. The effect of the cross-sectional shape of the horn on the aerodynamic performance [31]. (a) Cross-sectional shapes of ice accretion. (b) Effect on the aerodynamic performance.
Aerospace 11 00710 g011
Figure 12. The effect of the thickness of streamwise ice on aerodynamic performance [27].
Aerospace 11 00710 g012
Figure 13. The schematic diagram of ice shapes at different profiles of the swept-back wing [32].
Aerospace 11 00710 g013
Figure 14. The summary of the effect of ice shapes on aerodynamic performance, measured by IRT [32].
Aerospace 11 00710 g014
Figure 15. The effect of ice shapes on maximum lift via wind tunnels and LEWICE [32].
Aerospace 11 00710 g015
Figure 16. The effect of ice shapes on the stall AOA via the wind tunnel and LEWICE [32].
Aerospace 11 00710 g016
Figure 17. Roughness ice, horn ice, and streamwise ice on the leading edge of the NLF0414 airfoil [29].
Aerospace 11 00710 g017
Figure 18. The comparison of the icing effect on the aerodynamic performance at different stages [29].
Aerospace 11 00710 g018
Figure 19. The effect of ice shape on drag increment corresponds to different icing conditions [33].
Aerospace 11 00710 g019
Table 1. The recommended ice shapes concerned aerodynamic performance in each flight phase.
ChaptersContentsRecommended Ice ShapesAerodynamic Performance
PerformanceClmaxCdL/DαstClCmEffStabCn
25.103Stall speedTakeoff ice
Final takeoff ice
En route ice
Holding ice
25.111Takeoff PathTakeoff ice
25.119Landing Climb: all-Engines-OperatingHolding ice
25.121Climb: one-engine-inoperativeFinal takeoff ice
25.123En route flight pathsEn route ice
25.125LandingHolding ice
Maneuverability and Stability ClmaxCdL/DαstClCmEffStabCn
25.143Control ability and maneuverability—generalHolding ice
i(2)Roughness
jDTO
25.145Longitudinal controlHolding ice
25.147Directional and lateral controlHolding ice
25.161TrimHolding ice
25.171Stability—general
25.175Demonstration of static longitudinal stabilityHolding ice
25.177Static lateral—directional stabilityHolding ice
Stall ClmaxCdL/DαstClCmEffStabCn
25.201
25.203
Stall demonstration
Stall characteristics
Holding ice
25.207Stall warningHolding ice
DTO
Failure ice
25.237Wind velocitiesLanding ice
25.251Vibration and buffetingResidual ice
25.1309Failure conditionsFailure ice
●: Concerned aerodynamic performance.
Table 2. The classification of ice shapes according to the geometry.
Flight PhaseClassification by the Geometry of Ice
TakeoffRoughness ice
Final takeoffRoughness ice
Small-size horn ice
HoldingLarge-size horn ice
En routeSmall-size horn ice
DTORoughness ice
FailureLarge-size horn ice
Table 3. The ice shapes and aerodynamic effects on the NLF0414 airfoil.
Ice ShapeReduction of Maximum LiftReduction of Stall AOA
Roughness ice0.13
Horn ice0.64
Streamwise ice0.32
Table 4. The recommended ice shapes and criteria of criticality.
Flight PhaseClassification by Ice GeometryCriterion of Criticality
TakeoffRoughness iceThe larger the roughness height and the larger the distribution range (impact limit) of ice near the leading edge on the upper surface, the more critical it will be.
Final takeoffRoughness iceSame as the takeoff.
Small-size horn ice1. The larger the height of the upper horn and the further downstream, the more critical it will be.
2. The larger the total height of the projection of the horn in the direction of the lifting force, the more critical it will be.
HoldingLarge-size horn iceSame as the second case of final takeoff.
En routeSmall-size horn iceSame as the second case of final takeoff.
DTORoughness iceSame as the takeoff.
FailureLarge-size horn iceSame as the second case of final takeoff.
Table 5. The criterion of critical ice shape for each component.
Flight PhaseProtected Area of SlatUnprotected Area of SlatHorizontal TailVertical Tail
TakeoffThe larger the upper impact limit and the roughness height, the more critical it will be.The larger the lower impact limit and the roughness height, the more critical it will be.The larger the impact limit, the more critical it will be.
DTOSame as takeoff
Final takeoffSame as takeoff
The larger the total height of the projection of the horn in the direction of the lifting force, the more critical it will be.The larger the total height of the projection of the horn in the direction of the trimming lifting force, the more critical it will be.The larger the total height of the projection of the horn in the direction of the side force, the more critical it will be.
HoldingSame as the second case of final takeoff.
En routeSame as the second case of final takeoff.
FailureSame as the second case of final takeoff.
ICTSNoneSame as the second case of final takeoff None
Disclaimer/Publisher’s Note: The statements, opinions and data contained in all publications are solely those of the individual author(s) and contributor(s) and not of MDPI and/or the editor(s). MDPI and/or the editor(s) disclaim responsibility for any injury to people or property resulting from any ideas, methods, instructions or products referred to in the content.

