Article

Heat Transfer Model Based on Flow Pattern during Flow Boiling in Rectangular Microchannels

1
School of Mechanical Engineering, Beijing Institute of Technology, Beijing 100081, China
2
Institute of Engineering Thermophysics, Chinese Academy of Sciences, Beijing 100190, China
3
College of Mechanical and Electrical Engineering, Beijing University of Chemical Technology, Beijing 100029, China
*
Authors to whom correspondence should be addressed.
Aerospace 2024, 11(9), 733; https://doi.org/10.3390/aerospace11090733
Submission received: 1 August 2024 / Revised: 2 September 2024 / Accepted: 5 September 2024 / Published: 6 September 2024
(This article belongs to the Special Issue Aerospace Human–Machine and Environmental Control Engineering)

Abstract

:
In thermal management applications using two-phase flow boiling, rectangular microchannels hold significant promise due to their ease of manufacturing and effective heat transfer characteristics. In this work, we combined experimental and theoretical analyses to propose a theoretical model based on thin liquid film evaporation for predicting heat transfer performance in rectangular cross-sectional microchannels. The heat transfer model is segmented into five zones based on two-phase flow patterns and transient liquid film thickness. These zones represent different flow boiling heat transfer mechanisms over time in microchannels: the liquid slug zone, elongated bubble zone, long-side wall dryout zone, corner liquid evaporation zone, and full dryout zone. The new model comprehensively explains experimental phenomena observed, including long-side wall dryout and thinning of the liquid film on the short-side wall. To validate our model, numerical solutions were computed to study the spatial and temporal variations in heat transfer coefficients. The results exhibited a consistent trend with experimental data regarding average heat transfer coefficients. We also analyzed factors influencing flow boiling characteristics, such as microchannel aspect ratio, hydraulic diameter, measurement location, fluid mass flux, and wall heat flux.

1. Introduction

Flow boiling in microchannels has huge potential to carry out high heat transfer performance due to the larger contact area-to-volume ratio of fluid, coupled with the advantage of latent heat of vaporization compared to traditional cooling [1,2]. It is one of the paramount research topics in the field of efficient heat transfer with extensive industrial applications including compact heat exchangers, refrigeration systems, and heat pumps [3]. For example, compact heat exchangers have significant advantages in spacecraft thermal management, especially where space constraints and weight limitations are critical. The design challenge is to achieve uniform flow and temperature, as well as high thermal efficiency within a minimized size [4,5]. Extensive research has been conducted on heat transfer coefficients, pressure drop, transient flow patterns, and flow instabilities in microchannels [6,7]. The capability to precisely predict flow boiling heat transfer is of importance to design the microchannel cooling device.
In order to properly understand the thermophysics of heat transfer in microchannels, various flow patterns have been explored in the literature [8]. Experimentally investigating flow boiling phenomena using FC-77 in a square microchannel of 389 μm, Chen and Garimella [9] found that bubble flow dominates at low heat flux, with the bubbles coalescing to form vapor slug as the heat flux increases. Harirchian and Garimella [10] identified five regimes with FC-77 in rectangular microchannels: bubbly, slug, churn wispy annular, and annular flow. They discovered that the flow patterns in smaller microchannels (100 μm and 250 μm wide) differ significantly from those in wider microchannels (400 μm and larger). The variation in flow pattern highly impacts the heat transfer capabilities. Thome et al. [11] reviewed recent experimental studies on two-phase flow patterns in microchannel, identifying bubble flow, slug flow, annular flow, and mist flow as the four primary flow patterns and developing a standard flow pattern classification.
Despite researchers making significant efforts to comprehend the basic phenomena of flow boiling, there does not appear to be a consensus on the heat transfer mechanisms of microchannel flow boiling. Bao et al. [12] concluded that nucleate boiling is the dominant heat transfer mechanism through flow boiling experiments in a 1.95 mm circular microchannel. The experiments, which used R-11 and HCFC123, were conducted with mass fluxes ranging from 50 to 1800 kg/m2·s and heat flux varying between 5 and 200 kW/m2. The results indicated the heat transfer coefficient is heavily influenced by heat flux and pressure, while the mass flux and vapor quality have minimal impact. Yu et al. [13] also found nucleate boiling to be the dominant heat transfer mechanism for flow boiling in a 2.98 mm circular microchannel at a mass flux of 50–200 kg/m2·s. Lee and Lee [14] measured boiling heat transfer coefficients for R-113 during flow boiling in rectangular microchannels with low aspect ratios. They reported the heat transfer coefficient increases with mass flux and vapor quality, while the effect of heat flux is minor, with mass fluxes varying from 50 to 200 kg/m2·s and qualities between 0.15 and 0.75. Qu and Mudawar [15] revealed that the primary heat transfer mechanism is forced convective boiling through a test section consisting of 21 parallel microchannels of 231 × 713 μm, with mass fluxes ranging from 135 to 402 kg/m2·s. The experimental results indicated that the relationship between flow boiling heat transfer coefficient and mass flux is close, while its relationship with heat flux is relatively weak. Tran et al. [16] experimentally investigated the boiling heat transfer mechanism in both circular and rectangular microchannels using R-12. The operating parameters were a heat flux ranging from 3.6 to 129 kW/m2 and a mass flux ranging from 44 to 832 kg/m2·s. They pointed out that heat transfer performance is controlled by heat flux when the wall superheat exceeds 2.75 K, and heat transfer relies on mass flux when the wall superheat is below 2.75 K. Yen et al. [17] further proposed that in square and circular microchannels with mass fluxes ranging from 100 to 800 kg/m2·s, when the vapor quality is less than 0.4, the nucleate boiling effect dominates the heat transfer mechanism, whereas the convective boiling effect controls heat transfer when vapor quality is higher.
Ali et al. [18] experimentally investigated flow boiling heat transfer in 781 μm horizontal circular microchannels using R134a and R245fa as working fluids. No nucleation was observed in the elongated bubble zone under conditions of a mass flux of 175–500 kg/m2·s and a heat flux of 5–60 kW/m2, and they concluded that thin film evaporation is the main heat transfer mechanism. Bigham and Moghaddam [19] summarized four heat transfer mechanisms of flow boiling in rectangular microchannels: (1) microlayer evaporation, (2) interline evaporation, (3) transient conduction, and (4) micro-convection by using high-resolution temperature sensors. Okajima and Stephan [20] performed a numerical simulation of two-phase heat transfer characteristics in a 200 μm circular microchannel with FC-72. They pointed out that the heat transfer is primarily controlled by liquid film evaporation at low superheat. Mukherjee et al. [21] conducted a numerical simulation to analyze bubble growth during flow boiling in a square microchannel with a hydraulic diameter of 200 μm. Their numerical results displayed that heat transfer is unaffected by mass flux but occurs mainly at the evaporating liquid–vapor interface.
These previous observations elucidate the heat transfer mechanisms in microchannels, indicating that heat transfer characteristics are closely related to flow patterns, with different flow regions corresponding to different heat transfer mechanisms. Furthermore, flow boiling heat transfer was also analyzed by constructing theoretical models. Jacobi and Thome [22] concluded that thin film evaporation is the dominant heat transfer mechanism in the elongated bubble regime and further proposed a model to predict heat transfer behavior, which can predict the heat transfer coefficient qualitatively and quantitatively, thus proving the validity of the thin film evaporation heat transfer mechanism. However, the effects of flow, thermal, and geometry on film thickness need to be taken into account. On this basis, Thome et al. [23] introduced a three-zone flow boiling model to consider the heat transfer mechanism of thin film evaporation in the elongated bubble regime, which divides the flow boiling process in circular microchannels into three zones: (1) a liquid slug zone; (2) an evaporating elongated bubble zone; (3) a vapor slug zone. The model successfully evaluated time-averaged heat transfer variation, taking into account the effects of heat flux, vapor quality, mass flux, saturation pressure, and tube diameter [24]. Consolini and Thome [25] modified the three-zone heat transfer model by taking into account bubble coalescence. Costa-Party and Thome [26] presented a heat-dependent flow pattern transition criterion by combining the updated three-zone heat transfer model and the annular flow model. Wang et al. [27] utilized an augmented Young–Laplace equation and the kinetic theory to analyze mass transport at the vapor–liquid interface, and discussed the effects of disjoining pressure and capillary pressure on evaporation suppression. They indicated that more than 50% of heat transfer derives from the micro-region of the meniscus. Harirchian and Garimella [28] developed flow-regime-based models for predicting the heat transfer coefficient and pressure drop in slug flow and annular flow. Wang et al. [29] extended the three-zone flow boiling model to a four-zone flow boiling model specifically for rectangular microchannels. Considering the non-uniform distribution of liquid film varies circumferentially within the rectangular cross-section, the boiling process is segmented into four zones: (1) liquid slug zone; (2) elongated bubble zone; (3) partial dryout zone; (4) full dryout zone. Magnini and Thome [30] modified the three-zone model during flow boiling in circular microchannels accounting for the thermal inertia of liquid film and liquid recirculation in slug flow. Jain et al. [31] constructed a heat transfer model for flow boiling in a rectangular microchannel, considering pressure fluctuation and liquid film thinning. The model consisted of five zones: (1) liquid slug; (2) partially confined bubble; (3) fully confined bubble; (4) partial dryout; (5) full dryout. It appears from these reviews that studies on heat transfer mechanism of rectangular microchannels are still incomplete.
Numerous studies have investigated two-phase heat transfer in single test tubes or parallel arrays of microchannels. However, research on liquid film thickness variation and heat transfer characteristics during flow boiling in rectangular microchannels remains limited. The bottleneck problem is the non-uniform distribution of liquid film thickness within the cross-section of a rectangular microchannel, making it difficult to precisely measure the transient liquid film thickness. The four-zone flow boiling model for rectangular microchannels proposed by Wang et al. [29] subdivided the dryout zone into a partial dryout zone and a full dryout zone, assuming that the liquid film thickness and thinning rate in the center of the long-side and short-side walls were identical, which is inconsistent with the experimental observation in this study. Based on accurate transient liquid film thickness measurement in the center of both side walls of the rectangular microchannel by a laser confocal displacement meter (LFDM), the current work develops a model for predicting the flow boiling heat transfer performance in rectangular microchannels. The spatially averaged and timed-averaged heat transfer coefficients are compared with the experimental results. Numerical calculations have been conducted to investigate the factors influencing heat transfer performance, providing valuable insights for the optimization of microchannel heat exchanger design.

2. Experimental System and Procedure

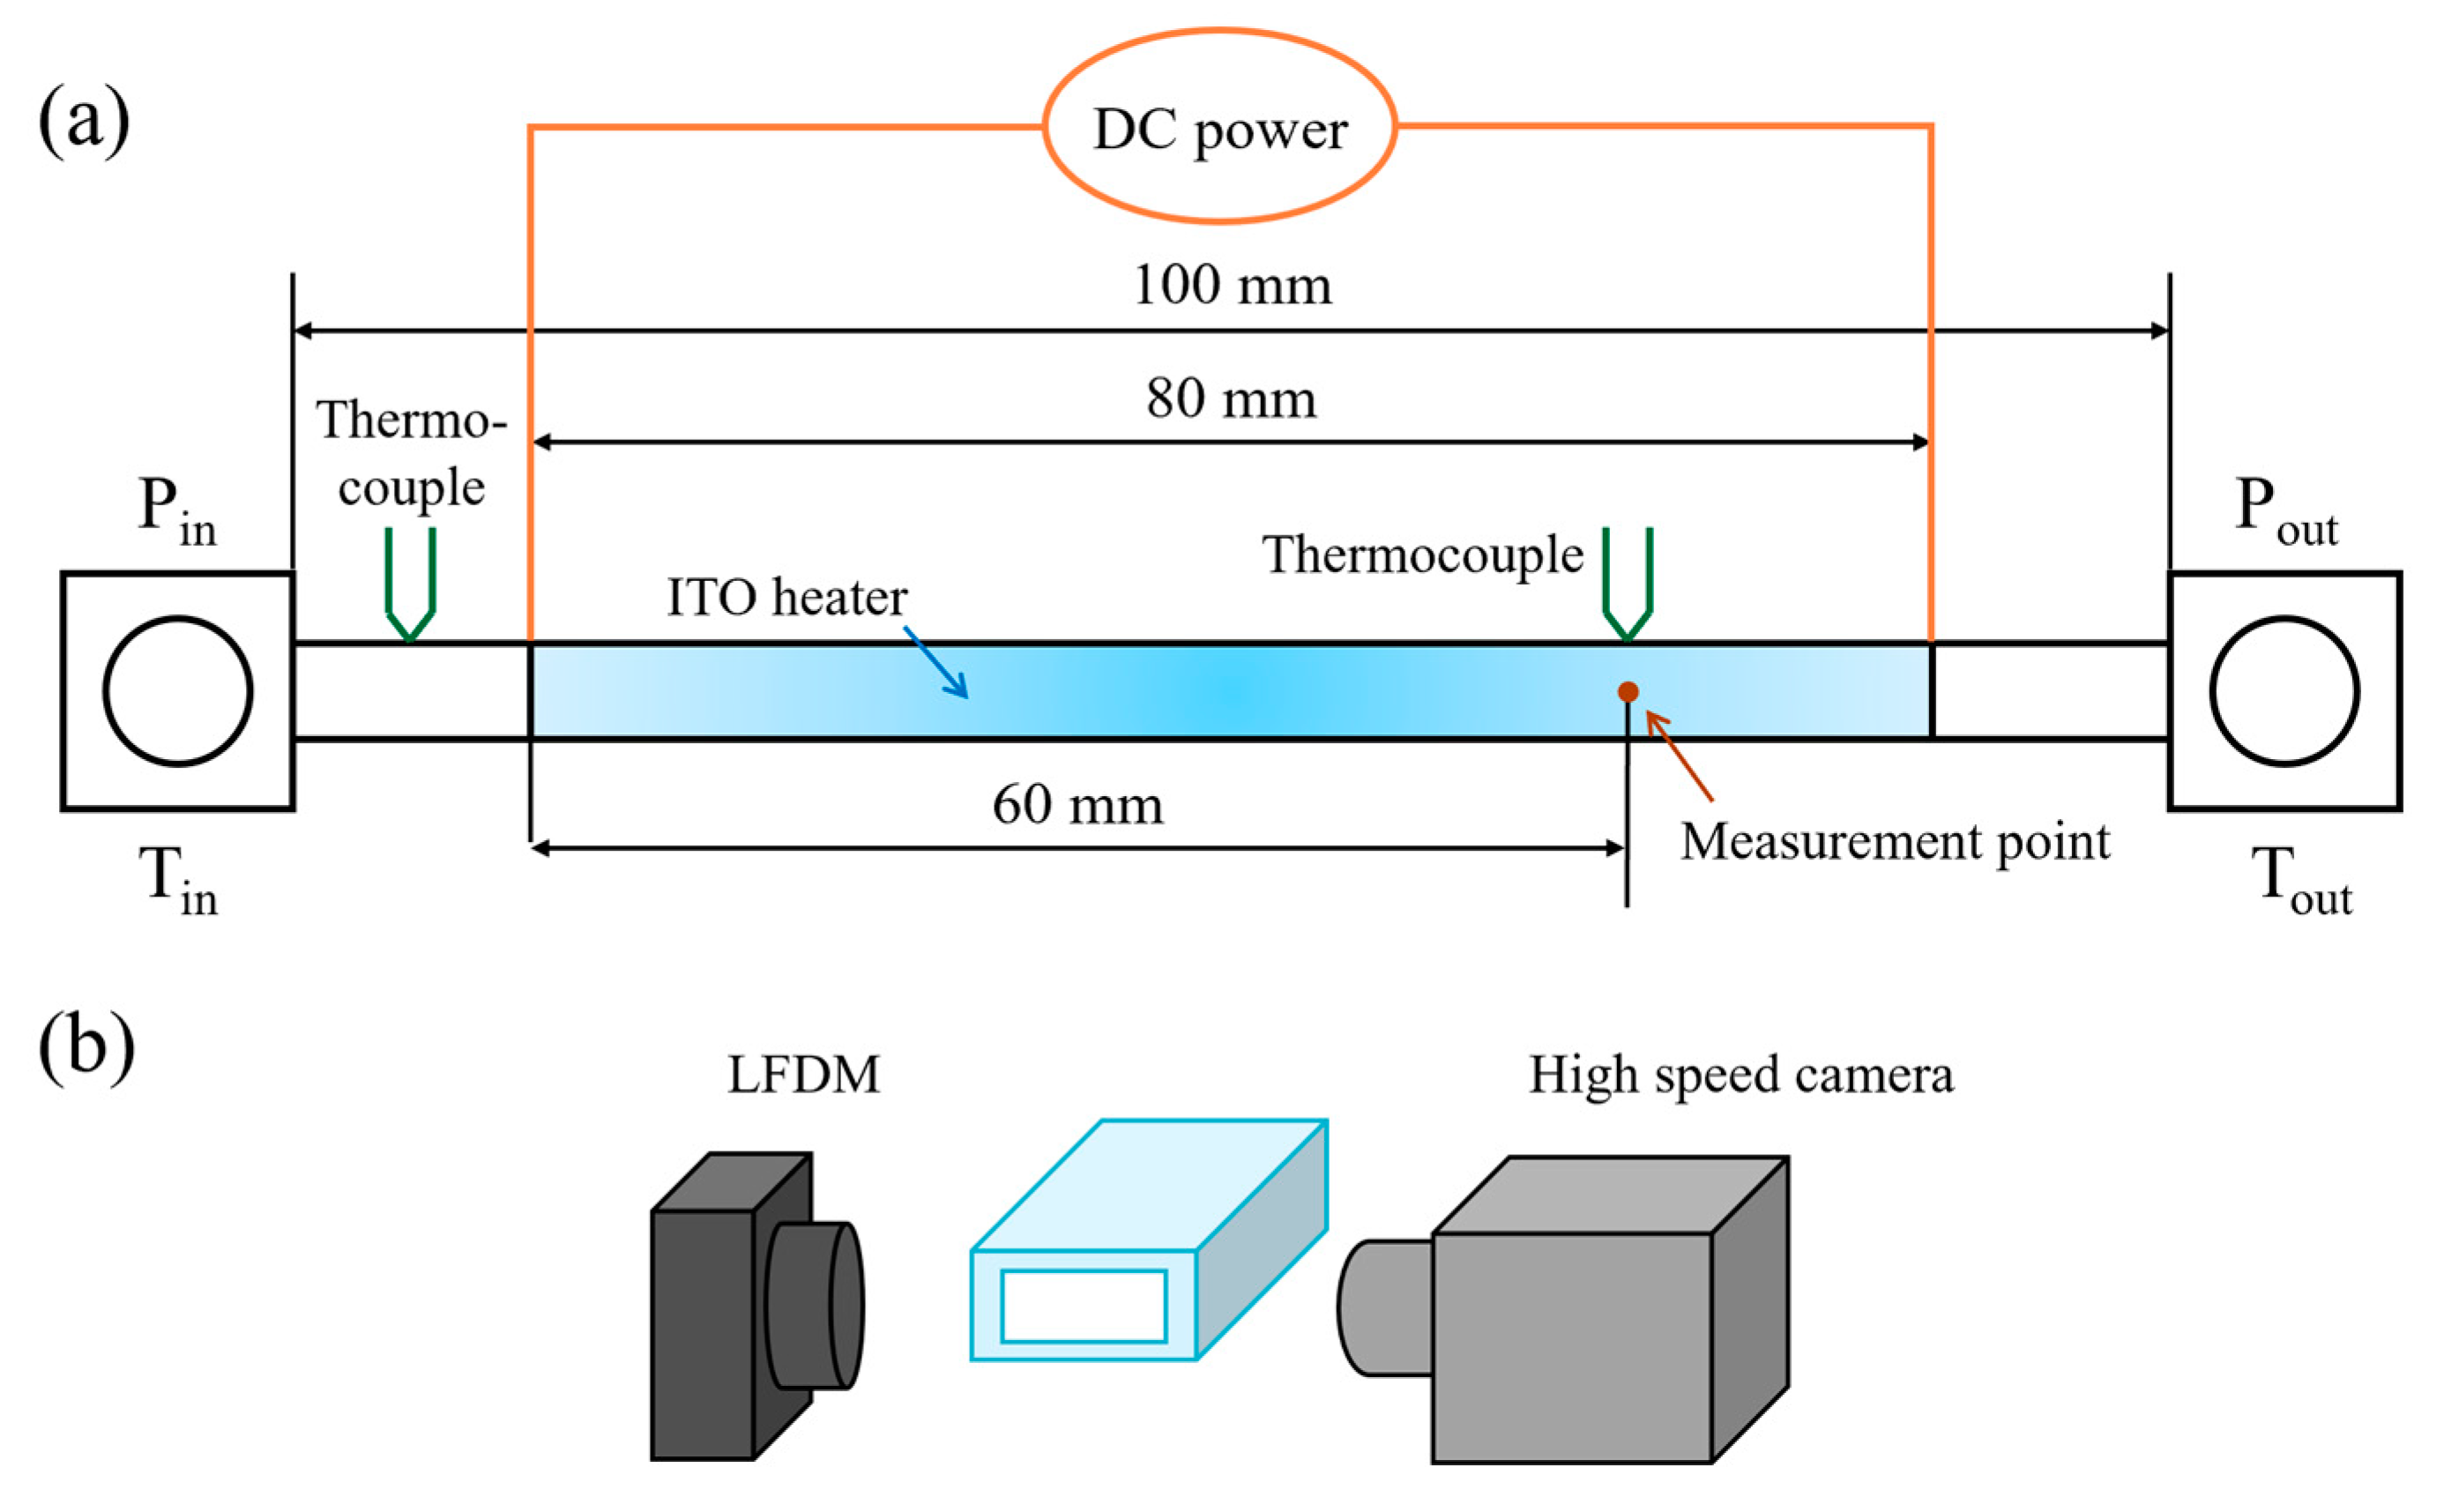
2.1. Experimental System

The experimental system was set up to observe the flow pattern and predict heat transfer performance, as shown in Figure 1. The working fluid was driven by a micropump (2 PB-0240, Beijing Xingda Science & Technology Development Co., Ltd., Beijing, China) from the receiver through a 7 μm filter to the preheating section. The working fluid reached its saturation temperature at the preheating outlet through electric power heating. The saturated working fluid flowed through the test section, where it was recorded by a high-speed camera (Phantom R310, Vision Research, Inc., Wayne, NJ, USA) and measured by a laser confocal displacement meter (LT9011 M, Keyence Corp., Osaka, Japan) at 70 mm from the inlet. The high-speed camera captured at 1000 fps with a resolution of 768 × 480 pixels and an exposure time of 480 μs. The laser confocal displacement meter (LFDM) has a response time of 0.64 ms, a laser spot diameter of 2 μm, and a measurement range of ±0.3 mm.
The test section, made of quartz glass (Chengteng Equipment Co., Ltd., Beijing, China), had an ITO film deposited on it to supply uniform heat flux, as shown in Figure 2. The test section was 100 mm long and oriented horizontally, with a heated length of 80 mm. The inner dimensions of the rectangular microchannel in the test section were 0.3 × 0.8 mm2, and the inner dimensions of the square microchannel were 0.7 × 0.7 mm2. Water and ethanol were used as working fluids, with mass flux ranging from 0.25 to 290.89 kg/m2·s.
The pressures at the inlet and outlet of the test section were measured by pressure sensors (Huba 511, Huba Control Corp., Würenlos, Switzerland). K-type thermocouples were located at both the inlet and outlet of the preheating section and test section to measure liquid temperatures. High-precision T-type thermocouples were used to measure ambient temperature and the wall temperature at the measurement point. The diameter of T-type thermocouples was 100 μm and the response time was 0.01 s. The signals of liquid film thickness, temperature, pressure, and visual images were synchronously obtained using a data acquisition system (National Instrument Corp., Austin, TX, USA) and LabVIEW 2019 software.

2.2. Experimental Procedure

The microchannels were cleaned by ultrasonication to remove potential stains before experiments. To determine the actual heat load applied to the heat section, heat loss measurements were performed by heating empty microchannels to achieve thermal balance.
During the experiments, the flow rate of working fluid was kept constant. The heating power was adjusted to ensure the outlet temperature of the pre-heater remained at the saturation temperature. The detailed method for measuring liquid film thickness has been thoroughly described in previous research [32,33,34]. All data, including flow boiling images, film thickness, temperature, and pressure, were synchronously recorded by the LabVIEW software. The above experimental procedure was repeated under varying heat fluxes and mass flux conditions.

2.3. Experimental Data Reduction

The total heating load in the test section was supplied by the DC power, expressed as
Q = U I
where U and I are voltage and current. The heat loss Qloss of rectangular microchannels can be calculated using empirical correlations obtained through the empty-channel experiments, as follows:
Q loss = 0.0319 ( T wout T amb ) 0.1017
where Twout and Tamb are the microchannel outer wall temperature and ambient temperature, respectively.
The heat flux on the microchannel walls during the experiments can be calculated from
q = Q Q loss P H L H
where PH is the perimeter of the microchannel cross-section, and LH is the length of the heating area. The maximum relative uncertainty of heat flux is 2.58%. The mass flux of working fluid is calculated from the flow rate of the micropump V and the cross-sectional area A of the microchannel:
G = ρ V A
The maximum relative uncertainty of mass flux is 2.7%. The local heat transfer coefficient of the microchannel is calculated from
T w = T wout q δ w λ w
h = q T W T sat
where δw is the wall thickness of the microchannels, and λw is the thermal conductivity of the Pyrex glass. The relative uncertainty of the heat transfer coefficient is 2.58%.

3. The Five-Zone Flow Boiling Model

The four-zone flow boiling model proposed by Wang et al. [29] considers the impact of microchannel cross-sectional shape on liquid film distribution, subdividing the dryout zone into a partial dryout zone and a full dryout zone. However, it assumed identical thinning rates for liquid film on both the long-side and the short-side walls, which led to simultaneous dryout on all four sides of a rectangular cross-section. This assumption is not consistent with our experimental observations. Therefore, we have modified the four-zone model into a five-zone flow boiling model specifically for rectangular microchannels. This adjustment aims to more precisely predict heat transfer coefficients of flow boiling in non-circular microchannels.

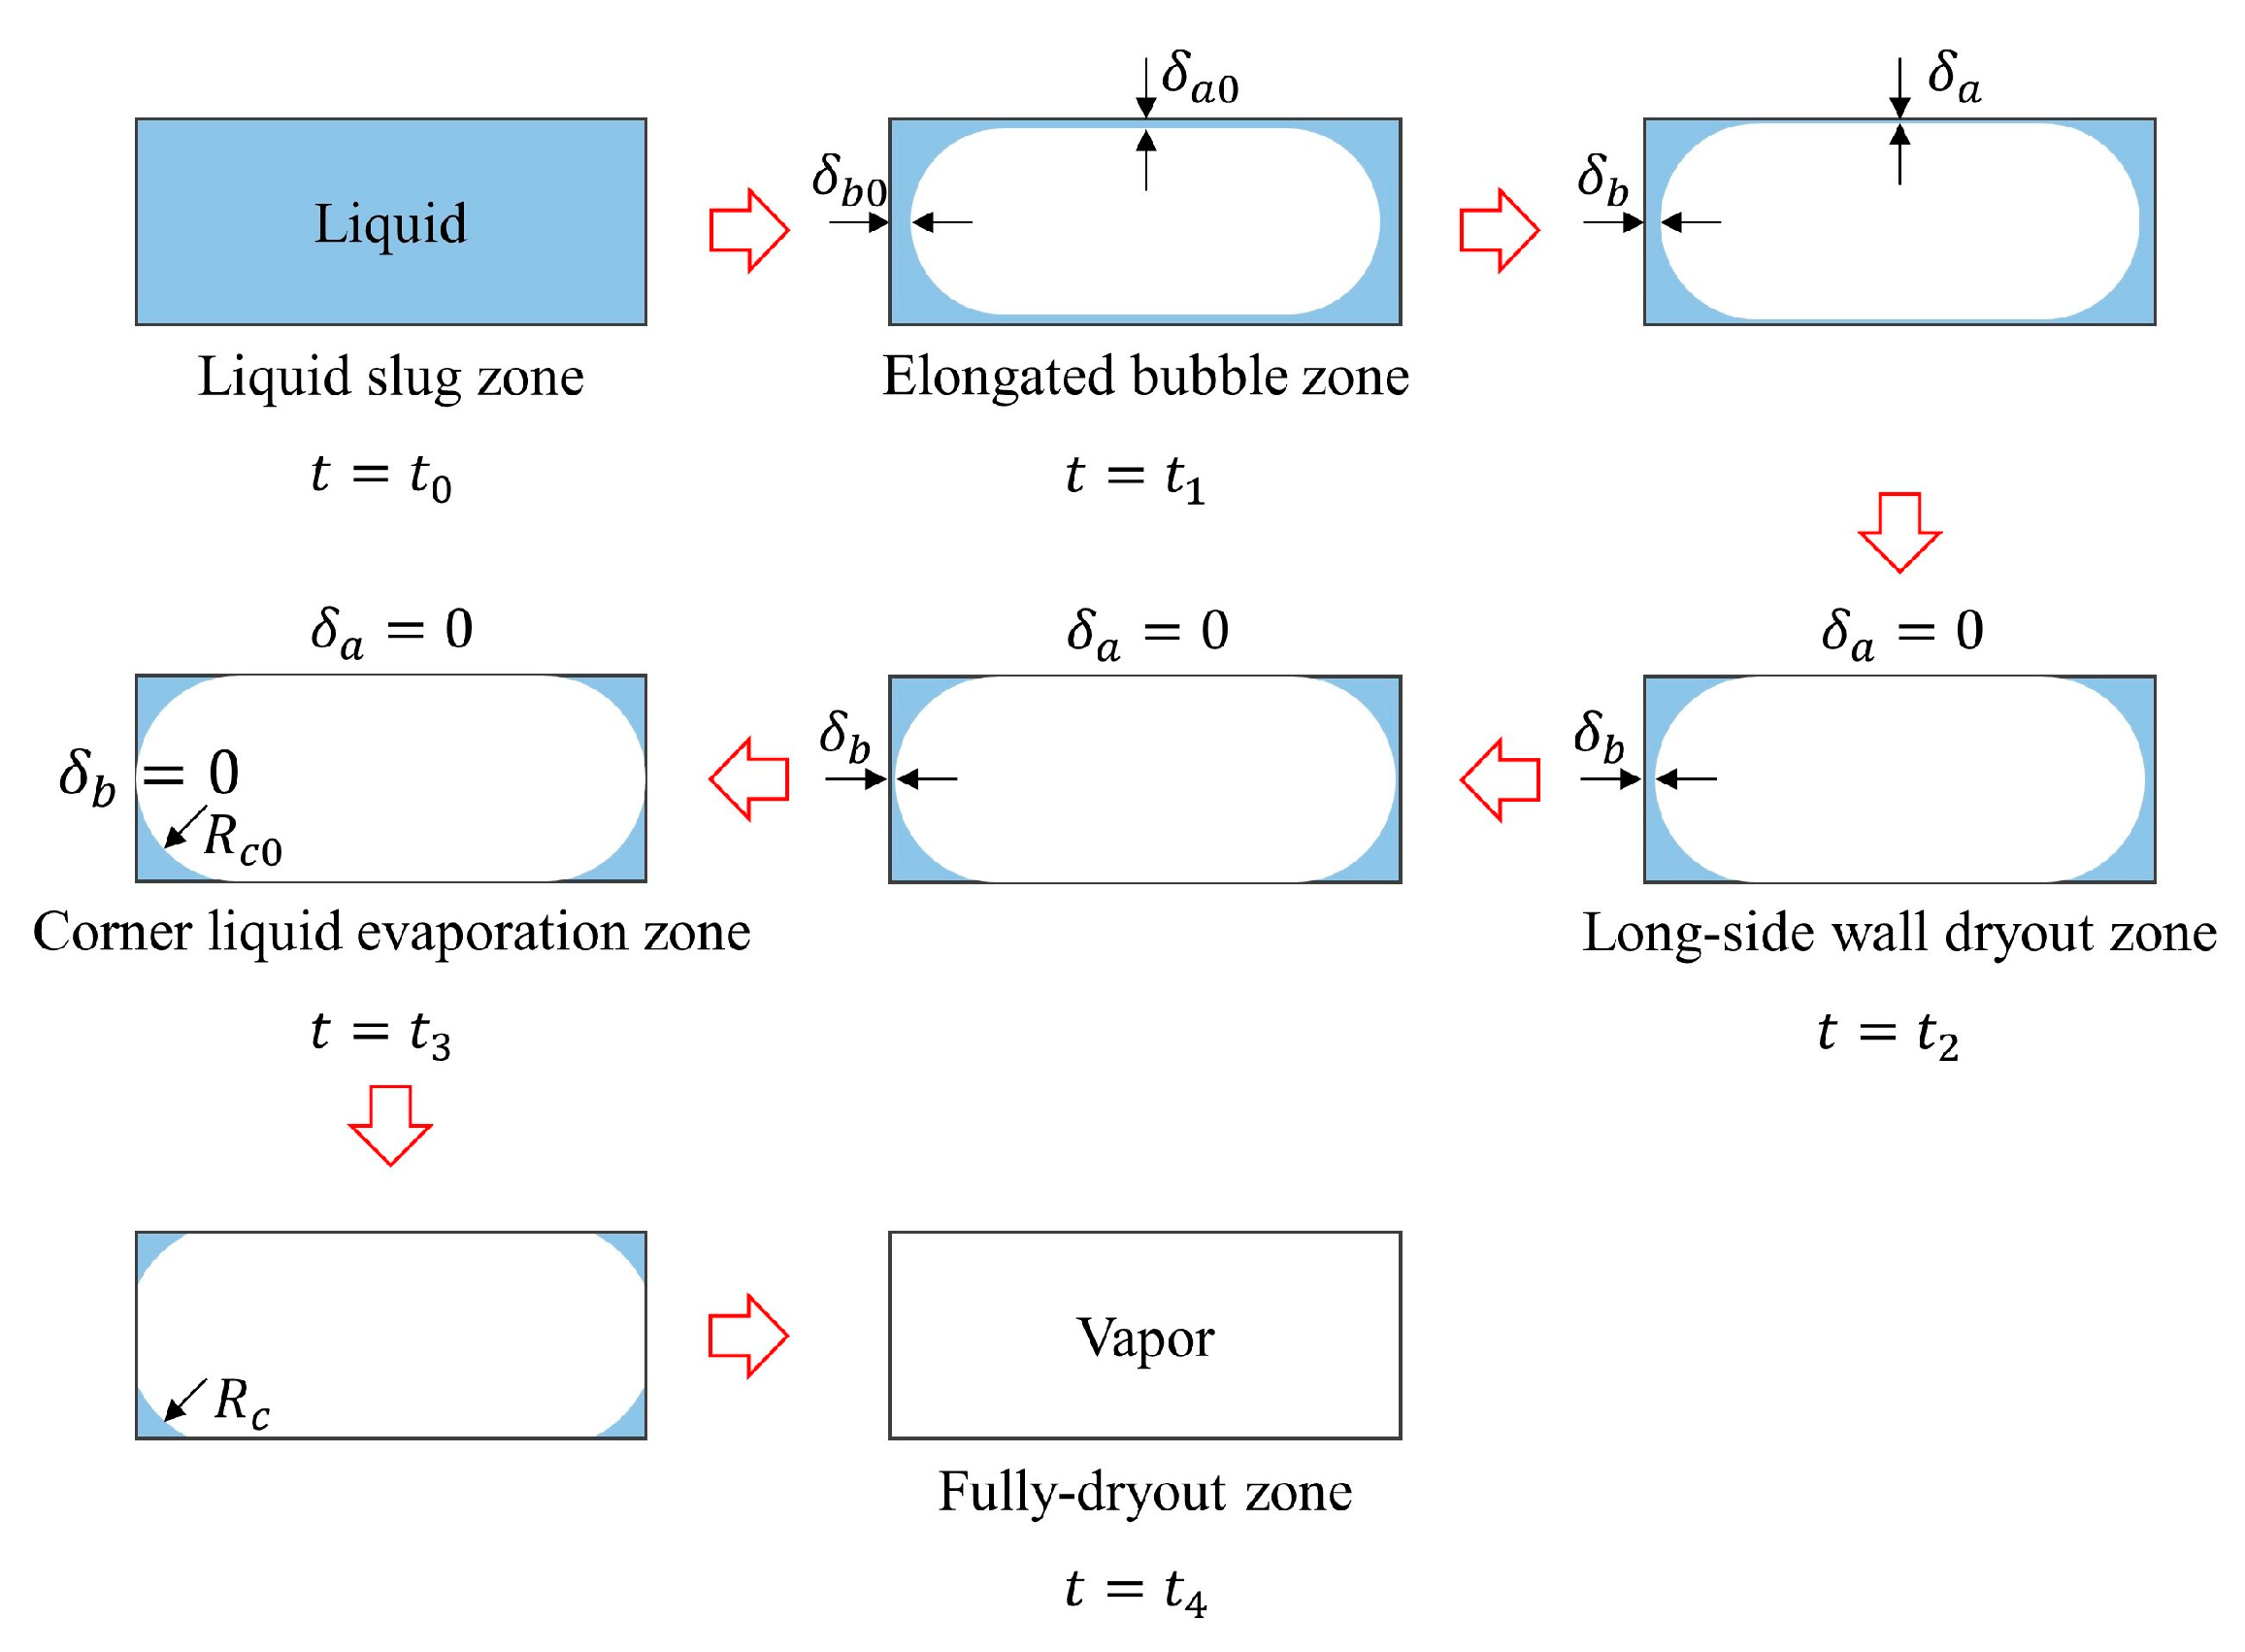
3.1. Characterization of Five-Zone Flow Boiling Model

We present a five-zone flow boiling model to characterize flow boiling in rectangular microchannels, where the cyclic passages of liquid slug, elongated bubble, and vapor slug appear in turn. As shown in Figure 3, the evaporation cycle can be divided into the liquid slug zone, the elongated bubble zone, the long-side wall dryout zone, the corner liquid evaporation zone, and the full dryout zone. In the elongated bubble zone, liquid film exists on both the long-side and short-side walls, thinning under the effect of wall heating. In the long-side wall dryout zone, the liquid film remains only in the center of the short-side wall and continues to thin. In the corner liquid evaporation zone, liquid accumulates only in the corners and continues to evaporate. Liquid in the cross-section of the microchannel evaporates completely in the full dryout zone.

3.2. Assumptions

Figure 4 illustrates the process of flow boiling in a rectangular microchannel. A uniform wall heat flux q is imposed on each of the four sides of the microchannel, and the mass flux of working fluids at the inlet is denoted as G. The liquid at the inlet has reached saturation temperature at z = 0 cross-section, where the nucleating bubble grows until confined by microchannel walls, forming a vapor slug. To clarify the model, the following assumptions are made, in accordance with those made by Thome et al. [23], Wang et al. [29], and Jain et al. [31].
Firstly, the heat flux is uniform and does not vary over time. Secondly, all the heat flux is utilized for evaporation. Thirdly, the working fluid is considered to be saturated from the nucleation point. Fourthly, bubbles are assumed to be in a saturated state, with a constant pressure drop and unchanged physical properties. Fifthly, the liquid film decreases linearly along the axial direction. Sixthly, the liquid film thickness is very small relative to the microchannel dimensions. Then, evaporation arises only at the vapor–liquid interface, and the thermal inertia of the microchannel wall is neglected. Eighthly, the bubble in the elongated bubble zone and long-side wall dryout zone is considered to be a rounded rectangle shape. In the corner liquid evaporation zone, liquid accumulates in the four corners, each forming a quarter-circle cross-section.

3.3. Initial Conditions and Basic Parameter Calculation

The flow boiling model is one-dimensional along the flow direction, as illustrated in Figure 5, and the liquid slug and the vapor slug alternately pass through the microchannel at the z = 0 cross-section. Due to wall heating, the liquid evaporates into vapor during the downstream movement, so the liquid slug shortens while the vapor slug lengthens. Since the vapor density is significantly lower than that of the liquid, the rate of liquid slug shortening is much lower than the rate of vapor slug lengthening. Therefore, the speed of movement of the liquid slug and vapor slug increases along the flow direction.
The liquid passing through the z = 0 cross-section forms an initial liquid slug, and the length of the initial liquid slug Ll0 is determined by
L l 0 = G ρ l τ
where G is the mass flux of liquid, ρl is the liquid density, and τ is the bubble formation period at z = 0 cross-section.
The initial vapor slug is transformed from the bubble grown spherically to be confined by the microchannel wall, so the length of the initial vapor slug can be calculated using the one-dimensional model:
L v 0 = 4 3 π ( H 2 ) 3 W H = π H 2 6 W
where Lv0 is the length of initial vapor slug, and W and H represent the width and height of the rectangular microchannel cross-section.
The initial vapor quality χ0 can be calculated from [29]
χ 0 = ρ v W H L v 0 ρ v W H L v 0 + ρ l W H L l 0 = 1 1 + 6 G τ W ρ v π H 2
where ρv is vapor density. According to thermal equilibrium, all the heat applied to the microchannel is used for the liquid evaporation until the liquid is completely evaporated at χ = 1.
q 2 ( W + H ) L χ = 1 = G ( 1 χ 0 ) W H h lv
where hlv is the latent heat. Hence, the length of the microchannel at χ = 1 can be formulated by
L χ = 1 = G ( 1 χ 0 ) W H h lv q 2 ( W + H )
The vapor quality χ has a linear distribution along the flow direction:
χ = χ 0 + z L χ = 1 ( 1 χ 0 )
Hence, the length of liquid slug and vapor slug across z cross-section in a period can be obtained from
L l = G τ ( 1 χ ) ρ l
L v = G τ χ ρ v
The velocity of the flow field across the z cross-section is obtained from
U = G χ ρ v + G ( 1 χ ) ρ l
Further, the resident time of vapor slug and liquid slug can be expressed as
t 1 = L l U = τ 1 + ρ l ρ v χ 1 χ
t v = L v U = τ 1 + ρ v ρ l 1 χ χ

3.4. Five Zone Heat Transfer Coefficient Calculation

To predict the flow boiling heat transfer coefficient in rectangular microchannels, the heat transfer coefficients of five zones (the liquid slug zone, the elongated bubble zone, the long-side wall dryout zone, the corner liquid evaporation zone, and the full dryout zone) are analyzed in detail.

3.4.1. Heat Transfer Coefficients in the Liquid Slug Zone and Full Dryout Zone

When the measurement point passes through the liquid slug zone or full dryout zone, the heat transfer mechanism is single-phase convection. Therefore, the heat transfer coefficients are derived from the corresponding local Nusselt numbers:
h l = N u λ l D h
h v = N u λ v D h
where λl and λv represent the thermal conductivity of liquid and vapor, and Dh represents the hydraulic diameter of rectangular microchannels. For the single-phase laminar fully developed condition, the Nusselt numbers can be calculated using the empirical formula developed by Shah and London [35] as
N u = 8.235 ( 1 2.0421 α + 3.0853 α 2 2.4765 α 3 + 1.0578 α 4 0.1861 α 5 )
where α = H/W.

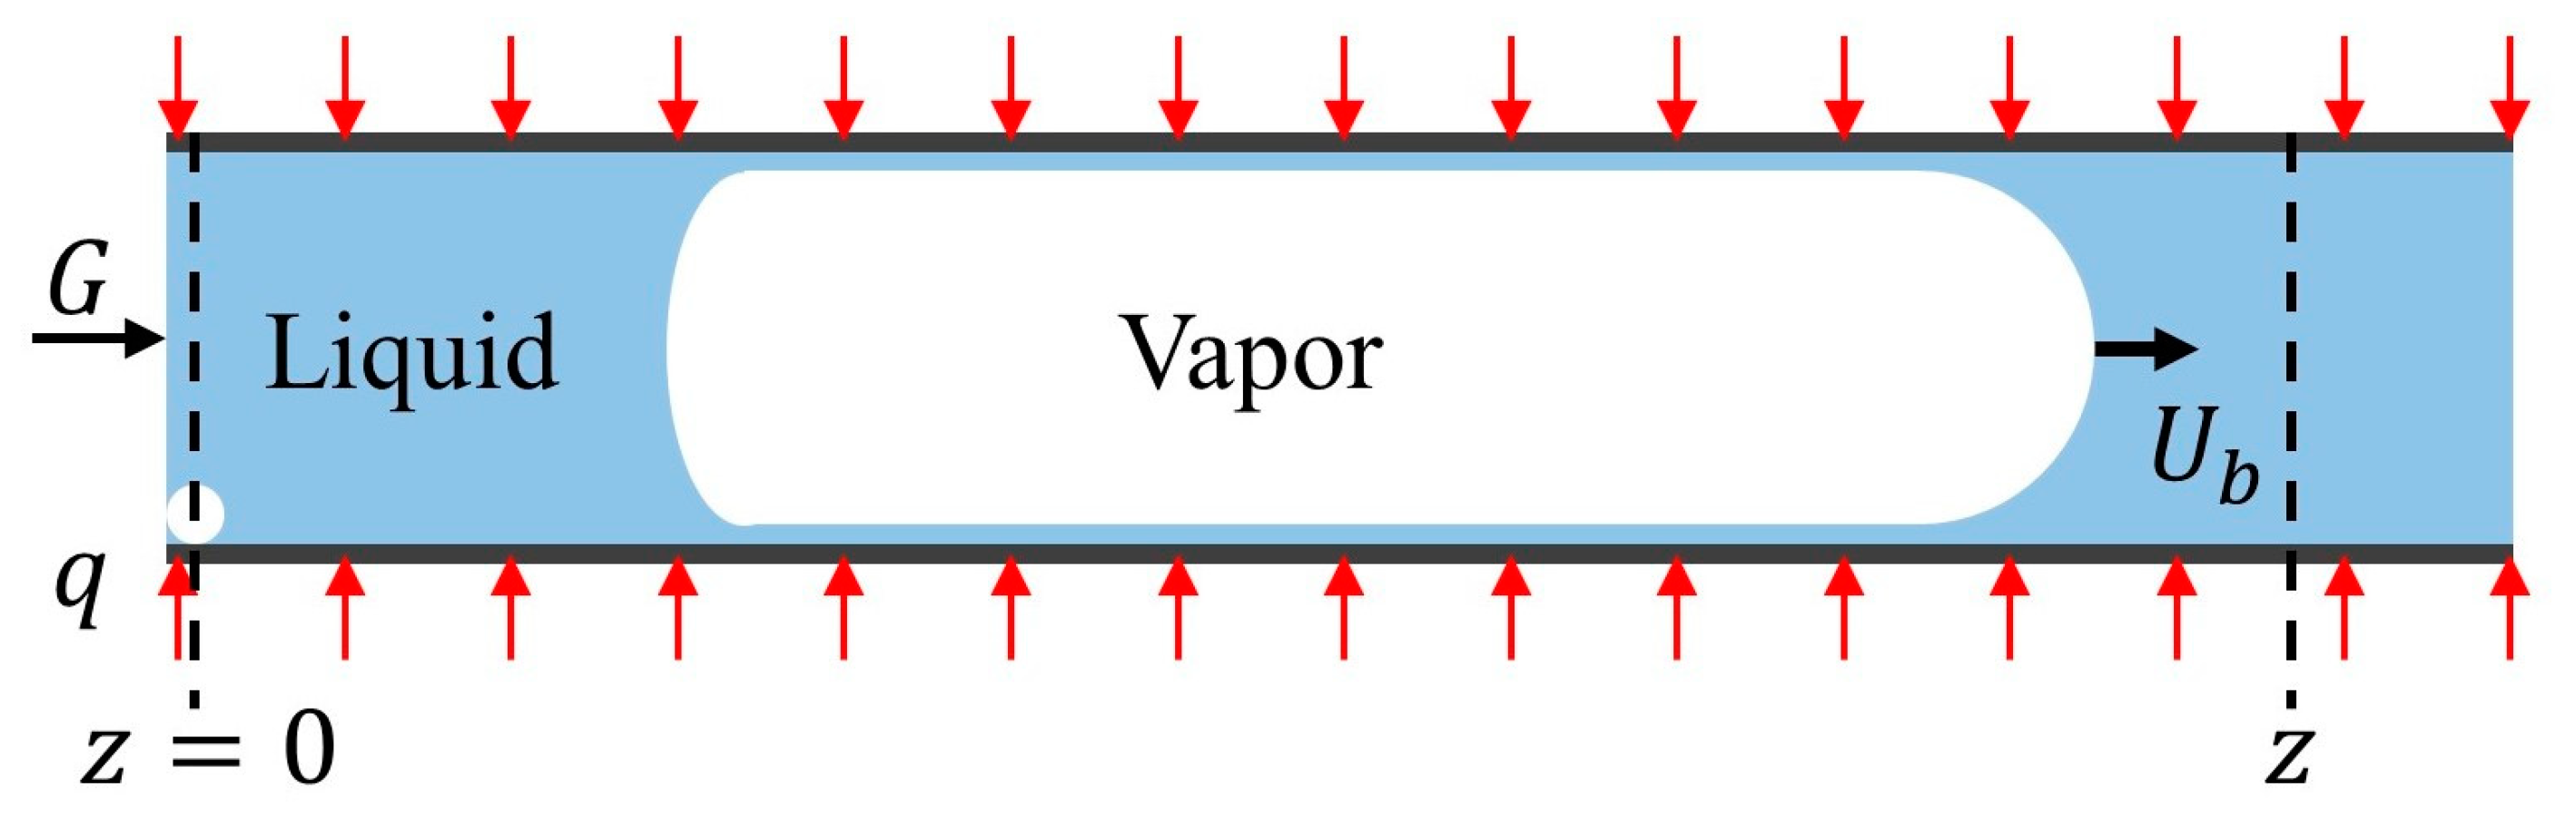
3.4.2. Heat Transfer Coefficient in the Elongated Bubble Zone

As the elongated bubble passes through the z cross-section, one-fourth of the cross-section is selected to study the local heat transfer coefficient due to its symmetry, as shown in Figure 6. Liquid is distinguished into three parts: a thin liquid film region in the center of the long-side wall, a meniscus region on the long-side wall, and a meniscus region on the short-side wall.
The evaporation mass flux at the vapor–liquid interface can be calculated according to the Wayner model [36]:
m = ( 2 M π R T lv ) 1 2 ρ v h lv T lv ( T lv T v ) ( 2 M π R T lv ) 1 2 ρ v ρ l T v T lv ( P d + P c )
where Tlv is the temperature of the vapor–liquid interface, Tv is saturated vapor temperature, and Pd is disjoining pressure and Pc is capillarity due to the curvature of the cross-section.
According to energy balance, the heat transferred from the wall to the vapor–liquid interface results in evaporation at the vapor–liquid interface, which can be expressed as
q = m h lv = λ l ( T w T lv ) δ
where Tw represents the wall temperature. As the experiments maintain the constant wall heat flux, the local heat transfer coefficient can be denoted as
h = q T w T v
Hence, with constant heat flux, the local heat transfer coefficient is influenced by the liquid thickness and the curvature of the gas–liquid interface at this position, expressed as h = f (δ, K). The transient film thickness in the center of the short-side wall can be represented as
δ b = ( δ b 0 δ a 0 ) + δ a
where δa0 and δa represent the initial film thickness and transient film thickness in the center of the long-side wall; δb0 and δb represent the initial film thickness and the transient film thickness in the center of the short-side wall. The curvature of the meniscus at the vapor–liquid interface is obtained from Kc = 1/Rc ≈ 2/H.
The liquid film thickness decreases from the initial liquid film thickness due to evaporation, bubble acceleration shear force, and transversal flow until the microchannel wall dries out. Combined the initial liquid film thickness in circular and square microchannels [37,38,39], the initial film thickness of the long-side wall can be expressed as
δ a 0 H / 2 = 0.09 0.10 C a 2 3
According to energy conservation, all heat applied to the liquid film is used for evaporation for the flow direction element dz in the center of the long-side wall:
ρ l L a ( d δ a d t ) d z h lv = q L a d z
where ρl is the liquid density, hlv is the latent heat of liquid, and La is the half-length of the thin liquid film on the long-side wall.
Due to interfacial shear force, the liquid velocity increases in the flow direction, resulting in the liquid flux into dz being smaller than the liquid flux out. The mass conservation for element dz can be expressed as
u ¯ l δ a L a ( u ¯ l + u ¯ l z d z ) δ a L a = ( d δ a d t ) L a d z
where u ¯ l represents the average velocity of liquid.
The shear force at the vapor–liquid interface can be calculated according to the Hagen–Poiseuille equation. For thin liquid film, the shear force at the interface can be expressed as
τ i μ l u ¯ l δ
According to energy conservation, the variation in vapor velocity is caused by the evaporation of the liquid film:
ρ v A v d u ¯ v h lv = q P H d z
where ρv is the vapor density, and Av is the area occupied by the gas in the microchannel cross-section.
The interface curvature of the thin liquid film region in the center of the wall is zero, and that of the corner meniscus region is 1/Rc. According to the Young–Laplace equation, this pressure difference causes liquid to flow from the center toward the corner. According to mass conservation, the thinning of liquid film due to flow from the center of the wall to the corner can be expressed as
v ¯ l δ a d z = d δ a d t L a d z
where v ¯ l is the average velocity of transversal flow.
Hence, the total thinning rate of liquid film in the center of the long-side wall due to evaporation, shear force, and transversal flow can be calculated from
d δ a d t = q ρ l h lv 4 μ v μ l δ a 2 H q P H ρ v A v h lv σ 3 μ l δ a 3 R c L a 2
The initial film thickness model in the center of the short-side wall of rectangular microchannels can be derived from
δ b 0 W / 2 = 1.34 C a 2 3 1 + 3.35 C a 2 3 + 0.38 C a
As shown in Figure 7, the equivalent film thicknesses of the meniscus region can be described as
δ c a = x 2 + H 2 4 H 2 + δ a
δ c b = y 2 + ( H 2 + δ b 0 δ a 0 ) 2 H 2 + δ a
where δca represents the equivalent film thickness of the meniscus region on the long-side wall and δcb represents the equivalent film thickness of the meniscus region on the short-side wall.
Further, the spatially averaged heat transfer coefficient of the meniscus region on the long-side wall can be expressed as
h ¯ c a ( t ) = 1 H 2 + δ b 0 δ a 0 0 H 2 + δ b 0 δ a 0 h c a ( x , t ) d x
The spatially averaged heat transfer coefficient of the meniscus region on the short-side wall can be represented as
h ¯ c b ( t ) = 2 H 0 H 2 h c b ( y , t ) d y
In the elongated bubble zone, the spatially averaged heat transfer coefficient at the z cross-section can be described as
h ¯ 1 ( t ) = 2 W + H [ h a ( t ) L a + h ¯ c a ( t ) L c a + h ¯ c b ( t ) L c b ]
where Lca and Lcb represent the range of meniscus region on the long-side and short-side walls, respectively.

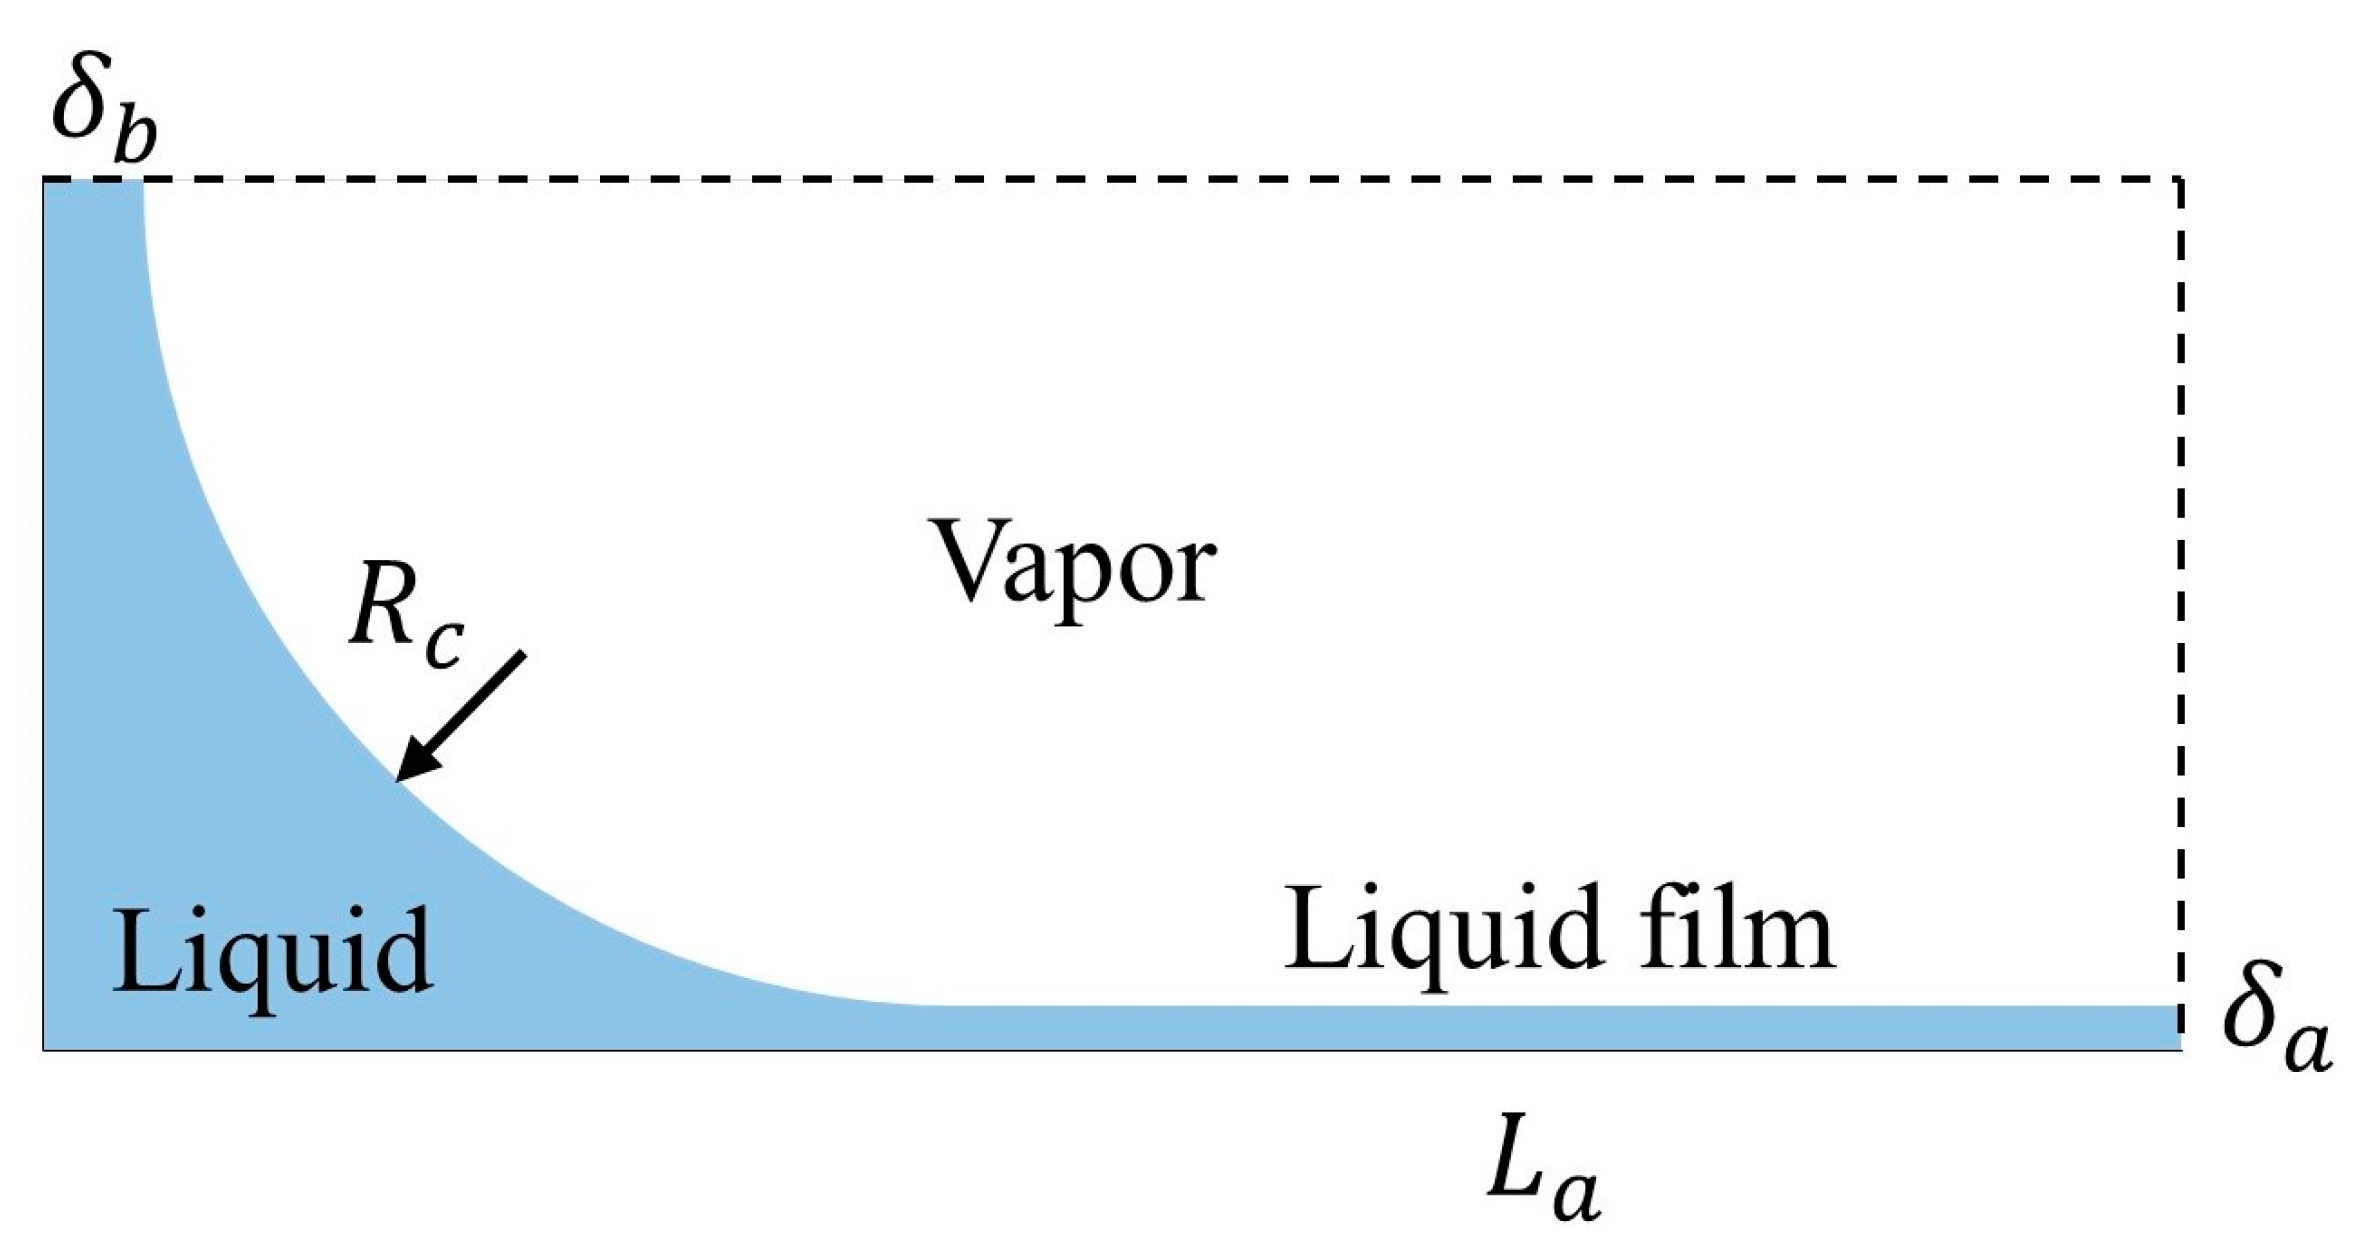
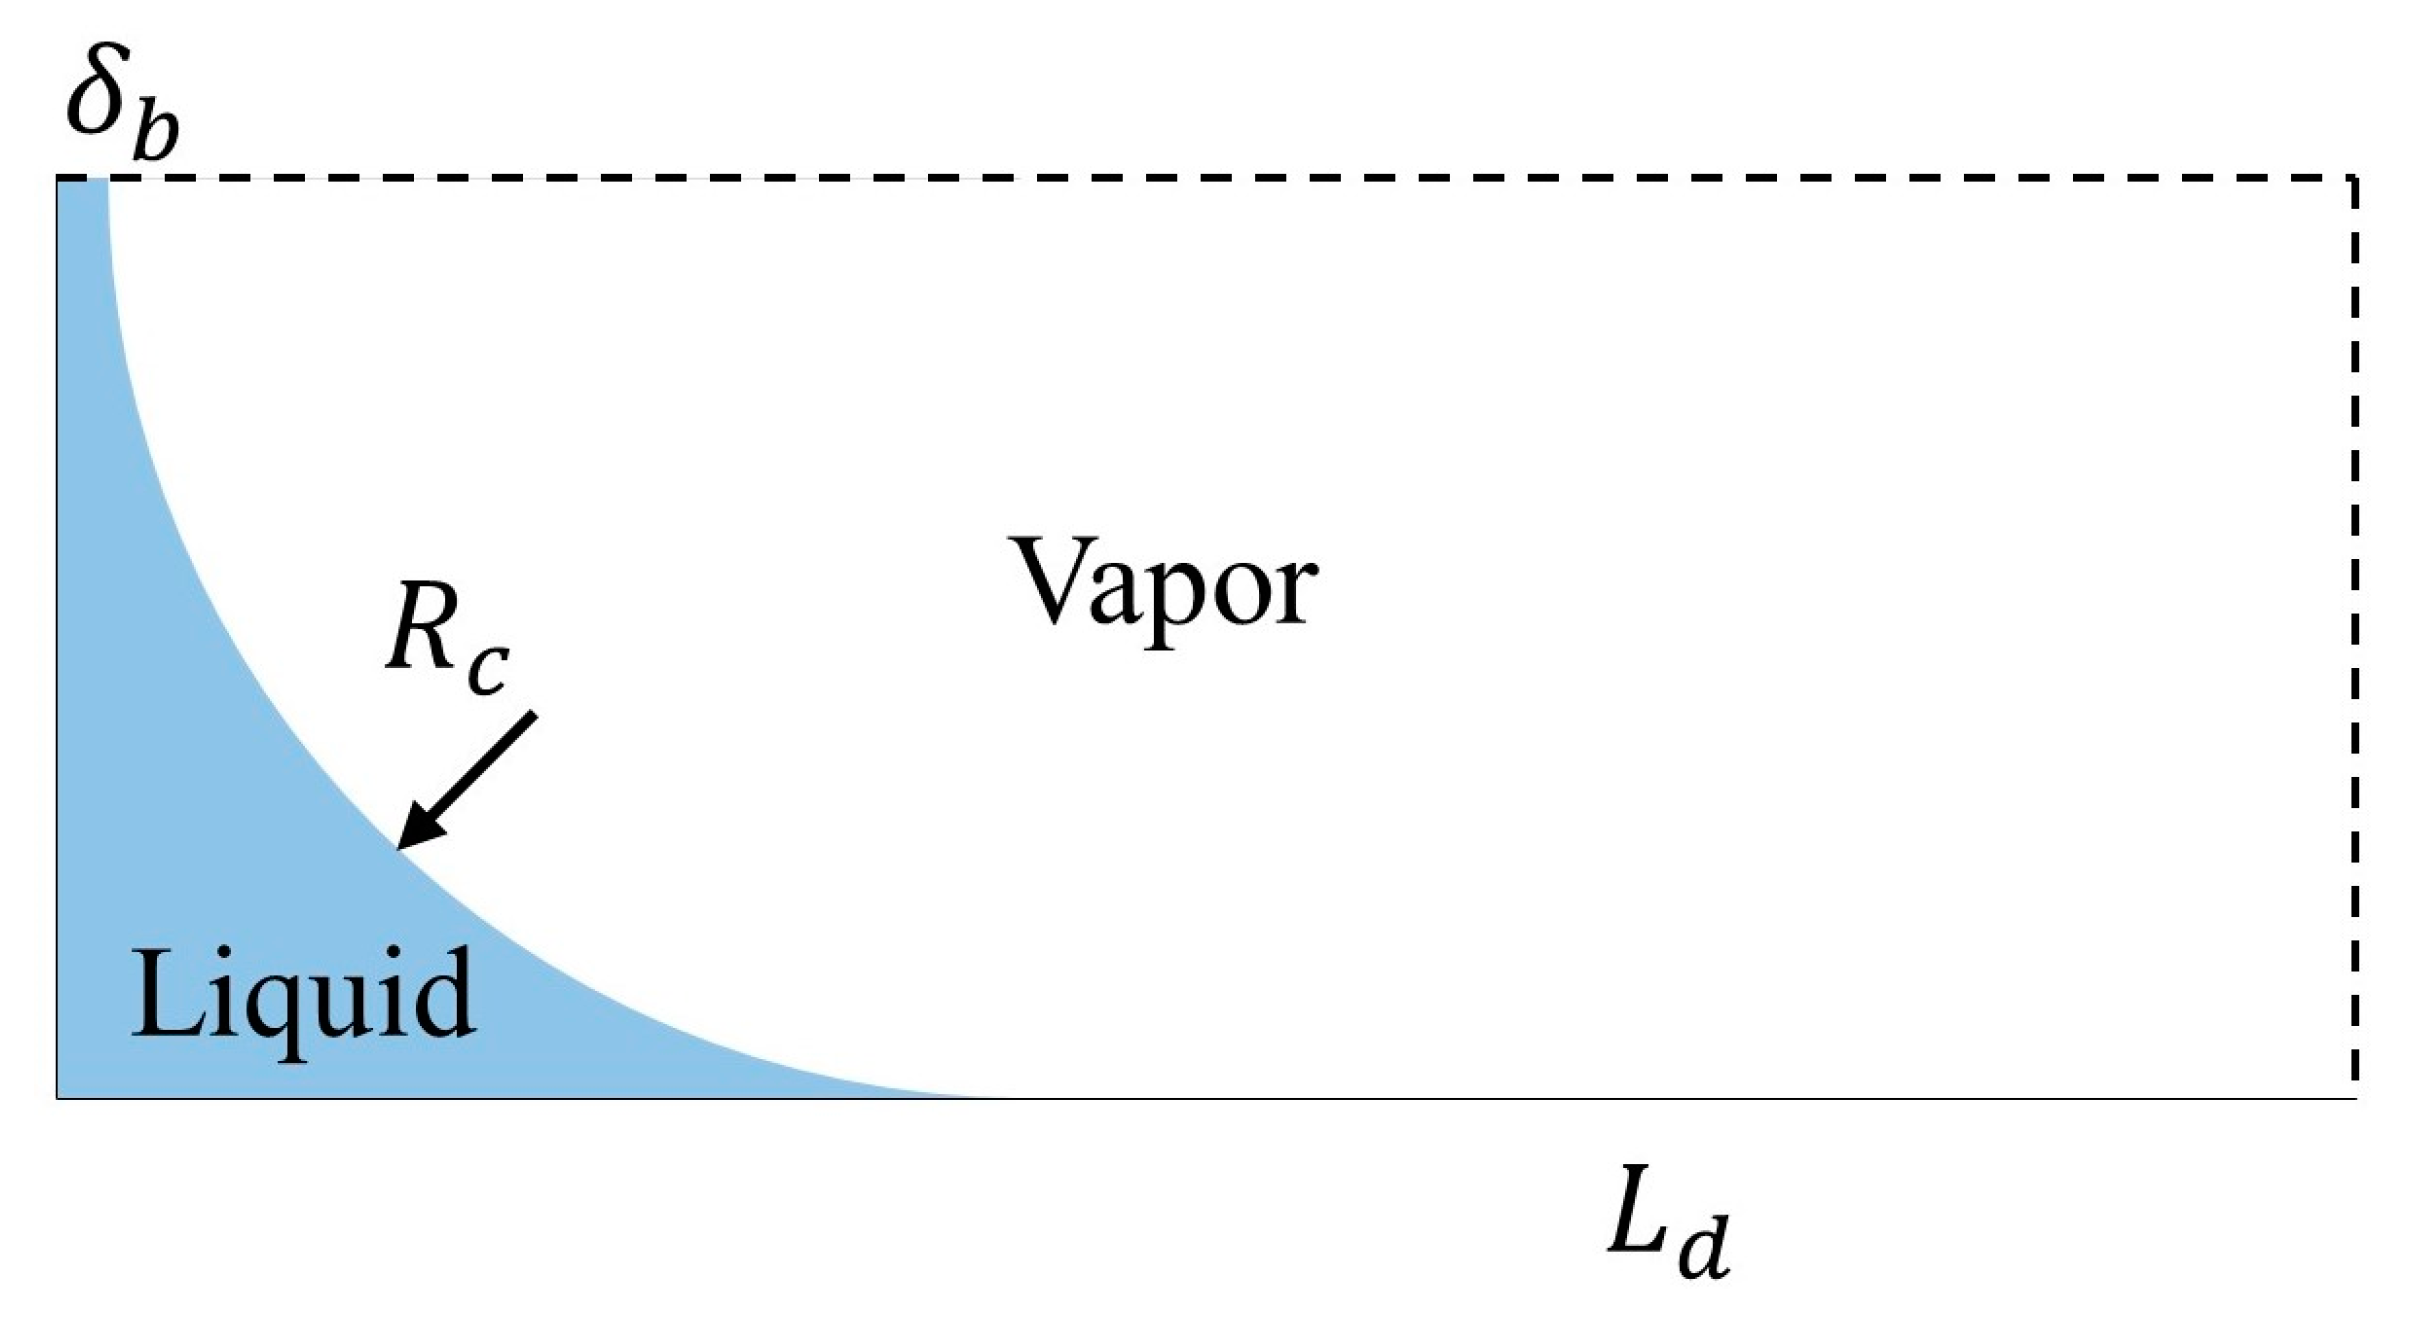
3.4.3. Heat Transfer Coefficient in the Long-Side Wall Dryout Zone

As depicted in Figure 8, the corner remains liquid when the long-side wall dries out. In the long-side wall dryout zone, the initial film thickness in the center of the short-side wall can be expressed as [36]
δ b 0 = δ b 0 δ a 0
where δb0 represents the film thickness in the center of the short-side wall at the moment the long-side wall dries out. The curvature of the meniscus at the vapor–liquid interface can be calculated from Kc = 2/H.
Similar to the method used for calculating the thinning rate of the liquid film in the center of the long-side wall, the liquid film thinning rate in the center of the short-side wall can be calculated from
d δ b d t = q ρ l h lv 4 ( H + δ b ) π H 4 A l δ b 2 ( A l + 2 π R δ b ) ( R δ b ) μ v μ l q P H ρ v A v h lv
As illustrated in Figure 9, the equivalent film thickness of the meniscus region can be represented as
δ c a = x 2 + H 2 4 H 2
δ c b = y 2 + ( H 2 + δ b ) 2 H 2
Hence, the spatially averaged heat transfer coefficient of the meniscus region can be calculated from
h ¯ c a ( t ) = 1 H 2 + δ b 0 H 2 + δ b h c a ( x , t ) d x
h ¯ c b ( t ) = 2 H 0 H 2 h c b ( y , t ) d y
Therefore, in the long-side wall dryout zone, the spatially averaged heat transfer coefficient at the z cross-section can be represented as
h ¯ 2 ( t ) = 2 W + H [ h v ( t ) L a + h ¯ c a ( t ) L c a + h ¯ c b ( t ) L c b ]

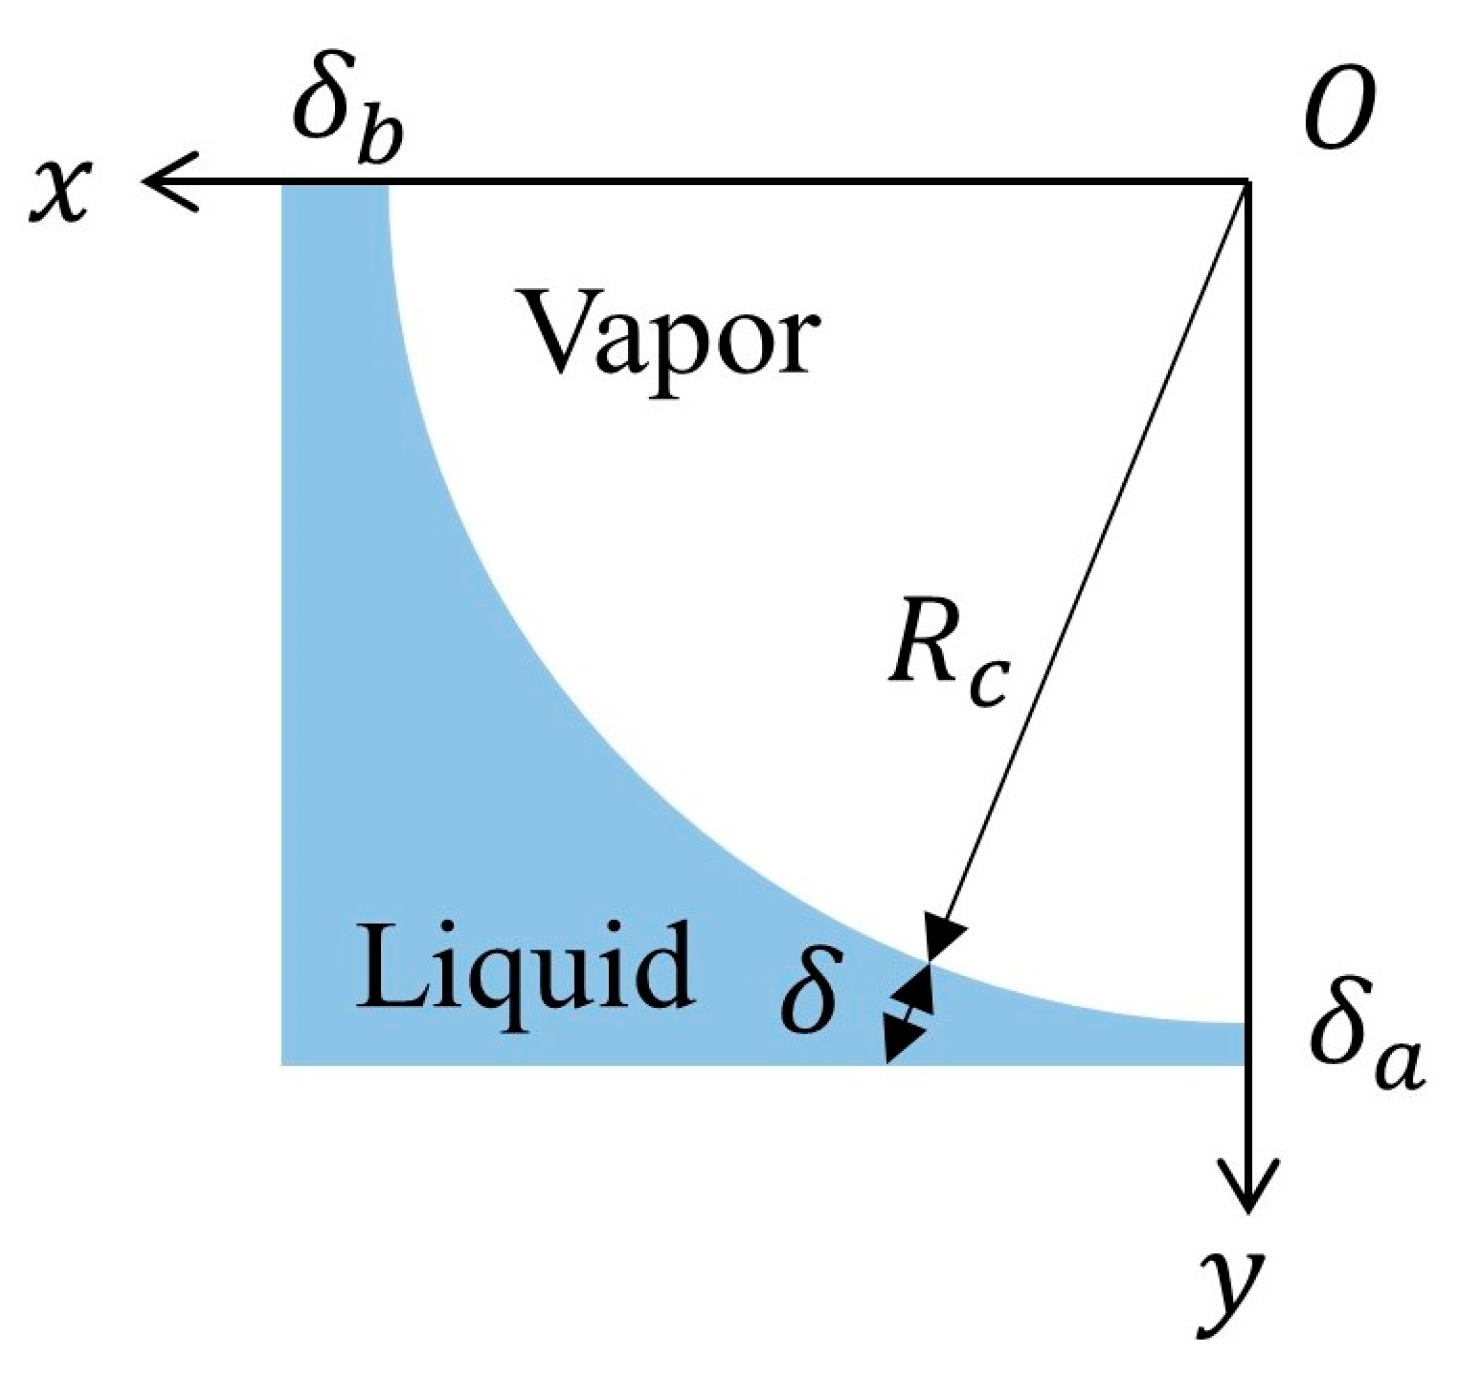
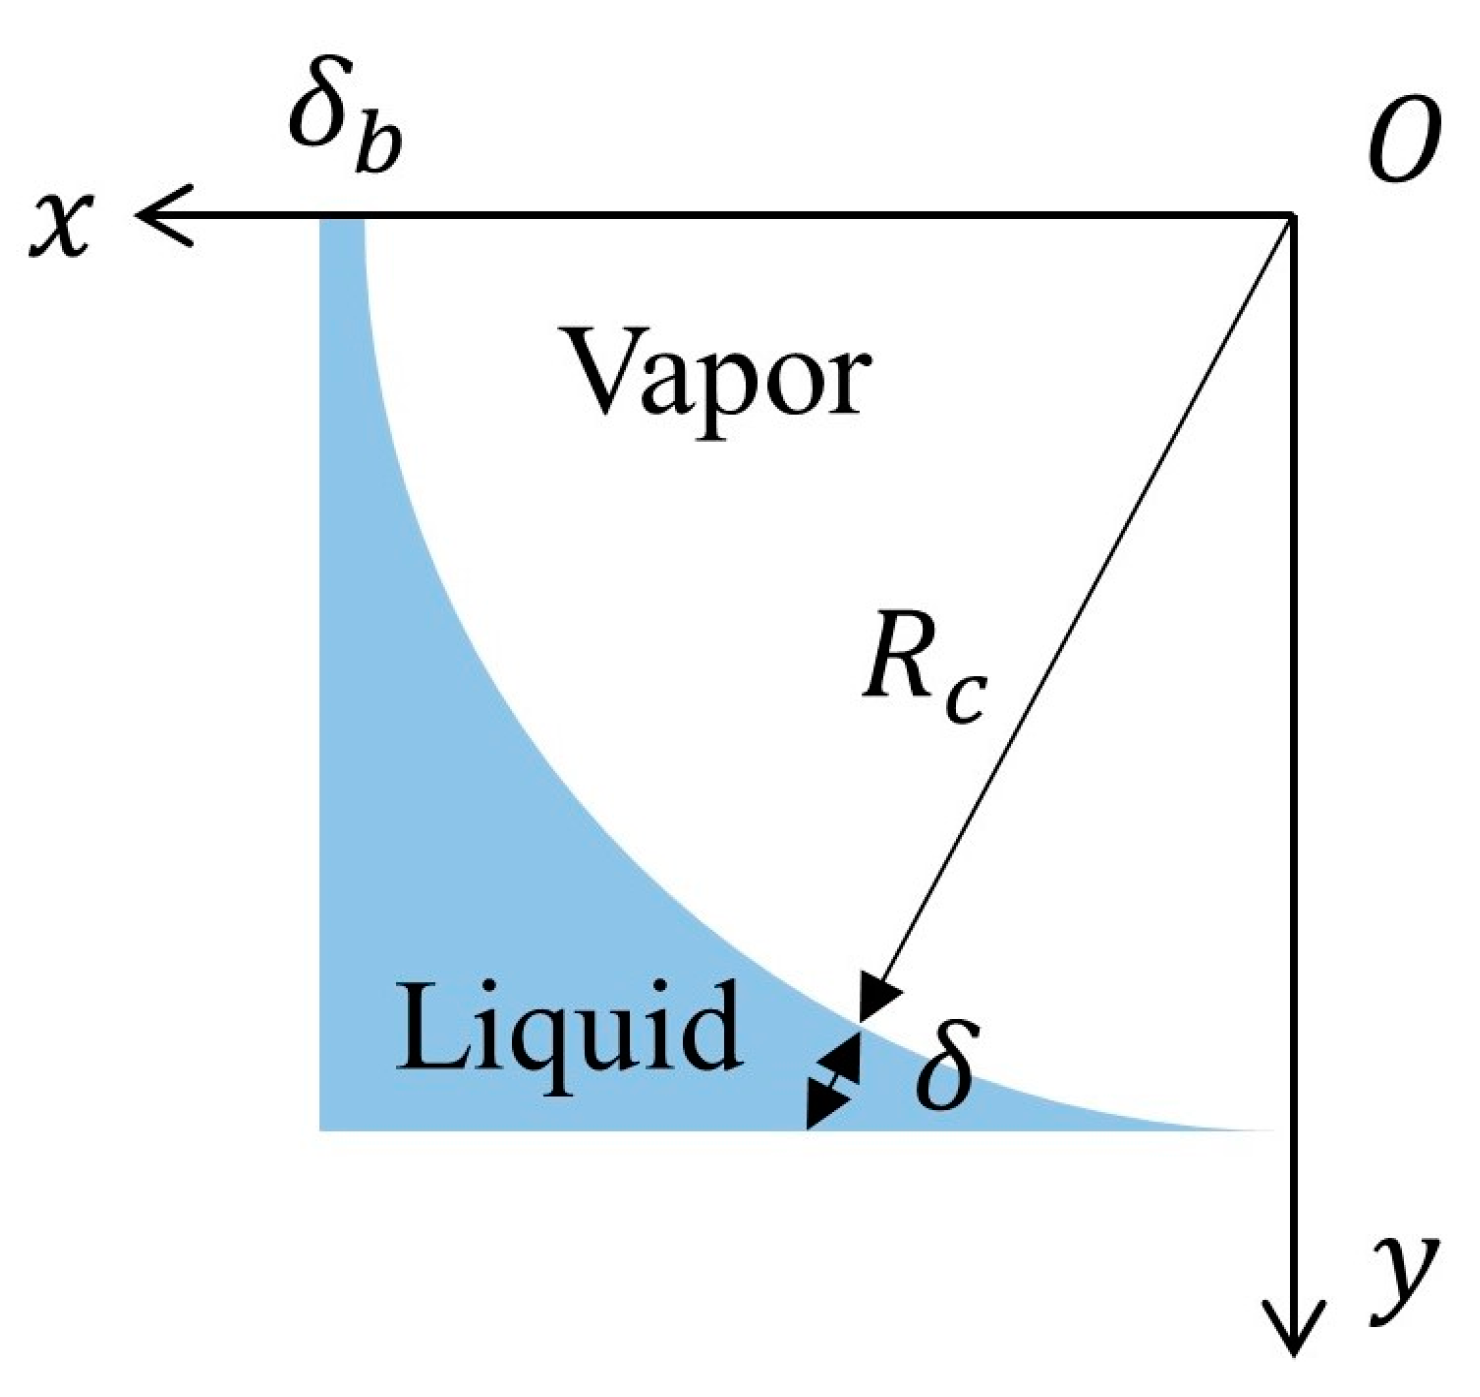
3.4.4. Heat Transfer Coefficient in the Corner Liquid Evaporation Zone

Both the long-side and short-side walls dry out in the corner liquid evaporation zone, as shown in Figure 10. The reduction in meniscus radius needs to consider evaporation and shear force. Firstly, during flow boiling in microchannels, the following equation was derived for the flow direction element dz based on energy balance:
q · 2 R c d z = ρ l ( 1 π 4 ) [ R c 2 ( R c d R c d t ) 2 ] d z · h lv
The thinning rate of the meniscus radius caused by evaporation can be calculated from
( d δ c d t ) evaporation = q ρ l h lv 4 4 π
Along the flow direction, the liquid velocity also increases due to the shear force caused by bubble acceleration. The continuity equation for element dz can be given by
u ¯ l A c ( u ¯ l + u ¯ l z d z ) A c = ( 1 π 4 ) ( R c 2 ( R c d R c d t ) 2 ) d z
The thinning rate of the meniscus radius caused by shear force can be expressed as
( d R c d t ) shear = 4 ( 1 π 4 ) R c μ v μ l u ¯ v z
where μv and μl represent the dynamic viscosity of vapor and liquid, and u ¯ v represents the average velocity of vapor.
Combined with evaporation and shear force, the total thinning rate of the meniscus radius in the corner liquid evaporation zone can be calculated from
d R c d t = q ρ l h lv 4 4 π 4 ( 1 π 4 ) R c μ v μ l u ¯ v z
The equivalent film thicknesses of the meniscus region can be denoted as
δ c = R c 2 + x 2 R c 2
where 0 ≤ xRc, and the spatially averaged heat transfer coefficient of the corner meniscus region can be expressed as
h ¯ c ( t ) = 1 R c 0 R c h c ( x , t ) d x
Therefore, the spatially averaged heat transfer coefficient at the z cross-section in the corner liquid evaporation zone can be calculated from
h ¯ 3 ( t ) = 2 W + H [ h ¯ c ( t ) 2 R c + h v ( t ) L d ]

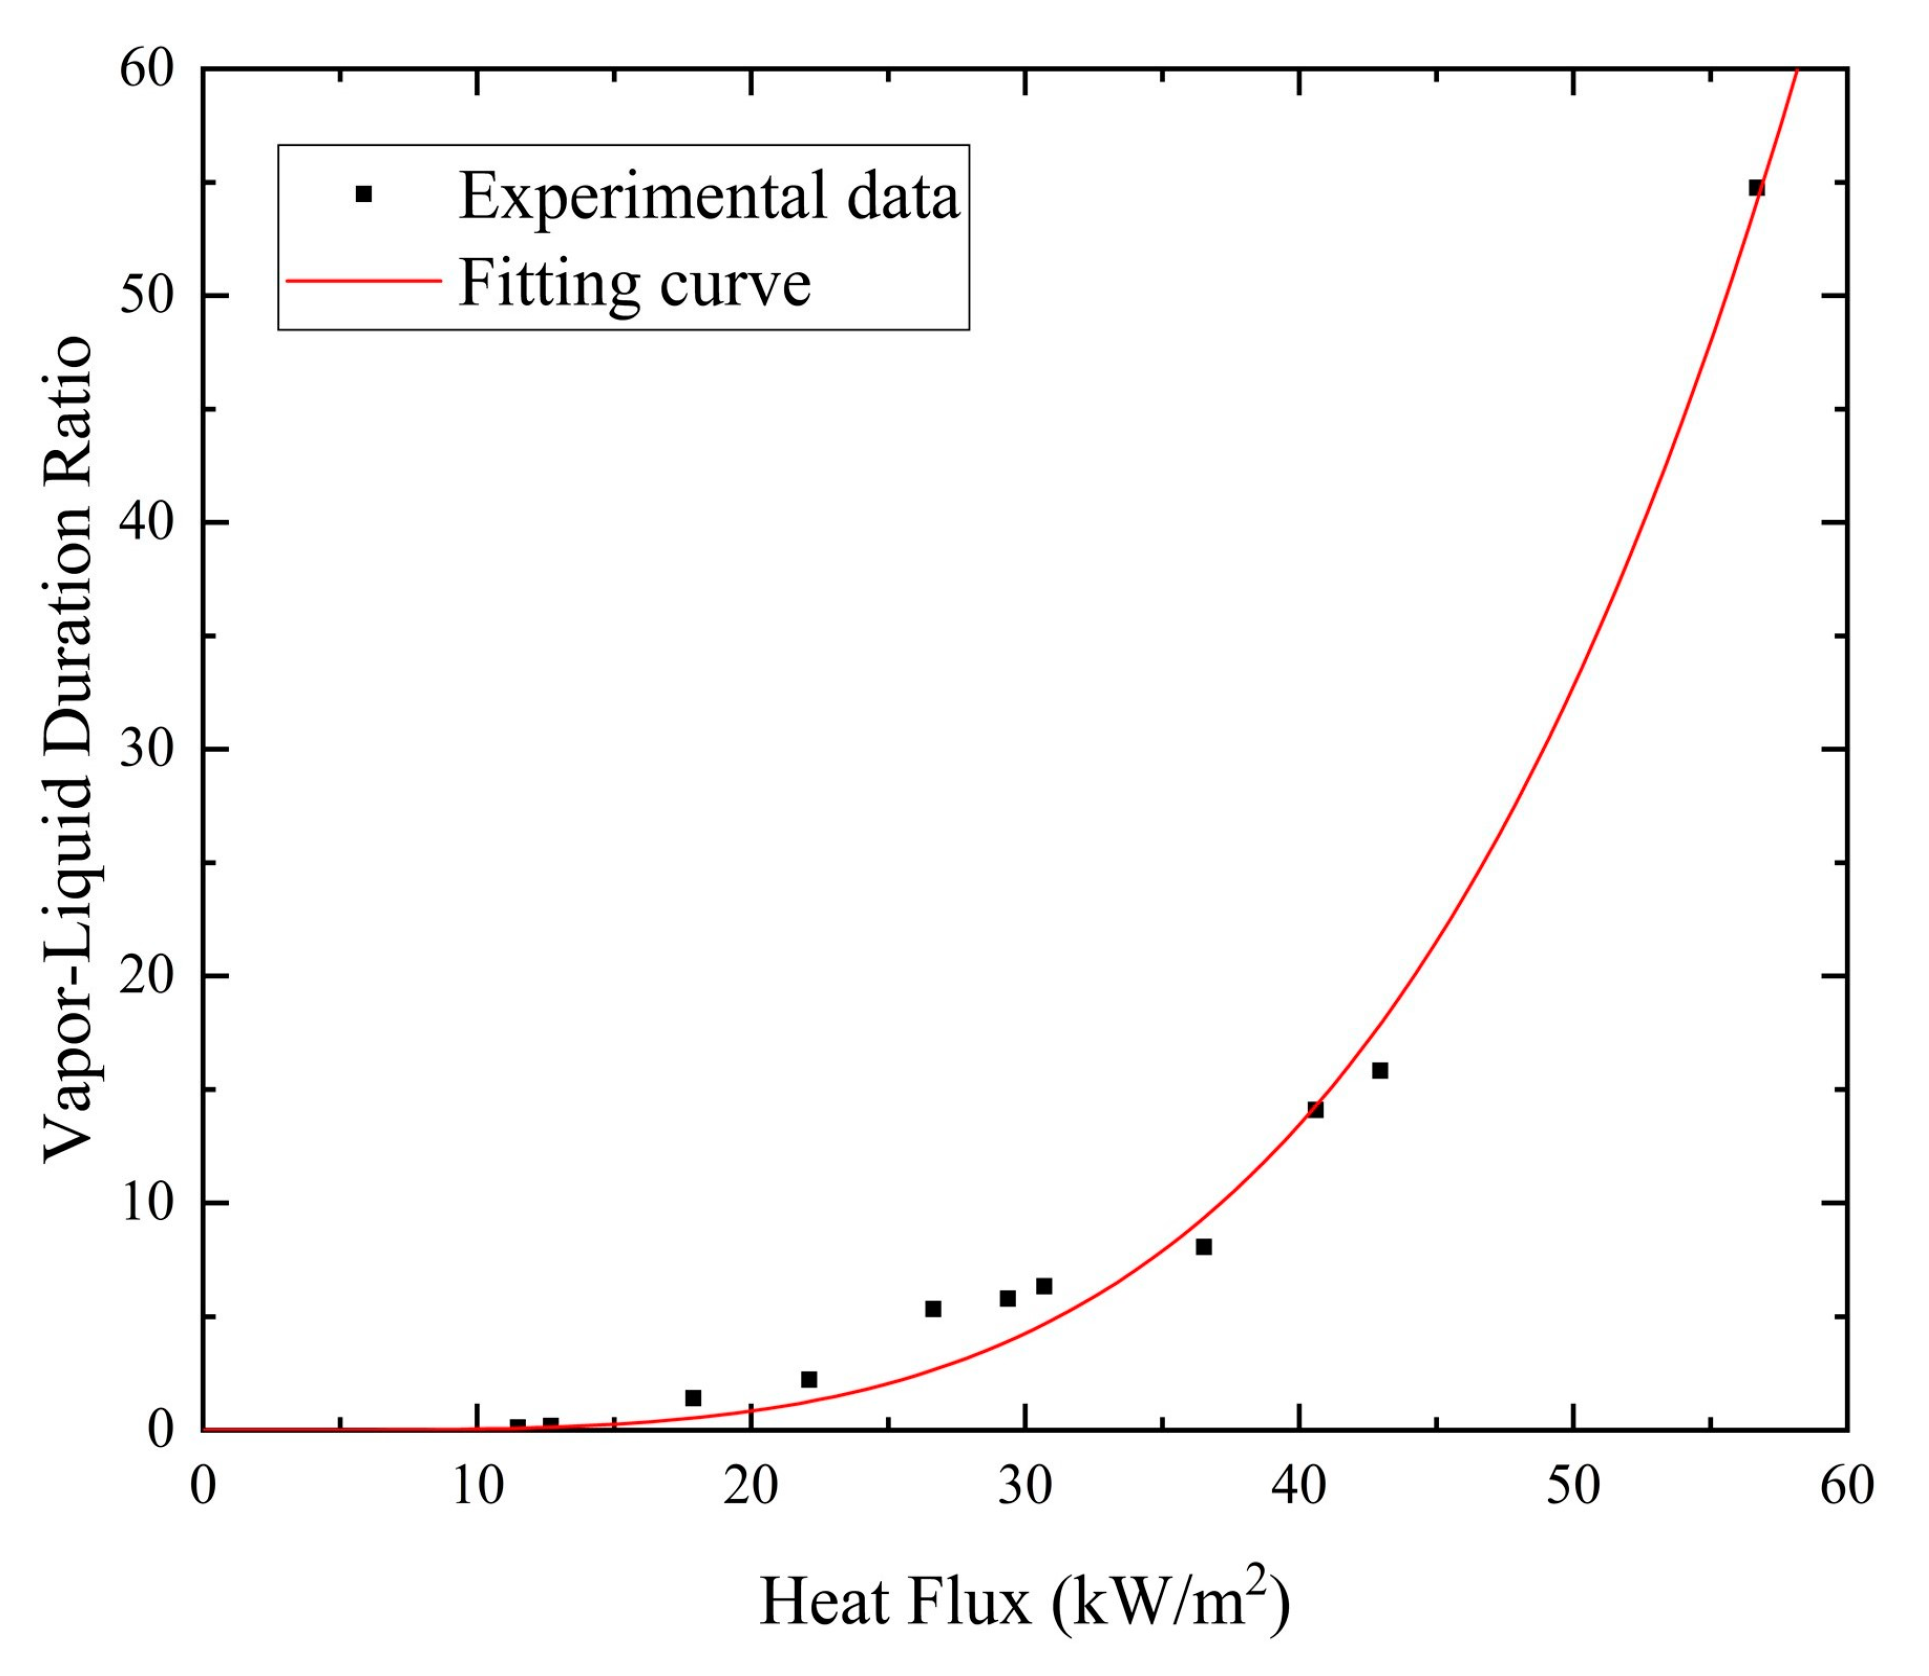
3.5. Analysis of Five Zone Duration

The frequency of bubble formation at high heat flux and mass flux can be determined using the empirical correlation proposed by Wang et al. [27]:
f = 0.0491 ( 1000 · B o ) 6.8195 G ρ l D h
where Bo is the boiling number, which is defined as Bo = q/Ghlv.
During a bubble formation period, the residence time of the vapor slug and liquid slug can be calculated using Equations (16) and (17). The relationship between residence time and bubble formation period can be given as follows:
τ = t l + t v
When mass flux and heat flux are low, the bubble formation period and the vapor–liquid duration ratio can be fitted from experimental data, as illustrated in Figure 11 and Figure 12. It can be observed that the bubble formation period lasted longer at lower heat flux, while vapor–liquid duration increased with the increase in heat flux.
Hence, the bubble formation period and vapor–liquid duration ratio can be evaluated as follows:
τ = 1.177 × 10 7 ( 1 B o ) 3.283
t v t l = 9.585 × 10 11 B o 3.98
After the heat transfer coefficients in the five zones are determined, the time-averaged heat transfer coefficient for the five-zone flow boiling can be derived from
h ¯ = 1 τ [ h l t 1 + 0 Δ t 1 h ¯ 1 ( t )   d t + 0 Δ t 2 h ¯ 2 ( t )   d t + 0 Δ t 3 h ¯ 3 ( t )   d t + h v Δ t 4 ]
where t1 is the liquid slug duration time, Δt1 is the duration time of the elongated bubble zone, Δt2 is the duration time of the long-side wall dryout zone, Δt3 is the duration time of the corner liquid evaporation zone, and Δt4 is the full dryout duration time.

4. Results and Discussion

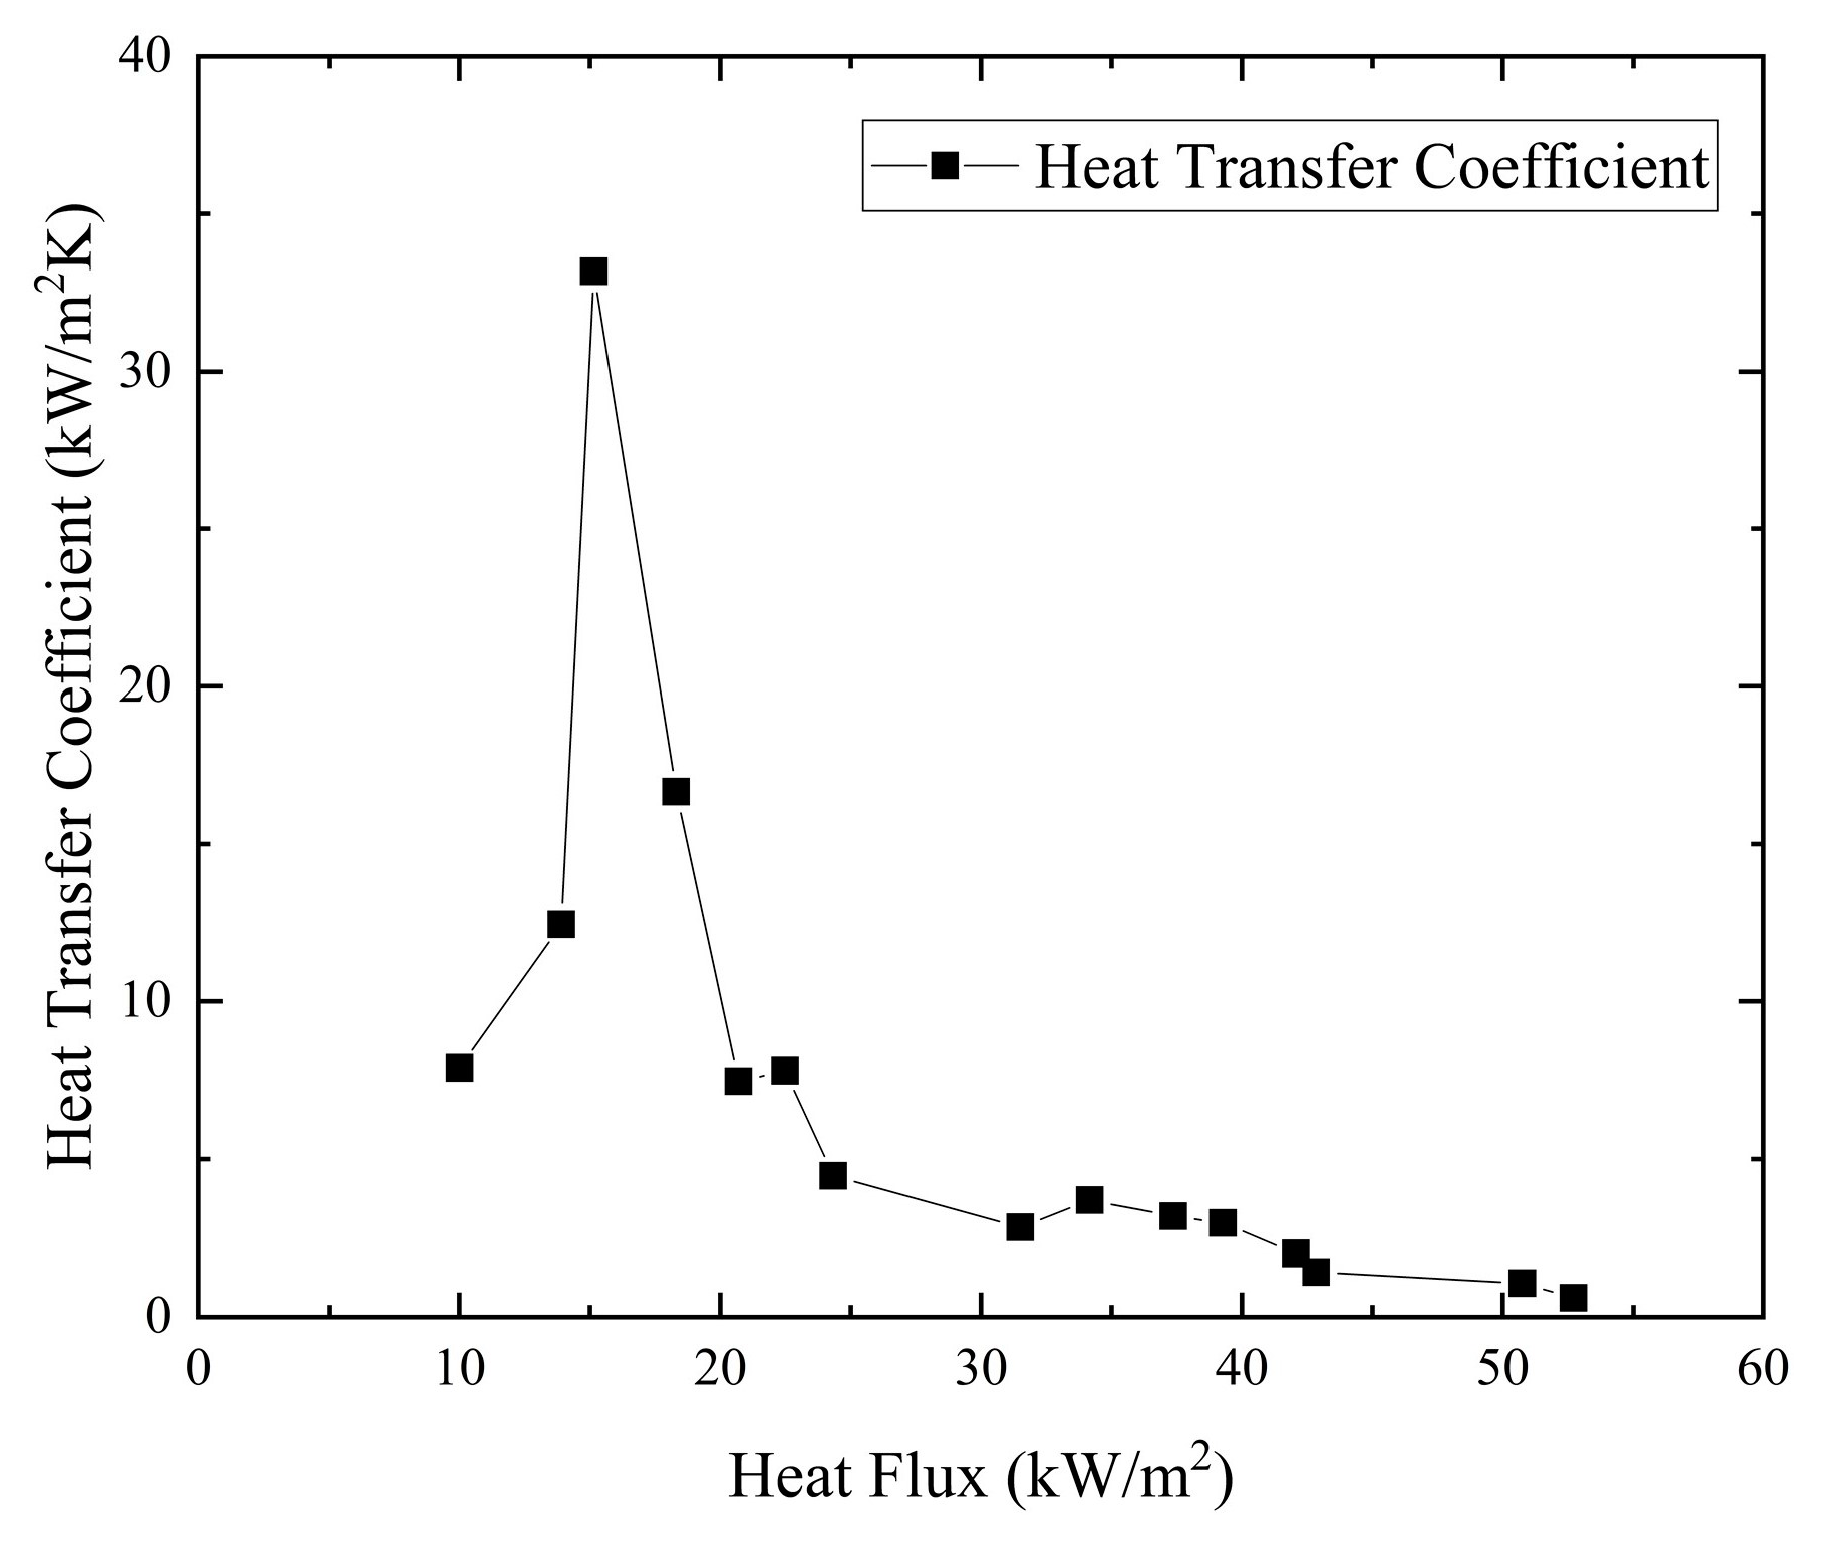
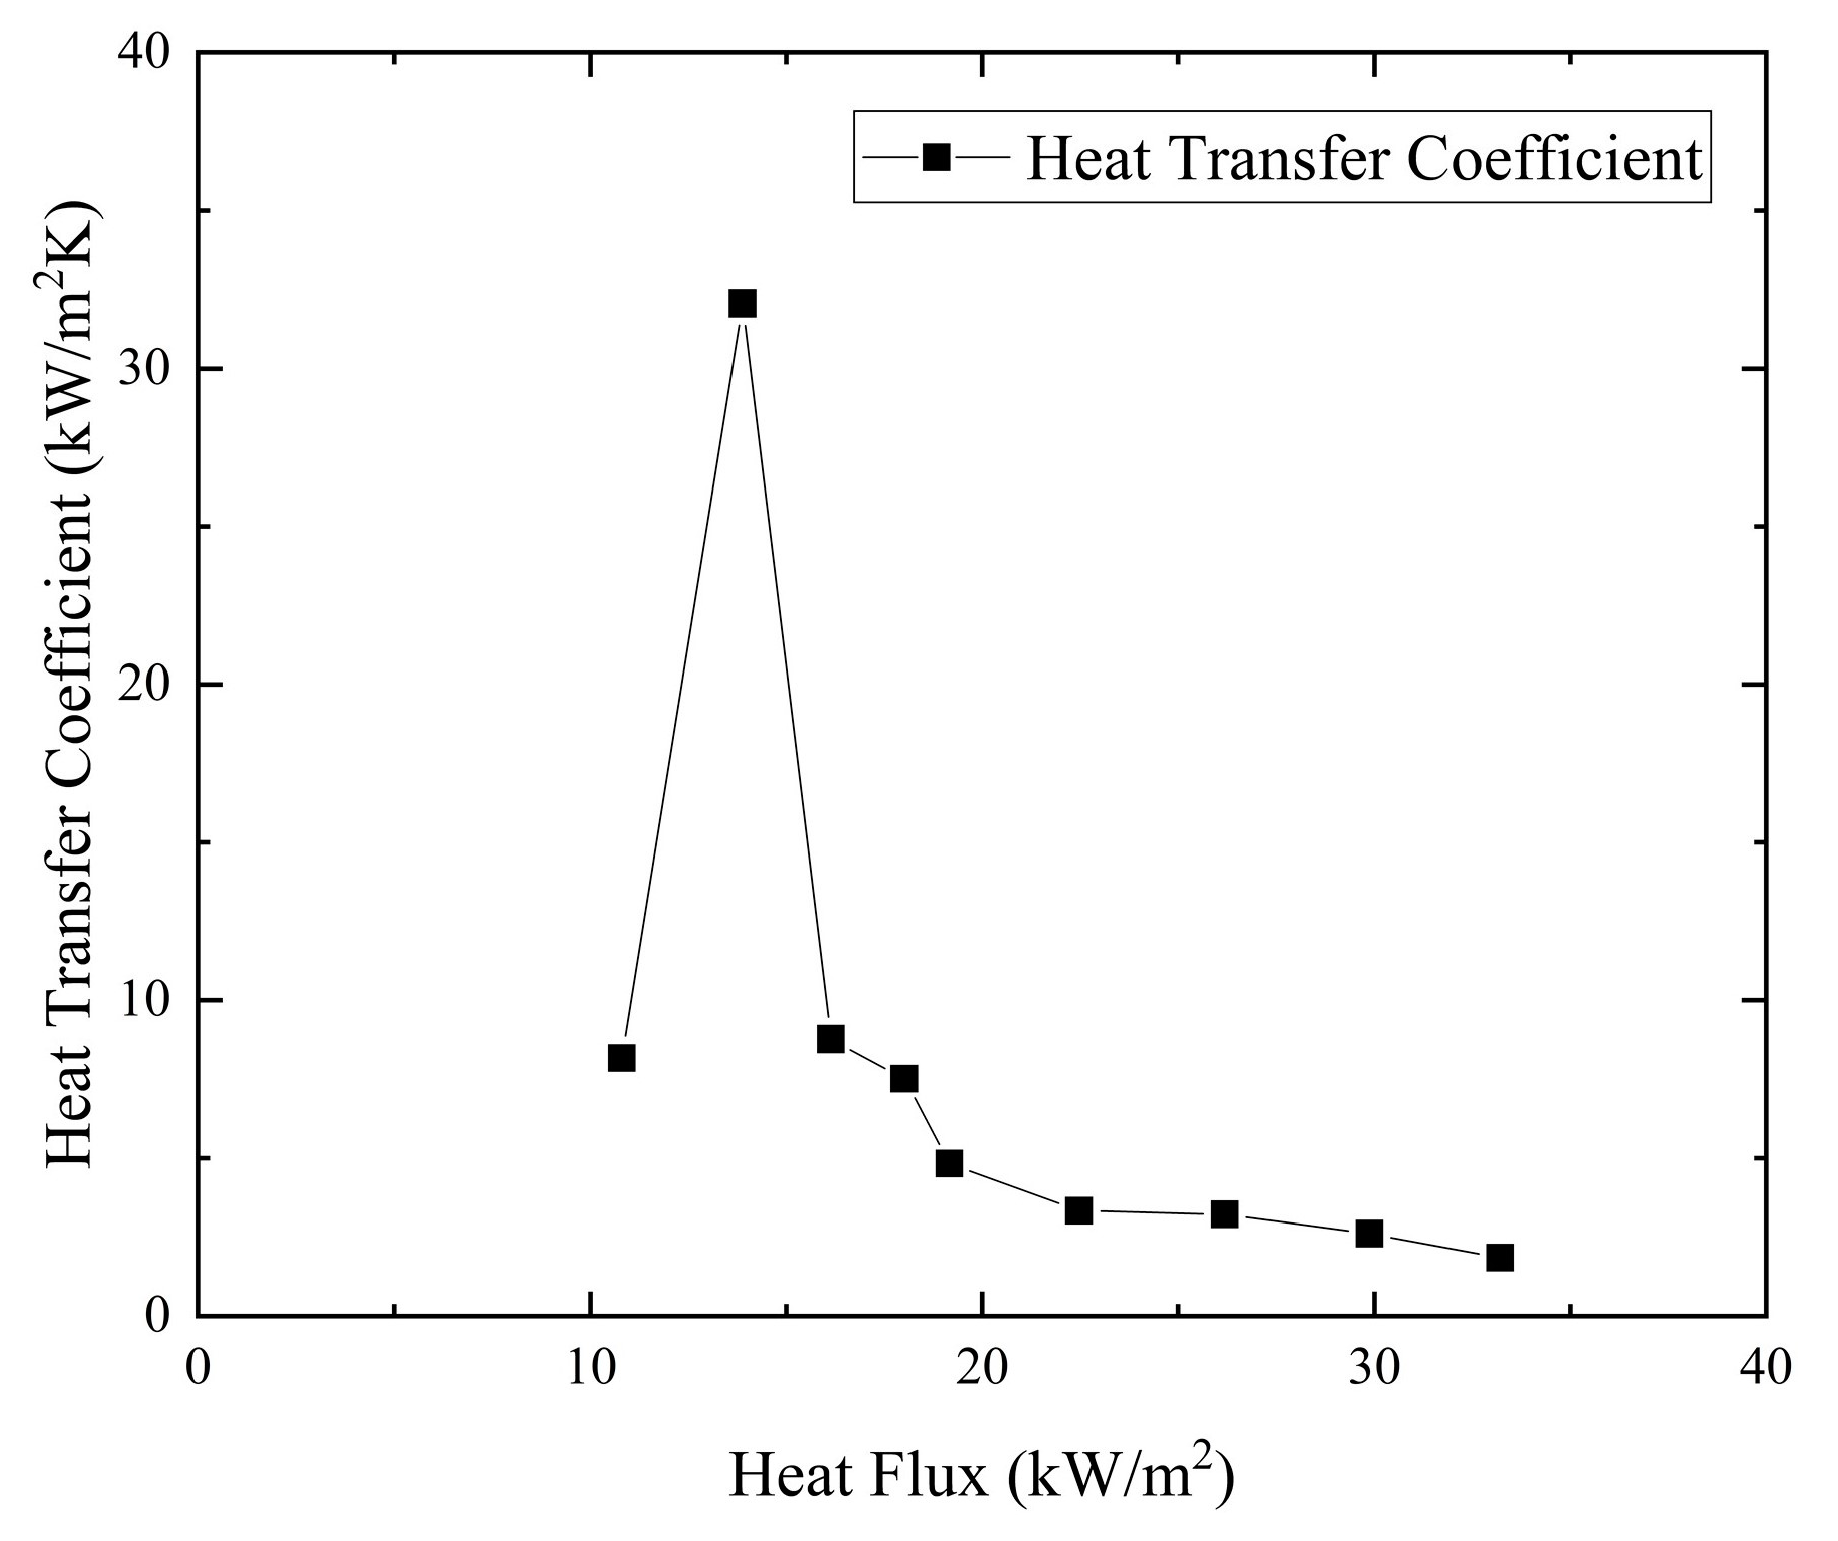
4.1. Experimental Results

Time-averaged heat transfer first increases and then decreases as the heat flux increases during a bubble formation period. When the heat flux is low, the heat transfer mechanism is single-phase convection in the liquid phase, leading to a relatively low heat transfer coefficient. In the elongated bubble zone, the heat transfer mechanism is thin film evaporation, leading to a very high heat transfer coefficient that increases as the liquid film thins. When the microchannel wall dries out, the heat transfer mechanism is single-phase convection in the gas phase and evaporation from the corner liquid, resulting in a significantly reduced heat transfer coefficient. The local time-averaged heat transfer coefficient can reflect this tendency, as shown in Figure 13 and Figure 14 when using ethanol with a mass flux of 25.58 kg/m2·s.

4.2. Numerical Results of Five-Zone Model

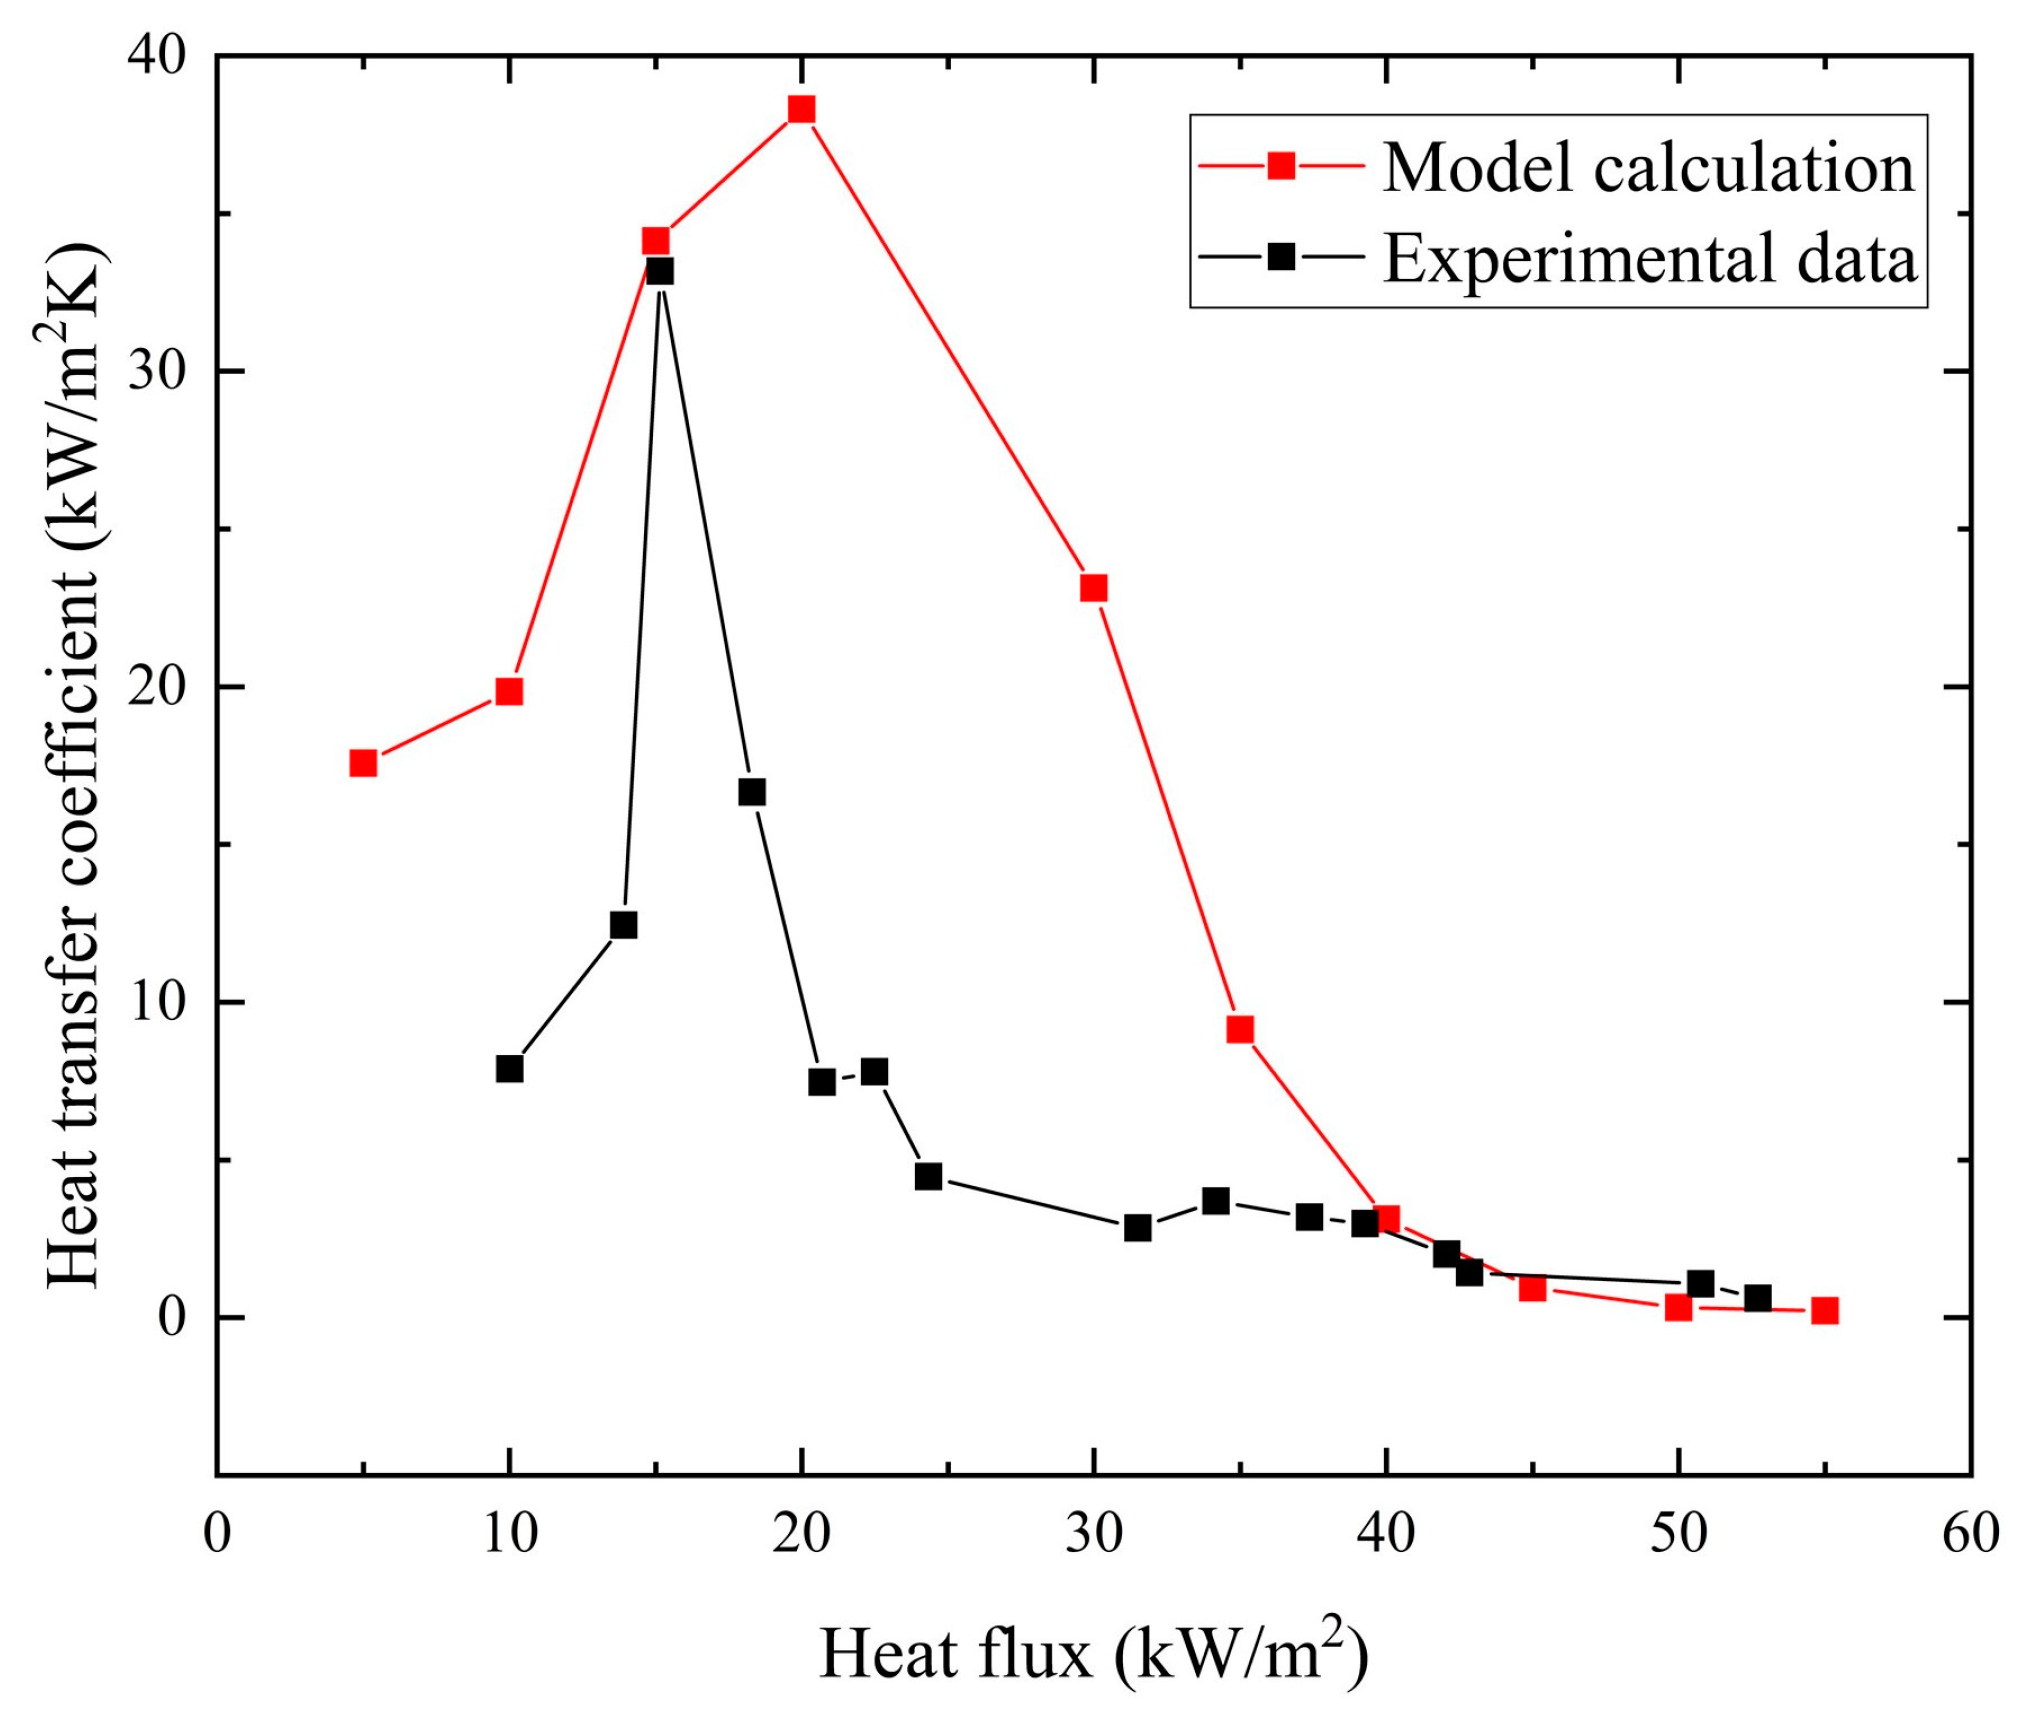
4.2.1. Model Validation

To validate the model against the experimental data, the five-zone flow boiling model is numerically calculated for a rectangular microchannel of 0.3 × 0.8 mm2 with ethanol as the working fluid. The heat flux is 40 kW/m2 and the mass flux is 51.16 kg/(m2·s). As mentioned above, the measurement point experiences the liquid slug zone, the elongated bubble zone, the long-side wall dryout zone, the corner liquid evaporation zone, and the full dryout zone.
Figure 15 depicts the variation in time-averaged heat transfer coefficient observed in rectangular microchannel flow boiling experiments at mass flux of 25.58–51.16 kg/m2·s and heat flux of 5–55 kW/m2. The heat transfer coefficient increases and then decreases with rising heat flux. At low heat flux, the liquid slug zone lasts long. As the heat flux increases, the time proportion dominated by the elongated bubble zone increases, resulting in an increase in the heat transfer coefficient due to thin film evaporation. At higher heat flux, the duration of the dryout zone increases, causing a lower heat transfer coefficient. The peak heat transfer coefficient increases with increasing mass flux, and the heat flux at which this peak occurs also increases accordingly.
Compared with the experiment data for flow boiling in rectangular microchannels at a mass flux of 25.58 kg/m2·s, the numerical results show the same tendency. However, the peak value of heat transfer coefficients measured experimentally is lower, and the range of heat flux corresponding to a higher heat transfer coefficient is quite narrow. This is because when the film thickness decreases to the micrometer scale, even a slight disturbance can cause the liquid film to break up and form a local dryout, leading to a rapid deterioration of heat transfer performance.
Figure 16 illustrates the variation in time-averaged heat transfer coefficients during square microchannel flow boiling experiments at a mass flux of 26.71 kg/m2·s and a heat flux of 5–55 kW/m2. The trend of heat transfer coefficient is consistent with that observed in rectangular microchannels, increasing and then decreasing as heat flux increases. The heat transfer coefficients predicted by the model follow the same trend as the experimental results.

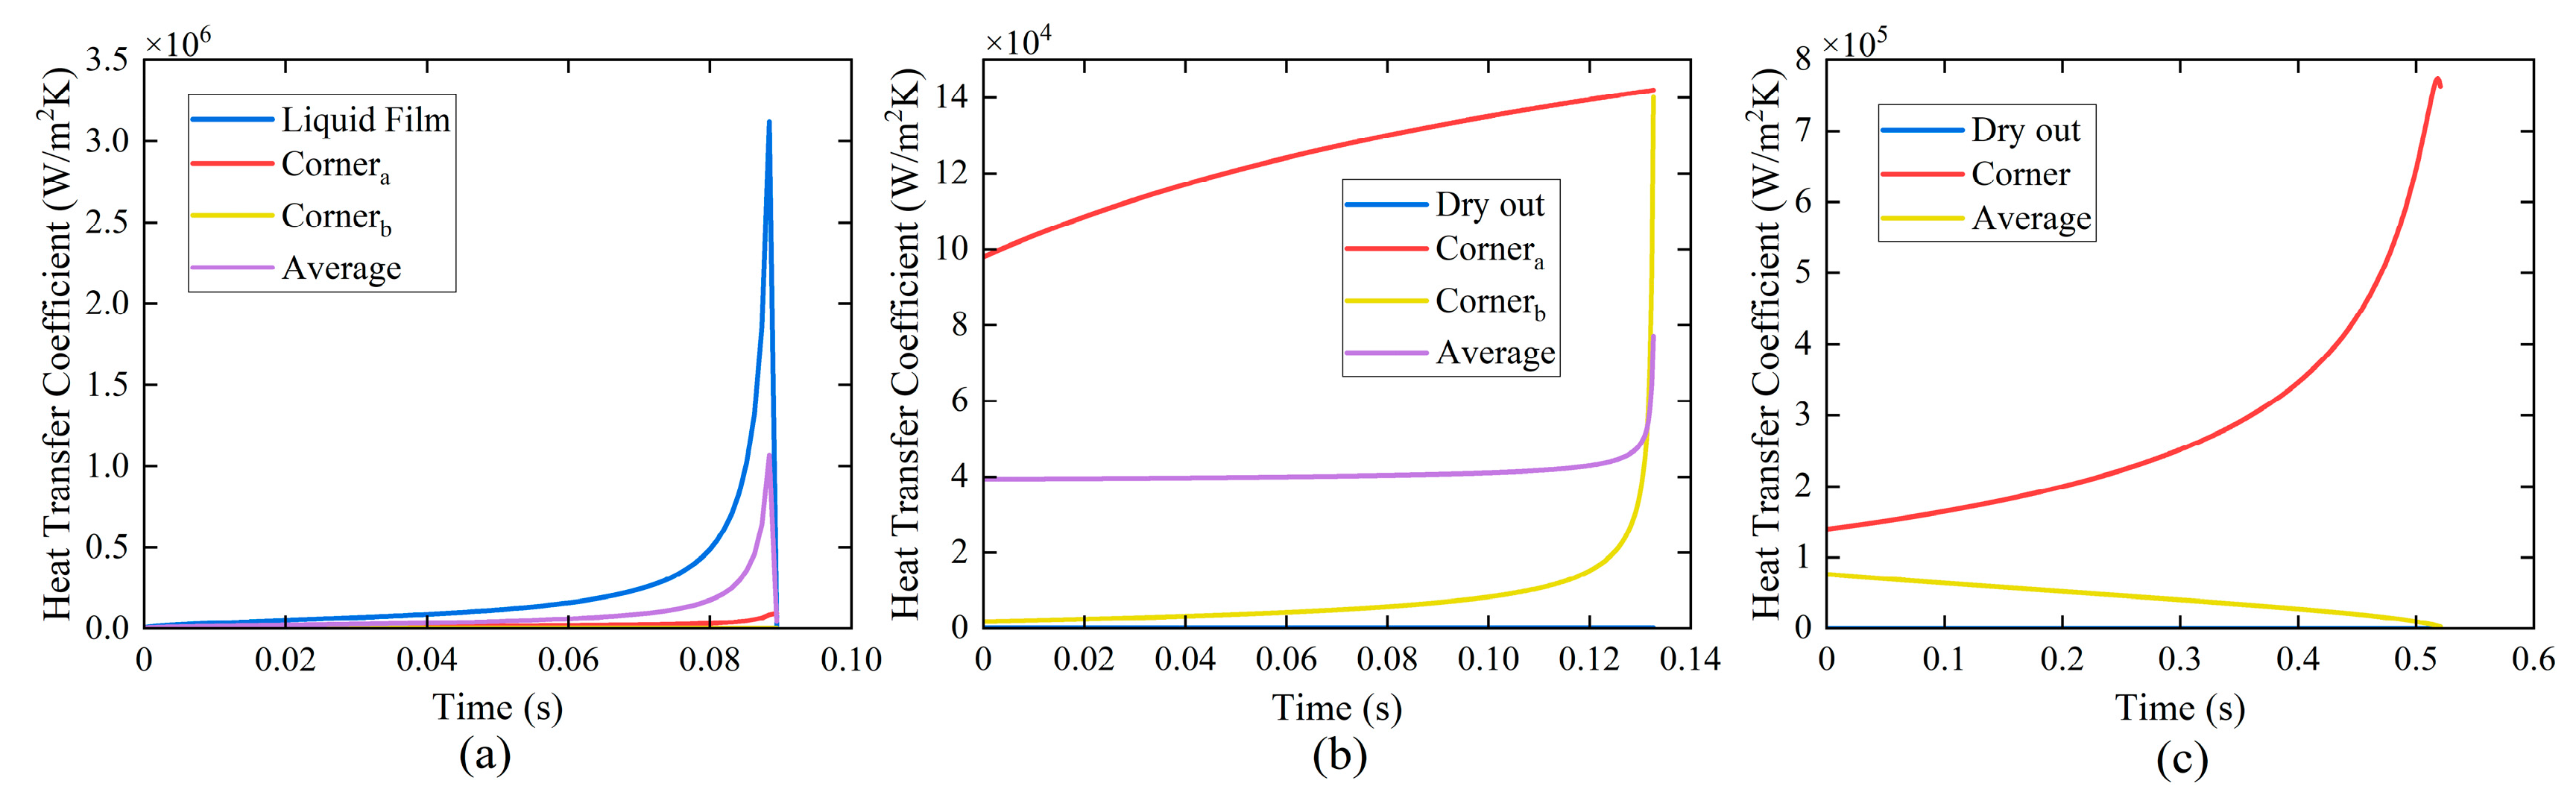
4.2.2. The Spatially Averaged Heat Transfer Coefficient during a Bubble Formation Period

Figure 17 displays the variation in spatially averaged heat transfer coefficient over time. In the liquid slug zone, the spatially averaged heat transfer coefficient for single-phase forced convection is relatively low. In the elongated bubble zone, since the heat transfer mechanism is film evaporation, the average heat transfer coefficient increases rapidly over time until film thickness reduces to the critical film thickness, and then the average heat transfer coefficient decreases dramatically due to the inhibition of film evaporation by disjoining pressure and capillarity. The heat transfer mechanism in the long-side wall dryout zone and corner liquid evaporation zone involves thin film evaporation in the meniscus region and single-phase convection in the vapor phase. In the long-side wall dryout zone, the thinning of film thickness in the center of the short-side wall leads to an increase in the average heat transfer coefficient. In the corner liquid evaporation zone, the average heat transfer coefficient decreases as the meniscus region decreases and the dryout area increases. The average heat transfer coefficient is quite low in the full dryout zone.
The changes in heat transfer coefficients across different regions within the microchannel cross-section in the elongated bubble zone, the long-side wall dryout zone, and the corner liquid evaporation zone are shown in Figure 18. In the elongated bubble zone, the heat transfer coefficient of the thin film region on the long-side wall is much higher than that of the meniscus region, as shown in Figure 18a. In the long-side wall dryout zone, as shown in Figure 18b, the heat transfer coefficient of the meniscus region on the long-side wall is relatively large. The heat transfer coefficient of the meniscus region on the short-side wall increases with time due to evaporation, and ultimately becomes comparable to that of the meniscus region of the long-side wall. In the corner liquid evaporation zone, the heat transfer coefficient in the meniscus region increases with evaporation. However, the average heat transfer still decreases because the meniscus region is shrinking while the dryout zone expands.

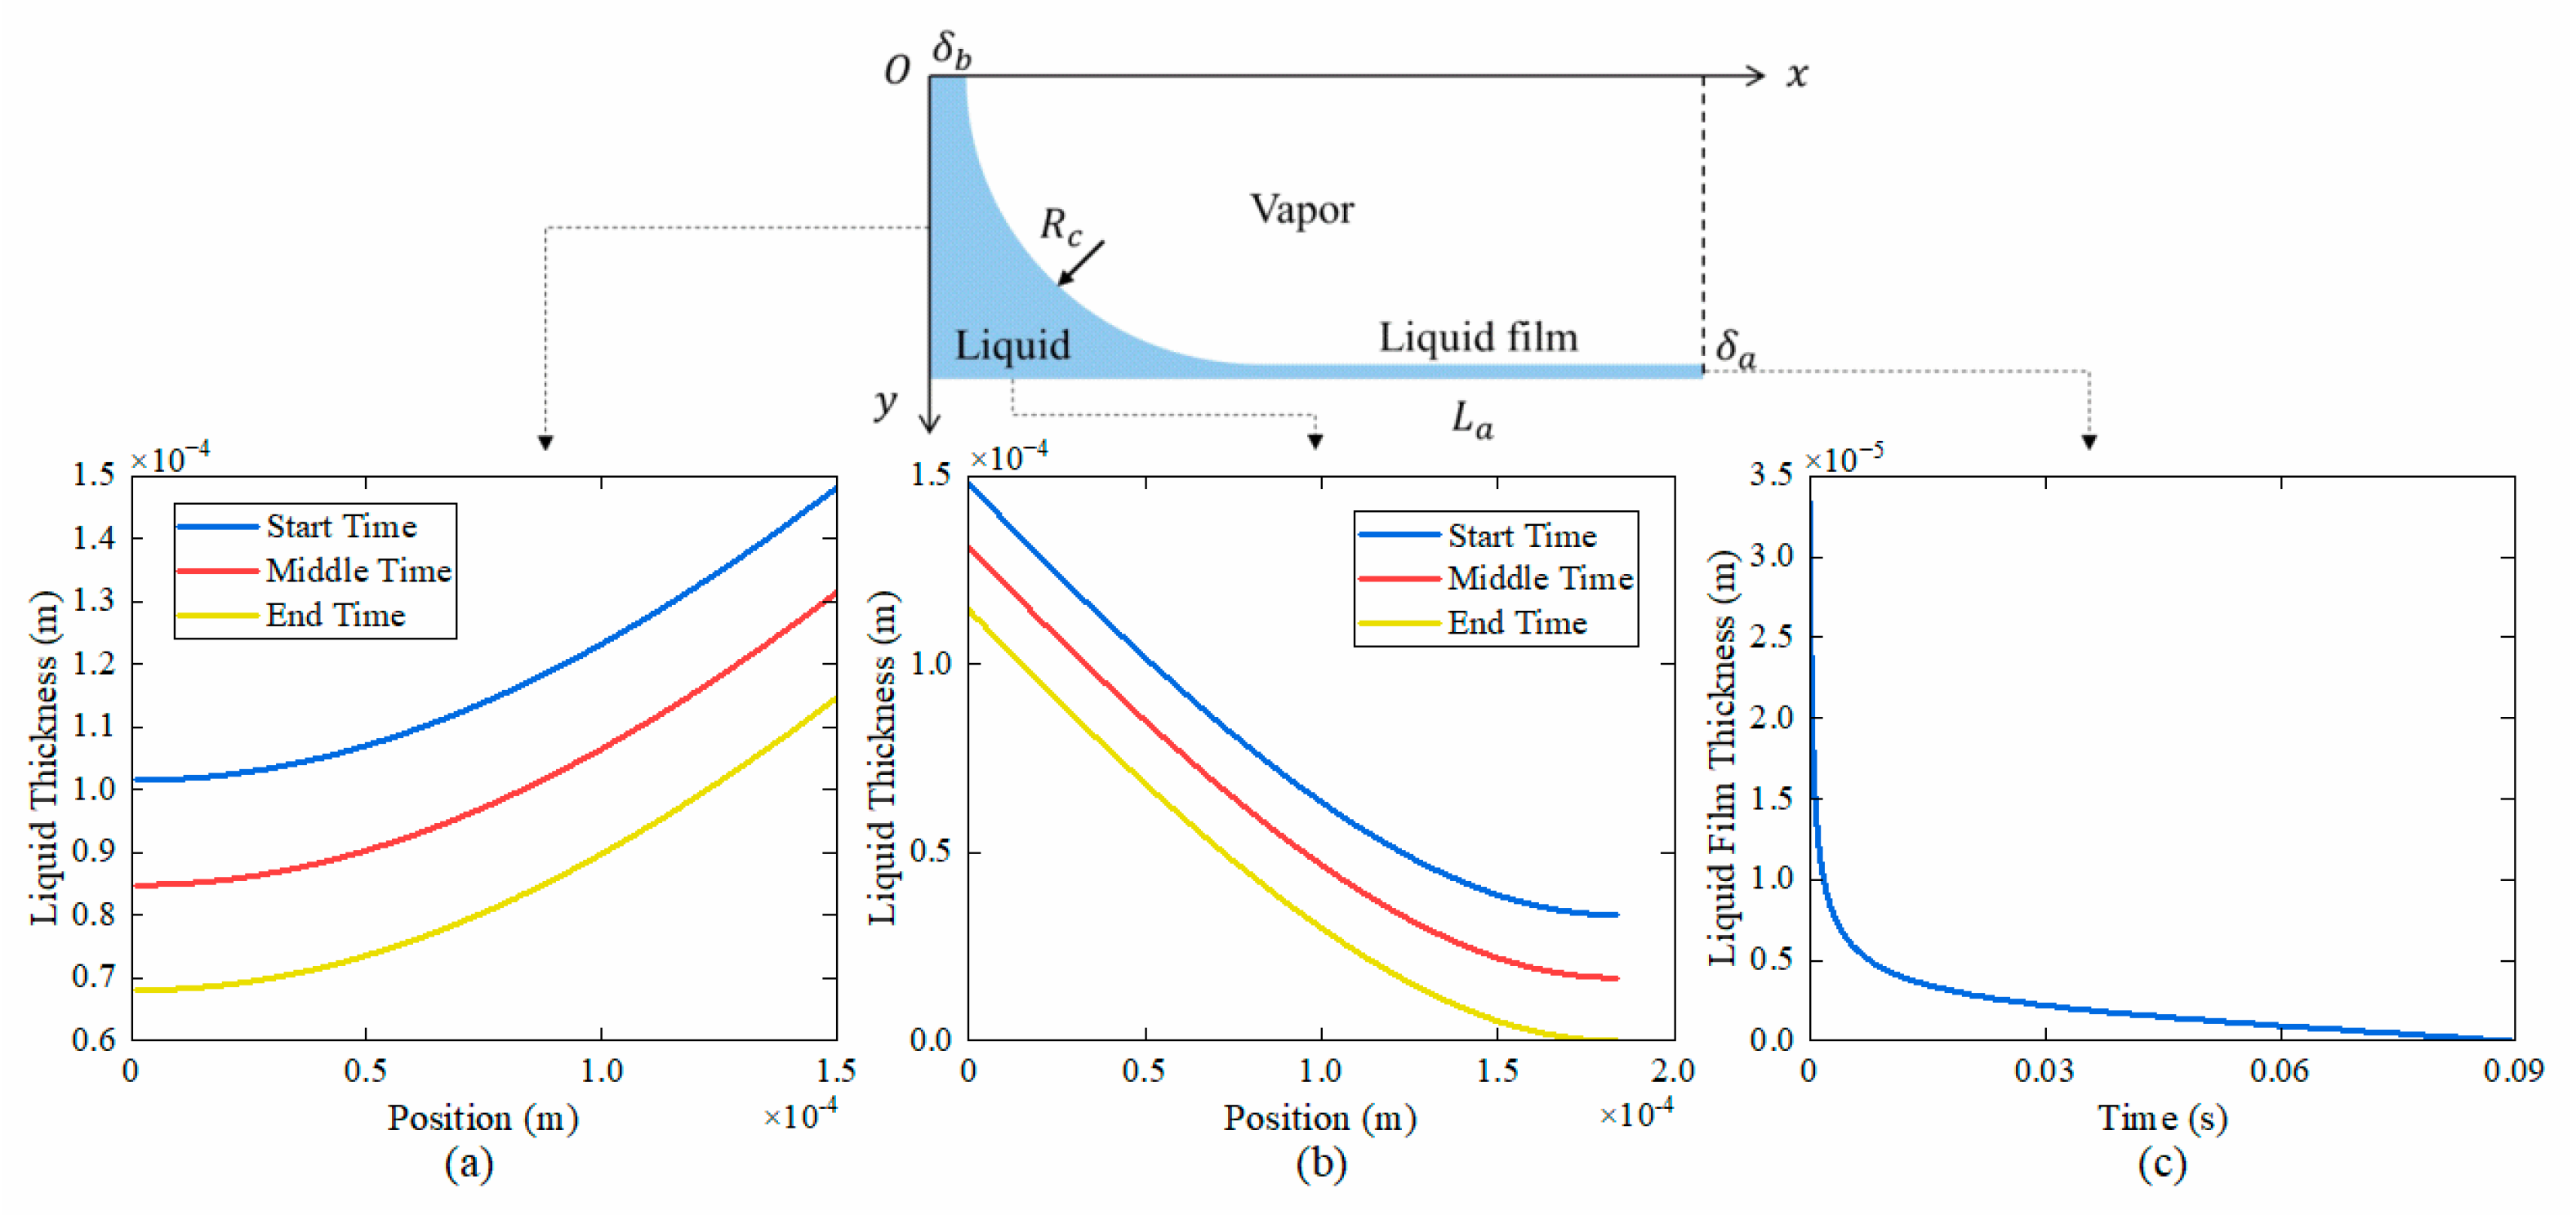
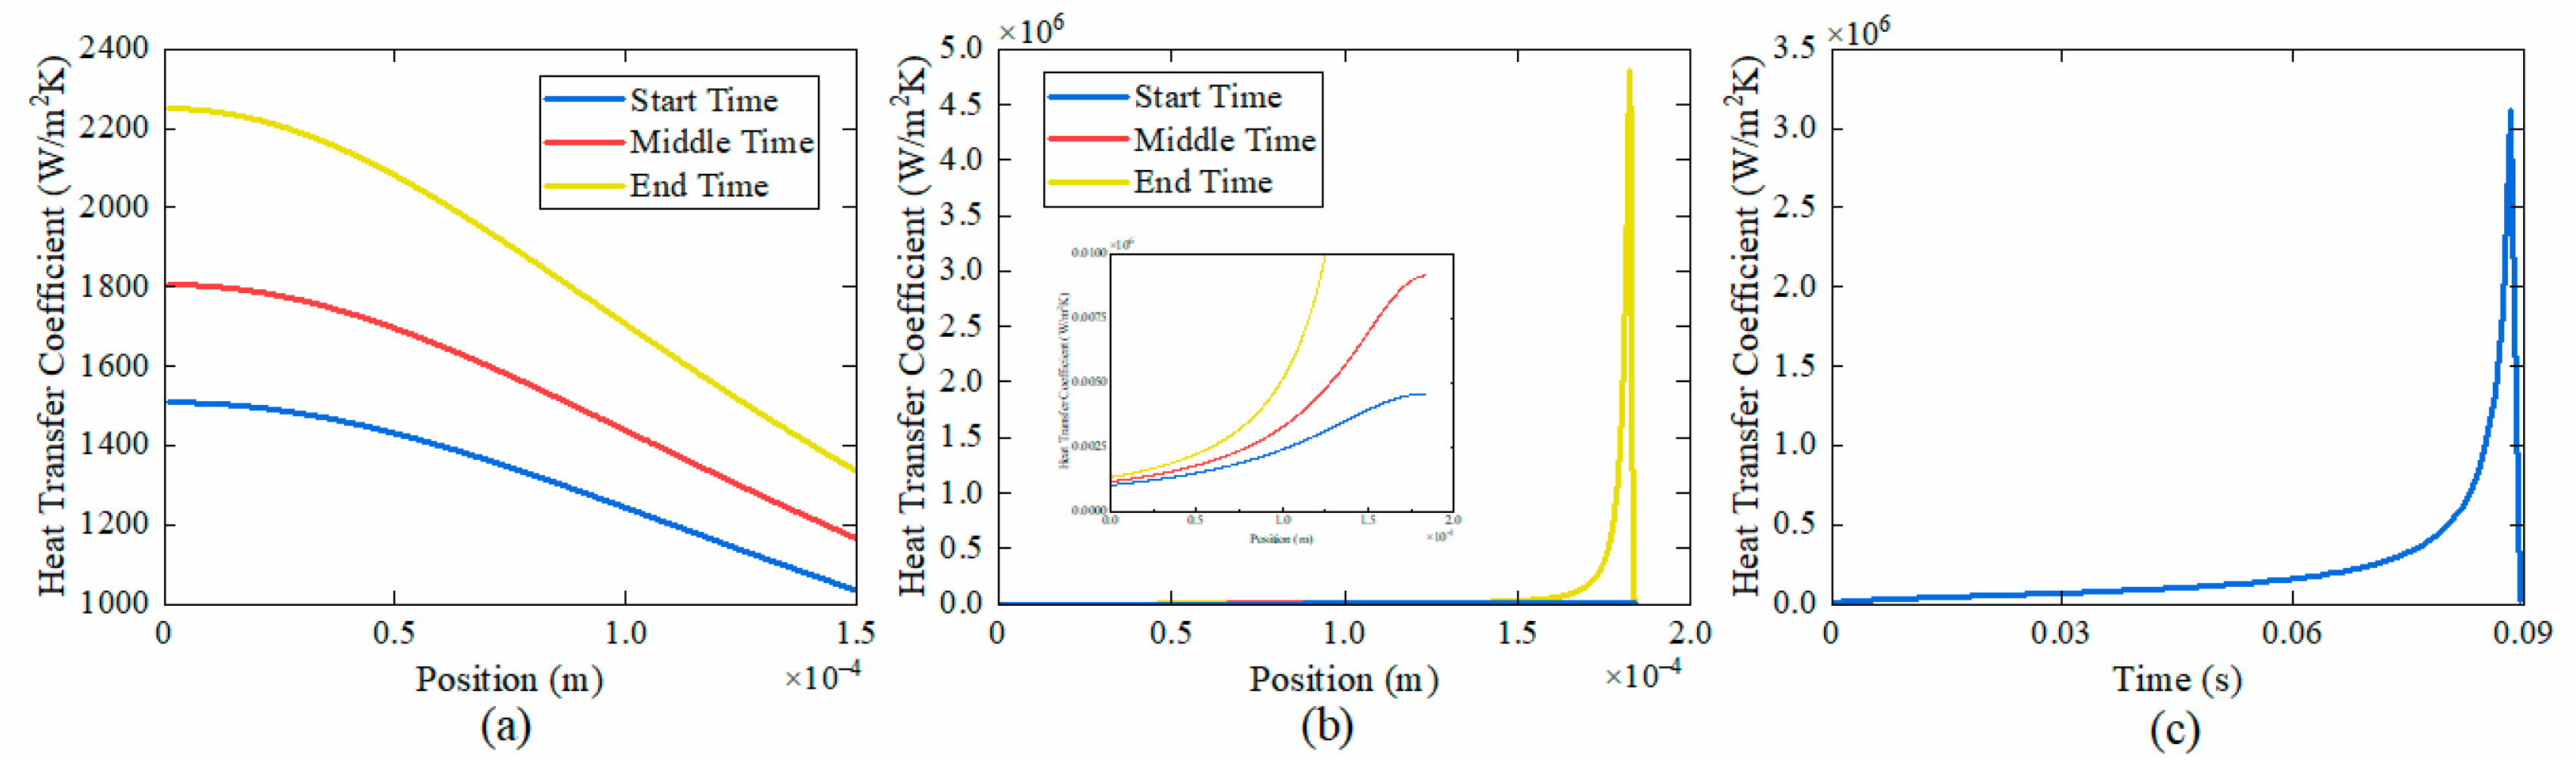
4.2.3. The Elongated Bubble Zone

In the elongated bubble zone, the variation in liquid film thickness across different regions of the rectangular microchannel cross-section is depicted in Figure 19. Figure 19a,b illustrates the variation in the meniscus region on the short-side and long-side walls, and Figure 19c depicts the variation in liquid film thickness in the center of the long-side wall. The liquid film thickness and thinning rate decrease over time during flow boiling.
Figure 20 illustrates the temporal evolution of wall temperature and vapor–liquid interface temperature in the elongated bubble zone, Figure 20a,b represents the meniscus region on the short-side and long-side walls, and Figure 20c shows the variation in the thin liquid film region. It is observed that the temperature of the vapor–liquid interface remains nearly constant with time. Combined with Figure 19, the wall temperature is higher where the liquid film thickness is thicker during flow boiling. As liquid film thins, the wall temperature decreases. While the film thickness is extremely thin, thin liquid film evaporation is suppressed due to disjoining pressure and capillarity, leading to a rise in both the wall temperature and vapor–liquid interface temperature.
Figure 21 depicts the variation in heat transfer coefficients across different regions of the cross-section in the elongated bubble zone. It is evident that the thicker liquid film corresponds to the lower heat transfer coefficient. With the decrease in the film thickness, the heat transfer coefficient increases. When the film thickness reaches the critical film thickness, the heat transfer coefficient peaks. Subsequently, when the liquid film continues to thin, the heat transfer coefficient sharply drops due to the inhibition of evaporation by disjoining pressure and capillarity.

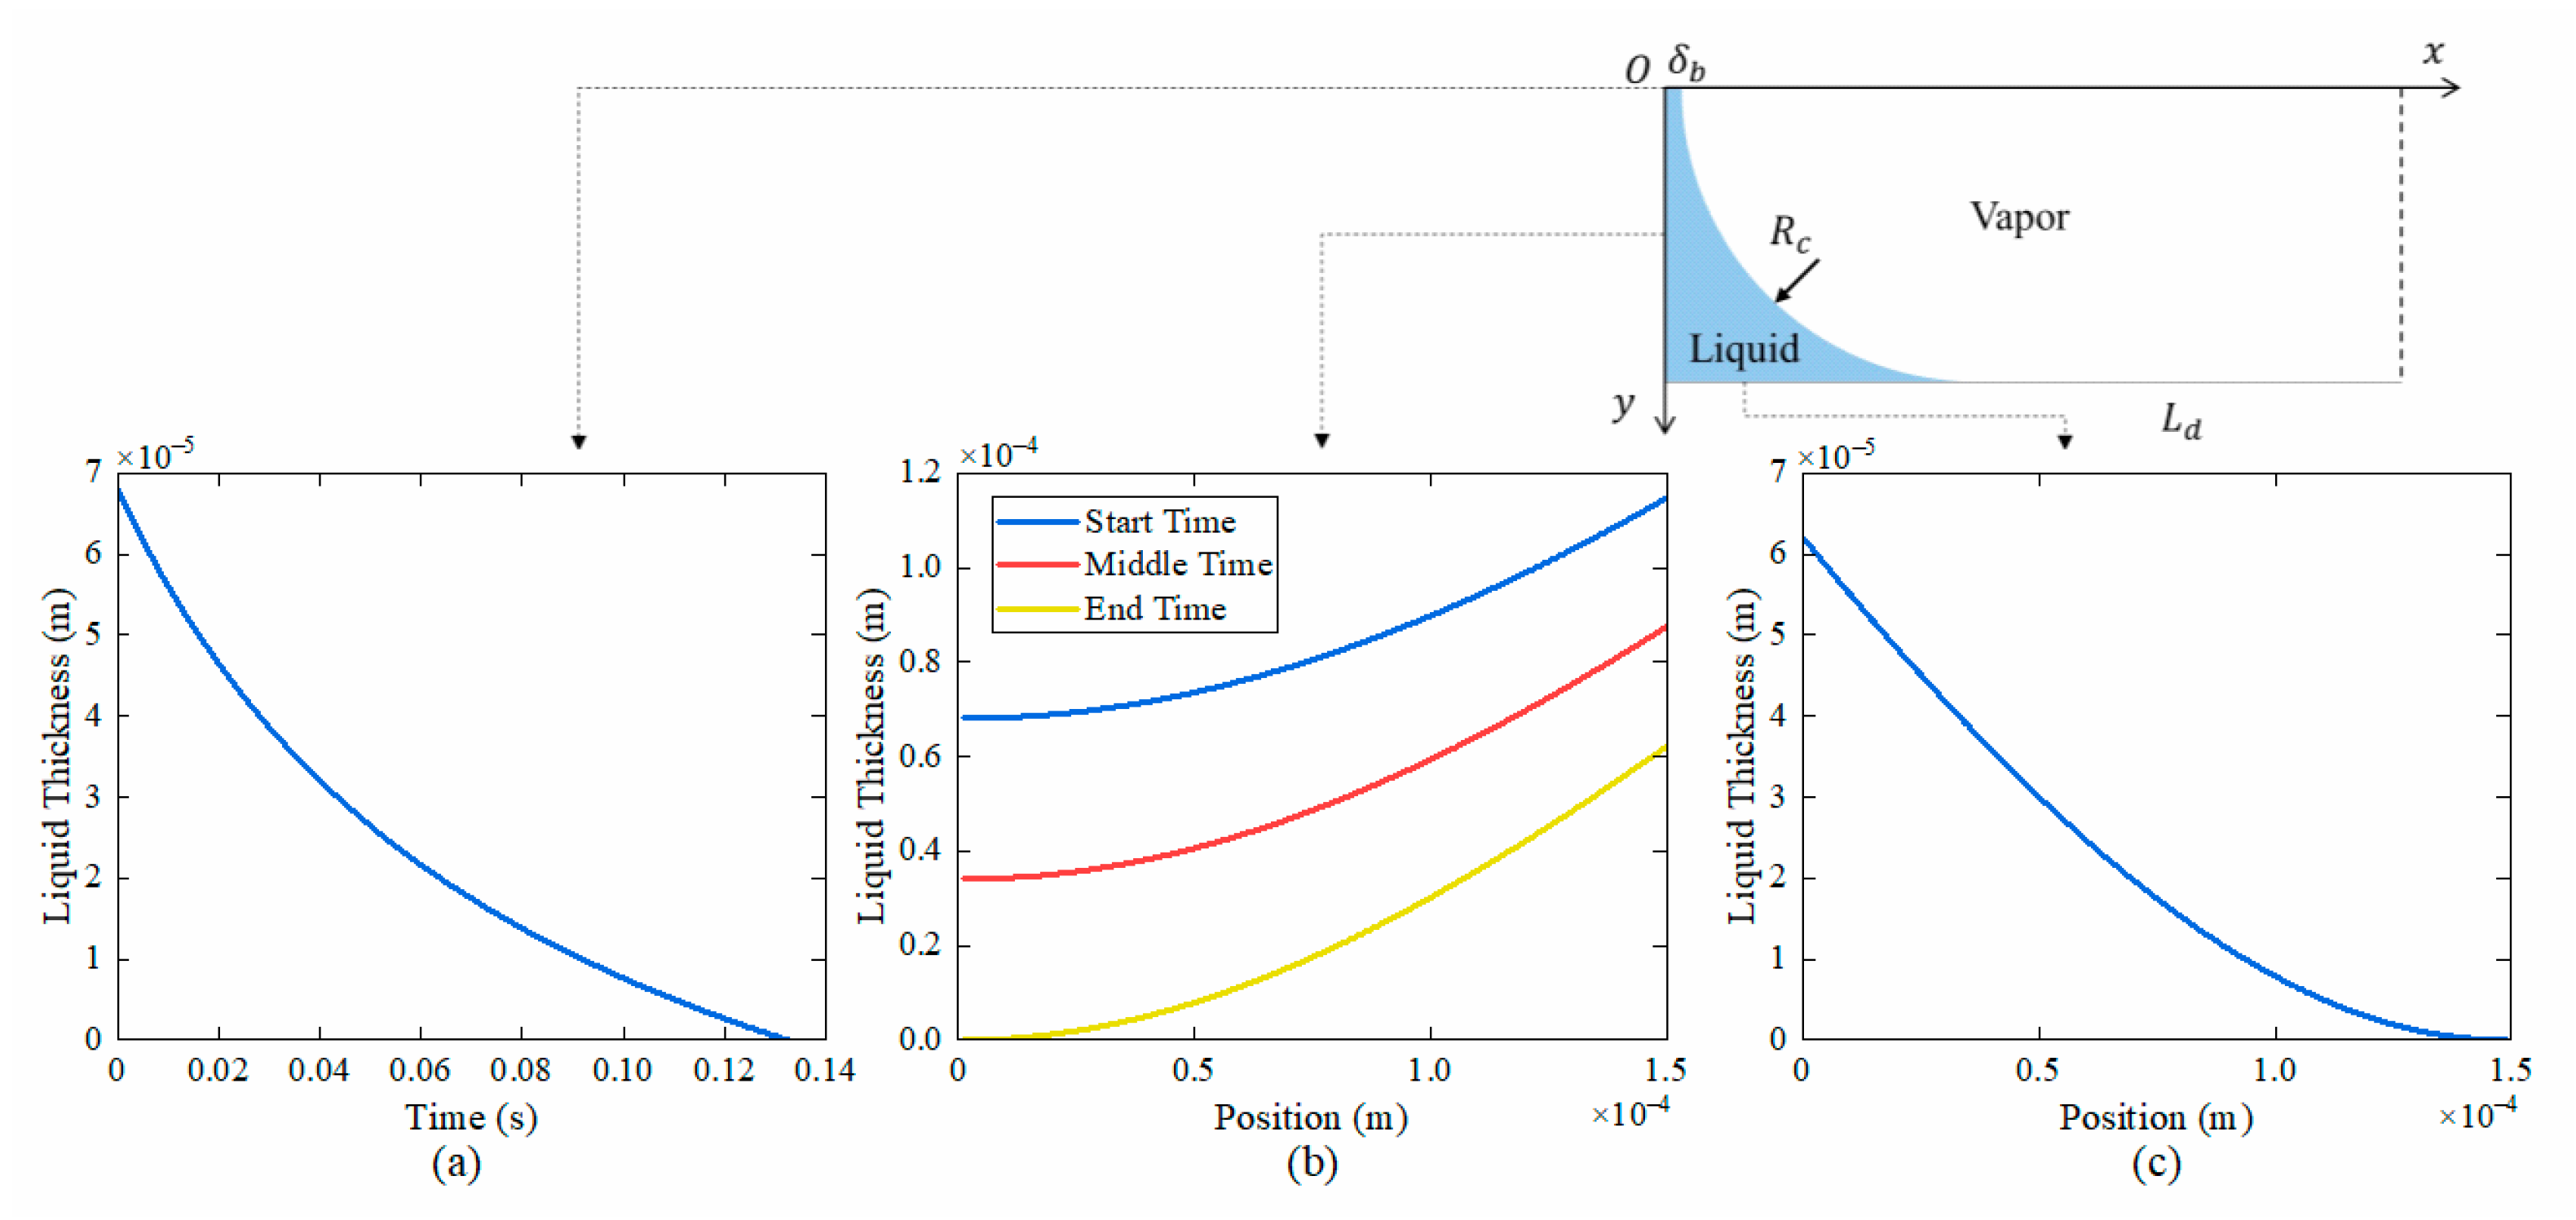
4.2.4. The Long-Side Wall Dryout Zone

The changes in film thickness across different regions of the cross-section in the long-side wall dryout zone are shown in Figure 22. The liquid film thickness of the meniscus region on the short-side wall decreases with time, while the liquid distribution of the meniscus region on the long-side wall remains nearly unchanged. The vapor–liquid interface moves towards the short-side wall, transitioning into the corner evaporation region.
In the long-side wall dryout zone, the changes in wall temperature and vapor–liquid interface temperature in the meniscus region on the short-side wall and the long-side wall are depicted in Figure 23a,b, and the variations in heat transfer coefficients for these regions are shown in Figure 23c,d. As the liquid film thickness decreases, the wall temperature lowers, the temperature at the vapor–liquid interface remains nearly constant, and the heat transfer coefficient increases. However, once the liquid film reaches critical thickness, thin film evaporation is inhibited. With further reduction in liquid film thickness, both the wall temperature and the vapor–liquid interface temperature increase, leading to a sharp decrease in the heat transfer coefficient.

4.2.5. The Corner Liquid Evaporation Zone

In the corner liquid evaporation zone, the meniscus radius decreases with time, as shown in Figure 24a, indicating the corner meniscus region reduces. The liquid film thickness reaches the critical film thickness near the full dryout zone, where the wall temperature is minimized.

4.3. Influence Factor of Heat Transfer Performance

Many factors affect the distribution and dynamics of the liquid film, thereby impacting the heat transfer performance of the microchannel. In this section, the influencing factors are discussed using numerical calculations with the five-zone heat transfer model.

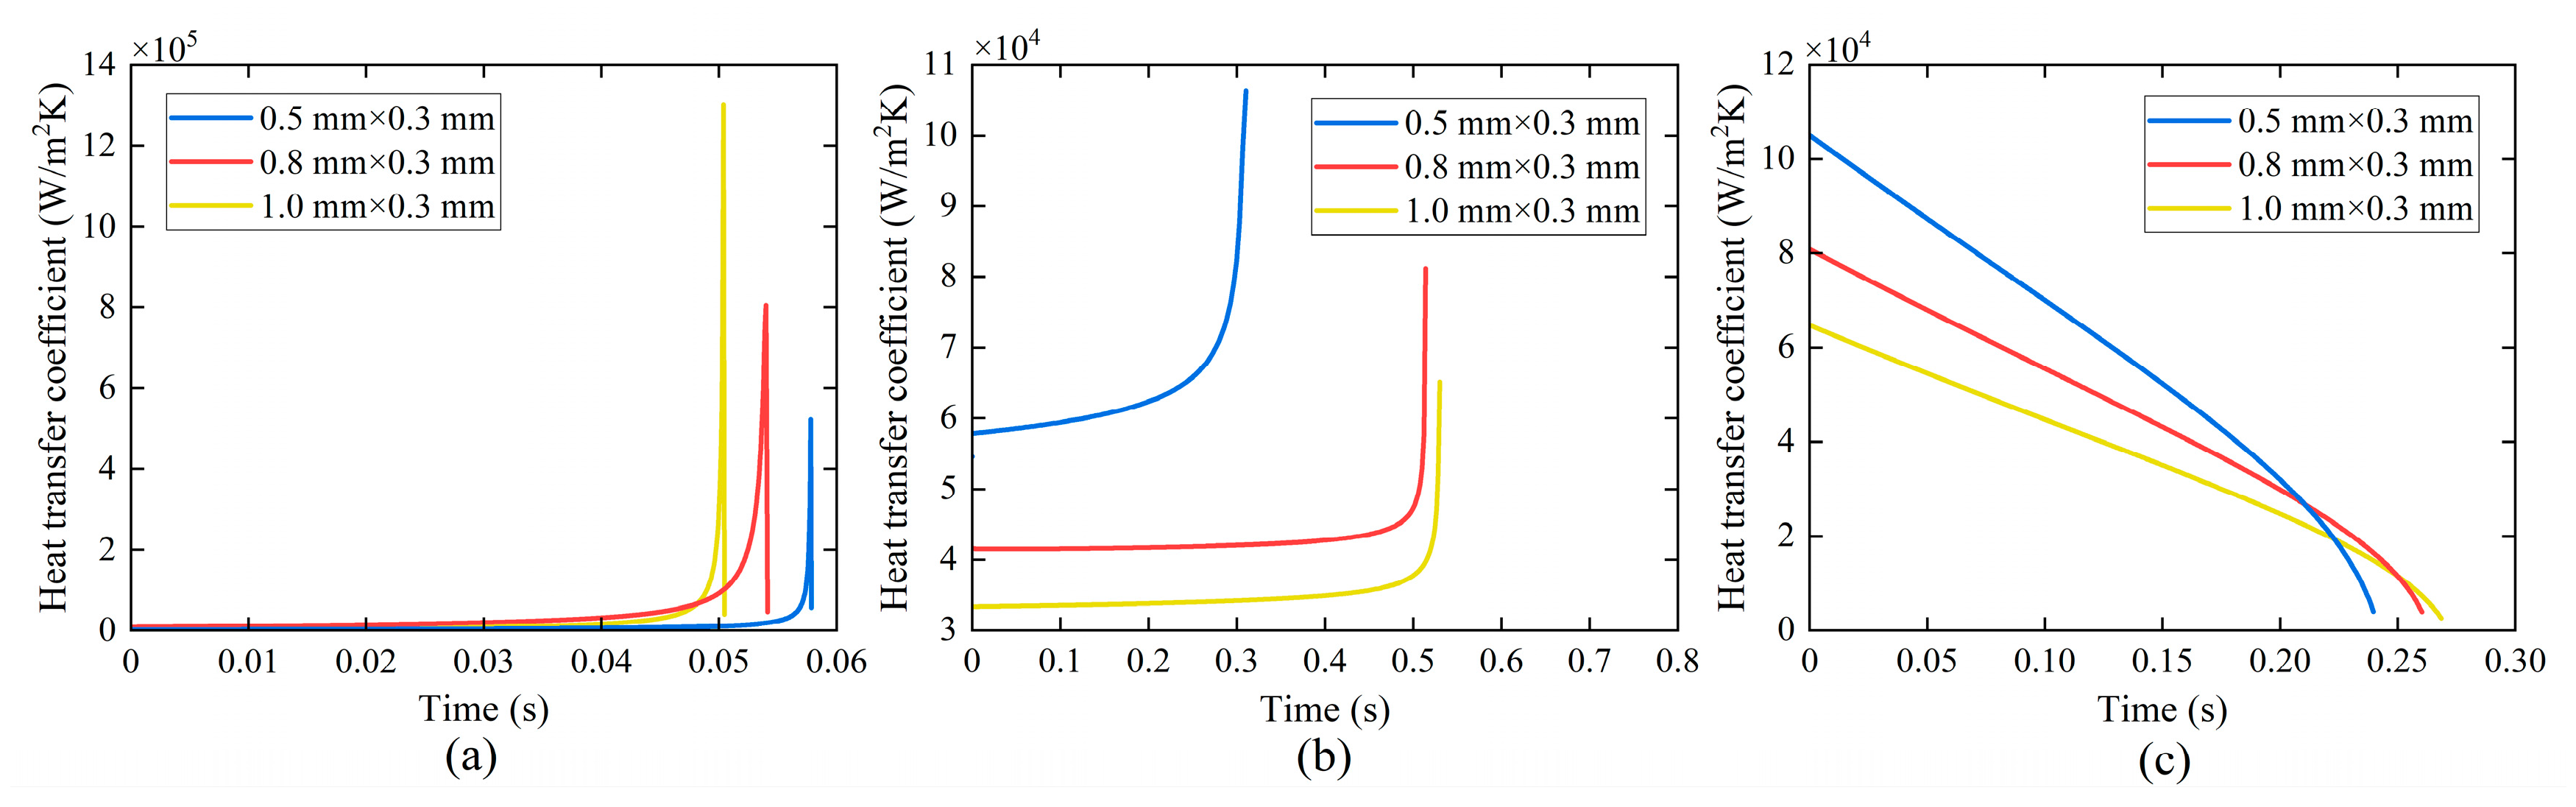
4.3.1. Effect of Aspect Ratio

During flow boiling in rectangular microchannels, the aspect ratio plays a crucial role in determining the flow and heat transfer characteristics. When the aspect ratio exceeds 2.04, the bubble shape in the cross-section does not appear circular [40]. The prediction of heat transfer performance can be calculated using the five-zone flow boiling model in this study. When the aspect ratio is less than 2.04, the bubble shape in the cross-section is rounded rectangular at low capillary numbers and circular at high capillary numbers. The variation in liquid film thickness can be obtained by using the transient liquid film thickness model for square microchannels [34]. When the hydraulic diameter of the rectangular microchannel is the same, the duration and the peak value of the average heat transfer coefficient increase with increasing aspect ratio in the elongated bubble zone, as shown in Figure 25a, while those in the long-side wall dryout zone and the corner liquid evaporation zone decrease as aspect ratio increases, as illustrated in Figure 25b,c.

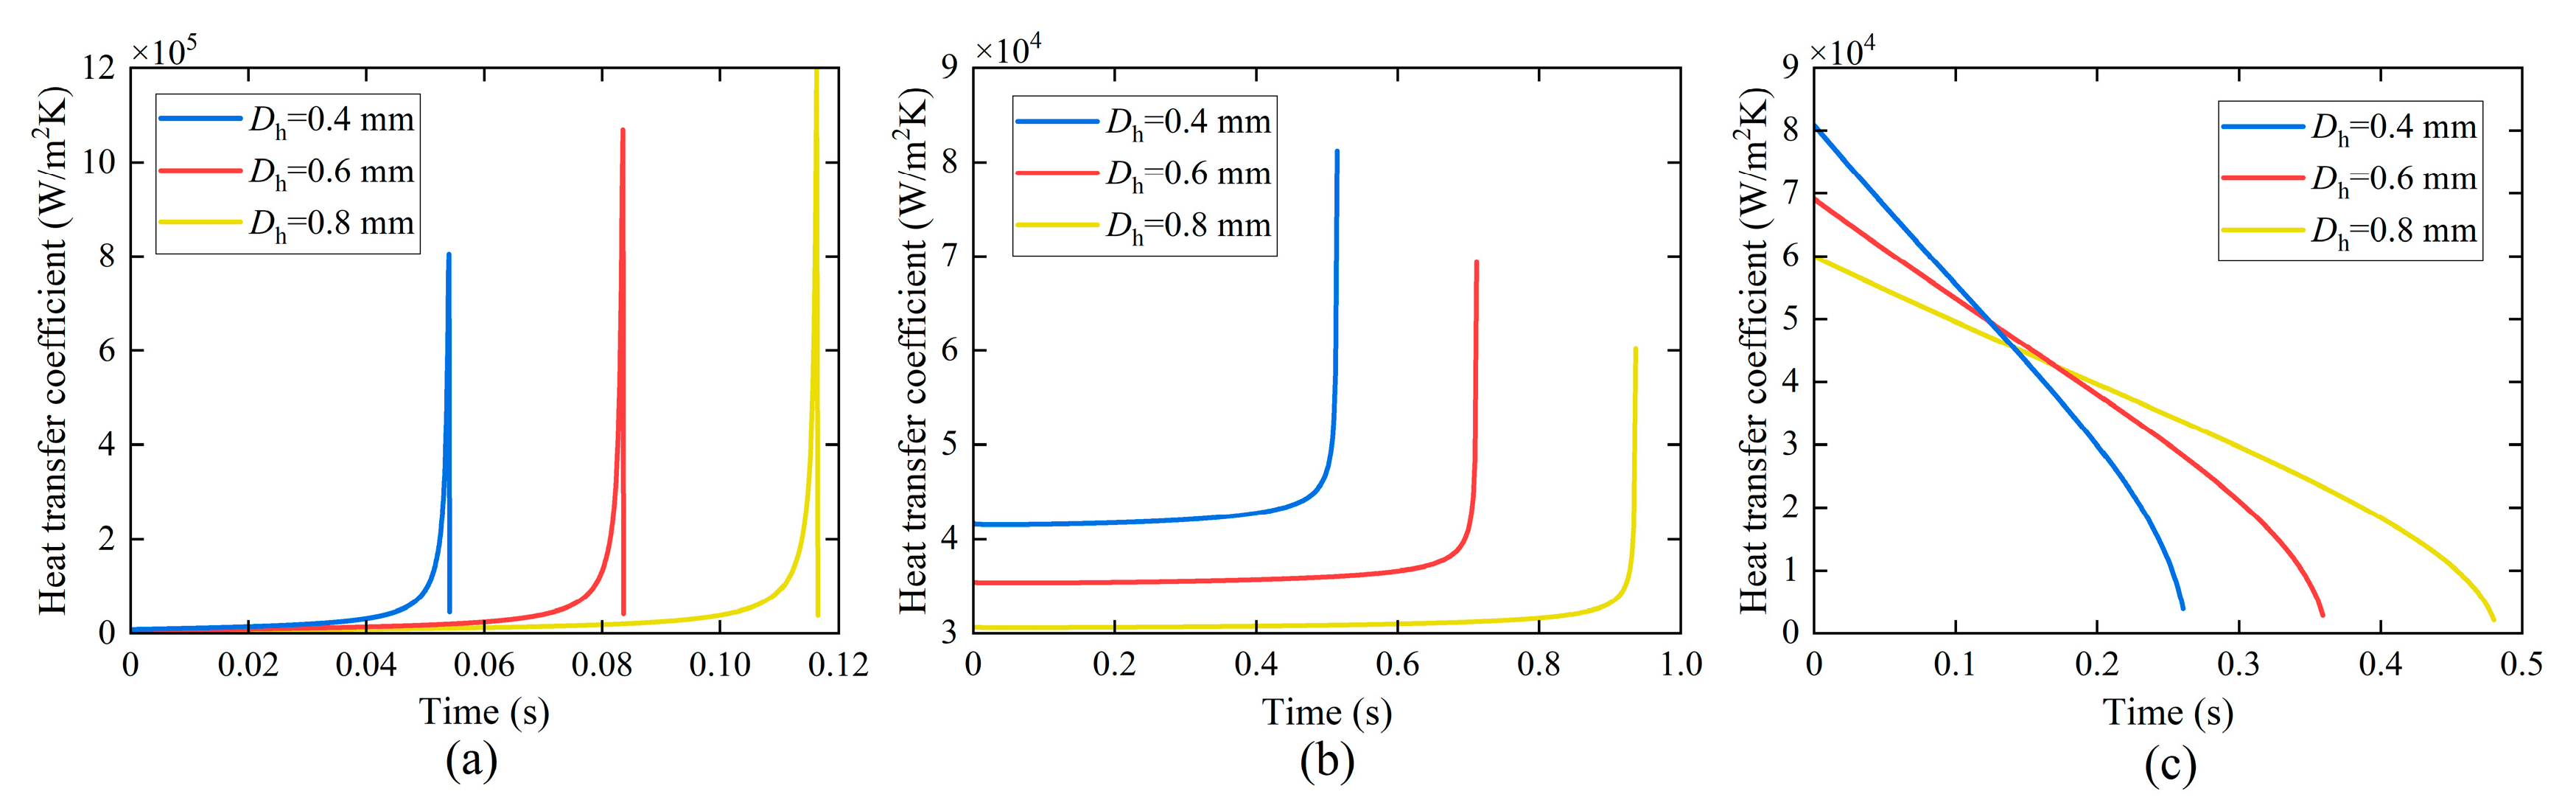
4.3.2. Effect of Hydraulic Diameter

The hydraulic diameter is also one of the significant parameters in microchannel flow boiling. A larger hydraulic diameter results in a thicker liquid film on the wall [41]. During the initial stage of flow boiling, microchannels with smaller hydraulic diameters exhibit superior heat transfer performance. However, as flow boiling progresses, microchannels with smaller hydraulic diameters experience dryout earlier, leading to a deterioration in heat transfer performance. In contrast, in microchannels with larger hydraulic diameters, the liquid film continues thinning and the heat transfer coefficient increases.
As illustrated in Figure 26, when the aspect ratio remains constant but the hydraulic diameter of the microchannel varies, the duration increases with the increase in the hydraulic diameter in the elongated bubble zone, the long-side wall dryout zone, and the corner liquid evaporation zone. The peak value of the average heat transfer coefficient increases in the elongated bubble zone, but decreases in the long-side wall dryout zone and the corner liquid evaporation zone. When the height of the rectangular section is the same, the duration decreases in the elongated bubble zone as the width of the rectangular section increases, as depicted in Figure 27.

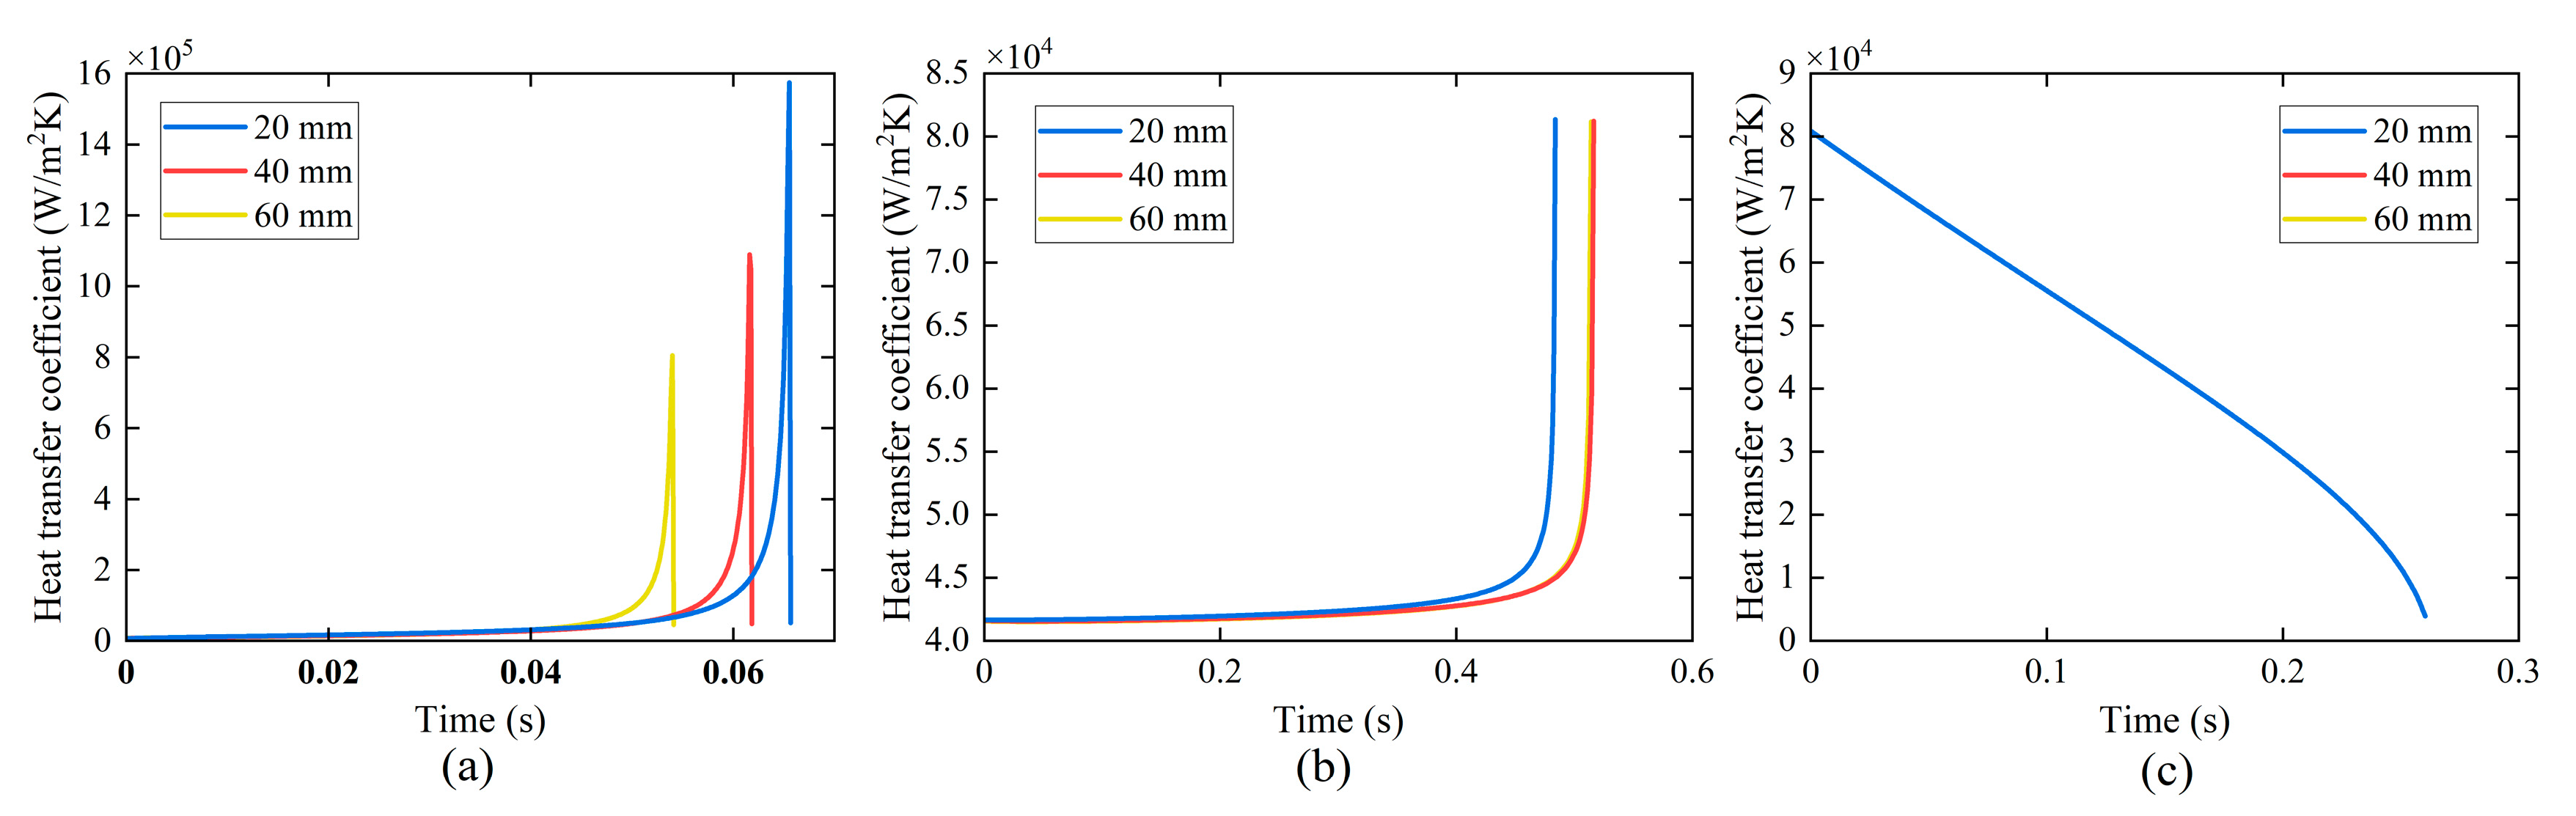
4.3.3. Effect of Measurement Point

The variation in the heat transfer coefficient over time at different positions along the flow direction in the microchannel is shown in Figure 28. The duration and the peak of the average heat transfer coefficient decrease along the flow direction in the elongated bubble zone, while the duration increases and the peak of the average heat transfer coefficient does not change in the corner liquid evaporation zone.

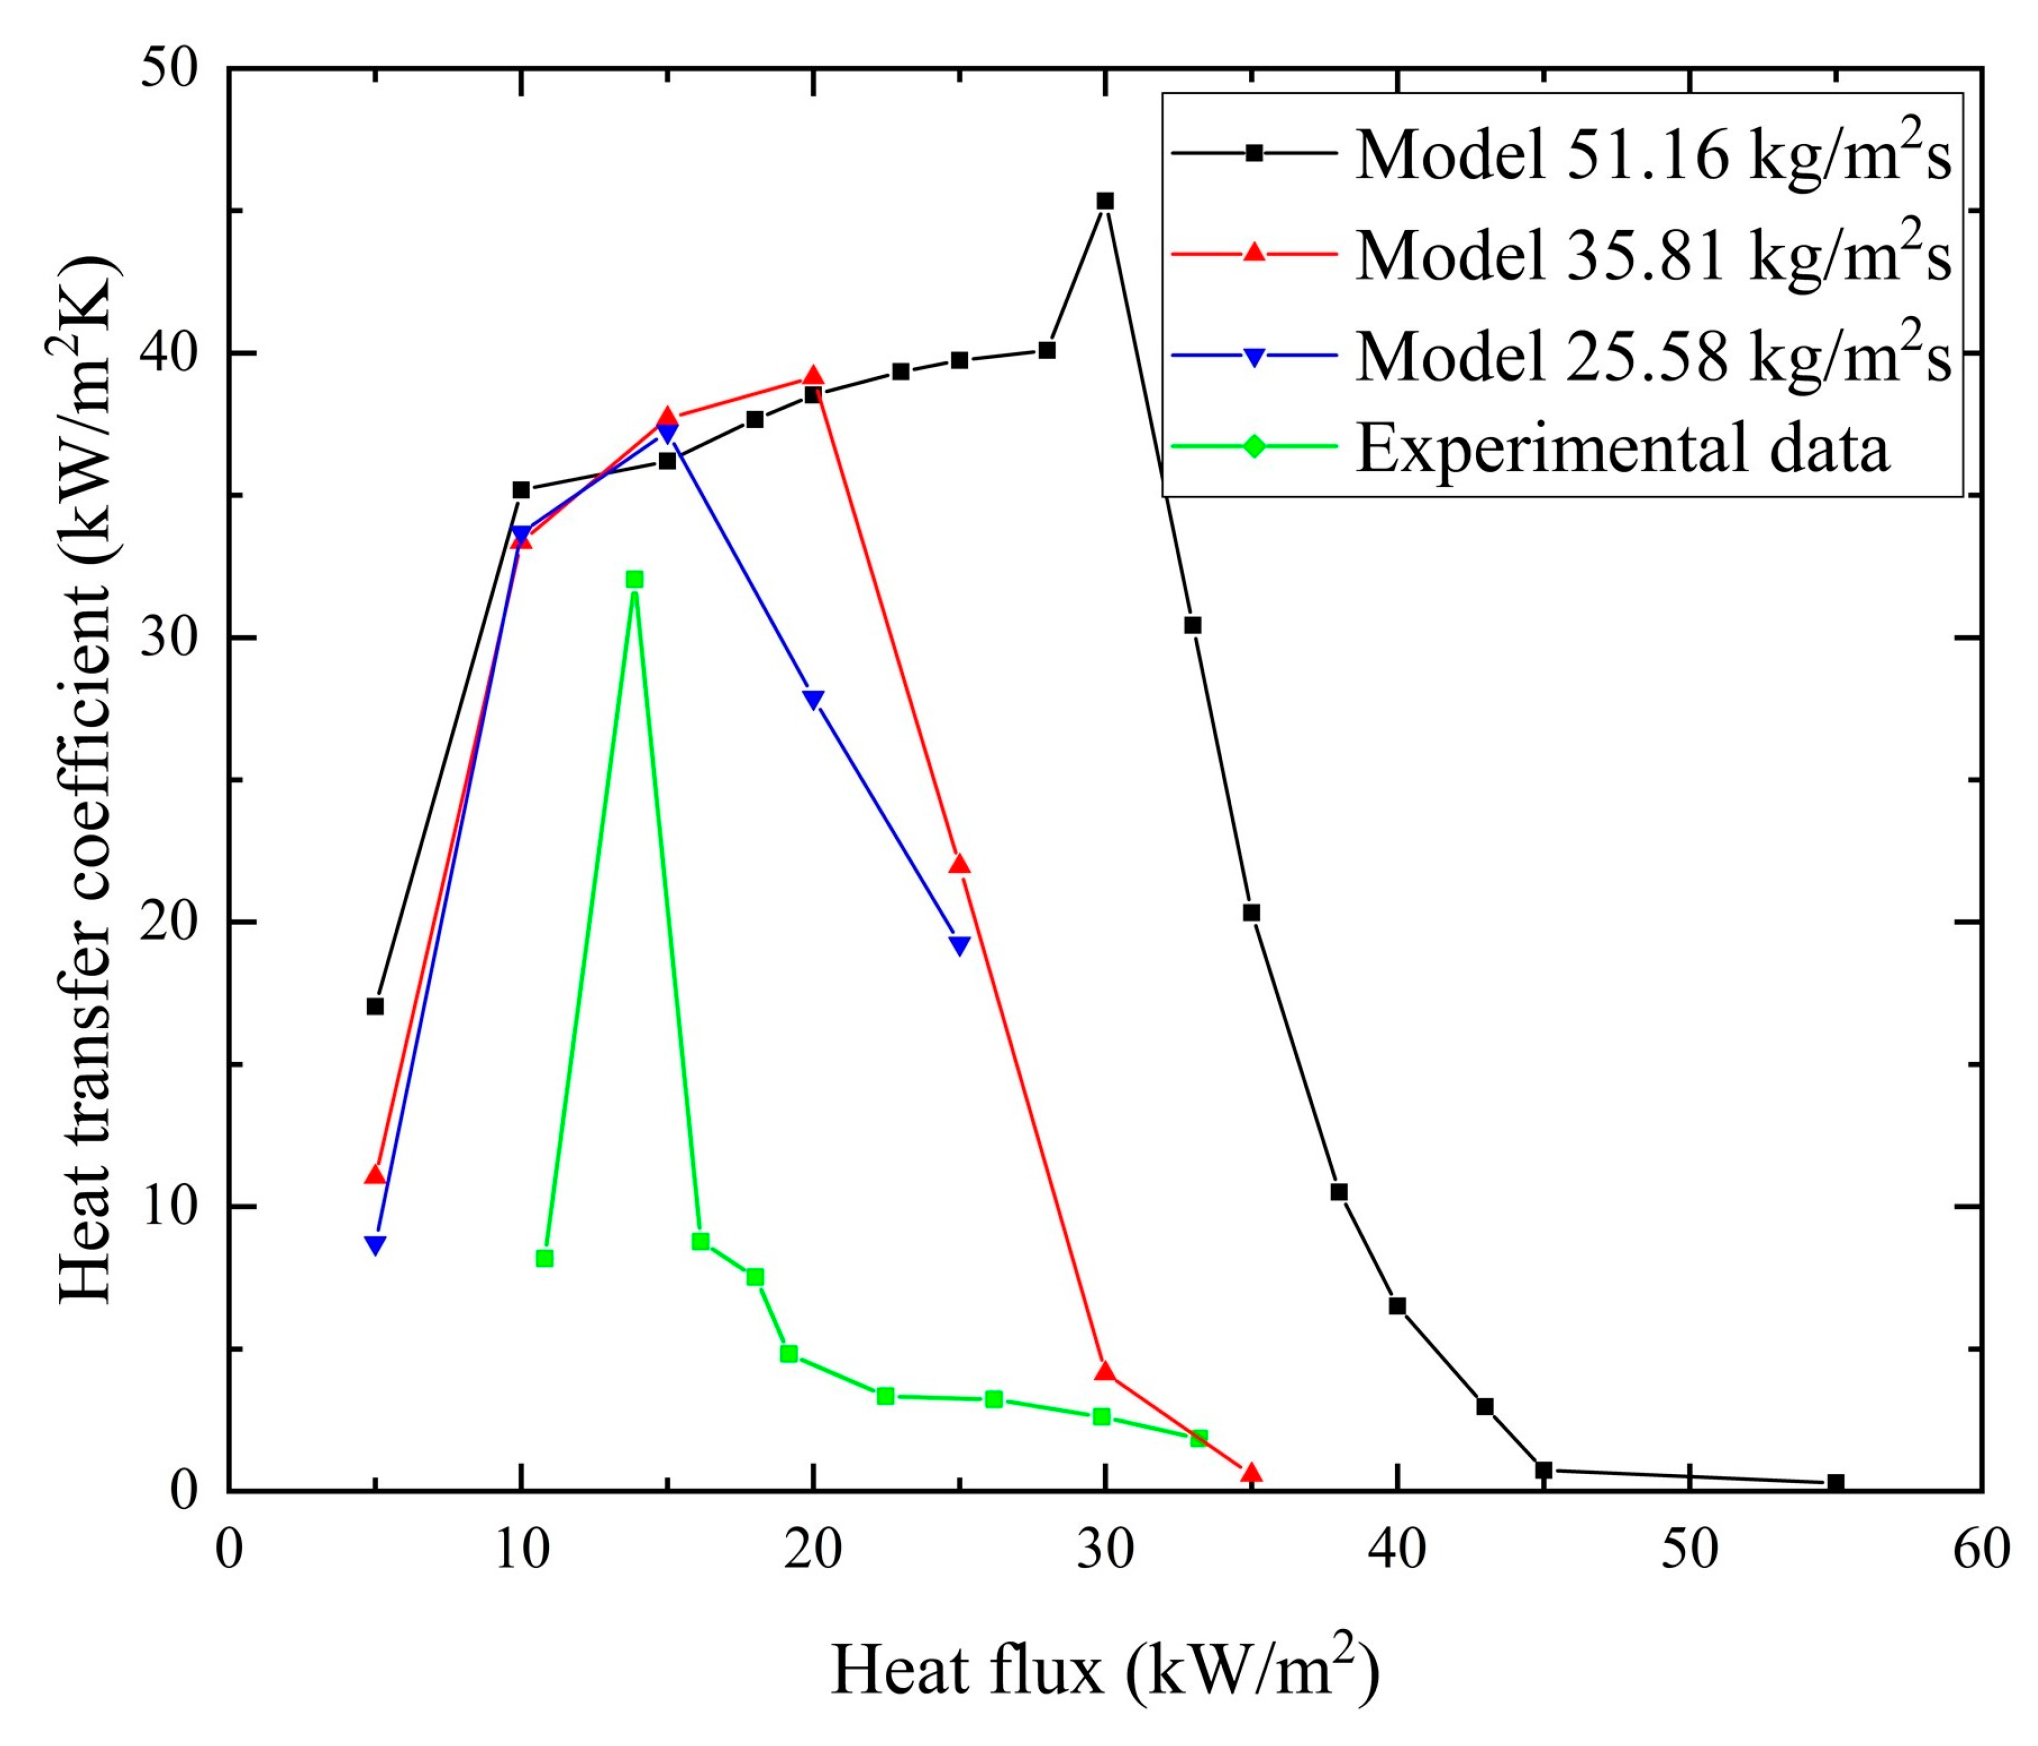
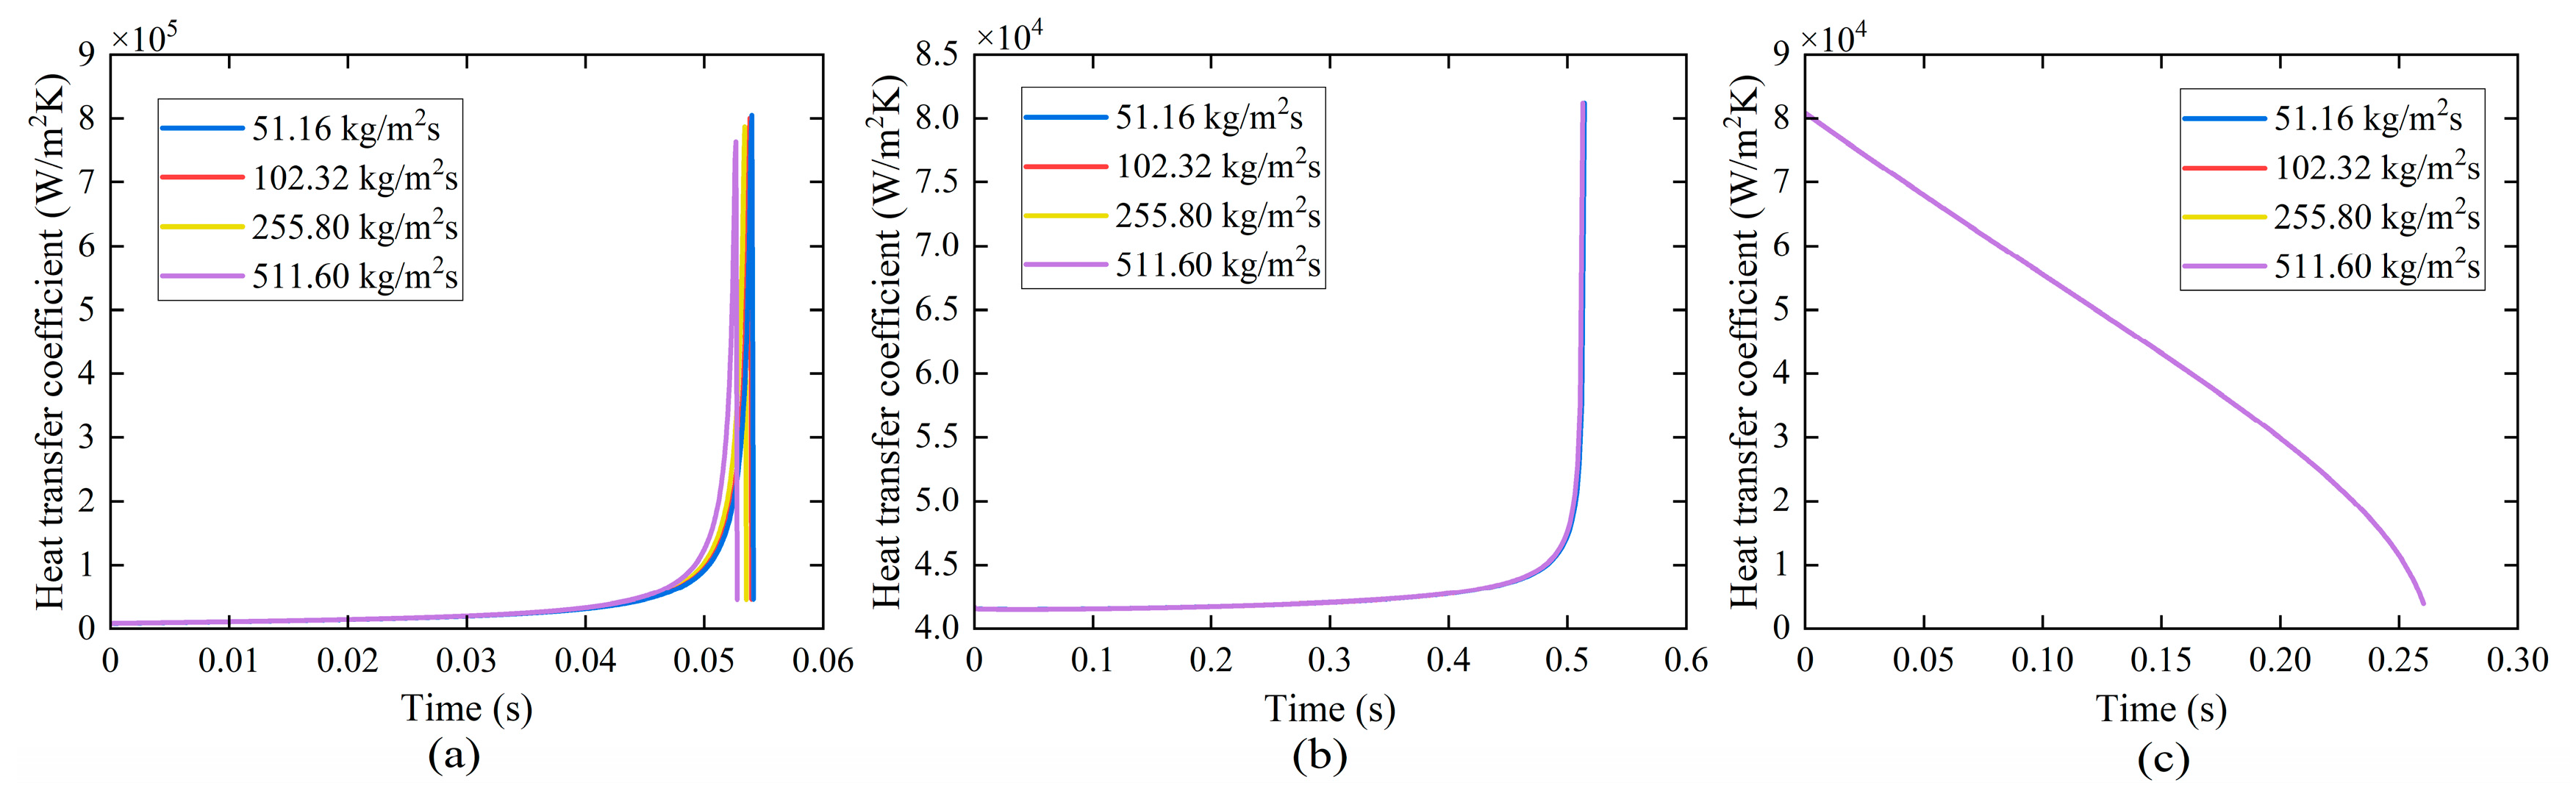
4.3.4. Effect of Mass Flux

Figure 29 depicts the variation in time-averaged heat transfer under different mass fluxes. The duration and the peak value of the average heat transfer coefficient decrease slightly with increasing mass flux in the elongated bubble zone. The average heat transfer coefficient remains nearly constant in both the long-side wall dryout zone and the corner liquid evaporation zone. The bubble formation period and the residence time of liquid slug increase with the increase in mass flux, which influences the heat transfer coefficient.

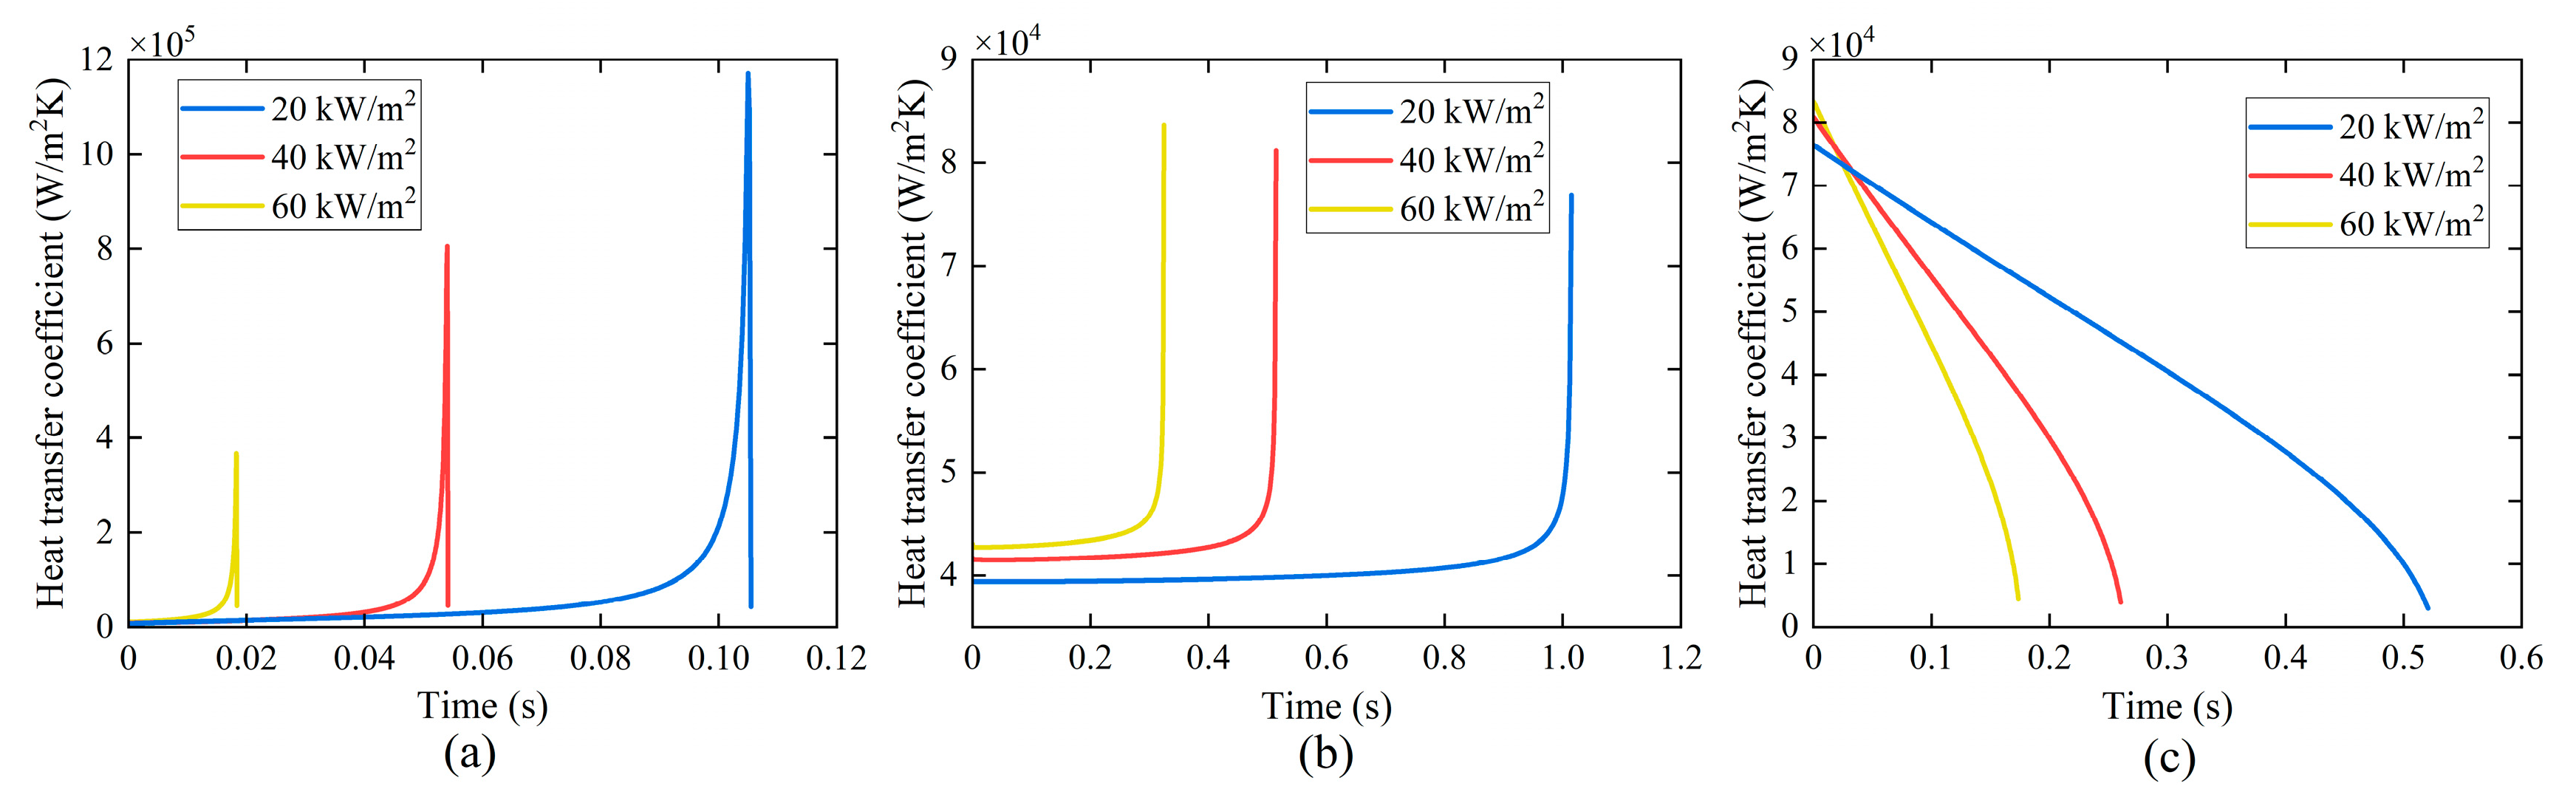
4.3.5. Effect of Heat Flux

Heat flux affects the bubble formation period, the residence time of liquid slug and vapor slug, and the rate of evaporation. As heat flux increases, the bubble formation period and the residence time of the liquid slug decrease. The duration of the elongated bubble zone, the long-side wall dryout zone, and the corner liquid evaporation zone decreases with increasing heat flux, as depicted in Figure 30. With an increase in heat flux, the average heat transfer coefficient decreases in the elongated bubble zone while increasing in the long-side wall dryout zone and the corner liquid evaporation zone.

5. Conclusions

In the present study, the heat transfer mechanism for flow boiling in rectangular microchannels was studied. Based on accurate transient liquid film thickness measurement by a laser confocal displacement meter (LFDM), a five-zone model for predicting flow boiling heat transfer performance has been established. The following conclusions can be obtained from this work.
At low heat fluxes, the heat transfer mechanism is single-phase convection in the liquid phase, leading to a relatively low heat transfer coefficient. When an elongated bubble passes through, the heat transfer mechanism is thin film evaporation, leading to a very high heat transfer coefficient that increases as the liquid film thins. When the microchannel wall dries out, the heat transfer mechanism is single-phase convection in the gas phase and evaporation from the corner liquid, resulting in a rapid deterioration of heat transfer performance.
The heat transfer performance is related to the residence time of the liquid slug and vapor slug and transient liquid film thickness. The five-zone model divides the flow boiling process into the liquid slug zone, the elongated bubble zone, the long-side wall dryout zone, the corner liquid evaporation zone, and the full dryout zone. The new model comprehensively explains the experimental phenomena observed, including the dryout on the long-side wall while the short-side wall remains in the process of liquid film thinning.
Correlation predictions derived from this model showed good agreement with the experimental data. The spatial and temporal variations in heat transfer coefficients across different zones, as well as different regions of cross-section, have been investigated. Numerical calculations have been conducted to investigate the factors influencing heat transfer performance. This work provides valuable insights into optimizing microchannel heat exchanger design to achieve more efficient heat dissipation, maintain a uniform temperature, and prevent dryout or excessive pressure drops.

Author Contributions

Conceptualization, Y.J. and S.T.; methodology, Y.J.; software, C.G.; validation, P.Z., T.W., and C.G.; formal analysis, P.Z.; investigation, J.Z.; resources, T.W.; data curation, Y.J. and S.T.; writing—original draft preparation, J.Z.; writing—review and editing, S.T.; visualization, J.Z.; supervision, Y.J.; project administration, S.T.; funding acquisition, Y.J. All authors have read and agreed to the published version of the manuscript.

Funding

This research was funded by the National Natural Science Foundation of China, grant number 52276050, and the Beijing Institute of Technology Research Fund Program for Advanced Talents.

Data Availability Statement

Data are contained within the article.

Conflicts of Interest

The authors declare no conflicts of interest.

Nomenclature

Aarea, mm2
Boboiling number, (Bo = q/Ghlv)
Dhhydraulic diameter, mm
Gmass flux, kg/(m2·s)
hheat transfer coefficient, kW/(m2·K)
hlvlatent heat, kJ/kg
Hheight, mm
Kcurvature, 1/m
Llength, mm
Lahalf-length of long-side wall, mm
mevaporative mass flux, kg/m2
Mmolecular weight, kg/kmol
NuNusselt number, (Nu = hDh/λ)
qheat flux, kW/m2
Rhydraulic radius, mm
Runiversal gas constant, J/(kmol·K)
ttime, ms
Ttemperature, °C
uvelocity, m/s
Uvelocity, m/s
Wwidth, mm
zaxial location, mm
Greek symbols
αaspect ratio
δliquid film thickness, μm
λthermal conductivity, W/(m·K)
μdynamic viscosity, μPa∙s
ρdensity, kg/m3
τtime, s
χvapor quality
Subscripts
0initial state
along side of rectangular microchannels cross-section
bshort side of rectangular microchannels cross-section
bbubble
ccorner
lliquid
outouter
satsaturation
vvapor
wwall surface

References

  1. Zu, Y.Q.; Yan, Y.Y.; Gedupudi, S.; Karayiannis, T.G.; Kenning, D.B.R. Confined Bubble Growth During Flow Boiling in a Mini-/Micro-Channel of Rectangular Cross-Section Part Ii: Approximate 3-D Numerical Simulation. Int. J. Therm. Sci. 2011, 50, 267–273. [Google Scholar] [CrossRef]
  2. Ferrari, A.; Magnini, M.; Thome, J.R. Numerical Analysis of Slug Flow Boiling in Square Microchannels. Int. J. Heat Mass Transf. 2018, 123, 928–944. [Google Scholar] [CrossRef]
  3. Cheng, L.; Xia, G. Fundamental Issues, Mechanisms and Models of Flow Boiling Heat Transfer in Microscale Channels. Int. J. Heat Mass Transf. 2017, 108, 97–127. [Google Scholar] [CrossRef]
  4. Chennu, R. Numerical Analysis of Compact Plate-Fin Heat Exchangers for Aerospace Applications. Int. J. Numer. Methods Heat Fluid Flow 2018, 28, 395–412. [Google Scholar] [CrossRef]
  5. Careri, F.; Khan, R.H.U.; Todd, C.; Attallah, M.M. Additive Manufacturing of Heat Exchangers in Aerospace Applications: A Review. Appl. Therm. Eng. 2023, 235, 121387. [Google Scholar] [CrossRef]
  6. Karayiannis, T.G.; Mahmoud, M.M. Flow Boiling in Microchannels: Fundamentals and Applications. Appl. Therm. Eng. 2017, 115, 1372–1397. [Google Scholar] [CrossRef]
  7. Tibiriçá, C.B.; Ribatski, G. Flow Boiling in Micro-Scale Channels—Synthesized Literature Review. Int. J. Refrig. 2013, 36, 301–324. [Google Scholar] [CrossRef]
  8. Kandlikar, S.G. Fundamental Issues Related to Flow Boiling in Minichannels and Microchannels. Exp. Therm. Fluid Sci. 2002, 26, 389–407. [Google Scholar] [CrossRef]
  9. Chen, T.; Garimella, S.V. Measurements and High-Speed Visualizations of Flow Boiling of a Dielectric Fluid in a Silicon Microchannel Heat Sink. Int. J. Multiph. Flow 2006, 32, 957–971. [Google Scholar] [CrossRef]
  10. Harirchian, T.; Garimella, S.V. Effects of Channel Dimension, Heat Flux, and Mass Flux on Flow Boiling Regimes in Microchannels. Int. J. Multiph. Flow 2009, 35, 349–362. [Google Scholar] [CrossRef]
  11. Thome, J.R.; Bar-Cohen, A.; Revellin, R.; Zun, I. Unified Mechanistic Multiscale Mapping of Two-Phase Flow Patterns in Microchannels. Exp. Therm. Fluid Sci. 2013, 44, 1–22. [Google Scholar] [CrossRef]
  12. Bao, Z.Y.; Fletcher, D.F.; Haynes, B.S. Flow Boiling Heat Transfer of Freon R11 and Hcfc123 in Narrow Passages. Int. J. Heat Mass Transf. 2000, 42, 3347–3358. [Google Scholar] [CrossRef]
  13. Yu, W.; France, D.M.; Wambsganss, M.W.; Hull, J.R. Two-Phase Pressure Drop, Boiling Heat Transfer, and Critical Heat Flux to Water in a Small-Diameter Horizontal Tube. Int. J. Multiph. Flow 2002, 28, 927–941. [Google Scholar] [CrossRef]
  14. Lee, H.J.; Lee, S.Y. Heat Transfer Correlation for Boiling Flows in Small Rectangular Horizontal Channels with Low Aspect Ratios. Int. J. Multiph. Flow 2001, 27, 2043–2062. [Google Scholar] [CrossRef]
  15. Qu, W.; Mudawar, I. Flow Boiling Heat Transfer in Two-Phase Micro-Channel Heat Sinks––I. Experimental Investigation and Assessment of Correlation Methods. Int. J. Heat Mass Transf. 2003, 46, 2755–2771. [Google Scholar] [CrossRef]
  16. Tran, T.N.; Wambsganss, M.W. Small Circular- and Rectangular-Channel Boiling with Two Refrigerants. Int. J. Multiph. Flow 1996, 22, 485–498. [Google Scholar] [CrossRef]
  17. Yen, T.-H.; Shoji, M.; Takemura, F.; Suzuki, Y.; Kasagi, N. Visualization of Convective Boiling Heat Transfer in Single Microchannels with Different Shaped Cross-Sections. Int. J. Heat Mass Transf. 2006, 49, 3884–3894. [Google Scholar] [CrossRef]
  18. Ali, R.; Palm, B.; Maqbool, M.H. Flow Boiling Heat Transfer of Refrigerants R134a and R245fa in a Horizontal Micro-Channel. Exp. Heat Transf. 2012, 25, 181–196. [Google Scholar] [CrossRef]
  19. Bigham, S.; Moghaddam, S. Microscale Study of Mechanisms of Heat Transfer During Flow Boiling in a Microchannel. Int. J. Heat Mass Transf. 2015, 88, 111–121. [Google Scholar] [CrossRef]
  20. Okajima, J.; Stephan, P. Numerical Simulation of Liquid Film Formation and Its Heat Transfer through Vapor Bubble Expansion in a Microchannel. Int. J. Heat Mass Transf. 2019, 136, 1241–1249. [Google Scholar] [CrossRef]
  21. Mukherjee, A.; Kandlikar, S.G.; Edel, Z.J. Numerical Study of Bubble Growth and Wall Heat Transfer During Flow Boiling in a Microchannel. Int. J. Heat Mass Transf. 2011, 54, 3702–3718. [Google Scholar] [CrossRef]
  22. Jacobi, A.M.; Thome, J.R. Heat Transfer Model for Evaporation of Elongated Bubble Flows in Microchannels. J. Heat Transf. 2002, 124, 1131–1136. [Google Scholar] [CrossRef]
  23. Thome, J.R.; Dupont, V.; Jacobi, A.M. Heat Transfer Model for Evaporation in Microchannels. Part I: Presentation of the Model. Int. J. Heat Mass Transf. 2004, 47, 3375–3385. [Google Scholar] [CrossRef]
  24. Dupont, V.; Thome, J.R.; Jacobi, A.M. Heat Transfer Model for Evaporation in Microchannels. Part Ii: Comparison with the Database. Int. J. Heat Mass Transf. 2004, 47, 3387–3401. [Google Scholar] [CrossRef]
  25. Consolini, L.; Thome, J.R. A Heat Transfer Model for Evaporation of Coalescing Bubbles in Micro-Channel Flow. Int. J. Heat Fluid Flow 2010, 31, 115–125. [Google Scholar] [CrossRef]
  26. Costa-Patry, E.; Thome, J.R. Flow Pattern-Based Flow Boiling Heat Transfer Model for Microchannels. Int. J. Refrig. 2013, 36, 414–420. [Google Scholar] [CrossRef]
  27. Wang, H.; Garimella, S.V.; Murthy, J.Y. Characteristics of an Evaporating Thin Film in a Microchannel. Int. J. Heat Mass Transf. 2007, 50, 3933–3942. [Google Scholar] [CrossRef]
  28. Harirchian, T.; Garimella, S.V. Flow Regime-Based Modeling of Heat Transfer and Pressure Drop in Microchannel Flow Boiling. Int. J. Heat Mass Transf. 2012, 55, 1246–1260. [Google Scholar] [CrossRef]
  29. Wang, G.; Hao, L.; Cheng, P. A Four-Zone Model for Saturated Flow Boiling in a Microchannel of Rectangular Cross-Section. Int. J. Heat Mass Transf. 2010, 53, 3439–3448. [Google Scholar] [CrossRef]
  30. Magnini, M.; Thome, J.R. An Updated Three-Zone Heat Transfer Model for Slug Flow Boiling in Microchannels. Int. J. Multiph. Flow 2017, 91, 296–314. [Google Scholar] [CrossRef]
  31. Jain, S.; Jayaramu, P.; Gedupudi, S. Modeling of Pressure Drop and Heat Transfer for Flow Boiling in a Mini/Micro-Channel of Rectangular Cross-Section. Int. J. Heat Mass Transf. 2019, 140, 1029–1054. [Google Scholar] [CrossRef]
  32. Sun, Y.; Guo, C.; Jiang, Y.; Wang, T.; Zhang, L. Transient Film Thickness and Microscale Heat Transfer During Flow Boiling in Microchannels. Int. J. Heat Mass Transf. 2018, 116, 458–470. [Google Scholar] [CrossRef]
  33. Guo, C.; Tao, J.; Jiang, Y.; Sun, Y.; Wang, T. Measurement and Theoretical Analysis of Transient Liquid Film During Micro-Channel Flow Boiling. Int. J. Multiph. Flow 2020, 130, 103365. [Google Scholar] [CrossRef]
  34. Zhang, P.; Wang, T.; Jiang, Y.; Guo, C. Measurement of Transient Liquid Film and Its Effect on Flow Boiling Heat Transfer in Non-Circular Microchannels. Int. J. Therm. Sci. 2023, 184, 108004. [Google Scholar] [CrossRef]
  35. Shah, R.K.; London, A.L. Laminar Flow Forced Convection in Ducts: A Source Book for Compact Heat Exchanger Analytical Data; Academic Press: New York, NY, USA, 1978; pp. 78–138. [Google Scholar]
  36. Wayner, P.C., Jr. The Effect of Interfacial Mass Transport on Flow in Thin Liquid Films. Colloids Surf. 1991, 52, 71–84. [Google Scholar] [CrossRef]
  37. Bretherton, F.P. The Motion of Long Bubbles in Tubes. J. Fluid Mech. 1961, 5, 166–188. [Google Scholar] [CrossRef]
  38. Aussillous, P.; Quéré, D. Quick Deposition of a Fluid on the Wall of a Tube. Phys. Fluids 2000, 12, 2367–2371. [Google Scholar] [CrossRef]
  39. Zhang, P.; Wang, T.; Jiang, Y.; Yu, C.; Guo, C.; Tan, S. Experimental Study of Initial Liquid Film Thickness in Square Microchannel Two-Phase Flow. Heat Transf. Res. 2022, 53, 51–69. [Google Scholar] [CrossRef]
  40. Hazel, A.L.; Heil, M. The Steady Propagation of a Semi-Infinite Bubble into a Tube of Elliptical or Rectangular Cross-Section. J. Fluid Mech. 2002, 470, 91–114. [Google Scholar] [CrossRef]
  41. Revellin, R.; Thome, J.R. A New Type of Diabatic Flow Pattern Map for Boiling Heat Transfer in Microchannels. J. Micromech. Microeng. 2007, 17, 788–796. [Google Scholar] [CrossRef]
Figure 1. Microchannel flow boiling experimental system.
Aerospace 11 00733 g001
Figure 2. Schematic diagram of the test section and measurement positions. (a) Schematic diagram of the test section, (b) Schematic view of measurement positions.
Aerospace 11 00733 g002
Figure 3. Variation in vapor–liquid distribution in cross-section of a rectangular microchannel.
Aerospace 11 00733 g003
Figure 4. Schematic diagram of flow boiling model in rectangular microchannels.
Aerospace 11 00733 g004
Figure 5. Schematic diagram of one-dimensional model of microchannel flow boiling.
Aerospace 11 00733 g005
Figure 6. Vapor–liquid distribution in the elongated bubble zone.
Aerospace 11 00733 g006
Figure 7. Schematic diagram of corner meniscus in the elongated bubble zone.
Aerospace 11 00733 g007
Figure 8. Vapor–liquid distribution in the long-side wall dryout zone.
Aerospace 11 00733 g008
Figure 9. Schematic diagram of corner meniscus in the long-side wall dryout zone.
Aerospace 11 00733 g009
Figure 10. Vapor–liquid distribution in the corner meniscus evaporation zone.
Aerospace 11 00733 g010
Figure 11. Variation in bubble formation period with heat flux in microchannel flow boiling.
Aerospace 11 00733 g011
Figure 12. Variation in vapor–liquid duration ratio with heat flux in microchannel flow boiling.
Aerospace 11 00733 g012
Figure 13. Local time-averaged heat transfer coefficient of 0.7 mm square microchannel.
Aerospace 11 00733 g013
Figure 14. Local time-averaged heat transfer coefficient of rectangular microchannel.
Aerospace 11 00733 g014
Figure 15. Variation in time-averaged heat transfer coefficient during flow boiling in rectangular microchannels.
Aerospace 11 00733 g015
Figure 16. Variation in time-averaged heat transfer coefficient during flow boiling in a square microchannel.
Aerospace 11 00733 g016
Figure 17. Variation in spatially average heat transfer coefficient of the rectangular microchannel with time.
Aerospace 11 00733 g017
Figure 18. Variation in average heat transfer coefficient in different regions of a rectangular microchannel cross-section. (a) in the elongated bubble zone, (b) in the long-side wall dryout zone, (c) in the corner liquid evaporation zone.
Aerospace 11 00733 g018
Figure 19. Variation in liquid film thickness of the elongated bubble zone. (a) in the meniscus region on the short-side wall, (b) in the meniscus region on the long-side wall, (c) in the center of the long-side wall.
Aerospace 11 00733 g019
Figure 20. Variation in wall temperature and vapor–liquid interface temperature of the elongated bubble zone. (a) in the meniscus region on the short-side wall, (b) in the meniscus region on the long-side wall, (c) in the center of the long-side wall.
Aerospace 11 00733 g020
Figure 21. Variation in heat transfer coefficient of the elongated bubble zone. (a) in the meniscus region on the short-side wall, (b) in the meniscus region on the long-side wall, (c) in the center of the long-side wall.
Aerospace 11 00733 g021
Figure 22. Variation in liquid film thickness of the long-side wall dryout zone. (a) in the center of the short-side wall, (b) in the meniscus region on the short-side wall, (c) in the meniscus region on the long-side wall.
Aerospace 11 00733 g022
Figure 23. Variation in wall temperature, vapor–liquid interface temperature, and heat transfer coefficient of the long-side wall dryout zone. (a) temperature variation in the meniscus region on the short-side wall, (b) temperature variation in the meniscus region on the long-side wall, (c) heat transfer variation in the meniscus region on the short-side wall, (d) heat transfer variation in the meniscus region on the long-side wall.
Aerospace 11 00733 g023
Figure 24. Variation in meniscus radius, wall temperature, and vapor–liquid interface temperature of the corner meniscus evaporation zone. (a) the meniscus radius variation, (b) temperature variation in the meniscus region.
Aerospace 11 00733 g024
Figure 25. Variation in average heat transfer coefficient of rectangular microchannels with different aspect ratios. (a) in the elongated bubble zone, (b) in the long-side wall dryout zone, (c) in the corner liquid evaporation zone.
Aerospace 11 00733 g025
Figure 26. Variation in average heat transfer coefficient in rectangular microchannels with different hydraulic diameters. (a) in the elongated bubble zone, (b) in the long-side wall dryout zone, (c) in the corner liquid evaporation zone.
Aerospace 11 00733 g026
Figure 27. Variation in average heat transfer coefficient in rectangular microchannels with different widths. (a) in the elongated bubble zone, (b) in the long-side wall dryout zone, (c) in the corner liquid evaporation zone.
Aerospace 11 00733 g027
Figure 28. Variation in average heat transfer coefficient with time at different measurement points. (a) in the elongated bubble zone, (b) in the long-side wall dryout zone, (c) in the corner liquid evaporation zone.
Aerospace 11 00733 g028
Figure 29. Variation in average heat transfer coefficient with time under different mass fluxes. (a) in the elongated bubble zone, (b) in the long-side wall dryout zone, (c) in the corner liquid evapo-ration zone.
Aerospace 11 00733 g029
Figure 30. Variation in average heat transfer coefficient with time under different heat fluxes. (a) in the elongated bubble zone, (b) in the long-side wall dryout zone, (c) in the corner liquid evaporation zone.
Aerospace 11 00733 g030
Disclaimer/Publisher’s Note: The statements, opinions and data contained in all publications are solely those of the individual author(s) and contributor(s) and not of MDPI and/or the editor(s). MDPI and/or the editor(s) disclaim responsibility for any injury to people or property resulting from any ideas, methods, instructions or products referred to in the content.

