
Mixed-Flow Turbofan Engine Model for the Conceptual Design of Sustainable Supersonic Airplanes

 ,
,  , and
, and 
Abstract
:1. Introduction
2. Overall Design Methodology
3. Rapid Aircraft Prototyping Tool: ASTRID-H 2.0
4. Propulsion System Modeling
- The flow is, on average, steady and one dimensional.
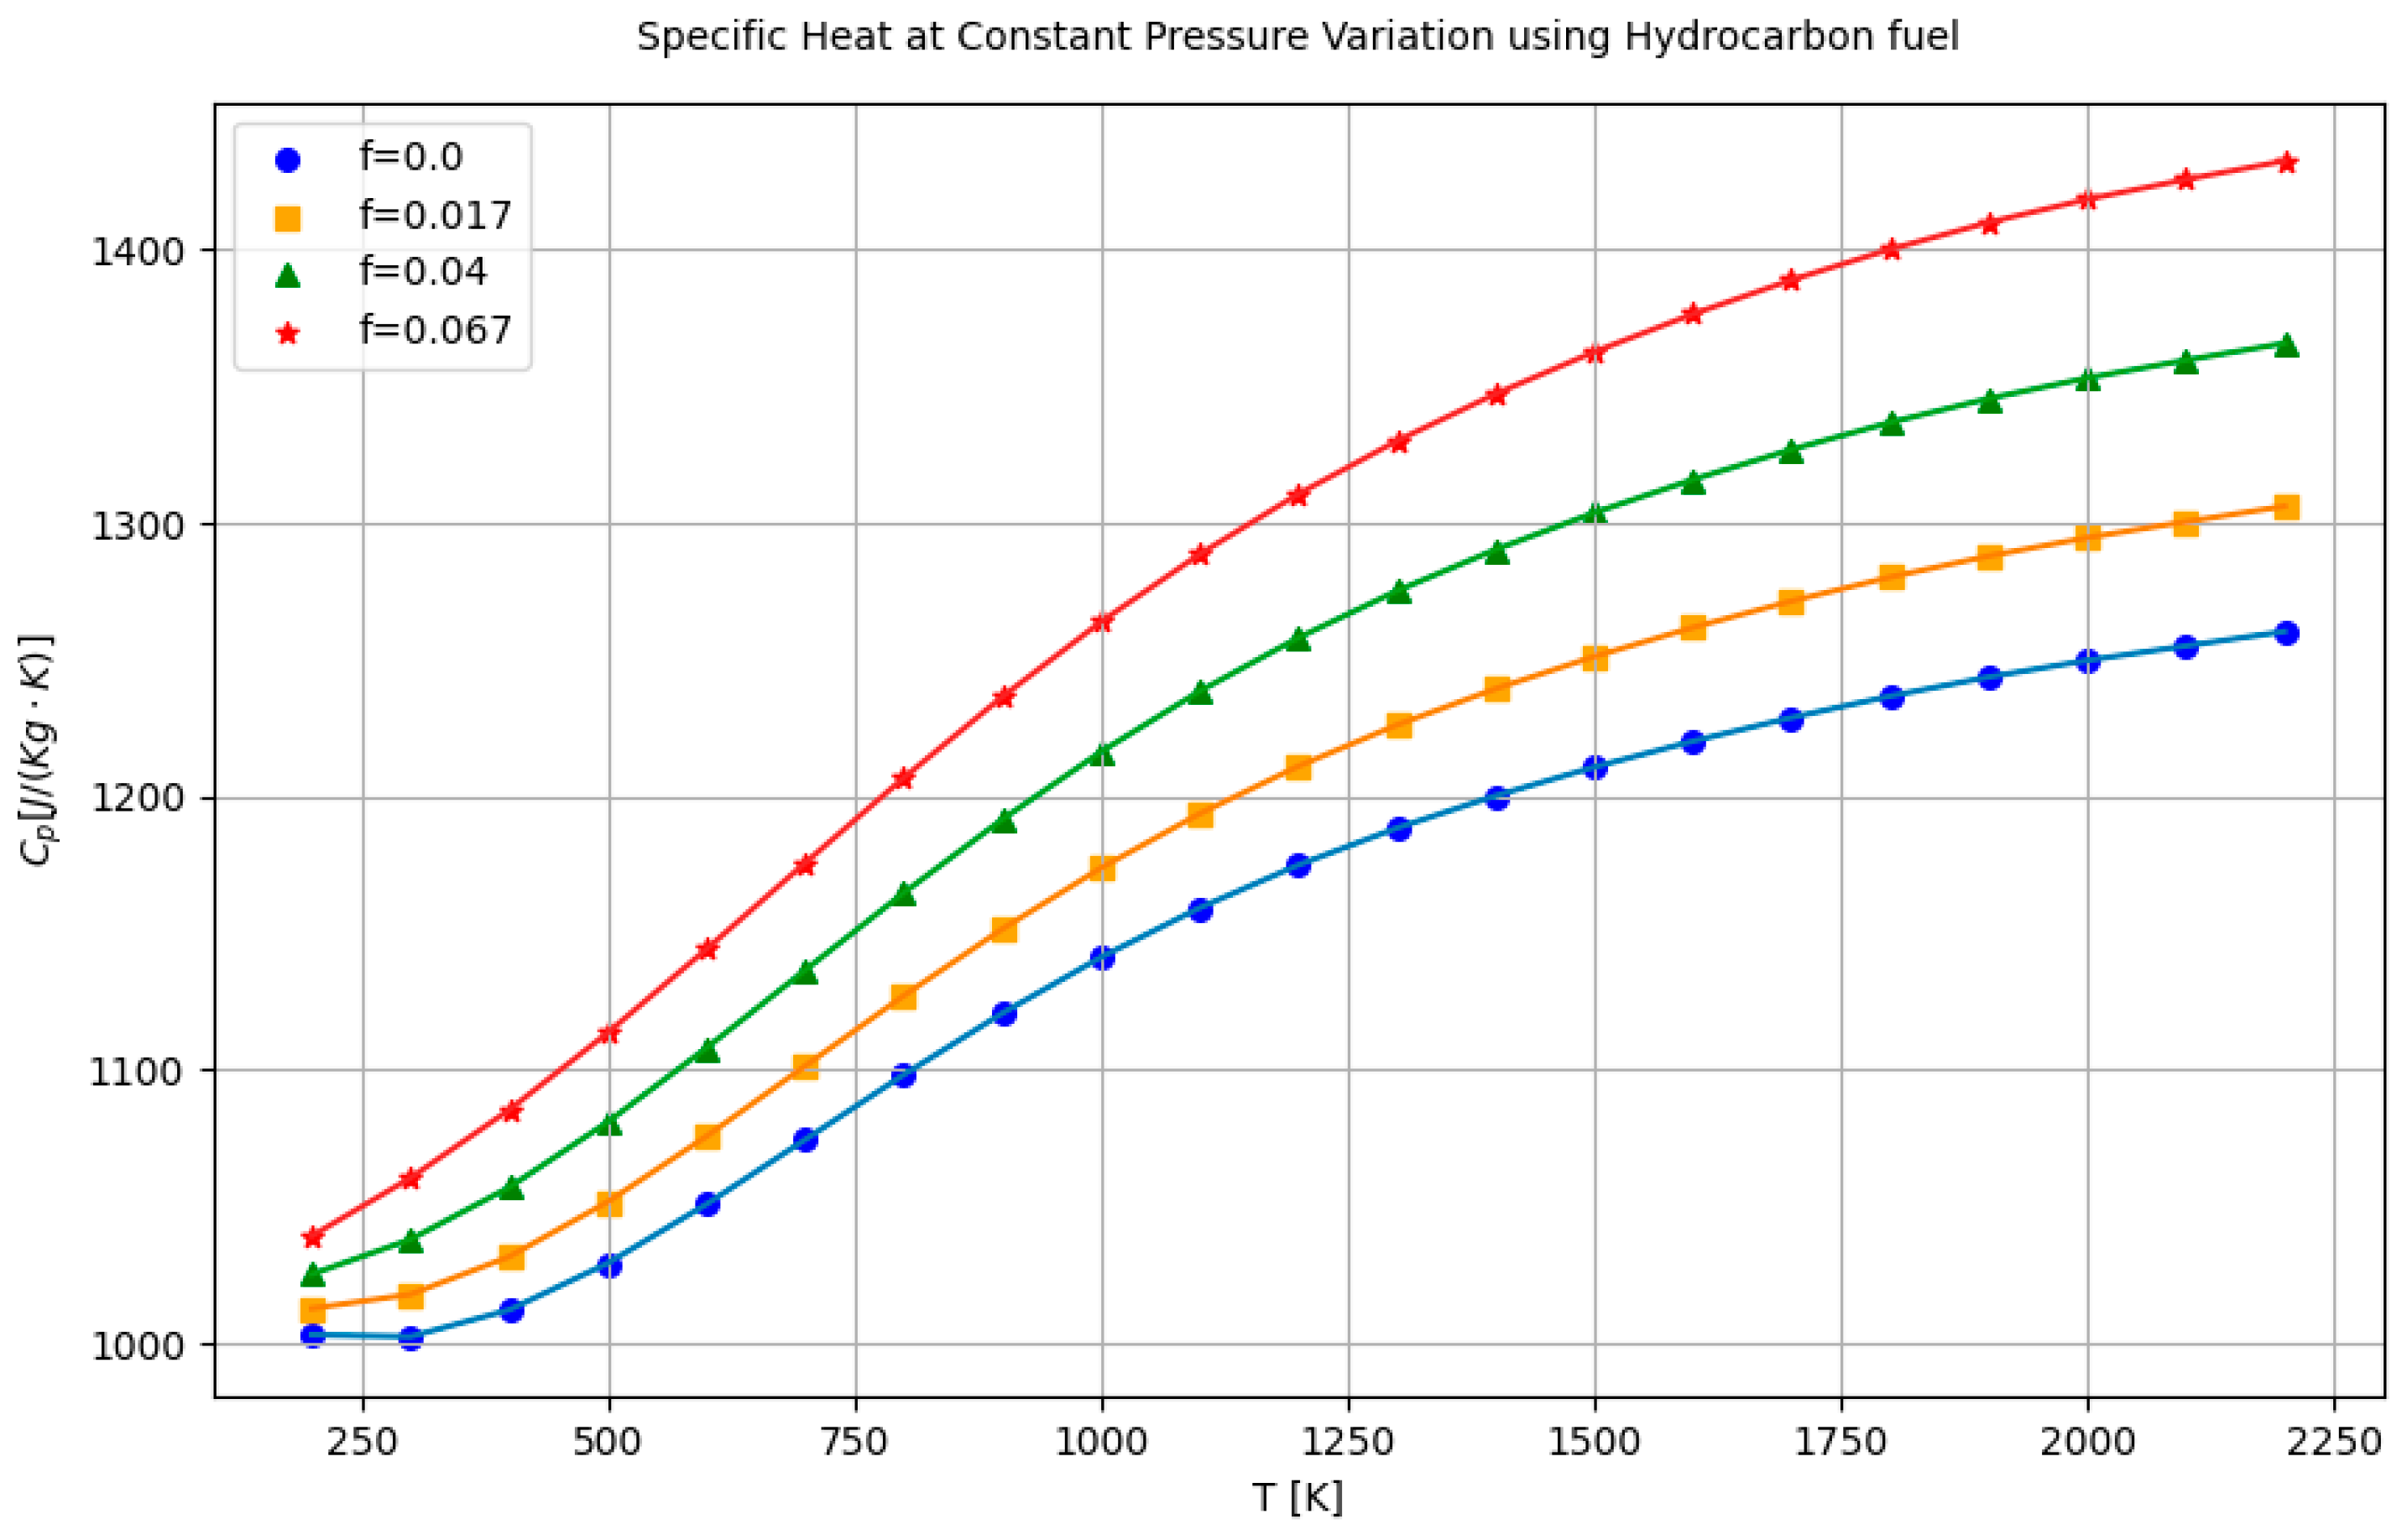
- The working fluid is modeled as a “half-ideal gas” using Variable Specific Heat (VSH).
- A reference fuel, (JP-4), is adopted.
- The inlet is modeled according to MIL-E-5008B.
- Both turbines provide power to the installed accessories.
- The turbine is cooled by air fractions bled from the high-pressure compressor.
- The constant area mixer is adopted.
- The flow areas are constant at stations 4, 4.5, 6, 16, and 6A.
- The exit area of the nozzle () is adjustable to maintain the exit pressure ratio of the exhaust equal to the external one () or to a selected ratio .
- The area of station 8 remains constant at its reference value.
- The map scaling procedure is adopted.
4.1. Gas Model: Variable Specific Heat (VSH)
- : the universal gas constant of the mixture;
- : the constant pressure specific heat of the mixture;
- : the ratio of the constant specific heat at constant pressure over the constant specific heat at constant volume of the mixture;
- : the speed of sound of the mixture;
- : the temperature of the mixture (if unknown);
- : the enthalpy of the mixture (if unknown);
- : the entropy function;
- : the entropy of the mixture;
- : the reduced pressure of the mixture (if unknown).
4.2. Parametric Analysis
4.3. Emissions Modeling
5. Case Study: Mach 1.5
5.1. On-Design Analysis
5.2. Off-Design Analysis
5.3. Validation
6. Mission Simulation
Emission Estimation
7. Conclusions and Future Work
Author Contributions
Funding
Data Availability Statement
Acknowledgments
Conflicts of Interest
Abbreviations
| ASTRID | Aircraft on-board Systems sizing and TRade-off analysis in Initial Design |
| BFFM2 | Boeing Fuel Flow Method 2 |
| BPR | By-Pass Ratio |
| EICO | Emission Index of Carbon Monoxide |
| EIHC | Emission Index of Hydrocarbons |
| EINOx | Emission Index of Nitrogen Oxides |
| ESATTO | Environmentally Sustainable AircrafT Trajectory and Operations |
| GSP | Gas turbine Simulation Program |
| ICAO | International Civil Aviation Organization |
| IFV | Inverting Flow Valve |
| MORE&LESS | MDO and REgulations for Low-boom and Environmentally Sustainable Supersonic aviation |
| LTO | Landing and Take-Off |
| MTOW | Maximum Take-Off Weight |
| NASA | National Aeronautics and Space Administration |
| NLR | Netherlands Laboratory Research |
| NPSS | Numerical Propulsion System Simulation |
| OEW | Operative Empty Weight |
| OPR | Overall Pressure Ratio |
| TBE | Turbine Bypass Engine |
| TIT | Turbine Inlet Temperature |
| VCE | Variable Cycle Engine |
| VSH | Variable Specific Heat |
| Symbols | |
| Area | |
| Specific heat at constant pressure | |
| Polytropic efficiency | |
| Uninstalled thrust | |
| Fuel-to-air ratio | |
| Static enthalpy | |
| Fuel heating value | |
| Mach number | |
| Mass Flow rate Parameter | |
| Mass flow rate | |
| Pressure | |
| Power at take-off | |
| Reduced pressure | |
| Gas constant | |
| Uninstalled thrust specific fuel consumption | |
| Temperature or installed thrust | |
| Total (or stagnation) temperature | |
| Installed Thrust Specific Fuel Consumption | |
| Thrust-to-weight ratio | |
| Velocity | |
| Wing loading | |
| Bypass ratio | |
| Mixer bypass ratio | |
| Bleed air fraction | |
| Ratio of specific heats | |
| Cooling air #1 mass flow rate | |
| Cooling air #2 mass flow rate | |
| Efficiency | |
| Total pressure ratio | |
| Total temperature ratio | |
| Entropy function | |
| Subscripts | |
| Air | |
| Burner | |
| Compressor | |
| High-pressure compressor | |
| Low-pressure compressor | |
| Fan | |
| Mixer | |
| Maximum | |
| Mechanical, high-pressure spool | |
| Mechanical, low-pressure spool | |
| Nozzle | |
| Products | |
| Sea level | |
| High-pressure turbine | |
| Low-pressure turbine | |
References
- Laurence, K.L.J. Toward a Second-Generation Supersonic Transport. J. Aircr. 1974, 11, 3–9. [Google Scholar]
- Candel, S. Concorde and the Future of Supersonic Transport. J. Propuls. Power 2004, 20, 59–68. [Google Scholar] [CrossRef]
- Commercial Supersonic Technology Project. Available online: https://www.nasa.gov/directorates/armd/aavp/cst/ (accessed on 2 August 2024).
- Honda, M.; Yoshida, K. D-SEND Project for Low Sonic Boom Design Technology. In Proceedings of the 28th Congress of the International Council of Aeronautical Sciences, Brisbane, Australia, 23–28 September 2012. [Google Scholar]
- Yoshida, K. Supersonic drag reduction technology in the scaled supersonic experimental airplane project by JAXA. Prog. Aerosp. Sci. 2009, 45, 124–146. [Google Scholar] [CrossRef]
- MDO and REgulations for Low-Boom and Environmentally Sustainable Supersonic Aviation. 2024. Available online: https://cordis.europa.eu/project/id/101006856/results (accessed on 2 August 2024).
- SENECA—(LTO) noiSe and EmissioNs of supErsoniC Aircraft. Available online: https://seneca-project.eu/ (accessed on 2 August 2024).
- Hardeman, A.B.; Maurice, L.Q. Sustainability: Key to enable next generation supersonic passenger flight. IOP Conf. Ser. Mater. Sci. Eng. 2020, 1024, 012053. [Google Scholar] [CrossRef]
- Welge, R.H.; Nelson, C.; Bonet, J. Supersonic Vehicle Systems for the 2020 to 2035 Timeframe. In Proceedings of the 28th AIAA Applied Aerodynamics Conference, Chicago, IL, USA, 28 June–1 July 2010. [Google Scholar]
- Villena Munoz, C.; Giordana, B.; Lawson, C.; Riaz, A. Conceptual Design of a Next Generation Supersonic Airliner for Low Noise and Emissions. In Proceedings of the AIAA SciTech Forum 2023, National Harbor, MD, USA, 23–27 January 2023. [Google Scholar]
- Berton, J.; Huff, D.; Geiselhart, A.; Seidel, J. Supersonic Technology Concept Aeroplanes for Environmental Studies. In Proceedings of the AIAA SciTech Forum 2020, Orlando, FL, USA, 6–10 January 2020. [Google Scholar]
- Mercure, R.A. Propulsion System Considerations for Future Supersonic Transports: A Global Perspective; ASME: New York, NY, USA, 1996; p. 18. [Google Scholar]
- Strack, W.C.; Morris, S.J. The challenges and opportunities of supersonic transport propulsion technology. In Proceedings of the 24th Joint Propulsion Conference cosponsored by the AIAA, ASME, SAE, and ASEE, Boston, MA, USA, 11–13 July 1988. [Google Scholar]
- Szeliga, R.; Allan, R.D. Advanced Supersonic Technology Propulsion System Study—Final Report; NASA Lewis Research Centre: Cleveland, OH, USA, 1974. [Google Scholar]
- Brear, M.J.; Kerrebrock, J.L.; Epstein, A.H. Propulsion System Requirements for Long Range, Supersonic Aircraft. ASME J. Fluids Eng. 2005, 128, 370–377. [Google Scholar] [CrossRef]
- Rettie, I.H.; Lewis, W.G.E. Design and Development of an Air Intake for a Supersonic Transport Aircraft. J. Aircr. 1968, 5, 513–521. [Google Scholar] [CrossRef]
- Sitt, L.E. Exhaust Nozzles for Propulsion Systems with Emphasis on Supersonic Cruise Aircraft; NASA Lewis Research Centre: Cleveland, OH, USA, 1990. [Google Scholar]
- Zainul, H.; Praseyto, E. Materials selection in design of structures and engines of supersonic aircrafts: A review. Mater. Des. 2013, 46, 552–560. [Google Scholar]
- Papamoschou, D.; Debiasi, M. Conceptual Development of Quiet Turbofan Engines. J. Propuls. Power 2003, 19, 161–169. [Google Scholar] [CrossRef]
- Speth, R.L.; Eastham, S.D.; Fritz, T.M.; Sanz-Morére, I.; Agarwal, A.; Prashanth, P.; Allroggen, F.; Barrett, S.R.H. Global Environmental Impact of Supersonic Cruise Aircraft in the Stratosphere; NASA Glenn Research Centre: Cleveland, OH, USA, 2021. [Google Scholar]
- Phillips, B.D.; Health, C.M.; Schmidt, J. System-Level Impact of Propulsive Uncertainties for Low-Boom. In Proceedings of the AIAA AVIATION Forum 2020, Virtual event, 15–19 June 2020. [Google Scholar]
- Schuermann, M.; Gaffuri, M.; Horst, P. Multidisciplinary pre-design of supersonic aircraft. CEAS Aeronaut. J. 2014, 6, 207–216. [Google Scholar] [CrossRef]
- Villena Munoz, C.; Lawson, C.; Riaz, A.; Jaron, R. Conceptual Design of Supersonic Aircraft to Investigate Environmental Impact. In Proceedings of the AIAA Scitech 2024 Forum, Orlando, FL, USA, 8–12 January 2024. [Google Scholar]
- Lytle, J.K. The Numerical Propulsion System Simulation: An Overview; NASA Glenn Research Centre: Cleveland, OH, USA, 2000. [Google Scholar]
- Nordqvist, M.; Kareliusson, J.; da Silva, E.R.; Kyprianidis, K.G. Conceptual Design of a Turbofan Engine for a Supersonic Business Jet. In Proceedings of the International Society of Air-Breathing Engines (ISABE), Manchester, UK, 3–8 September 2017. [Google Scholar]
- PROOSIS—Propulsion Object-Oriented Simulation Software. Available online: https://www.ecosimpro.com/products/proosis/ (accessed on 2 August 2024).
- Gas Turb. Available online: https://www.gasturb.com/ (accessed on 2 August 2024).
- Softly—Gas Turbine Simulation Program (GSP 12). Available online: https://usoftly.ir/product/gas-turbine-simulation-program/ (accessed on 2 August 2024).
- DuBois, D.; Paynter, G.C. Fuel Flow Method2 for Estimating Aircraft Emissions. SAE 2006 Trans. J. Aerosp. 2006, 115, 1–14. [Google Scholar]
- Fusaro, R.; Viola, N.; Galassini, D. Sustainable Supersonic Fuel Flow Method: An Evolution of the Boeing Fuel Flow Method for Supersonic Aircraft Using Sustainable Aviation Fuels. Aerospace 2021, 8, 331. [Google Scholar] [CrossRef]
- Sun, Y.; Smith, H. Review and prospect of supersonic business jet design. Prog. Aerosp. Sci. 2017, 90, 12–38. [Google Scholar] [CrossRef]
- Henne, P.A. Case for Small Supersonic Civil Aircraft. J. Aircr. 2005, 42, 765–774. [Google Scholar] [CrossRef]
- Dovi, A.R.; Wrenn, G.A.; Barthelemy, J.F.M.; Coen, P.G.; Hall, L.E. Multidisciplinary design integration methodology for a supersonic transport aircraft. J. Aircr. 1995, 32, 290–296. [Google Scholar] [CrossRef]
- Li, W.; Shields, E.; Geiselhart, K. A Mixed-Fidelity Approach for Design of Low-Boom Supersonic Aircraft. J. Aircarft 2011, 48, 1131–1135. [Google Scholar] [CrossRef]
- Roncioni, P.; Marini, M.; Gori, O.; Fusaro, R.; Viola, N. Aerodatabase Development and Integration and Mission Analysis of a Mach 2 Supersonic Civil Aircraft. Aerospace 2024, 11, 111. [Google Scholar] [CrossRef]
- Chandrasekaran, N.; Guha, A. Study of Prediction Methods for NOx Emission from Turbofan Engines. J. Propuls. Power 2012, 28, 170–180. [Google Scholar] [CrossRef]
- Viola, N.; Fusaro, R.; Saccone, G.; Borio, V. Analytical Formulations for Nitrogen Oxides Emissions Estimation of an Air Turbo-Rocket Engine Using Hydrogen. Aerospace 2023, 10, 909. [Google Scholar] [CrossRef]
- Fusaro, R.; Saccone, G.; Viola, N. NOx emissions estimation methodology for air-breathing reusable access to space vehicle in conceptual design. Acta Astronaut. 2024, 216, 304–317. [Google Scholar] [CrossRef]
- Ferretto, D.; Fusaro, R.; Viola, N. A conceptual design tool to support high-speed vehicle design. In Proceedings of the AIAA Aviation 2020 Forum, Virtual event, 15–19 June 2020. [Google Scholar]
- Raymer, D.P. Aircraft Design: A Concpetual Approach; AIAA Education Series; AIAA: Reston, VA, USA, 2018. [Google Scholar]
- Arif, I.; Masud, J.; Javed, A.; Toor, Z.G.; Hassan Raza Shah, S. Analytical Modelling and Validation of a Turbofan Engine at Design Conditions. In Proceedings of the AIAA Scitech 2019 Forum, San Diego, CA, USA, 7–11 January 2019. [Google Scholar]
- Schlette, T.; Staudacher, S. Preliminary Design and Analysis of Supersonic Business Jet Engines. Aerospace 2022, 9, 493. [Google Scholar] [CrossRef]
- Becker, R.; Reitenbach, S.; Klein, C.; Otten, T.; Nauroz, M.; Siggel, M. An Integrated Method for Propulsion System Conceptual Design. In Proceedings of the ASME Turbo Expo 2015: Turbine Technical Conference and Exposition, Montreal, QC, Canada, 15–19 June 2015. [Google Scholar]
- Häßy, J.; Schmeink, J. Knowledge-based Concpetual Design Methods for Geometry and Mass Estimation of Rubber Aero-engines. In Proceedings of the International Council of the Aeronautical Sciences (ICAS), Stockholm, Sweden, 4–9 September 2022. [Google Scholar]
- Hutchinson, R.; Lawrence, J.; Joiner, K.F. Conceptual design and integration of a propulsion system for a supersonic transport aircraft. Proc. Inst. Mech. Eng. Part G J. Aerosp. Eng. 2022, 236, 583–592. [Google Scholar] [CrossRef]
- Berton, J.J.; Haller, W.J.; Senick, P.F.; Scott, J.M.; Seidel, J.A. A Comparative Propulsion System Analysis for the High-Speed Civil Transport; NASA/TM—2005-213414; Glenn Research Center: Cleveland, OH, USA, 1995. [Google Scholar]
- Mattingly, J.D. Aircraft Engine Design; AIAA Educational Series; AIAA: Reston, VA, USA, USA, 2002. [Google Scholar]
- Mattingly, J.D.; Heiser, W. Performance Estimation of the Mixed Flow, Afterburning, Cooled, Two-Spool Turbofan Engine with Bleed and Power Extraction. In Proceedings of the AIAA/ASME/SAE/ASEE 22nd Joint Propulsionn Conference, Hunsville, Australia, 16–18 June 1986. [Google Scholar]
- Qian, R.; Benwei, L.; Hanqiang, S.; Qing, D.; Wang, Y. Aerodynamic Thermodynamic Modeling and Simulation of Turbofan Engine. IOP Conf. Ser. Mater. Sci. Eng. 2019, 685, 012024. [Google Scholar] [CrossRef]
- Fawke, A.J.; Saravanamuttoo, H.I.H. Digital computer simulation of the dynamic response of a twin-spool turbofan with mixed exhausts. Aeronaut. J. 1968, 77, 471–478. [Google Scholar] [CrossRef]
- Stiuso, G. Tecnica di Simulazione Numerica delle Prestazioni Stazionarie e Transitorie di Turbomotori. Master’s, Politecnico di Torino, Torino, Italy, 2019. [Google Scholar]
- Nada, T. Performance characterization of different configurations of gas turbine engines. Propuls. Power Res. 2014, 3, 121–132. [Google Scholar] [CrossRef]
- Gordon, S.; McBride, B.J. Computer Program for Calculation of Complex Chemical Equilibrium Compositions and Applications; NASA Reference Publication 1311; NASA Lewis Research Center: Cleveland, OH, USA, 1994. [Google Scholar]
- NASA. CEARUN. Available online: https://cearun.grc.nasa.gov/ (accessed on 2 August 2024).
- Mattingly, J.D. Elements of Gas Turbine; Tata McGraw-Hill: New York, NY, USA, 2007. [Google Scholar]
- Zhao, W.; Huang, C.; Zhao, Q.; Ma, Y.; Xu, J. Performance analysis of a pre-cooled and fuel-rich pre-burned mixed-flow turbofan cycle for high speed vehicles. Energy 2018, 154, 96–109. [Google Scholar] [CrossRef]
- Koff, B.L.; Koff, S.G. Engine design and challenges for the high Mach transport. In Proceedings of the 43rd AIAA/ASME/SAE/ASEE Joint Propulsion Conference & Exhibit, Cincinnati, OH, USA, 8–11 July 2007. [Google Scholar]
- Dinc, A. NOx emissions of turbofan powered unmanned aerial vehicle for complete flight cycle. Chin. J. Aeronaut. 2020, 33, 1683–1691. [Google Scholar] [CrossRef]
- Wang, Y.; Yin, H.; Zhang, S.; Yu, X. Multi-objective optimization of aircraft design for emission and cost reductions. Chin. J. Aeronaut. 2014, 27, 52–58. [Google Scholar] [CrossRef]
- ICAO Aircraft Engine Emissions Databank. Available online: https://www.easa.europa.eu/en/domains/environment/icao-aircraft-engine-emissions-databank#:~:text=The%20ICAO%20Aircraft%20Engine%20Emissions,according%20to%20their%20national%20regulations (accessed on 7 August 2024).
- NASA. Quiet Supersonic Technology (QueSST) Mission. Available online: https://www.nasa.gov/mission/quesst/ (accessed on 2 August 2024).
- Kishi, Y.; Yashiro, R.; Kanazaki, M. Low-Boom Design for Supersonic Transport with Canard and Forward-Swept Wings Using Equivalent Area Design Method. Aerospace 2023, 10, 717. [Google Scholar] [CrossRef]
- Piccionello, F. Modeling of Propulsion Systems for Supersonic Civil Aircraft. Master’s Thesis, Politecnico di Torino, Torino, Italy, 2023. [Google Scholar]
- Richiardi, G.; Graziani, S.; Gori, O.; Viola, N. Low-boom supersonic business jet: Aerodynamic analysis and mission simulation towards a CO2 emission standard. In Proceedings of the Aeronautics and Astronautics—AIDAA XXVII International Congress in Materials Research Proceedings, Padova, Italy, 4–7 September 2023. [Google Scholar]
- ASTOS Solutions. Available online: https://www.astos.de/products/astos (accessed on 2 August 2024).


| Engine Station Numbering | |
|---|---|
| 0 | Fan upstream or freestream |
| 1 | Inlet or diffuser entry |
| 2 | Inlet or diffuser exit, fan entry, low-pressure compressor entry |
| 13 | Fan exit |
| 2.5 | Low-pressure compressor exit, high-pressure compressor entry |
| 3 | High-pressure compressor exit |
| 3.1 | Burner entry |
| 4 | Burner exit |
| 4.1 | Nozzle vane entry Coolant mixer 1 entry High-pressure turbine entry |
| 4.4 | High-pressure turbine exit Modeled coolant mixer entry |
| 4.5 | Coolant mixer 2 exit Low-pressure turbine entry |
| 5 | Low-pressure turbine exit |
| 6 | Core stream mixer entry |
| 16 | Fan bypass stream mixer entry |
| 6A | Mixer entry Afterburner entry |
| 7 | Afterburner exit Exhaust nozzle entry |
| 8 | Exhaust nozzle throat |
| 9 | Exhaust nozzle exit |
| Air Alone | Fuels | |
|---|---|---|
| A0 | ||
| A1 | ||
| A2 | ||
| A3 | ||
| A4 | ||
| A5 | ||
| A6 | ||
| A7 | ||
| [Btu/lbm] | ||
| [Btu/(lbm °R)] |
| Parametric Cycle Analysis (Input Variables) | |
|---|---|
| Flight parameters | |
| Gas properties | |
| Fuel heating value | |
| Components (pressure ratios, efficiencies) | |
| Design choices | |
| Parametric Cycle Analysis Inputs | ||
|---|---|---|
| Parameter | Symbol | Value |
| Inlet pressure ratio | 0.995 | |
| Burner pressure ratio | 0.96 | |
| Nozzle pressure ratio | 0.98 | |
| Mixer pressure ratio | 0.96 | |
| Burner efficiency | 0.995 | |
| Mechanical efficiency LP spool | 0.99 | |
| Mechanical efficiency HP spool | 0.99 | |
| Fan polytropic efficiency | 0.89 | |
| LP compressor polytropic efficiency | 0.9 | |
| HP compressor polytropic efficiency | 0.9 | |
| HP turbine polytropic efficiency | 0.89 | |
| LP turbine polytropic efficiency | 0.89 | |
| Max turbine inlet temperature (TIT) | 2000 K | |
| Afterburner exit temperature | 2200 K | |
| Pressure ratio at nozzle exit | 1.00 | |
| Mixer inlet Mach number | 0.5 | |
| Fuel heating value | 43.260 MJ/Kg | |
| Aircraft High-Level Requirements | |
|---|---|
| Parameter | Value |
| Payload | 1320 kg |
| Mach @cruise | 1.5 |
| Range | km |
| Sonic boom | |
| Fuel | Biofuel |
| Design Data | |
|---|---|
| Parameter | Value |
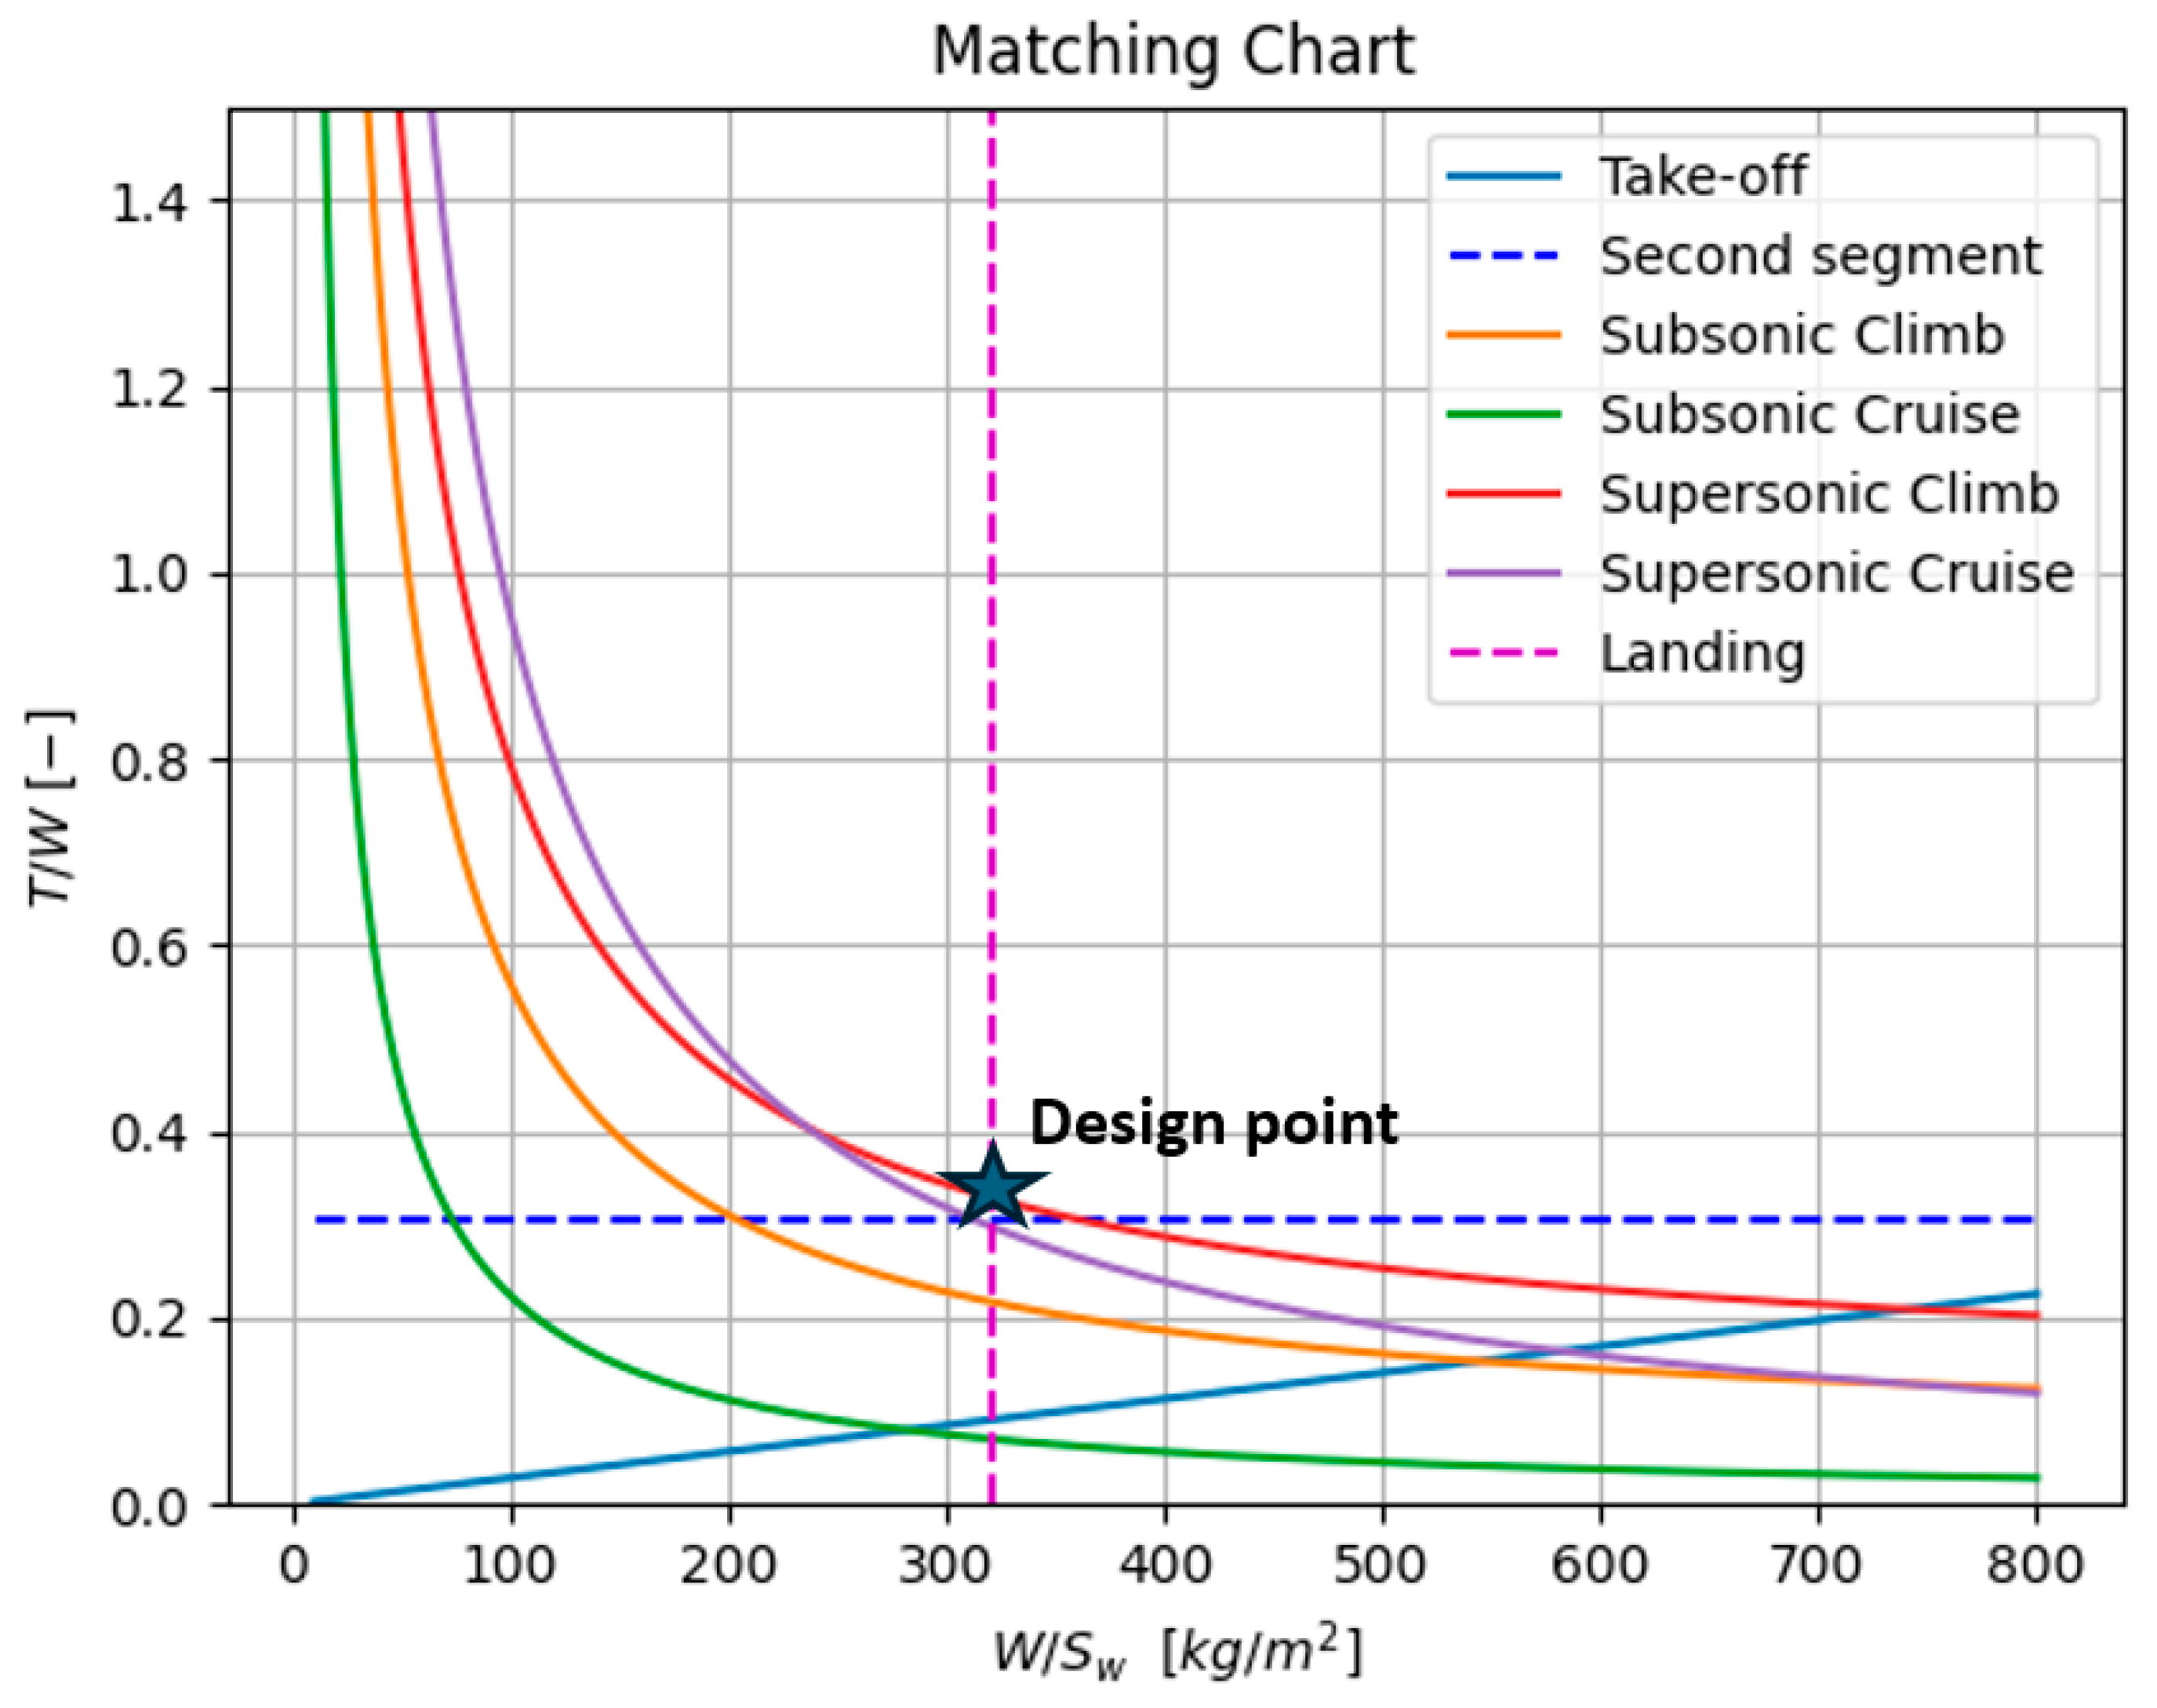
| T/W | 0.32 |
| W/Sw | 320 kg/ |
| MTOW | 39,283 kg |
| OEW | 19,048 kg |
| Sw | 112 |
| Length | 44 m |
| Wingspan | 14 m |
| Propulsion System Requirements | |
|---|---|
| Parameter | Value |
| Number of engines | 2 |
| Inlet diameter | 1.10 m |
| Mach @on-design | 1.5 |
| Altitude @on-design | 16 km |
| Required Thrust @on-design | 62 kN |
| On-Design Results | ||
|---|---|---|
| Parameter | Symbol | Value |
| Compressor pressure ratio | 30 | |
| Fan pressure ratio | 4.5 | |
| LP compressor ratio | 5 | |
| HP compressor ratio | 6 | |
| By-Pass Ratio (BPR) | 0.7 | |
| Turbine Inlet Temperature (TIT) | 2000 K | |
| Air mass flow rate | 82 kg/s | |
| Core mixer Mach number | 0.5 | |
| Fuel heating value | 43.260 MJ/kg | |
| Cooling fractions | 6.38% | |
| Power extraction | 240 kW | |
| Uninstalled thrust | 68 kN | |
| Specific fuel consumption | 25.2 mg/Ns | |
| Parameter | GSP 11 | Engine Model | Absolute Error | Relative Error |
|---|---|---|---|---|
| Thrust | 11.48 | 11.54 | 0.06 | 0.52% |
| TSFC | 0.0538 | 0.0541 | 0.0003 | 0.51% |
| Fuel flow | 0.0172 | 0.0174 | 0.002 | 1.01% |
| Mixer exit area | 0.200 | 0.198 | 0.002 | 1.00% |
Disclaimer/Publisher’s Note: The statements, opinions and data contained in all publications are solely those of the individual author(s) and contributor(s) and not of MDPI and/or the editor(s). MDPI and/or the editor(s) disclaim responsibility for any injury to people or property resulting from any ideas, methods, instructions or products referred to in the content. |
© 2024 by the authors. Licensee MDPI, Basel, Switzerland. This article is an open access article distributed under the terms and conditions of the Creative Commons Attribution (CC BY) license (https://creativecommons.org/licenses/by/4.0/).
Share and Cite
Piccirillo, G.; Gregorio, A.; Fusaro, R.; Ferretto, D.; Viola, N. Mixed-Flow Turbofan Engine Model for the Conceptual Design of Sustainable Supersonic Airplanes. Aerospace 2024, 11, 740. https://doi.org/10.3390/aerospace11090740
Piccirillo G, Gregorio A, Fusaro R, Ferretto D, Viola N. Mixed-Flow Turbofan Engine Model for the Conceptual Design of Sustainable Supersonic Airplanes. Aerospace. 2024; 11(9):740. https://doi.org/10.3390/aerospace11090740
Chicago/Turabian StylePiccirillo, Grazia, Antonio Gregorio, Roberta Fusaro, Davide Ferretto, and Nicole Viola. 2024. "Mixed-Flow Turbofan Engine Model for the Conceptual Design of Sustainable Supersonic Airplanes" Aerospace 11, no. 9: 740. https://doi.org/10.3390/aerospace11090740