Abstract
High gravity (high-g) combustion can significantly increase flame propagation speed, thereby potentially shortening the axial length of aero-engines and increasing their thrust-to-weight ratio. In this study, we utilized the large eddy simulation model to investigate the combustion characteristics and flame morphology evolution of premixed propane–air flames in a channel with a backward-facing step. The study reveals that both the increase in centrifugal force and flow velocity can enhance pressure fluctuations during combustion and increase the turbulence intensity. The presence of centrifugal force promotes the occurrence of Rayleigh–Taylor instability (RTI) between hot and cold fluids. The combined effects of RTI and Kelvin–Helmholtz instability (KHI) enhance the disturbance between hot and cold fluids, shorten the fuel combustion time, and intensify the dissipation of large-scale vortices. The increase in fluid flow velocity can raise the flame front’s hydrodynamic stretch rate, thereby enhancing the turbulence level during combustion to a certain extent and increasing the fuel consumption rate. When a strong centrifugal force is applied, the global flame propagation speed can be more than doubled. Within a certain range, the increase in high-g field strength can enhance the intensity of RTI and accelerate the transition of RTI to the nonlinear stage.
1. Introduction
Modern aero gas turbines aim to improve performance, enhance durability, and reduce emissions. Ultra-compact combustion technology adopts the rich burn–quick quench–lean burn (RQL) combustion organization method, which significantly shortens the fuel combustion length, thereby reducing the length of the combustion chamber and increasing the thrust-to-weight ratio of the gas turbine [1,2]. Figure 1 presents a comparative schematic of the ultra-compact combustor and the conventional combustor. As shown, compared to the conventional combustor, the ultra-compact combustor features a cavity near the engine’s outer diameter, where fuel and air mix and burn in a circumferential rotation within the cavity. This design, to some extent, transforms traditional axial combustion into circumferential combustion, greatly reducing the axial length of the combustion chamber. The key to ultra-compact combustion technology is the creation of a high-g combustion environment within the combustor components, achieved by strong swirling or rotating the combustor to generate high centrifugal forces. The intensity of these centrifugal forces is typically represented by a dimensionless ratio relative to gravity, and this mode of combustion is also known as high-g combustion.

Figure 1.
Schematic comparison of ultra-compact combustion chamber and traditional combustion chamber [3].
In 1971, Lewis [4] conducted combustion experiments with premixed propane air within a rotating tube, demonstrating that within a certain range of high-g combustion environments, the flame propagation speed during the combustion process increases with the strength of the high-g field. The experiments also revealed that the accelerated flame propagation phenomenon only occurs within the high-g range of 600 g to 3500 g. Within this range, the flame propagation speed Sf is approximately proportional to the square root of the high-g factor g0, as expressed by the equation Sf = C1g00.5. Subsequently, Lewis proposed the “bubble transport principle” to explain this phenomenon and noted that buoyancy forces within a specific high-g range significantly impact the flame propagation speed [5,6]. Later, Sakai [7] conducted combustion experiments on flame propagation in a rigid-body rotating flow field using an open-ended tube. The experiments indicated that as the rotational speed increased, the flame propagation speed at specific points in the tube exhibited an approximately linear increase. Additionally, it was found that the presence of centrifugal forces could expand the flammability limits of the fuel.
Katta [8] simplified Lewis’s experiment into a two-dimensional model extending infinitely in the direction of flame propagation. By applying a force parallel to the flow direction in the momentum equation to simulate the body force generated by rotation, the phenomenon of buoyancy accelerating the flame propagation speed was observed when the body force increased to 500 g. This further validated the rationality of the “bubble transport principle”. Briones, A.M. et al. [9] used a closed, X-axis symmetric two-dimensional model to perform numerical simulations of propane–air premixed gas in a rotating reference frame. They pointed out that the centrifugal force promotes the occurrence of Rayleigh–Taylor instability (RTI), increases the contact area between the flame front and unburned gas, accelerates the flame combustion rate, and enhances flame propagation speed. Liuyu et al. [10] considered the effects of Coriolis force and centrifugal force on flame propagation speed in a closed duct. They pointed out that in a closed rotating combustor, the Coriolis force also has a certain impact on flame propagation speed and cannot be ignored.
As high-speed fluids flow through a curved channel, a significant centrifugal force field can form within the channel. When fuel combusts in this environment, high-g combustion phenomena may occur. Based on this, Lapsa [11,12] conducted combustion experiments with high-speed fuel flow in a curved channel featuring a backward-facing step. The study revealed that when the step is located on the outer side, the centrifugal force can induce Rayleigh–Taylor Instability (RTI) between the burned and unburned gases, increasing their contact area, enhancing heat transfer, and thereby increasing the flame propagation rate. Building on Lapsa’s experiments, Erdmann et al. [13] further investigated the combustion of propane–air premixed gas in a curved channel. Their research indicated that due to the presence of the centrifugal force field, high-density reactants near the channel’s inner radius are driven outward by RTI, while low-density combustion products near the outer radius are driven inward, creating intense turbulent structures that greatly promote mixing in the combustion zone. Sykes et al. [14] optimized Lapsa’s backward-facing step curvature model into a curved channel model with a splitter plate. They studied the development of RTI and pressure fluctuation characteristics within the curved channel. The research revealed that the model with the partition plate reduced the pressure variation amplitude by an order of magnitude compared to Lapsa’s original model.
It is evident that current research on high-g combustion mechanisms is primarily divided into two directions: combustion in rotational systems based on Lewis’s experiments and combustion of high-speed fluids in curved channels based on Lapsa’s experiments. High-g combustion is mainly applied in the field of aero-engine turbojet engines, but utilizing rotational combustion poses significant challenges to the overall structure, fuel supply system, and ignition system of existing engines. Current ultra-compact combustors are mainly designed using specific combustion organization methods that generate high-g fields through high-speed fluid flow. Therefore, Lapsa’s experiments offer better guidance for the design of ultra-compact combustors, which is the main reason for choosing Lapsa’s experimental model for the study in this paper.
Although considerable research has been conducted based on Lapsa’s experiments, there is still a lack of studies on the potential factors that enhance flame propagation speed in high-g combustion. Therefore, this paper, based on the experimental model of Lapsa, employs large eddy simulation (LES) to investigate the mechanism of high-g combustion. By analyzing flame morphology evolution, flame surface area changes, and the distribution of flame surface stretch rate, this study explores the mechanisms by which high-g combustion enhances flame propagation speed. The findings of this study can provide relevant references for the selection of high-g intensity and combustion organization methods in the design of ultra-compact combustors.
2. Computational Model and Method
2.1. Computational Model
As shown in Figure 2, the computational model used in this paper is based on the experimental model with a backward-facing step by Lapsa [11,12]. Model 1 is illustrated in Figure 2a. Due to the high computational resource requirements of LES simulations, and given the limited computational resources, we focused on the core combustion region downstream of the backward-facing step. Therefore, the model was further simplified to the core combustion region spanning −46° to 45°, totaling 91° (the shaded area in Figure 2). Model 2, shown in Figure 2b (only the core region is displayed), serves as a comparative study in a non-high-g environment against Model 1. The length and circumference at the curved channel center correspond, and various boundary conditions are identical to those of the curved channel. To minimize the influence of the front and rear walls on the flame morphology, all model front and rear walls were simplified to translational periodic boundaries. Additionally, the green-shaded area—Region A—in the corresponding positions of each model in Figure 2 is designated as the primary region for later analysis, and a monitoring point, Point P0, was set up during the solution process to analyze its pressure fluctuations later.
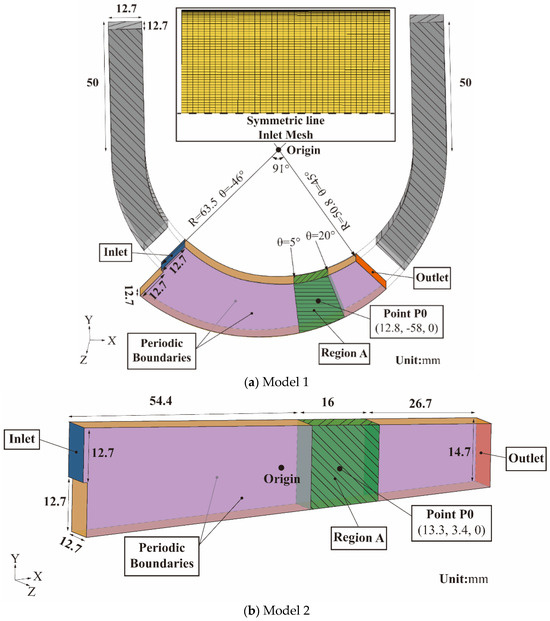
Figure 2.
Schematic diagram of the computational model.
In the calculations, it was ensured that the mesh resolution for turbulent kinetic energy was above 85% in all regions, with Y+ < 1. A boundary layer with a total thickness of 1 mm was set near the wall, comprising 20 layers, with the first layer height being 0.005 mm and a growth rate of 1.2, to better capture the significant variations in parameters close to the wall. After initial calculations, multiple modifications, and repeated computations, the final mesh used had a primary mesh size of 0.3 mm, with approximately 2.8 million mesh cells. The yellow area in Figure 2a shows half of the final mesh at the inlet of Model 1.
2.2. Computational Method
In this study, ANSYS FLUENT 2022 R2 software was used for the numerical simulation of the model. This software is widely applied in computational fluid dynamics (CFD) and is known for its stability and robustness. To better simulate the turbulent characteristics within the channel, the large eddy simulation (LES) model was chosen for the turbulence model, and the wall-adapting local eddy viscosity (WALE) model was selected for the subgrid–scale model. The species transport equation utilized the eddy dissipation concept (EDC) model, and the combustion mechanism employed a global two-step reaction mechanism for propane air.
A second-order implicit difference scheme was used to discretize the time term. The pressure–velocity coupling scheme employed the Coupled method. For spatial discretization, the PRESTO! scheme was used for pressure, while bounded central differencing schemes with low dissipation were selected for density, momentum, turbulent kinetic energy, species, and energy. The gradient spatial discretization used the least squares cell-based scheme. The time step was determined using the Courant–Friedrichs–Lewys condition (CFL) method, with multiple calculations monitoring the maximum Courant number (Cmax) to ensure the global Cmax remained below 1, resulting in a final time step of Δt = 10−6 s.
To eliminate the influence of steady-state initial conditions on the LES calculations, an initial calculation was conducted for 1.5 to 2 times the fluid residence time to serve as the initial condition for steady-state calculations. Subsequently, the statistical function was activated for formal statistical calculations, with the statistical time also being 1.5 to 2 times the residence time. Since LES calculations require substantial computational resources, to ensure accuracy and save computation time, the initial and statistical times were set to 1.5 times the residence time at low speed (inlet velocity of 20 m/s) and 2 times at high speed (inlet velocity of 40 m/s).
2.3. Boundary Conditions
During the simulation process, the Reynolds-averaged Navier–Stokes (RANS) method was first used for unsteady solution calculations of the complete model. After obtaining the steady-state solution, the temperature, velocity, pressure distribution, and turbulence information at the corresponding interface of the core region inlet (the blue areas in Figure 2a,b) were extracted as the boundary conditions for the core region inlet. The inlet composition for each case was a stoichiometric propane–air premixed gas, and the other inlet boundary conditions for each case are shown in Table 1, where the prefix BFS represents the channel with a backward-facing step (BFS).

Table 1.
Inlet boundary conditions for each case.
2.4. Mesh Scale Selection and Independence Verification
The requirement for mesh resolution in LES simulations is primarily evaluated by the percentage of resolved turbulent kinetic energy kres to the total turbulent kinetic energy kt, with a general requirement of exceeding 80%. The total turbulent kinetic energy is the sum of the resolved turbulent kinetic energy kres and the subgrid–scale turbulent kinetic energy ksgs. Prior to determining the final mesh scale, multiple preliminary calculations were conducted. Initially, the RANS method was used to calculate the integral length scale l0, and the initial mesh Δ was set to one-fifth of the integral length scale. The calculation formula for the initial mesh scale Δ is provided in Equation (1):
where k is the turbulent kinetic energy, Cμ is the Smagorinsky constant (0.325), and ω is the specific dissipation rate, with units of S−1.
After determining the initial mesh scale, the mesh was adjusted multiple times based on the distribution of resolved turbulent kinetic energy and Y+, ensuring that all Y+ values were less than 1. A boundary region with a total thickness of 1 mm was set near the wall, containing 20 boundary layers. The height of the first layer was 0.005 mm, with a growth rate of 1.2, to better capture the significant variations in parameters close to the wall. After preliminary calculations, multiple modifications, and recalculations, the final mesh used had a main mesh size of 0.3 mm, with approximately 2.8 million mesh nodes. The yellow region in Figure 2a shows half of the final mesh at the inlet for model 1. Figure 3 provides the proportion of resolved turbulent kinetic energy for BFS B (left) and BFS C (right) with the final mesh. As shown in the figure, the adopted mesh resolves more than 96% of the turbulent kinetic energy in most regions, with only a few small areas, such as near the inlet or close to the upper wall, exhibiting relatively lower resolution. However, even in these areas, the resolution exceeds 85%, indicating that the chosen mesh scale adequately meets the mesh independence requirements for LES simulations.
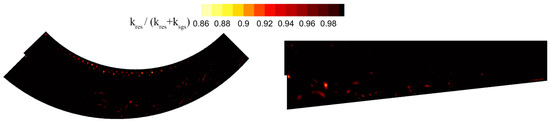
Figure 3.
Proportion of Resolved Turbulent Kinetic Energy for BFS B (left) and BFS C (right) with the Final Mesh.
3. Results and Discussion
To better study the combustion characteristics of fuel in a combustion channel with a backward-facing step, the following sections will discuss various aspects of the combustion process, including pressure fluctuations, temperature field distribution, flame surface morphology and area, flame stretch rate, and flame propagation speed.
3.1. Analysis of Pressure Fluctuation Characteristics in the Channel
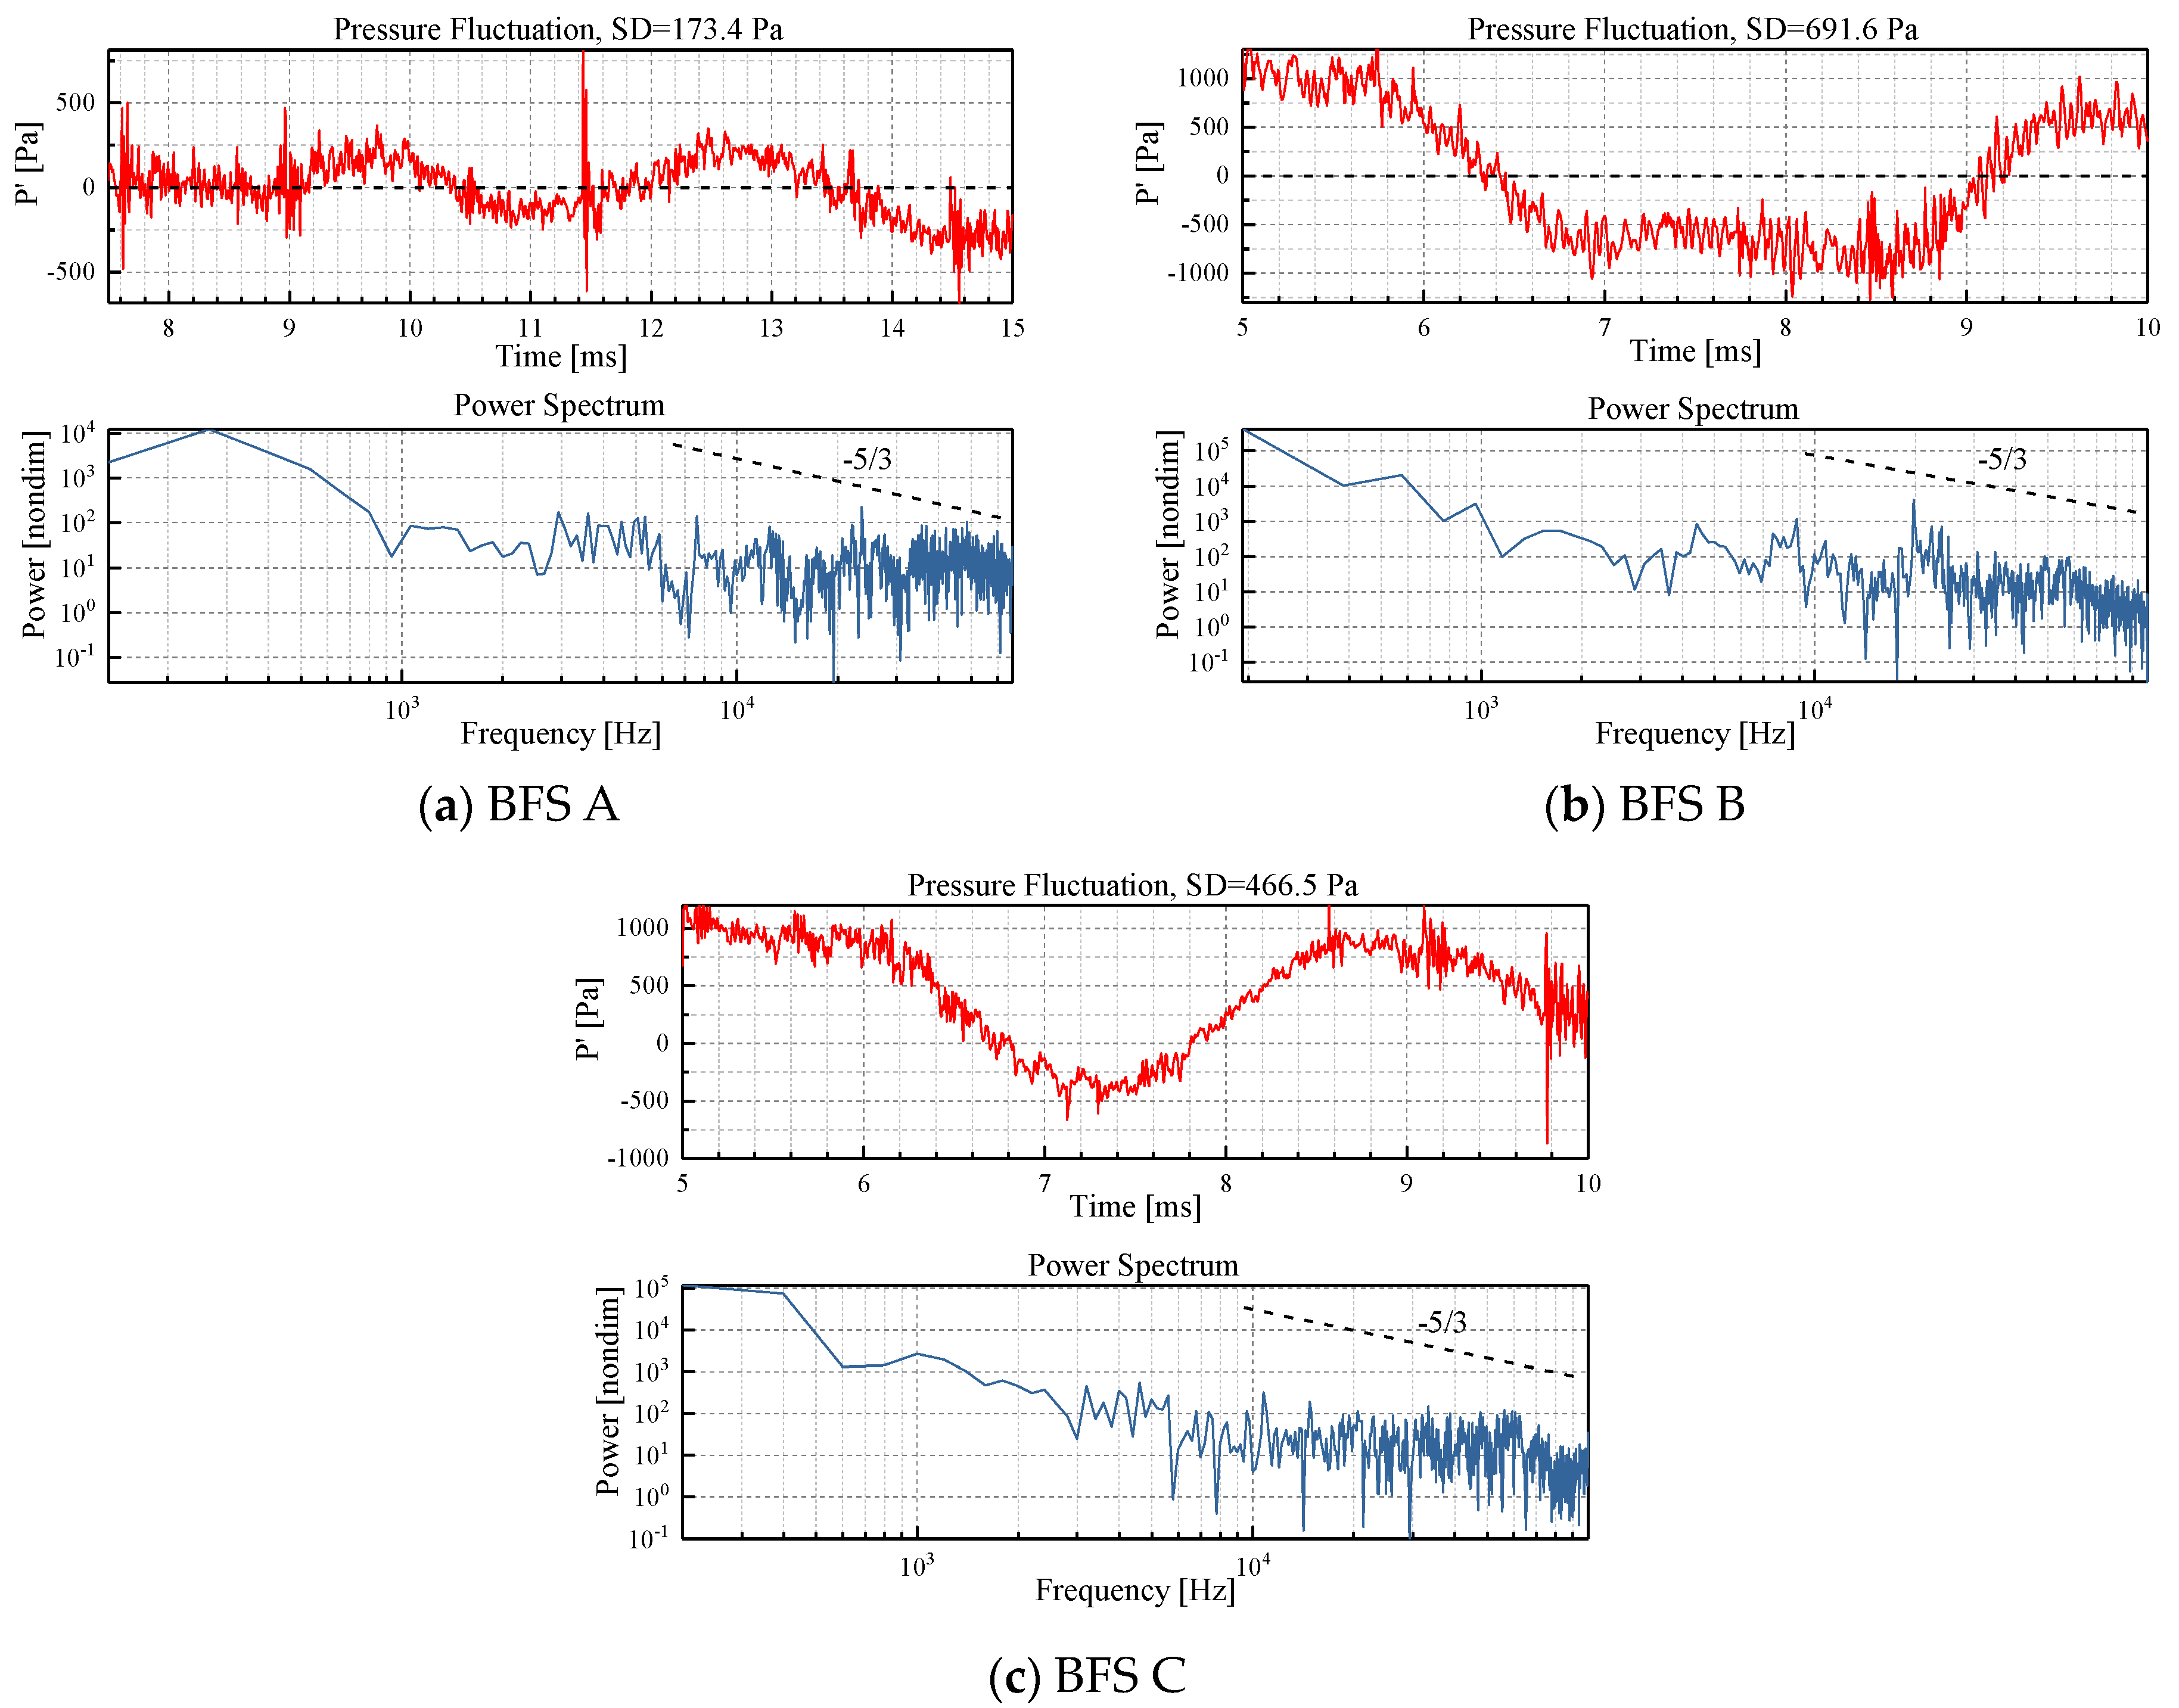
Figure 4 (top) shows the variation curves of pressure fluctuations at monitoring point P0 over time for each case. Comparing BFS A and BFS B, it can be seen that BFS B exhibits more intense pressure fluctuations with a higher overall amplitude. The standard deviation (SD) of BFS B is approximately four times that of BFS A, indicating that an increase in flow rate enhances pressure fluctuations during the flow process. The possible reasons for this phenomenon are as follows: On the one hand, the increase in flow rate leads to a higher Reynolds number, directly enhancing the turbulence intensity in the flow process. On the other hand, the increase in flow rate in the curved channel results in greater centrifugal force during the flow process, promoting the mixing of fluids with different densities, which also increases turbulence intensity and thereby enhances pressure fluctuations.

Figure 4.
Pressure fluctuation curves (top) and power spectrum curves (bottom) for each case.
Comparing BFS B and BFS C, it is observed that their overall pressure fluctuation trends are quite similar, with maximum pressure fluctuations around 1000 Pa. However, BFS B shows significantly stronger local pressure fluctuation amplitudes and a higher standard deviation, nearly 1.5 times that of BFS C. This indicates that, under the same conditions, pressure fluctuations in a curved channel with a backward-facing step are stronger than in a straight channel. This further demonstrates that the presence of centrifugal force can enhance the turbulence intensity within the channel, leading to pressure fluctuations during the flow process.
Figure 4 (bottom) shows the power spectrums of pressure fluctuations for each case, with the dashed line representing the classical turbulent dissipation curve with a slope of −5/3. From the power spectrum, it is evident that all cases conform to the Kolmogorov universal equilibrium theory in the inertial range, further validating the rationality of the computational models. All cases exhibit typical turbulent decay; however, it can be seen that BFS B and BFS C have stronger power densities in the low-frequency range, indicating that their energy density is more concentrated in the low-frequency region.
3.2. Analysis of High-g Field Distribution in the Channel
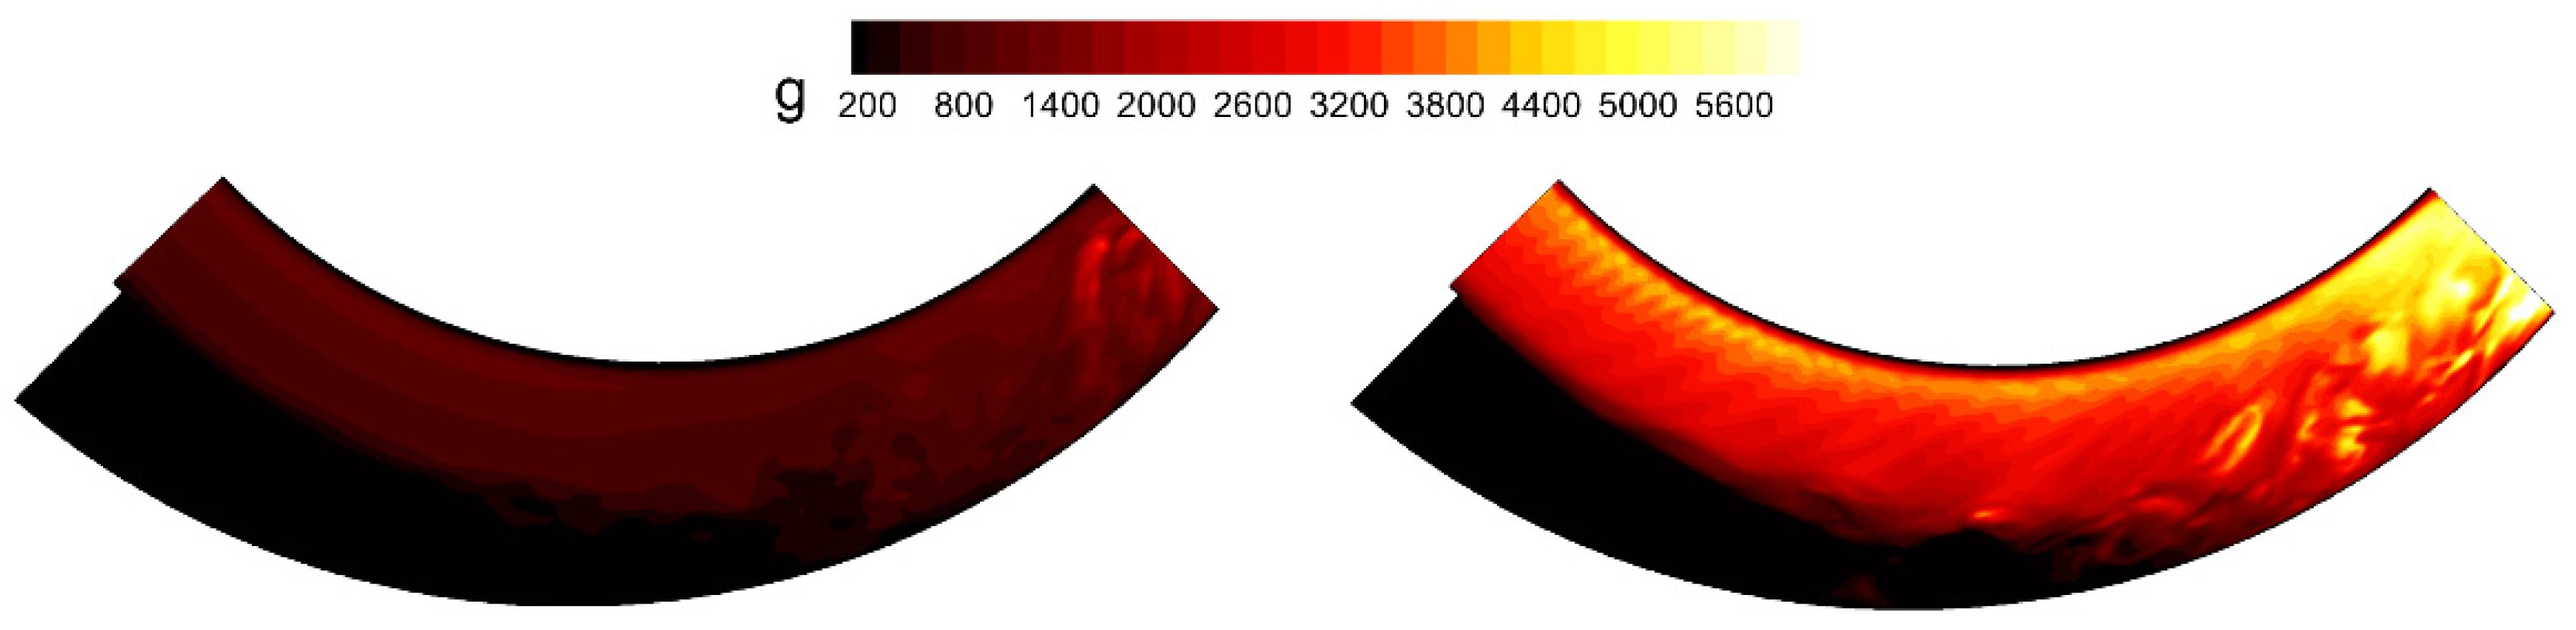
High-speed fluid flow in a curved channel generates centrifugal force, creating a high-g combustion environment that affects the combustion process and flame propagation speed. Figure 5 shows the instantaneous high-g field contour during the combustion process for BFS A and BFS B. The high-g field strength g0 is expressed as a dimensionless factor, representing the ratio of the resulting centrifugal acceleration to gravitational acceleration. Its value can be calculated using Equation (2).

Figure 5.
High-g field contours for BFS A (left) and BFS B (right).
In the equation, Vtan is the tangential velocity of the fluid, g is the gravitational acceleration, and r is the radius at the corresponding position.
From the figure, it can be observed that the high-g field is stronger near the inner radius for both cases because the high-g field is inversely proportional to the channel radius. Additionally, strong high-g fields are formed at certain local points near the exit. This phenomenon is likely due to the intense mixing between the burnt and unburnt gases at these locations, which disrupts the shear layer formed between the hot and cold fluids, enhancing the turbulence level and consequently increasing the tangential velocity of the local fluid. This results in a stronger high-g field at these local points.
Both cases exhibit large areas of low-intensity high-g fields (around 200 g) near the backward-facing step region. The gas velocity in these regions is relatively low, and the high-temperature combustion products mix with the low-temperature unburnt premixed fuel. This region is referred to as the “recirculation zone” in some literature [15]. It can be observed that the low-g field region in BFS B is smaller than that in BFS A, mainly due to the difference in fluid velocity. When the flow velocity increases from 20 m/s to 40 m/s, the high-g field at the leading edge of the backward-facing step increases from around 800 g to 2600 g, indicating that increasing the inlet velocity enhances the high-g intensity within the flow field.
The high-g field at the flame front significantly impacts the fuel consumption rate, which in turn alters the combustion characteristics of the turbulent flame. Further analysis will be conducted by examining other parameters during the combustion process.
3.3. Analysis of Flame Combustion Characteristics in the Channel
To study the flame combustion characteristics during the combustion process for each case, time-averaged temperature contour plots were obtained for the Z = 0 mm section (Z0) and X = 0 mm section (X0), as shown in Figure 6. The blue dashed lines in the figure indicate the position of the X0 section.
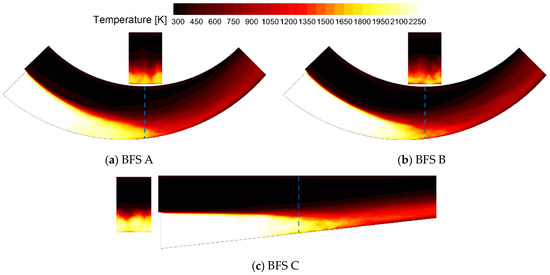
Figure 6.
Time-averaged temperature contours for each case.
Figure 6 shows that all cases exhibit a large high-temperature area near the backward-facing step, corresponding to the recirculation zone mentioned earlier. This further demonstrates that the recirculation zone in the backward-facing step combustion channel maintains a high temperature. Comparing the downstream extension distance of the high-temperature regions for each case, BFS C has the longest extension distance, followed by BFS A, and BFS B the shortest. The downstream extension distance can reflect the intensity of the combustion process to some extent. A shorter extension distance indicates that the fuel completes combustion within a short distance, leading to a more intense initial combustion process. Conversely, a longer extension distance implies that more time is required for combustion at the same speed, resulting in a relatively mild combustion process.
This observation suggests that combustion in a high-g environment can shorten the fuel combustion distance, and within a certain range, the combustion distance is inversely related to the intensity of the high-g field.
Comparing the shear layers between the hot and cold fluids in each case reveals that in the non-high-g environment (BFS C), the shear layer changes more gradually, with a more apparent transition between the hot and cold fluids and a thinner shear layer. In contrast, in high-g environments (BFS A and BFS B), the shear layer between the hot and cold fluids changes more dramatically and is relatively thicker. In cases of higher high-g fields, the changes in the shear layer are even more intense. The thickness of the shear layer can reflect the intensity of the mixing process between the fluids to some extent. Under the same conditions, a thicker shear layer indicates stronger mixing, resulting in a shorter mixing time. This suggests that the presence of a high-g field can enhance the mixing degree between the hot and cold fluids and shorten the mixing time, which might be one of the factors contributing to the increased flame propagation speed in high-g fields.
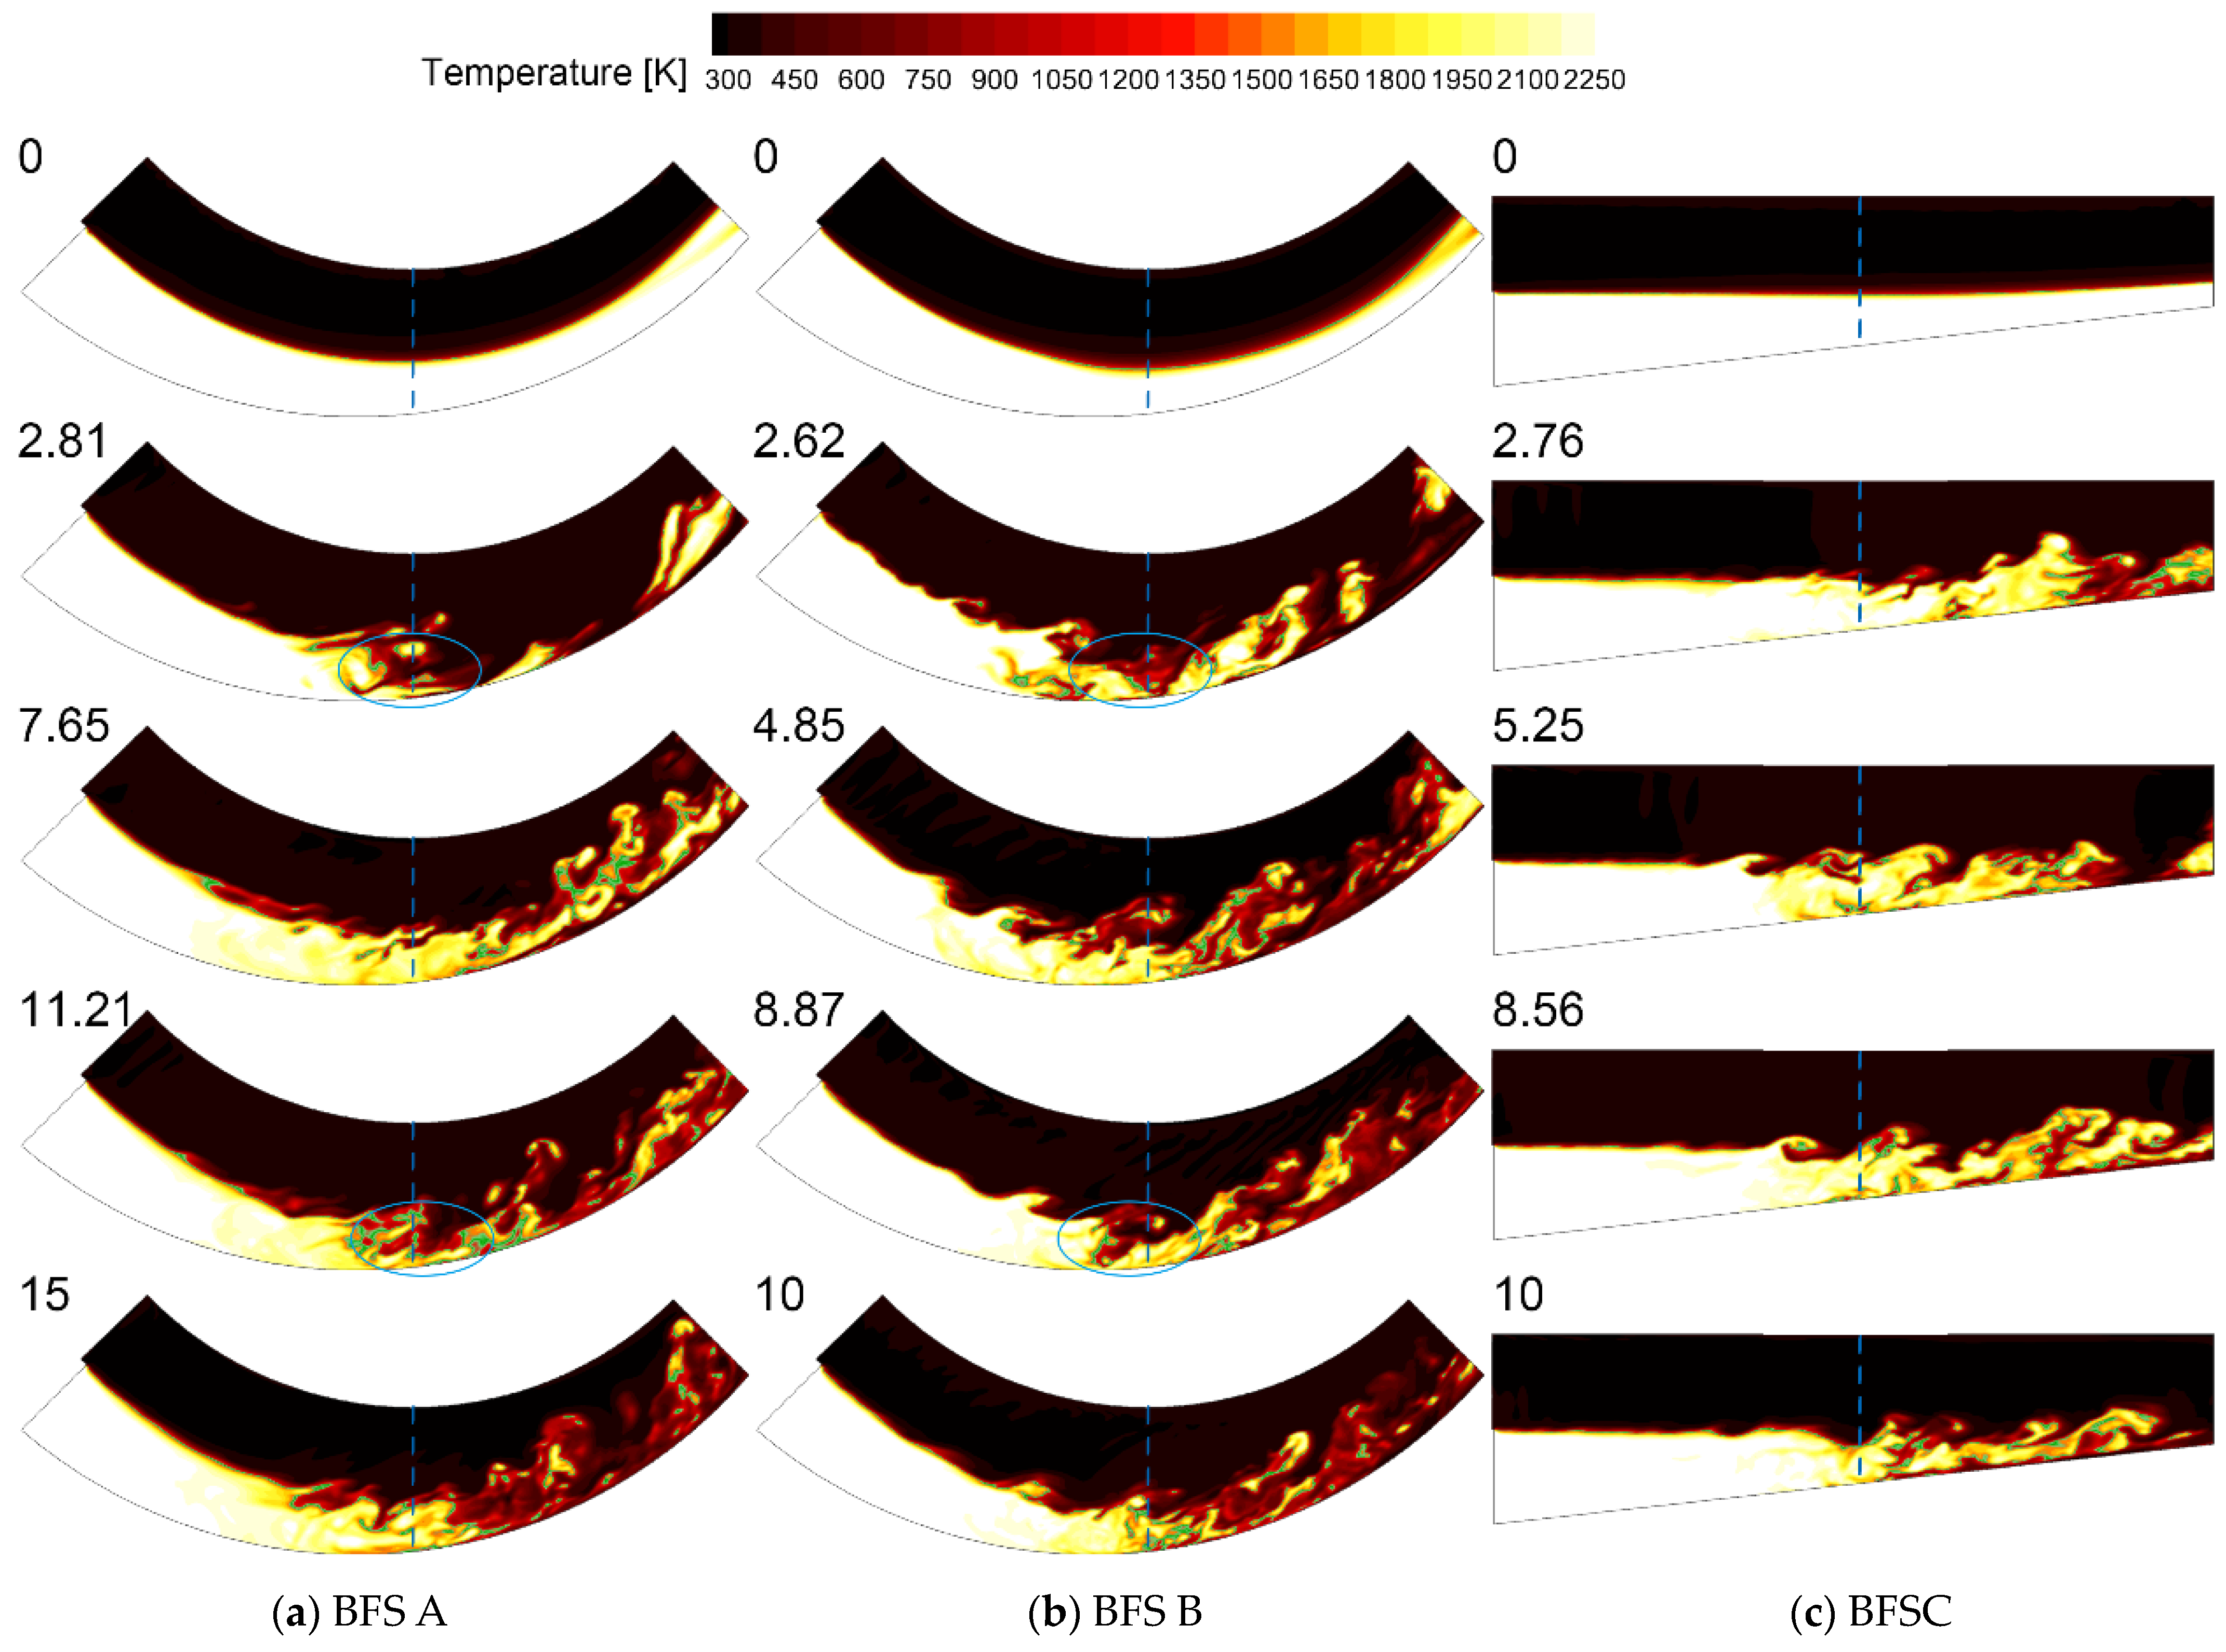
Figure 7 presents the instantaneous temperature contours for each case during the combustion process. The combustion time increases sequentially from top to bottom, with the combustion time indicated in the top left corner of each image. The 0 ms time frame (the topmost image) for each case represents the steady-state results calculated using the RANS turbulence model, while the bottommost image represents the final time frame of the calculation for each case. Following the method of Sykes [16], the instantaneous flame front is characterized by the T = 1275 K temperature isosurface, depicted with green lines in the figures.
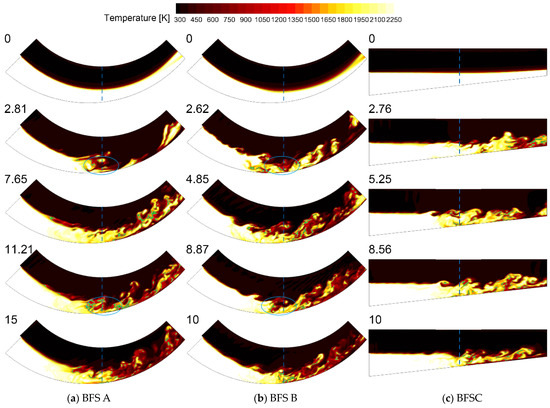
Figure 7.
Instantaneous temperature contours at different time instances for each case (Time unit: ms).
From the figure, it can be observed that at the initial moment (0 ms), the distribution of high- and low-temperature regions is quite distinct. The high-temperature regions are predominantly located downstream of the backward-facing step. Compared to BFS A, the high-temperature region in BFS B is smaller. This phenomenon can be explained as follows: On the one hand, the increased flow velocity can quickly blow the flame front downstream; while on the other hand, the increased flow velocity in the curved channel accompanies an increase in centrifugal force, resulting in a stronger high-g field. This intensifies the strain rate of the flame front, leading to local flame quenching and thereby reducing the high-temperature region. At the initial moment, although the RANS turbulence model can roughly calculate the temperature distribution within the channel, it averages the global turbulent kinetic energy, lacking the details of local turbulent kinetic energy, and thus cannot fully capture the combustion process accurately.
By comparing the temperature contours at different times, it can be observed that the flame fronts in each case generally appear on the right and upper parts of the recirculation zone, consistent with the steady flame stabilization mechanism behind the backward-facing step studied by Rasmussen [17]. Additionally, in the straight channel, the high-temperature regions are mainly located on the right side of the backward-facing step, whereas in the curved channel, the flame gradually expands toward the inner wall downstream, significantly enlarging the combustion region.
Comparing BFS B and BFS C, it is noted that in the straight channel, there is a segment near the backward-facing step where the boundary between high and low temperatures remains undisturbed. Only as it approaches the middle section does minor perturbation appear. This can be explained by the Kelvin–Helmholtz instability (KHI) affecting the disturbance between hot and cold fluids primarily due to differing flow velocities. Near the backward-facing step, the short-wavelength perturbations formed by KHI are counteracted by the surface tension of the fluid, hence minimal changes occur at the boundary. As KHI intensifies, the induced disturbances gradually increase, breaking the surface tension and forming small amplitude disturbances at the boundary. However, the perturbation caused by KHI over short distances is limited. In contrast, BFS B shows disturbances at the high- and low-temperature boundary over a shorter distance from the backward-facing step, with much stronger amplitudes compared to BFS C. This phenomenon can be explained as follows: During the flow, the density of the low-temperature free stream gas is approximately 1.19 m3/kg, while the high-temperature recirculation zone density is about 0.15 m3/kg, an eightfold difference. The rapid flow in the curved channel generates high body forces due to centripetal acceleration, creating a centripetal buoyancy effect. Under the influence of this density difference and force, the hot products in the recirculation zone are radially forced inward into the reactive flow, while the cooler reactants are radially forced outward into the recirculation zone, resulting in an intense mixing region between reactants and combustion products, promoting the formation and development of RTI. Therefore, the fluid in BFS B is affected by both RTI and KHI, forming strong disturbances at the high- and low-temperature interface.
Although the high- and low-temperature interface in the straight channel gradually exhibits curling and wrinkling downstream, the extent is far less than in BFS A and BFS B. Comparing BFS A and BFS B, it is evident that at higher velocities, the disturbances at the high- and low-temperature interface are stronger, and the distance over which disturbances transition to wrinkled flames is shorter. This phenomenon likely occurs because a stronger high-g field is formed at higher velocities, which more rapidly promotes RTI to reach a nonlinear stage, resulting in stronger disturbance variations.
Additionally, comparing the instantaneous temperature contours of each case in Figure 7, it can be observed that large-scale vortices periodically appear in the curved channel, as indicated by the blue ellipses, whereas such vortices are not observed in the straight channel. This phenomenon can be explained as follows: In the curved channel, due to the influence of RTI, the perturbations between the high- and low-temperature interfaces gradually increase, eventually forming large-scale vortices. However, as these large-scale vortices flow downstream, according to the energy cascade hypothesis in turbulence theory, the larger vortices gradually break down into smaller vortices, which then further decompose into even smaller vortices, ultimately dissipating as internal energy. Consequently, large-scale vortices periodically appear in the curved channel. Additionally, the combustion process within the channel generates a certain degree of acoustic instability, which periodically influences the vortices formed within the channel.
Based on the above discussion, it can be concluded that the fluid in the curved channel promotes the occurrence of RTI between the hot and cold fluids. The combined effect of RTI and KHI enhances the perturbations between the hot and cold fluids, shortens the combustion time of the fuel, and increases the dissipation of large-scale vortices. These effects, in turn, have a significant impact on the flame propagation speed. In the design of actual ultra-compact combustors, it is crucial to adopt appropriate combustion organization methods to reduce the generation of periodic large vortices, thereby ensuring stability during the combustion process.
3.4. Analysis of Flame Stretch Rate and Instantaneous Flame Morphology in the Channel
In nonuniform flow processes, the flame front is influenced by both strain and curvature effects. The combined impact of these two factors leads to changes in the flame front. The flame stretch rate κ can be used to quantitatively reflect these changes. The total flame stretch rate κt can be represented by the sum of the curvature-induced stretch rate (κc) and the hydrodynamic stretch rate (κh) [18,19]. The κc primarily reflects the stretching caused by the local curvature effects on the flame front, while the κh mainly reflects the stretching due to strain caused by local flow nonuniformity.
In this section, the instantaneous isotherms at T = 1275 K are used to represent the flame surface. Figure 8 shows the instantaneous flame surfaces for two translation periods for each case, with the flame surfaces colored by the curvature-induced stretch rate and the hydrodynamic stretch rate, respectively.
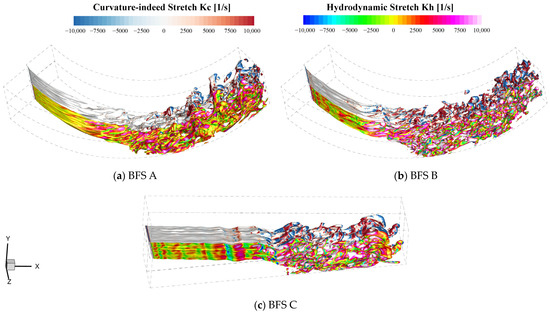
Figure 8.
Instantaneous flame front and stretch rate distribution contours for each case.
From the figure, it can be seen that for all three cases, the flame front in the upstream region near the rear inlet is primarily unaffected by curvature-induced stretch. The total stretch rate is mainly controlled by hydrodynamic stretch. This stretch rate is primarily due to the flow imbalance caused by the velocity and density differences between the free stream and the recirculation zone. Although this phase can induce some undulations on the flame surface, the influence on the flame surface area is limited due to the surface tension of the fluid itself. As the flow progresses downstream, the free stream gradually approaches the flame stabilization region, where intense chemical reactions begin to occur. Under the influence of chemical reaction instability, KHI, and RTI, the curvature-induced stretch rate of the flame front increases rapidly, causing the flame front to fold and wrinkle. This indicates that in the backward-facing step channel studied in this paper, the primary cause of flame front wrinkling and folding is curvature-induced stretch.
Comparing BFS A and BFS B, it can be observed that in the upstream region, BFS B exhibits a higher hydrodynamic stretch rate on the flame front. Additionally, the location where the flame front starts to show ripples, folds, and wrinkles is closer to the inlet in BFS B. This phenomenon can be explained as follows: The free stream in BFS B has a higher velocity compared to BFS A, resulting in a greater velocity difference between the free stream and the recirculation zone, which leads to a larger flow imbalance between the two regions. Consequently, BFS B initially exhibits a higher hydrodynamic stretch rate. Simultaneously, a stronger high-g field is formed in the BFS B flow, causing the distance for RTI to develop to the nonlinear stage between the free stream and the recirculation zone to be shorter. Therefore, the flame front in BFS B starts to fold and wrinkle earlier. Overall, comparing the flame front morphology in the mid-downstream regions of BFS A and BFS B, it is evident that BFS B has more wrinkles and a higher degree of flame front fragmentation. However, in the flame stabilization region, the wrinkles growing toward the inner wall in BFS A are more pronounced. The reasons for these observed flame front characteristics can be explained as follows: The higher velocity of the free stream in BFS B can partially blow away the wrinkled flame front growing toward the inner wall, resulting in less pronounced wrinkles toward the inner wall. Additionally, BFS B is subjected to a stronger high-g field, leading to more intense RTI at the shear interface between the free stream and the recirculation zone, causing large-scale vortices to transition into small-scale vortices more rapidly. Furthermore, the stronger high-g field can cause local flame front fragmentation and quenching to some extent. Therefore, BFS B exhibits a higher degree of flame front fragmentation.
Comparing BFS B with BFS C, it can be observed that the hydrodynamic stretch rates near the inlet upstream are numerically similar. In contrast to BFS A at the same location, it further indicates that the initial hydrodynamic stretch rate is mainly due to the velocity difference between the free stream and the recirculation zone fluids. Additionally, the greater the velocity difference, the higher the hydrodynamic stretch rate to some extent. Compared to BFS C, BFS B exhibits flame front folding and wrinkling earlier, and the magnitude of these folds and wrinkles is significantly greater.
3.5. Analysis of Flame Area Evolution and Flame Propagation Speed in the Channel
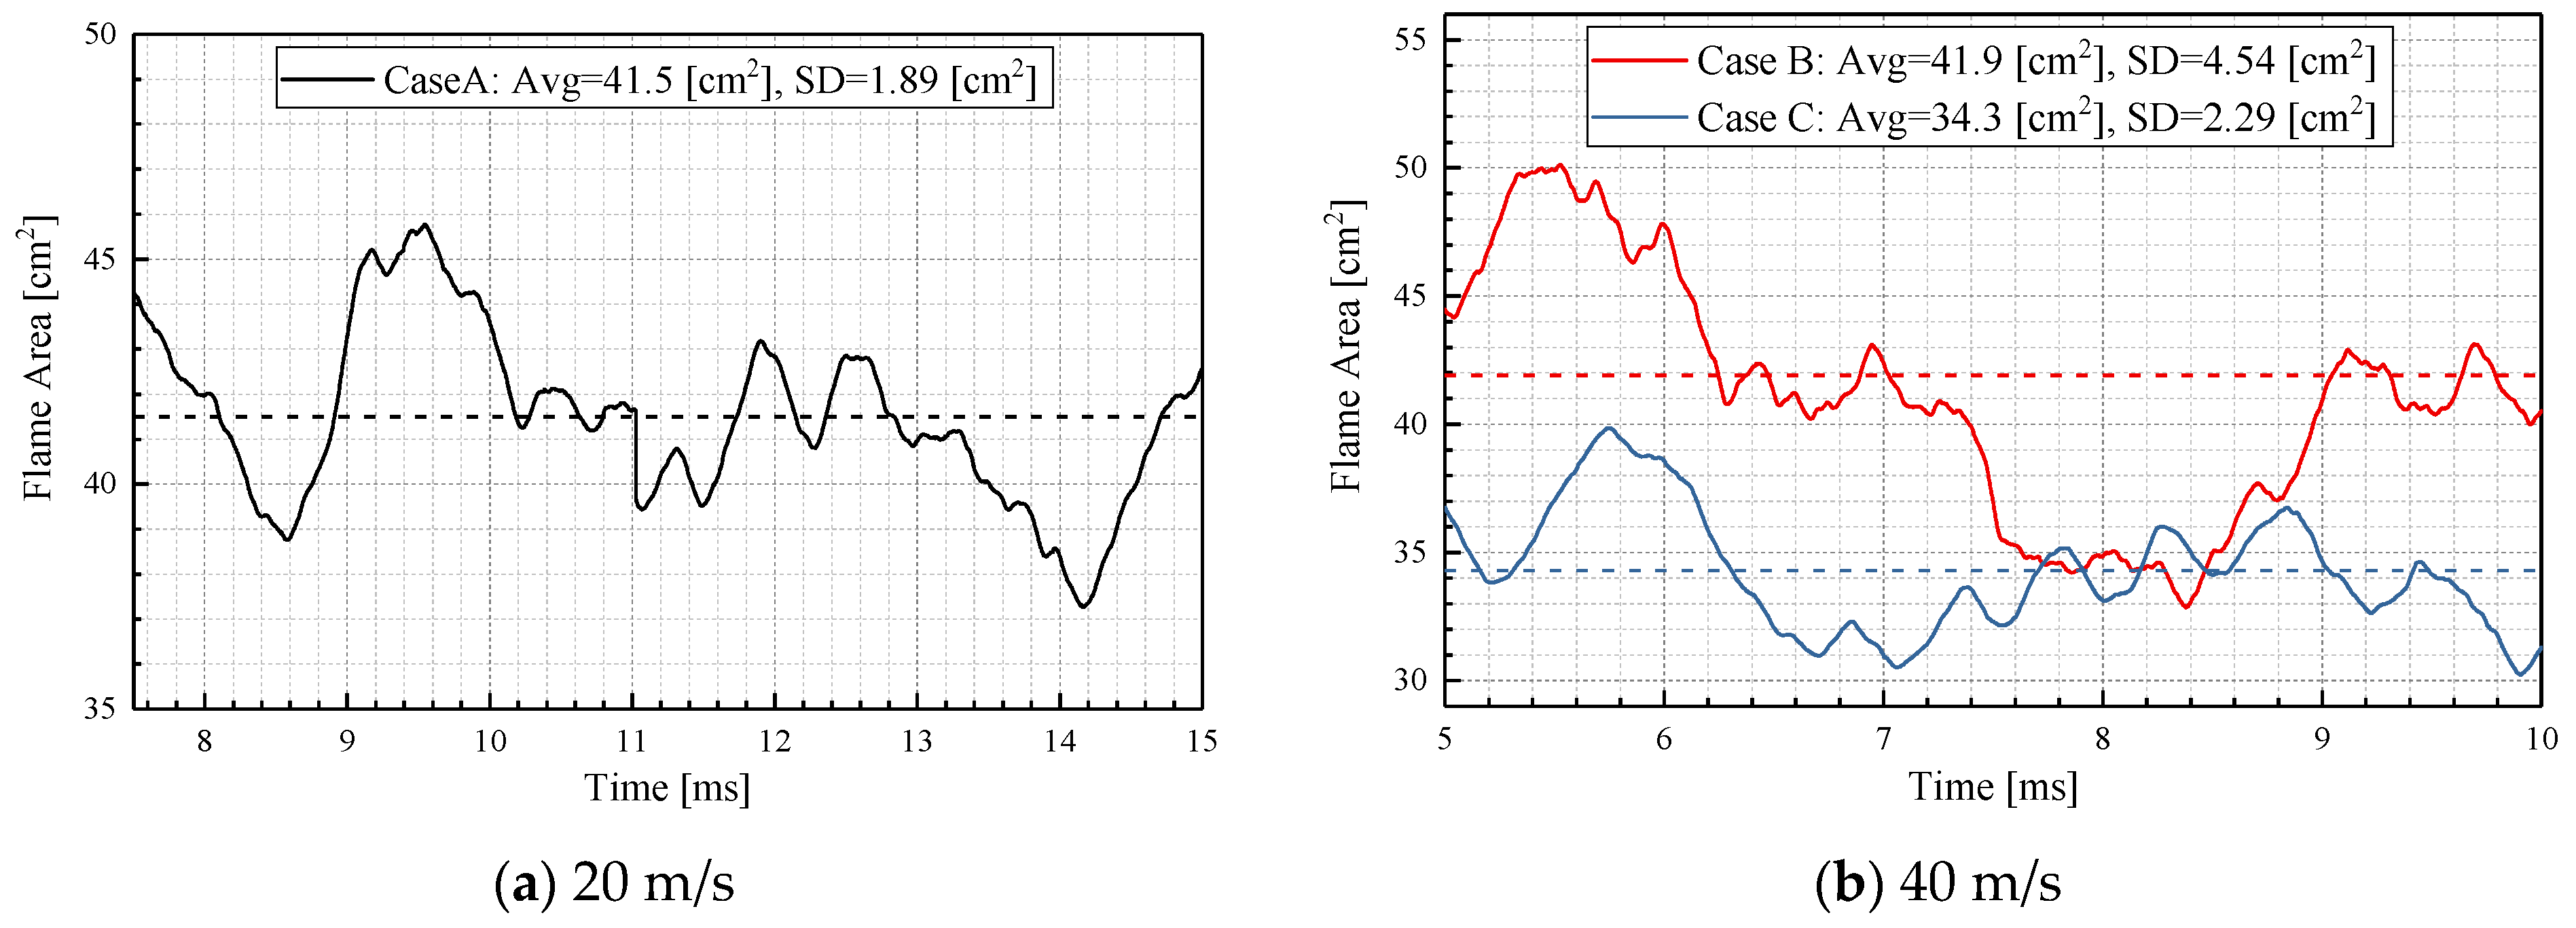
To quantitatively study the flame evolution characteristics during the combustion process of each case, Figure 9 presents the curve of flame surface area over time. As shown in the figure, the flame surface area in the curved channel under both flow velocity conditions is larger than that in the straight channel. This indicates that the presence of a high-g field can increase the flame surface area to some extent. Comparing BFS A and BFS B, although their average flame areas are numerically close, BFS B exhibits larger maximum values and smaller minimum values for the flame area. The overall standard deviation (SD) of BFS B is 2.4 times that of BFS A, indicating that BFS B has stronger fluctuations in flame area. The possible reasons for this phenomenon are as follows: In BFS B, the free stream has a higher flow velocity and can generate a stronger high-g field. Under the combined effect of high flow velocity and strong high-g field, stronger turbulence is induced in the middle and downstream regions. Additionally, due to the stronger RTI, the flame surface breaks up more quickly and even extinguishes locally in some areas. Consequently, BFS B shows greater fluctuations in flame surface area during combustion.

Figure 9.
The variation curve of flame surface area with time for each calculation.
To further study the combustion characteristics of each case, this paper uses the method of global consumption speed [20] to calculate the flame propagation speed during the combustion process. Equation (3) provides the calculation formula. To eliminate the influence of the initial stage on the flame propagation speed, Region A (as shown by the shaded area in Figure 2) was selected as the calculation region for the flame propagation speed. This region is located in the stabilized flame zone behind the step for all three cases and can accurately reflect the flame propagation speed during the rapid combustion stage.
In the above equation, represents the fuel consumption rate; represents the density of the reactants; represents the area of the isosurface where the reaction progress variable is 0.5; and represents the flame surface area during the combustion process.
The flame propagation speed for BFS A, as calculated using the aforementioned definitions, is 0.47 m/s, whereas BFS B achieves a speed of 0.97 m/s, approximately double that of BFS A. This indicates that increasing the inlet flow velocity in the curved channel used in this study can significantly enhance the global propagation speed. For BFS C, the calculated flame propagation speed is 0.53 m/s, slightly higher than BFS A but significantly lower than BFS B, suggesting that at the same inlet velocity, the curved channel can significantly improve the global flame propagation speed during combustion.
The observed results for the flame propagation speed can be explained as follows: In the curved channels (BFS A and BFS B), BFS B’s higher flow velocity forms a stronger KHI with the recirculation zone. The turbulence level in the stabilization zone is more chaotic, and the RTI developed during BFS B’s flow is stronger. The combined effect of strong turbulence and strong RTI enhances the mixing between the low-temperature fuel and high-temperature recirculation zone gases. Additionally, it increases the flame front’s twisting and stretching (as seen in Figure 8), thereby increasing the fuel consumption rate and enhancing the global flame propagation speed. At the same flow velocity, BFS B and BFS C have similar hydrodynamic stretch rates and KHI intensity, but BFS B has the presence of RTI in the channel and a higher curvature-induced stretch rate of the flame front (as seen in Figure 8), which accelerates the fuel consumption rate, resulting in a faster global flame propagation speed.
Additionally, the combustion efficiency of the three cases during the combustion process was calculated based on the relevant standards of the Society of Automotive Engineers (SAE) [21]. The average combustion efficiencies for BFS A, BFS B, and BFS C were 25.32%, 22.18%, and 19.58%, respectively. BFS A achieved the highest combustion efficiency primarily due to its lower inlet velocity, which resulted in a longer residence time for the fuel within the channel, leading to relatively higher combustion efficiency. Under the same inlet velocity, BFS B, which experienced centrifugal force, exhibited higher combustion efficiency compared to the BFS C case. This indicates that high-g combustion also has the potential to improve combustion efficiency to a certain extent.
A comprehensive comparison of the flame propagation speeds of the three cases shows that within a certain range, increasing the fluid velocity and enhancing the strength of the high-g field can both increase the fuel consumption rate during combustion, thereby improving the flame propagation speed. Based on the above research results, the following conclusions can be drawn: In channels with a backward-facing step, increasing the inlet velocity can increase the hydrodynamic stretch rate of the flame front, and to a certain extent, enhance the turbulence level during combustion, thereby increasing the fuel consumption rate. In curved channels, increasing the inlet velocity is accompanied by an increase in centrifugal force, which can enhance the strength of RTI, accelerate the transition of RTI to the nonlinear stage, increase the curvature-induced stretch rate of the flame front, promote the mixing of the free stream and the recirculation zone, thereby increasing the fuel consumption rate and flame propagation speed. However, the presence of centrifugal force also increases the flame front area. However, it is worth noting that the presence of centrifugal force also increases the flame front area. When the relative increase in overall combustion consumption rate is less than the relative increase in the flame front area, it can potentially reduce the overall flame propagation speed.
4. Conclusions
In this study, a LES model was used to perform numerical simulations of propane -air premixed fuel in channels with backward-facing steps at different flow velocities. The combustion characteristics in high-g and normal gravity environments were investigated in curved and straight channels. The influence of flame expansion characteristics and flame morphology within the channels was qualitatively analyzed, and the flame propagation speed and flame front area were quantitatively compared. The following conclusions were obtained:
- (1)
- The increase in centrifugal force and flow velocity both enhance pressure fluctuations during combustion and increase the turbulence intensity. The presence of centrifugal force promotes RTI between hot and cold fluids. The combination of RTI and KHI enhances the disturbance between hot and cold fluids, shortens the combustion time of the fuel, and enhances the dissipation of large-scale vortices.
- (2)
- Increasing the flow velocity of the fluid can increase the hydrodynamic stretch rate of the flame front, enhance the turbulence intensity during the combustion process to a certain extent, and increase the fuel consumption rate. Within a certain range, increasing the intensity of the high-g field can enhance the strength of RTI, accelerate the transition of RTI to the nonlinear stage, increase the curvature stretch rate of the flame front, enhance the mixing of the free stream and the recirculation zone, increase the fuel consumption rate, and increase the flame propagation speed. When a strong centrifugal force is applied, the global flame propagation speed can be more than doubled.
- (3)
- In the curved channel, the increase in flow velocity accompanied by the increase in centrifugal force triggers stronger RTI, resulting in increased hydrodynamic and curvature stretch rates of the flame front. This leads to enhanced flame front curvature and wrinkling, improving the mixing of unburned premixed gas with high-temperature combustion products, and strengthening heat and mass transfer. Under these conditions, the overall fuel consumption rate is increased, potentially leading to increased combustion efficiency and power density, thus improving the overall flame propagation speed. However, the presence of centrifugal force also increases the flame front area.
- (4)
- It is worth noting that the presence of centrifugal force also increases the flame front area. When the relative increase in overall combustion consumption rate is less than the relative increase in the flame front area, it can potentially reduce the overall flame propagation speed.
- (5)
- In the design of ultra-compact combustors, structures that maintain a high-g environment should be incorporated to achieve faster combustion rates and higher flame propagation speeds. This will reduce the fuel residence time within the combustion chamber and consequently shorten the chamber’s axial length.
Although this study qualitatively explains the mechanisms by which high-g environments accelerate flame propagation, it is limited by the computational resources required for large-eddy simulations of the combustion process. As a result, only three cases under two models were computed and analyzed, and a sensitivity analysis of boundary conditions was not performed. Therefore, the generalization of high-g characteristics may have certain limitations, which is a shortcoming of this study. Related research and analysis are ongoing and will be published in the future. Additionally, while high-g combustion has potential for reducing the axial length of combustion chambers and enhancing overall engine performance, our research has identified that the stability of the ignition process in a high-g environment is relatively poor. In the design of ultra-compact combustors, additional measures such as flame stabilization structures or multi-point ignition strategies may be required to ensure engine start-up and stable operation. We are also investigating the variation characteristics and potential impact mechanisms of fuel ignition in high-g environments, with results to be published in future studies.
Author Contributions
Conceptualization, Z.G.; methodology, Z.G.; software, Z.G.; validation, H.T.; formal analysis, Z.G.; investigation, Z.G.; resources, H.T.; data curation, H.T.; writing—original draft preparation, Z.G.; writing—review and editing, Z.G.; visualization, Z.G.; supervision, H.T.; project administration, H.T.; funding acquisition, H.T. All authors have read and agreed to the published version of the manuscript.
Funding
This research was supported by the National Natural Science Foundation of China (No. 51076064 and No. 91641131), and the Fundamental Research Funds for the Central Universities (No. 56XBA22001).
Data Availability Statement
Some data, models, or code that support the findings of this study are available from the corresponding author upon reasonable request.
Conflicts of Interest
The authors declare no conflicts of interest.
Nomenclature
| BFS | Backward-Facing Step |
| CFD | Computational Fluid Dynamics |
| CFL | Courant–Friedrichs–Lewys Condition |
| Cmax | Maximum Courant number |
| EDC | Eddy-Dissipation-Concept |
| high-g | high gravity |
| Kc | Curvature-induced Stretch |
| Kh | Hydrodynamic Stretch |
| KHI | Kelvin–Helmholtz Instability |
| LES | Large Eddy Simulation |
| RANS | Reynolds-averaged Navier–Stokes |
| RQL | Rich burn-Quick quench-Lean burn |
| RTI | Rayleigh–Taylor Instability |
| SAE | Society of Automotive Engineers |
| SD | Standard Deviation |
| WALE | Wall-Adapting Local Eddy-Viscosity |
| X0 | X = 0 mm section |
| Z0 | Z = 0 mm section |
References
- Straub, D.L.; Casleton, K.H.; Lewis, R.E.; Sidwell, T.G.; Maloney, D.J.; Richards, G.A. Assessment of rich-burn, quick-mix, lean-burn trapped vortex combustor for stationary gas turbines. J. Eng. Gas Turbines Power 2005, 127, 36–41. [Google Scholar] [CrossRef]
- Peterson, C.O.; Sowa, W.A.; Samuelsen, G. Performance of a Model Rich Burn-Quick Mix-Lean Burn Combustor at Elevated Temperature and Pressure; NASA: Washington, DC, USA, 2002. [Google Scholar]
- Bohan, B.T. Analysis of Flow Migration in an Ultra-Compact Combustor. Master’s Thesis, Air Force Institute of Technology, Dayton, OH, USA, 2011. [Google Scholar]
- Lewis, G.D. Combustion in a centrifugal-force field. Symp. (Int.) Combust. 1971, 13, 625–629. [Google Scholar] [CrossRef]
- Lewis, G.D. Centrifugal-force effects on combustion. Symp. (Int.) Combust. 1973, 14, 413–419. [Google Scholar] [CrossRef]
- Lewis, G.D.; Shadowen, J.H.; Thayer, E.B. Swirling Flow Combustion. J. Energy 1977, 1, 201–205. [Google Scholar] [CrossRef]
- Sakai, Y.; Ishiuka, S. The phenomena of flame propagation in a rotating tube. Symp. (Int.) Combust. 1996, 26, 847–853. [Google Scholar] [CrossRef]
- Katta, V.; Blunck, D.; Roquemore, M. Effect of Centrifugal Forces on Flame Stability in an Ultra-Compact Combustor. In Proceedings of the 51st AIAA Aerospace Sciences Meeting Including the New Horizons Forum and Aerospace Exposition, Grapevine, TX, USA, 7–10 January 2013. [Google Scholar]
- Briones, A.M.; Burrus, D.L.; Erdmann, T.J.; Shouse, D.T. Effect of Centrifugal Force on the Performance of High-G Ultra Compact Combustor. In Proceedings of the Asme Turbo Expo: Turbine Technical Conference & Exposition, Montréal, QC, Canada, 15–19 June 2015. [Google Scholar]
- Liu, Y.; Wang, Z.; Tang, H. Numerical Investigation of Turbulent Premixed Combustion in a High Acceleration Field. J. Therm. Sci. Eng. Appl. 2020, 12, 041010. [Google Scholar] [CrossRef]
- Lapsa, A.; Dahm, W. Experimental study on the effects of large centrifugal forces on step-stabilized flames. In Proceedings of the 5th US Combustion Meeting, San Diego, CA, USA, 25–28 March 2007; pp. 3388–3399. [Google Scholar]
- Lapsa, A.P.; Dahm, W.J.A. Hyperacceleration effects on turbulent combustion in premixed step-stabilized flames. Proc. Combust. Inst. 2009, 32, 1731–1738. [Google Scholar] [CrossRef]
- Erdmann, T.J.; Caswell, A.W.; Gutmark, E. Experimental Study of the Impact of High Centrifugal Body Forces on Constant Pressure, Propane-Air Flames. In Proceedings of the AIAA Scitech 2019 Forum, San Diego, CA, USA, 7–11 January 2019. [Google Scholar]
- Sykes, J.; Gallagher, T.; Rankin, B.A. Numerical Design of an Experiment to Investigate Rayleigh-Taylor Instabilities in Reacting Flows. In Proceedings of the AIAA Scitech 2019 Forum, San Diego, CA, USA, 7–11 January 2019. [Google Scholar]
- Driscoll, J.F.; Rasmussen, C.C. Correlation and analysis of blowout limits of flames in high-speed airflows. J. Propuls. Power 2005, 21, 1035–1044. [Google Scholar] [CrossRef]
- Sykes, J.P.; Gallagher, T.P.; Rankin, B.A. Effects of Rayleigh-Taylor instabilities on turbulent premixed flames in a curved rectangular duct. Proc. Combust. Inst. 2021, 38, 6059–6066. [Google Scholar] [CrossRef]
- Rasmussen, C.C.; Driscoll, J.F.; Carter, C.D.; Hsu, K.-Y. Characteristics of cavity-stabilized flames in a supersonic flow. J. Propuls. Power 2005, 21, 765–768. [Google Scholar] [CrossRef]
- Karlovitz, B. Open turbulent flames. Symp. (Int.) Combust. 1953, 4, 60–67. [Google Scholar] [CrossRef]
- Poinsot, T.; Candel, S.; Trouvé, A. Applications of direct numerical simulation to premixed turbulent combustion. Prog. Energy Combust. Sci. 1995, 21, 531–576. [Google Scholar] [CrossRef]
- Poinsot, T.; Echekki, T.; Mungal, M.G. A Study of the Laminar Flame Tip and Implications for Premixed Turbulent Combustion. Combust. Sci. Technol. 1992, 81, 45–73. [Google Scholar] [CrossRef]
- SAE ARP1533B; Procedure for the Analysis and Evaluation of Gaseous Emissions from Aircraft Engines. SAE: Warrendale, PA, USA, 2013.


Disclaimer/Publisher’s Note: The statements, opinions and data contained in all publications are solely those of the individual author(s) and contributor(s) and not of MDPI and/or the editor(s). MDPI and/or the editor(s) disclaim responsibility for any injury to people or property resulting from any ideas, methods, instructions or products referred to in the content. |
© 2024 by the authors. Licensee MDPI, Basel, Switzerland. This article is an open access article distributed under the terms and conditions of the Creative Commons Attribution (CC BY) license (https://creativecommons.org/licenses/by/4.0/).