Abstract
Commercial aircraft fault diagnosis is an important means to ensure the reliability and safety of commercial aircraft. Traditional knowledge-driven and data-driven fault diagnosis methods lack interpretability in engineering mechanisms, making them difficult to promote and apply. To address the issue of lack of interpretability, this paper conducts a fault knowledge graph for commercial aircraft fault diagnosis, using the fault logic in the logic diagram to increase the interpretability of diagnostic work. Firstly, to avoid the inefficiency of logic diagram applications, an executable logic diagram model is established, which can perform mathematical analysis and achieve fault diagnosis and localization using operational data as input. Then, the logic diagram is sorted out to obtain the hidden fault knowledge in the logic diagram, which is used to construct a fault knowledge graph to help achieve cause localization and rapid troubleshooting. The methods proposed in this paper are all validated through case studies of abnormal low-pressure faults in domestic commercial aircraft hydraulic systems. The results show that the logic diagram model can perform model simulation and fault diagnosis based on operational data, and the fault knowledge graph can quickly locate abnormal monitoring parameters and guide troubleshooting work based on existing information.
1. Introduction
Commercial aircraft are industrial products that comprehensively consider safety, reliability, and economy, with safety being the most basic technical requirement for commercial aircraft. Fault diagnosis, as an important technical means to ensure the high safety and reliability of commercial aircraft, includes technical aspects such as fault detection, fault location, and fault isolation [1,2,3]. At present, data-driven proxy model methods [4] and knowledge graph methods based on technical manuals [5] are widely used in commercial aircraft fault diagnosis.
The proxy model method is based on data to establish decision models and support data analysis and feedback, solving practical engineering problems from a data perspective [6,7]. The core of the data-driven approach is data modeling. In the domain of commercial aircraft fault diagnosis, researchers frequently employ methodologies rooted in machine learning and deep learning to construct precise and efficacious predictive models. Shao [8] introduced an enhanced deep forest approach to address the multi-mixed fault scenario in aviation gearboxes with limited data samples. Mallikarjuna [9] leveraged both time-domain and frequency-domain vibration data from aircraft gearboxes, applying long short-term memory (LSTM) network models to achieve robust health monitoring and accurate fault diagnosis. Meanwhile, Liu [10] developed a Bayesian network-based fault diagnosis technique specifically for commercial aircraft’s environmental control systems, offering ground crews an efficient tool for isolating faults within these critical systems. The essence of the above research is to construct an explicit fault diagnosis model based on data, so that the model continuously approaches the implicit relationship between monitoring data and fault states, thereby achieving data-driven fault diagnosis.
Knowledge graph (KG) methodology focuses on structuring expert knowledge [11], maintenance manuals [12], and various technical documents to form a knowledge graph. This endeavor aims to catalyze more expedient and precise identification and diagnostic procedures for faults. The difficulty in constructing a knowledge graph lies in how to accurately extract data entities and relationships from data files. Scholars have also conducted many studies in this field: Xing [13] proposed the BMLSTM (Boyer–Moore long short-term memory network) algorithm for unstructured commercial aircraft fault isolation manuals to efficiently extract manual knowledge. Meng [14] introduced the ERNIE model on the basis of LSTM based on manuals and fault cases, and constructed a fault knowledge graph for aircraft health management. Nie [15] improved the bidirectional long short-term memory network through an attention mechanism, and achieved the construction of fault maps and intelligent question-answering applications for commercial aircraft power systems.
Looking at the above two methods, whether knowledge-based or data-driven, the central focus in the realm of fault diagnosis research is undeniably algorithm optimization, with a strong emphasis on enhancing model accuracy [16] and boosting operational efficiency [17]. However, in terms of specific faults, neither method has good interpretability, making it difficult to effectively promote and apply in engineering [18]. To address the above issues, we should start from the fault logic of commercial aircraft products themselves, and then combine operational data and knowledge graph methods to achieve efficient fault diagnosis.
The main manufacturers of commercial aircraft have sorted out the logic of aircraft failure occurrence through methods such as fault mode and effect analysis [19], fault tree [20], and logic diagram [21]. The bottom layer of the logic diagram is directly or indirectly related to aircraft sensor monitoring data, providing a foundation for combining fault logic with operational data and conducting fault diagnosis work. Ground crews usually use logic diagrams to infer all possible causes of a fault and troubleshoot them one by one when the fault isolation manual cannot solve a certain fault. Given the inefficiency of manual reasoning, this paper establishes a Simulink mathematical model based on logic diagrams to provide efficient and accurate decision-making models for aircraft operation data, thereby supporting rapid troubleshooting and fault location of commercial aircraft. At the same time, in order to effectively apply the knowledge of the above fault causes and triggering conditions, a knowledge graph is used to integrate the logical information in the logic diagram, supporting the retrieval and localization of fault causes without data support.
The main work of this article is organized as follows: Firstly, in Section 2, we introduce the mathematical modeling methods of logic diagrams and the basic theory of knowledge graphs. Subsequently, in Section 3, we illustrate our approach by developing a fault logic diagram model, using characteristic failures in the hydraulic systems of commercial aircraft as a practical scenario. This model facilitates fault diagnosis and localization by leveraging operational data in tandem with logic diagram representations. Then, in Section 4, based on the logic diagram, possible reasons for faults and monitoring parameters are sorted out, and a knowledge graph is established between monitoring parameters, fault reasons, and fault types. The application of knowledge graph in commercial aircraft fault diagnosis was explored. Finally, Section 5 summarizes the work of the paper.
2. Basic Theory
2.1. Logic Diagram and Mathematical Modeling
Airbus used Electronic Centralized Aircraft Monitoring (ECAM) for the first time on its A310 aircraft [22]. ECAM serves as a centralized monitoring, alarm, and decision feedback system, reducing the operational pressure on pilots and effectively improving flight safety and reliability. However, the introduction of electronic systems has brought enormous challenges to ground crew handling in fault diagnosis work [23]. For this purpose, Airbus launched the ECAM System Logic Data (ESLD) manual [24], sorting out the underlying logic of detectable faults, which details the working logic, operation, and troubleshooting procedures of the ECAM system and its related components, providing assistance for ground crew to conduct fault isolation and maintenance decisions. At present, Airbus has built a full aircraft ESLD manual for A318–A321 models, which includes 1693 detectable faults in various ATA chapters [25].
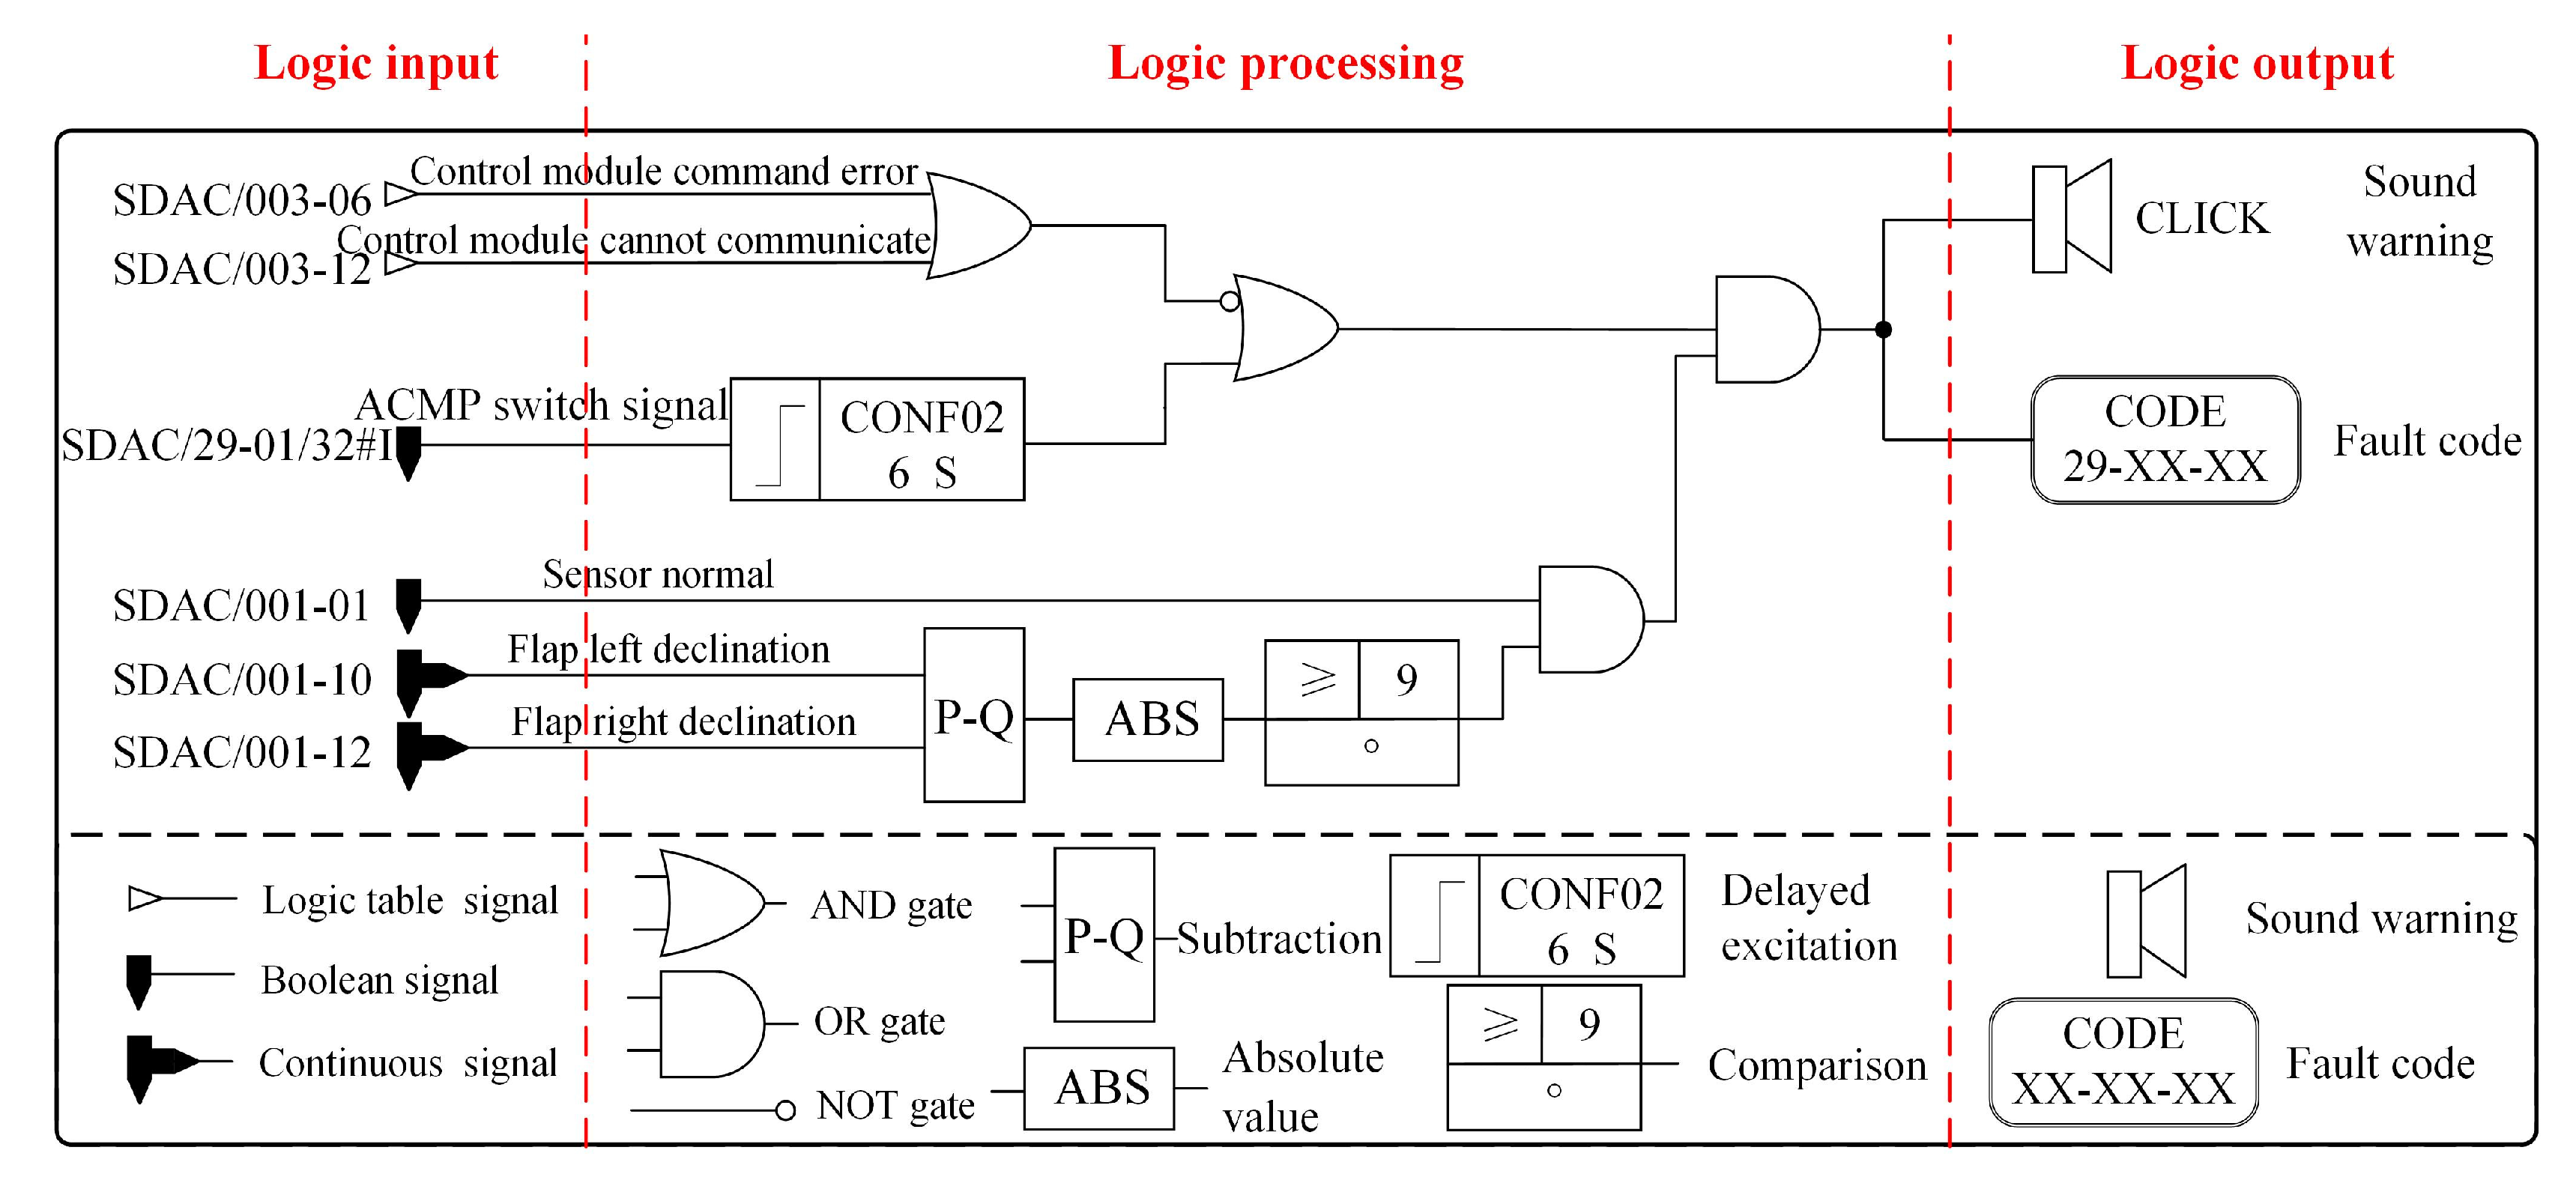
The logic diagram includes three parts: logic input, logic processing, and logic output. Figure 1 shows the main structural information of the logic diagram. There are three forms of logic inputs: Boolean input, continuous input, and logic table input. Boolean and continuous input are usually aircraft monitorable parameters, while logic table input is the logic output of a certain sub-level logic diagram. The implementation of logic processing is based on logic components such as AND gates, OR gates, delayed excitation, conditional judgment, and so on. Logic output refers to the current fault alarm form, such as sound warning, visual warning, etc. Ground crew will check the ECAM alarm records after the flight ends, find the fault information that has occurred, and carry out fault inference and manual troubleshooting based on the logic diagram.
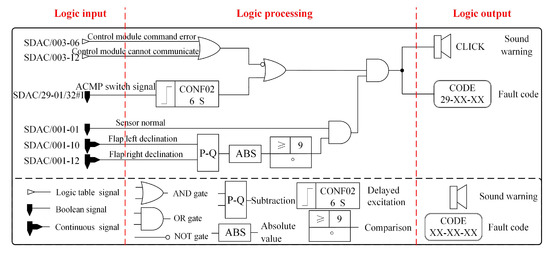
Figure 1.
Schematic diagram of the main structure of the logic diagram.
To further improve the efficiency of fault diagnosis based on logic diagrams, a mathematical model of logic diagrams can be established using Simulink. The model can use aircraft Quick Access Recorder (QAR) data as input for model data processing and fault diagnosis analysis. The general steps for constructing an electronic logic diagram model based on Simulink are as follows:
(1) Input component modeling and design: In Simulink, input components can be defined through the From WorkSpace component provided by the system, and different input components are distinguished by component names and input parameter types.
(2) Logic processing component modeling and design: There are logic components such as AND gates, OR gates, and NOT gates in the Simulink logic component library that can be directly called and processed. However, for logic components that are not available in Simulink, such as conditional judgment and delayed excitation, Simulink also supports custom component design. By establishing Function components and defining the mathematical relationship between their inputs and outputs, new logic components can be constructed. Taking conditional judgment logic components as an example, their mathematical relationship can be defined as:
where Xi is the input timing data, Yi is the output timing data after conditional judgment, and i is time, counted every second. The conditional judgment component uses 40 Kt as the judgment condition. If it is greater than or equal to 40 Kt, the output is one. Otherwise, the output is zero. The conditional judgment component is mostly used to process continuous input data at the bottom of a logic diagram, converting them into fault logic for backward transmission.
(3) Output component modeling and design: In the logic diagram model, it is not possible to directly construct components such as sound warning and visual warning. Usually, signal output components in Simulink are used to record output data curves, which can intuitively reflect the fault status.
2.2. Knowledge Graph
The notion of knowledge graphs dates back to the 1950s, with initial research efforts centered around semantic networks [26], an approach that intuitively depicts relationships among entities. The concept gained widespread public recognition in 2012, following the introduction of Google’s Knowledge Graph [27]—an initiative aimed at enhancing search engine intelligence. Its objective is to refine query understanding and deliver more accurate, direct responses by interpreting the semantic context of user inquiries.
A knowledge graph can be formally defined as a graph-based data structure comprising entities, relations, and attributes. Mathematically, this structure can be represented as a collection of triples:
where E denotes the set of entities, and P represents the set of relations. The triplet (h, r, t) signifies a fact, wherein the head entity h is linked to the tail entity t via the relation r.
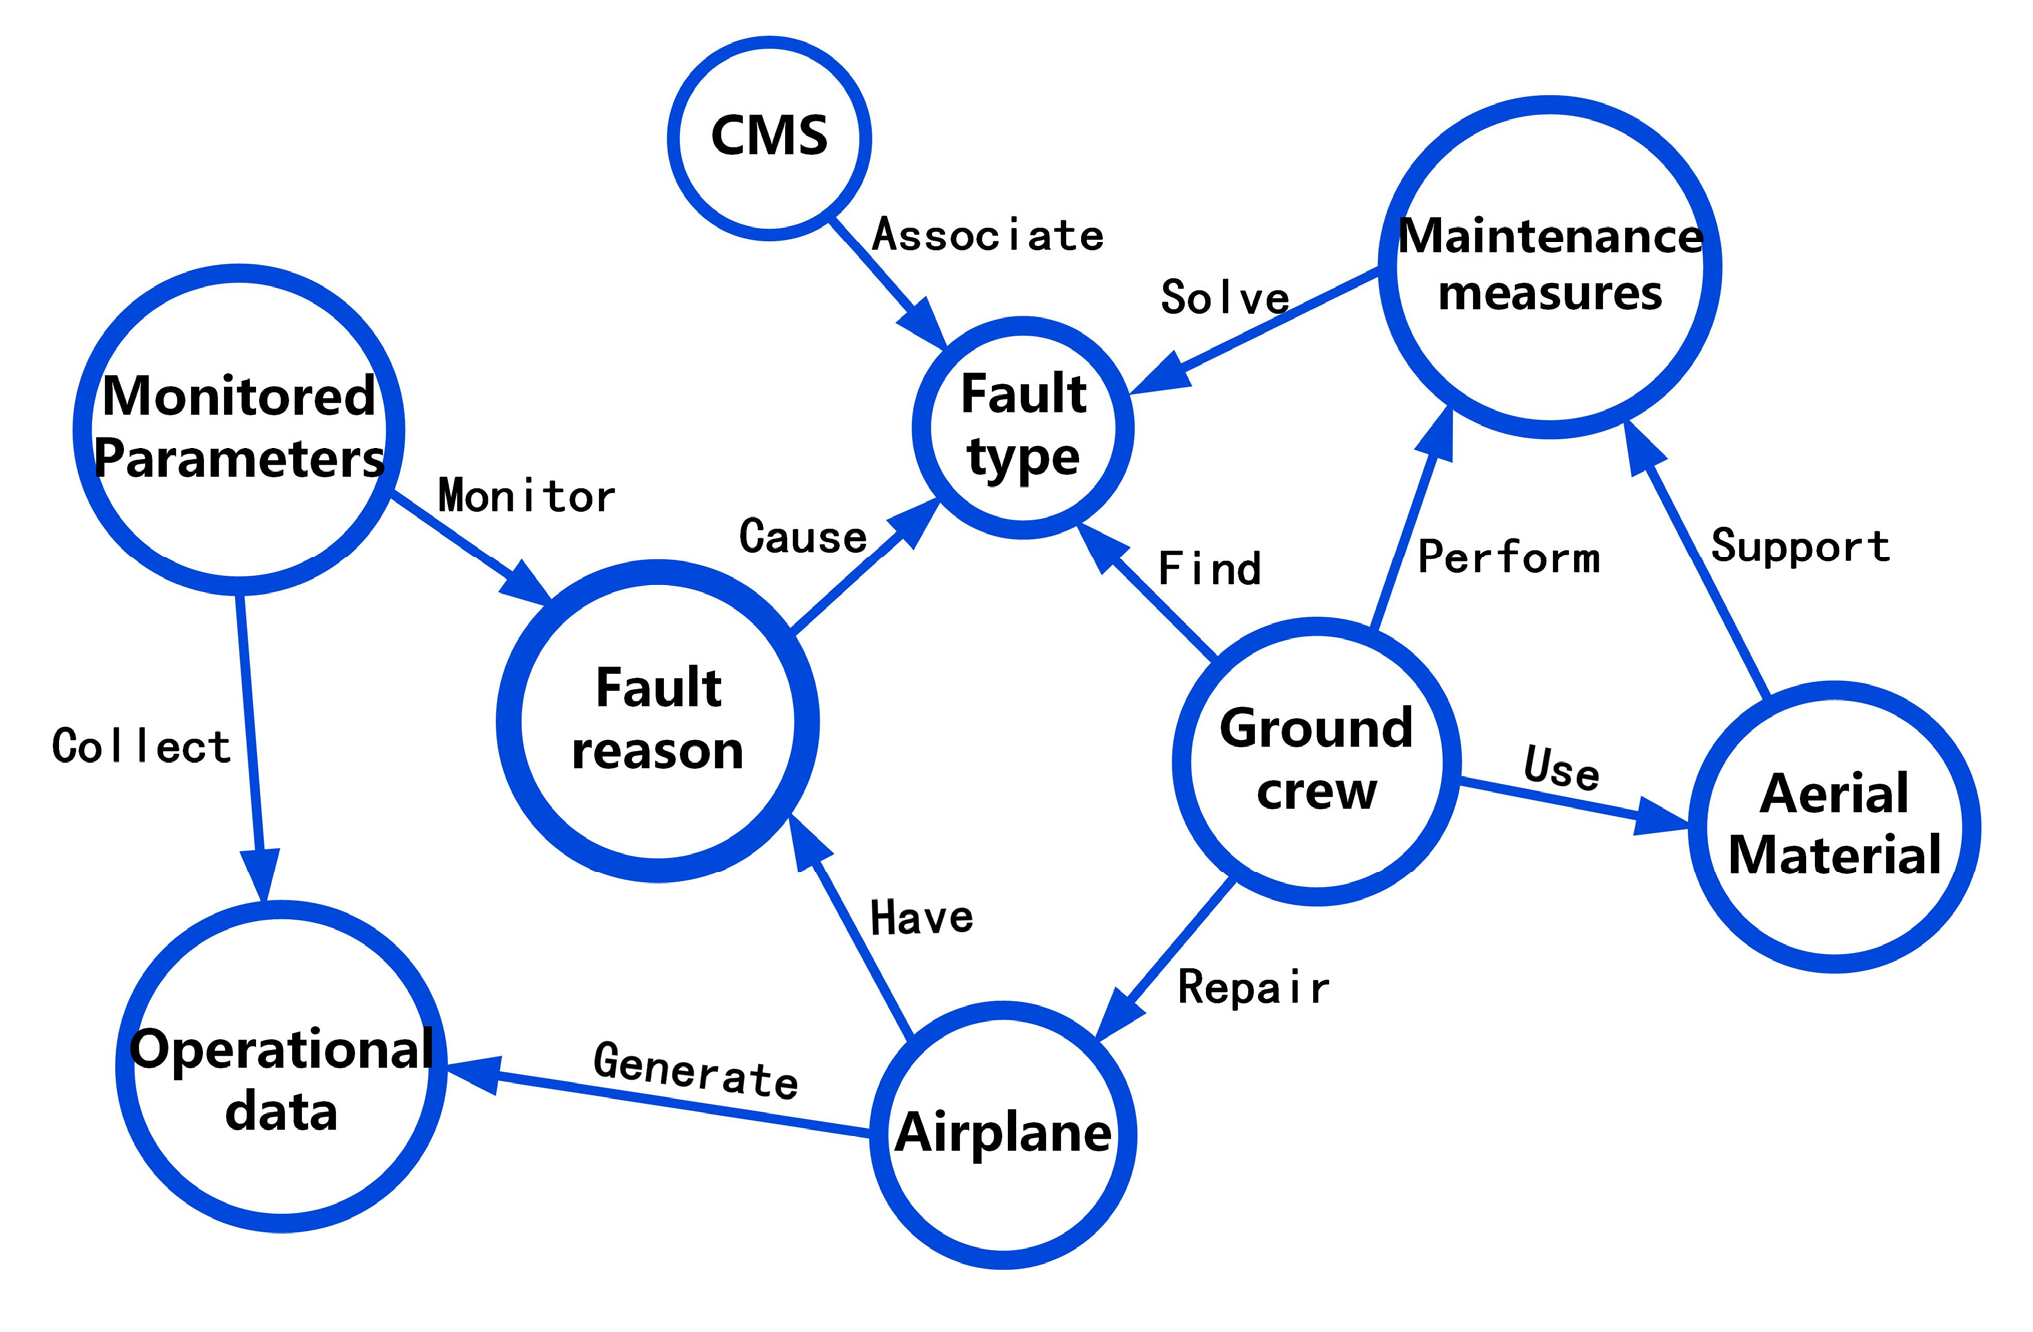
The graphical content of a knowledge graph mainly consists of nodes, edges, and properties. The partial graph content involved in the field of commercial aircraft fault diagnosis is shown in Figure 2. The circular shape in the graph is used to represent nodes, which represent entities in the knowledge graph. They can be concrete things or abstract concepts, and each node has a unique identifier to distinguish different entities in the graph. Edge represents the relationship between nodes, with each edge having a direction pointing from one node to another, indicating some kind of relationship between the previous node and the next node. Attributes can be attached to nodes or edges to provide additional information.
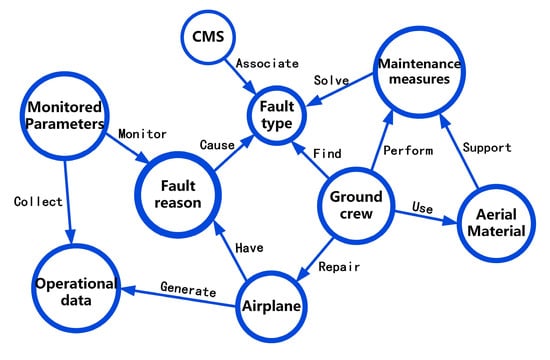
Figure 2.
Graphical structure of knowledge graph.
2.3. Proposed Method
To address the lack of interpretability in data-driven and knowledge-driven fault diagnosis methodologies, our study employs the fault logic diagrams of commercial aircraft for diagnostic analysis and the construction of a knowledge graph. The technical approach outlined in this paper is depicted in Figure 3. As illustrated, we initially selected the fault logic diagrams pertinent to typical systems of commercial aircraft and collected operational data specifically targeting the underlying monitoring parameters indicated by these diagrams. Subsequently, to enhance the efficiency of applying the logic diagrams and circumvent the inefficiencies of technical manuals reasoning, we established executable models of the logic diagrams using Simulink. The collected operational data serve as inputs to these models, enabling automated fault diagnosis procedures. Finally, the fault logic embedded within the diagrams allows us to infer combinations of monitoring parameters, intermediate faults, and top-level system faults that could potentially lead to a fault. These three elements serve as knowledge inputs for the development of a commercial aircraft fault diagnosis knowledge graph, thereby encapsulating the aforementioned diagnostic efforts in graphical form for convenient reuse, thus eliminating redundant model simulation tasks in future applications.
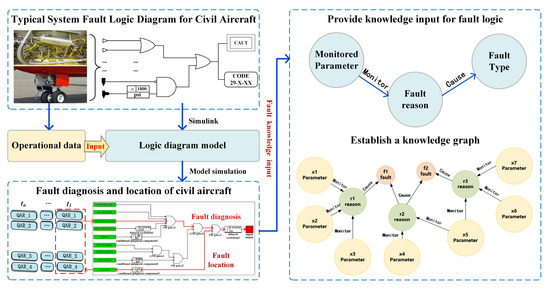
Figure 3.
Technical roadmap of the proposed method.
3. Cases Analysis of Fault Diagnosis Based on Logic Diagram Model
This Section takes the ARJ21 aircraft 1# hydraulic system as the analysis object, constructs a fault logic diagram for its abnormal low-pressure fault, uses Simulink to establish a mathematical model of the logic diagram, and combines aircraft QAR data to carry out fault diagnosis and location.
3.1. Logic Diagram of Abnormal Low-Pressure Fault in 1# Hydraulic System
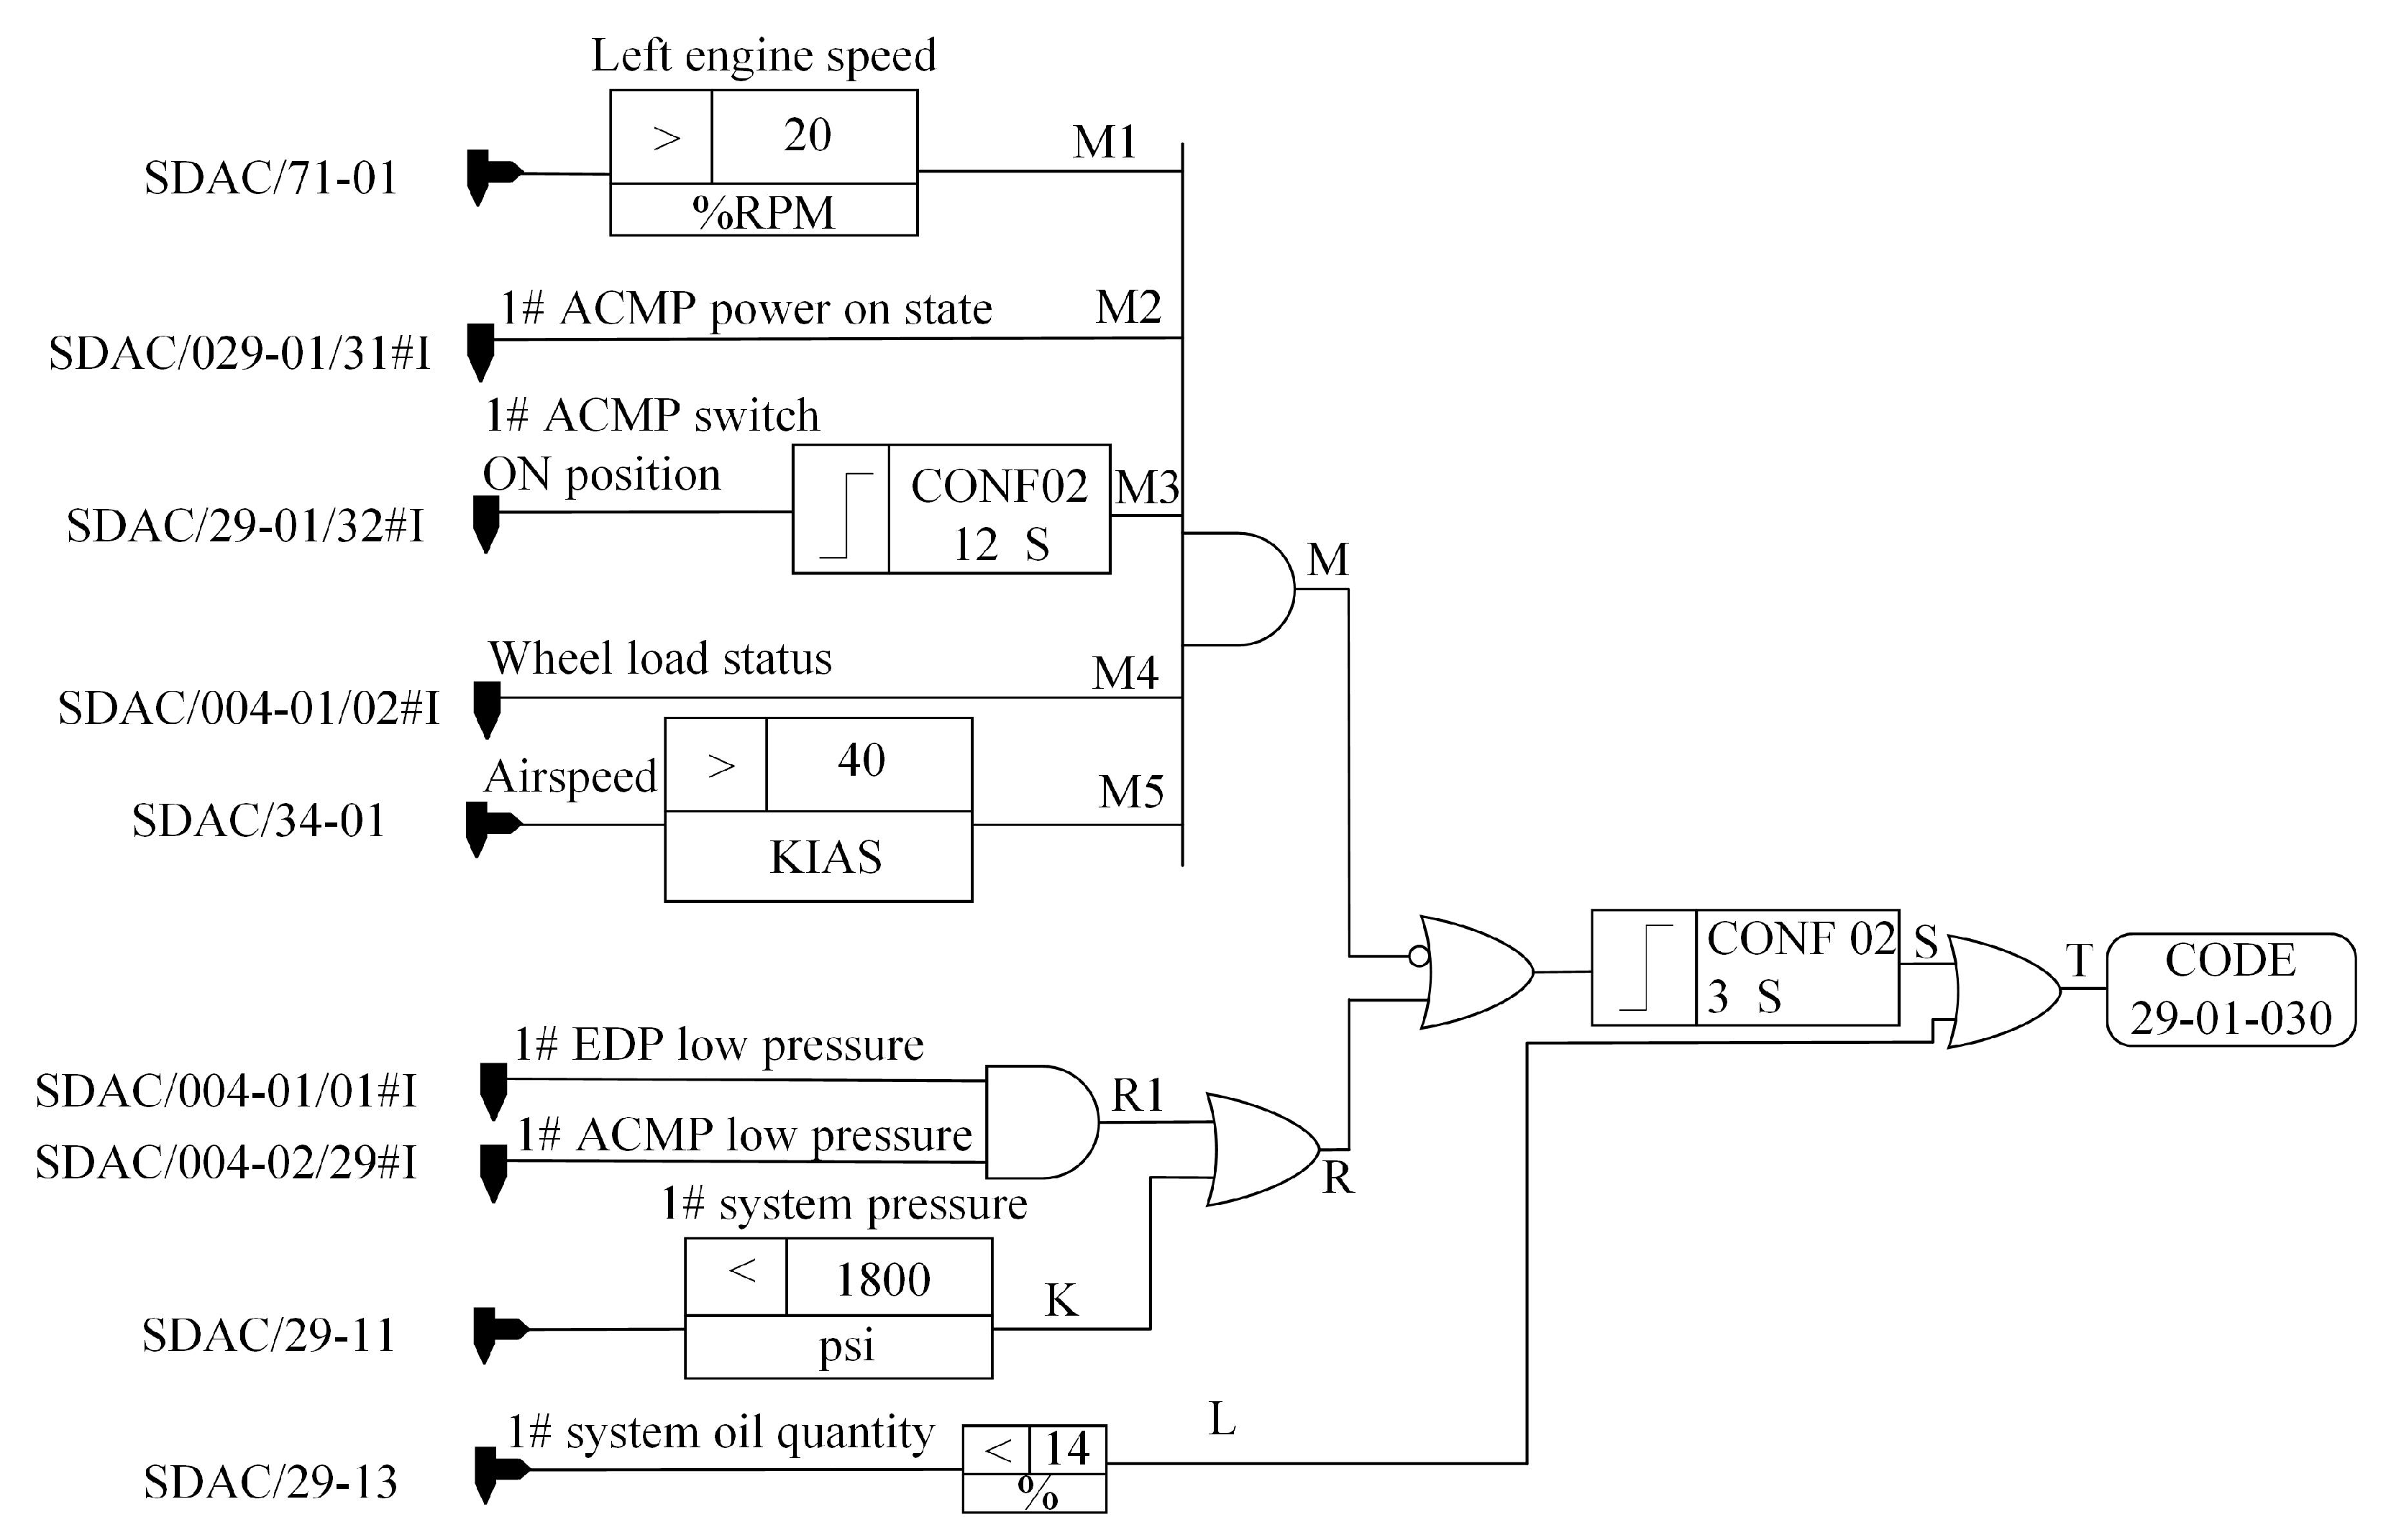
The establishment process of the commercial aircraft fault logic diagram is as follows: firstly, conduct functional hazard analysis, fault mode and effect analysis, and fault tree analysis to determine monitoring faults, fault causes, and fault transmission logic, respectively. Then, determine the sensor types and monitored parameters of the underlying fault triggers combined with the Engine Indicating and Crew Warning System (EICAS) manual. Finally, a logic diagram is established based on the monitoring parameters and fault logic of the underlying sensors. The logic diagram of an ARJ21 aircraft 1# hydraulic system abnormal low-pressure fault established based on the above process is shown in Figure 4. As shown in Figure 4, it can be seen that the nine monitoring parameters that cause abnormal low pressure in the 1# hydraulic system are left engine speed, 1# AC Motor Pump (ACMP) power on status, 1# ACMP switch ON status, aircraft wheel load status, airspeed, 1# Engine Driven Pump (EDP) low-pressure status, 1# ACMP low-pressure status, 1# system pressure, and 1# hydraulic system oil quantity.
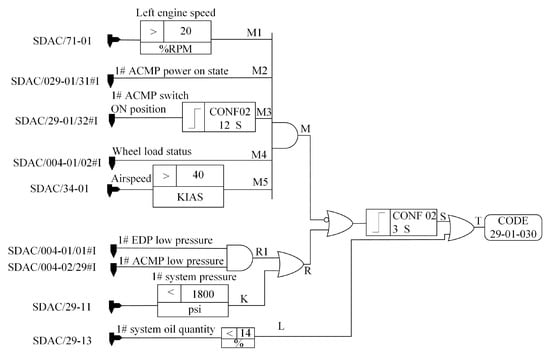
Figure 4.
Logic diagram of abnormal low-pressure fault in 1# hydraulic system.
3.2. Mathematical Modeling of Abnormal Low-Pressure Logic Diagram
Based on the logic diagram of abnormal low-pressure faults in the 1# hydraulic system, fault monitoring parameters and fault transmission logic can be determined. However, the logic diagram is usually used for logical reasoning and cannot be directly used for data analysis and fault diagnosis based on QAR data. Therefore, it is necessary to establish a logic diagram model of abnormal low-pressure faults in the 1# hydraulic system based on Simulink.
The underlying monitoring inputs in the logic diagram ultimately need to be transformed into Boolean values for backward transmission. Therefore, for the four continuous variables at the bottom, it is necessary to customize conditional judgment components in the model to transform continuous parameters into Boolean values. Taking the continuous monitoring parameter of left engine speed as an example, when the engine speed exceeds 20%, the output is one, otherwise, the output is zero. The mathematical relationship of the custom left engine speed condition judgment component in the model is shown in Equation (3).
The other five Boolean monitoring parameters can be directly passed back, but for the parameter “1# ACMP switch ON status”, its duration needs to be determined and judged. Therefore, a custom delay excitation element is needed to process this monitoring parameter. The mathematical relationship of the delay excitation element defined as “whether ACMP is in the ON position for 12 consecutive seconds” is shown in Equation (4), which means that when ACMP is continuously started for 12 s, the output Boolean value one is passed back, otherwise the output is zero.
When the logic diagram ultimately triggers a fault, it is also necessary to use delayed excitation elements to isolate abnormal data. The abnormal low-pressure fault is triggered only when the logic diagram outputs one continuously for 3 s, otherwise, the fault will not be triggered. At the same time, to highlight the fault information, after triggering the fault with a delay of 3 s, the fault information is highlighted by outputting five. The mathematical relationship of custom components triggered by fault delay is shown in Equation (5).
In addition to custom components, Simulink has built-in logic processing components such as AND gates, OR gates, and NOT gates, and supports quick setting of input components. Therefore, a logic diagram model for abnormal low pressure in the 1# hydraulic system can be quickly established based on Simulink, as shown in Figure 5.
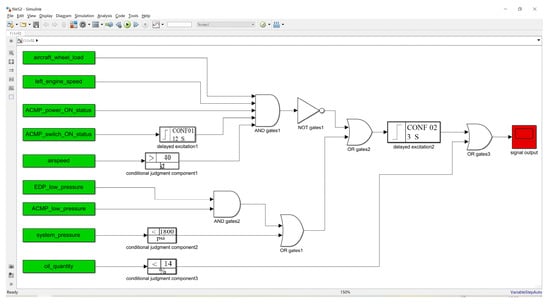
Figure 5.
Logic diagram model for abnormal low-pressure fault based on Simulink.
3.3. Diagnosis and Localization of Abnormal Low-Pressure Fault
During the post-flight inspection of a certain flight, the ARJ21 crew of a certain airline discovered abnormal low-pressure fault alarm information in the 1# hydraulic system. The ground crew obtained aircraft operation data from the quick access recorder and screened 9 monitoring parameters that caused low-pressure faults, totaling 8432. Among them, there are differences in the recording format of the monitoring data of Boolean parameters, such as the recording format of “1# ACMP power on status” and “1# ACMP switch ON status” being ON/OFF. The recording format for “aircraft wheel load status” is GND/AIR. The recording format for “1# ACMP low-pressure status” and “1# EDP low-pressure status” is LOW/NOT-LOW. For the convenience of the logic diagram model to make logical judgments on Boolean inputs, it is necessary to unify the different record formats mentioned above into 0/1 form. Therefore, “ON/AIR/LOW” should be changed to “1”, while others should be changed to “0”.
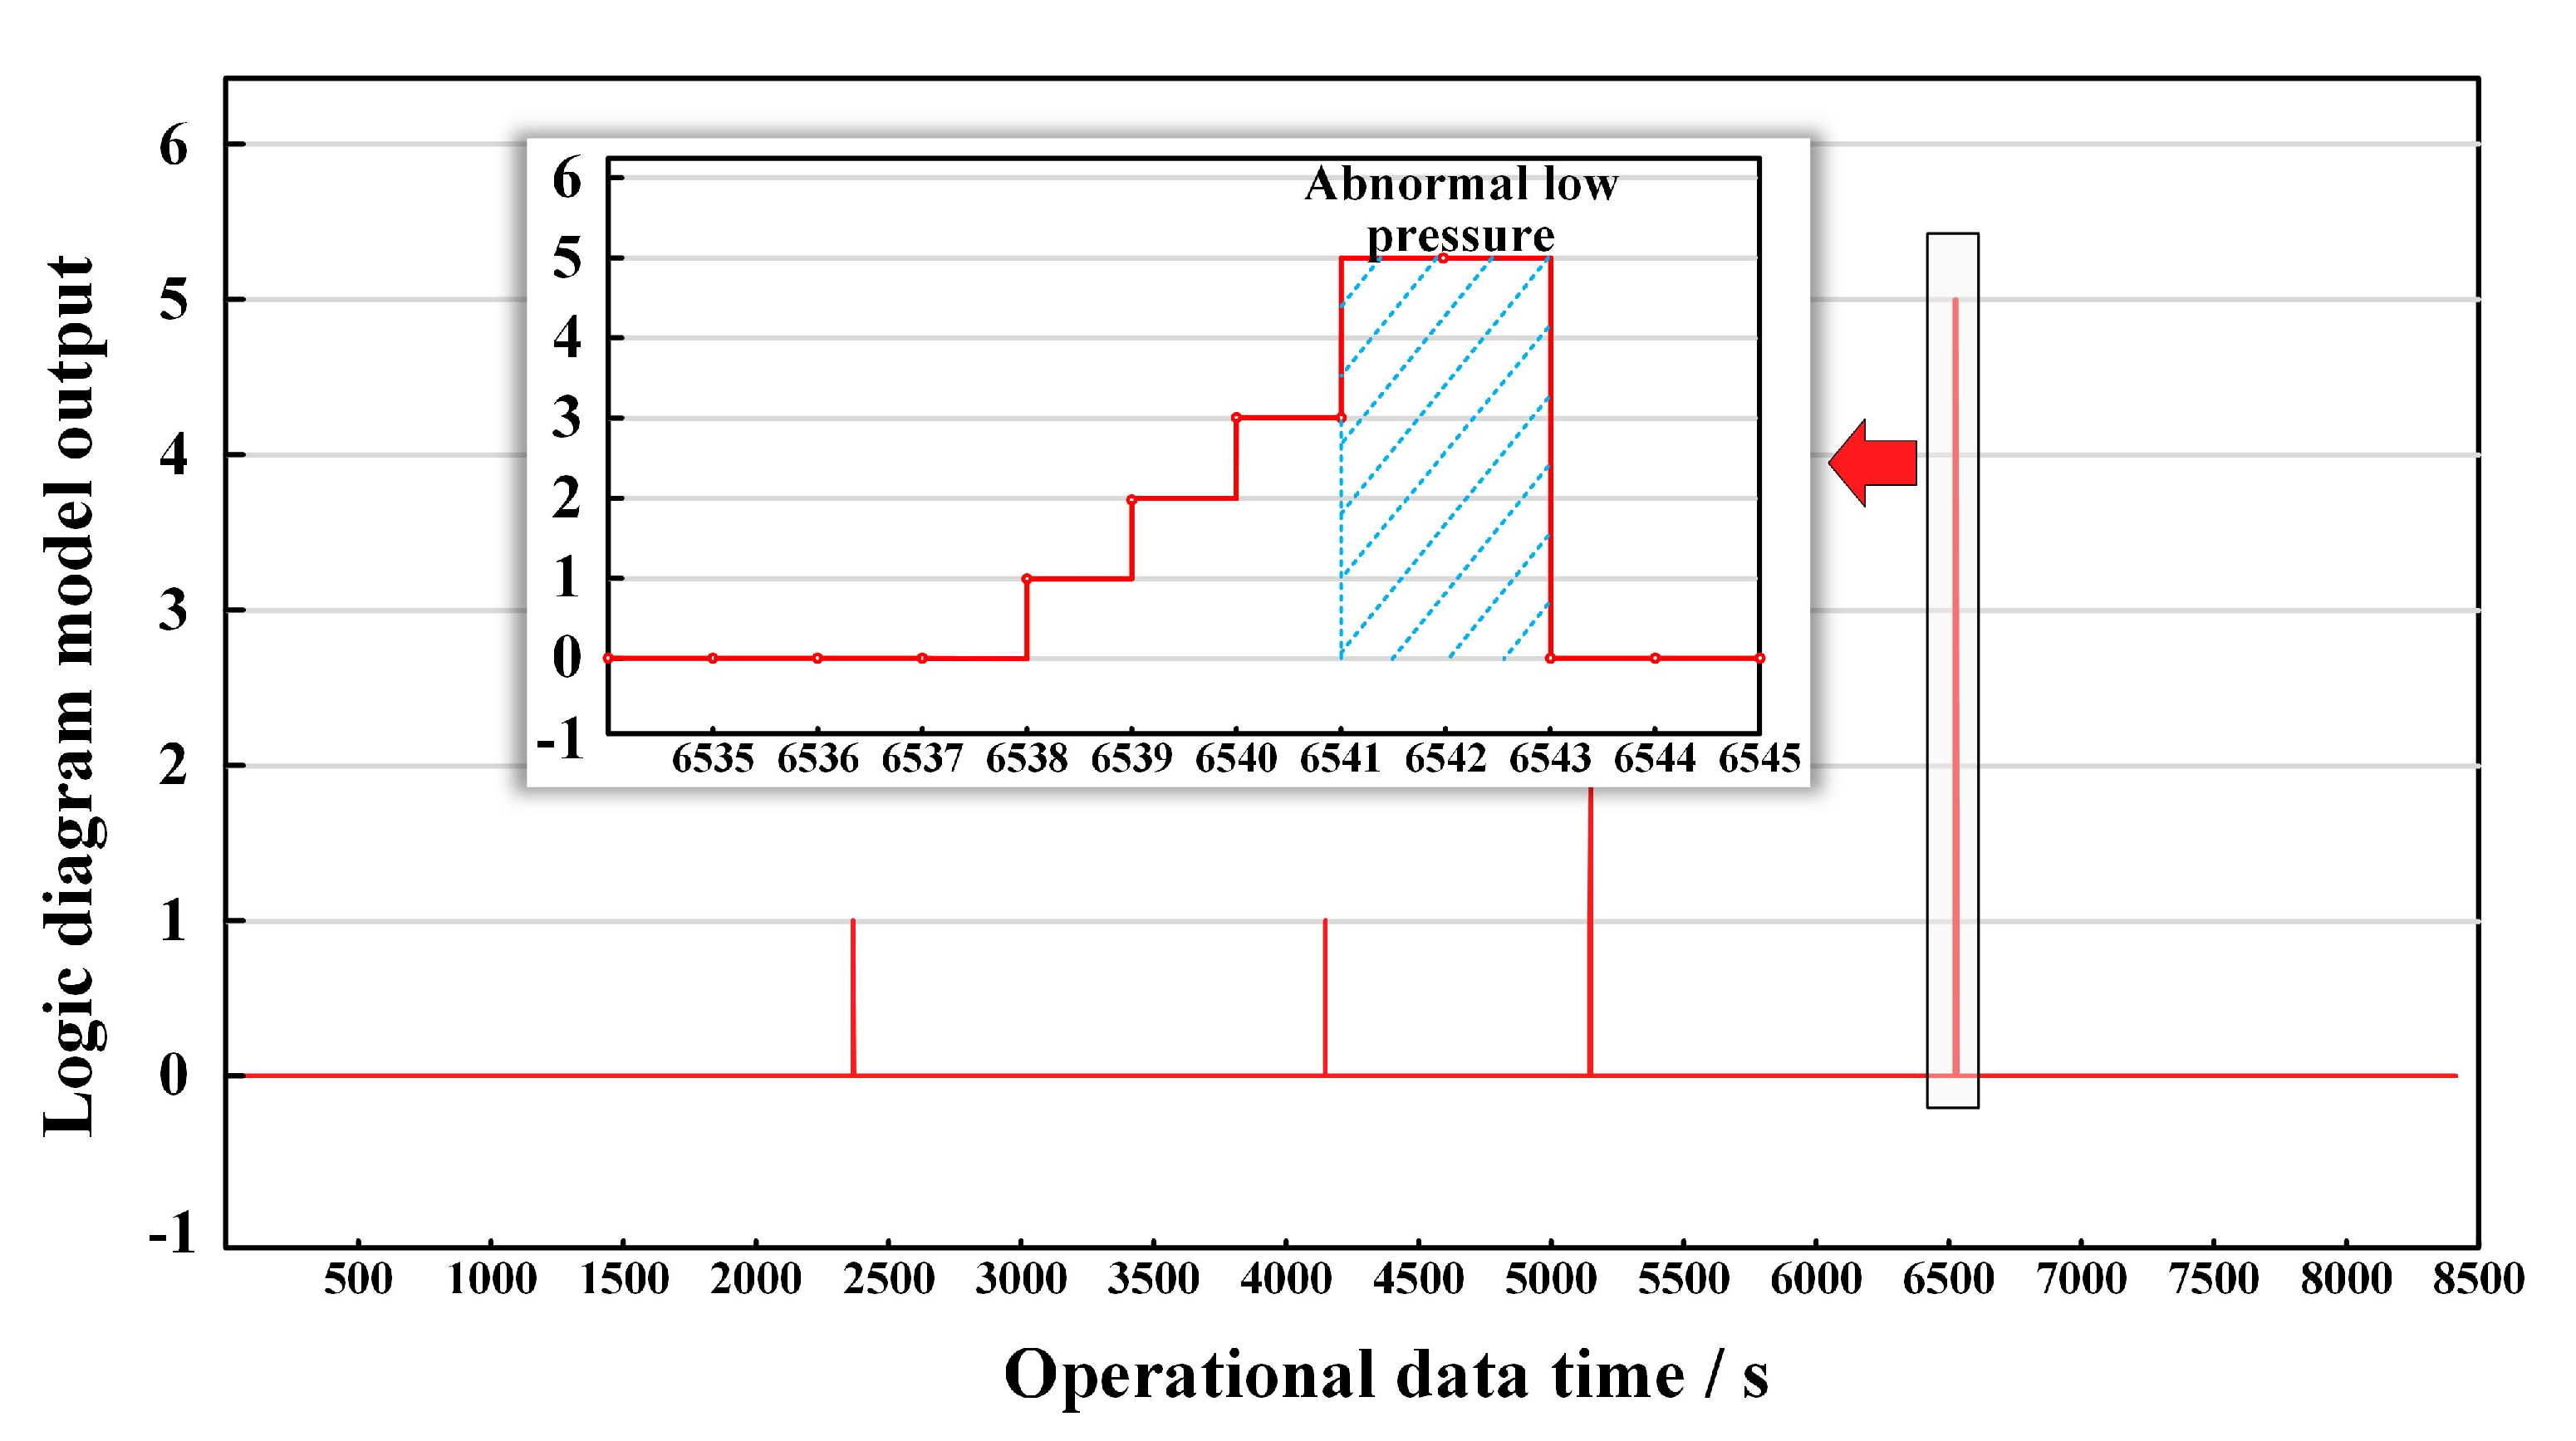
Then, call QAR data in MATLAB as the model input of abnormal low-pressure logic diagram, run the logic diagram model to carry out data analysis and fault diagnosis, and use the “signal output” component to record the model output. The output results of QAR data after fault diagnosis through a logic diagram are shown in Figure 6.
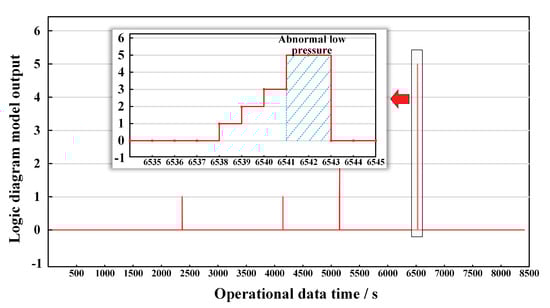
Figure 6.
QAR data fault logic analysis output results.
As is shown in Figure 6, it can be seen that the aircraft began to experience malfunctions during Flight 6538, and an abnormal low-pressure fault occurred during Flight 6541, until the fault disappeared during Flight 6543. Nine monitoring data items corresponding to flight times 6538–6543 were selected from the operating data, as shown in Table 1.

Table 1.
QAR parameter data information table at Flight 6538–6543.
The out-of-limit and abnormal situations of the nine monitoring data items were judged: all nine monitoring parameters have normal parameter ranges, such as the reasonable parameter range for “EDP low pressure” should be zero. However, the EDP low-pressure monitoring parameters in the table below are all one from 6538s to 6542s, which triggered a hydraulic system low-pressure fault. Therefore, fault location can be carried out for the low-pressure factor of EDP, and problems such as EDP failure itself and EDP pressure switch failure can be investigated.
4. Construction and Application of Fault Knowledge Graph
This Section uses a knowledge graph to record the knowledge information in the fault logic diagram, forming a fault knowledge base to help ground personnel achieve rapid troubleshooting and cause localization, thereby avoiding unnecessary model simulation work. This Section first summarizes the fault knowledge based on the logical diagram model fault diagnosis results, including monitoring parameters, intermediate faults, and top-level fault entities and their relationships. Then, the Neo4j graph database management system is used to establish a fault knowledge graph, achieving visual display and knowledge storage of the graph. Finally, based on the Cypher query language in Neo4j, the intermediate faults and monitoring parameters are queried corresponding to a certain fault to verify the effectiveness of the knowledge graph.
4.1. Fault Knowledge
Fault knowledge, as input to the fault knowledge graph, can be obtained from the logic diagram. In the third Section, we input operational data into the logic diagram model to monitor which monitoring parameters may cause faults, forming a complete fault knowledge. This process requires a batch of abnormal operation data each time to obtain fault knowledge. Therefore, if we want to obtain all the fault knowledge through operation data, we need a huge amount of data and workload. In order to obtain fault knowledge more efficiently, we can locate abnormal parameter combinations from the perspective of logical reverse reasoning, thereby avoiding the huge workload of data simulation.
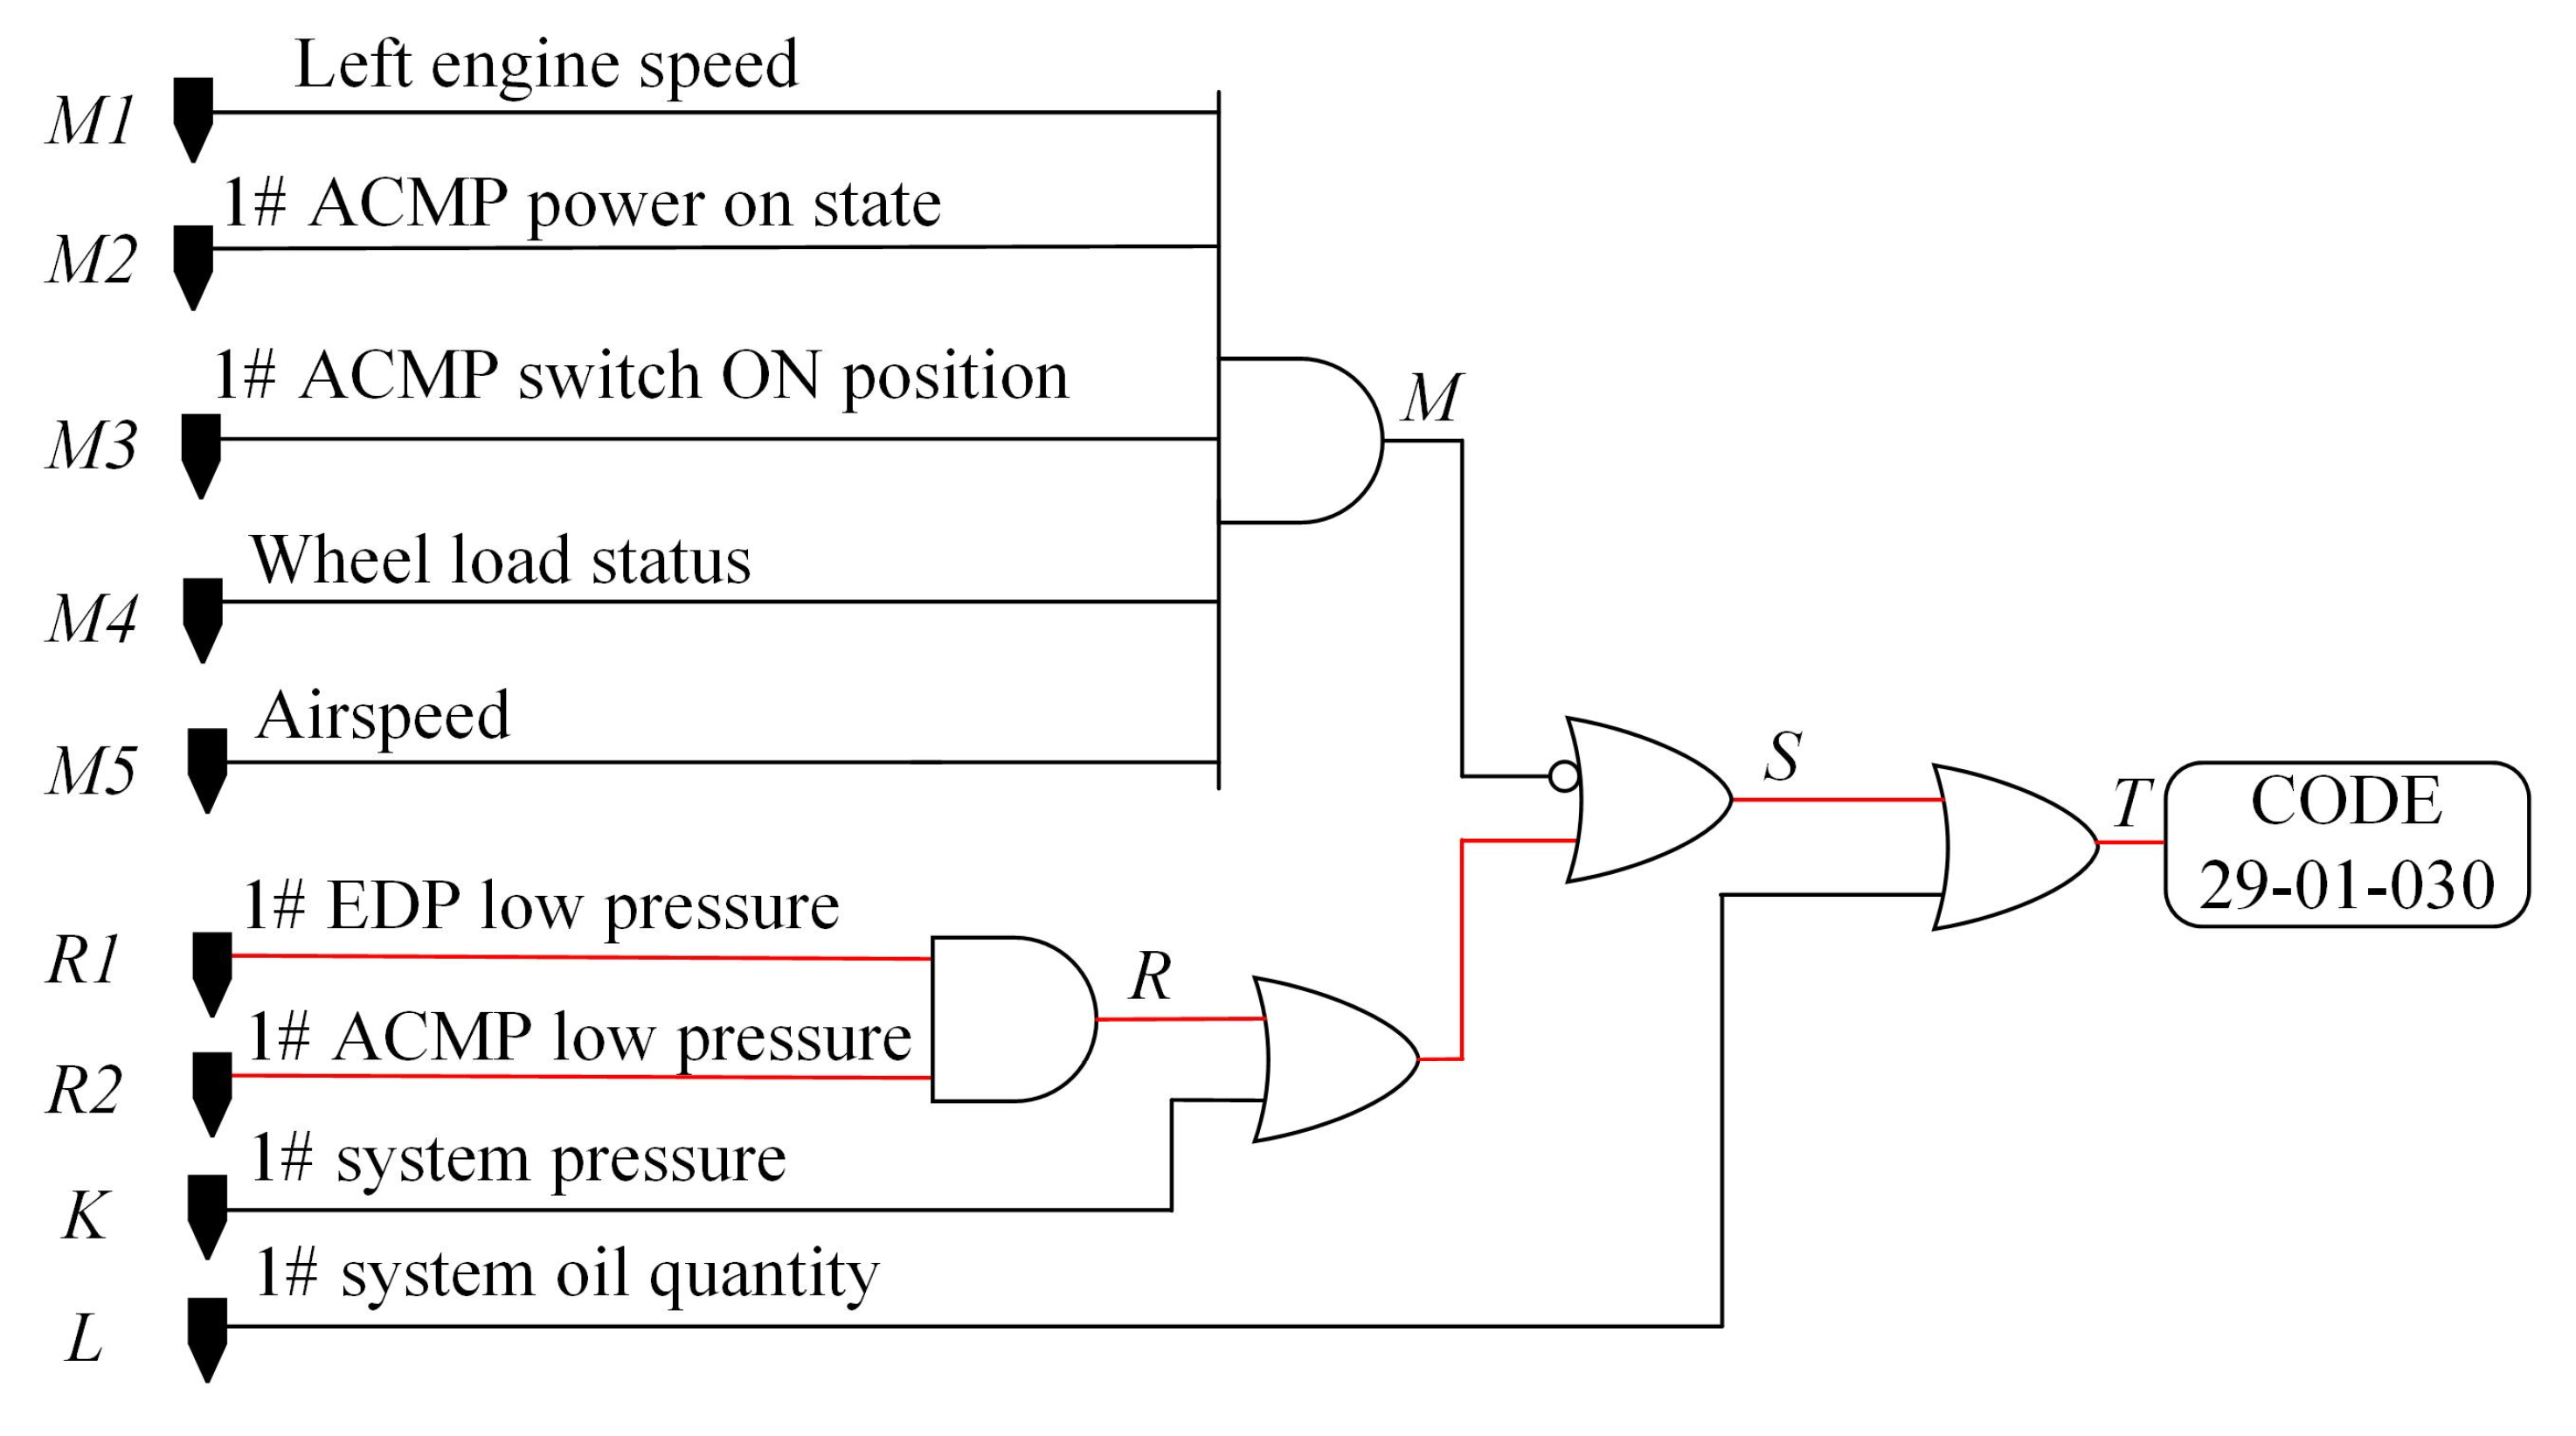
In order to efficiently obtain all possible combinations of abnormal parameters that may cause faults, we use a logic diagram to infer possible combinations of abnormal parameters in reverse. As shown in Figure 7, nodes M, R, K, and L are associated with faults through a series of OR gates. Therefore, the occurrence of one or more of nodes M, R, K, and L can lead to faults. The possible combinations of four nodes are shown in Table 2. The fault combinations given in Table 2 are composed of nodes M, R, K, and L, where nodes K and L are only related to one monitoring parameter. Node R is associated with monitoring parameters R1 and R2 through AND gates. When both R1 and R2 have data anomalies, it will cause an R fault. So, there is only one abnormal parameter situation that causes the failure of nodes R, K, and L. However, for node M, it is associated with five monitoring parameters M1, M2, M3, M4, and M5 through an OR gate. Therefore, if any one or more of the five nodes have abnormal data, it will cause M to occur, leading to the failure. Therefore, unlike nodes R, K, and L, node M includes 31 different combinations of abnormal parameters.

Figure 7.
Assumed logic diagram and combination of fault causes.
Table 2.
Fault cause combination and probability table.
In Table 2, there are eight types of node combinations that include M nodes. Considering that there may be 31 abnormal parameter combinations for the occurrence of M nodes, there are 248 (8 × 31) abnormal parameter combinations for these 8 node combinations. At the same time, considering the other seven node combinations in Table 2, they are only related to seven parameter combinations. Therefore, there are a total of 255 abnormal parameter combinations that occurred in the case logic diagram. The above 255 combinations of abnormal parameters will be used as inputs to construct a fault knowledge graph.
4.2. Fault Knowledge Graph
For the above fault combinations, a knowledge graph can be further established. The two types of triplet information required to establish the graph are <monitoring parameters, monitor, fault reason> and <fault reason, cause, fault type>. The monitoring parameters in this case are one or more of the nine monitoring parameters involved in the abnormal low pressure, and the fault type is the abnormal low-pressure fault. The fault reason is the four intermediate faults in the logic diagram, namely, mechanical failure, hydraulic pump failure, low oil level, and low-pressure output. Taking the case in Figure 7 as an example, the fault knowledge involved is as follows: the monitoring parameters are “1# EDP low pressure” and “1# ACMP low pressure”, the fault reason is “low-pressure output”, and the fault type is “abnormal low-pressure fault”.
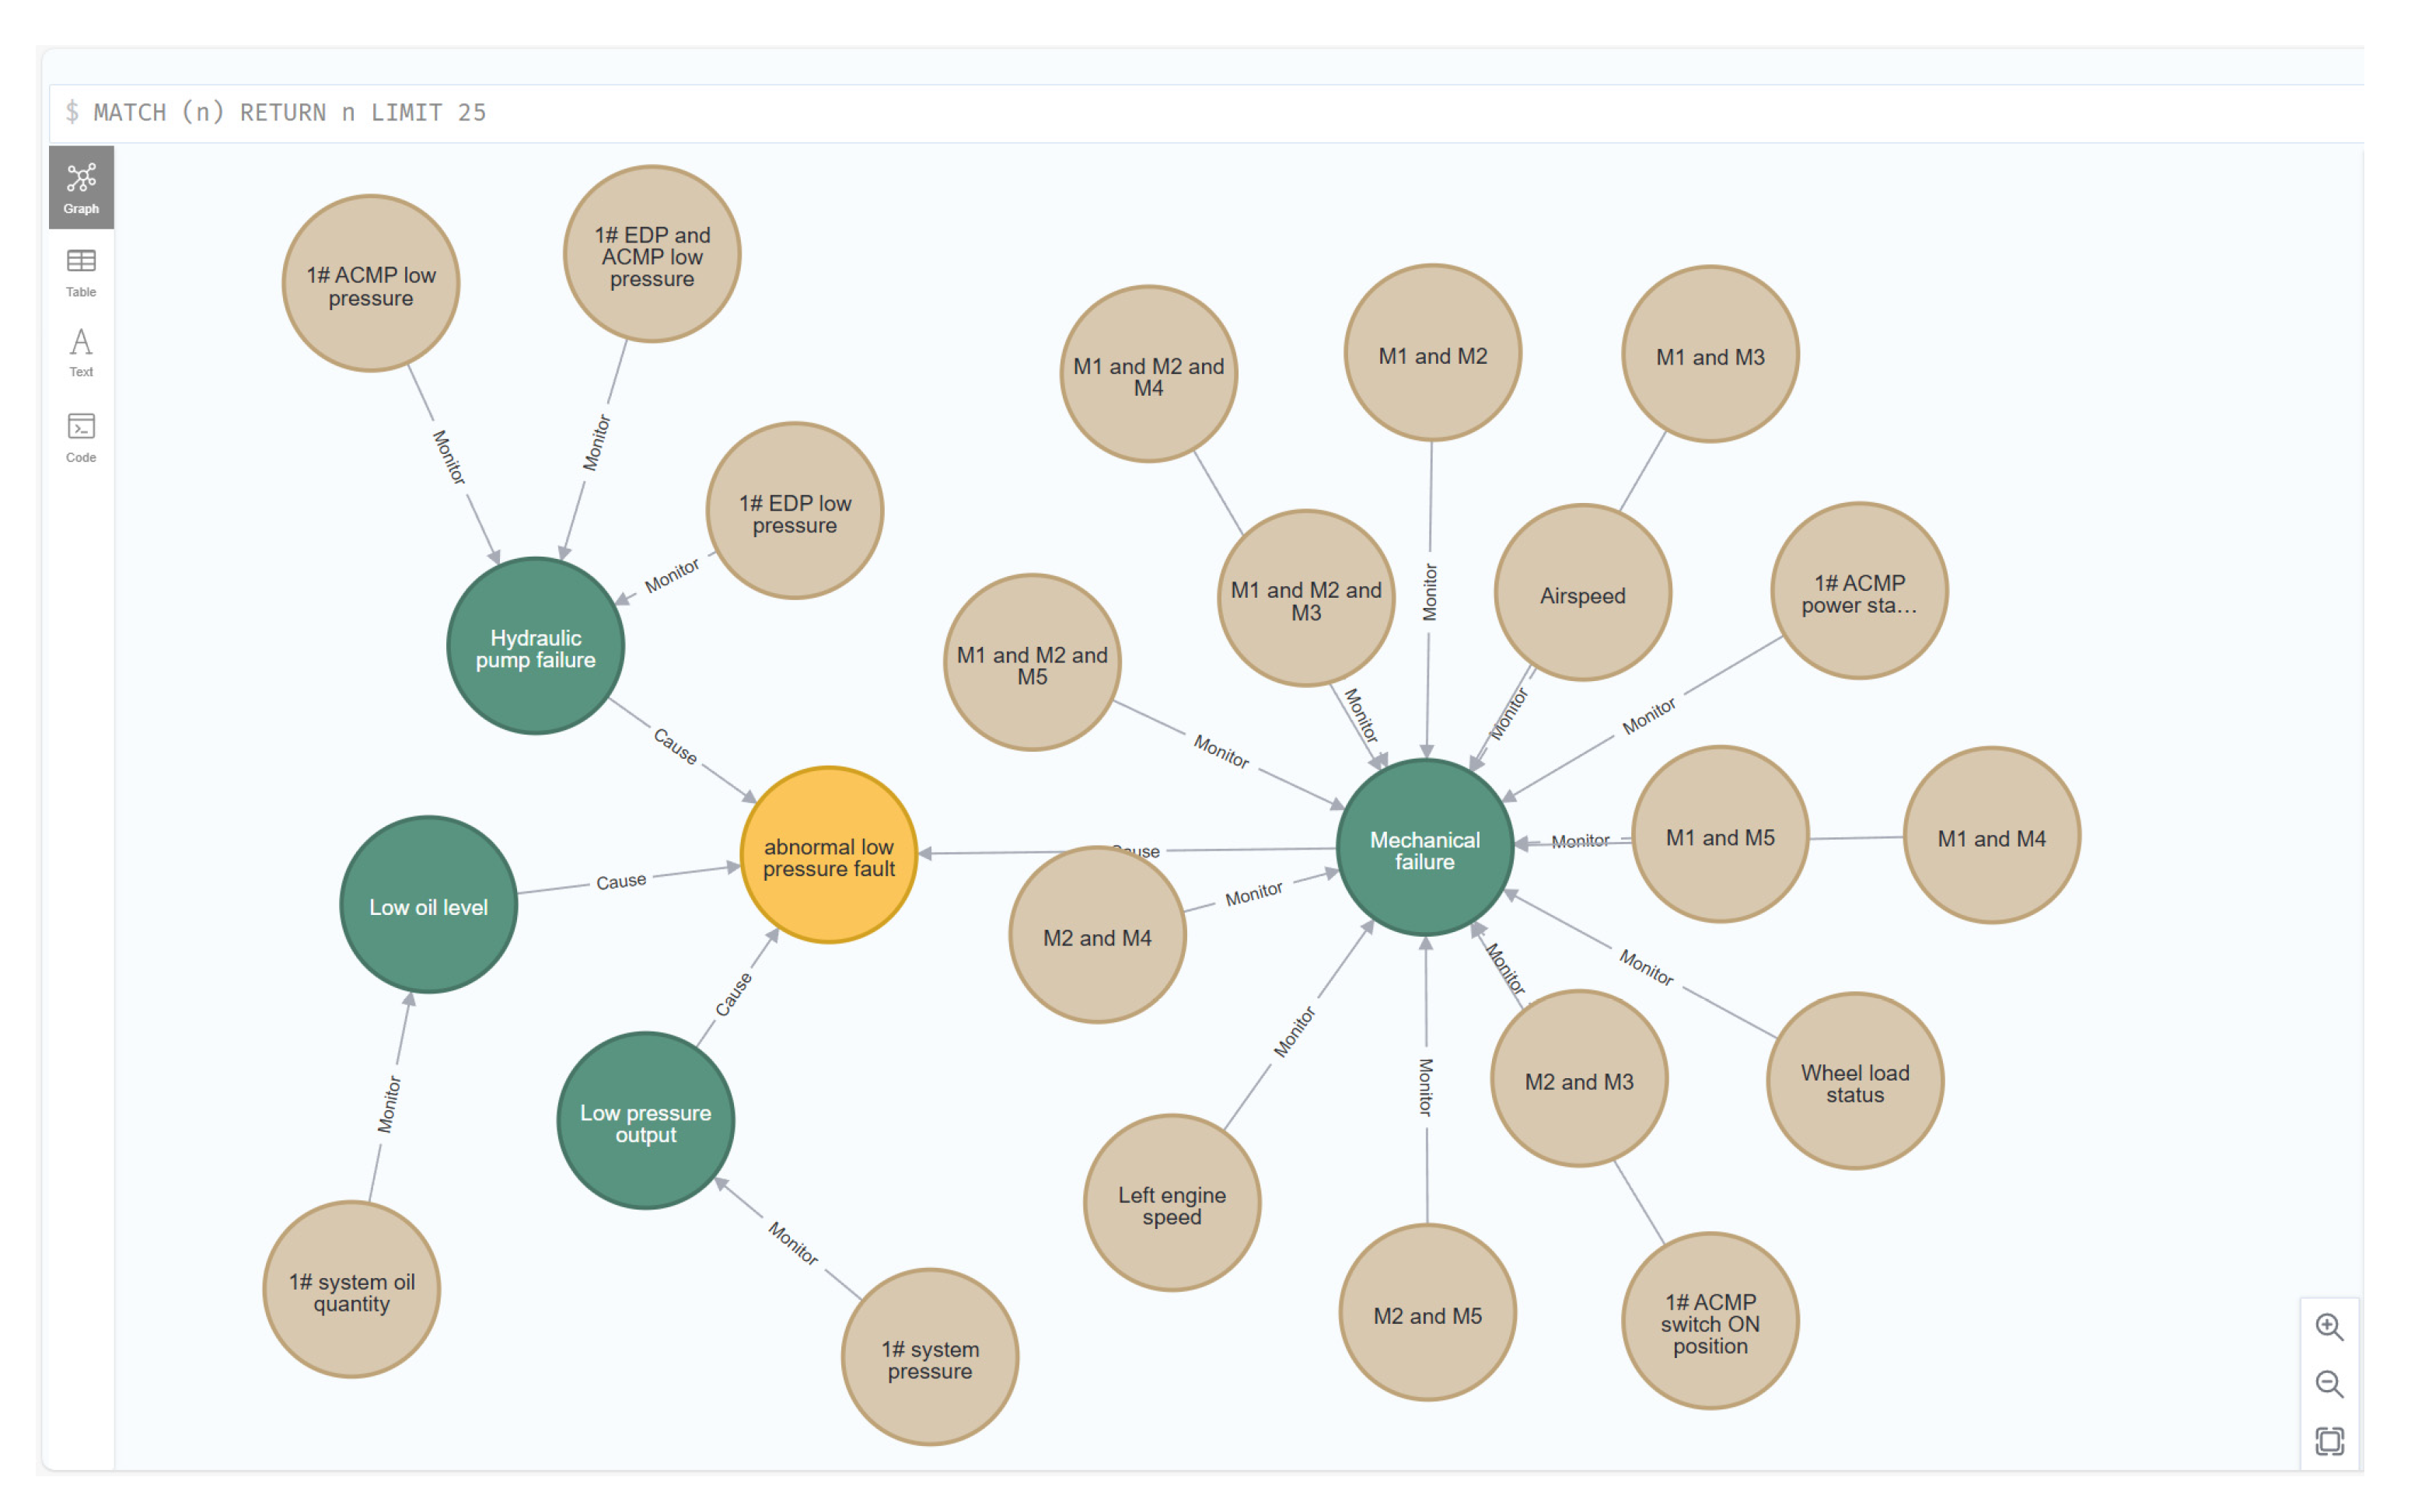
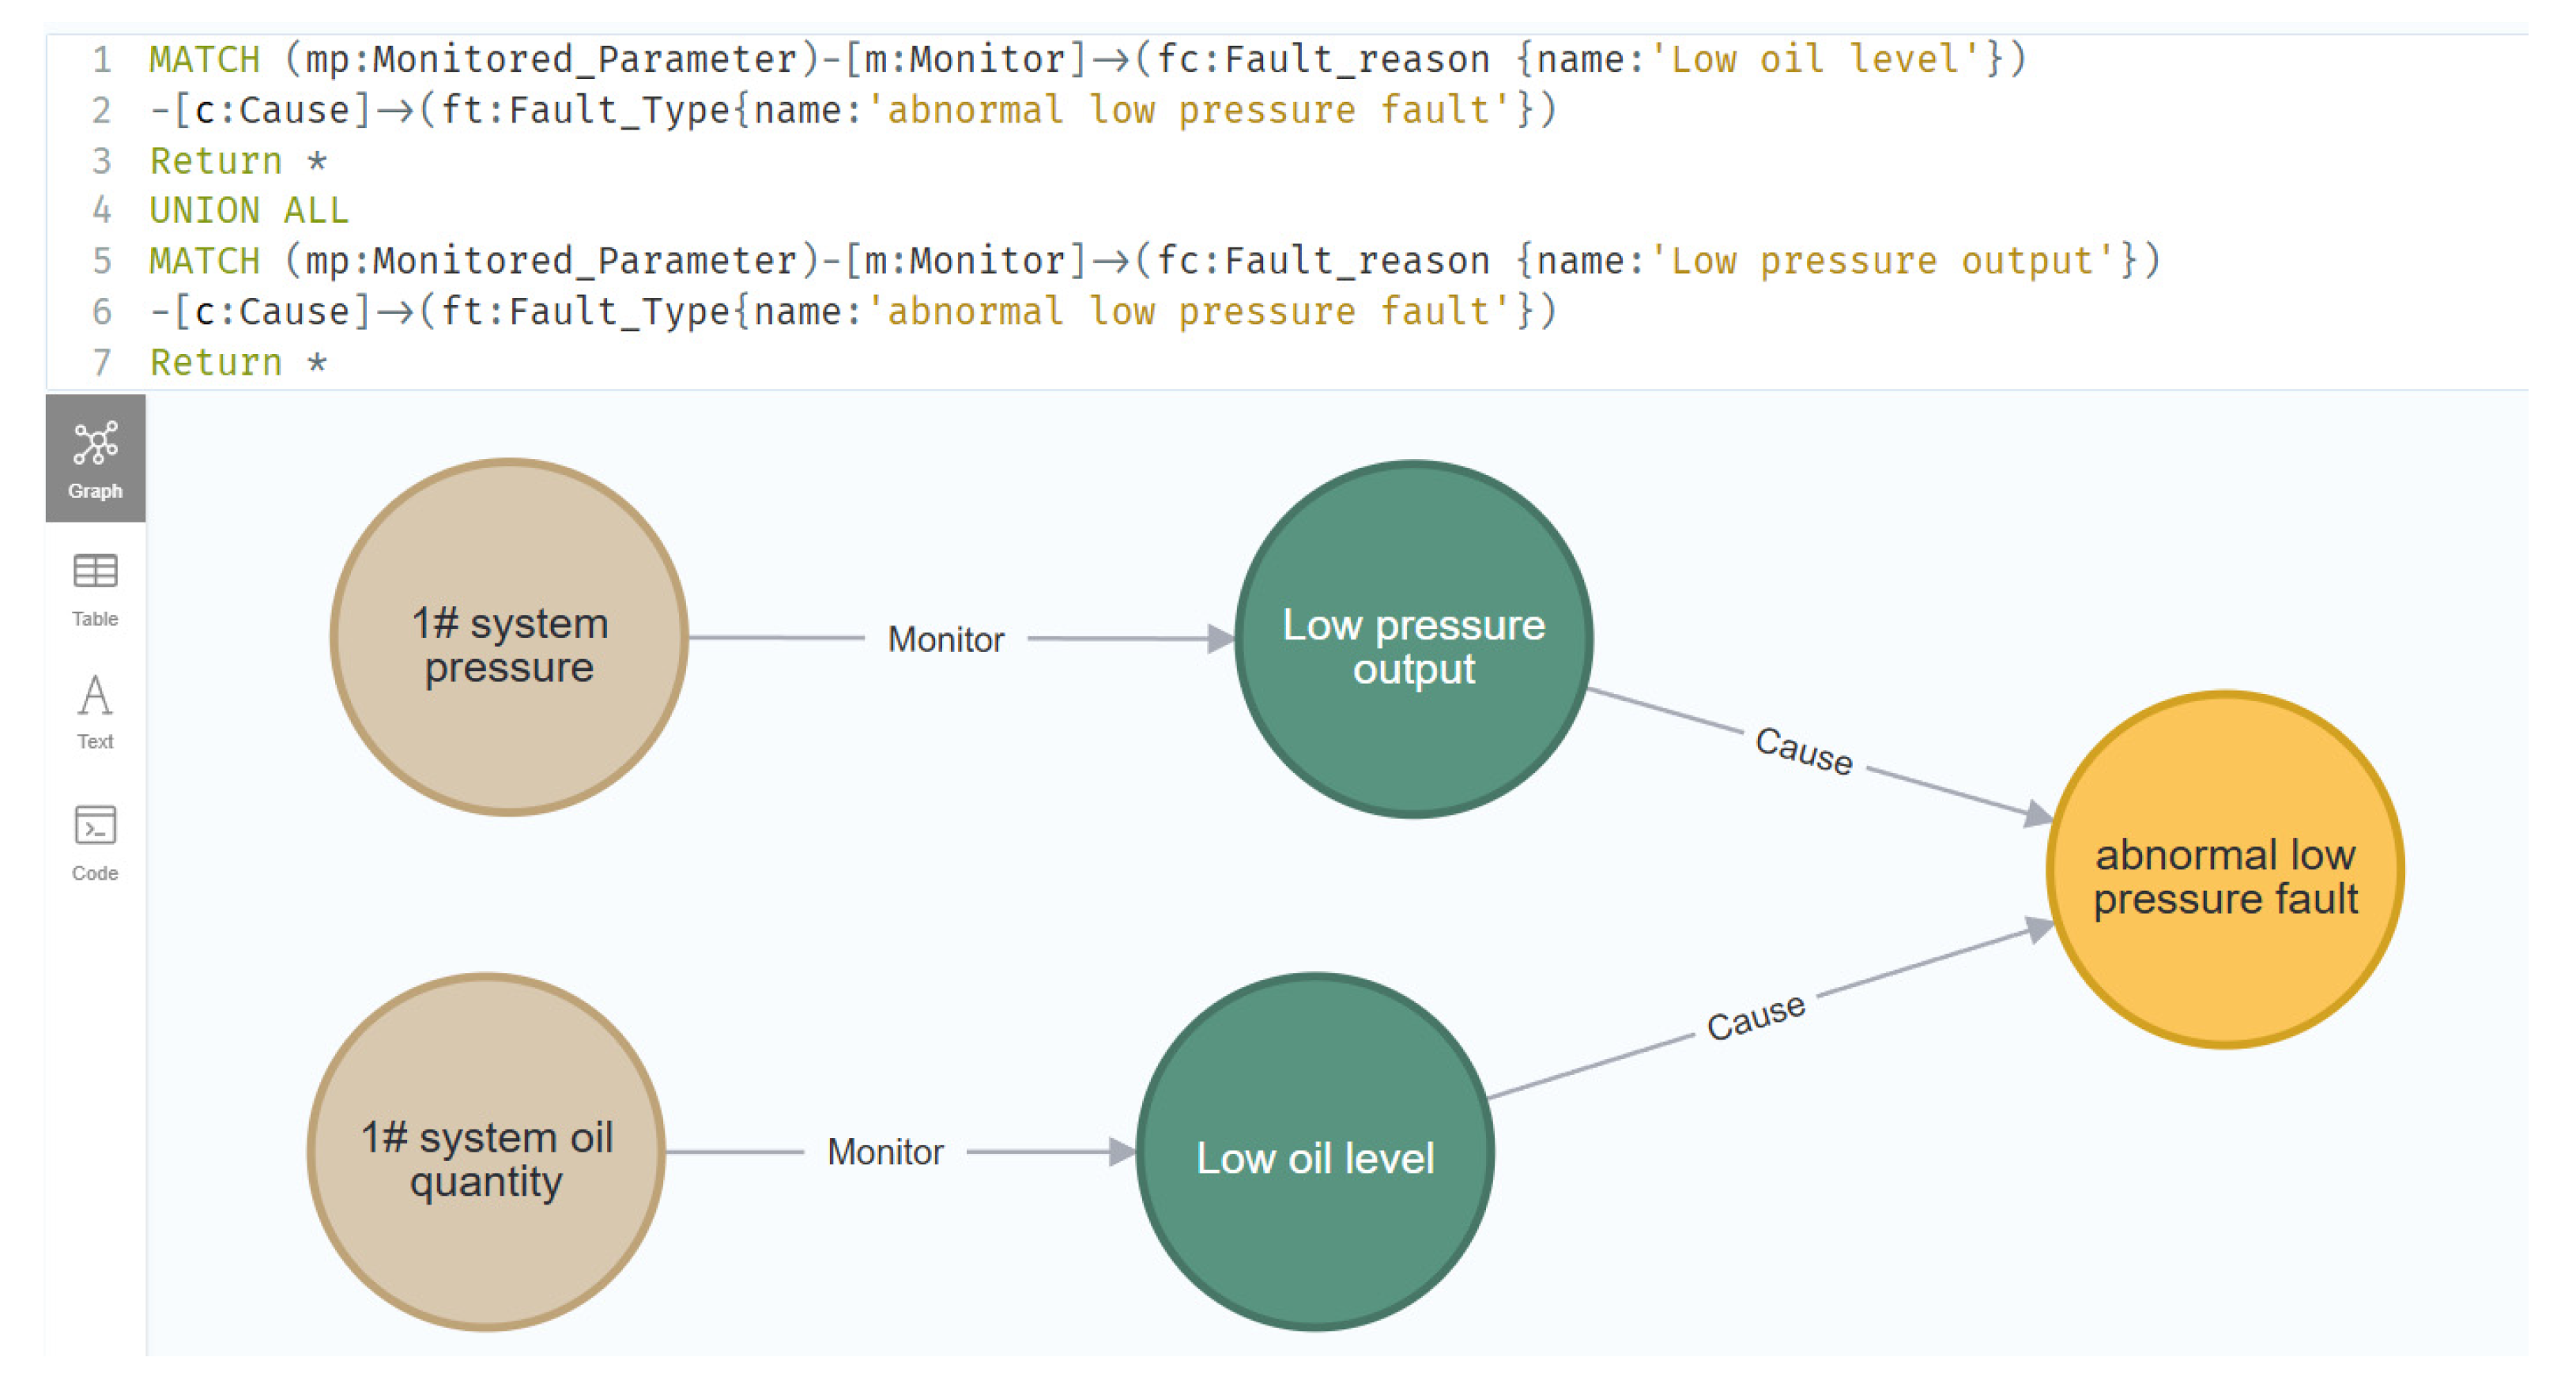
Neo4j is a visual knowledge graph software. We can store the above fault triplet information in Neo4j 5.15 software, and the stored fault knowledge is shown in Figure 8. Neo4j software is a graph storage database that can retrieve graph content through structured Cypher language. Assuming the current known abnormal low-pressure fault and fault cause R, the monitoring parameters related to fault cause R can be retrieved using the Cypher language, as shown in Figure 9. From the figure below, it can be seen that the abnormal monitoring parameters “1# EDP low pressure” and “1# ACMP low pressure” can be quickly retrieved based on the graph. Based on this, ground personnel can carry out inspection and replacement tasks on EDP and ACMP, thereby achieving rapid troubleshooting.
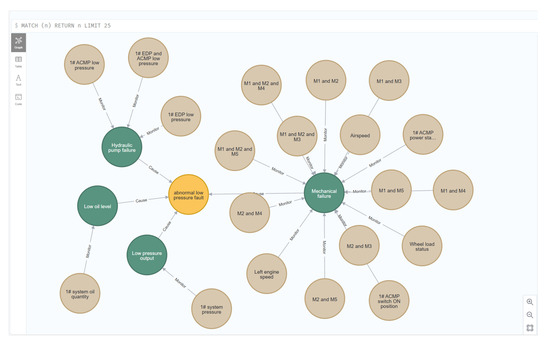
Figure 8.
Knowledge graph of abnormal low-pressure fault.

Figure 9.
Knowledge Graph Retrieval Results.
4.3. Deterministic Analysis of Knowledge Graph
The fault knowledge graph can store fault knowledge and help ground crews quickly retrieve useful information to support troubleshooting work. But knowledge graphs cannot quantitatively provide the probability of different fault causes occurring. Bayesian network is a probabilistic graphical model that can further achieve quantitative inference of different causes. Bayesian networks consist of nodes and directed edges connecting these nodes, where nodes represent random variables and edges represent conditional dependencies between these variables. The core of Bayesian inference is Bayes’ theorem, which describes how to update probability estimates about a hypothesis based on prior knowledge and newly obtained data. Bayes’ theorem can be expressed as Formula (6):
where P(θ|D) represents the posterior probability distribution of parameter θ after observing data D; P(D|θ) is the probability of observing data D given the parameter θ; P(θ) represents the prior probability distribution of parameter θ before observing any data; and P(D) is the edge probability of data D, also known as the normalization constant.
We use logic diagrams to quickly construct Bayesian networks, where the conditional probability distribution of nodes is provided by the AND or OR gates between nodes in the logical graph, i.e., P(θ|D). Assuming we know the prior probability distribution P(θ) of each monitoring parameter and the current probability of fault occurrence P(D), we can infer the posterior probability of each monitoring parameter under known fault occurrence conditions through Bayesian inference, and thus determine which monitoring parameters are most likely to cause faults. Then, we can locate relevant components and troubleshoot.
Genie 4.0 is a visualization modeling software for Bayesian networks, which has built-in Bayesian inference algorithms. We can more intuitively and efficiently establish Bayesian networks and achieve posterior probability solving. Based on the logic diagram of the abnormal low-pressure fault in hydraulic system 1, we use Genie software to establish a Bayesian network model as shown in Figure 10. The network model originates from the basic structure of the logic diagram, where the left side of the model represents the monitoring parameters, the middle part represents the defined logical relationship between the AND or OR gate, and the right side represents the abnormal low-pressure fault. The monitoring parameter node can determine the prior probability P(θ) of the parameter by calculating the proportion of anomalies in the operation data. The conditional probability distribution P(D|θ) of event occurrence is defined mathematically with the AND and OR gate. When the probability of top event failure P(D) is known, the Bayesian network model can reverse derive the conditional occurrence probability P(θ|D) of different monitoring parameters when the failure occurs, thereby providing support for the deterministic analysis of monitoring parameters.
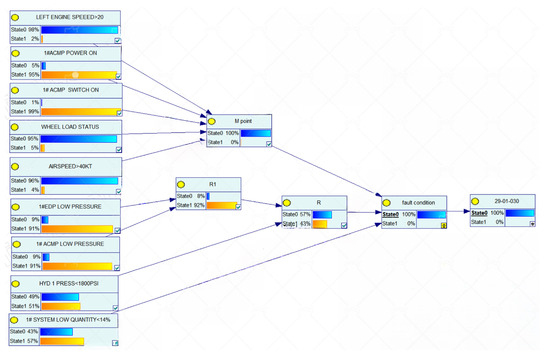
Figure 10.
Bayesian network model based on Genie.
4.4. Prospects for Future Research
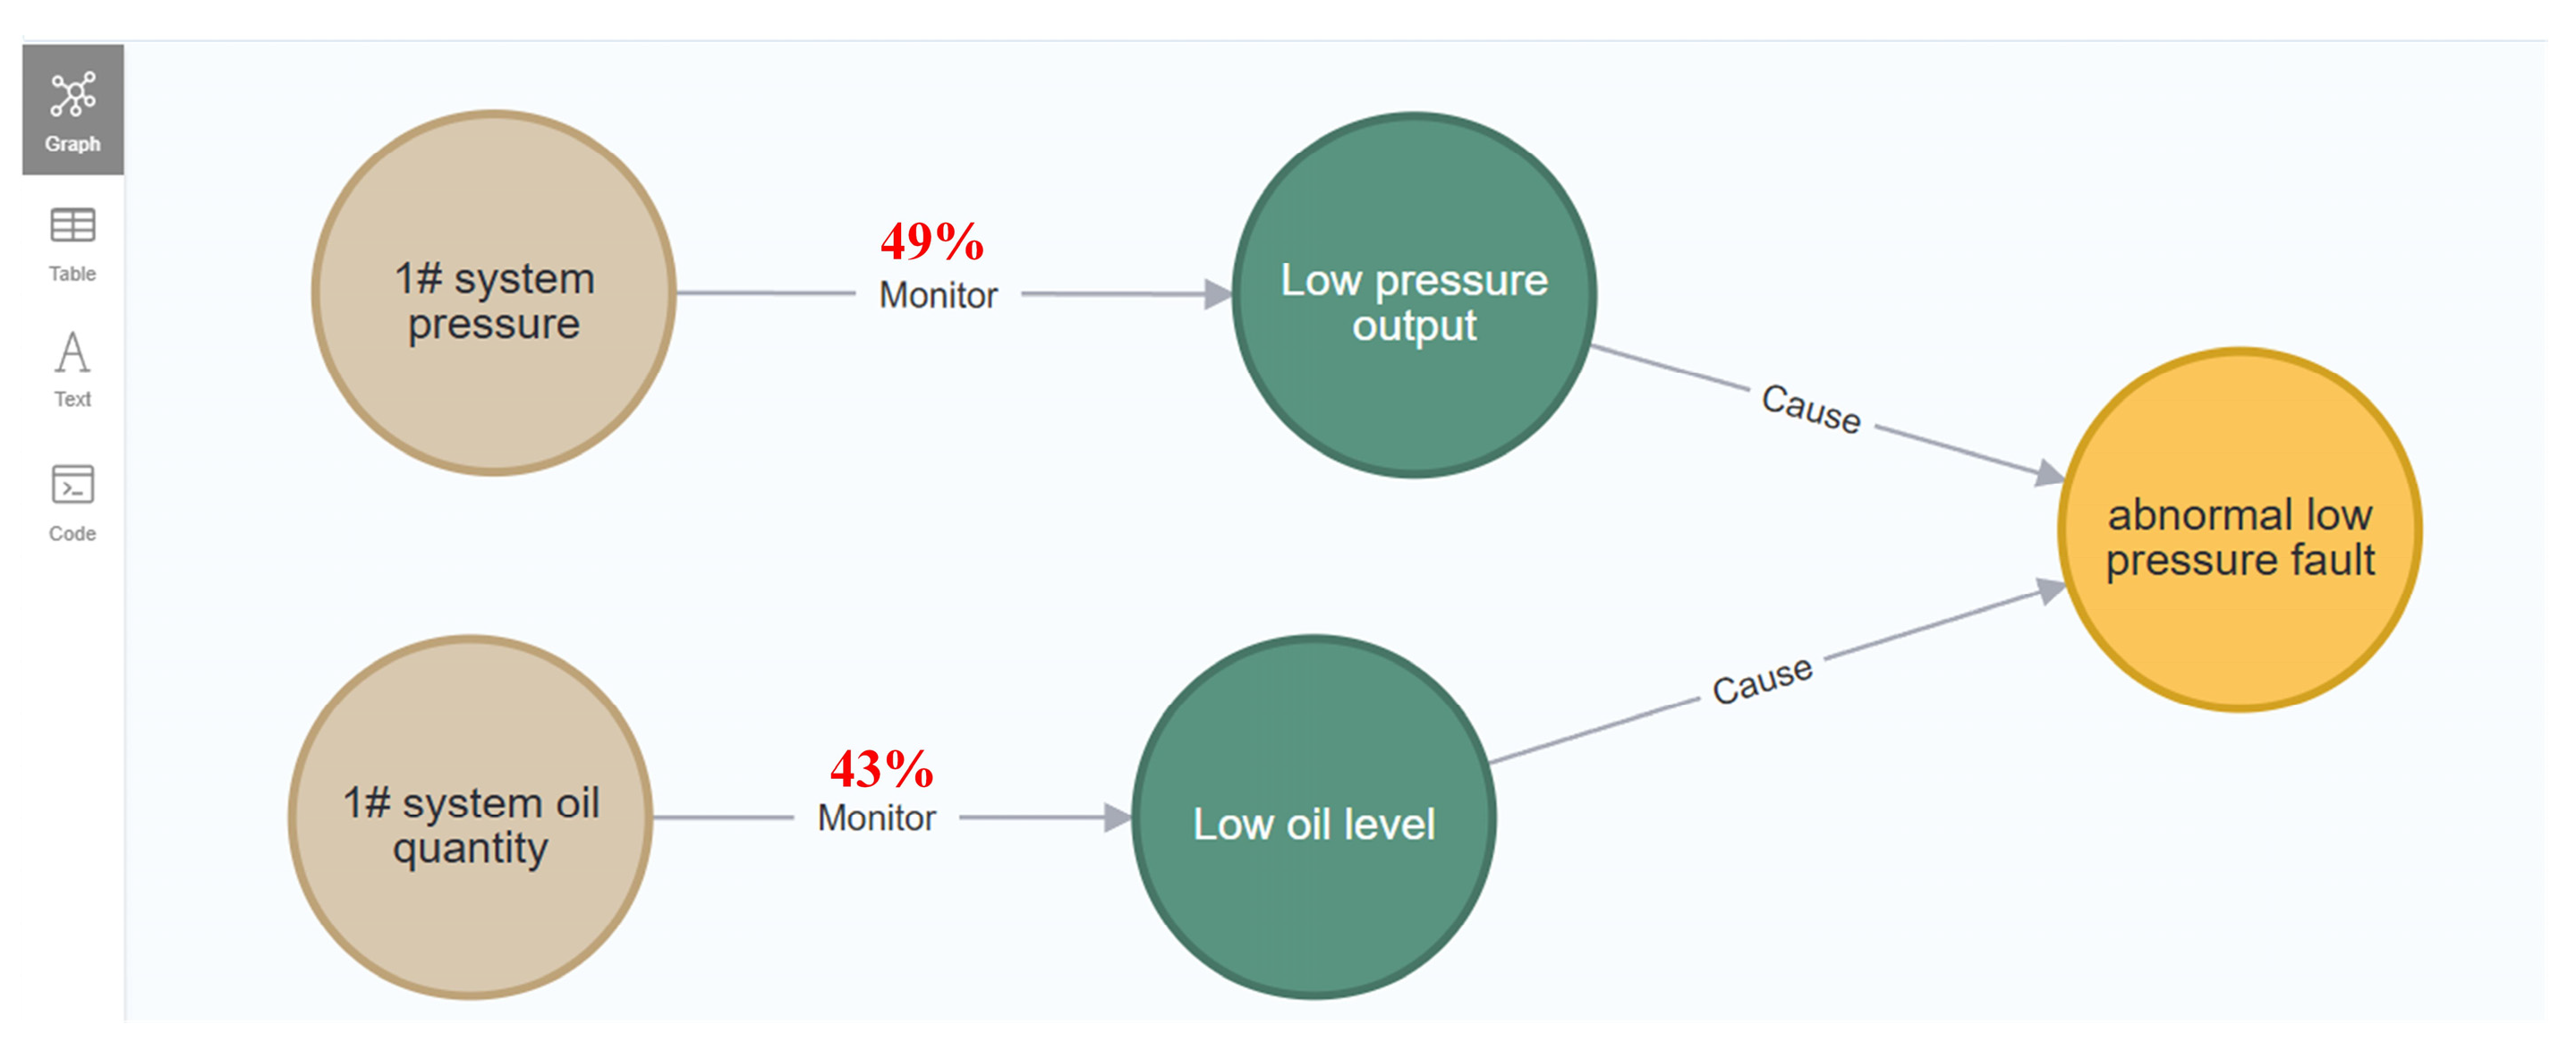
A fault knowledge graph only constructs a knowledge database for fault information, which can retrieve relevant fault reasons and monitoring parameters based on fault types, but it is difficult to provide targeted troubleshooting suggestions based on specific problems. By combining the above Bayesian network model, probability inference of fault causes can be achieved. The inference results can be effectively combined with knowledge graphs to achieve commercial aircraft fault diagnosis based on fault knowledge and operational data, thereby enhancing the interpretability of fault diagnosis work. The schematic diagram of the knowledge graph based on probabilistic reasoning is shown in Figure 11 below. Compared to Figure 9, the following figure supplements the probability of different monitoring parameter failures, thereby supporting ground personnel in determining the actual troubleshooting sequence. We have provided methods for constructing fault knowledge graphs and quantitative fault inference, but both methods require further encapsulation to provide convenient operational interfaces for ground handling.

Figure 11.
Schematic diagram of knowledge graph combined with probabilistic reasoning.
5. Conclusions
To solve the lack of interpretability in knowledge-driven and data-driven approaches, we conducted research on fault diagnosis and graph construction based on commercial aircraft fault logic diagrams. The main tasks of this paper are as follows:
- (1)
- We propose a logical diagram mathematical modeling method that enables logical diagrams to be combined with operational data for mathematical analysis, fault diagnosis, and abnormal parameter localization. The proposed method provides a new solution for the diagnosis of commercial aircraft faults, and provides interpretability for fault diagnosis through fault logic.
- (2)
- To expand the engineering application of logic diagrams, we conducted a deep analysis of the fault logic in logic diagrams, identifying the causes of faults and underlying monitoring parameters. The acquisition of fault logic knowledge provides input for the construction of a fault knowledge graph and is a powerful tool for later troubleshooting.
- (3)
- We validate the above method using the abnormal low-pressure fault of the domestic commercial aircraft hydraulic system. The validation showed that the logic diagram model can accurately carry out fault diagnosis function in combination with operating data, and the fault knowledge graph can accurately detect abnormal monitoring parameters based on relevant information and guide troubleshooting work accurately.
- (4)
- The fault knowledge graph and Bayesian network proposed in the paper can be further encapsulated to provide a convenient interface for ground crews. Ground crews can query the relevant causes of faults through the knowledge graph and obtain the probability of different fault causes based on the Bayesian network, thereby determining the priority of troubleshooting and supporting rapid troubleshooting of routes.
Author Contributions
Conceptualization, H.P. and W.Y.; Methodology, H.P.; Validation, H.P.; Formal analysis, H.P.; Resources, W.Y.; Data curation, W.Y.; Writing—original draft, H.P.; Writing—review and editing, W.Y.; Supervision, W.Y. All authors have read and agreed to the published version of the manuscript.
Funding
This research received no external funding.
Data Availability Statement
The raw data supporting the conclusions of this article will be made available by the authors on request.
Conflicts of Interest
The authors declare no conflicts of interest.
References
- Lin, J.; Zhang, B.Y.; Zhang, D.Y.; Chen, M. Research status and prospect of fault diagnosis for gas turbine aeroengine. Acta Aeronaut. Astronaut. Sin. 2022, 43, 626565. [Google Scholar]
- Jung, Y.; Park, E.-G.; Jeong, S.-H.; Kim, J.-H. AI-Based Anomaly Detection Techniques for Structural Fault Diagnosis Using Low-Sampling-Rate Vibration Data. Aerospace 2024, 11, 509. [Google Scholar] [CrossRef]
- Teng, D.; Feng, W.; Chen, Y.; Lu, C. Structural dynamic reliability analysis: Review and prospects. Int. J. Struct. Integr. 2022, 13, 753–783. [Google Scholar] [CrossRef]
- Lu, C.; Fei, C.W.; Liu, H.T.; Li, H.; An, L.Q. Moving extremum surrogate modeling strategy for dynamic reliability estimation of turbine blisk with multi-physics fields. Aerosp. Sci. Technol. 2020, 106, 106112. [Google Scholar] [CrossRef]
- Bas-Calopa, P.; Riba, J.-R.; Ortega, J.A. Low-Pressure Optical Detection, Location, and Quantification of Electrical Discharges in Aircraft Wiring Systems. Aerospace 2023, 10, 3. [Google Scholar] [CrossRef]
- Liu, W.Y.; Feng, Y.W.; Teng, D.; Lu, C.; Chen, J.Y. Fault logic and data-driven model for operation reliability analysis of the flap deflection angle. Philos. Trans. R. Soc. A 2023, 381, 20220385. [Google Scholar] [CrossRef]
- Lu, C.; Fei, C.W.; Feng, Y.W.; Zhao, Y.J.; Dong, X.W.; Choy, Y.S. Probabilistic analyses of structural dynamic response with modified Kriging based moving extremum framework. Eng. Fail. Anal. 2021, 125, 105398. [Google Scholar] [CrossRef]
- Shao, Y.W.; Cheng, J.Y.; Ling, C.Y.; Wan, C.; Ge, H.J.; Shi, Z.L. Gearbox fault diagnosis with small training samples: An improved deer forest based method. Acta Aeronaut. Astronaut. Sin. 2022, 43, 625429. [Google Scholar]
- Mallikarjuna, P.B.; Sreenatha, M.; Manjunath, S.; Kundur, N.C. Aircraft gearbox fault diagnosis system: An approach based on deep learning techniques. J. Intell. Syst. 2021, 30, 258–272. [Google Scholar] [CrossRef]
- Liu, C.; Sun, J.; Wang, F.; Ning, S.; Xu, G. Bayesian network method for fault diagnosis of civil aircraft environment control system. Proc. Inst. Mech. Eng. Part I J. Syst. Control. Eng. 2020, 234, 662–674. [Google Scholar] [CrossRef]
- Li, S.; Wang, J.; Rong, J. Design-Oriented product fault knowledge graph with frequency weight based on maintenance text. Adv. Eng. Inform. 2023, 58, 102229. [Google Scholar] [CrossRef]
- Liu, C.; Wang, B.; Wang, Z.; Tian, J.; Luo, P.; Yang, Y. TCFLTformer: TextCNN-Flat-Lattice Transformer for Entity Recognition of Air Traffic Management Cyber Threat Knowledge Graphs. Aerospace 2023, 10, 697. [Google Scholar] [CrossRef]
- Xing, X.Q.; Ding, Y.T.; Xia, T.B.; Pan, E.S.; Xi, L.F. Integrated modeling of commercial aircraft maintenance plan recommendation system based on knowledge graph. J. Zhejiang Univ. 2023, 57, 512–521. [Google Scholar]
- Meng, X.; Jing, B.; Wang, S.; Pan, J.; Huang, Y.; Jiao, X. Fault knowledge graph construction and platform development for aircraft PHM. Sensors 2023, 24, 231. [Google Scholar] [CrossRef] [PubMed]
- Nie, T.P.; Zeng, J.Y.; Cheng, Y.J.; Ma, L. Knowledge graph construction technology and its application in aircraft power system fault diagnosis. Acta Aeronaut. Astronaut. Sin. 2022, 43, 46–62. [Google Scholar]
- Fei, W.; Li, H.; Lu, C.; Han, L.; Keshtegar, B.; Taylan, O. Vectorial surrogate modeling method for multi-objective reliability design. Appl. Math. Model. 2022, 109, 1–20. [Google Scholar] [CrossRef]
- Teng, D.; Feng, W.; Chen, Y. Intelligent moving extremum weighted surrogate modeling framework for dynamic reliability estimation of complex structures. Eng. Fail. Anal. 2022, 138, 106364. [Google Scholar] [CrossRef]
- Bautista-Hernández, J.; Martín-Prats, M.Á. Artificial Intelligence Approach in Aerospace for Error Mitigation. Aerospace 2024, 11, 300. [Google Scholar] [CrossRef]
- Shi, X.D.; Cheng, B.Y.; Huang, K.; Yang, Z. Risk assessment of aircraft IDG based on fuzzy TOPSIS-FMEA. Syst. Eng. Electron. 2022, 44, 2060–2064. [Google Scholar]
- Zhuang, L.; Lu, Z.; Song, J.; Dong, L.; Wu, Y.; Zhou, J. Safety analysis for fly-by-wire system based on fault injection model. Acta Aeronaut. Astronaut. Sin. 2023, 44, 327329. [Google Scholar]
- Liu, X.; Liu, Z. A hybrid approach for aircraft fault diagnosis based on fault inference and fault identification. Aeronaut. J. 2014, 118, 81–97. [Google Scholar] [CrossRef]
- Altun, A.T.; Hasanzade, M.; Saldiran, E.; Guner, G.; Uzun, M.; Fremond, R.; Tang, Y.; Bhundoo, P.; Su, Y.; Xu, Y.; et al. The Development of an Advanced Air Mobility Flight Testing and Simulation Infrastructure. Aerospace 2023, 10, 712. [Google Scholar] [CrossRef]
- Lu, X. Application of preventive maintenance based on wing loop troubleshooting method for A320 series aircraft. Aviat. Maint. Eng. 2023, 11, 26–28. [Google Scholar]
- Togni, S.; Nikolaidis, T.; Sampath, S. A combined technique of Kalman filter, artificial neural network and fuzzy logic for gas turbines and signal fault isolation. Chin. J. Aeronaut. 2021, 34, 124–135. [Google Scholar] [CrossRef]
- Hu, N.; Appel, C.; Haxter, S.; Callsen, S.; Klabes, A. Simulation of surface pressure fluctuations on an Airbus-A320 fuselage at cruise conditions. AIAA J. 2021, 59, 1585–1597. [Google Scholar] [CrossRef]
- Paulheim, H. Knowledge graph refinement: A survey of approaches and evaluation methods. Semant. Web 2017, 8, 489–508. [Google Scholar] [CrossRef]
- Cai, C.; Jiang, Z.; Wu, H.; Wang, J.; Liu, J.; Song, L. Research on knowledge graph-driven equipment fault diagnosis method for intelligent manufacturing. Int. J. Adv. Manuf. Technol. 2024, 130, 4649–4662. [Google Scholar] [CrossRef]


Disclaimer/Publisher’s Note: The statements, opinions and data contained in all publications are solely those of the individual author(s) and contributor(s) and not of MDPI and/or the editor(s). MDPI and/or the editor(s) disclaim responsibility for any injury to people or property resulting from any ideas, methods, instructions or products referred to in the content. |
© 2024 by the authors. Licensee MDPI, Basel, Switzerland. This article is an open access article distributed under the terms and conditions of the Creative Commons Attribution (CC BY) license (https://creativecommons.org/licenses/by/4.0/).