Article

Analysis of Radio Science Data from the KaT Instrument of the 3GM Experiment During JUICE’s Early Cruise Phase

1
Department of Mechanical and Space Engineering, Sapienza University of Rome, Via Eudossiana 18, 00184 Rome, Italy
2
European Space Operations Centre, Robert-Bosch-Str. 5, 64293 Darmstadt, Germany
*
Author to whom correspondence should be addressed.
Current address: Aurora Technology for ESAC, Camino Bajo del Castillo s/n, 28692 Villanueva de la Cañada, Spain.
Aerospace 2025, 12(1), 56; https://doi.org/10.3390/aerospace12010056
Submission received: 20 December 2024 / Revised: 10 January 2025 / Accepted: 13 January 2025 / Published: 16 January 2025

Abstract

:
The JUpiter Icy Moon Explorer (JUICE) mission, launched on 14 April 2023, aims to explore Jupiter and its Galilean moons, with arrival in the Jovian system planned for mid-2031. One of the scientific investigations is the Geodesy and Geophysics of Jupiter and the Galilean Moons (3GM) radio science experiment, designed to study the interior structures of Europa, Callisto, and Ganymede and the atmospheres of Jupiter and the Galilean moons. The 3GM experiment employs a Ka-band Transponder (KaT) to enable two-way coherent range and Doppler measurements used for the gravity experiment and an Ultra Stable Oscillator (USO) for one-way downlink occultation experiments. This paper analyzes KaT data collected at the ESA/ESTRACK ground station in Malargüe, Argentina, during the Near-Earth Commissioning Phase (NECP) in May 2023 and the first in-cruise payload checkout (PC01) in January 2024. The radiometric data were fitted using both NASA’s Mission Analysis, Operations, and Navigation Toolkit Environment (MONTE) and ESA’s General Orbit Determination and Optimization Toolkit (GODOT) software. The comparison of the orbital solutions showed an excellent agreement. In addition, the Doppler and range residuals allowed a preliminary assessment of the quality of the radiometric measurements. During the NECP pass, the radio link data showed a range-rate noise of 0.012 mm/s at 1000 s integration time, while the root mean square of the range residuals sampled at 1 s was 8.4 mm. During the first payload checkout, the signal power at the KaT input closely matched the value expected at Jupiter, due to a specific ground station setup. This provided early indications of the 3GM’s performance during the Jovian phase. In this test, the accuracy of range data at an integration time of 1s, particularly sensitive to the link signal-to-noise ratio, degraded to 13.6 cm, whilst the range-rate accuracy turned out to be better than 0.003 mm/s at 1000 s, thanks to the accurate tropospheric delay calibration system (TDCS) available at the Malargue station (inactive during NECP).

1. Introduction

The JUICE mission was launched on 14 April 2023 from the Kourou spaceport, located in French Guyana. The spacecraft is currently in its interplanetary cruise, comprising three Earth flybys and one Venus flyby, en route to the Jovian system. The Jupiter Orbit Insertion (JOI) will occur in July 2031, and it will be followed by a Ganymede flyby, assisting in the propellant consumption reduction needed for the capture maneuver. The scientific phase of the mission envisages a 3.5-year tour in the Jovian system comprising a series of flybys of the Galilean moons Europa, Callisto, and Ganymede. At the end of the tour in 2034, JUICE will enter into orbit around Ganymede, initially in a Ganymede Elliptical Orbit (GEO) with a pericenter of 200 km and an apocenter of 10000 km, followed by a Ganymede Circular Orbit at approximately 500 km of altitude (GCO500). Thanks to the propellant saved by launching in the optimal window, the residual Δ V could be used to restore a GCO phase at 200 km of altitude (GCO200), a phase that was initially included within the mission baseline and then canceled due to a partial redesign of the original tour.
The JUICE mission includes 11 scientific investigations aimed at characterizing the structure and environment of Jupiter and its Galilean moons [1]. One of the key investigations is the 3GM radio science experiment, which focuses on probing the interior structure and ionosphere [2,3] of the Galilean moons and the atmosphere and ionosphere of Jupiter [4] by exploiting radio links at X- and Ka-band through two completely separated and independent units, namely the Ka-band transponder (KaT) and an ultra-stable oscillator (USO).
This paper focuses on the analysis of KaT data acquired during the near-Earth commissioning phase and the first payload checkout (PC01). Our goal is to assess the preliminary in-flight performances of the two-way coherent Ka/Ka radio link during these early mission phases. We evaluate the compensation of tropospheric effects using global navigation satellite system (GNSS) calibration files [5] and the tropospheric delay calibration system (TDCS), a state-of-the-art water vapor radiometer [6,7].
Additionally, we aim to validate the orbit determination setup to ensure its accuracy and reliability. To achieve this, we perform a detailed evaluation using two established software codes: NASA’s MONTE [8] and ESA’s GODOT (https://godot.io.esa.int/godotpy accessed on 10 January 2025). By comparing the results generated by MONTE and GODOT, we aim to identify any discrepancies and assess the performance and precision of our implementation. This comparative analysis will help us understand the strengths and limitations of our orbit determination setups.
This paper is organized as follows: in Section 2 we present the 3GM experiment and the observation campaigns. Section 3 outlines the orbit determination setup. Section 4 presents the results of our analysis, and in Section 5 we offer preliminary conclusions.

2. 3GM Experiment

The 3GM experiment science goals pertain to the geodesy and geophysics of the Galilean satellites [9,10,11] and atmospheric science [4]. The USO is used to generate a stable reference signal for one-way downlink occultation experiments at both X and Ka bands. The KaT is used for gravity measurements, providing precise two-way coherent range and Doppler (range-rate) data at Ka-band. Additionally, data from a high-accuracy accelerometer (HAA) [12] will be used to mitigate the disturbance effect of propellant sloshing on the orbit reconstruction, especially during flybys.
The main scientific objectives of the 3GM gravity experiment are:
  • The determination of Ganymede’s gravity field, at least to degree and order 30.
  • The measurement of Ganymede complex tidal Love number with an accuracy better than 0.001 at the orbital frequency.
  • The measurement of selected tidal Love numbers associated with inter-satellite tides.
  • The measurement of Ganymede rotational state.
  • Determination of Callisto’s tidal Love number k2 with an absolute uncertainty better than 0.06.
  • The measurement of Callisto’s gravity field at least to degree and order 3 (with an accuracy for J3 better than 4 × 10⁻⁸).
  • The determination of Europa’s unconstrained J2 and C22 gravity coefficients with 1–2% relative uncertainties.
  • The improvement of the ephemerides of the Galilean moons [13].
The ability to meet or even exceed these requirements relies on the accuracy of the 3GM radiometric data, the ability to compensate for the effect of the propellant sloshing by means of the HAA, the tour design, and the operational constraints of the spacecraft. Current experiment simulations indicate not only that the scientific requirements will be met, but most of them will also be exceeded [9,10,14,15]. Additionally, 3GM may perform superior solar conjunctions experiments during the cruise phase to verify the general relativity prediction of the time delay induced on the radio link by the solar gravity [16,17].

2.1. Radio Tracking System and Links

The KaT is used to establish a two-way coherent link with a ground station, enabling both Doppler shift measurements and pseudo-noise (PN) ranging measurements at 24.35 mega chips per second (Mcps) [18] in Ka-band (uplink ≈ 34.56 GHz − downlink ≈ 32.27 GHz). The KaT is equipped with an internal Solid-State Power Amplifier (SSPA) that provides a radio frequency output power of 1.9 W. For telecommanding and telemetry, the radio system includes a deep space transponder (DST), which can receive uplink signals at X-band (≈7.18 GHz) and retransmitting phase-coherent downlink signals both at X- (≈8.44 GHz) and Ka-band (≈32.06 GHz). These links support Doppler and PN range at 3 Mcps. The X- and Ka-band downlink signals are amplified by two traveling wave tube amplifiers (TWTA), providing an output power of 52 and 27 W, respectively. The onboard radio tracking system also includes a 2.54 m high-gain antenna (HGA) and a 0.56 m steerable medium-gain antenna (MGA). Both antennas support the five possible links (referred to as the “full multifrequency link”), which enable near-complete cancelation of plasma noise [19]. The JUICE state-of-the-art radio tracking system is similar to the one already in use on BepiColombo [20]. This system has demonstrated the capability to achieve two-way Doppler measurements with an accuracy of 0.003 mm/s at 1000 s of integration time [21] and two-way range measurements with a jitter of ~4.5 cm at all solar elongation angles [6].

2.2. Observation Campaigns

As of June 2024, the 3GM KaT operated during two short observation campaigns: the Near-Earth Commission Phase and the first payload checkout. Both observation campaigns were supported by the ESA ESTRACK deep-space antenna 3 (DSA-3), located in Malargüe, Argentina. Up to now, it is the only ESA station capable of transmitting at Ka-band to support a full multifrequency link. For these test campaigns, the uplink frequency has been kept constant for the whole duration of each of the two passes. The onboard MGA was used during these campaigns because in this phase of the mission the HGA acts as a thermal shield to avoid overheating of the spacecraft due to the large solar flux experienced in the early phases of the mission (compared to the one that will be experienced at Jupiter).
The KaT NECP test was performed from 22 May 2023 at 22:22 UTC to 23 May 2023 at 3:04 UTC, for a duration of about 4 h and 42 min. The round-trip light time between the Earth and the JUICE spacecraft was ~62 s, corresponding to a relative distance of 0.06 AU, while the spacecraft distance from the Sun was 1.05 AU. The test campaign was carried out during an interactive session comprising several real-time functional checks to verify the status and operability of the instrument after launch. All tests were successful, and the instrument operated nominally. After the functional checkout sequence, the KaT locked the carrier signal from 22 May 2023 at 23:53 UTC to 23 May 2023 at 02:21 UTC. The ranging modulation on the uplink signal started a few minutes later, and it was acquired on the KaT from 23 May 2023 at 00:07 UTC to 02:15 UTC. Furthermore, the X/X and X/Ka links were also activated to establish a full multifrequency link between 00:57 UTC and 2:05 UTC.
The second observation campaign was performed on 24 January 2024 from 07:33 to 9:07 UTC, as part of the first cruise payload checkout. The Earth-spacecraft round-trip light time was ~260 s, corresponding to a relative distance of 0.26 AU, while JUICE was at 0.91 AU from the Sun. Differently from NECP, the KaT autonomously executed a series of functional tests by means of a command sequence pre-loaded on the onboard computer and then acquired Ka/Ka Doppler data from 7:57 to 9:03 UTC and PN range data from 8:11 to 9:00 UTC. In this case, it was not possible to operate the full multifrequency link due to power limitations on the spacecraft.
During both campaigns, before the acquisition of the uplink carrier, the unit repeated three self-calibration tests to measure the internal group delay, important in the processing of the data by the orbit determination codes. The average group delay was about 702.22 ns during NECP and 701.63 ns during the payload checkout. These measurements are perfectly in line with ground tests performed at the relevant temperature, showing peak to peak variations below 0.04 ns.
The following Table 1 summarizes the main characteristics of the dataset analyzed in this work.

3. Orbit Determination Setup

The orbit determination process is used to obtain an estimate of the spacecraft’s dynamical evolution based on the analysis of observable quantities. In this work the measured quantities are range and range-rate (Doppler) measurements generated at the ground station. The orbit determination software is based on three main building blocks: the dynamical propagator, the observational model, and the estimation filter.
The dynamical propagator offers the mathematical framework for integrating the spacecraft’s trajectory, including the dynamical model and the integrator. The observational model supplies the mathematical formulation to replicate the observable quantities. The estimation filter adjusts the parameters of both the dynamical and observational models to minimize the discrepancies between the observed and computed quantities. The following orbit determination setup has been implemented both in the NASA’s MONTE (version 149) [8] and the ESA’s GODOT flight dynamics software (version 1.7).

3.1. Dynamical Model

The dynamical model includes the accelerations exerted by the Sun, Earth, Moon, Mercury, Venus, and the barycenter of all planetary systems [22]. In this work we considered only the point mass model of the celestial objects in a relativistic framework, without considering aspherical gravity models because of the large distance from any celestial object. As planetary ephemerides, we considered the JPL de440 [22]. The acceleration from the asteroids of the main belt was also neglected.
The only non-gravitational acceleration considered is the one induced by the solar radiation pressure [23]. The overall spacecraft shape is modeled considering two plates of 43.5 m2 each (to represent the two large solar panels), a 5.1 m2 plate to model the HGA, and an additional 7.8 m2 plate to model the spacecraft bus. Since the fixed HGA lies on one side of the spacecraft bus, and during the two data acquisition campaigns the HGA was Sun-pointed (to act as a thermal shield), the spacecraft bus, effectively illuminated by the Sun, was only 2.7 m2. The attitude of the spacecraft surfaces has been retrieved from the official JUICE mission kernels [24]. The mass of the spacecraft was obtained by flight dynamics team estimates, and it was 5991.6 kg during the NECP and 5600.6 kg during the payload checkout.
According to the manufacturers, the spacecraft surfaces considered in our model have a null specular reflective thermo-optical coefficient, while the reflective diffusive coefficients C d are reported in Table 2.

3.2. Observational Model

The range and range-rate observables are modeled based on the formulation given in [25,26]. The Earth rotational model is based on the International Earth Rotation and Reference Systems Service (IERS) described by the IERS convention 2010 [27]. Both in MONTE and GODOT, the implementation of the Earth rotational model is based on the SOFA (Software Routines from the IAU SOFA Collection were used. Copyright © International Astronomical Union Standards of Fundamental Astronomy (http://www.iausofa.org accessed on 15 May 2024)) routines. The Earth orientation parameters have been retrieved from the IERS official release (https://datacenter.iers.org/data/json/finals2000A.all.json accessed on 15 May 2024). Specifically, the International Astronomical Union (IAU) 2006 precession model has been adopted together with the nutation model IAU 2000A [28]. The initial station position has been obtained from the most recent ESA estimation campaign (in 2022). In the modeling of the station location, we considered the Earth’s solid tides, the plate motion, and the Lorentz transformations [26,29].
To compensate for the delay induced by Earth’s troposphere, GNSS calibration files have been used for the first campaign, while for the second campaign, the TDCS was in use. The latter relies on a water vapor radiometer that can provide very accurate atmospheric calibrations, as demonstrated by the analysis of Gaia [7] and BepiColombo data [6].

3.3. Filter Setup and Estimated Parameters

To improve the spacecraft’s initial state and model parameters, a weighted least squares batch filter with a priori information is used to minimize the difference between the observed and modeled observable quantities. The differential corrections to the estimated parameters are [30]:
δ x ^ k = H k T W k H k + P ¯ k 1 1 ( H k T W k δ y ^ k + P ¯ k 1 δ x ¯ k )
where x is the unknown n -dimensional vector of the parameters to be estimated and δ x ^ is the vector of differential corrections. H is the p × n design matrix, with p number of observables, containing the partial derivatives of the observables with respect to the estimated parameters. δ x ¯ and P ¯ k represent, respectively, the a priori estimate deviation and covariance of x . δ y is the vector of residuals, i.e., the vector of differences between observed and computed observables, and W the corresponding weighting matrix. The n × n matrix P k = H k T W k H k + P ¯ k 1 1 represents the covariance matrix of the estimated parameters. Due to the non-linearity of the problem, the linearization process inherent in Equation (1) must be iterated ( k indicates the iteration number) until convergence is reached. MONTE and GODOT use the square root information filter (SRIF) algorithm for computational reasons.
The JUICE dynamical model adopted in the analysis of the two tests is quite simple. The list of estimated parameters includes only the spacecraft state (position and velocity) at the reference time, the station coordinates, and a scale factor for the solar radiation pressure acceleration. We gave ample margin to the a priori covariance matrix of the spacecraft state (100 km and 1 m/s for each component of the position and velocity), basically leaving the a priori spacecraft state unconstrained. The a priori uncertainty in the knowledge of the station location has been set to 10 cm for each axis of a X-Y-Z orthogonal reference system, as per ESA navigation office indications. The a priori uncertainty for the scale factor on the solar radiation pressure has been set to 0.05, corresponding to 3.4 10 9 m/s2 in terms of acceleration error. The list of estimated parameters together with their nominal value and a priori uncertainty is reported in the following Table 3.

4. Results

4.1. Orbit Determination Software Comparison

In this section we compare the results obtained with the two orbit determination codes, focusing on the NECP test. Although the short duration of the data arc does not allow an exhaustive assessment of the deviations in the reconstructed orbits, nonetheless it provides a first, preliminary comparison between orbital solutions from the two orbit determination codes in an operational environment [31]. Figure 1 represents the difference between the JUICE position and velocity, relative to the Sun in the ICRF frame, obtained using the GODOT and MONTE orbit propagators before any corrections are applied by their respective orbital filters. The difference in the spacecraft state is at the submillimeter level for the position and below nanometer per second for the velocity. This comparison underlines that the implemented dynamical models and integrators in the two codes provide almost identical results. By extending the integration time, we demonstrated that over a 5-day period, the positional divergence remained below 3 mm, while the velocity divergence was under 4 nm/s.
The left panel of Figure 2 shows the difference between computed range and Doppler measurements generated by the two codes on the trajectory propagated starting from the same initial conditions. Doppler residuals are flat, but there is an average offset of ~1.2 μm/s mainly related to the ITRF implementation, corresponding to a slightly different station position in the inertial reference frame that causes a compatible drift in the difference of 2-way range computed observables. By using a longer time span, it has been verified that the peak-to-peak variation in two codes is quasi-periodic and smaller than 3 cm. The right panel of Figure 2 shows the difference between the computed observables obtained with the two setups after the last iteration of the estimation process, when convergence is reached. The distribution of Doppler residuals is quite similar in both plots, but the fitting procedure reduced the offset to 0.045 μm/s, a value compatible with a range residual difference below one millimeter. The standard deviation (STD) at 1s of integration time is at the level of 0.025 mm/s, but it strongly reduces at higher integration time following a linear dependence with time (e.g., below 0.5 μ m / s at 60 s) showing a thermal noise-like behavior, see Section 4.2.
Table 4 compares the two filter solutions by showing the differences in each estimated parameter along with their associated uncertainties. All deviations fall within the 1-σ uncertainty level. The average ratio of deviations to uncertainties is 0.06%, indicating a high degree of statistical compatibility between the solutions. The estimated parameter reconstructed uncertainties reported in Table 4 differ by less than 0.04% between the two setups. As expected, the filter is less sensitive to spacecraft displacement along the Z axis, as this axis is nearly orthogonal to the spacecraft-Earth line of sight. Due to the short duration of the radio tracking data, the filter is not very sensitive to small deviations in the station location or to solar radiation pressure acceleration. These effects do not have sufficient time to generate significant signatures over the short duration of the radio tracking pass. The parameters of both the dynamical and observation models were included in the analysis to validate the robustness of the estimation process. Statistically compatible results were obtained, even when only the dynamical model parameters were estimated. We repeated the same analysis for the first payload checkout test campaign, obtaining the same qualitative results.

4.2. Data Quality

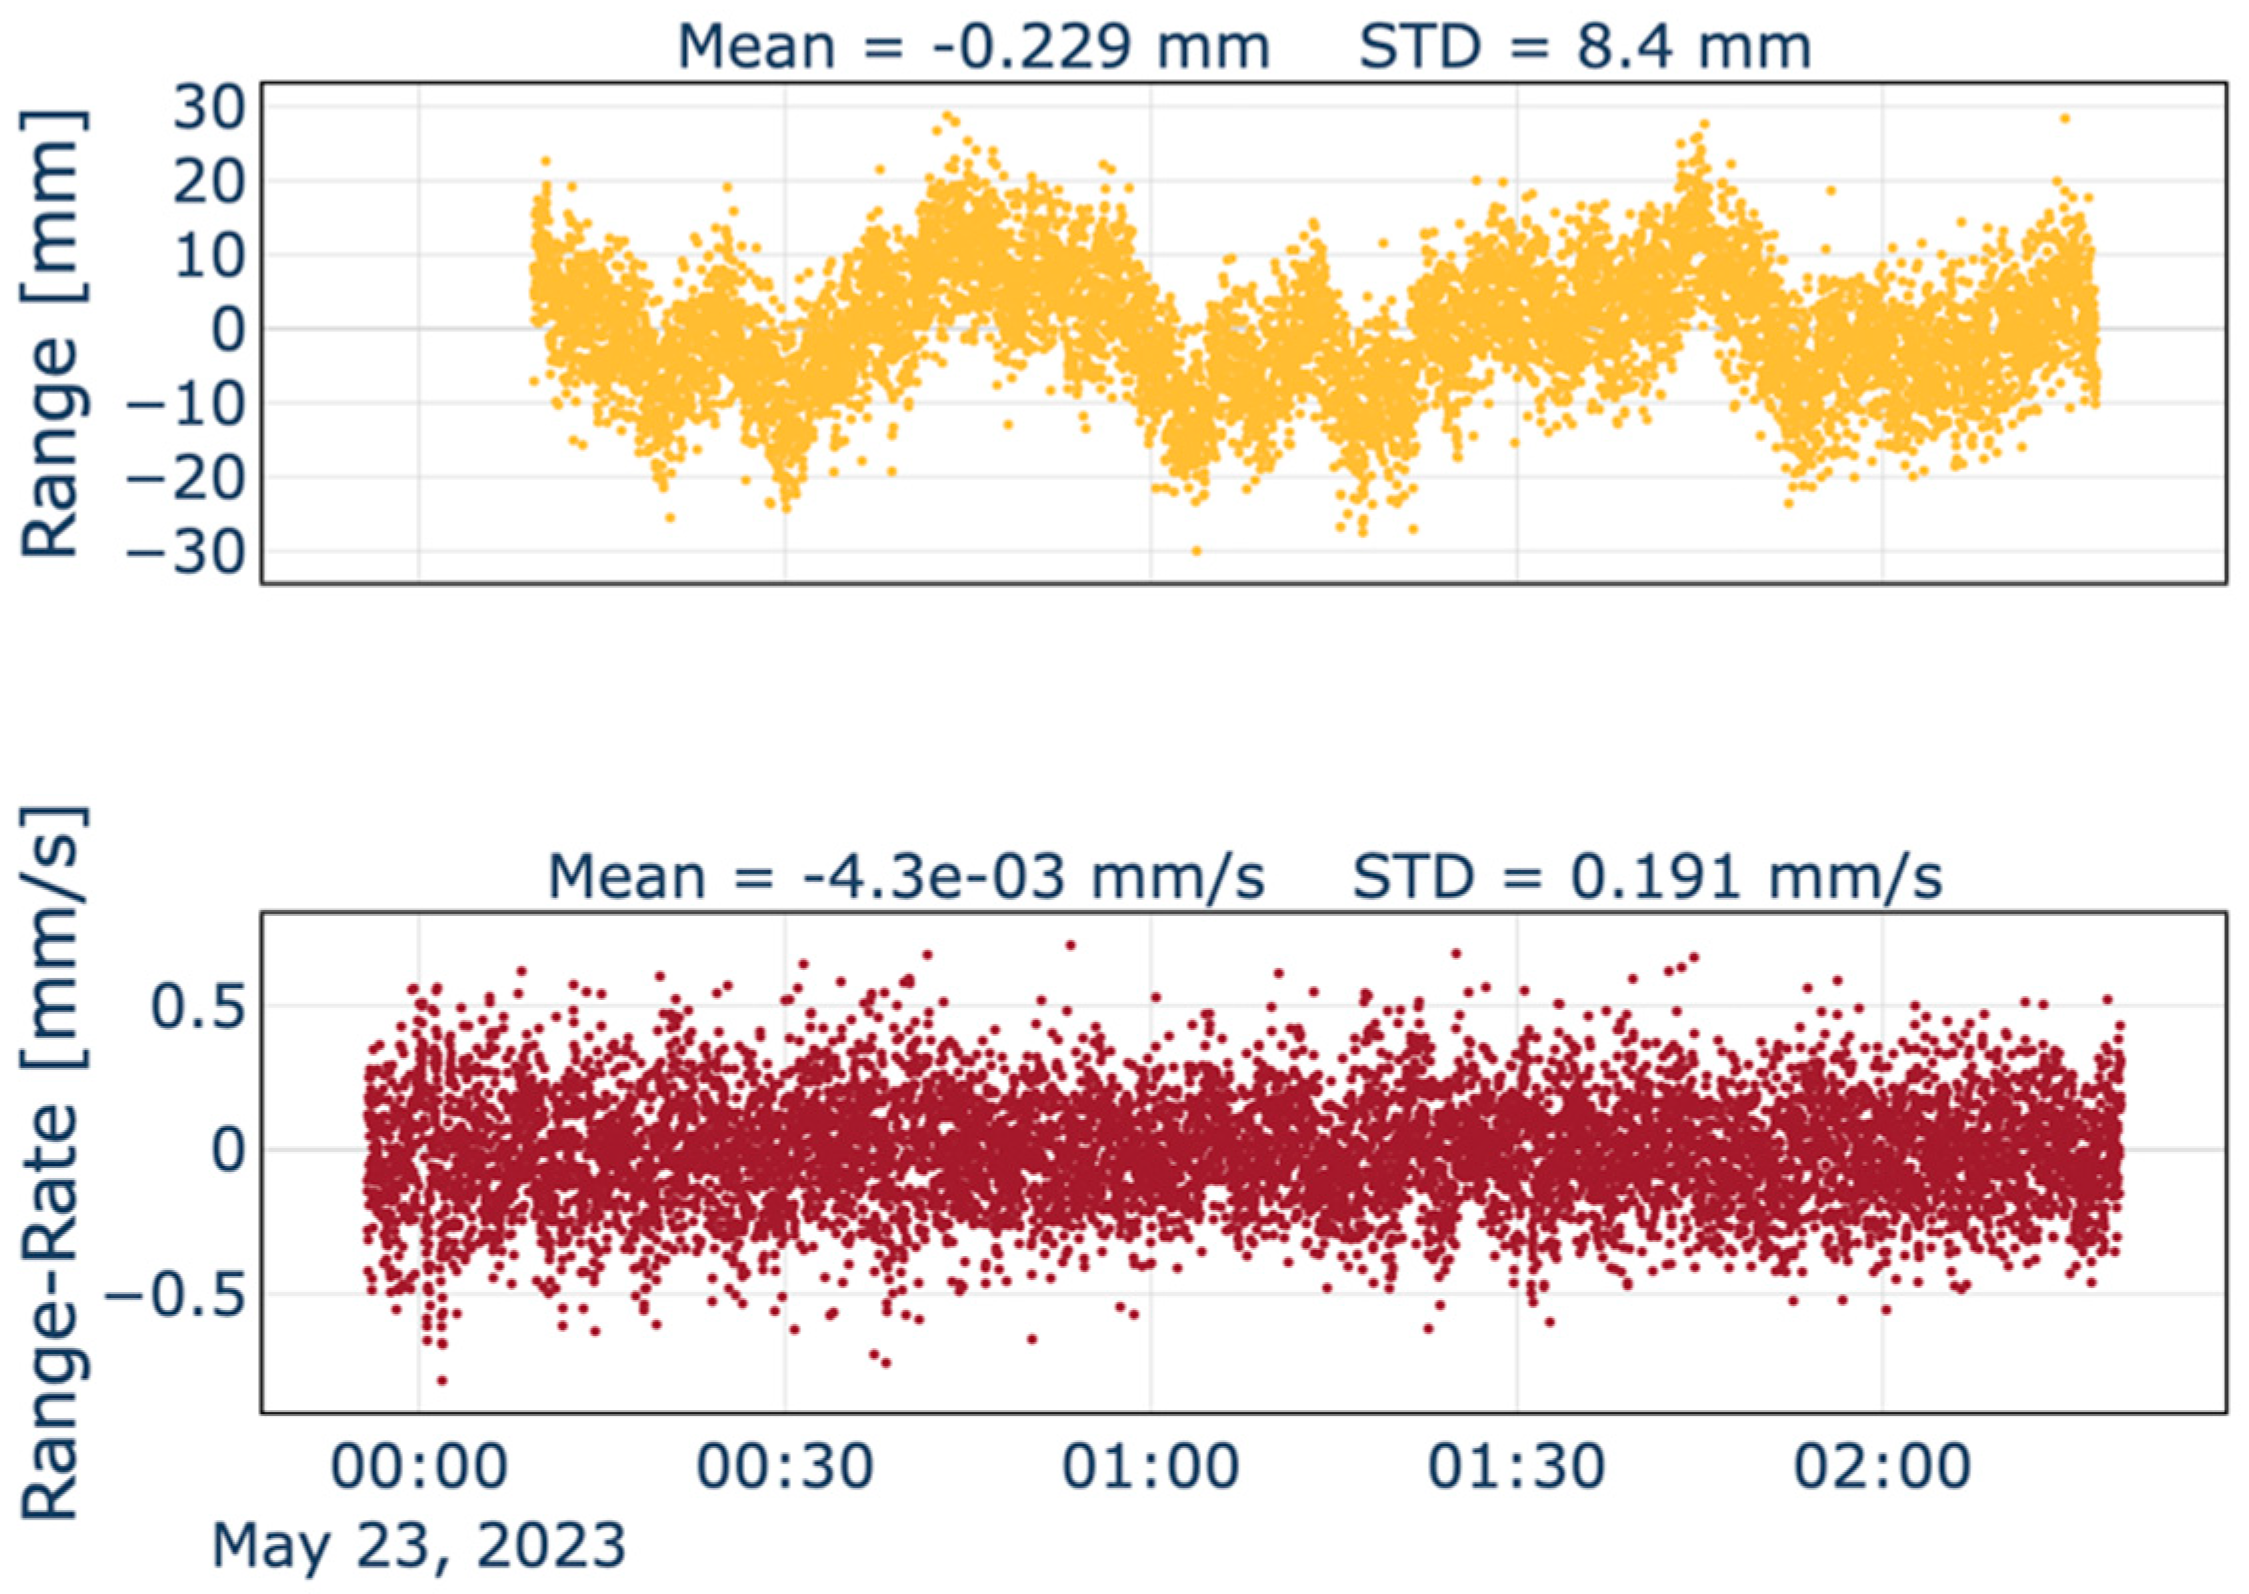
The range and range-rate residuals of the NECP pass are shown in Figure 3. The standard deviation of the range-rate @ 1s of integration time is 0.191 mm/s. The noise on the Doppler dataset is almost a factor of 2 higher than expected because the TDCS calibrations were not available during the test. In addition, no rain or hail was detected at the station site, but winds up to 8 m/s were recorded at the time of the experiment. As noticed with BepiColombo data [21], the wind at the station can significantly impact the overall Doppler noise, contributing up to 50% of the error budget. The range residuals show a smaller standard deviation (8.4 mm) with respect to the one expected during the science phase at Jupiter (see Section 2). This is due to the fact that the range jitter is dominated by thermal noise; thus with a higher signal to noise ratio [18], it is expected to achieve a lower noise. The visible signatures in the range residuals are probably due to small uncalibrated atmospheric effects at the level of a few millimeters.
During the NECP operations, Doppler and range measurements obtained from the telecommunication link were also recorded. The Doppler noise @1s of integration time is 0.233 mm/s and 0.252 mm/s for the X/X and X/Ka link, respectively. The nearly equal value of the residuals is due to the dominance of thermal noise at 1 s and by the small path delay due to charged particles (a consequence of the small distance of the spacecraft). The X/X link range residuals show a jitter noise at a level of 18.6 cm, while the X/Ka link residuals have an overall standard deviation of 9.35 cm, as reported in Figure 4. This difference is due to the different settings in the DST telemetry for X- and Ka-band. Notably, the X/Ka residuals display two distinct regions with different noise levels. Before 23 May 2023 01:07 UTC the noise is at the level of 6.2 cm, while after that it increases to 9.6 cm. This can be explained by the activation of the telemetry modulation on the X/Ka link after 1:07 UTC, which reduces the power available to the ranging channel.
Not surprisingly, the plasma-free Doppler and range observables [15,16] did not provide significant improvement for the same reasons indicated above in the comparison of the X/X and X/Ka residuals. The range-rate performance is in line with the performance of the Ka/Ka link, while the range standard deviation increased from 0.84 to 1.5 cm because of the higher thermal noise added on the plasma-free observables by the X/X and X/Ka link [19,32].
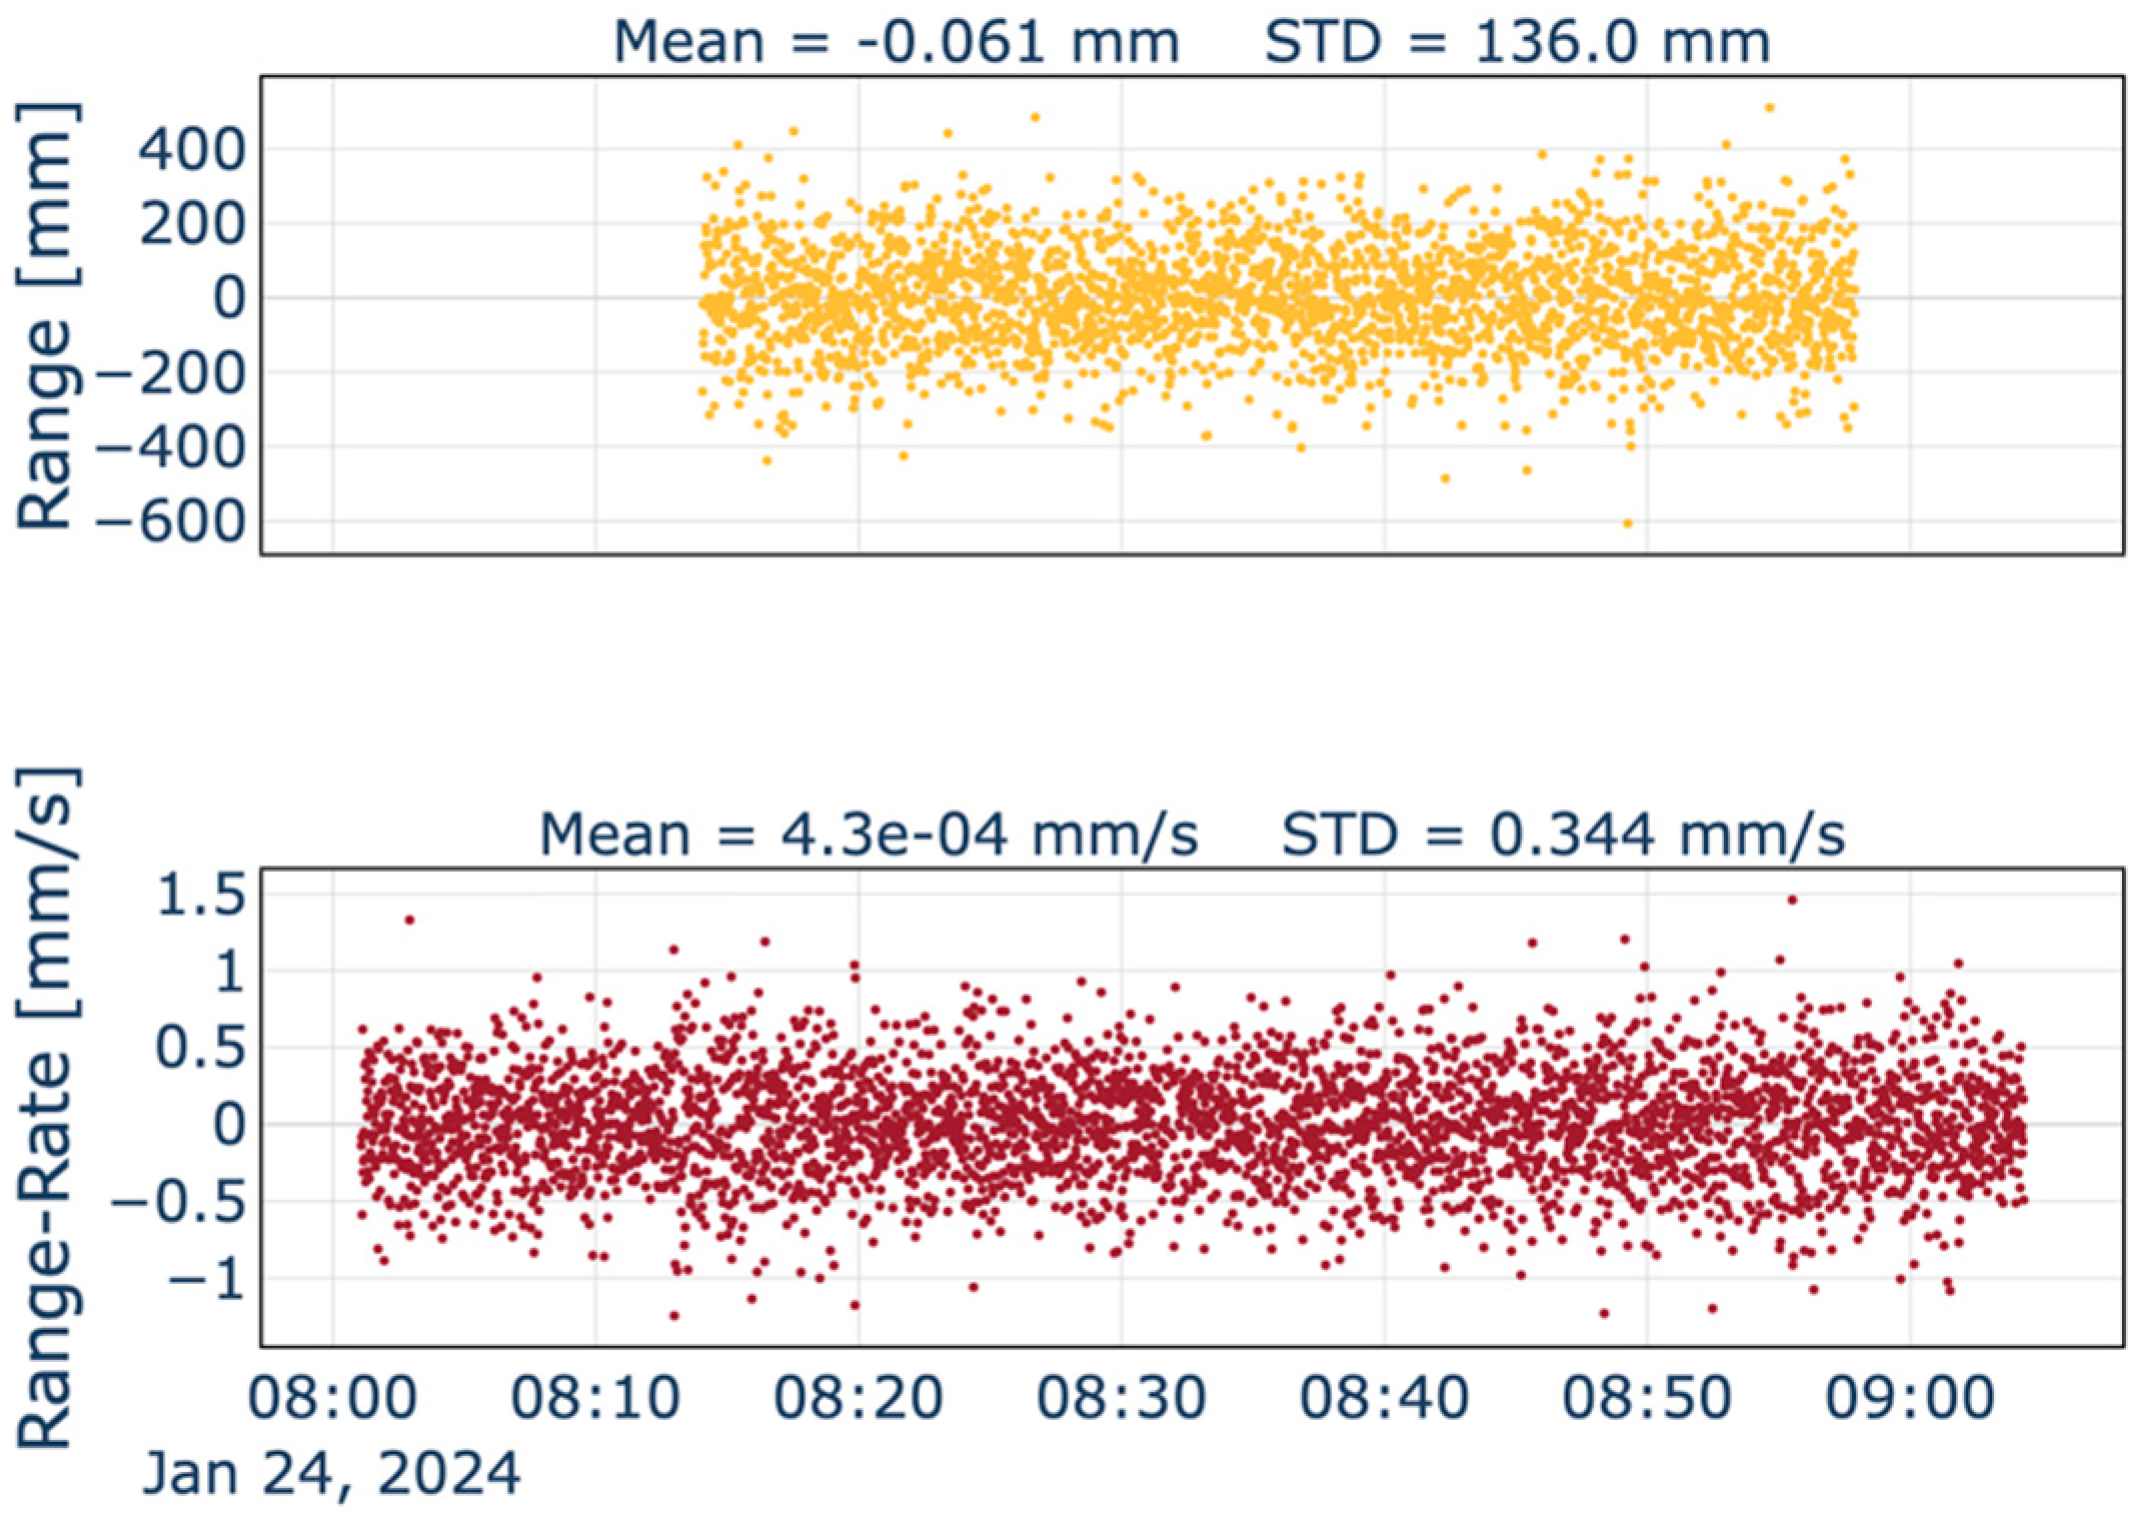
The Ka/Ka data from the first payload checkout show a significantly larger noise at 1s in both Doppler and range measurements. In particular, the range-rate noise at 1s integration time increased to 0.343 mm/s and to 13.6 cm for range (see Figure 5 for a plot of the Allan deviation of the Doppler measurements). Further investigations conducted by ESA and 3GM teams concluded that the radio frequency power level was caused by a specific setting used at DSA-3 during the test. This setting caused the antenna to operate at the edge of the main lobe of its antenna pattern, resulting in a power loss of more than 20 dB. Noteworthy, this signal level is representative of the power level [33] that can be expected at Jupiter, providing initial hints of the attainable KaT measurement performances during the nominal science phase.
The left panel of Figure 6 presents the autocorrelation function of the Ka/Ka Doppler residuals for the NECP, in red, and the PC01, in cyan. The red line shows a clear peak at the round-trip light time (62 s, see Table 1), suggesting that a large local noise at the station dominates the noise budget [34,35]. This local noise could be due to wet tropospheric path delay variations or to antenna mechanical noise, possibly caused by wind gusts. Note that during NECP tropospheric delay calibrations from TDCS were not available. At a time-lag of 1s, the cyan line instead shows a large negative peak with a value close to −0.5, as expected in the case of a large thermal noise [36]. The right panel of Figure 6 shows the power spectral density (PSD) computed using the Welch method [37] with a 1024-sample window. This technique reduces noise in the PSD estimation while preserving its main characteristics. Coherently with the autocorrelation function (left panel of Figure 6), the PSD (red curve) shows a clear periodic behavior with zeros at odd multiples of f = 1 2 R T L T , as expected for local noises at the ground station [34]. The data collected during PC01 exhibit a marked thermal noise, shown by a PSD increasing with a power law f 2 for frequencies higher than 0.05 Hz [38].
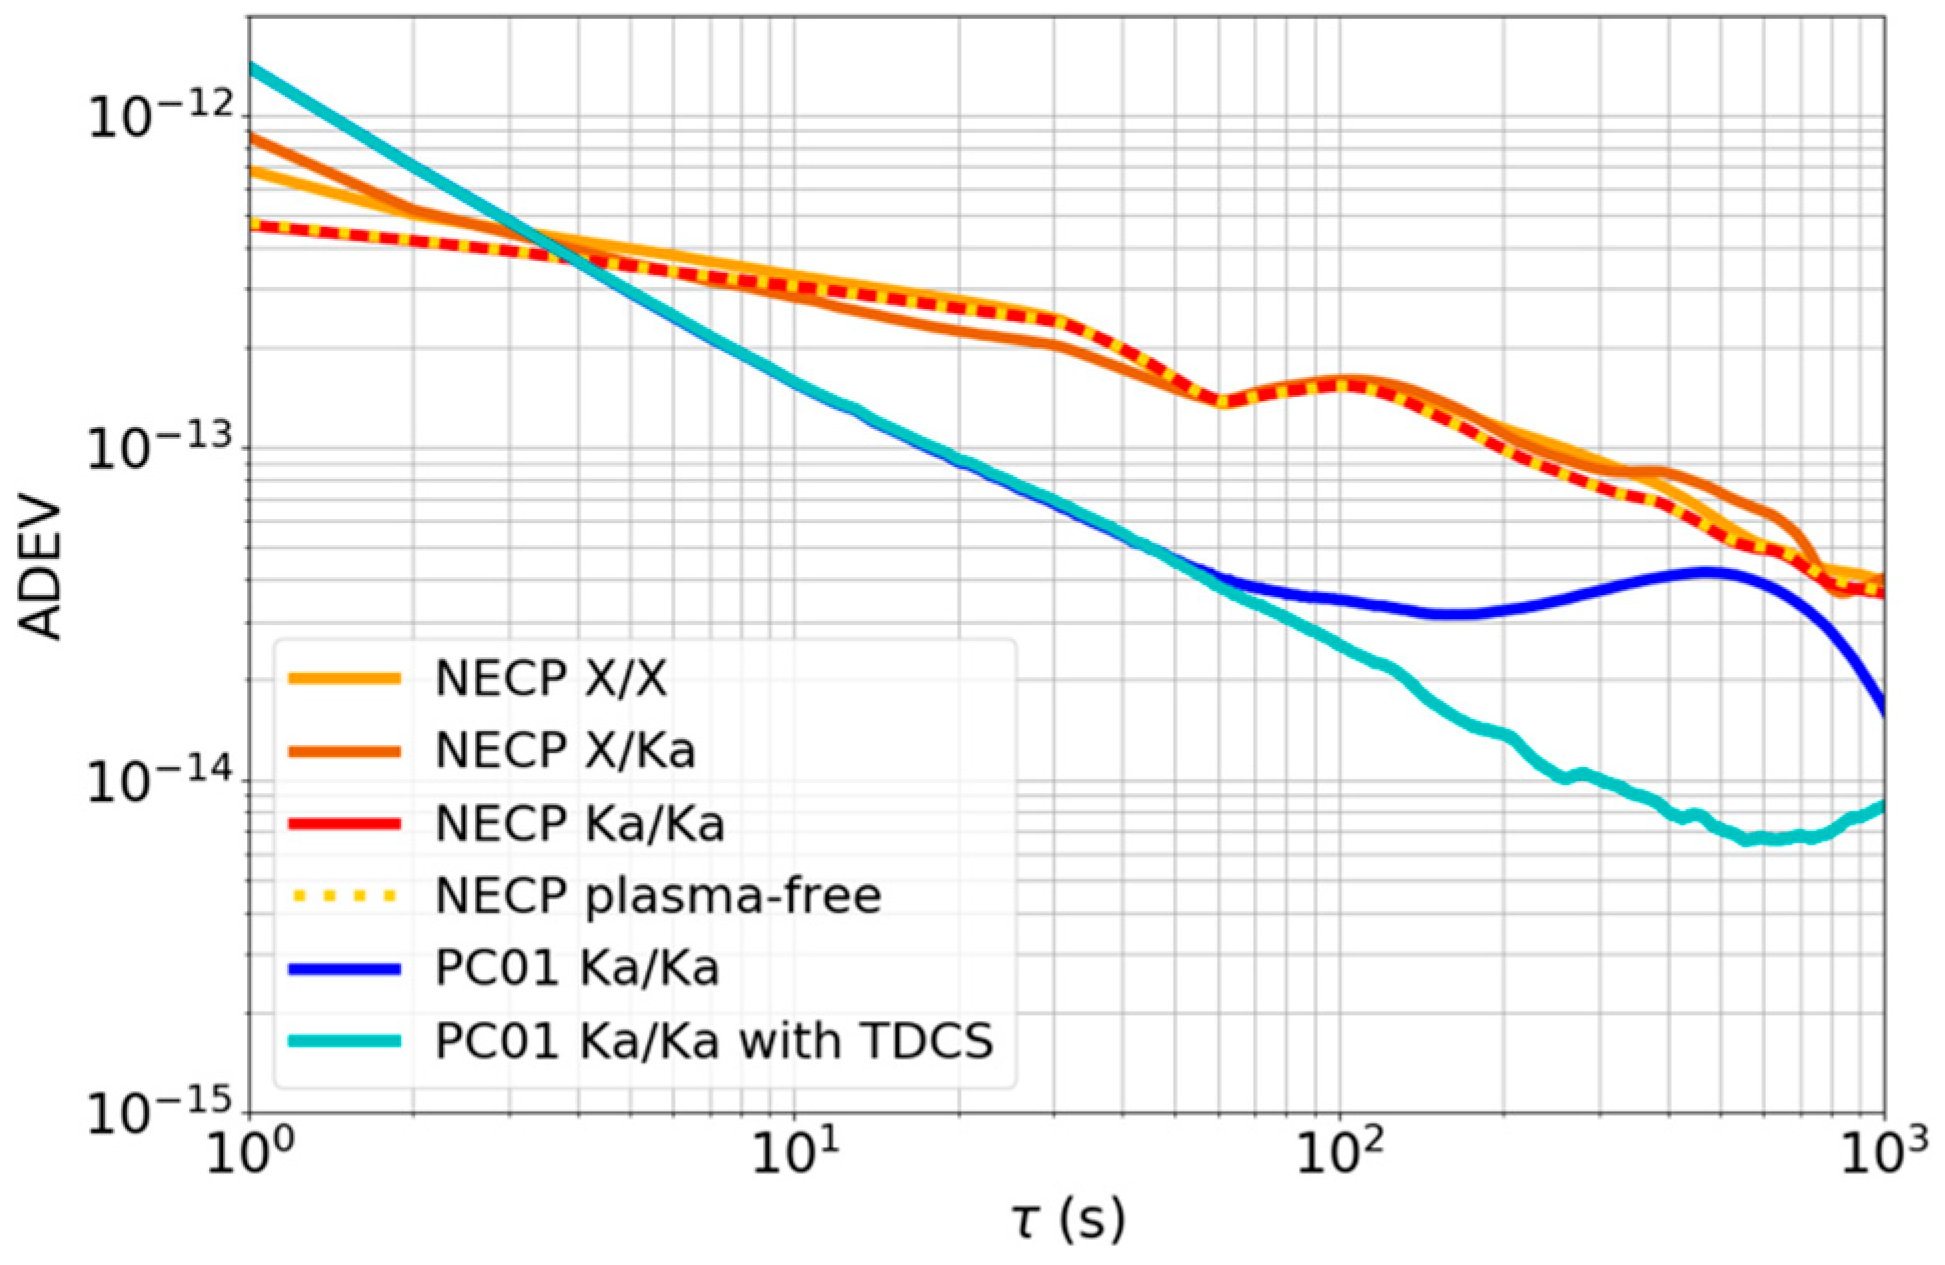
Figure 7 reports the overlapping Allan deviation (ADEV) [38] of Doppler residuals collected during both observation campaigns. The X/X, X/Ka and Ka/Ka link during the NECP, reported in orange, brown, and red, respectively, show very similar behavior. The spacecraft was very close to the Earth, and the interplanetary plasma noise did not significantly affect the noise budget. This is confirmed also by looking at the ADEV of the plasma-free observable [19], reported with a yellow dotted line. In this campaign, local noises at the ground station degrade the quality of the Doppler data. This is also confirmed by the knee in the ADEV curve at an integration time close to the round-trip light time [35].
During the second observation campaign, only Ka/Ka data were collected, and we can notice a clear difference between the Ka/Ka link calibrated by GNSS data (blue line) and the Ka/Ka link data calibrated with the TDCS (cyan line). For timescales τ below 20 s the two curves are identical, and the dominant noise source is thermal noise, consistent with σ τ 1 [38]. For τ > 20   s the effect of the removal of tropospheric noise is clearly detectable. We can also notice that the knee at the round-trip light time of 260 s disappears if TDCS calibrations are used, suggesting that tropospheric water vapor effects are strongly reduced. The TDCS provided an improvement in the ADEV of the Doppler residuals by a factor of 5.8 at 400 s and a factor of 2 at 1000 s of integration time.

5. Conclusions

In this work we analyzed the first KaT radiometric data collected by the ESA/ESTRACK DSA-3 station located in Malargüe, Argentina, during the first mission tests of the JUICE/3GM investigation. The KaT was operated during the NECP and the first payload checkout in May 2023 and January 2024, respectively. The range and Doppler measurements were analyzed using NASA’s MONTE and ESA’s GODOT orbit determination software. We demonstrated that starting from the same dynamical model, the difference between the spacecraft trajectories computed with the two integrators is below the millimeter level. We noticed that the error associated with the observational model is at the level of a few centimeters for range measurements and 0.025 mm/s for range-rate at 1 s. These values are compatible with the use of different numerical realizations of the ITRF adopted by the two codes. The differential error on the computed observables significantly decreases at higher integration times, following a power law that is inversely proportional to time. We also demonstrated that at convergence the two orbit determination solutions are in very good agreement and largely statistically compatible.
The 3GM radio link performance during NECP passes achieved a range measurement precision of 8.4 mm at 1 s integration time and a range-rate precision of 0.012 mm/s at 1000 s. The X/X and X/Ka telecommunication links showed similar performances in terms of Doppler noise, while the range data showed a standard deviation of 18.6 and 9.35 cm, respectively. We also demonstrated the full implementation of the multifrequency radio link configuration, although, as expected, the plasma-free observables did not lower the noise level because of the small plasma content in the signal’s path.
Data acquired during the first payload checkout could benefit from the tropospheric delay calibration system (inactive during NECP). The calibrated range-rate residuals attained a noise lower than 0.003 mm/s at 1000 s while the noise standard deviation of range measurement was 13.6 cm. The power levels during this checkout closely matched those expected at Jupiter, indicating promising performance of the 3GM experiment during the Jovian phase.

Author Contributions

Conceptualization, P.C. and A.S.; methodology, P.C. and A.S.; software, P.C., A.S., D.D., R.M. and B.G.; validation. P.C., A.S., D.D., U.D.F., I.d.S. and M.D.B.; formal analysis, P.C. and A.S.; investigation, P.C. and A.S.; resources, L.I.; data curation, P.C. and A.S.; writing—original draft preparation, P.C. and A.S.; writing—review and editing, all authors; visualization, P.C. and A.S.; supervision, D.D., L.I. and R.M.; project administration, L.I., M.D.B. and P.C.; funding acquisition, L.I. All authors have read and agreed to the published version of the manuscript.

Funding

This work has been partially funded by the Italian Space Agency (ASI) with the contract n. 2023-6-HH.0.

Data Availability Statement

The kernels of the mission are publicly available at: https://doi.org/10.5270/esa-ybmj68p. The radio tracking measurements dataset presented in this article are not readily available because they are test data that belong to the 3GM instrument team. Requests to access the datasets should be directed to luciano.iess@uniroma1.it.

Acknowledgments

The 3GM team would like to thank Nicolas Altobelli, Claire Vallat, Ignacio Tanco, Angela Dietz, Jose Villalvilla, Frank Budnik, and all the JUICE mission operation team for the planning and execution of the test. We also acknowledge the use of the GODOT and MONTE frameworks.

Conflicts of Interest

The authors declare no conflicts of interest. The funders had no role in the design of the study; in the collection, analyses, or interpretation of data; in the writing of the manuscript; or in the decision to publish the results.

References

  1. Grasset, O.; Dougherty, M.; Coustenis, A.; Bunce, E.; Erd, C.; Titov, D.; Blanc, M.; Coates, A.; Drossart, P.; Fletcher, L.; et al. JUpiter ICy moons Explorer (JUICE): An ESA mission to orbit Ganymede and to characterise the Jupiter system. Planet. Space Sci. 2013, 78, 1–21. [Google Scholar] [CrossRef]
  2. Tosi, F.; Roatsch, T.; Galli, A.; Hauber, E.; Lucchetti, A.; Molyneux, P.; Stephan, K.; Achilleos, N.; Bovolo, F.; Carter, J.; et al. Characterization of the Surfaces and Near-Surface Atmospheres of Ganymede, Europa and Callisto by JUICE. Space Sci. Rev. 2024, 220, 59. [Google Scholar] [CrossRef]
  3. Buccino, D.R.; Parisi, M.; Gramigna, E.; Gomez-Casajus, L.; Tortora, P.; Zannoni, M.; Caruso, A.; Park, R.S.; Withers, P.; Steffes, P.; et al. Ganymede’s Ionosphere Observed by a Dual-Frequency Radio Occultation With Juno. Geophys. Res. Lett. 2022, 49, e2022GL098420. [Google Scholar] [CrossRef]
  4. Fletcher, L.N.; Cavalié, T.; Grassi, D.; Hueso, R.; Lara, L.M.; Kaspi, Y.; Galanti, E.; Greathouse, T.K.; Molyneux, P.M.; Galand, M.; et al. Jupiter Science Enabled by ESA’s Jupiter Icy Moons Explorer. Space Sci. Rev. 2023, 219, 53. [Google Scholar] [CrossRef]
  5. Feltens, J.; Bellei, G.; Springer, T.; Kints, M.V.; Zandbergen, R.; Budnik, F.; Schönemann, E. Tropospheric and ionospheric media calibrations based on global navigation satellite system observation data. J. Space Weather Space Clim. 2018, 8, A30. [Google Scholar] [CrossRef]
  6. Lasagni Manghi, R.; Bernacchia, D.; Casajus, L.G.; Zannoni, M.; Tortora, P.; Martellucci, A.; De Vicente, J.; Villalvilla, J.; Maschwitz, G.; Cappuccio, P.; et al. Tropospheric Delay Calibration System Performance During the First Two BepiColombo Solar Conjunctions. Radio Sci. 2023, 58, e2022RS007614. [Google Scholar] [CrossRef]
  7. Lasagni Manghi, R.; Zannoni, M.; Tortora, P.; Martellucci, A.; De Vicente, J.; Villalvilla, J.; Mercolino, M.; Maschwitz, G.; Rose, T. Performance Characterization of ESA’s Tropospheric Delay Calibration System for Advanced Radio Science Experiments. Radio Sci. 2021, 56, e2021RS007330. [Google Scholar] [CrossRef]
  8. Evans, S.; Taber, W.; Drain, T.; Smith, J.; Wu, H.-C.; Guevara, M.; Sunseri, R.; Evans, J. MONTE: The next generation of mission design and navigation software. CEAS Space J. 2018, 10, 79–86. [Google Scholar] [CrossRef]
  9. Cappuccio, P.; Di Benedetto, M.; Durante, D.; Iess, L. Callisto and Europa Gravity Measurements from JUICE 3GM Experiment Simulation. Planet. Sci. J. 2022, 3, 199. [Google Scholar] [CrossRef]
  10. Cappuccio, P.; Hickey, A.; Durante, D.; Di Benedetto, M.; Iess, L.; De Marchi, F.; Plainaki, C.; Milillo, A.; Mura, A. Ganymede’s gravity, tides and rotational state from JUICE’s 3GM experiment simulation. Planet. Space Sci. 2020, 187, 104902. [Google Scholar] [CrossRef]
  11. Van Hoolst, T.; Tobie, G.; Vallat, C.; Altobelli, N.; Bruzzone, L.; Cao, H.; Dirkx, D.; Genova, A.; Hussmann, H.; Iess, L.; et al. Geophysical Characterization of the Interiors of Ganymede, Callisto and Europa by ESA’s JUpiter ICy moons Explorer. Space Sci. Rev. 2024, 220, 54. [Google Scholar] [CrossRef]
  12. Iafolla, V.; Fiorenza, E.; Lefevre, C.; Morbidini, A.; Nozzoli, S.; Peron, R.; Persichini, M.; Reale, A.; Santoli, F. Italian Spring Accelerometer (ISA): A fundamental support to BepiColombo Radio Science Experiments. Planet. Space Sci. 2010, 58, 300–308. [Google Scholar] [CrossRef]
  13. Fayolle, M.; Magnanini, A.; Lainey, V.; Dirkx, D.; Zannoni, M.; Tortora, P. Combining astrometry and JUICE-Europa Clipper radio science to improve the ephemerides of the Galilean moons. Astron. Astrophys. 2023, 677, A42. [Google Scholar] [CrossRef]
  14. De Marchi, F.; Gaetano, D.A.; Giuseppe, M.; Paolo, C.; Ivan, D.S.; Mauro, D.B.; Luciano, I. Observability of Ganymede’s gravity anomalies related to surface features by the 3GM experiment onboard ESA’s JUpiter ICy moons Explorer (JUICE) mission. Icarus 2021, 354, 114003. [Google Scholar] [CrossRef]
  15. De Marchi, F.; Cappuccio, P.; Mitri, G.; Iess, L. Frequency-dependent Ganymede’s tidal Love number k2 detection by JUICE’s 3GM experiment and implications for the subsurface ocean thickness. Icarus 2022, 386, 115150. [Google Scholar] [CrossRef]
  16. di Stefano, I.; Cappuccio, P.; Di Benedetto, M.; Iess, L. A test of general relativity with ESA’s JUICE mission. Adv. Space Res. 2022, 70, 854–862. [Google Scholar] [CrossRef]
  17. Cappuccio, P.; di Stefano, I.; Cascioli, G.; Iess, L. Comparison of light-time formulations in the post-Newtonian framework for the BepiColombo MORE experiment. Class. Quantum Gravity 2021, 38, 227001. [Google Scholar] [CrossRef]
  18. CCSDS Secretariat. PSEUDO-NOISE (PN) RANGING SYSTEMS. Washington, DC, USA. 2014. Available online: https://public.ccsds.org/Pubs/414x0g2.pdf (accessed on 10 October 2024).
  19. Bertotti, B.; Comoretto, G.; Iess, L. Doppler tracking of spacecraft with multi-frequency links. Astron. Astrophys. 1993, 269, 608–616. [Google Scholar]
  20. Iess, L.; Asmar, S.W.; Cappuccio, P.; Cascioli, G.; De Marchi, F.; di Stefano, I.; Genova, A.; Ashby, N.; Barriot, J.P.; Bender, P.; et al. Gravity, Geodesy and Fundamental Physics with BepiColombo’s MORE Investigation. Space Sci. Rev. 2021, 217, 21. [Google Scholar] [CrossRef]
  21. Cappuccio, P.; Notaro, V.; di Ruscio, A.; Iess, L.; Genova, A.; Durante, D.; di Stefano, I.; Asmar, S.W.; Ciarcia, S.; Simone, L. Report on first inflight data of bepicolombo’s mercury orbiter radio science experiment. IEEE Trans. Aerosp. Electron. Syst. 2020, 56, 4984–4988. [Google Scholar] [CrossRef]
  22. Park, R.S.; Folkner, W.M.; Williams, J.G.; Boggs, D.H. The JPL Planetary and Lunar Ephemerides DE440 and DE441. Astron. J. 2021, 161, 105. [Google Scholar] [CrossRef]
  23. di Stefano, I.; Cappuccio, P.; Iess, L. Precise Modeling of Non-Gravitational Accelerations of the Spacecraft BepiColombo During Cruise Phase. J. Spacecr. Rocket. 2023, 60, 1625–1638. [Google Scholar] [CrossRef]
  24. ESA SPICE Service. JUICE SPICE Kernel Dataset; European Space Agency: Paris, France, 2024. [Google Scholar] [CrossRef]
  25. Moyer, T.D. Range and Doppler Tracking Observables 3.1 The Tracking Link. In JPL DEEP SPACE COMMUNICATIONS AND NAVIGATION SERIES; 2000. Available online: https://descanso.jpl.nasa.gov/monograph/series2/Descanso2_all.pdf (accessed on 27 September 2024).
  26. Springer, T.A.; Dow, J.M. NAPEOS: Mathematical Models and Algorithms; ESOC: Darmstadt, Germany, 2009. [Google Scholar]
  27. Petit, G.; Luzum, B. IERS Conventions (2010). 2010. Available online: https://www.iers.org/IERS/EN/Publications/TechnicalNotes/tn36.html (accessed on 21 May 2024).
  28. Wallace, P.T.; Capitaine, N. Precession-nutation procedures consistent with IAU 2006 resolutions. Astron. Astrophys 2007, 464, 793. [Google Scholar] [CrossRef]
  29. Moyer, T. Formulation for Observed and Computed Values of Deep Space Network Data Types for Navigation; John-Wiley & Sons, Inc.: Hoboken, NJ, USA, 2003. [Google Scholar]
  30. Tapley, B.; Schutz, B.; Born, G.H. Statistical Orbit Determination; Elsevier: Amsterdam, The Netherlands, 2004. [Google Scholar]
  31. Zannoni, M.; Tortora, P. Numerical error in interplanetary orbit determination software. J. Guid. Control Dyn. 2013, 36, 1008–1018. [Google Scholar] [CrossRef]
  32. Mariotti, G.; Tortora, P. Experimental validation of a dual uplink multifrequency dispersive noise calibration scheme for Deep Space tracking. Radio Sci. 2013, 48, 111–117. [Google Scholar] [CrossRef]
  33. Buccino, D.R.; Oudrhiri, K.; Parisi, M.; Park, R.S.; Mazarico, E.; Tortora, P.; Withers, P.; Genova, A.; Zannoni, M. Precision of Spacecraft Doppler Tracking at Low Signal-To-Noise Ratios. Radio Sci. 2023, 58, e2023RS007703. [Google Scholar] [CrossRef]
  34. Notaro, V.; Iess, L.; Armstrong, J.W.; Asmar, S.W. Reducing Doppler noise with multi-station tracking: The Cassini test case. Acta Astronaut. 2020, 173, 45–52. [Google Scholar] [CrossRef]
  35. Armstrong, J.W.; Estabrook, F.B.; Asmar, S.W.; Iess, L.; Tortora, P. Reducing antenna mechanical noise in precision spacecraft tracking. Radio Sci. 2008, 43, RS3010. [Google Scholar] [CrossRef]
  36. Papoulis, A.; Hoffman, J.G. Probability, Random Variables, and Stochastic Processes, 4th ed.; Papoulis, A., Pillai, S.U., Eds.; McGraw-Hill: Boston, MA, USA, 2002. [Google Scholar]
  37. Townsend, R.H.D. Fast calculation of the lomb-scargle periodogram using graphics processing units. Astrophys. J. Suppl. Ser. 2010, 191, 247–253. [Google Scholar] [CrossRef]
  38. Riley, W.J.; Howe, D. Handbook of Frequency Stability Analysis; National Institute of Standards and Technology: Boulder, CO, USA, 2008; Volume 31. [Google Scholar]
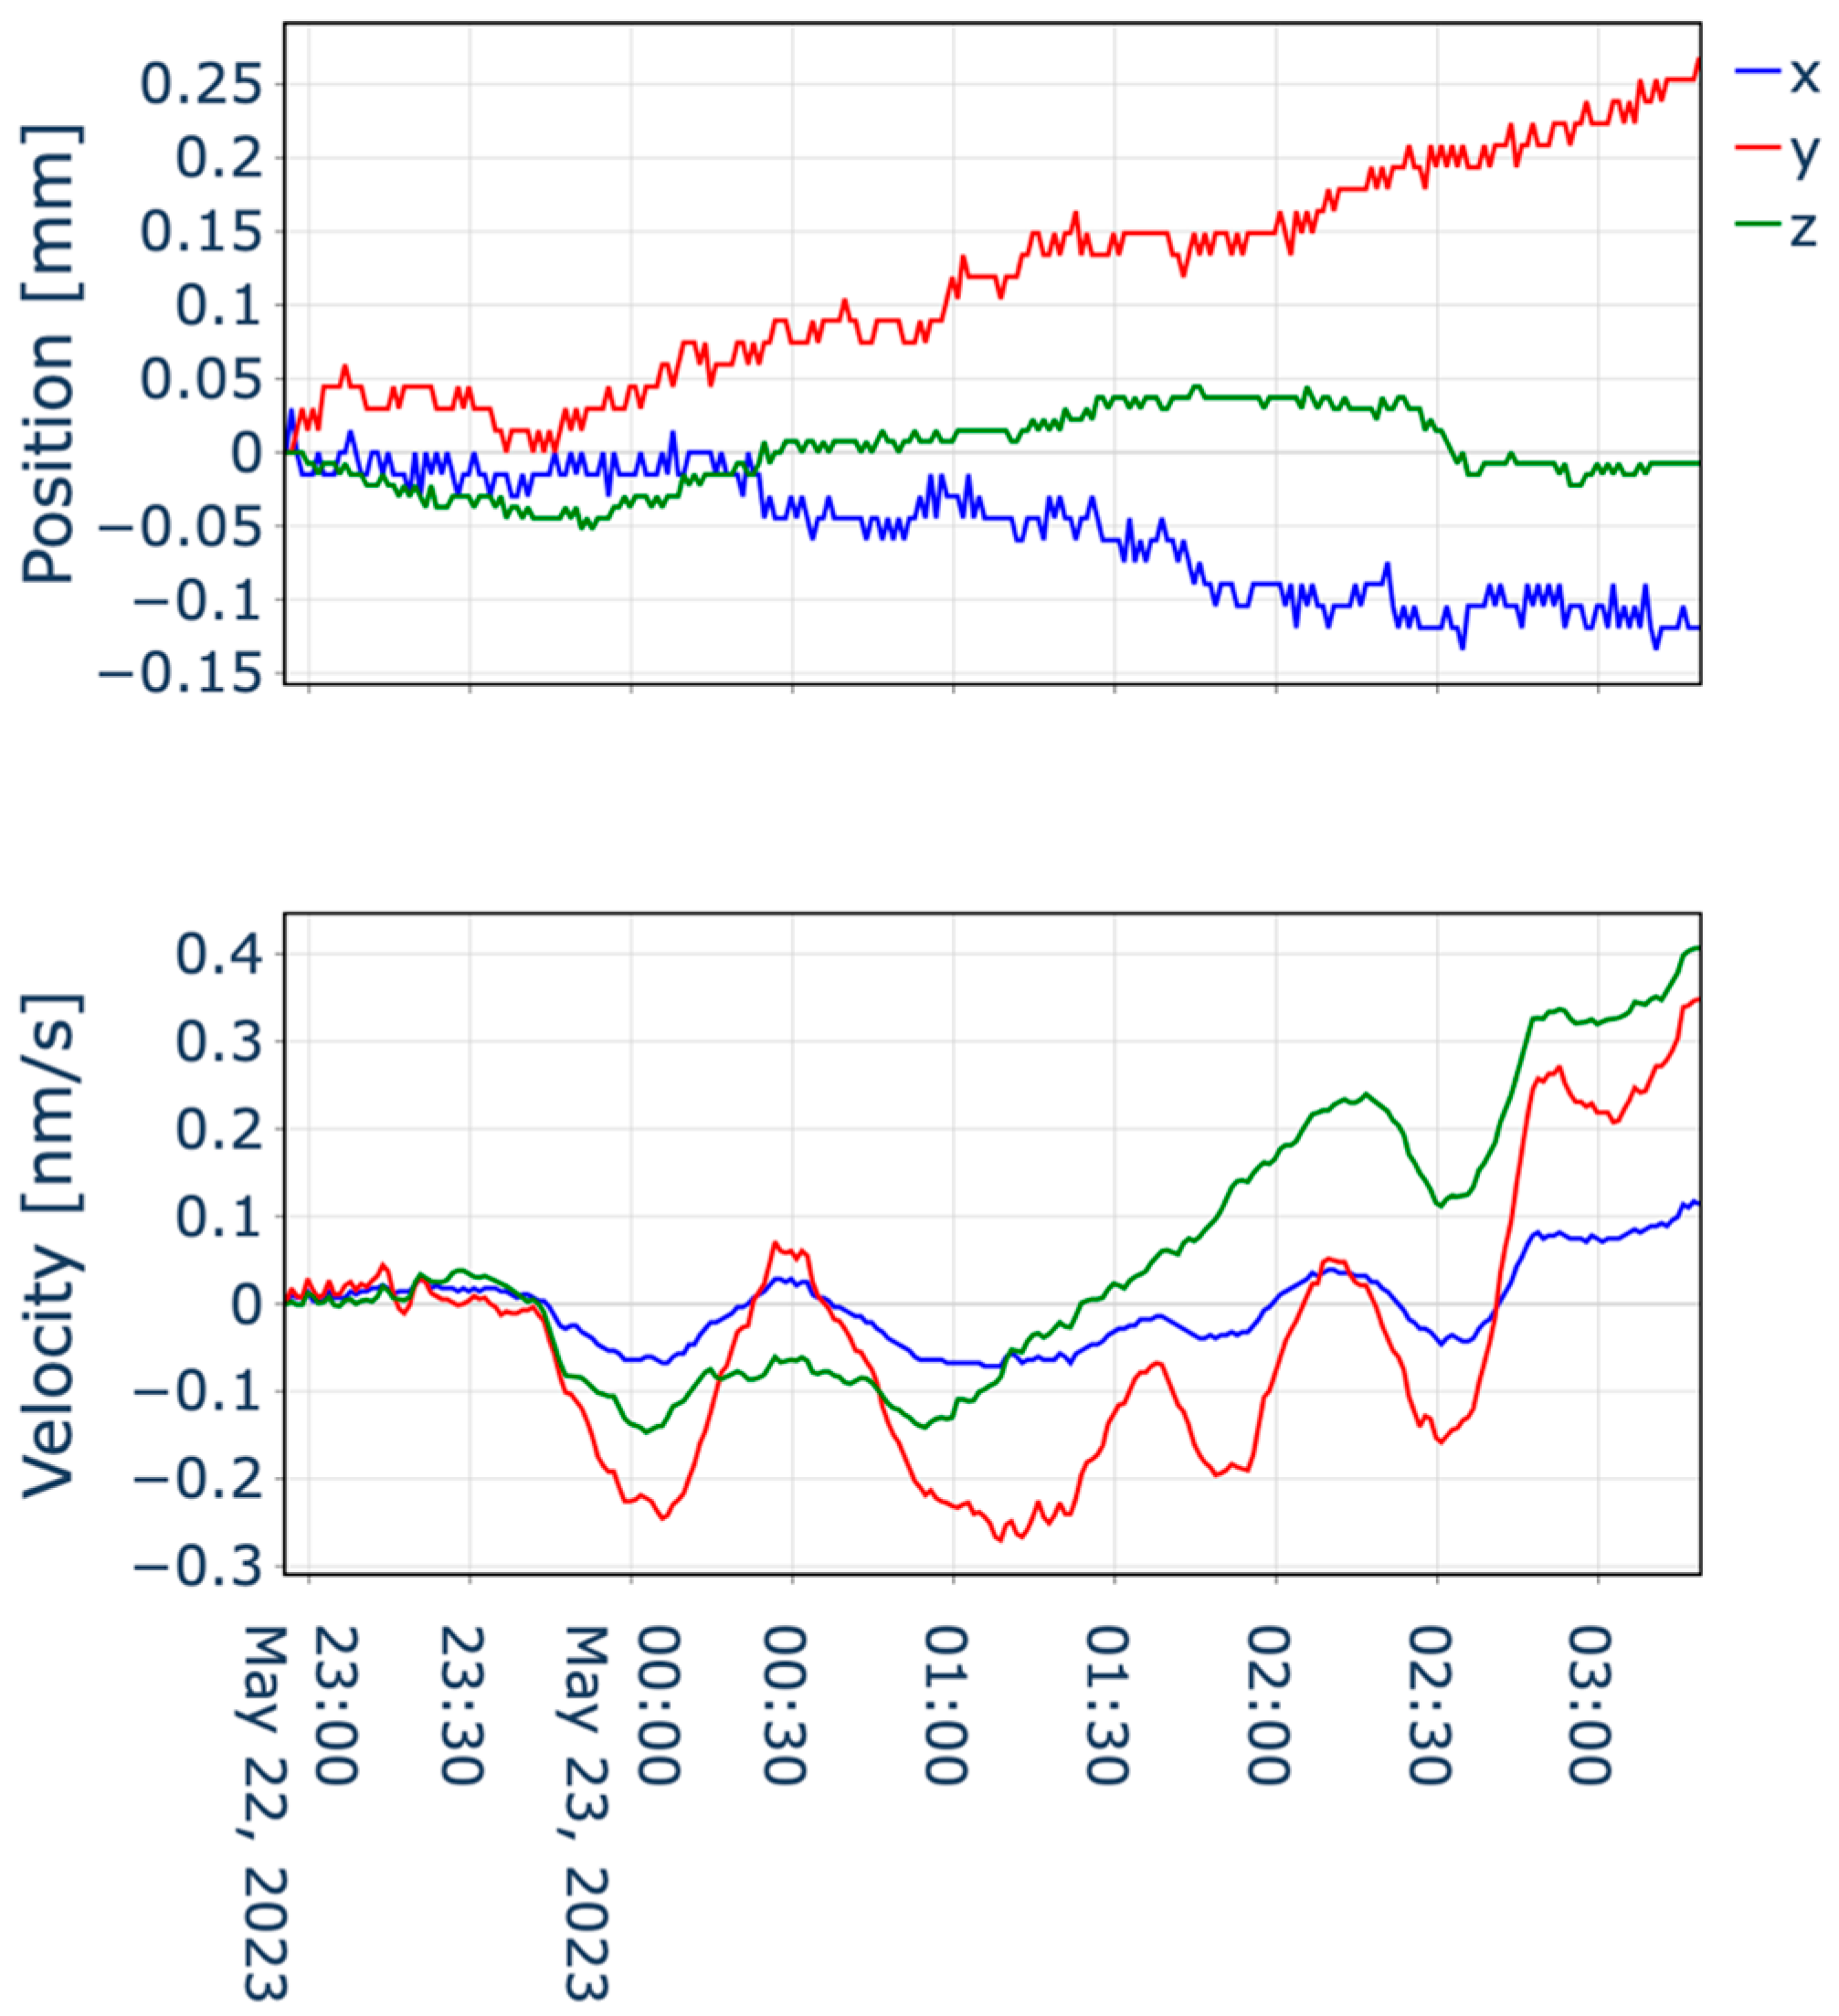
Figure 1. JUICE state vector comparison between MONTE and GODOT orbit determination software in terms of position (top) and velocity (bottom) with respect to the Sun as a function of the epoch. The blue, red, and green lines represent, respectively, the x, y, and z components in the ICRF reference frame.
Aerospace 12 00056 g001
Figure 2. Range (top) and Doppler (bottom) pass-through residuals difference @ 1s for the Ka/Ka link during the near-Earth commissioning phase between MONTE and GODOT models. The left panels show the difference in the computed observables on the trajectory propagated from the a priori initial condition; the right panels show the difference in computed observables at the end of the orbit determination procedure.
Aerospace 12 00056 g002
Figure 3. Range (top) and range-rate (bottom) residuals @ 1s for the Ka/Ka link during the near-Earth commissioning phase.
Aerospace 12 00056 g003
Figure 4. Range residuals @1s in the X/Ka link during the near-Earth commissioning phase. The standard deviation of the residuals for the first 10 min is about 6.2 cm, while the standard deviation for the remaining part is 9.6 cm. The lower noise is due to the absence of the telemetry modulation during the first 10 min.
Aerospace 12 00056 g004
Figure 5. Range (top) and range-rate (bottom) residuals @1s for the Ka/Ka link during the first payload checkout.
Aerospace 12 00056 g005
Figure 6. Autocorrelation function (left) and power spectral density (right) of Doppler residuals for the Ka/Ka link during the near-Earth commissioning phase, in red, and the first payload checkout, in cyan. The NECP residuals show a significant autocorrelation at the round-trip light time, meaning that the local noise at the station is the dominant noise source.
Aerospace 12 00056 g006
Figure 7. Overlapping Allan deviation of the relative frequency shift residuals.
Aerospace 12 00056 g007
Table 1. Main features of the two 3GM observation campaigns.
CampaignTest
Duration
LinkTropospheric CalibrationEarth-JUICE DistanceSun-JUICE DistanceRound Trip Light Time
NECP125 minKa/Ka, X/X, X/KaGNSS0.06 AU1.05 AU62 s
PC0165 minKa/KaTDCS and GNSS0.26 AU0.91 AU260 s
Table 2. Spacecraft shape element considered in the solar radiation pressure mode, according to data provided by the manufacturers. Accordingly, the specular reflective coefficients for all surfaces are assumed to be zero.
Surface ElementEffective Area C d
Solar panel (x2)43.5 m20.19
HGA5.1 m20.86
Bus2.7 m20.48
Table 3. List of estimated parameters and corresponding a priori uncertainties.
ParameterNominal ValueA Priori Uncertainty
JUICE position and velocityFrom SPICE kernels [24]100 km and 1 m/s per component
Station locationFrom ESA database10 cm per component
Solar radiation pressure scale factor1.00.05
Table 4. Comparison of estimated parameters between the MONTE and GODOT setups at convergence. The asterisk indicates that the formal uncertainties do not change from their a priori value.
ParameterDifference Between Estimated ValuesFormal Uncertainty
Spacecraft initial position [km]X 0.006
Y 0.003
Z 0.079
7.6
1.9
82.7
Spacecraft initial velocity [mm/s]X 0.055
Y 0.017
Z 0.010
24
164
542
Station location [mm]X 0.001
Y 0.002
Z   5 × 10 8
100 *
100 *
100 *
Solar radiation pressure scale factor 10 6 0.05 *
Disclaimer/Publisher’s Note: The statements, opinions and data contained in all publications are solely those of the individual author(s) and contributor(s) and not of MDPI and/or the editor(s). MDPI and/or the editor(s) disclaim responsibility for any injury to people or property resulting from any ideas, methods, instructions or products referred to in the content.