Article

Evaluation of Intelligent Auxiliary Information Presentation Mode for Collaborative Flight Formation

1
School of Aeronautic Science and Engineering, Beihang University, Beijing 100191, China
2
Department of Information Science, Beijing City University, Beijing 100083, China
*
Author to whom correspondence should be addressed.
Aerospace 2025, 12(1), 57; https://doi.org/10.3390/aerospace12010057
Submission received: 25 November 2024 / Revised: 9 January 2025 / Accepted: 14 January 2025 / Published: 16 January 2025

Abstract

:
Collaborative flight formations represent a promising operational model, but the integration of multi-source information in manned interfaces often results in cognitive overload and reduced situation awareness. This study evaluates the effectiveness of intelligent auxiliary information presentation modes in enhancing personnel capabilities. Using a simulation-based collaborative flight formation system, four presentation modes with varying levels of information and dynamics were experimentally tested and evaluated across subjective dimensions (cognitive workload, situation awareness, and interface design) and objective dimensions (design task flow information load and operational task flow information load). The results indicate that Level 3 and Level 4 modes significantly reduced mental workload and improved practical operational ability compared to the original mode. Level 3 achieved the highest interface evaluation scores, while Level 4 demonstrated the lowest design task flow information load. Both modes significantly enhanced situation awareness. Altogether, Level 3 and Level 4 resulted in the most significant improvements in personnel capabilities. These findings provide valuable insights for optimizing interface design and improving situation awareness in collaborative flight formation tasks.

1. Introduction

Unmanned Aerial Vehicles (UAVs) are increasingly used in various domains due to their simple structure, low cost, and high maneuverability [1,2]; multi-agent systems have also been widely researched and applied [3,4,5,6]. Despite these advantages, their limited autonomy presents significant challenges as they cannot match human decision-making and judgment [7] or independently navigate complex environments effectively. To address these limitations, collaborative flight formations have emerged as a promising solution and are gaining attention as a new operational model [8,9,10,11]. The collaborative flight formation includes both manned and unmanned aerial vehicles, with manned aerial vehicles serving as the command center to coordinate multiple unmanned aerial vehicles for joint operations.
The efficiency and success of task execution in collaborative flight formations depend heavily on the command system, which functions as the UAV control station integrated into the manned aerial vehicle (MAV). The human–machine interface serves as the critical medium through which commanders manage and control the formation. This system consolidates various types of data, including onboard, formation, environmental, and battlefield information, and presents it via the human–machine interface. Commanders rely on this interface to access information, assess the situation, and make timely decisions and actions [12,13].
In dynamic and complex task environments, commanders are often faced with the challenge of making high-stakes decisions under the pressure of processing rapidly changing information. This could lead to a decline in situation awareness and an increase in cognitive load, negatively affecting task performance and compromising the safety of the flight formation [14,15,16]. The design of human–machine interfaces can be an effective solution to this problem. Researchers have demonstrated the benefits of optimized interface design in various fields, such as autonomous system control [17], nuclear process control [18], and urban search and rescue [19], showing its ability to improve situation awareness. In collaborative flight formation systems, interface information plays a crucial role in influencing operators’ performance. To address the decline in personnel capabilities caused by information overload, this study proposes different intelligent auxiliary information presentation modes to optimize the human–machine interface. The intelligent auxiliary information presentation mode can follow the task, intelligently provide the required accurate information, and present it to the operator in different dynamic forms.
Research on human–machine interface evaluation primarily focuses on assessing mental workload, situation awareness, and interface usability, as well as developing relevant evaluation metrics. Some studies on human–machine interface evaluation are shown in Table 1. However, many studies in the early stages of interface design rely heavily on human experience, which often limits their ability to effectively analyze and adapt to variations in personnel capabilities. This highlights the need for more robust and systematic approaches to interface evaluation and design.
In conclusion, research on collaborative flight formations has become a prominent focus, driven by the need to address the decline in personnel capabilities caused by information overload. Optimizing the human–machine interface is a key solution for enhancing situation awareness. To this end, we have developed several intelligent auxiliary information presentation modes. While numerous evaluation methods exist for human–machine interfaces, few specifically target the assessment of interface information.
This study aims to bridge that gap by conducting experimental evaluations from both subjective and objective perspectives. It examines factors such as cognitive workload, situation awareness, information load, operational performance, and design effectiveness. Through this comprehensive analysis, this study seeks to identify the most effective mode, providing a foundation for methods to enhance personnel capabilities in collaborative flight formation systems.

2. Collaborative Flight Formation Simulation System

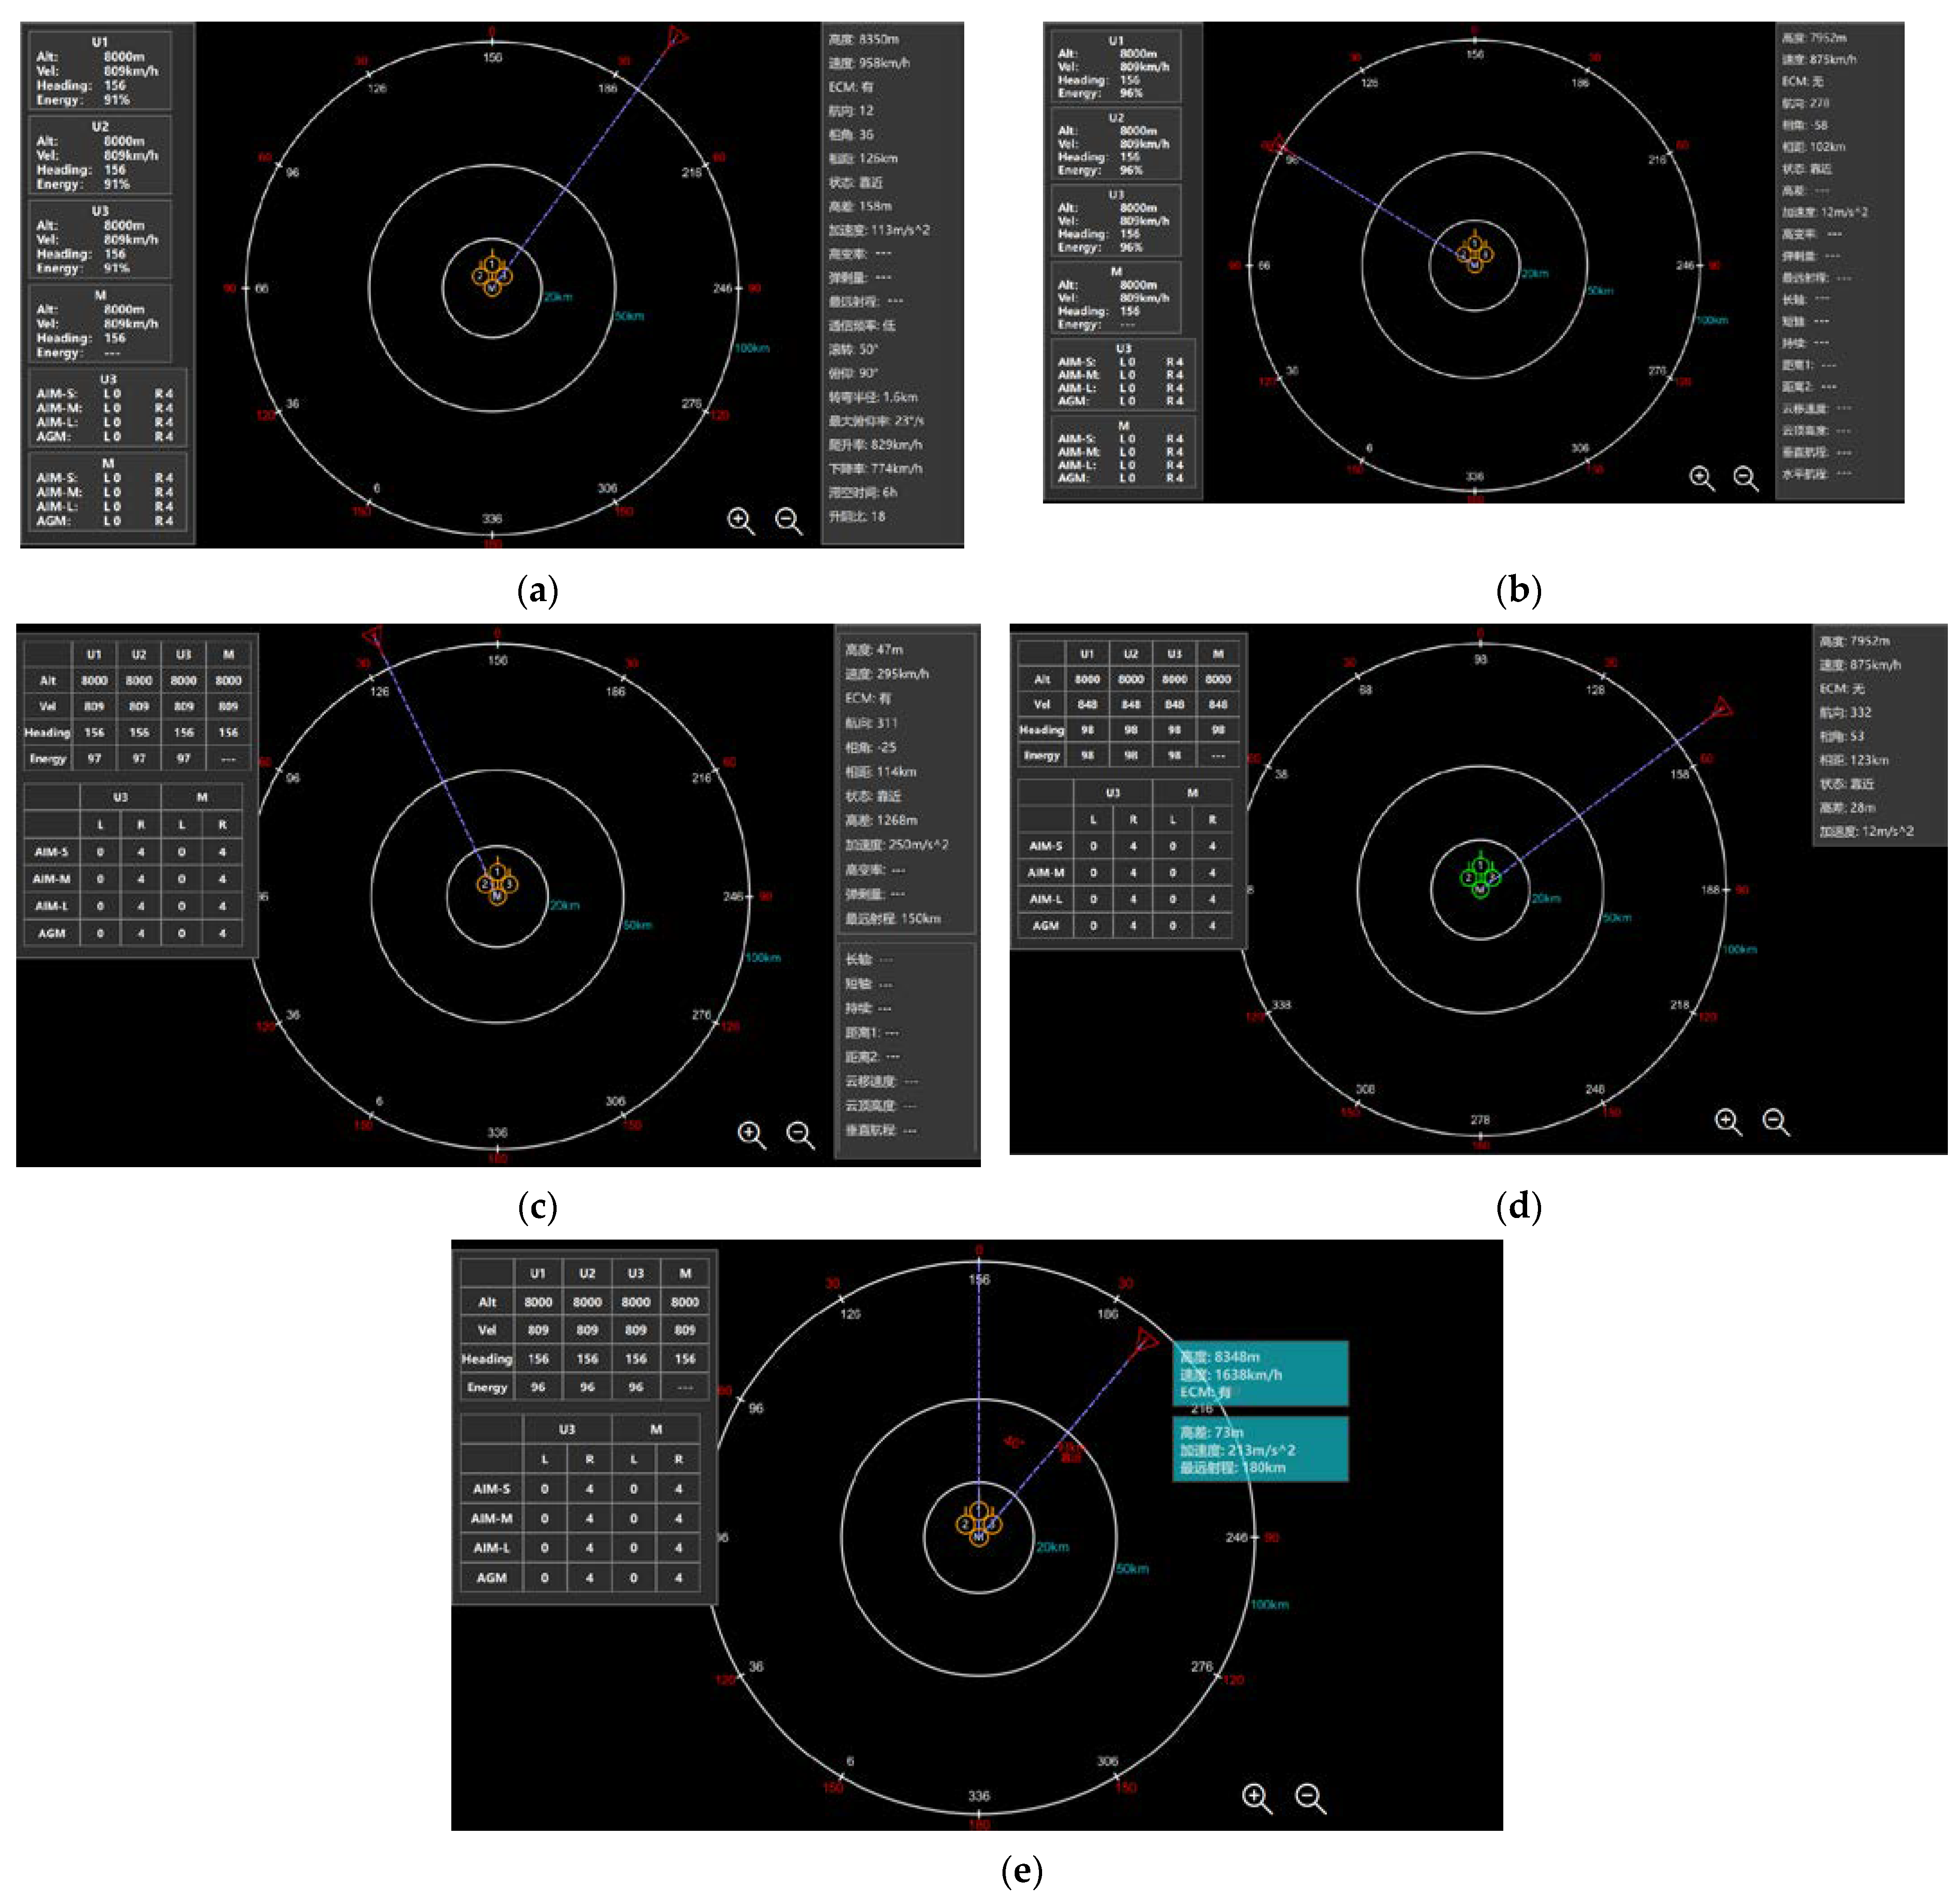
2.1. Simulation Mission and Interface Display

A simulation system [33] was developed to model collaborative flight formations, consisting of one manned aerial vehicle (MAV) and three unmanned aerial vehicles (UAVs) [34]. In this system, the MAV serves as the command center, directing UAVs specialized for reconnaissance, electronic jamming, and attack operations. The mission incorporates emergency subtasks, including aerial target engagement (Task A), ground target engagement (Task B), and responses to extreme weather conditions (Task C) [35,36,37]. These subtasks require operators to perform microtasks such as target recognition, situational assessment, threat evaluation, target allocation, and route planning. A detailed task classification is provided in Table 2.
In the cooperative flight formation system, the human–computer interface serves as the primary medium for operators to receive and interact with information. In alignment with the requirements for collaborative simulation missions, the interface organizes information into distinct categories, such as flight formation details, load data, alarm notifications, mission sequence steps, mission execution feedback, and three types of mission target information.

2.2. Intelligent Auxiliary Information Presentation Mode

The comprehensive situation window, central to the interface, integrates key data sources such as maps, radar, and formation information. Designed for real-time monitoring and decision-making, it is divided into three sections.
The left side of the window displays flight status parameters for the formation, including UAV1, UAV2, UAV3, and the MAV. These parameters include flight altitude, velocity, heading, and energy levels. Additionally, it provides payload details for UAV3 and the MAV, such as the number of air-to-air missiles (AAM-S, AAM-M, and AAM-L) and air-to-ground missiles (AGM) that have been launched and remain available.
The right side of the window is dedicated to target-related information, divided into three categories: aerial targets (Task A), ground targets (Task B), and extreme weather (Task C). Aerial target data include parameters such as altitude, velocity, the presence or absence of electromagnetic radiation, heading, operational status, relative angle, relative distance, acceleration, and altitude differences. Ground target information includes radar signal strength, electromagnetic field intensity, radar station detection radius, the number of radar station defense facilities, communication signal strength, infrared heat source intensity, the footprint of military bases, and the number of defense facilities at these bases. For extreme weather events, the interface displays data such as thunderstorm cloud dimensions (long and short axes), distances (distance 1 and distance 2), duration, movement speed, cloud top height, visibility, dissipation time, and wind force.
The center of the window features a situational map, providing a comprehensive overview of the environment, with the MAV at its focal point. This layout ensures that all critical information is clearly presented and accessible, facilitating efficient task execution and decision-making.
The original information presentation mode (Level 0) displays all available information in a static and unfiltered format. On the left side of the interface, the flight and energy data for UAV1–3 and the MAV, as well as the payload details for UAV3 and the MAV, are arranged vertically from top to bottom. The right side presents a total of 39 data items, including 19 related to Task A, 8 related to Task B, and 12 related to Task C, also displayed in a top-to-bottom layout. All information remains in a fixed position on both sides of the window, as illustrated in Figure 1a.
This study focuses on redesigning the comprehensive situation window by introducing four levels of intelligent auxiliary information presentation modes. These modes incorporate features such as tabular classification, categorized partitions, intelligent filtering, and task-based dynamic updates. These improved modes are represented in Figure 1b–e and will be described in detail in the following sections.
  • Level 1
In Level 1, the information displayed on the left side remains the same as in the original mode. However, the right side only shows data relevant to the task currently being executed by the target, leaving any redundant information blank. Both sides of the interface maintain a constant display, with no dynamic updates.
2.
Level 2
Level 2 reduces the amount of information displayed compared to Level 1. On the left side, formation and payload data are organized into a tabular format, eliminating duplicate entries and presenting information more clearly for easier scanning. The right side introduces categorized partitions for target-related information. Each of the three task categories is presented hierarchically within text boxes [38], allowing operators to quickly locate specific data without searching through the entire list. Like Level 1, the information on both sides remains static.
3.
Level 3
In Level 3, the left-side format is identical to Level 2, but the right side uses an intelligent filtering function. Only information directly relevant to the current target is displayed, further reducing clutter and improving accuracy. Additionally, information on both sides is dynamically pushed to the interface only when emergency subtasks are triggered, remaining hidden during routine formation flight operations.
4.
Level 4
Level 4 retains the same interface behavior as Level 3, with information dynamically pushed during task-triggered events. However, a key difference is that target-related information on the right side is moved to the central area of the display. This central dynamic positioning follows the target in real time, exploring an optimized method for presenting critical information.

3. Evaluation Method

This study evaluates different intelligent auxiliary information presentation modes from two key perspectives, such as subjective operator evaluations and objective assessments of operator performance. The goal is to identify the most effective mode for enhancing the capabilities of formation operators.

3.1. Subjective Evaluation

The subjective evaluation assesses the operator’s performance from three dimensions: mental workload (MWL), situation awareness (SA), and interface design evaluation. Mental workload is measured using the NASA-TLX scale, situation awareness is assessed with the 3D-SART scale, and interface design is evaluated through a questionnaire that captures subjective perceptions of information presentation.
The NASA-TLX scale, a widely used tool for evaluating subjective mental workload, has six dimensions: mental demand, physical demand, temporal demand, performance, effort, and frustration. Each dimension is rated and weighted [39], with higher scores indicating a greater mental workload. Situation awareness is measured using the 3D-SART scale [40], which also consists of three dimensions. Higher scores reflect greater levels of situation awareness. The interface design evaluation questionnaire is based on the 5-point Likert scale, the System Usability Scale (SUS) [41], and the Questionnaire for User Interface Satisfaction (QUIS) [42]. It evaluates factors such as the amount of information displayed, the rationality of the information presentation, the ease of acquiring information, and the impact of the presentation on task performance. Higher scores indicate greater satisfaction with the interface design.

3.2. Objective Evaluation

The objective evaluation of different information presentation modes is conducted by analyzing the design task flow information load and the operation task flow information load.
The evaluation of interface information load in the design task flow focuses on how information is presented and the task interaction process. Using consistent task logic and processes, visual search methods are applied to assess the impact of different interface designs on information processing efficiency during task execution. To measure human–machine interaction complexity (HMIC), four key indicators are used: task logic complexity, operation step complexity, knowledge level complexity, and interface complexity [43]. The evaluation leverages Mowshwitz’s graph entropy theory [44] to create behavior control diagrams, knowledge hierarchy diagrams, and interface information structure diagrams, which are used to calculate complexity indicators. The relationships between these indicators and their measurement methods are detailed in Table 3.
The representation of the complexity of human–machine interaction in the context of emergency subtasks is illustrated by Equation (1), as presented in reference [45].
H M I C i = H I C i 2 + H T C i 2 + H O C i 2 + H K C i 2
The requisite design task flow information and maximum completion time are sourced from the HMIC. The design task flow information load for subtasks is illustrated in Equation (2).
E d e s = i = 1 n H M I C i T d e s i
Among them, Tdesi is the required maximum completion time of the i-th microtask, and n is the number of microtasks in the subtasks.
The design task flow information load is determined solely by the fixed task flow, providing an objective measure of the interface load under different information presentation modes. However, during actual task execution, the operators’ response speed and operational proficiency can influence the effective information load. To account for this, the operation task flow information load incorporates the operators’ real-world abilities, offering a more comprehensive evaluation of the interface’s information load under practical operating conditions, as represented in Equation (3).
E o p e = i = 1 n H M I C i T o p e i
Among them, Topei is the actual response time of the i-th microtask.
The practical operational ability (POA) of an operator is determined by the relationship between the design task flow information load and the operation task flow information load, as described in Equation (4) [46]. The POA value ranges from 0 to 1. A higher value indicates that the operation task flow information load closely aligns with the design task flow information load, suggesting a lower practical operational ability of the operator.
P O A = E ope E des
By combining subjective and objective evaluations, this study aims to provide a robust assessment of intelligent auxiliary information presentation modes, identifying those that best enhance operators’ capabilities and reduce cognitive load.

4. Experimental Design

4.1. Participants

The required sample size was estimated using G*Power 3.1.9 software. Based on a single-factor, five-level, and within-subject design analyzed with repeated measures ANOVA, a minimum of 26 participants was needed to achieve 90% statistical power at a significance level of α = 0.05 and a moderate effect size (f = 0.25).
A total of 36 male college students participated in the experiment. All participants had at least a bachelor’s degree, with an average age of 22.42 ± 1.26 years. They were in good physical health (BMI: 23.71 ± 2.57) and right-handed and had normal or corrected vision and hearing. All participants were proficient in computer use and capable of completing the experimental tasks.

4.2. Experimental Materials

The experiment utilized a collaborative flight formation simulation system, as depicted in Figure 2, to create a realistic operational scenario involving a MAV and three UAVs. Participants were tasked with responding to emergency subtasks by selecting answers or issuing commands based on task rules and the information displayed on the interface. The objective was to ensure that the flight formation successfully completed the designated route tasks.
The system automatically recorded various data types throughout the process, including the triggering times of tasks, participants’ actions, operation times, and accuracy. Subjective evaluations were collected using the NASA-TLX scale, the 3D-SART scale, and an interface design evaluation questionnaire.

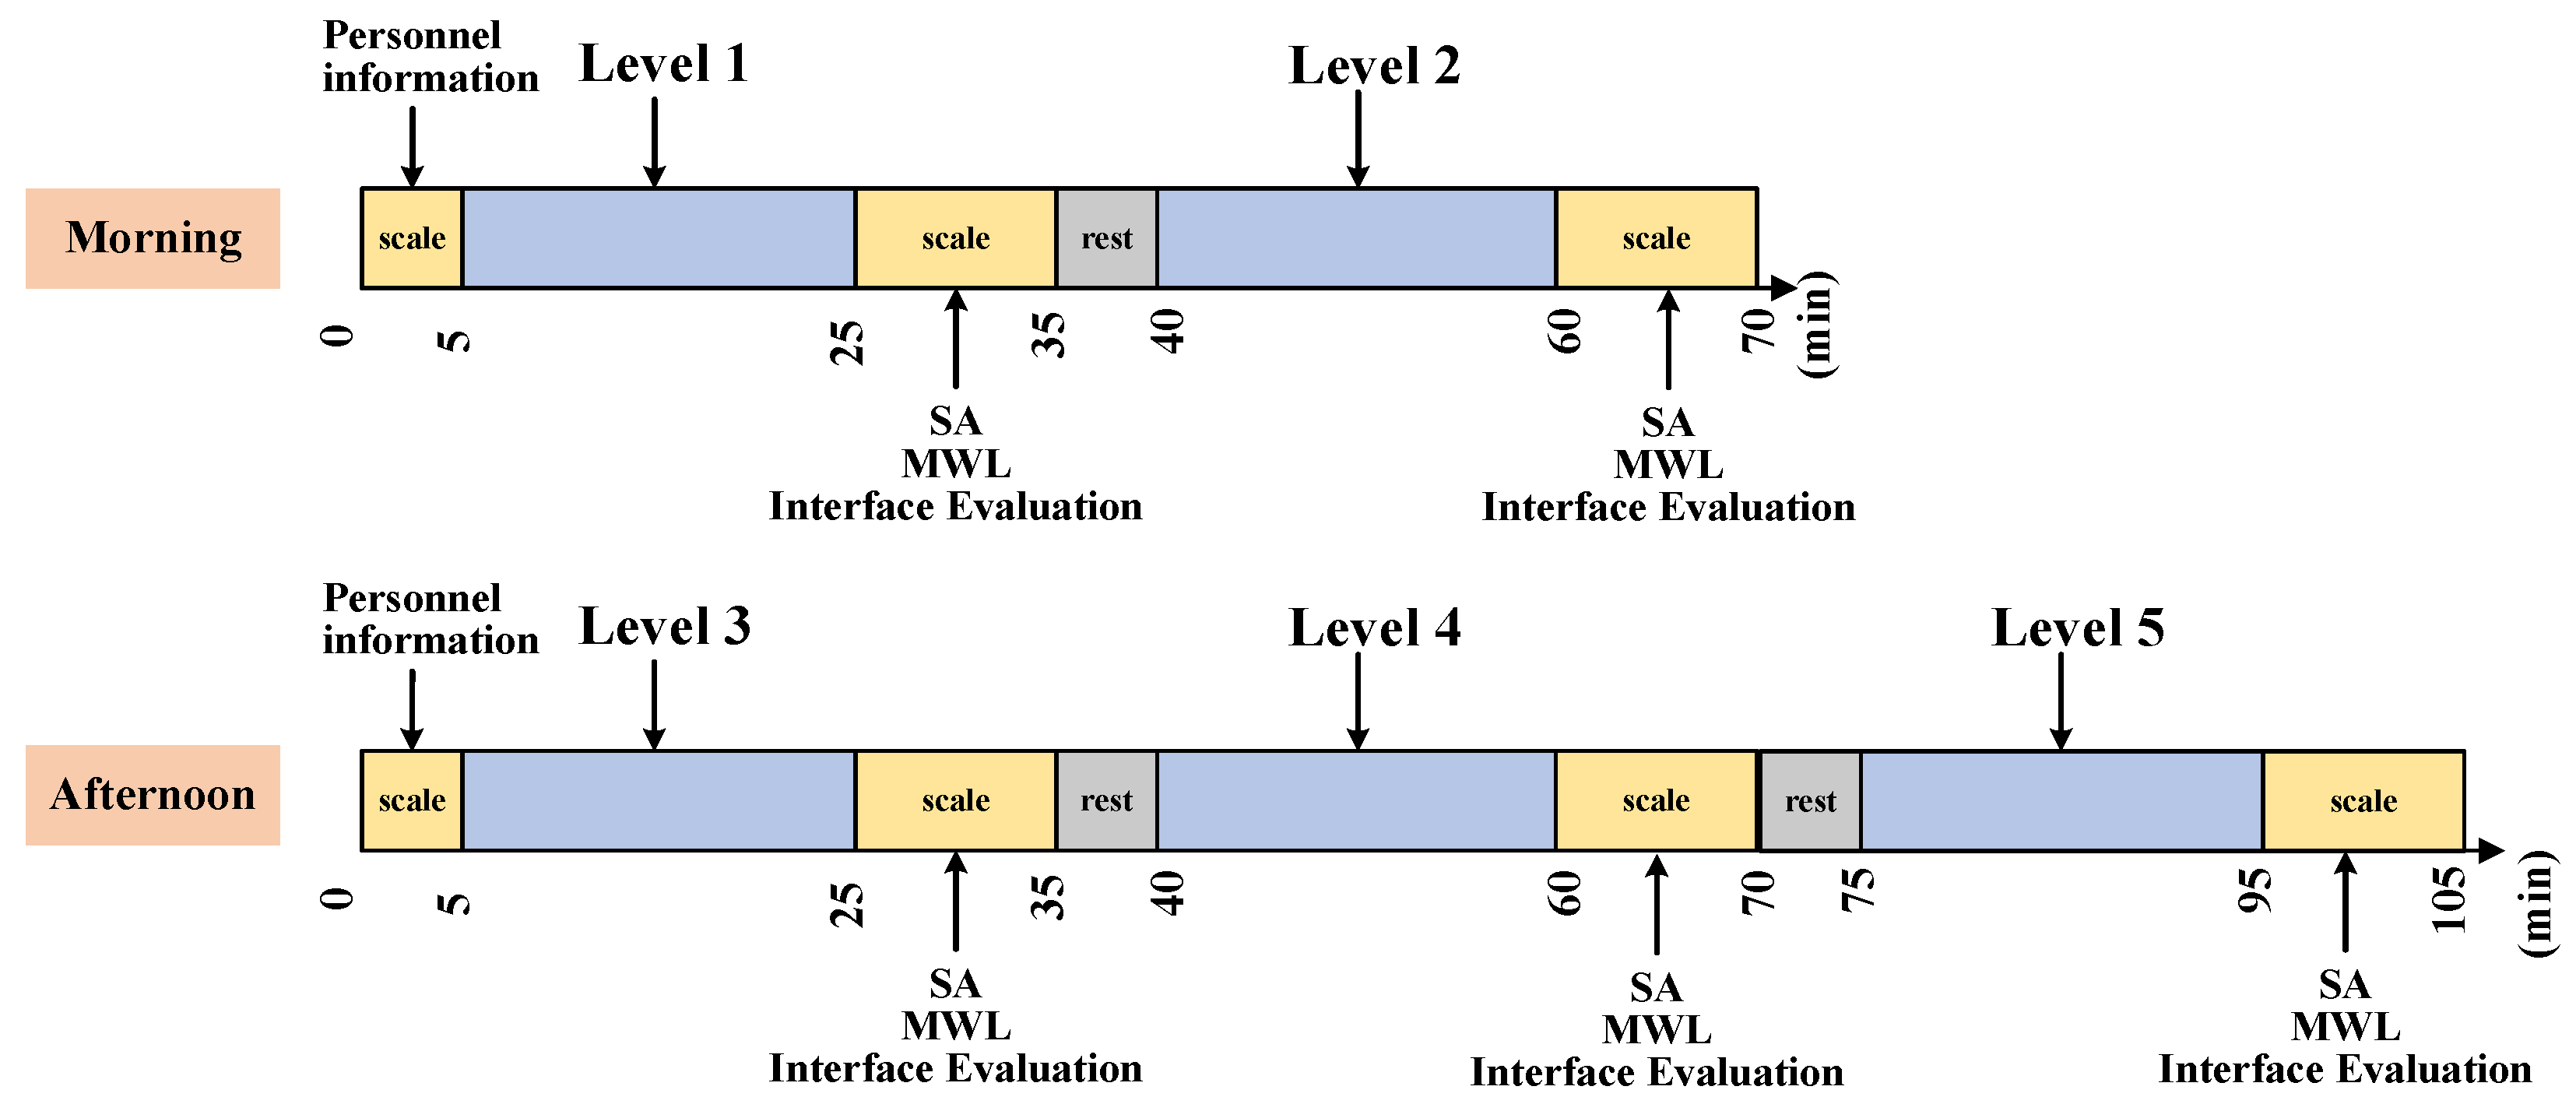
4.3. Experimental Process

The experimental process consisted of two stages: training and the formal experiment. Each participant underwent 4 h of training, which included learning and memorizing task rules as well as reviewing experimental guidelines. The formal experiment, lasting approximately 175 min, was conducted in two sessions (morning and afternoon), as shown in Figure 3.
Participants were grouped in pairs, with each participant completing simulations for five different information presentation modes on the same day. Each task lasted 20 min, followed by a 10 min period to complete a subjective scale. Participants then took a 5 min break before proceeding to the next task.

4.4. Data Analysis

The performance of different information presentation modes was analyzed using a Generalized Additive Mixed Model (GAMM) in R 4.4.0. In the model, participants were treated as random effects, while fixed effects were tested for the NASA-TLX score, 3D-SART score, interface evaluation score, and practical operational ability.
Statistical significance was determined at p < 0.05.
y = β 1 1 + i = 2 5 β i 1 ( L e v e l i ) + b 1 + e 1
y = β 1 2 + i = 3 5 β i 2 ( L e v e l i ) + b 2 + e 2
y = β 1 3 + i = 4 5 β i 3 ( L e v e l i ) + b 3 + e 3
y = β 1 4 + β 5 4 ( L e v e l i ) + b 4 + e 4
The GAMM Equations (5)–(8) describe the relationships among these variables, with y representing the dependent variable and β coefficients representing fixed effects at different levels of comparison. Statistical significance was determined at p < 0.05.
This provided insights into the fixed effects of intelligent auxiliary information presentation modes, enabling the identification of modes that most effectively enhance operator performance.

5. Results

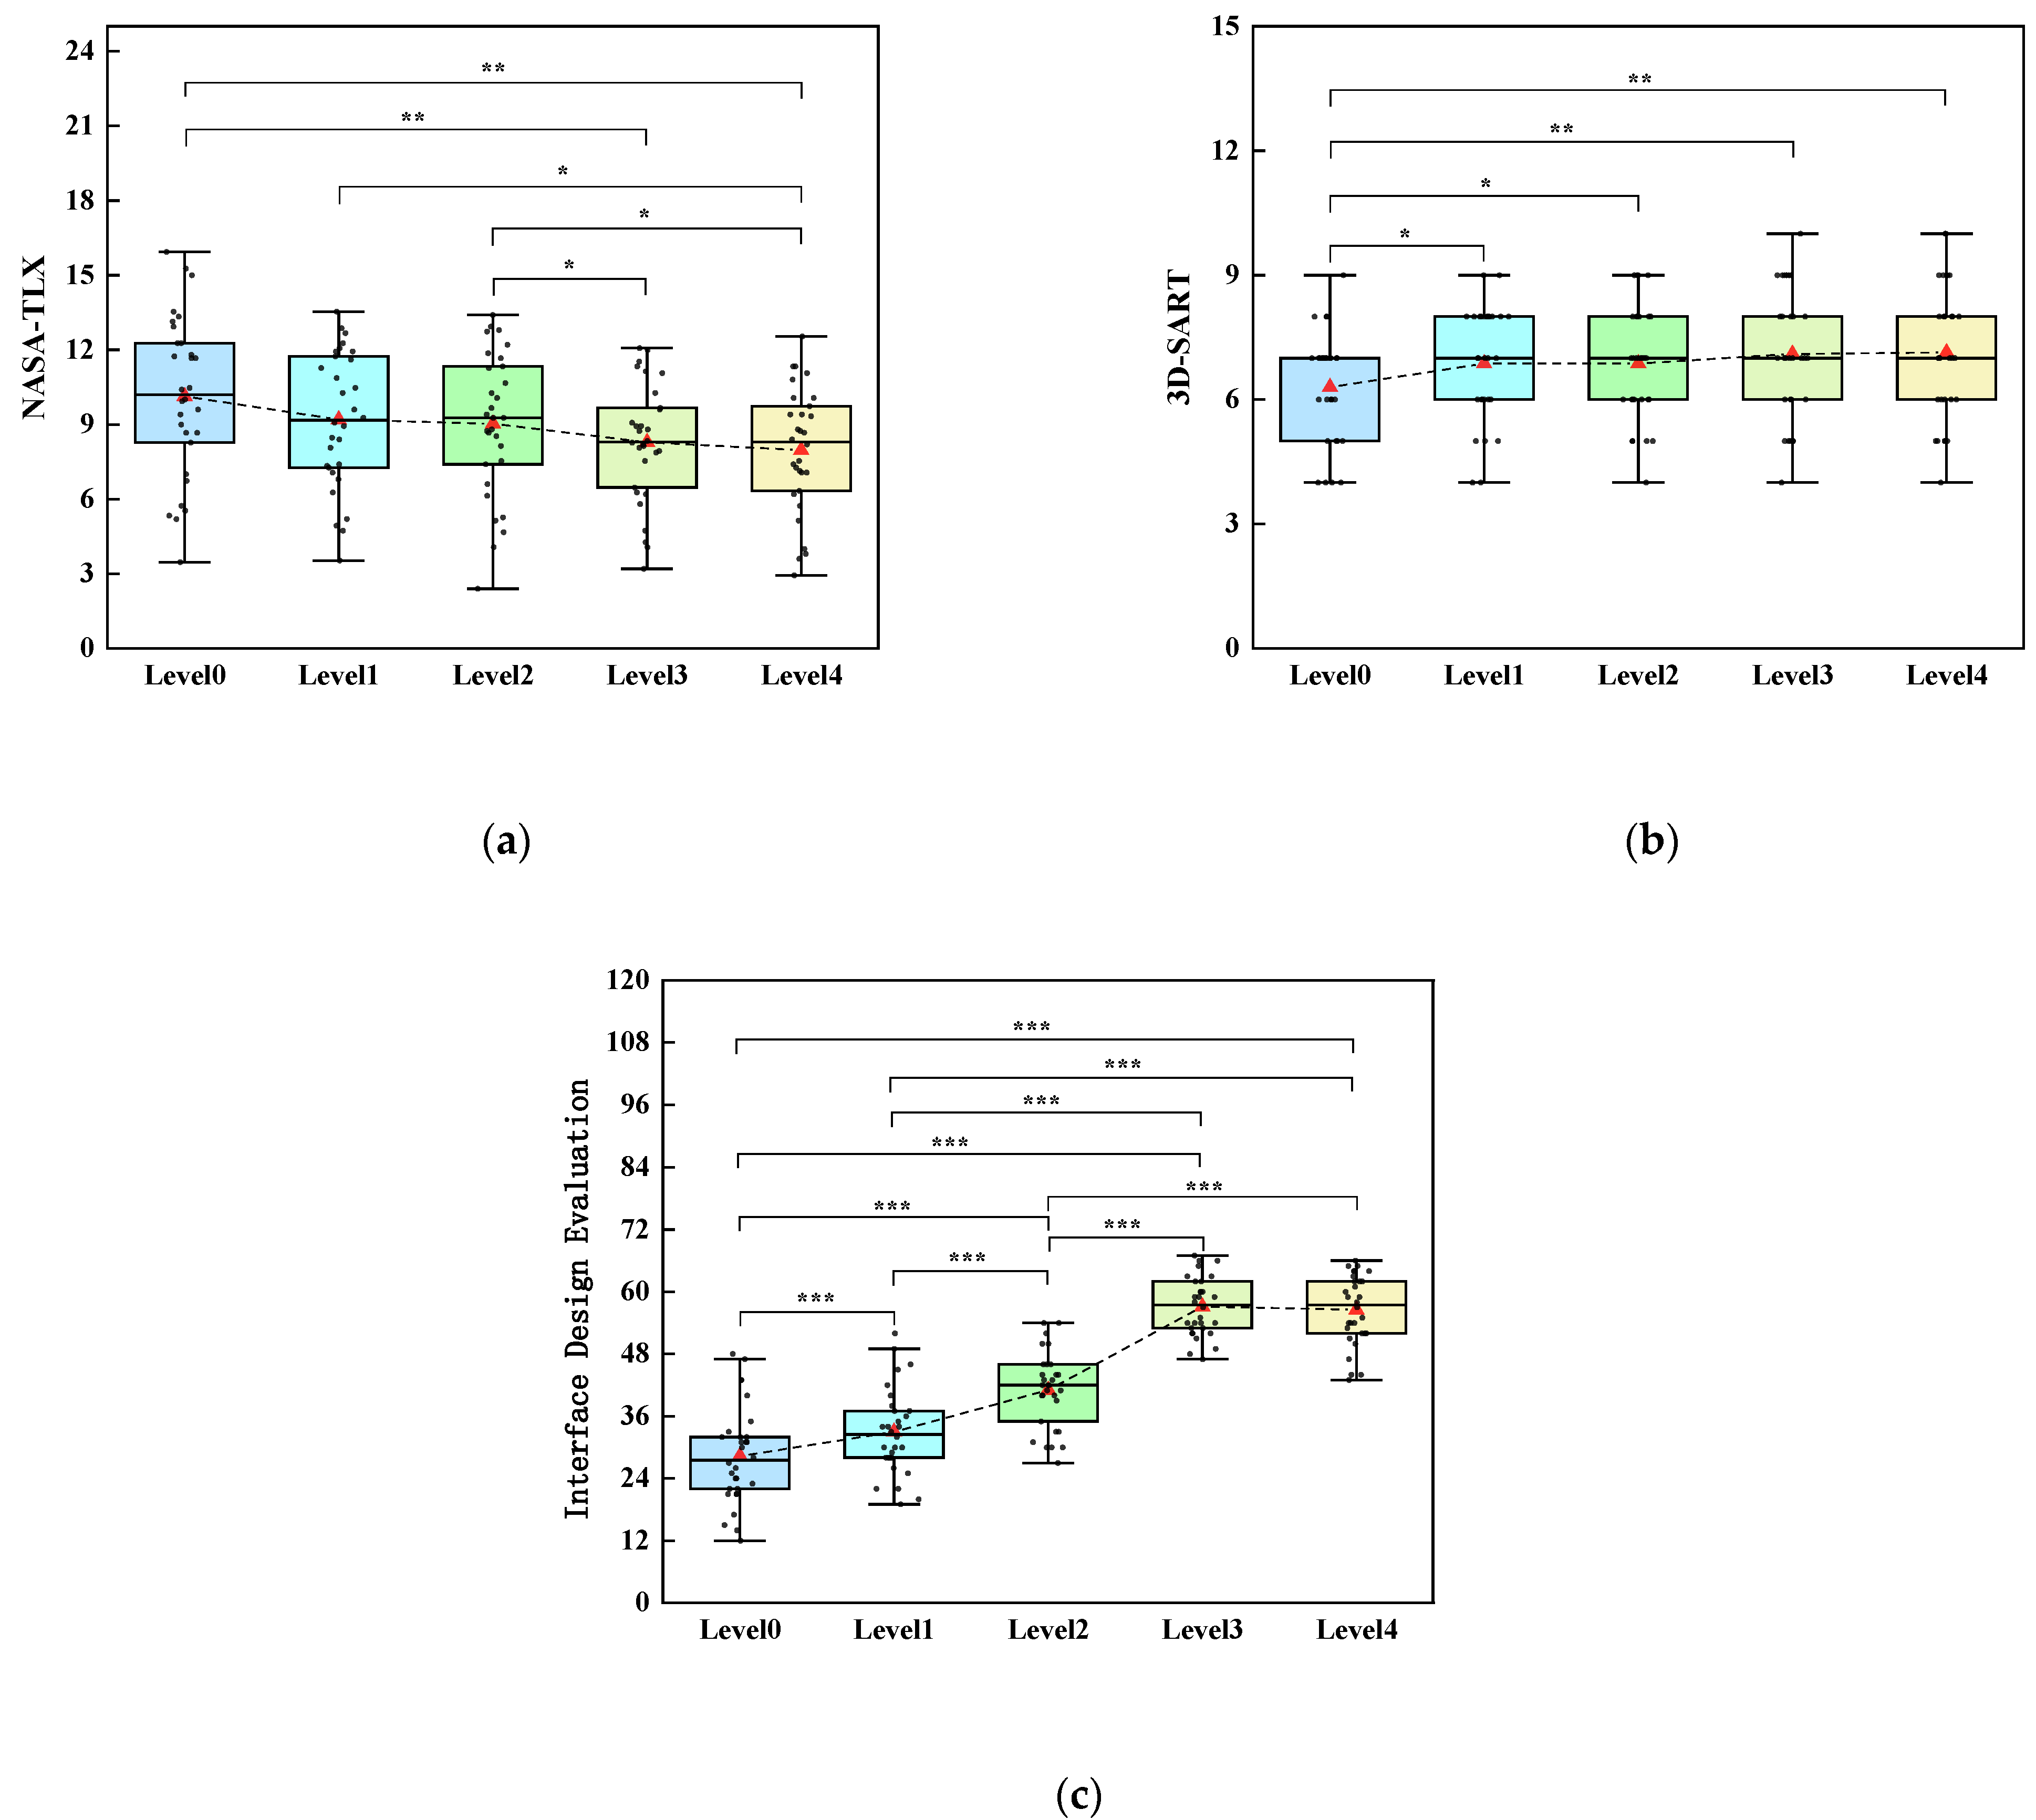
5.1. Subjective Evaluation Results

The subjective evaluation results, presented in Table 4 and Figure 4, reveal how intelligent auxiliary information presentation modes influence mental workload (MWL), situation awareness (SA), and interface design evaluation.
Mental workload, measured by NASA-TLX (Figure 4a), shows a decreasing trend from Level 0 to Level 4. Levels 3 and 4 showed the most substantial reduction in MWL, with no significant differences between them. This indicates that tabular formatting and intelligent filtering effectively alleviate the mental workload.
Situation awareness, assessed using the 3D-SART scale (Figure 4b), significantly improved across all intelligent modes compared to Level 0, indicating that all modes enhance situation awareness compared to the original mode. While SA increased slightly with higher levels of intelligent assistance, the differences among Levels 1 to 4 were not statistically significant.
Interface design evaluation scores (Figure 4c) increased from Level 0 to Level 3 but showed a slight decline at Level 4. Level 3 achieved the highest ratings, reflecting the best satisfaction. The decline in Level 4 may be due to participants’ difficulty in adapting to dynamic information positioning, which disrupted established search patterns.

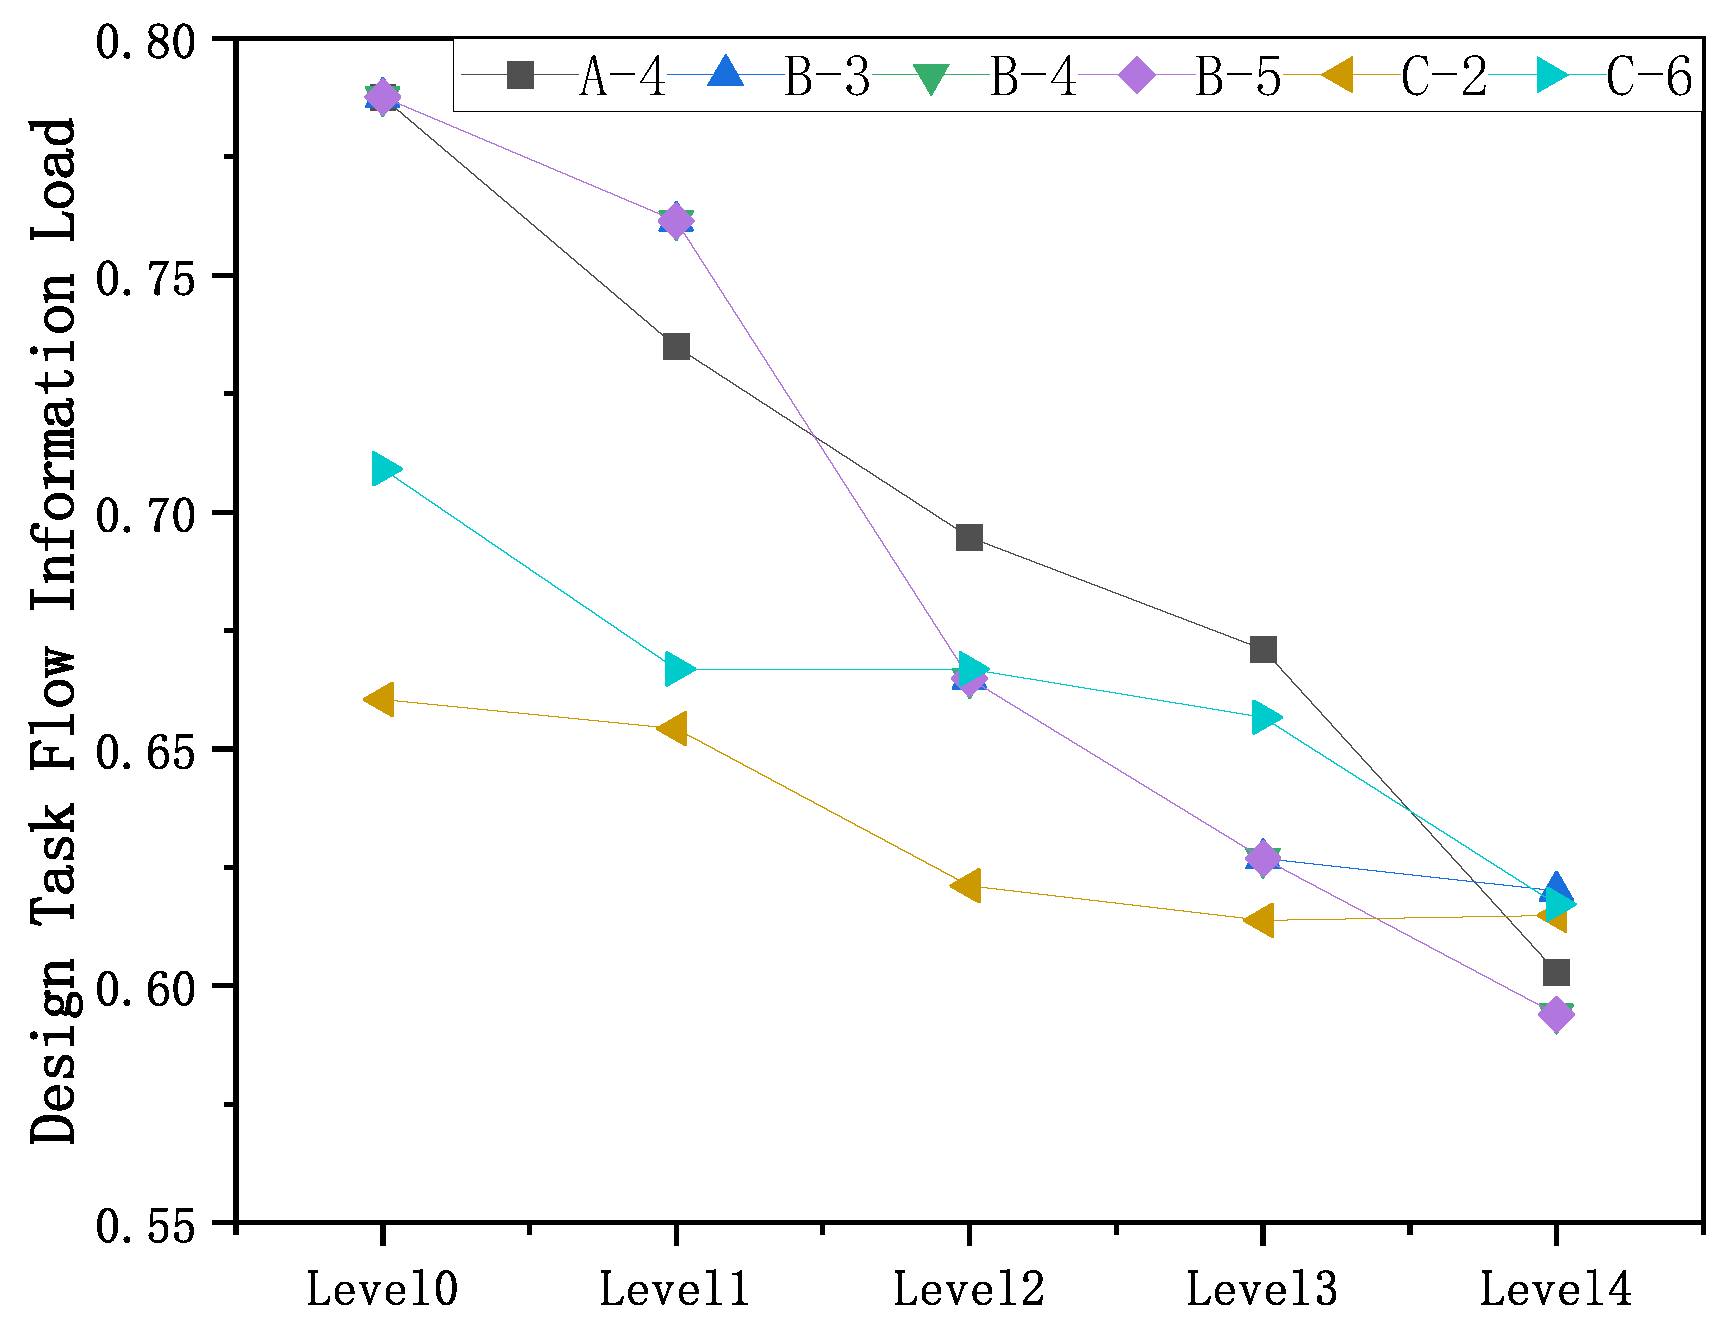
5.2. Objective Evaluation Results

The objective measures focused on task flow information load and practical operational ability (POA).
There are some microtasks in different types of emergency subtasks whose completion does not require obtaining information from the comprehensive situation window. The selected typical microtasks for analysis were A-4, B-3, B-4, B-5, C-2, and C-6.
Design task flow information load decreased consistently across all microtasks (Figure 5), reflecting improved interface efficiency with higher levels of intelligent assistance.
POA, as shown in Table 5 and Figure 6, demonstrated significant improvements for both microtask B-3 and overall tasks from Level 0 to Levels 3 and 4. In microtask B-3 (Figure 6a), POA scores for Levels 3 and 4 were significantly higher than those for Levels 0, 1, and 2. Similarly, overall task (Figure 6b) improved markedly in Levels 3 and 4. However, a slight decline in POA was observed from Level 3 to Level 4, potentially due to a misalignment between participants’ visual search patterns and dynamic information updates.

6. Discussion

6.1. Optimal Intelligent Auxiliary Information Presentation Mode

This study primarily seeks to identify the optimal mode of presentation of intelligent auxiliary information, with the aim of enhancing personnel capabilities in five key aspects: subjective mental workload, situation awareness, interface design evaluation, design task flow information load, and practical operation ability.
Taking B-3 as an example for analyzing operational behavior, the operation steps are shown in Table 6. The operational behavior under different modes is shown in Figure 7. In step B-3.2, the operator needs to view target information in the comprehensive situation window. There are a total of 39 pieces of information on the right side of the original interface, of which 8 are related to the B task and 5 are related to the current target. When using Level 1, the operator still needs to view all information items, but 31 of them have reduced visual search time due to the lack of redundant information. When using Level 2, the operator only needs to view the information items corresponding to the target category. In this mode, the operator’s search time is limited only to information items related to the task. When using Level 3 and Level 4, only the information items that are related to the current target will appear, and the visual search time is significantly reduced. Compared to the original mode, the intelligent auxiliary information presentation mode presents all information items related to the task, reducing the time for operators to judge the availability of information. In theoretical analysis, with the continuous reduction in visual search time and information availability judgment time in Level 1 to Level 4, the response time for operators to complete the current task is shortened, indicating an improvement in operational ability.
The results identify Levels 3 and 4 as the most effective intelligent auxiliary information presentation modes, which is consistent with the analysis of operational behavior. The subjective evaluations showed that both modes significantly reduced MWL, improved SA, and achieved high interface design ratings. Objective measures further validated these findings, with notable improvements in task flow information load and POA. The results of this study are consistent with the findings of Donovan’s research [47] that optimizing interfaces can improve people’s situation awareness and performance.
The interface design evaluation and POA of Level 4 exhibited a slight decline compared to Level 3, which may be attributed to the dynamic repositioning of information with lightly hindered usability, leading to the misalignment between the visual search patterns and the new mode. This phenomenon highlighted the importance of maintaining consistency in interface design.

6.2. Limitations and Future Research

This study has several limitations that warrant consideration:
  • Simplistic Task Scenarios: The simulation involved single-target tasks, which may not reflect the complexity of real-world multi-target scenarios. Future research should evaluate intelligent modes under multi-target conditions to better simulate operational environments.
  • Limited Objective Metrics: This study focused on information load as the primary objective metric. Incorporating additional measures, such as task performance or physiological indicators (e.g., eye tracking and bioelectric signals), could provide a more comprehensive evaluation.
  • Homogeneous Participant Pool: This study recruited only healthy male college students, limiting the generalizability of the findings. Future studies should include a more diverse participant pool, particularly professional pilots, to ensure broader applicability.

7. Conclusions

In collaborative flight formation systems, the integration of multi-source information gathered by the human–machine interface often leads to cognitive overload and reduced situation awareness for commanders. This study proposed and evaluated four intelligent auxiliary information presentation modes to address these challenges. The key findings are as follows.
  • All four intelligent auxiliary information presentation modes reduced mental workload and improved situation awareness compared to the original mode. Level 4 demonstrated the most substantial impact while also presenting the lowest design task flow information load.
  • Due to the influence of habits, participants were more likely to utilize interfaces that were consistently displayed. Consequently, most participants favored the design of Level 3, and the overall task’s practical operation ability was the most optimal.
  • The intelligent modes effectively reduced visual search time and information judgment time, leading to faster task response times. As the level of intelligence increased, the response time continued to decrease. Levels 3 and 4 demonstrated superior results in improving operational abilities.
These findings highlight the critical role of intelligent auxiliary information presentation in optimizing human–machine interfaces. Future research should explore the applicability of these modes in multi-target scenarios, diverse participant groups, and various objective evaluation metrics. These steps will further refine intelligent interface designs and enhance their effectiveness in complex operational environments.

Author Contributions

Conceptualization, X.W. (Xiyue Wang) and L.P.; methodology, X.W. (Xiyue Wang); software, X.W. (Xiyue Wang) and D.M.; validation, X.W. (Xiyue Wang), L.P., and D.M.; formal analysis, X.W. (Xiyue Wang), D.M. and X.W. (Xiaoxiang Wu); investigation, X.W. (Xiyue Wang), L.P. and D.M.; resources, X.W. (Xiyue Wang), L.P., and D.M.; data curation, X.W.(Xiyue Wang); writing—original draft preparation, X.W.(Xiyue Wang); writing—review and editing, L.P. and H.Y.; visualization, X.W.(Xiyue Wang); supervision, L.P., H.Y. and X.C.; and project administration, L.P. and X.C. All authors have read and agreed to the published version of the manuscript.

Funding

This research received no funding.

Data Availability Statement

Due to the limitations of the Ethics Review Committee, these data cannot be made public to protect the privacy and confidential information of the participants. The data presented in this study are available upon request from the corresponding author.

Acknowledgments

The authors would like to thank all participants involved in this study.

Conflicts of Interest

The authors declare no conflicts of interest.

References

  1. Li, Y.; Tu, T. Interface design of manned/unmanned collaborative accusation terminal. Electron. Technol. Softw. Eng. 2019, 8, 90–92. [Google Scholar]
  2. Sun, S.; Meng, C.; Hou, Y.; Cai, X. Research on the Collaborative Operational Mode and Key Technologies of Manned/Unmanned Aerial Vehicles. Aero Weapon. 2021, 28, 33–37. [Google Scholar]
  3. Alqudsi, Y.; Murat, M. Exploring advancements and emerging trends in robotic swarm coordination and control of swarm flying robots: A review. Proc. Inst. Mech. Eng. Part C J. Mech. Eng. Sci. 2025, 239, 180–204. [Google Scholar] [CrossRef]
  4. Abro, G.E.M.; Ali, Z.A.; Masood, R.J. Synergistic UAV Motion: A Comprehensive Review on Advancing Multi-Agent Coordination. IECE Trans. Sens. Commun. Control 2024, 1, 72–88. [Google Scholar] [CrossRef]
  5. Shangguan, R.; Lin, L.; Zhou, Y. Overview of cooperative UAV swarm localization. In Proceedings of the International Conference on Remote Sensing and Digital Earth (RSDE 2024), Chengdu, China, 8–10 November 2014. [Google Scholar]
  6. Li, W.; Zhou, S.; Shi, M.; Yue, J.; Lin, B.; Qin, K. Collision avoidance time-varying group formation tracking control for multi-agent systems. Appl. Intell. 2025, 55, 175. [Google Scholar] [CrossRef]
  7. Li, Y.; Zhang, W. Command and Control Technology for Unmanned Combat Vehicles. Command Inform. Syst. Technol. 2011, 2, 6–9. [Google Scholar]
  8. Schouwenaars, T.; Valenti, M.; Feron, E.; How, J.; Roche, E. Linear Programming and Language Processing for Human-Unmanned Aerial-Vehicle Team Missions. J. Guid. Control Dyn. 2006, 29, 303–313. [Google Scholar] [CrossRef]
  9. Liu, B.; Chen, S.; Wang, X.; Wang, Z. Air combat decision making for coordinated multiple target attack based on science of collectives in the uncertain communication environment. In Proceedings of the 2014 IEEE Chinese Guidance, Navigation and Control Conference, Yantai, China, 8–10 August 2014. [Google Scholar]
  10. Valenti, M.; Schouwenaars, T.; Kuwata, Y.; Feron, E.; How, J.; Paunicka, J. Implementation of a Manned Vehicle-UAV Mission System. In Proceedings of the AIAA Guidance, Navigation, and Control Conference and Exhibit, Providence, RI, USA, 16–19 August 2004. [Google Scholar]
  11. Zhang, Y.; Mehrjerdi, H. A survey on multiple unmanned vehicles formation control and coordination: Normal and fault situations. In Proceedings of the 2013 International Conference on Unmanned Aircraft Systems (ICUAS), 2013 International Conference on Unmanned Aircraft Systems (ICUAS), Atlanta, GA, USA, 28–31 May 2013. [Google Scholar]
  12. Boyd, J.A. A Discourse on Winning and Losing; Unpublished set of Briefing Slides Available at Air University Library, Maxwell AFB, Alabama,1987. Available online: http://www.ausairpower.net/JRB/intro.pdf (accessed on 1 November 2024).
  13. Defense and the National Interest. Available online: https://d-n-i.net/ (accessed on 1 November 2024).
  14. Endsley, M.R. Toward a theory of situation awareness in dynamic systems. Man Factors 1995, 37, 32–64. [Google Scholar] [CrossRef]
  15. Feng, C.; Wanyan, X.; Chen, H.; Zhuang, D. Situation awareness model and application based on multi resource load theory. J. Beijing Univ. Aeronaut. Astronaut. 2018, 44, 1438–1446. [Google Scholar]
  16. Wang, X.; Cao, Y.; Ding, M.; Wang, X.; Yu, W.; Guo, B. Research Progress in Modeling and Evaluation of Cooperative Operation System-of-systems for Manned-unmanned Aerial Vehicles. Aerosp. Electron. Syst. Mag. 2024, 39, 6–31. [Google Scholar] [CrossRef]
  17. Robb, D.A.; Garcia, F.J.C.; Laskov, A.; Liu, X.; Patron, P.; Hastie, H. Keep Me in the Loop: Increasing Operator Situation Awareness through a Conversational Multimodal Interface. In Proceedings of the 20th ACM International Conference on Multimodal Interaction, Boulder CO, USA, 16–20 October 2018. [Google Scholar]
  18. Burns, C.M.; Skraaning, G.; Jamieson, G.A.; Lau, N.; Kwok, J.; Welch, R.; Andresen, G. Evaluation of Ecological Interface Design for Nuclear Process Control: Situation Awareness Effects. Hum. Factors 2008, 50, 663–679. [Google Scholar] [CrossRef] [PubMed]
  19. Rood, M.M.V. Increasing Situation Awareness in USAR Human-Robot Teams by Enhancing the User Interface. Master’s Thesis, Utrecht University, Utrecht, The Netherlands, 2016. [Google Scholar]
  20. Xiao, Y.; Wang, Z.; Wang, M. The appraisal of reliability and validity of subjective workload assessment technique and NASA-task load index. Chin. J. Ind. Hyg. Occup. Dis. 2005, 23, 178–181. [Google Scholar]
  21. Kang, W.; Yuan, X. Optimization Design of Aircraft Cockpit Visual Display Interface Based on Mental Load. J. Beijing Univ. Aeronaut. Astronaut. 2008, 34, 782–785. [Google Scholar]
  22. Salmon, P.M.; Stanton, N.A.; Walker, G.H.; Jenkins, D.P.; Young, M.S. Measuring Situation Awareness in complex systems: Comparison of measures study. Int. J. Ind. Ergon. 2009, 39, 490–500. [Google Scholar]
  23. Yang, J.; Zeng, Y.; Zhang, K.; Rantanen, E.M. Measurement of situational awareness of air traffic controllers based on events. Space Med. Med. Eng. 2008, 21, 321–327. [Google Scholar]
  24. Nielsen, J. Usability Engineering; China Machine Press: Beijing, China, 2004. [Google Scholar]
  25. Shackel, B. Usability-Context, framework, definition, design and evaluation. Interact. Comput. 2009, 21, 339–346. [Google Scholar]
  26. Shackel, B. The concept of usability. In Proceedings of the IBM Software and Information Usability Symposium, Poughkeepsie NY, USA, 15–18 September 1981; IBM-Corporation: New York, NY, USA, 1981. [Google Scholar]
  27. Schneiderman, B. Designing the User Interface; Addison Wesley: Boston, MA, USA, 1998. [Google Scholar]
  28. Deng, Z.; Lu, Y. Study on the Influence Factors of Electronic Commerce Website Users’ Satisfaction and Behavior. Libr. Inform. Serv. 2008, 29, 5. [Google Scholar]
  29. Lin, Y. Evaluation of user interface satisfaction of mobile maps for touch screen interfaces. In Proceedings of the 2012 International Conference on Advances in Computer-Human Interactions, Valencia, Spain, 30 January–4 February 2012. [Google Scholar]
  30. Yan, S.; Yu, X.; Zhang, Z.; Peng, M.; Yang, M. Evaluation method of human-machine interface of virtual meter based on RBF network. J. Syst. Simul. 2007, 19, 5731–5735. [Google Scholar]
  31. Yan, S.; Li, Q.; Zhang, Z.; Peng, M. Research on Subjective evaluation method in human-machine-interface based on grey theory. J. Harbin Eng. Univ. 2005, 16, 98–104. [Google Scholar]
  32. Xia, C. Study on Human Machine Interface Evaluation of Hoisting Machine based on Fuzzy Factors. Coal Mine Mach. 2007, 28, 3. [Google Scholar]
  33. Tambe, M.; Johnson, W.L.; Jones, R.M.; Koss, F.; Laird, J.E.; Rosenbloom, P.S.; Schwamb, K. Intelligent Agents for Interactive Simulation Environments. AI Mag. 1995, 16, 15–39. [Google Scholar]
  34. Liu, S.; Wang, H. Review on cooperative formation control for manned/unmanned aerial vehicles. Flight Dyn. 2022, 40, 1–8. [Google Scholar]
  35. Yan, W. Research on Radar Detection of Three Kinds Aviation Hazardous Weather Features. Master’s Thesis, Nanjing University of Information Science & Technology, Beijing, China, 2019. [Google Scholar]
  36. Li, C. Aircraft rerouting strategy research under special weather. J. Civ. Aviat. Univ. China 2020, 38, 5–9. [Google Scholar]
  37. Song, N.; Xing, Q. Multi-class classification of air targets based on support vector machine. Syst. Eng. Electron. 2006, 28, 1279–1281. [Google Scholar]
  38. Niu, J.; Wu, X.; Zhang, L.; Li, Z.; Liu, X. Research on information structure layout of combat display and control interface based on visual cognition characteristics. Packag. Eng. 2023, 44, 328–337. [Google Scholar]
  39. Hart, S.G.; Staveland, L.E. Development of NASA-TLX (Task Load Index): Results of Empirical and Theoretical Research. Adv. Psychol. 1988, 52, 139–183. [Google Scholar]
  40. Taylor, R.M. Situational Awareness Rating Technique (Sart): The Development of a Tool for Aircrew Systems Design. In Proceedings of the AGARD AMP Symposium on Situation Awareness in Aerospace Operations, Neuilly Sur Seine, France, 1 April 1990. [Google Scholar]
  41. Lewis, J.R. The System Usability Scale: Past, Present, and Future. Int. J. Hum. Comput. Interact. 2018, 34, 577–590. [Google Scholar] [CrossRef]
  42. Harper, P.; Norman, K. Improving user satisfaction: The questionnaire for user interaction satisfaction version 5.5. In Proceedings of the 1st Annual Mid-Atlantic Human Factors Conference, Virginia Beach, VA, USA, February 1993. [Google Scholar]
  43. Davis, J.S.; LeBlanc, R.J. A Study of the Applicability of Complexity Measures. IEEE Trans. Softw. Eng. 1988, 14, 1366–1372. [Google Scholar] [CrossRef]
  44. Mowshowitz, A. Entropy and the complexity of graphs: I. an index of the relative complexity of a graph. Bull. Math. Biol. 1968, 30, 175–204. [Google Scholar] [CrossRef]
  45. Zheng, Y.; Lu, Y.; Wang, Z.; Huang, D.; Fu, S. Developing a Measurement for Task Complexity in Flight. Aerosp. Med. Hum. Perform. 2015, 86, 698–704. [Google Scholar] [CrossRef]
  46. Yang, C.; Pang, L.; Zhang, J.; Cao, X. Workload Measurement Method for Manned Vehicles in Multitasking Environments. Aerosp. 2024, 11, 406. [Google Scholar] [CrossRef]
  47. Donovan, S.-L.; Triggs, T. Investigating the Effects of Display Design on Unmanned Underwater Vehicle Pilot Performance; DSTO: Canberra, Australia, 2006. [Google Scholar]
Figure 1. Intelligent auxiliary information presentation modes. (a) Level 0; (b) Level 1; (c) Level 2; (d) Level 3; and (e) Level 4. 高度:Altitude; 速度:Speed; 有: Have; 航向:Heading; 相角:Phase angle; 相距:Distance; 状态: Status; 靠近:Approach; 高差:Altitude difference; 加速度:Acceleration; 高变率:Rate of change in altitude; 弹剩量:Remaining missile quantity; 最远射程:Maximum range; 通信频率:Communication frequency; 低:Low; 滚转:Roll; 俯仰:Pitch; 转弯半径:Turning radius; 最大俯仰率:Maximum pitch rate; 爬升率:Climb rate; 下降率:Descent rate; 滞空时间:Hovering time; 升阻比:Lift to drag ratio; 长轴:Long axis; 短轴:Short axis; 持续:Duration; 距离1:Distance 1; 距离2:Distance 2; 云移速度:Cloud migration speed; 云顶高度:Cloud top height; 垂直航程:Vertical range; 水平航程:Horizontal range.
Aerospace 12 00057 g001
Figure 2. Experimental environment.
Aerospace 12 00057 g002
Figure 3. Experimental process.
Aerospace 12 00057 g003
Figure 4. Results of mental workload, situation awareness, interface design evaluation, and GAMM analysis of their impact. (a) NASA-TLX; (b) 3D-SART; and (c) interface design evaluation. In the box plot, black dots represent all data points, red triangles represent the mean, and black dotted lines represent the median. The black line at the bottom of the box indicates that 25% of the data are below this line, while the black line at the top of the box indicates that 75% of the data are below this line. The extended black bracket lines represent the p-value between the two modes: *** (p < 0.001), ** (p < 0.01), and * (p < 0.05).
Aerospace 12 00057 g004
Figure 5. Design task flow information load. In the line plot, gray squares represent A-4 data, blue triangles represent B-3 data, green triangles represent B-4 data, purple diamonds represent B-5 data, yellow triangles represent C-2 data, and light blue triangles represent C-6 data.
Aerospace 12 00057 g005
Figure 6. Practical operational ability in the B-3 microtask and the overall task. (a) B-3 and (b) overall task. In the box plot, black dots represent all data points, red triangles represent the mean, and black dotted lines represent the median. The black line at the bottom of the box indicates that 25% of the data are below this line, while the black line at the top of the box indicates that 75% of the data are below this line. The extended black bracket lines represent the p-value between the two modes: *** (p < 0.001), ** (p < 0.01), and * (p < 0.05).
Aerospace 12 00057 g006
Figure 7. Operation behavior diagram under different information presentation modes. (a) Level 0; (b) Level 1; (c) Level 2; and (d) Level 3/Level 4.
Aerospace 12 00057 g007
Table 1. Studies on human–machine interface evaluation.
EvaluationReferencesMain Content
Mental workload[20]Validated the reliability and validity of subjective mental workload assessment tools, including SWAT and NASA-TLX.
[21]Developed an evaluation model for mental workload using visual displays in aircraft cockpits, optimizing their design to improve performance.
Situation awareness[22]Compared memory-based and subjective measurement methods for assessing situation awareness using military command digital maps.
[23]Explored event-based situation awareness measurement techniques for air traffic controllers.
Interface usability[24,25,26,27]Proposed the evaluation systems of interface usability, which has been used widely.
[28,29]Focused on user surveys and satisfaction assessments.
Developing relevant evaluation metrics[30,31,32]Based on theoretical analysis and mathematical models.
Table 2. The classification of simulation tasks.
SubtaskMicrotask
Aerial targets (Task A)/
Ground targets (Task B)/
Extreme weather (Task C)
1 Task category determination
2 Target type determination
3 The issuance of instructions/Target facility determination/Energy consumption level judgment
4 Interference and radar status judgment/Target facility scale judgment/Intensity level judgment
5 The issuance of instructions/Defense capability of target facility judgment/Response method determination
6 Target intention judgment/Comprehensive risk judgment/The issuance of instructions
7 The issuance of instructions
Table 3. Indicator and measurement method.
Key FactorsIndicatorMeasurement Method
Task factorsTask logic complexity HTCFirst-order entropy of behavior control diagram
Operation factorsOperation step complexity HOCSecond-order entropy of behavior control diagram
Personal factorsKnowledge level complexity HKCSecond-order entropy of knowledge hierarchy diagram
Human–machine interface factorsInterface complexity HICSecond-order entropy of interface information structure diagram
Table 4. Measurement results of subjective evaluation.
ResultMean ± SD
Level 0Level 1Level 2Level 3Level 4
NASA-TLX10.131 ± 3.2459.193 ± 2.7369.029 ± 2.8838.282 ± 2.3827.969 ± 2.496
3D-SART6.300 ± 1.3176.867 ± 1.3836.867 ± 1.3587.100 ± 1.5617.133 ± 1.634
Interface design evaluation28.333 ± 9.35332.967 ± 8.29841.067 ± 7.34357.133 ± 5.61956.533 ± 6.786
Table 5. Measurement results of POA.
ResultPOA (Mean ± SD)
Level 0Level 1Level 2Level 3Level 4
B-30.522 ± 0.1180.448 ± 0.1110.434 ± 0.1230.325 ± 0.0880.306 ± 0.092
Overall task0.421 ± 0.0870.396 ± 0.0840.386 ± 0.0810.359 ± 0.0770.360 ± 0.071
Table 6. Operation steps of B-3.
Operation StepsOperation Contents
3.1 View task sequence—“Target facility determination”
3.23.2.1View information item 1 on the right side of the comprehensive situation
3.2.2View information item 2 on the right side of the comprehensive situation
3.2.39View information item 39 on the right side of the comprehensive situation
3.3 Click on the dropdown menu
3.4 Choose an answer
3.5 Confirm the answer
Disclaimer/Publisher’s Note: The statements, opinions and data contained in all publications are solely those of the individual author(s) and contributor(s) and not of MDPI and/or the editor(s). MDPI and/or the editor(s) disclaim responsibility for any injury to people or property resulting from any ideas, methods, instructions or products referred to in the content.

