
Simulation and Stability Analysis of a Coupled Parachute–Payload System †


Abstract
1. Introduction
2. Prior Work
2.1. SC Subsonic Rigid Ring–Slot Parachute Modeling
2.2. SC Prismatic Shape Aerodynamics Studies
2.3. Recent Supersonic Computational Analyses
3. Physical and Computational Setup
3.1. Models
3.2. Computational Setup
3.2.1. Meshes
3.2.2. Flow Solver Summary
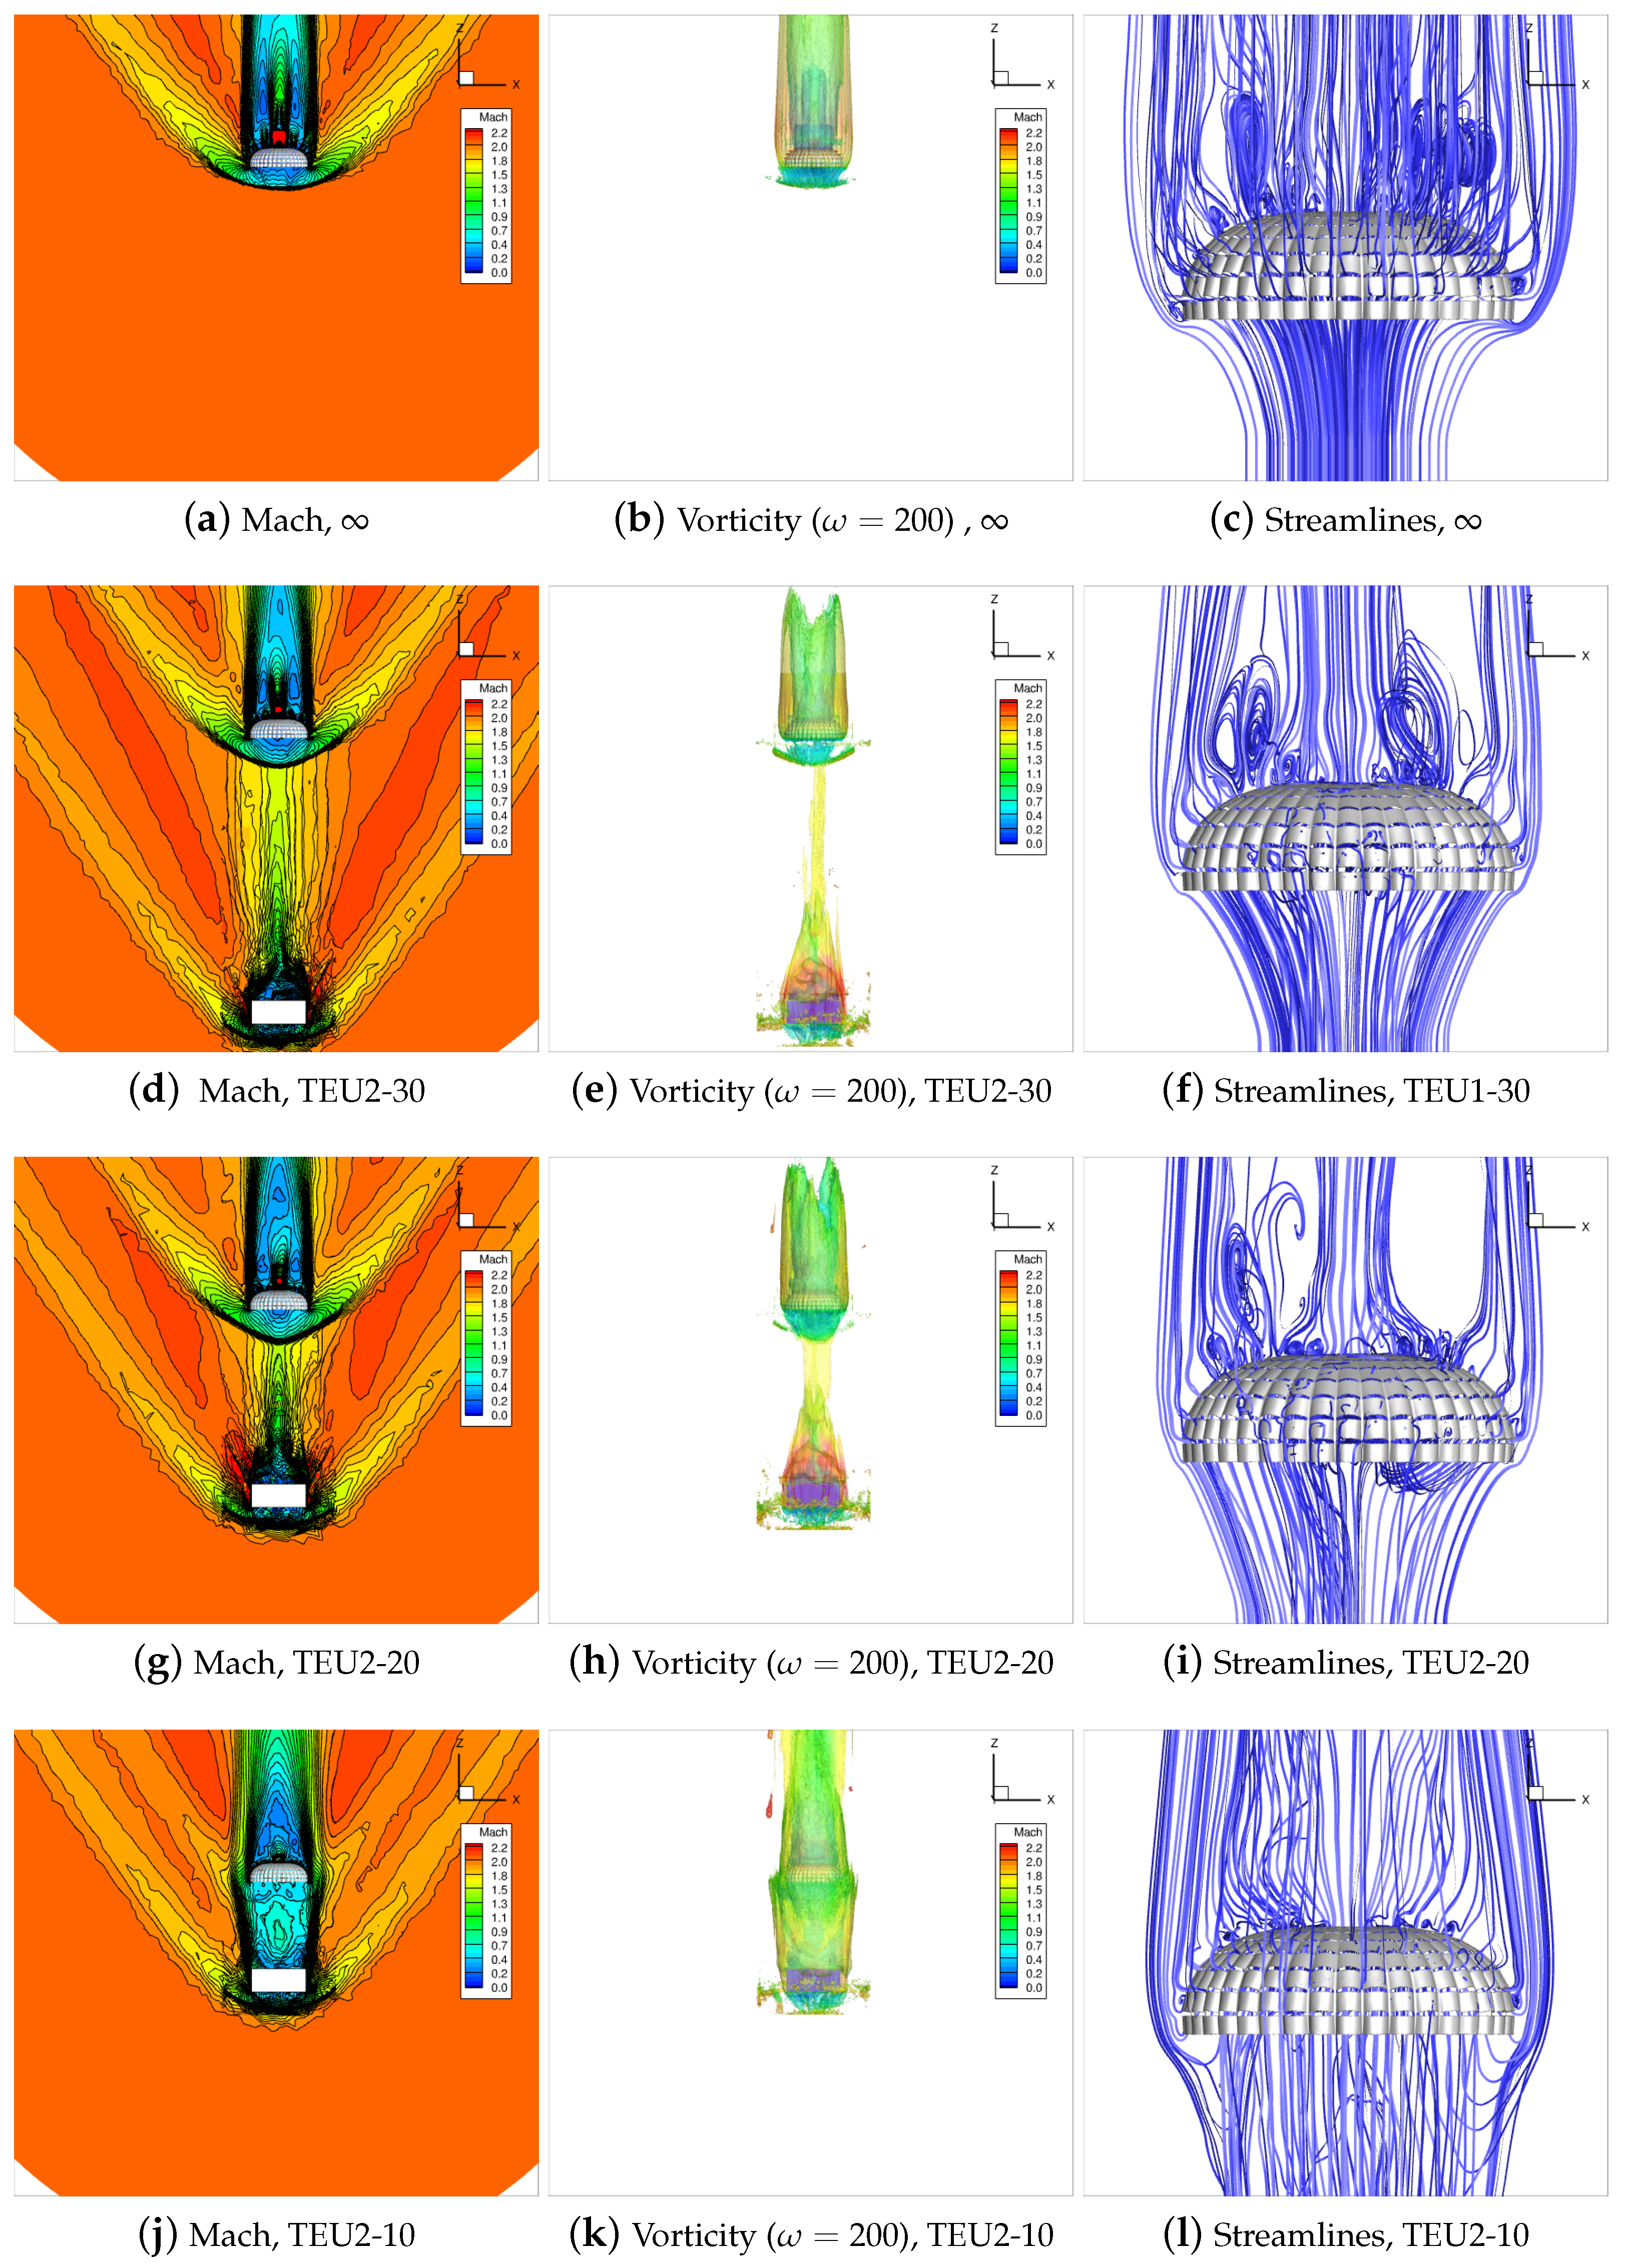
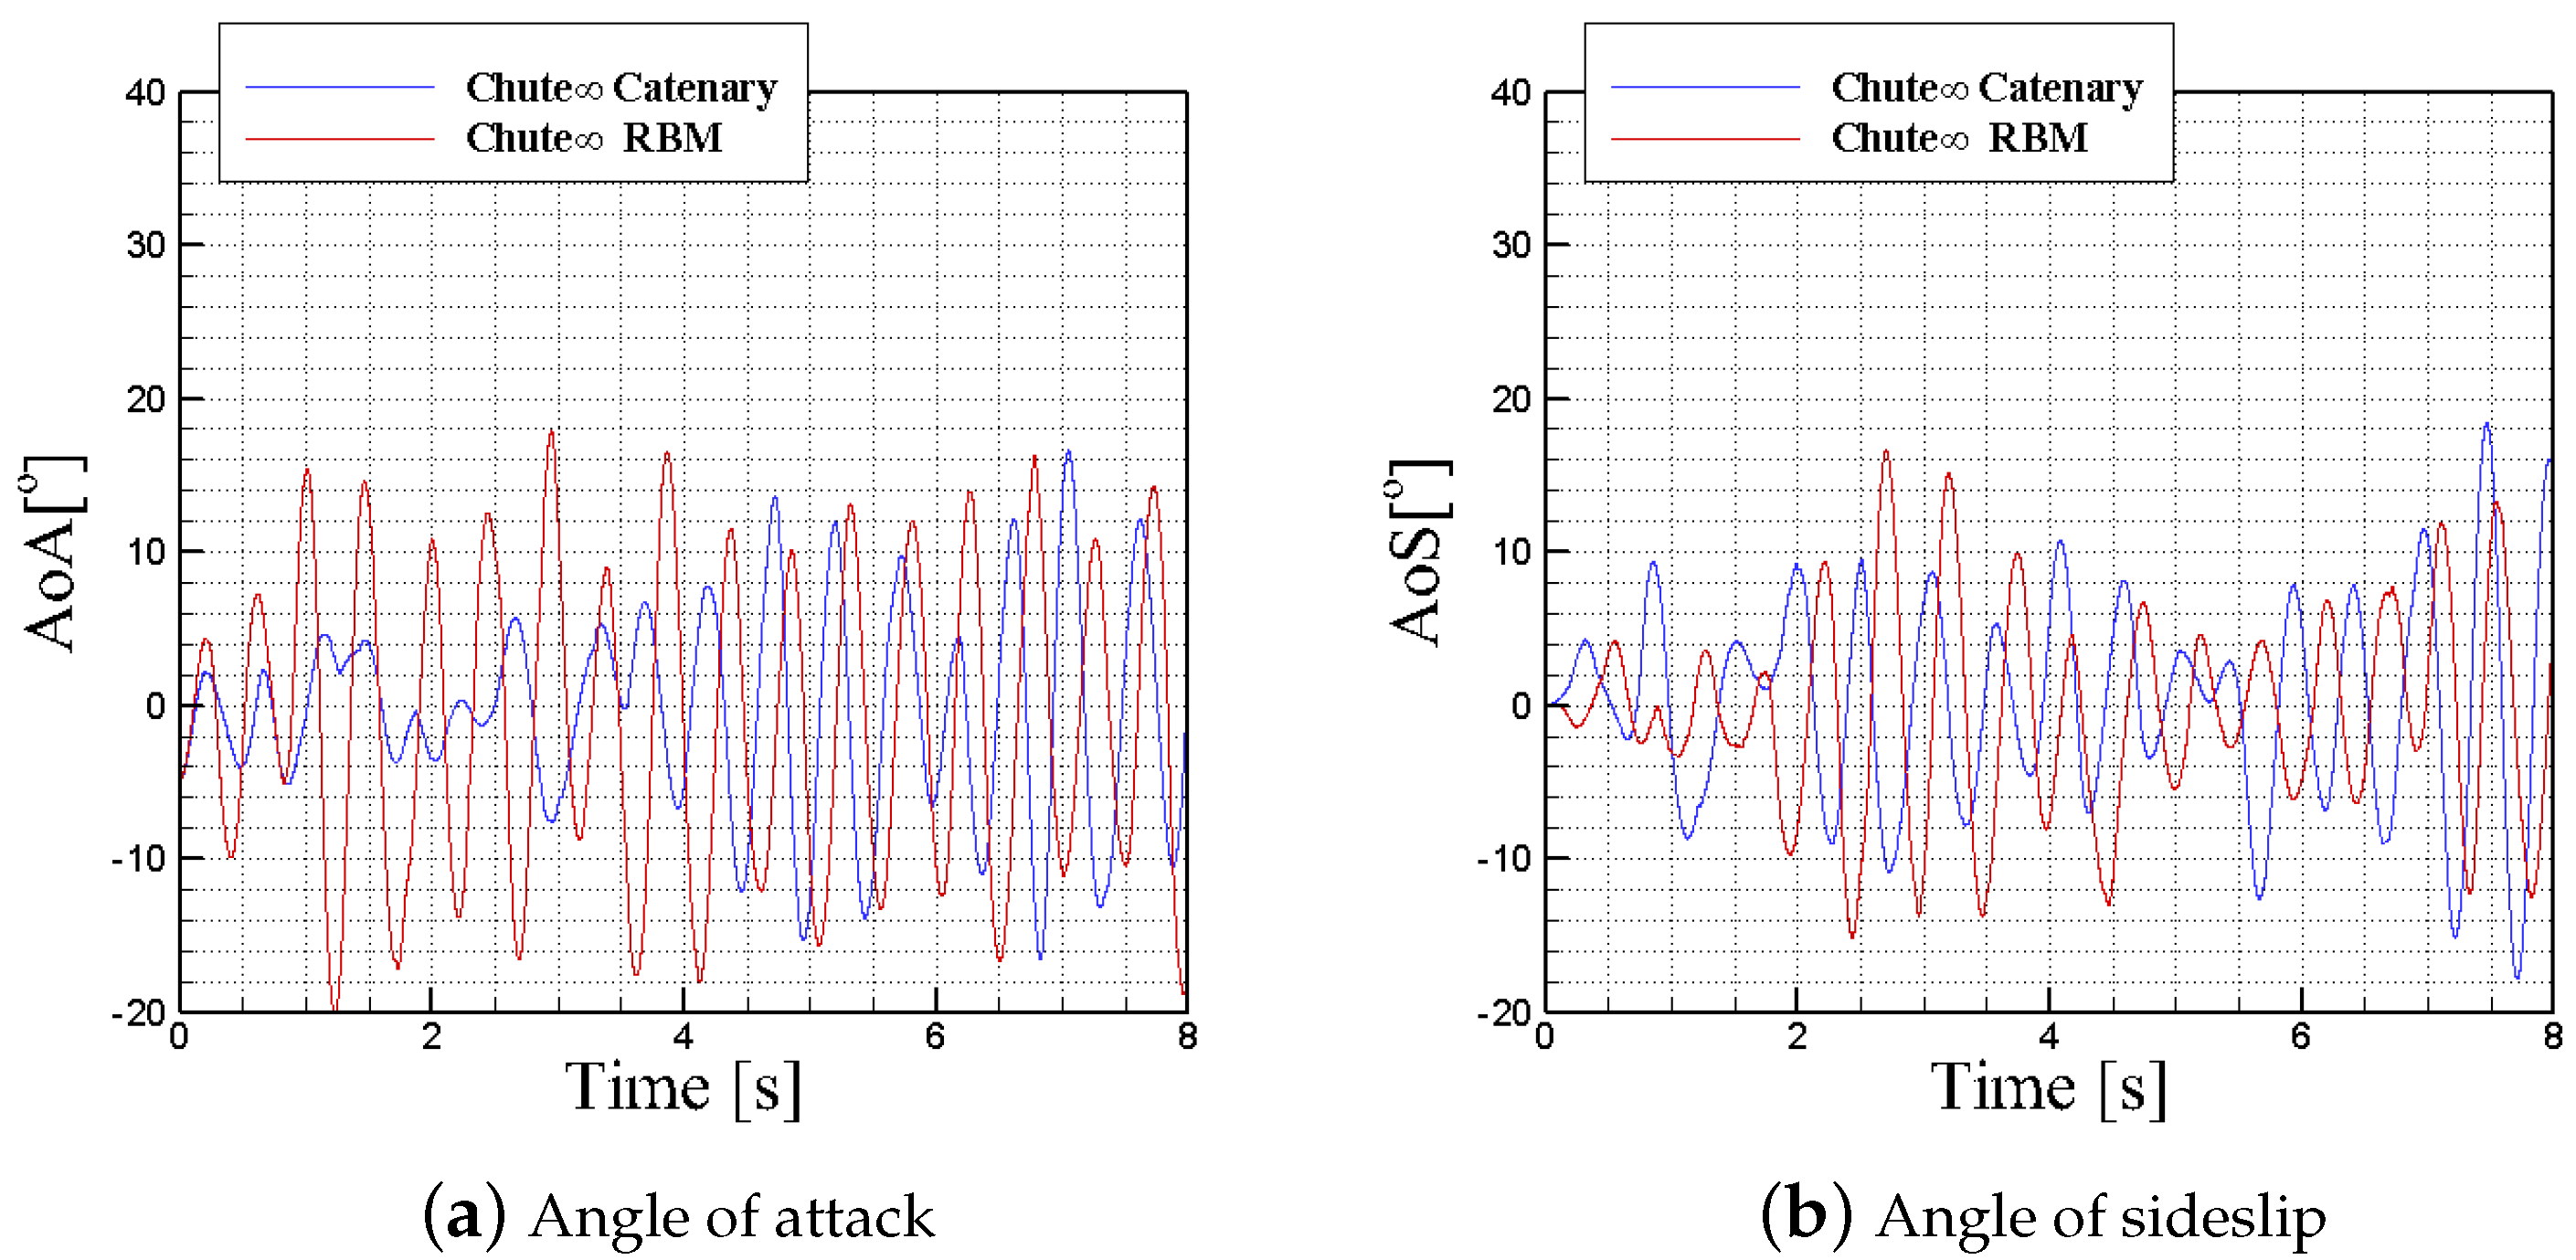
4. Results and Discussion
5. Conclusions
Author Contributions
Funding
Data Availability Statement
Acknowledgments
Conflicts of Interest
Nomenclature
| c | chute reference length |
| drag coefficient | |
| lift coefficient | |
| pitching moment | |
| pitch–moment curve slope | |
| pressure coefficient | |
| center of gravity | |
| chute diameter as calculated from its total wetted surface area | |
| chute projected diameter | |
| M | Mach number |
| Reynolds number, | |
| freestream velocity | |
| parachute angle of attack, deg | |
| parachute geometric porosity | |
| air density, m/kg3 |
References
- Daum, J. Orion Capsule Parachute Assembly System (CPAS) Main and Drogue Canopy Instrumentation. In Proceedings of the AIAA Aviation 2019 Forum, Dallas, TX, USA, 17–21 June 2019. AIAA 2019-3280. [Google Scholar]
- O’Farrell, C.; Brandeau, E.; Tanner, C.; Gallon, J.; Muppidi, S.; Clark, I. Reconstructed Parachute System Performance During the Second LDSD Supersonic Flight Dynamics Test. In Proceedings of the AIAA Atmospheric Flight Mechanics Conference, Washington, DC, USA, 13–17 June 2016. AIAA 2016-3242. [Google Scholar]
- SIERRA SPACE. Sierra Space Website. Available online: https://www.sierraspace.com/press-releases/sierra-space-ghost-enters-flight-test-enabling-global-payload-delivery-in-90-minutes/ (accessed on 13 January 2024).
- Knacke, T. Parachute Recovery Systems Design Manual; Technical Report NWC TP 6575; Para Publishing: Goleta, CA, USA, 1992. [Google Scholar]
- Pepper, W.B.; Maydew, R. Aerodynamic Decelerators-An Engineering Review. J. Aircr. 1971, 8, 3–19. [Google Scholar] [CrossRef]
- Xue, X.; Wen, C.Y. Review of unsteady aerodynamics of supersonic parachutes. Prog. Aerosp. Sci. 2021, 125, 100728. [Google Scholar] [CrossRef]
- Heinrich, H. The effective porosity of parachute cloth. Z. Flugwiss. 1963, 11, 389–398. [Google Scholar]
- Noetcher, G.; Ghoreyshi, M.; Rose, T.; Jirasek, A.; Bergeron, K. Optimization of Extraction Line Distance for Ringslot Parachute Extraction of Heavy Cargo from C-17. In Proceedings of the AIAA Scitech 2021 Forum, Virtual, 11–15, 19–21 January 2021. AIAA Paper 2021-0350. [Google Scholar]
- Bedwell, S.; Ghoreyshi, M.; Bergeron, K. Computational Validation, Verification, and Stability Analysis of Ring-slot and Flat Circular Parachutes. In Proceedings of the 26th AIAA Aerodynamic Decelerator Systems Technology Conference, Toulouse, France, 16–19 May 2022. AIAA 2022-2735. [Google Scholar]
- Bergeron, K.; Ghoreyshi, M. Computational Flow Field and Stability Analysis of Rigid Ring-slot Parachute Models with Varying Geometric Porosity. In Proceedings of the 26th AIAA Aerodynamic Decelerator Systems Technology Conference, Toulouse, France, 16–19 May 2022. AIAA 2022-2751. [Google Scholar]
- Bergeron, K.; Ghoreyshi, M.; Jirasek, A. Computational Study of Ring-slot Parachute Dynamics in Turbulent Flow Fields. In Proceedings of the AIAA SCITECH 2023 Forum, National Harbor, MD, USA, 23–27 January 2023. AIAA 2023-0640. [Google Scholar]
- Ewing, E.; Bixby, H.; Knacke, T. Recovery Systems Design Guide; Technical Report AFFDL-TR-78-151; Irvin Industries: Ann Arbor, MI, USA, 1978. [Google Scholar]
- Sengupta, A.; Roeder, J.; Kelsch, R.; Wernet, M.; Machalick, W.; Reuter, J.; Witkowski, A. Supersonic Disk Gap Band Parachute Performance in the Wake of a Viking-Type Aeroshell from Mach 2 to 2.5. In Proceedings of the AIAA Atmospheric Flight Mechanics Conference and Exhibit, Honolulu, HI, USA, 18–21 August 2008. AIAA 2008-6217. [Google Scholar]
- O’Farrell, C.; Muppidi, S.; Brock, J.M.; Van Norman, J.W.; Clark, I.G. Development of models for disk-gap-band parachutes deployed supersonically in the wake of a slender body. In Proceedings of the 2017 IEEE Aerospace Conference, Big Sky, MT, USA, 4–11 March 2017; pp. 1–16. [Google Scholar] [CrossRef]
- Bergeron, K.; Ghoreyshi, M.; Jirasek, A. Simulation of C-130 H/J troop doors and cargo ramp flow fields. Aerosp. Sci. Technol. 2018, 72, 525–541. [Google Scholar] [CrossRef]
- Benson, R.; Bumpus, D.; Ghoreyshi, M.; Fagley, C.; Bergeron, K. Computational and Experimental Static Stability Analysis of Rectangular Prisms. In Proceedings of the AIAA SCITECH 2024 Forum, Orlando, FL, USA, 8–12 January 2024. AIAA 2024-0903. [Google Scholar]
- Metzler, J.; Fagley, C.; Siefers, T.; Bergeron, K. Characterizing Flow Features in Responding Motion Simulations of Helicopter Sling Loads. In Proceedings of the AIAA SCITECH 2024 Forum, Orlando, FL, USA, 8–12 January 2024. AIAA 2024-1941. [Google Scholar]
- Fan, J.; Hao, J.; Wen, C.Y.; Xue, X. Numerical investigation of supersonic flow over a parachute-like configuration including turbulent flow effects. Aerosp. Sci. Technol. 2022, 121, 107330. [Google Scholar] [CrossRef]
- Rabinovitch, J.; As’ad, F.; Avery, P.; Farhat, C.; Ataei, N.; Lobbia, M. Update: Modeling Supersonic Parachute Inflations for Mars Spacecraft. In Proceedings of the 26th AIAA Aerodynamic Decelerator Systems Technology Conference, Toulouse, France, 16–19 May 2022. AIAA Paper 2022-2746. [Google Scholar]
- Boustani, J.; Cadieux, F.; Kenway, G.; Barad, M.; Kiris, C.; Brehm, C. Fluid-Structure Interaction Simulations of the ASPIRE SR01 Supersonic Parachute. In Proceedings of the AIAA SCITECH 2022 Forum, San Diego, CA, USA, 3–7 January 2022. AIAA Paper 2022-0904. [Google Scholar]
- Yu, H.; Pantano, C.; Cirak, F. Large-Eddy Simulation of Flow Over Deformable Parachutes using Immersed Boundary and Adaptive Mesh. In Proceedings of the AIAA Scitech 2019 Forum, San Diego, CA, USA, 7–11 January 2019. AIAA Paper 2019-00635. [Google Scholar]
- Bergeron, K.; Ghoreyshi, M.; Larsen, E.; Jirasek, A.; Rose, T.; Noetscher, G. Near-Body/Cartesian Off-Body Simulations for C-17 and Extraction Parachute. In Proceedings of the AIAA AVIATION 2020 FORUM, Virtual, 15–19 June 2020. AIAA Paper 2020-2712. [Google Scholar]
- Ghoreyshi, G.; Bergeron, K.; Jirasek, A.; Noetscer, G.; Rose, T. Investigation of New HPCMP CREATETM-AV Kestrel Capabilities for Simulation of Extraction Parachutes. In Proceedings of the AIAA AVIATION 2022 Forum, Chicago, IL, USA, 27 June–1 July 2022. AIAA 2022-3898. [Google Scholar]
- Roth, G.; Morton, S.; Brooks, G. Integrating CREATE-AV products DaVinci and Kestrel: Experiences and lessons learned. In Proceedings of the 50th AIAA Aerospace Sciences Meeting including the New Horizons Forum and Aerospace Exposition, Nashville, TN, USA, 9–12 January 2012. AIAA Paper 2012-1063. [Google Scholar] [CrossRef]
- Morton, S.A.; McDaniel, D.R. A fixed-wing aircraft simulation tool for improving DoD acquisition efficiency. Comput. Sci. Eng. 2015, 18, 25–31. [Google Scholar] [CrossRef]
- McDaniel, D.R.; Nichols, R.H.; Eymann, T.A.; Starr, R.E.; Morton, S.A. Accuracy and Performance Improvements to Kestrel’s Near-Body Flow Solver. In Proceedings of the 54th AIAA Aerospace Sciences Meeting, San Diego, CA, USA, 4–8 January 2016. AIAA Paper 2016-1051. [Google Scholar] [CrossRef]
- Glasby, R.S.; Erwin, J.T. Introduction to COFFE: The Next-Generation HPCMP CREATETM-AV CFD Solver. In Proceedings of the 54th AIAA Aerospace Sciences Meeting, San Diego, CA, USA, 4–8 January 2016. AIAA Paper 2016-0567. [Google Scholar] [CrossRef]
- Eymann, T.A.; Nichols, R.H.; Tuckey, T.; McDaniel, D.R. Cartesian Adaptive Mesh Refinement with the HPCMP CREATETM-AV Kestrel Solver. In Proceedings of the 53rd AIAA Aerospace Sciences Meeting, Kissimmee, FL, USA, 5–9 January 2015. AIAA Paper 2015-0040. [Google Scholar] [CrossRef]
- Glasby, R.; Erwin, J.; Eymann, T.; Nichols, R.; McDaniel, D.; Karman, S., Jr.; Stefanski, D.; Holst, K. Results from DoD HPCMP CREATETM-AV Kestrel for the 3rd AIAA High Lift Prediction Workshop. In Proceedings of the 2018 AIAA Aerospace Sciences Meeting, Kissimmee, FL, USA, 8–12 January 2018. AIAA Paper 2018-1256. [Google Scholar] [CrossRef]
- Morton, S.A.; Tillman, B.; McDaniel, D.R.; Sears, D.R.; Tuckey, T.R. Kestrel—A Fixed Wing Virtual Aircraft Product of the CREATE Program. In Proceedings of the 2009 DoD High Performance Computing Modernization Program Users Group Conference, San Diego, CA, USA, 15–18 June 2009. AIAA Paper 2009-0338. [Google Scholar] [CrossRef]
- Godnov, S. A difference scheme for numerical computation of discontinuous solution of hydrodynamic equations. Math Sb. 1959, 47, 271–306. (In Russian) [Google Scholar]
- Tramel, R.; Nichols, R.; Buning, P. Addition of improved shock-capturing schemes to OVERFLOW 2.1. In Proceedings of the 19th AIAA Computational Fluid Dynamics, San Antonio, TX, USA, 22–25 June 2009. AIAA Paper 2009-3988. [Google Scholar] [CrossRef]
- Spalart, P.; Allmaras, S. A one-equation turbulence model for aerodynamic flows. In Proceedings of the 30th Aerospace Sciences Meeting and Exhibit, Reno, NV, USA, 6–9 January 1992. AIAA Paper 1992-0439. [Google Scholar] [CrossRef]
- Spalart, P.; Shur, M. On the sensitization of turbulence models to rotation and curvature. Aerosp. Sci. Technol. 1997, 1, 297–302. [Google Scholar] [CrossRef]
- Menter, F.R. Eddy viscosity transport equations and their relation to the k-ε model. ASME J. Fluids Eng. 1997, 119, 876–884. [Google Scholar] [CrossRef]
- Spalart, P.; Allmaras, S. Comments on the feasibility of LES for wings, and on a hybrid RANS/LES approach. In Proceedings of the first AFOSR international conference on DNS/LES, Ruston, LA, USA, 4–8 August 1997. [Google Scholar]


| Case | f [Hz] | ||||||
|---|---|---|---|---|---|---|---|
| ∞, M2 | 0.9247 | 0.0028061 | −0.0039595 | 0.023733 | 0.008716 | 0.012272 | 1.4956 |
| TEU1-10m, M2 | 0.2693 | −0.008386 | 0.01099 | 0.030594 | 0.014799 | 0.020636 | 18.533 |
| TEU2-10m, M2 | 0.216 | −0.00102 | 0.001388 | 0.02806 | 0.01243 | 0.017043 | 15.2 |
| TEU1-20m, M2 | 0.5749 | −0.00759 | 0.009995 | 0.04658 | 0.02043 | 0.0286 | 22.3 |
| TEU2-20m, M2 | 0.573 | 0.00124 | −0.00145 | 0.0326 | 0.0204 | 0.0284 | 22.7 |
| TEU1-30m, M2 | 0.632 | −0.0104 | 0.01387 | 0.0382 | 0.0164 | 0.0232 | 19.2 |
| TEU2-30m, M2 | 0.6034 | −0.00308 | 0.00398 | 0.02696 | 0.02119 | 0.0295 | 22.0 |
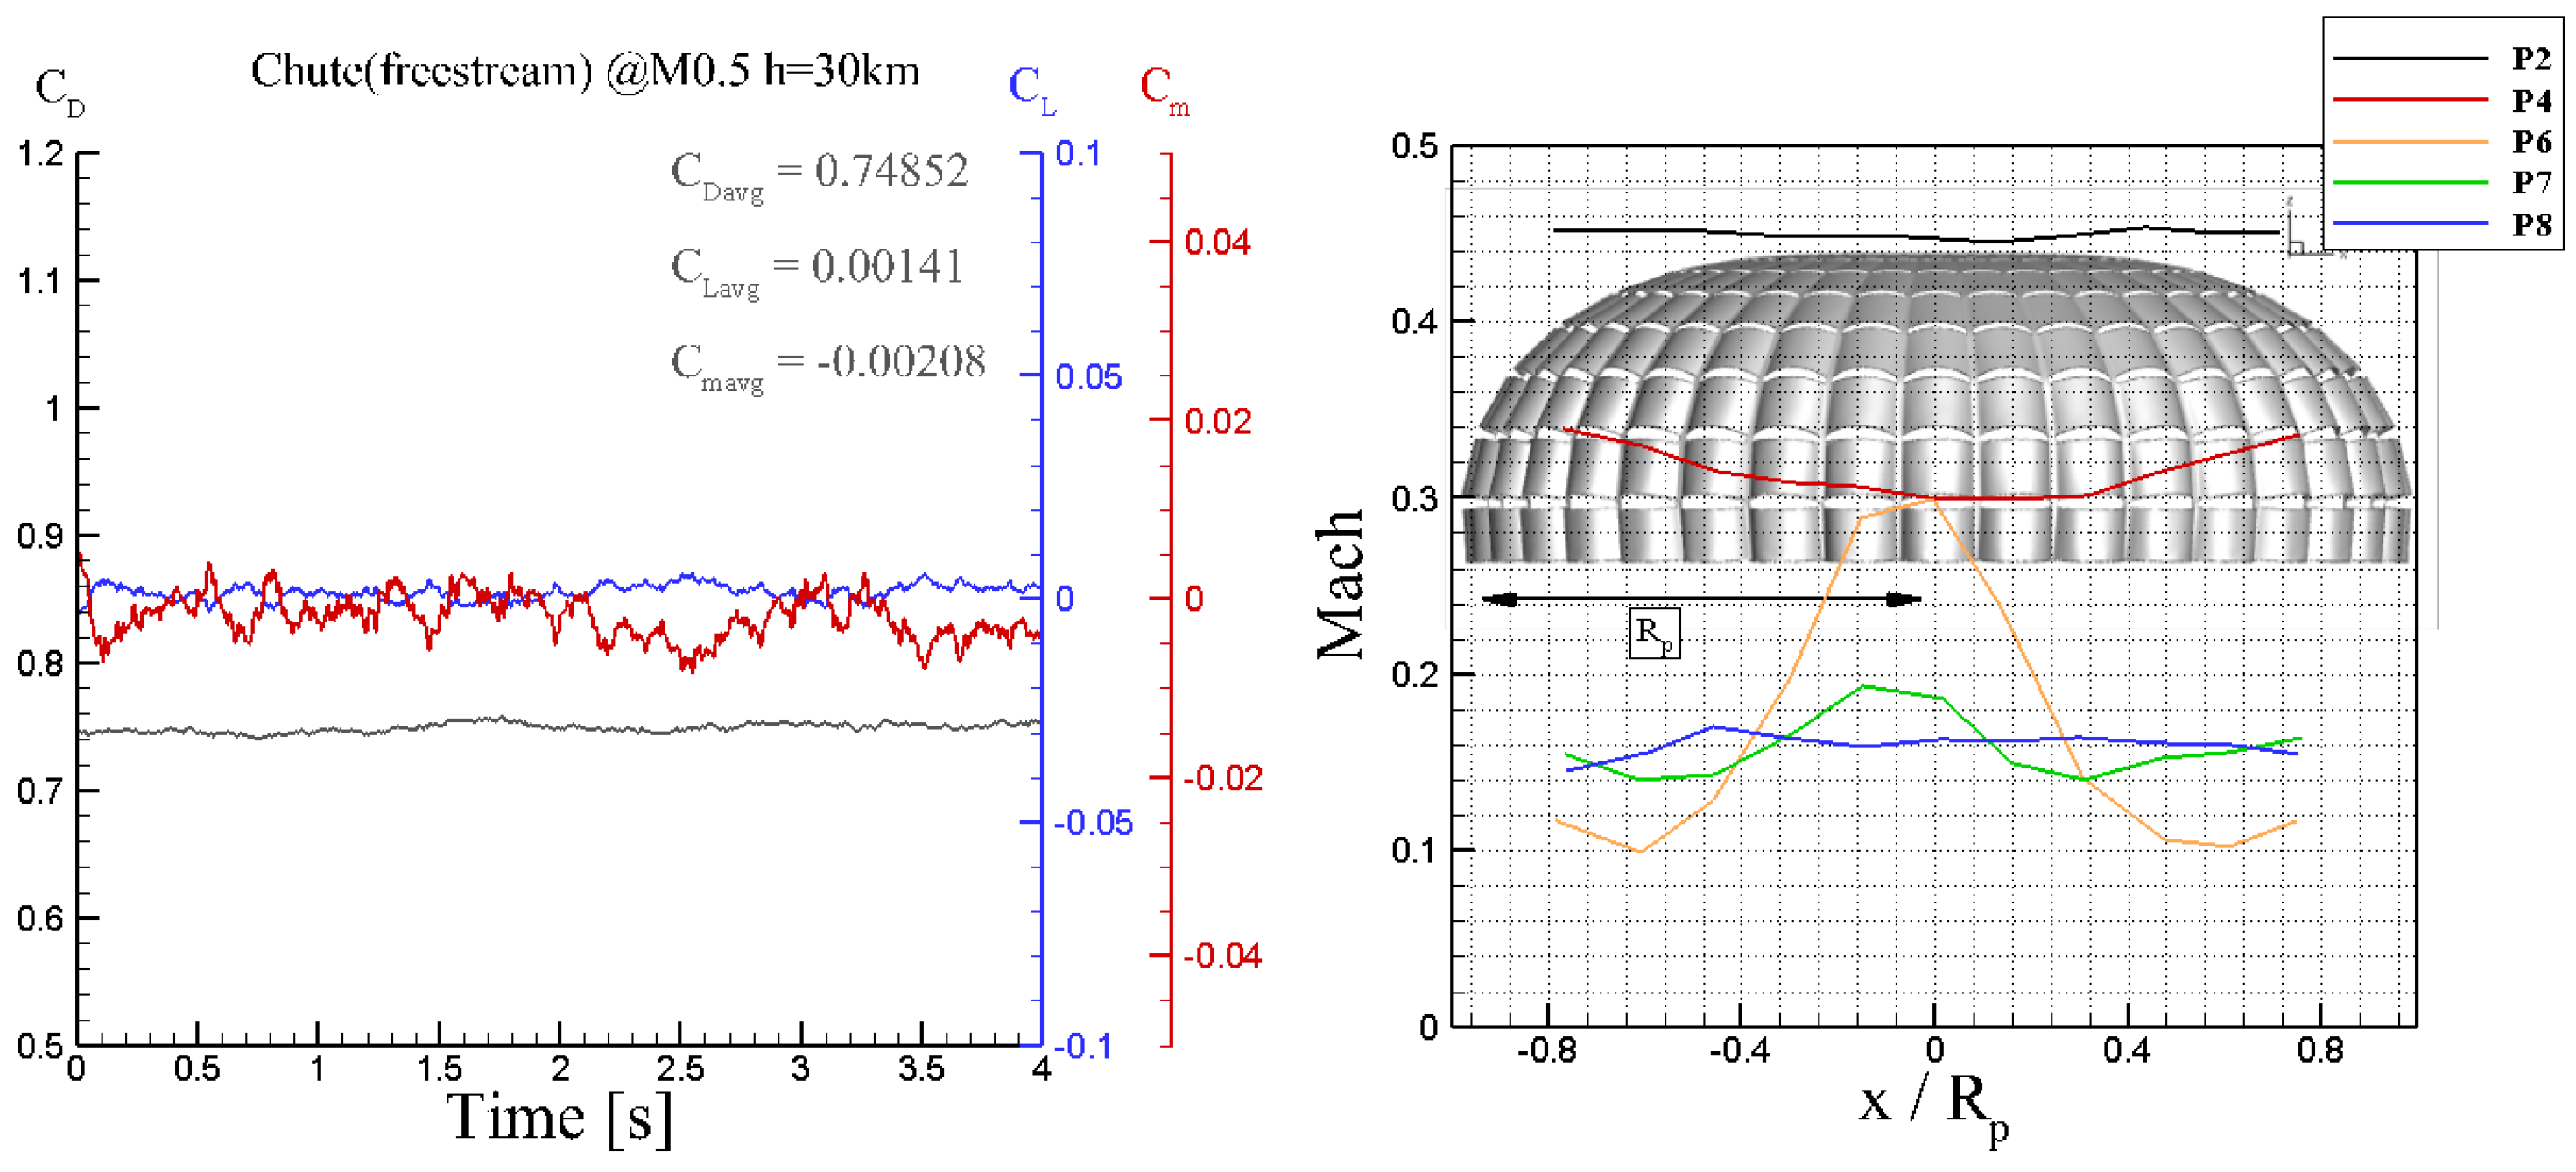
| ∞, M05 | 0.7485 | 0.0014117 | −0.00208 | 0.003479 | 0.0016838 | 0.002431 | 0.77813 |
| TEU1-10m, M05 | 0.557 | 0.00302 | −0.0042 | 0.05883 | 0.0349 | 0.05089 | 5.0 |
| TEU1-20m, M05 | 0.617 | 0.003425 | −0.00454 | 0.03892 | 0.01777 | 0.02544 | 7.7 |
| TEU1-30m, M05 | 0.668 | −0.00054 | 0.00093 | 0.03298 | 0.015079 | 0.021707 | 0.68 |
| ∞, M07 | 0.77709 | 0.00012422 | −0.00018692 | 0.0032741 | 0.0023439 | 0.0033981 | 0.17 |
| ∞, M09 | 0.81093 | 0.0018863 | −0.0027832 | 0.0039234 | 0.001531 | 0.0022253 | 0.30 |
| ∞, M1.1 | 0.9058 | 0.00065987 | −0.00044181 | 0.002662 | 0.000955 | 0.001327 | 0.093 |
| ∞, M1.5 | 0.9096 | −0.00011073 | 0.00017779 | 0.0011764 | 0.00069426 | 0.00096917 | 0.992 |
Disclaimer/Publisher’s Note: The statements, opinions and data contained in all publications are solely those of the individual author(s) and contributor(s) and not of MDPI and/or the editor(s). MDPI and/or the editor(s) disclaim responsibility for any injury to people or property resulting from any ideas, methods, instructions or products referred to in the content. |
© 2025 by the authors. Licensee MDPI, Basel, Switzerland. This article is an open access article distributed under the terms and conditions of the Creative Commons Attribution (CC BY) license (https://creativecommons.org/licenses/by/4.0/).
Share and Cite
Bergeron, K.; Ghoreyshi, M.; Jirasek, A. Simulation and Stability Analysis of a Coupled Parachute–Payload System. Aerospace 2025, 12, 116. https://doi.org/10.3390/aerospace12020116
Bergeron K, Ghoreyshi M, Jirasek A. Simulation and Stability Analysis of a Coupled Parachute–Payload System. Aerospace. 2025; 12(2):116. https://doi.org/10.3390/aerospace12020116
Chicago/Turabian StyleBergeron, Keith, Mehdi Ghoreyshi, and Adam Jirasek. 2025. "Simulation and Stability Analysis of a Coupled Parachute–Payload System" Aerospace 12, no. 2: 116. https://doi.org/10.3390/aerospace12020116
APA StyleBergeron, K., Ghoreyshi, M., & Jirasek, A. (2025). Simulation and Stability Analysis of a Coupled Parachute–Payload System. Aerospace, 12(2), 116. https://doi.org/10.3390/aerospace12020116