Article

New Transonic Tests of HB-2 Hypersonic Standard Models in the VTI T-38 Trisonic Wind Tunnel

by
Dijana Damljanović
1,*,
Đorđe Vuković
1,†,
Goran Ocokoljić
1 and
Boško Rašuo
2
1
Military Technical Institute (VTI), Ratka Resanovića 1, 11030 Belgrade, Serbia
2
Faculty of Mechanical Engineering, University of Belgrade, Kraljice Marije 16, 11120 Belgrade, Serbia
*
Author to whom correspondence should be addressed.
Recently retired.
Aerospace 2025, 12(2), 131; https://doi.org/10.3390/aerospace12020131
Submission received: 30 December 2024 / Revised: 30 January 2025 / Accepted: 6 February 2025 / Published: 9 February 2025
(This article belongs to the Special Issue New Results in Wind Tunnel Testing)

Abstract

:
Recent experience has shown that test results of standard wind tunnel models under off-design conditions could be a useful aid in preparations of some nonstandard wind tunnel tests. However, reference data for such conditions do not exist, or they are scarce. Therefore, off-design transonic wind tunnel tests of the HB-2 standard models were executed in the VTI T-38 wind tunnel as a supplement to the supersonic tests of the same models under design-intent conditions, for which reference results were available. New tests were conducted so that test envelopes partially overlapped with those from available supersonic reference data. Good agreements of results with references were confirmed in the overlapped ranges, so it was assumed that, by implication, the obtained results were also valid in the transonic range of conditions, with an observation that the effects of sting diameter were much more pronounced in the transonic range than in the supersonic one. HB-2 models were tested in two sizes, using two different wind tunnel balances for each model, so that the results can be used with more confidence.

1. Introduction

Aside from test section calibrations [1,2,3], wind tunnel data quality assurance activities often include tests of standard models [4,5]. The primary intention is to verify the reliability of obtained data, as well as test-to-test and in-test data repeatability [6].
Standard wind tunnel models (wind tunnel calibration models, check standards) are objects of relatively simple, precisely defined, and reproducible shapes, having known aerodynamic characteristics, that are tested in wind tunnels with the intent to verify, by comparing the test results with previously obtained results, the measurement chains in wind tunnels, check data repeatability over time, establish correlations between the results from different test facilities [7], establish the reliability of the data from a new or upgraded wind tunnel, validate new data-reduction and correction techniques [8], and validate CFD studies [9].
Standard models usually resemble simplified aeronautical shapes such as an airplane, a rocket or a reentry body. Most have been designed for a particular range of test conditions: the AGARD-B model was intended primarily for the supersonic Mach range, AGARD-C and ONERA-M for the transonic Mach range, and HB-1 and HB-2 for the supersonic and hypersonic Mach ranges. Databases of published results for most standard models in design-intent test condition ranges are fairly comprehensive.
On the other hand, experimenters sometimes face the problem of designing and performing non-standard wind tunnel tests [10]. Also, wind tunnel models may be briefly subjected to transient off-design conditions at some instances during a test. A short test of a standard model before a planned “non-standard” wind tunnel test can help to verify the setup and increase confidence in the results. Off-design conditions in tests of standard models may include high angles of attack, Mach numbers outside the design-intent envelope, alternate model and support configurations, and transients during the establishment or breakdown of supersonic flow. However, published test results for standard models under off-design test conditions are quite rare and may not be available at all.
The Experimental Aerodynamics Laboratory of the Military Technical Institute (VTI) in Belgrade was, on several occasions, in need of reference results for standard models under off-design conditions to aid in the preparation of some specific wind tunnel tests. Such results were found to be few or nonexistent, so, over the past period, several wind tunnel test campaigns of standard models under off-design conditions were made, with the intent to make an internal database for future tests. Those included tests of the AGARD-B body-wing configuration at low Mach numbers, tests of the ONERA-M half-model configuration at low subsonic speeds, tests of the HB-2 model at angles of attack up to 30°, and tests of the AGARD-B and HB models at supersonic-flow-start conditions [10].
The off-design tests of standard models were mostly opportunistic, performed when schedules permitted, as continuations of the test campaigns with the same models under design-intent conditions, for which reference results were available. They were configured so that, when possible, test envelopes partially overlapped with the test ranges for which the reference data were available. After confirming good agreements of off-design results with reference data in the available ranges, it was assumed that the obtained results were, by implication, also valid in the extended ranges.
Recently, forces-and-moments tests of two HB-2 models, with 75 mm and 100 mm body diameters (Figure 1), were performed under non-standard transonic conditions in the Mach number range from 0.7 to 1.4 [11].
Wind tunnel tests were performed in the VTI T-38 wind tunnel using two different wind tunnel balances, first in the supersonic and then transonic speed ranges, so the design-intended supersonic test data were extended under off-design transonic conditions.

2. Materials and Methods

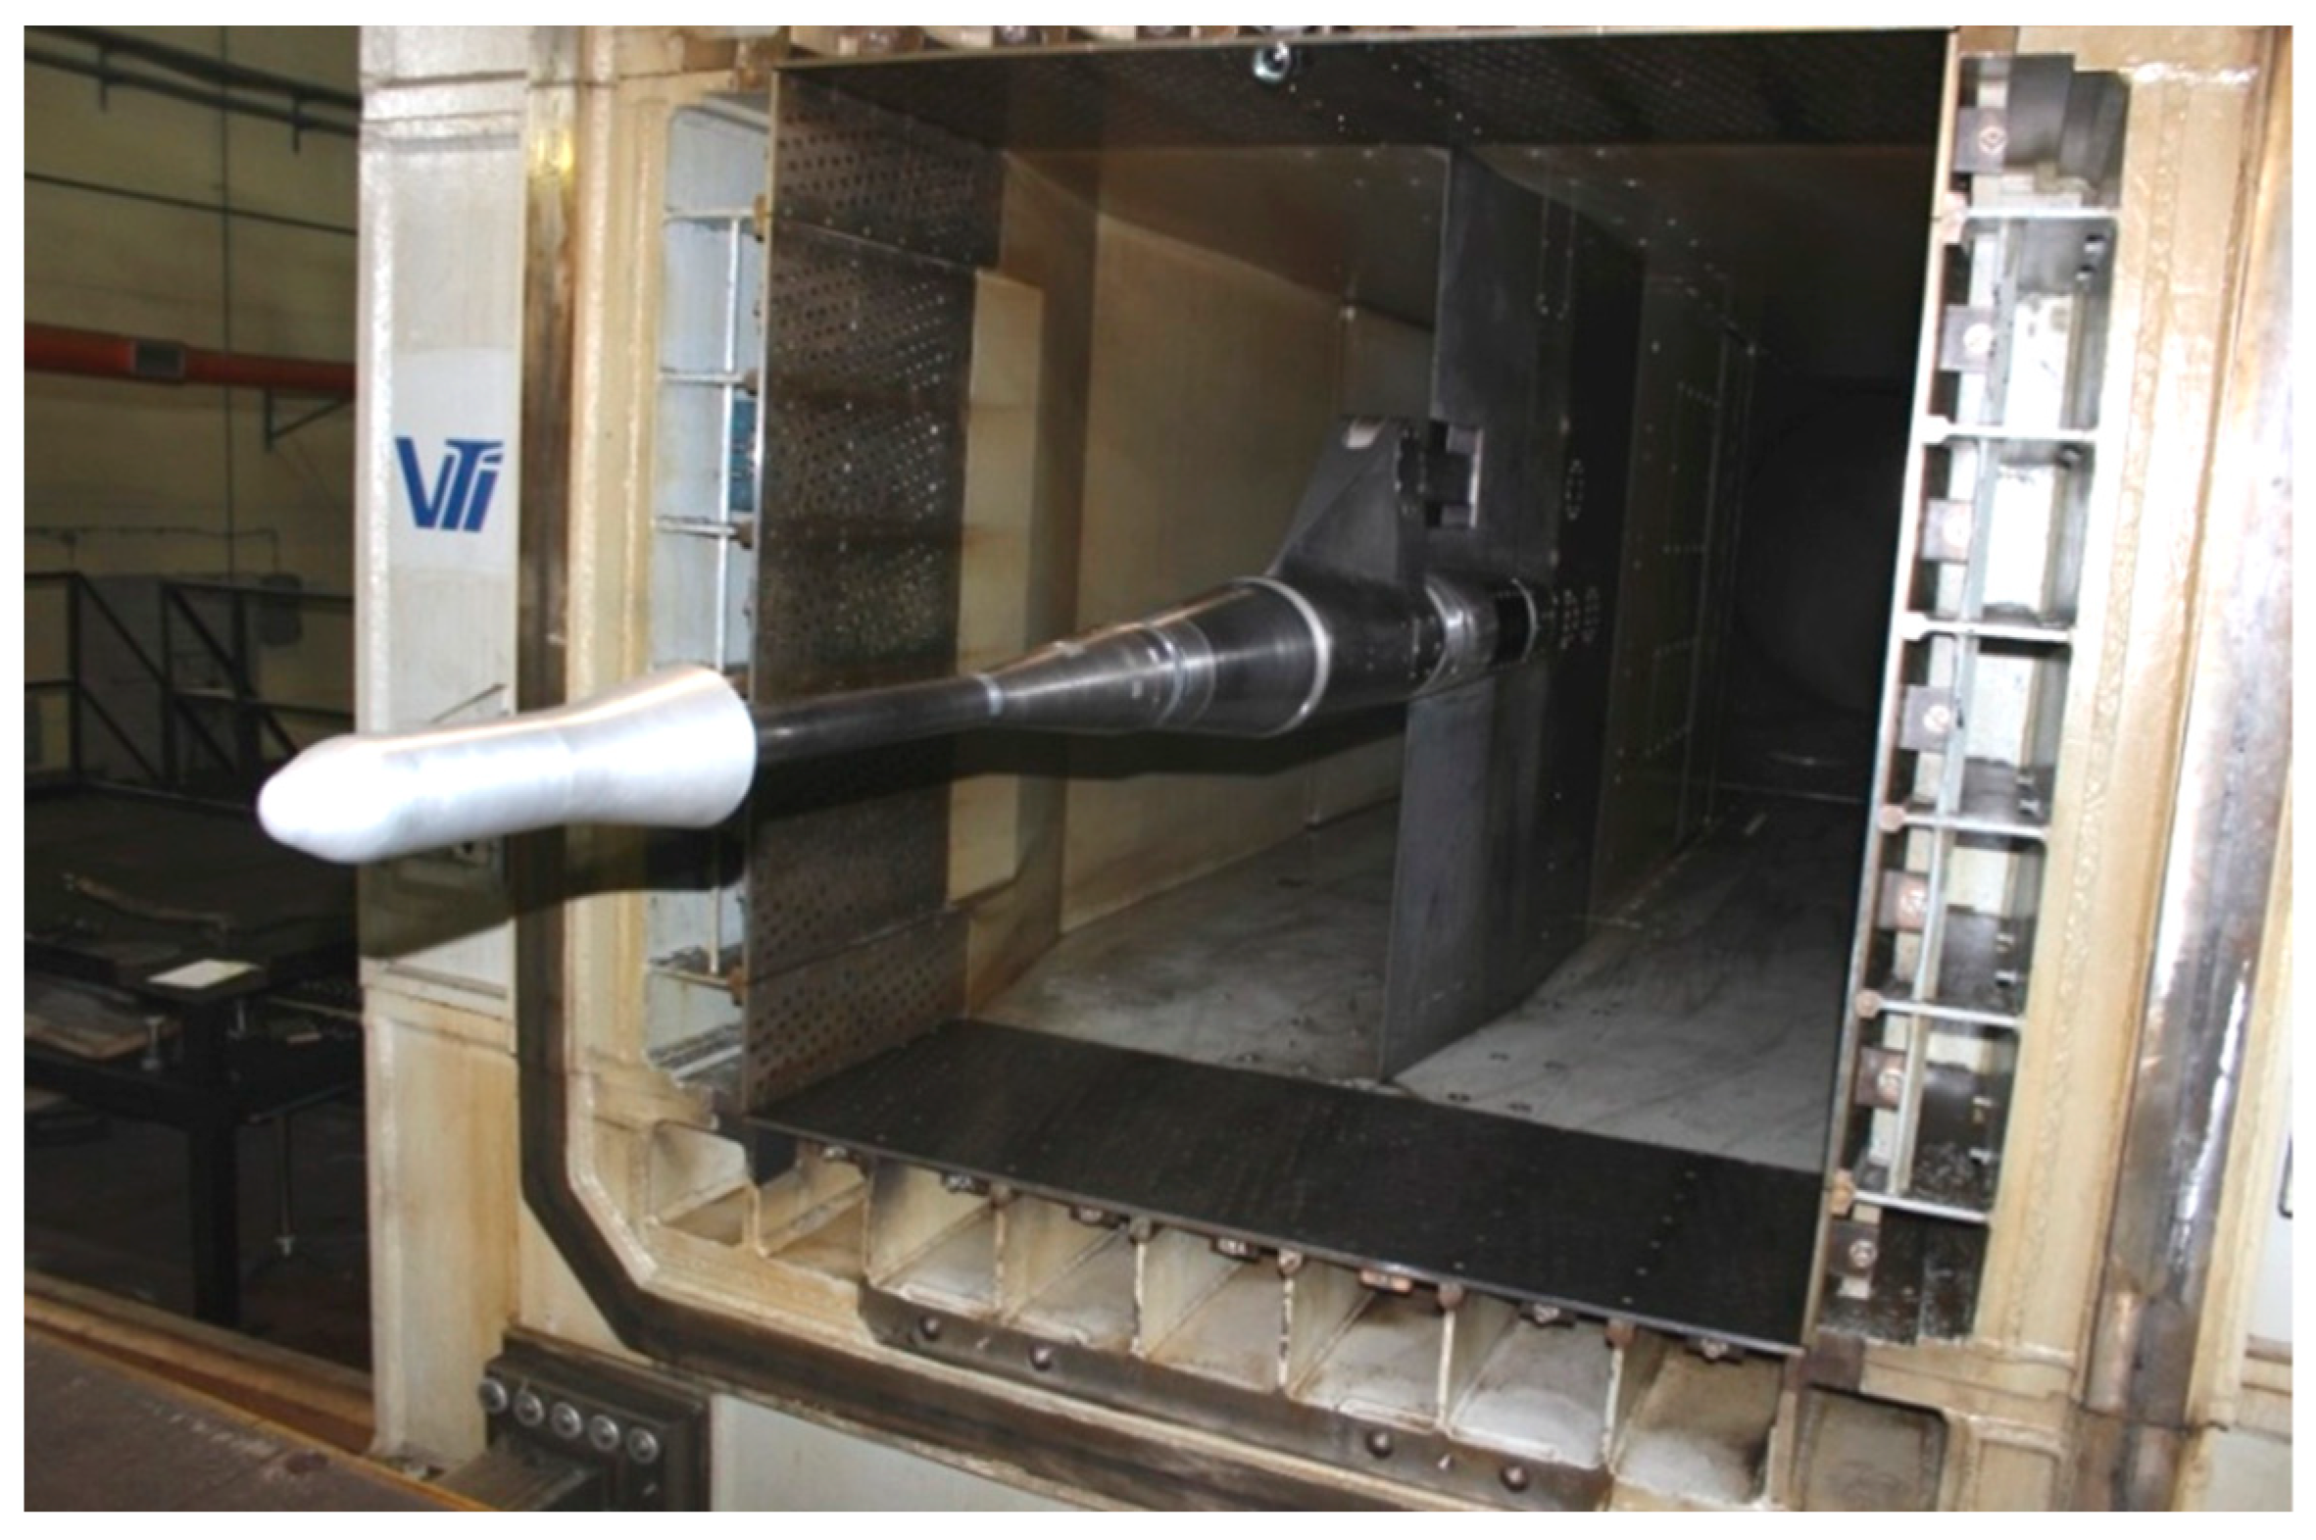
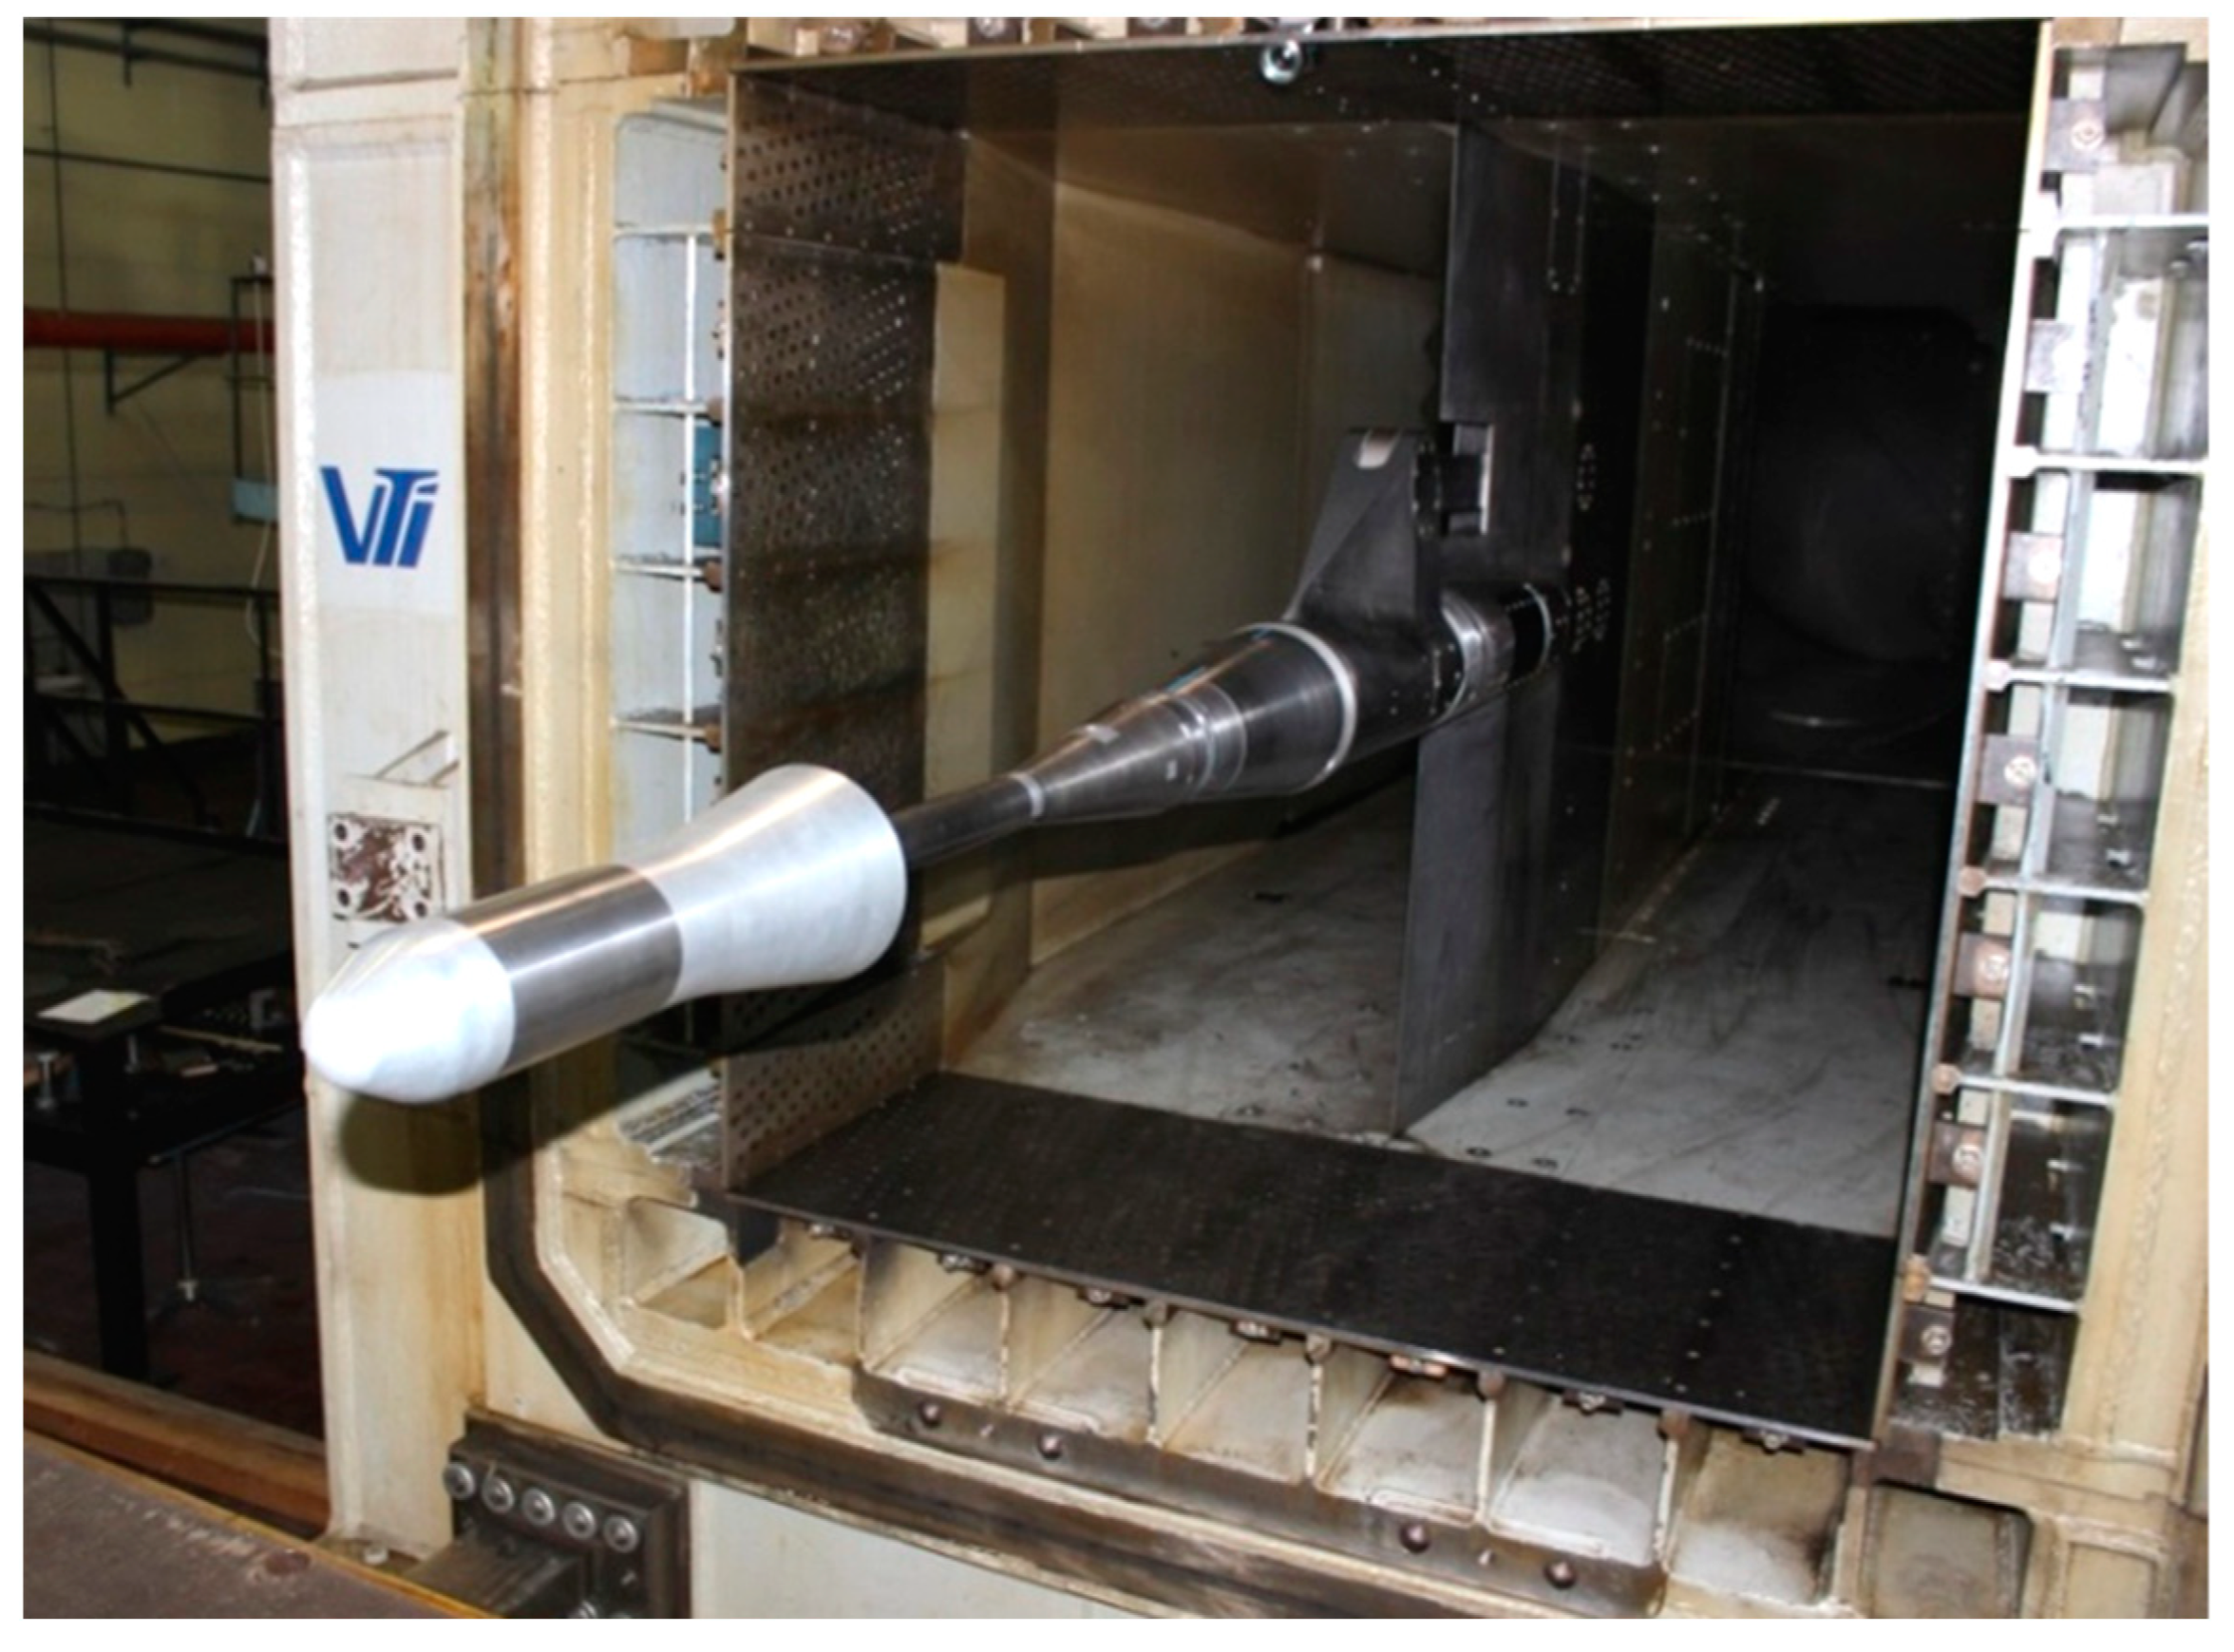
2.1. HB-2 Standard Model
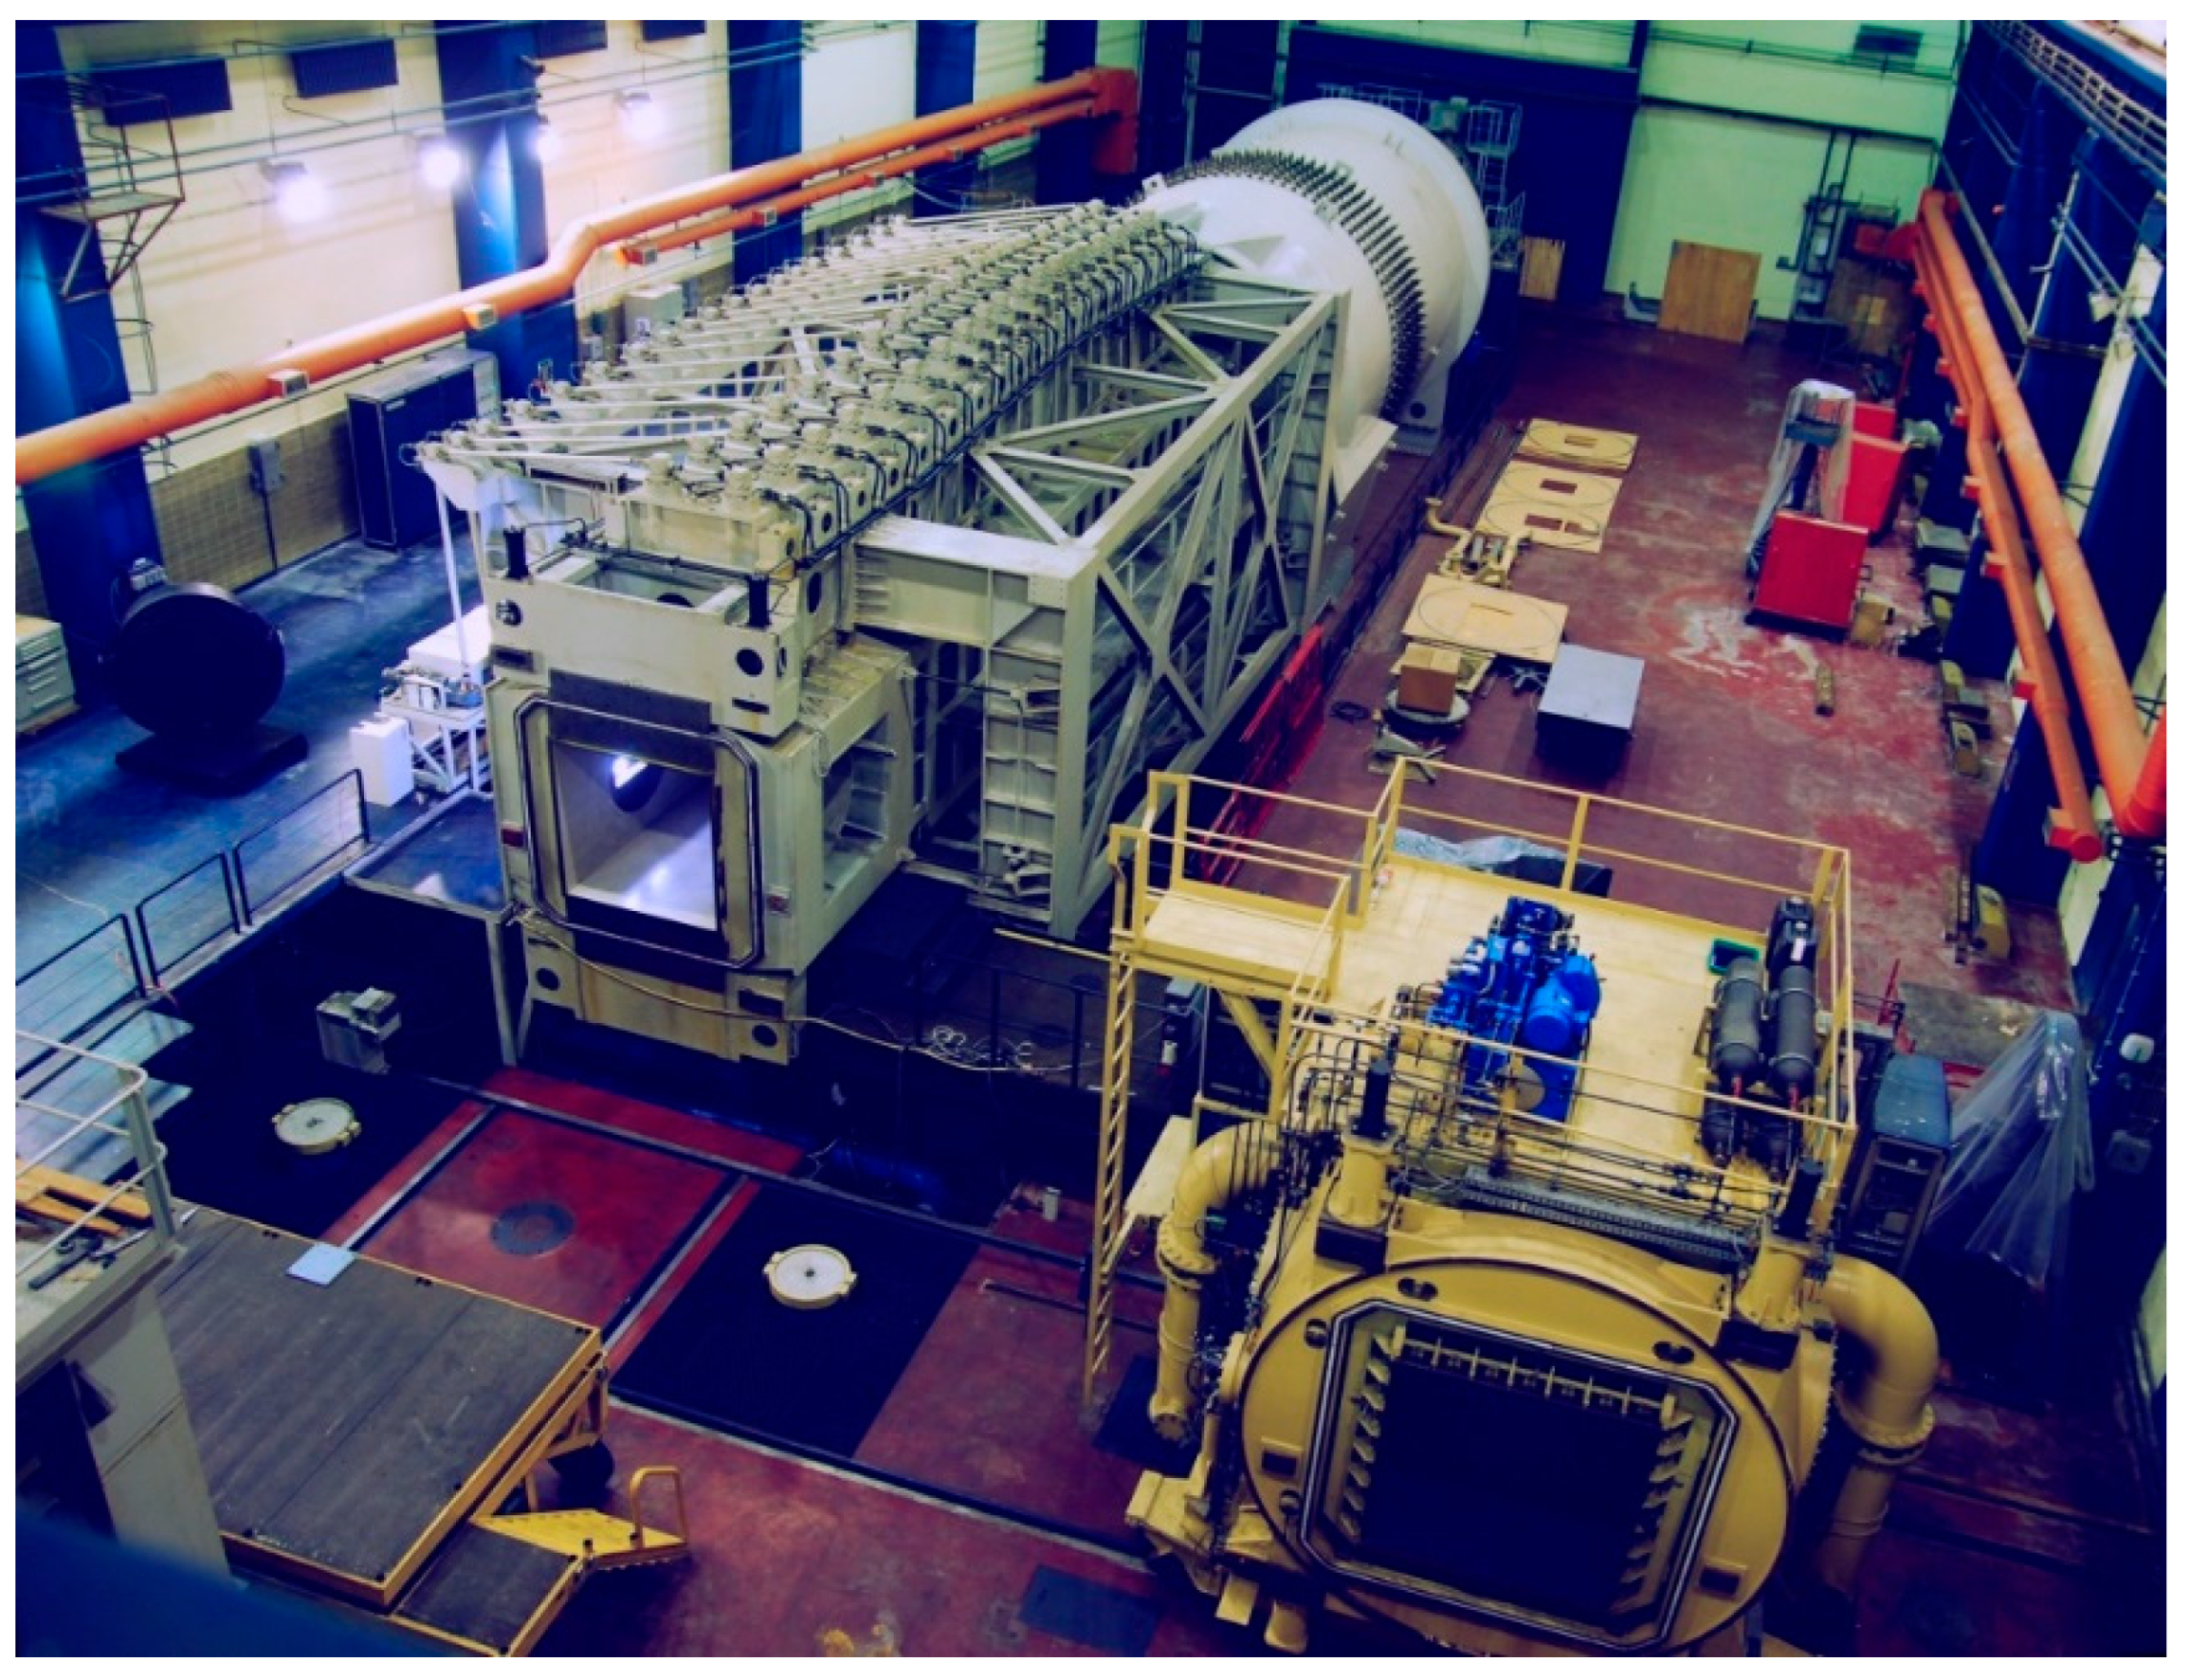
The Hypervelocity Ballistic (HB) standard model is an axisymmetric cone-cylinder body with a blunted conical nose having a 25° half-angle. It was proposed [12] in 1960 by the Von Karman Gas Dynamics Facility in AEDC, US, in two configurations, designated HB-1 and HB-2. The most-used HB-2 configuration has a 10° tail flare (Figure 2), in order to reduce the model’s sensitivity to viscous effects [12]. Unit length for the definition of model shape is the diameter (D) of the cylindrical forebody. The length of the model is 4.9 D. The reference point for moments is at 1.95 D from the nose tip.
Dimensions of the sting specified in the definition of the HB models were chosen to ensure negligible sting interference on the base pressure in turbulent flow. The sting should have a constant diameter of no more than 0.3 D and a length of no less than 3 D, with a downstream fairing having a 20° half-angle.
HB models of VTI were designed for quick assembly so that they can be easily mounted and tested, using adaptors, on several force balances from VTI’s repository. Previous force tests of those models (Figure 3 and Figure 4) were executed in the supersonic Mach number range, from Mach 1.5 to Mach 4.
It was shown in [13] that the relatively thin ‘standard’ sting, as defined in [12], can compromise model safety when testing HB models in a wind tunnel with high dynamic pressure, such as the T-38 trisonic wind tunnel of VTI, because of the high stresses in the sting, mostly during the supersonic starting/stopping loads. This has led to some tests of these models, including some of the reference tests, being performed with non-standard sting configurations. An increase in relative sting diameter from 0.3 D to 0.5 D (e.g., the same sting/body diameter ratio as for the AGARD-B model) eliminates the problems related to the stresses in the sting, but with the penalty of larger sting interference.
A local standardization of the relative sting diameter to 0.5 (referring to model forebody diameter D) was, therefore, proposed for tests of HB models in the VTI T-38 wind tunnel. However, this standardization was not completely adhered to: because of the limited availability of convenient stings. Both HB-2 models were tested on the same sting; the relative sting diameter was 0.64 for the smaller and 0.48 for the larger model (i.e., close but not identical to the proposed local standardization). As it is known that the presence of a sting affects the flow around the model base, the difference from the ‘standard’ setup should be taken into account when analyzing the results, expecting the results for the base-pressure coefficient and the total axial-force coefficient to be most affected.

2.2. Test Facility

The T-38 wind tunnel (Figure 5) is the most used and the most capable aerodynamic test facility in VTI [14]. It is a 1.5 m × 1.5 m, pressurized, blowdown-type wind tunnel, operating in the subsonic, transonic and supersonic speed ranges. For subsonic and supersonic tests a solid-wall test section is used. A test section with perforated porous walls is added to the wind tunnel configuration for transonic tests. Depending on Mach number, the porosity of ventilated walls of the transonic test section is varied between 1.5% and 4%. Optimum porosity settings for each Mach number were determined during the calibration of the wind tunnel [15], so as to minimize the wall interference effects and wave reflections from the walls.
The Mach number range of the wind tunnel is 0.2 to 4.0 and can be regulated to within 0.3% of the nominal value. In the subsonic speed ranges, the Mach number is set prior to a wind tunnel run by setting the opening of the second throat. In the transonic and supersonic speed ranges, the Mach number is set by setting the variable-geometry nozzle contour. In the transonic speed regime, additional fine regulation of the Mach number is performed by an active blow-off system. Transonic configuration enables testing in the Mach number range 0.7 to 1.4.
Stagnation pressure in the test section of the wind tunnel in the transonic configuration can be between 1.5 and 6.6 bar and regulated to within 0.1% of the nominal value. Reynolds numbers can be up to 100 × 106 per meter. Run time depends on test conditions, and can be up to approximately 60 s. The primary model support system is a tail sting on a pitch-and-roll mechanism, with 40° pitch travel range and 360° roll travel range. Computations of model position include, in addition to mechanism angles, also the balance and sting deformations under load, determined before the wind tunnel tests by calibrating the deformations versus loads sensed by the balances.

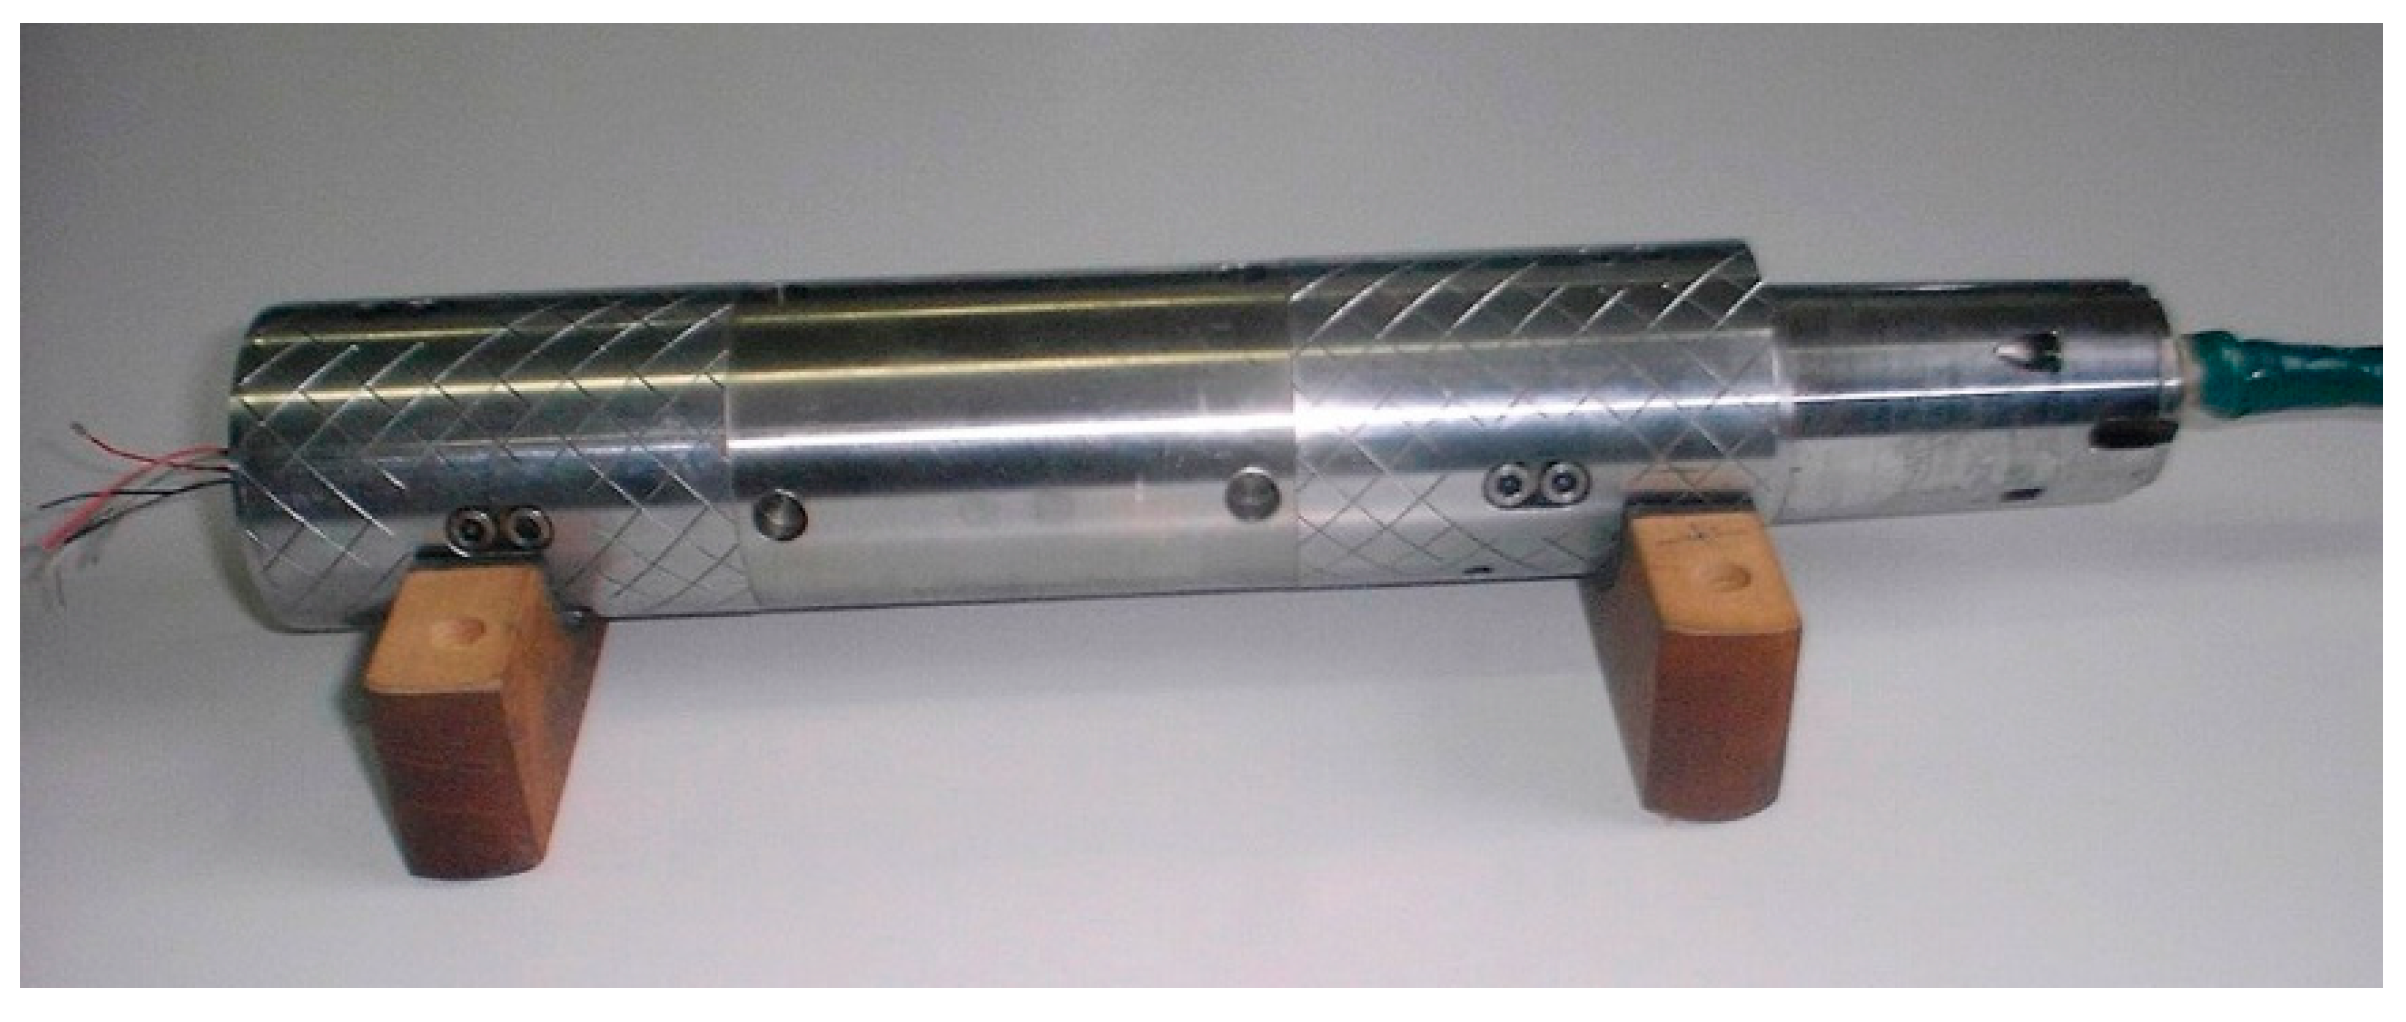
2.3. Wind Tunnel Balances

In the tests of the two HB-2 models, the aerodynamic forces and moments were measured by the Mk18 50.8 mm dia. six-component internal strain gauge balance produced by Able Corporation (Figure 6) and a VTI-produced KV44 six-component internal strain gauge balance with 44 mm diameter (Figure 7).
Able Mk18 is an assembled balance (i.e., consisting of several assembled pieces), of the type known as the force balance. For the tests of the HB models, it was calibrated to 1800 N nominal load range of the axial-force component and 8800 N nominal load range for the normal- and side-force components. The accuracy of this balance is between 0.1% F.S. and 0.2% F.S. (based on 95% measurement certainty), mostly because of the hysteresis inherent to the design type.
The VTI KV44 balance is an experimental, simple-to-produce, monolithic high-rigidity design with signals from the very stiff compressive axial-load element boosted by an on-board amplifier. It was produced for high-drag supersonic wind tunnel tests. The calibrated load range is 2200 N for the axial-force component and 4500 N for the normal force component (actual load range of the axial-force component is of the order of 4 kN). The balance was calibrated to an accuracy better than 0.2% FS (based on 95% measurement certainty) for all components except the axial force, where a somewhat lower accuracy of about 0.38% FS was achieved.
Base pressure on the models was measured at the entrance of the cavity for the sting at the rear of the model. Pneumatic leads were passed through the support sting from the measurement point to two silicon piezoresistive pressure transducers with measurement uncertainty better than 0.05%FS, located in the model support system, aft of the sting.

2.4. Measurement Uncertainty

Uncertainty of a measurement in a wind tunnel test is roughly proportional to a multiple of random error that is estimated by the standard deviation σ. This metric is often used to express the degree of the accuracy of measurements. From the known measurement uncertainties of individual sensors (obtained during calibration) in the tests, it was possible to estimate the standard deviations for various quantities, which were computed from several independently measured quantities. Table 1, Table 2 and Table 3 list the measurement uncertainties based on double standard deviations, corresponding to the 95% confidence level, of the HB-2 test conditions and aerodynamic coefficients. The uncertainties are given both for the smaller (Table 1 and Table 2) and larger HB-2 models (Table 1 and Table 3) using both wind tunnel balances, and for three Mach numbers: 0.9, 1.4, and (higher supersonic, for comparison) 2.0.

3. Results and Discussion

The Experimental Aerodynamics Laboratory of VTI periodically tests standard models in its wind tunnels [16]. A database of test results contains available results from other facilities and results of earlier tests of those standard models in the VTI T-38 wind tunnel. This database was used to estimate the validity of new data, having in mind that (a) the database hitherto contained results only for Mach numbers 1.5 and higher, and (b) tests in the VTI T-38 wind tunnel were performed at Reynolds numbers significantly higher than in other facilities.
Inter-facility correlation was performed on the basis of the dataset from the reports [12,17] on tests of the HB-2 model in the supersonic wind tunnels A and D in the Von Karman facility of the Arnold Engineering and Development Center (AEDC), data from the tests in ONERA Chalais S5 and Vernon C4 Facilities [18], and data from a Mach 2 free-flight test in the Pressurized Ballistic Range of the NASA Ames Research Center [19].
It can be remarked that the correspondence of the test results for the HB-2 model in various wind tunnels is not nearly as good as for some other standard models, e.g., AGARD-B [20]. The reasons for relatively large inter-facility discrepancies remain unclear because, aside from the non-dimensional aerodynamic coefficients, various authors typically presented few data about the circumstances of their tests and the data reduction procedures used. Extreme examples of this are the AEDC tests [12,17], which gave weird results for the base drag, significantly different from all other sources (and, therefore, not shown in this paper); this item was noted as unresolved in [19]. A reason for discrepancies among sources could be in different Reynolds numbers in various facilities and the sensitivity of the HB-2 model to this variable. Reference tests were performed at Reynolds numbers in the interval 0.34 million to 13.2 million, based on model length, which placed at least some of them in the region where the location of the transition was likely to change from the model to the wake [21,22], with a corresponding variation in base pressure and, therefore, base drag. It can also be noted that almost all reference tests were performed with natural boundary layer transitions, except for tests [18] that were performed both with natural and with forced transitions (effected by carborundum strips on the conical nose). Data from runs [18] with natural transitions were taken for comparison.
Another reason for poor agreement of reference results could have been in the load ranges of the force balances used, which, because of the supersonic starting/stopping loads, possibly had to be significantly higher than would have been required for measurement of the axial forces during the wind tunnel runs, which might have degraded accuracy. Insufficient data are available on this issue.
Intra-facility correlation was performed on the basis of previous supersonic tests of the same two models in the VTI T-38 wind tunnel, on several sting configurations, and on several force balances.
The lack of previous data from tests under transonic conditions was overcome by partially overlapping the envelope of the new tests with the envelopes of the previous supersonic tests and by assuming that, if the new data showed agreement with reference results in the limited overlapped range, they were also good in the new transonic range.
As shown in Table 2 and Table 3 above, measurement uncertainties for the axial-force component using Able and VTI balances significantly differed. Generally, the measurement uncertainty of the VTI KV44 balance is two times better than that of the Able Mk18 balance for the normal force and pitching moment, but approximately four times worse in the axial-force measurement. This became evident in testing of the smaller model, where the aerodynamic loads were small relative to the balance load range, as the comparisons with data obtained in tests using another balance and/or larger model were not so good. Scatter of the newly obtained VTI T-38 data in the tests of the 100 mm dia. model and using the Able Mk18 balance was of the same order of magnitude as the differences among reference data from other sources.
Correlated data of the zero-lift total axial-force coefficient of the HB-2 model vs. Mach number are given in Figure 8, and the zero-lift base pressure coefficient is shown vs. Mach number in Figure 9. Correlated data of the zero-lift forebody axial-force coefficient of the HB-2 model vs. Mach number are given in Figure 10. Comparisons of the normal-force-coefficient gradient CNalpha are shown in Figure 11.
Supersonic tests of HB-2 models in the VTI Experimental Aerodynamics Laboratory were performed at relatively high Reynolds numbers of 2.2 million to 4.5 million for the 75 mm model, based on model forebody diameter (10.8 million to 22 million based on model length), and Reynolds numbers of 3 million to 6.2 million for the 100 mm model, based on forebody diameter (14.7 to 30.4 million based on model length), all with natural boundary layer transition. Transonic tests were performed at Reynolds number 2.2 million to 2.6 million for the 75 mm model (10.8 million to 12.7 million based on model length) and 3.0 million to 5.4 million (14.7 million to 26.5 million based on model length) for the 100 mm model. Data from force-measurement tests [12,17,18,19] were used as references for comparison, in spite of lower Reynolds numbers of 0.07 million to 2.7 million based on model forebody diameter (0.34 million to 13.2 million based on model length; some of the references based Reynolds number on model length, while others based it on forebody diameter). Suitable reference data at higher Reynolds numbers could not be found.
The base pressure coefficient Cpb = (Pb − Pst)/q, where Pst is the free-stream static pressure, was computed by assuming a constant base pressure Pb over the entire base of the model(s). Base pressure was measured at one point only, in the model cavity accessed by the annular opening on the base of the model around the support sting. The measured pressure was assumed to be close to average base pressure in the presence of a sting (correct integration of an average base pressure on a model with a large base, as on the HB-2 configuration, can be a matter of debate).
The forebody axial-force coefficient CAf was calculated by subtracting the base axial-force coefficient CAb = −Cpb × Sb/Sref, obtained from base pressure measurement, from the total axial-force coefficient CA obtained from the force measurements, where Sref = πD2/4 and Sb = π(1.6 D)2/4.
Figure 8 shows that the total axial force coefficient decreases with the increase in Mach number, mostly because of the decrease in the base pressure coefficient, while Figure 10 shows that the change in the forebody axial force coefficient is much smaller. As expected, the contribution of the base drag to total drag diminished with increasing Mach number.
A small, but observable, difference in the character of the total axial force coefficients CA obtained for two sizes of the HB-2 models at Mach number 1.5 was noted in the earlier supersonic tests [23] in the VTI T-38 wind tunnel. These differences were barely observable at Mach number 2 and undetectable at higher Mach numbers. New tests in the transonic Mach number range confirmed that the effect is related to the change in the base pressure coefficient related to the model sting/base diameter ratio. While the forebody axial force coefficients of two models (i.e., with two sting/base diameter ratios) agree well at all transonic and supersonic Mach numbers (Figure 10), that was not the case with the base pressure coefficient (Figure 9) and, therefore, the total axial force coefficient, which had quite different characteristics for the two models at Mach numbers below 1.5. There, base drag was, somewhat counter-intuitively, smaller for the model with the smaller sting/base diameter ratio, with the largest difference around Mach 1.1. This finding is confirmed by results from [24], where a similar increase in base drag with sting diameter was observed. Furthermore, reference [24] suggests that the sting of the 100 mm model, although its length was more than three forebody diameters, as specified by the model definition (Figure 2), was, with the relative length of 2.2 base diameters, aerodynamically a bit too short for tests around Mach 1.0–1.2 and should have had a length of more than 3 base diameters. Therefore, the sting length may have further contributed to the reduction in the base drag. The relative length of the sting for the 75 mm model was 4.3 base diameters and was sufficiently long to avoid influence of the sting fairing on base pressure at any Mach number.
The influence of the Reynolds-number-related location of the transition point seems unlikely. Transonic test Reynolds numbers, based on model length, for the two models were 10.8 million and 14.7 million, respectively, both sufficiently higher than the Reynolds number around 1 million, where the transition moves from model to wake. Relatively high 0.9% freestream turbulence in the T-38 wind tunnel has an effect similar to further increasing the Reynolds number [25,26,27]. Therefore, the boundary layer approaching the model base was expected to have been turbulent. On the other hand, reference [17] notes the existence of boundary layer separation ahead of the flare at supersonic Mach numbers 2 and higher and at Reynolds numbers, based on model length, below 5 million (i.e., much lower than in the T-38 tests). The extent of the separation diminished and even disappeared with the increase in Reynolds number. The existence of boundary layer separation ahead of the flare was also observed by schlieren visualization in earlier supersonic tests [23] of HB-2 models at high angles of attack in the T-38 wind tunnel. The extent and location of the separation varied significantly with angle of attack and Mach number. Unfortunately, as flow visualizations could not be performed in the transonic test section of the T-38 wind tunnel because of the absence of windows, there was no practical way to gather data regarding possible flow separation in front of the conical flare in the transonic range.
The observed effects of sting diameter and length will have repercussions on the planning of future use of these models as quick-check standards in scenarios where a tested model may be swapped with a standard model to troubleshoot some issue. Above Mach 1.5, relative sting diameter does not have much significance, and a test of an HB-2 model can be performed on any sting of approximately the right diameter. However, below Mach 1.5, the proposed ‘local standard’ sting/base diameter ratio of 0.5 should be strictly adhered to, if repeatable and meaningful results are to be obtained.
Comparative graphs of normal-force-coefficient gradient CNalpha in Figure 11 show good repeatability of VTI results and agreement of the results obtained in the transonic and supersonic test sections of the T-38, with both balances. Deviations of VTI data relative to reference results from other laboratories appear no worse than the scatter among the various reference data themselves, though, generally, VTI CNalpha appears to be slightly smaller than some of the references. One should bear in mind, though, that the reference values of normal-force-coefficient gradient CNalpha were each obtained by differencing two values digitized from the published graphs [12,17,18,19], which could introduce noticeable uncertainties into the obtained values.
Transonic test results for the 75 mm model are also presented in Table 4 below, and for the 100 mm model in Table 5. It can be observed that the force data agree to within the combined measurement uncertainties of the two balances used. Convergence of the base pressure coefficient is not as good as the calibration-derived estimate of measurement uncertainty. This is attributed to small variations of the pressures during wind tunnel runs that, because of the very different lengths of pneumatic leads, were out of phase on the measuring and reference sides of the base pressure transducer.

4. Conclusions

A constant effort by the VTI Experimental Aerodynamic Laboratory during the past period resulted in building a database of the HB model test data in the Mach number range from 1.5 to 4 at high Reynolds numbers. Recently the database has been extended for the test envelope of the HB-2 model to higher angles of attack (up to 30°), and now, for the test data obtained in the full transonic range (from Mach 0.7 to 1.4). VTI found such data to be useful in preparations for wind tunnel tests, because of increasingly frequent requests for test campaigns that can be characterized as ‘non-standard’.
Obtained transonic data for the HB-2 standard model(s) appear to be reasonable extensions of the supersonic data and can be a useful reference for other aerodynamic laboratories. The results should also be of interest to researchers who consider them as experimental or computational test cases.
The preparation and execution of earlier high-dynamic-pressure wind tunnel tests, and post-test correlation with results from other laboratories, showed some issues related to the physical safety of the HB-2 configuration on the slender ‘standard’ support sting. The local standardization of sting diameter to 0.5, relative to the model forebody diameter, was, therefore, proposed for tests of the HB models in the VTI T-38 wind tunnel, but not completely implemented, with relative diameters in the latest tests being 0.48 and 0.64. New transonic test results and comparison with supersonic results showed that, while the influence of the sting/base diameter ratio on the measured characteristics of the HB-2 configuration is practically negligible at Mach numbers above 1.5, that is not the case in the transonic Mach range. In future tests of these models, the ‘local standard’ should be strictly respected for any tests at Mach numbers below 1.5, if meaningful and repeatable results are to be obtained.
On the other hand, as the transonic axial-force coefficient of the model with lower sting/base diameter ratio is, somewhat counter-intuitively, lower than the axial-force coefficient of the model with the higher sting/base diameter ratio, a short future test of the 100 mm dia. model with a larger sting diameter of 64 mm in the transonic range may help to confirm the effect and eliminate the possibility of unforeseen interferences of the test section walls and reflected shock waves, which the perforated walls are supposed to cancel.

Author Contributions

Conceptualization, D.D. and Đ.V.; Methodology, D.D. and Đ.V.; Software, Đ.V.; Validation, D.D. and Đ.V.; Formal Analysis, D.D. and Đ.V.; Investigation, D.D. and Đ.V.; Resources, G.O.; Data Curation, D.D. and Đ.V.; Writing—Original Draft Preparation, D.D. and Đ.V.; Writing—Review and Editing, D.D. and Đ.V.; Visualization, D.D.; Supervision, B.R.; Project Administration, G.O.; Funding Acquisition, G.O. and B.R. All authors have read and agreed to the published version of the manuscript.

Funding

This research was funded by the Military Technical Institute (VTI) Belgrade and the Ministry of Science, Technological Development and Innovation of Republic of Serbia (Project number 451-03-66/2024-03/200325).

Data Availability Statement

Data are contained within the article.

Acknowledgments

This study was supported by the Military Technical Institute (VTI) Belgrade.

Conflicts of Interest

The authors declare no conflicts of interest.

List of Symbols

DDiameter of the model cylindrical forebody, m
MMach number
qDynamic pressure, bar, Pa
ReReynolds number, 1/m
AlphaTotal aerodynamic angle, °
PhiAerodynamic roll angle, °
σStandard deviation of the measured value
CNalphaNormal-force-coefficient gradient, 1/rad
CATotal-axial-force coefficient
CAfForebody-axial-force coefficient
CAbBase-axial-force coefficient
CpbBase pressure coefficient
SrefModel reference area, m2
SbModel base area, m2
PstFree-stream static pressure, bar, Pa
PbBase pressure, bar, Pa

References

  1. Owen, F.K.; Owen, A.K. Measurement and Assessment of Wind Tunnel Flow Quality. Prog. Aerosp. Sci. 2008, 44, 315–348. [Google Scholar] [CrossRef]
  2. Philpott, D.R. Pressure Measurement in a Blowdown Wind Tunnel. Measurement 1985, 3, 107–114. [Google Scholar] [CrossRef]
  3. Reis, M.L.C.C.; Falcão Filho, J.B.P.; Moraes, L.F.G. The TTP Transonic Wind Tunnel Mach Number Uniformity Analysis. Measurement 2014, 51, 356–366. [Google Scholar] [CrossRef]
  4. Bobbit, C.; Everhart, J.; Foster, J.; Hill, J.; McHatton, R.; Tomek, W. National Transonic Facility Characterization Status. In Proceedings of the 38th AIAA Aerospace Sciences Meeting and Exhibit, Reno, NV, USA, 10–13 January 2000. [Google Scholar]
  5. Muylaert, J.; Walpot, L.; Haeuser, J.; Sagnier, P.; Devezeaux, D.; Papirnyk, O.; Lourme, D. Standard Model Testing in the European High Enthalpy Facility F4 and Extrapolation to Flight. In Proceedings of the 28th AIAA Joint Propulsion Conference and Exhibit, Nashville, TN, USA, 6–8 July 1992. [Google Scholar] [CrossRef]
  6. Hemsch, M.; Grubb, J.; Krieger, W.; Cler, D. Langley Wind Tunnel Data Quality Assurance: Check Standard Results. In Proceedings of the 21st AIAA Advanced Measurement Technology and Ground Testing Conference, Denver, CO, USA, 19–22 June 2000. [Google Scholar]
  7. DeLoach, R. Check-Standard Testing Across Multiple Transonic Wind Tunnels with the Modern Design of Experiments. In Proceedings of the 28th Aerodynamic Measurement Technology, Ground Testing, and Flight Testing Conference, New Orleans, LA, USA, 25–28 June 2012. [Google Scholar] [CrossRef]
  8. Ulbrich, N.M.; Amaya, M.A.; Flach, R. Use of the Ames Check Standard Model for the Validation of Wall Interference Corrections. In Proceedings of the 2018 AIAA Aerospace Sciences Meeting, Kissimmee, FL, USA, 8–12 January 2018. [Google Scholar] [CrossRef]
  9. Vassberg, J.; Dehaan, M.; Rivers, M.; Wahls, R. Development of a Common Research Model for Applied CFD Validation Studies. In Proceedings of the 26th AIAA Applied Aerodynamics Conference, Honolulu, HI, USA, 18–21 August 2008. [Google Scholar] [CrossRef]
  10. Damljanović, D.; Vuković, Đ.; Ocokoljić, G.; Ilić, B.; Rašuo, B. Wind tunnel testing of standard models at off-design conditions. Aerospace 2021, 8, 275. [Google Scholar] [CrossRef]
  11. Damljanović, D.; Vuković, Đ.; Ilić, B.; Ocokoljić, G. Wind Tunnel Testing of HB-2 Hypersonic Standard Models in Non-Standard Transonic Conditions. In Proceedings of the 57th 3AF International Conference on Applied Aerodynamics, Bordeaux, France, 29–31 March 2023. [Google Scholar]
  12. Gray, J.D. Summary Report on Aerodynamic Characteristics of Standard Models HB-1 and HB-2; AEDC-TDR-64-137; Arnold Engineering Development Center: Tullahoma, TN, USA, 1964. [Google Scholar]
  13. Damljanović, D.; Rašuo, B.; Vuković, Ð.; Mandić, S.; Isaković, J. Hypervelocity ballistic reference models as experimental supersonic test cases. Aerosp. Sci. Technol. 2016, 52, 189–197. [Google Scholar] [CrossRef]
  14. Elfstrom, G.M.; Medved, B. The Yugoslav 1.5 m Trisonic Blowdown Wind Tunnel. In Proceedings of the 14th AIAA Aerodynamic Testing Conference, a Collection of Technical Papers, West Palm Beach, FL, USA, 5–7 March 1986. [Google Scholar]
  15. Elfstrom, G.M.; Medved, B.; Rainbird, W.J. Optimum porosity for an inclined-hole transonic test section wall treated for edgetone noise reduction. In Proceedings of the 15th Aerodynamic Testing Conference, San Diego, CA, USA, 18–20 May 1988. [Google Scholar]
  16. Damljanović, D.; Isaković, J.; Rašuo, B. T-38 Wind Tunnel Data Quality Assurance Based on Testing of a Standard Model. J. Aircr. 2013, 50, 1141–1149. [Google Scholar] [CrossRef]
  17. Gray, J.D.; Lindsay, E.E. Force Tests of Standard Hypervelocity Ballistic Models HB-1 and HB-2 at Mach 1.5 to 10; AEDC-TDR-63-137; Arnold Engineering Development Center: Tullahoma, TN, USA, 1963. [Google Scholar]
  18. Céresuéla, R. Mesurés d‘Efforts et de Pressions sur la Maquette Balistique Étalon H.B.2 (2 ≤ Mach ≤ 16.5); Note technique 13/1879 A; ONERA: Palaiseau, France, 1964. [Google Scholar]
  19. Malcolm, G.N.; Chapman, G.T. A Computer Program for Systematically Analyzing Free-Flight Data to Determine the Aerodynamics of Axisymmetric Bodies; NASA TN D-4766; NASA, Ames Research Center: Mountain View, CA, USA, 1968.
  20. Vuković, D.; Damljanović, D.; Ocokoljić, G.; Rašuo, B. Convergence of Transonic Wind Tunnel Test Results of the AGARD-B Standard Model. FME Trans. 2020, 48, 761–769. [Google Scholar]
  21. Kurn, A.G. Drag Measurements on a Series of Afterbodies at Transonic Speeds Showing the Effects of Sting Interference; C.P. No. 984; Aeronautical Research Council: Bedford, UK, 1968. [Google Scholar]
  22. Uselton, B.L.; Cyran, F.B. Critical Sting Length as Determined by the measurement of Pitch Damping Derivatives for Laminar, Transitional, and Tubulent Boundary Layers at Mach Number 3 for Reduced Frequencies 0.033 and 0.0056; AEDC-TR-77-66; Arnold Engineering Development Center: Tullahoma, TN, USA, 1977. [Google Scholar]
  23. Vuković, Ð.; Damljanović, D. HB-2 high-velocity correlation model at high angles of attack in supersonic wind tunnel tests. Chin. J. Aeronaut. 2019, 32, 1565–1576. [Google Scholar] [CrossRef]
  24. Lee, G.; Summers, J.L. Effects of Sting-Support Interference on the Drag of an Ogive-Cylinder Body with and Without a Boattail at 0.6 to 1.4 Mach Number; NACA RM A57109; Ames Aeronautical Laboratory: Moffet Field, CA, USA, 1957.
  25. Elsenaar, A.; Binion, T.W., Jr.; Stanewsky, E.; Hornung, H.G. (Eds.) Reynolds Number Effects in Transonic Flow; AGARDograph No.303; North Atlantic Treaty Organization: Washington, DC, USA, 1988. [Google Scholar]
  26. Mishra, R.; Neunaber, I.; Guilmineau, E.; Braud, C. Wind tunnel study: Is turbulent intensity a good candidate to help in bypassing low Reynolds number effects on 2d blade sections? J. Phys. 2022, 2265, 0220905. [Google Scholar] [CrossRef]
  27. Yao, J.; Lou, W.; Shen, G.; Guo, J.; Xing, Y. Influence of Inflow Turbulence on the Flow Characteristics around a Circular Cylinder. Appl. Sci. 2019, 9, 3595. [Google Scholar] [CrossRef]
Figure 1. (a) A 75 mm dia. HB-2 model and (b) 100 mm dia. HB-2 model, both produced for tests in the VTI T-38 wind tunnel.
Aerospace 12 00131 g001
Figure 2. Theoretical geometry of the HB-2 standard wind tunnel model with ‘standard’ sting geometry [12].
Aerospace 12 00131 g002
Figure 3. The 75 mm dia. HB-2 model on the model support in the VTI T-38 wind tunnel.
Aerospace 12 00131 g003
Figure 4. The 100 mm dia. HB-2 model on the model support in the VTI T-38 wind tunnel.
Aerospace 12 00131 g004
Figure 5. VTI T-38 trisonic blowdown wind tunnel. The test section with ventilated walls and active blow-off system (yellow-colored module) is inserted in the configuration for transonic tests.
Aerospace 12 00131 g005
Figure 6. Mk18 50.8 mm six-component internal strain gauge balance by Able Corporation.
Aerospace 12 00131 g006
Figure 7. KV44 44 mm six-component internal strain gauge balance produced in VTI.
Aerospace 12 00131 g007
Figure 8. Zero-lift total axial-force coefficient of the HB-2 models vs. Mach number from different experimental sources. The VTI test envelope has been extended to transonic speed range.
Aerospace 12 00131 g008
Figure 9. Zero-lift base-pressure coefficient of the HB-2 models vs. Mach number from different experimental sources. The VTI test envelope has been extended to transonic speed range.
Aerospace 12 00131 g009
Figure 10. Zero-lift forebody axial-force coefficient of the HB-2 model vs. Mach number from different experimental sources. The VTI test envelope has been extended to transonic speed range.
Aerospace 12 00131 g010
Figure 11. Gradient of the normal-force coefficient of the HB-2 models vs. Mach number from different experimental sources. The VTI test envelope has been extended to transonic speed range; VTI supersonic test data have been updated.
Aerospace 12 00131 g011
Table 1. Estimated measurement uncertainties for the HB-2 model wind tunnel test conditions.
Measurement Uncertainties; Test Conditions
HB-2 Model Dia.Conditions2σ M2σ Po
Bar
2σ q
Bar
2σ Re2σ Alpha
°
2σ Phi
°
75 mmMach 0.9±0.00072±0.0017±0.0012±3700±0.043±0.25
Mach 1.4±0.00063±0.00076±3300
Mach 2.0±0.0012±0.00031±2900
100 mmMach 0.9±0.00072±0.0017±0.0012±5000±0.043±0.25
Mach 1.4±0.00063±0.00076±4500
Mach 2.0±0.0012±0.00031±3900
Table 2. Estimated measurement uncertainties of aerodynamic coefficients, 75 mm dia. HB-2.
Measurement Uncertainties; 75 mm Diameter HB-2 Standard Model
BalanceConditions2σ CA2σ Cpb2σ CN2σ Cm
Able Mk18Mach 0.9±0.0077±0.00048±0.046±0.060
Mach 1.4±0.0059±0.00027±0.035±0.047
Mach 2.0±0.0064±0.00087±0.039±0.041
VTI KV44Mach 0.9±0.035±0.00048±0.014±0.024
Mach 1.4±0.027±0.00027±0.011±0.019
Mach 2.0±0.030±0.00087±0.012±0.021
Table 3. Estimated measurement uncertainties of aerodynamic coefficients, 100 mm dia. HB-2.
Measurement Uncertainties; 100 mm Diameter HB-2 Standard Model
BalanceConditions2σ CA2σ Cpb2σ CN2σ Cm
Able Mk18Mach 0.9±0.0045±0.00048±0.026±0.026
Mach 1.4±0.0035±0.00027±0.020±0.020
Mach 2.0±0.0036±0.00087±0.022±0.017
VTI KV44Mach 0.9±0.02±0.00048±0.0079±0.010
Mach 1.4±0.015±0.00027±0.0061±0.008
Mach 2.0±0.017±0.00087±0.0067±0.0089
Table 4. Test results for the 75 mm dia. HB-2 model at zero angle of attack in the transonic range.
Transonic Test Results; 75 mm Diameter HB-2 Standard Model
BalanceMCA0CAf0Cpb0CNalpha
Able Mk180.700.7590.143−0.2414.74
0.790.8100.199−0.2394.96
0.900.9860.325−0.2585.53
1.001.5410.647−0.3494.78
1.101.8330.833−0.3914.79
1.191.7160.820−0.3504.76
1.281.6500.843−0.3164.69
1.391.5750.850−0.2834.66
VTI KV440.690.7240.099−0.2444.70
0.780.8160.212−0.2364.82
0.881.0040.361−0.2515.49
1.001.5100.631−0.3434.68
1.101.8410.812−0.4024.66
1.21.7070.785−0.3604.74
1.281.6610.823−0.3274.55
1.391.5790.821−0.2964.57
Table 5. Test results for the 100 mm dia. HB-2 model at zero angle of attack in the transonic range.
Transonic Test Results; 100 mm Diameter HB-2 Standard Model
BalanceMCA0CAf0Cpb0CNalpha
Able Mk180.690.7050.161−0.212 4.67
0.790.7260.230−0.1945.17
0.880.8810.326−0.2165.46
1.001.270.651−0.2424.76
1.101.4770.793−0.2674.79
1.191.5860.835−0.2934.76
1.291.5850.870−0.2794.69
1.381.5460.825−0.2764.66
VTI KV440.690.7110.160−0.2154.78
0.790.7370.216−0.2034.96
0.880.8850.352−0.2085.37
1.001.2530.647−0.2364.74
1.101.4520.769−0.2674.88
1.191.5870.815−0.3014.65
1.281.5860.828−0.2964.60
1.391.5530.840−0.2794.60
Disclaimer/Publisher’s Note: The statements, opinions and data contained in all publications are solely those of the individual author(s) and contributor(s) and not of MDPI and/or the editor(s). MDPI and/or the editor(s) disclaim responsibility for any injury to people or property resulting from any ideas, methods, instructions or products referred to in the content.

