Article

Simulation of Shock-to-Detonation Transition by OpenFOAM

1
CFD Team, Mineral Resource, CSIRO, Clayton South, VIC 3169, Australia
2
Explosion Research Institute Inc., Tokyo 101-0021, Japan
*
Author to whom correspondence should be addressed.
Aerospace 2025, 12(3), 214; https://doi.org/10.3390/aerospace12030214
Submission received: 27 December 2024 / Revised: 27 February 2025 / Accepted: 4 March 2025 / Published: 7 March 2025
(This article belongs to the Section Astronautics & Space Science)

Abstract

:
Shock-to-detonation transition (SDT) is the detonation of explosive charge triggered by the shock pressure from a nearby detonated explosive or an impact at high speed. A good prediction of SDT is a key in the design of explosives’ use, storage, and transportation. Typically, SDT simulation must use designated commercial software; therefore, a high license cost is necessary. This paper presents a simulation of SDT by a cost-effective hydrodynamic code developed on an open-source code framework, OpenFOAM. The code adopted the multi-material Eulerian method, Ignition and Growth reaction rate model, and Riemann solver to solve the shock-induced detonation phenomenon. The code was verified by a Pop plot calculation and a sympathetic detonation simulation. In the Pop plot calculation, the distance-of-run to the detonation of Composition B depending on the initial shock pressure was simulated. The reactant and product phases of Composition B were modeled by the Jone–Wilkins–Lee (JWL) equation of state (EOS). The aluminum plate used to create the initial shock pressure was modeled by shock Mie–Gruneisen (MG) EOS. The predicted distance-of-run against the initial shock pressure was in good agreement with an empirical correlation and experimental data. In the sympathetic detonation simulation, the charge explosive and nearby explosive were Composition B and were modeled by JWL EOS as in the Pop plot calculation and the plexiglass gap was modeled by MG EOS. The simulated critical gap for the sympathetic detonation was well predicted as in the other published data. This implies that the code is valid for SDT simulation. In addition, it is a cost-effective simulation, since the code was developed on open-source code, so massive computation can then be run without license costs.

1. Introduction

Shock-to-detonation transition (SDT) is the chain reaction caused by a detonated explosive or initial shock pressure to the surrounding explosives. The consequences of SDT have been catastrophic and, in most cases, have resulted in the loss of human lives and equipment. Therefore, a reduction in the hazards of munitions has been a topic of study of numerous organizations for decades [1].
SDT of high-energy explosives relates to a number of phenomena, including ignition by an external stimulus, detonation transition and propagation, the rapid expansion of detonation products, and the propagation of shock waves in various media. Therefore, the code for physical hazard analysis should be able to solve multi-material chemical reactions. This requires various models to be included in the code, such as the equations of state, the constitutive equations, and the burn models. There are a number of studies that have developed hydrodynamic codes for sympathetic detonation simulation. Most of the research has used the multi-material Eulerian method to represent all physic phenomena on a single mesh, since this method is simple to implement in code. Saburi et al. [2] developed a code based on the CIP method to cure the numerical diffusivity in the Eulerian method. However, the code uses the CIP method, so its conservation is in question. Alternatively, Kim et al. [3] used the hybrid Eulerian and Lagrangian method, where the Eulerian method uses the level set method and the Lagrangian method tracks the massless particle to correct the level set function. This treatment preserves the mass. However, it is a complicated implementation. To avoid the use of mesh, Yang et al. [4] used the smooth particle hydrodynamic SPH method. SPH is a pure Lagrangian tracking which can easily distinguish multi-material reactions. The drawback of the SPH method is the computation cost and that it is complicated to implement in code. In commercial codes, ANSYS LS-DYNA [5] and ANSYS Autodyn [6] are the major codes for such simulations and have been used in various research [7,8]. They are robust and available for massive computations but have expensive licensing costs.
To reduce the cost of massive computations of shock-to-detonation transition, we developed a hydrodynamic code based OpenFOAM [9]. OpenFOAM is a source code used to solve the partially differential equation based on the finite volume method. It is an open-source code and is written for unstructured mesh, so it is free for massive computations and is easy to implement new code in. However, OpenFOAM does not include the numerical schemes for shock discontinuity except the Kurganov–Tadmor scheme, which we found was not applicable for multi-material formulations. Furthermore, currently, OpenFOAM does not implement the constitutive relations for high-energy materials as equation of state or reaction models. Therefore, we are working to eliminate these drawbacks of OpenFOAM by developing libraries of the models for high-energy material explosion simulation.

2. Governing Equations

The developed code is based on the multi-material Eulerian method, where all materials’ motions are governed on a single set of equations based on mass, momentum, and energy conservation laws as follows:
ρ t + ρ U = 0
ρ U t + ρ UU + p = 0
ρ E t + ρ UE = 0
where ρ is the density, p is the pressure, U is the velocity, and E = e + 0.5U2, and e is the internal energy.
Each material is modeled by an equation of state as in the constitutive model. For the explosive, both reactants and products are represented by the Jones–Wilkins–Lee equation of state as follows [10]:
p = A 1 ω R 1 v e R 1 v + B 1 ω R 2 v e R 2 v + ω ρ 0 e + E 0 v
where v = ρ0/ρ. The coefficients A, B, R1, R2, ω, E0, and ρ0 are the JWL parameters.
The condensed phase is modeled as the Mie–Gruneisen equation of state as follows [11]:
p = p H + ρ 0 Γ v e e H
where pH and eH are the pressure and the internal energy along the Huguenot curve, Γ is the Gruneisen gamma, and v = ρ0/ρ. They are expressed as follows:
p H = ρ 0 c 0 μ 1 + μ 1 s 1 μ 2
e H = p H 2 ρ 0 μ 1 + μ
Γ = Γ 0 + a μ 1 + μ
where c0 is the sound speed at the reference condition, s and a are the parameters, and μ = 1/v − 1.
The rate of decomposition of the explosive is adopted from the Ignition and Growth model proposed by Lee–Tarver [12] as follows, where H(x) is the Heaviside function
d λ dt = I 1 λ b μ a x H λ λ Imax   + G 1 1 λ c λ d p y H λ λ G 1 max   + G 2 1 λ e λ g p z H λ G 2 min λ
Here, λ = 0 represents the reactant and λ = 0 represents the product. The first term of the right-hand side is the ignition of reaction, and the second and third terms are the growth of the reaction.
The governing Equations (1)–(3) and the reaction rate (9) with the constitutive Equations (4)–(8) are solved by the finite volume method based on the open-source code OpenFOAM. The method to compute the fluxes is either the Harten Lax van-Leer with Contact (HLLC) scheme [13] or the Advection Upstream Splitting Method (AUSM) scheme [14], which are integrated into OpenFOAM.

3. Results

3.1. Pop Plot Calculation

To confirm the reliability of the code, the simple Pop plot, a one-dimensional shock–detonation transition, was simulated. Typically, a bar of explosives is impacted by a high-speed metal plate at an end. The impact creates an initial shock pressure, and then detonation in the bar at a distance downstream depending on the strength of the shock pressure. In the current calculation, the bar length is 100 mm, where the first 20 mm from the left is modeled as an aluminum plate and the remaining portion is unreacted Composition B. The impact condition is modeled at a high particle velocity at the left end region of the aluminum plate, whose length is 0.05 mm. This particle velocity generates a shock pressure propagating though the aluminum plate and impacting Composition B. Depending on the shock pressure, the detonation occurs at a distance, or the shock attenuates.
The JWL parameters of both the reactant and product of Composition B used in this simulation are shown in Table 1. The reaction rate of Composition B was computed by the Ignition and Growth model, whose parameters are shown in Table 2. The aluminum is modeled as Mie–Gruneisen EOS, and the parameters are shown in Table 3. All these parameters are referred to in Urtiew’s work [15].
Figure 1 plots the pressure with time at several locations from the interface between the aluminum plate and Composition B. It shows that the initial shock pressure is 4.35 GPa (the first pressure rise at the location of 0 mm). The shock takes time to travel in the bar. This explains the pressure rise delays for distances further from the interface between the aluminum plate and the Composition B bar. In this case, the shock pressure increases as the shock propagates downstream. At a certain distance of between 13 mm and 14 mm, the peak of the pressure becomes flat at 35 GPa. This indicates that detonation occurs at this distance.
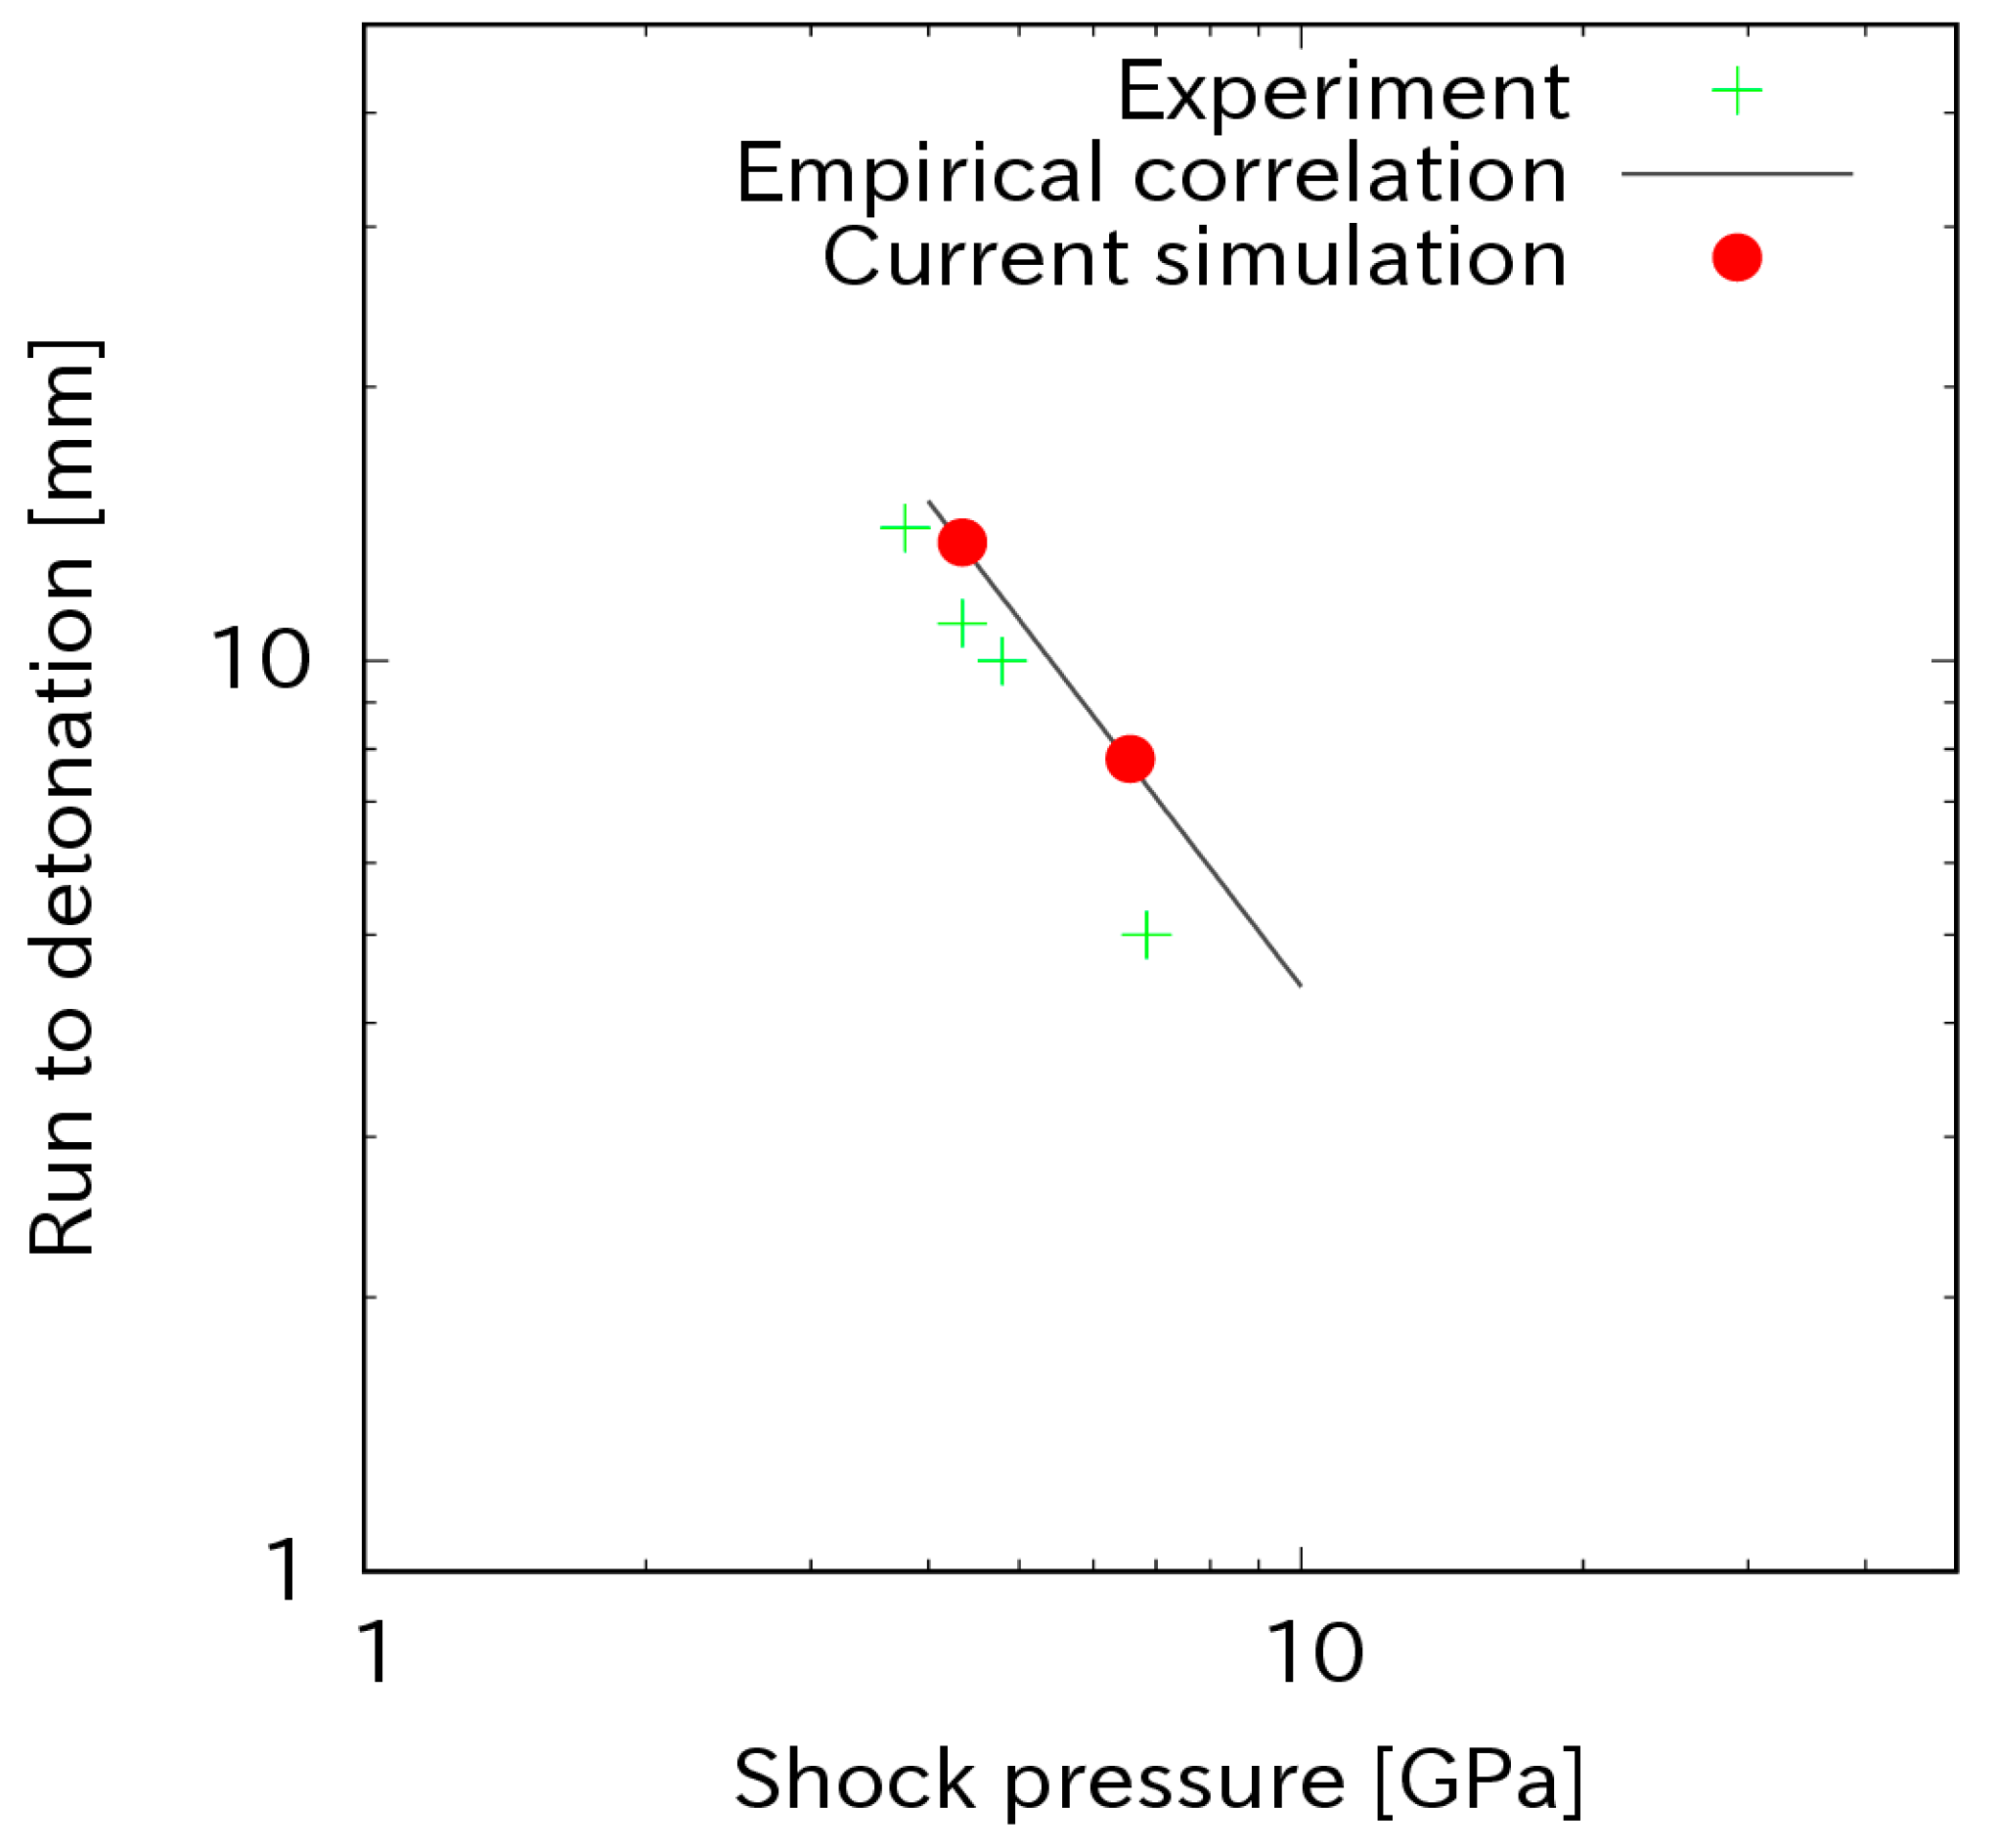
The shock sensitivity of Composition B for various initial shock pressures is plotted in Figure 2. It plots the dependence of the distance to detonation on the initial impact pressure. On a log–log plot, the run distance to detonation versus shock pressure data mostly fall on a straight line. The closer the line is to the origin of the plot, the more sensitive the material is. The current simulation data were compared with experiment data and empirical correlation. The experiment data were from Urtiew’s experiment [15]. In the experiment, a 100 mm-bore propellant-driven gas gun was used to provide a precise projectile velocity and then an initial shock pressure impacting on an explosive sample. The shock pressure in the explosive sample was measured by embedded manganin piezoresistive pressure gauge packages. The empirical correlation was published in the Explosive Property Data report by Gibbs [16]. The data for correlation performance are the most credible unpublished internal Los Alamos National Scientific Laboratory (LASL) data. The figure shows that the simulation data are in good agreement with these works.

3.2. Sympathetic Detonation Simulation

This section performs a simulation of sympathetic detonation, as schematically shown in Figure 3. Sympathetic detonation is a detonation of an explosive charge ignited by a nearby explosion. The nearby explosion generated by an explosive is called a “donor”. The shock of detonation in the donor travels through a gap, an inert material, and then impacts the explosive charge, which is called the acceptor. Depending on the length of the gap, detonation may occur in the acceptor. This is a key consideration in the safety design of explosive use, storage, transportation, and production.
In this simulation, the donor and acceptor are Composition B and the gap is pelixglass (PMMA), as in Kubota’s work [17]. The JWL parameters and the Ignition and Growth model parameters of Composition B are identical to the previous Pop plot calculation. The Mie–Gruneisen parameters of the PMMA are shown in Table 4 [18]. The detonator is the detonated product of Composition B.
The donor and acceptor have the same size, and the diameter D (charge diameter) is equal to the length L, which makes the aspect ratio of the donor and acceptor 1.
The simulation was carried out in an axis-symmetrical model. Therefore, the axis-symmetry module of the code was used. The computational domain had a length equal to the total length of the donor, acceptor, and the gap. The detonator had a depth of 2 mm. The mesh was uniform with a size of 1 mm. For the numerical stability, the MINMOD slope limiter was used in the computation of the fluxes. The time was advanced by the explicit Euler method, where the time step was controlled by the Courant–Friedrichs–Lewy CFL number as bellow; the subscript f represents the face value and δ is the cell-to-cell distance.
Δ t = CFL δ f max U + c f , U c f
The distribution of the density when the shock impacts the acceptor for a gap length of 15 mm and a charge diameter of 32 mm is depicted in Figure 4a. A curved, thin, high-density region (2300 kg/m3 in comparison with the original density of 1717 kg/m3) formed in the acceptor, as shown in the figure. This implies that a strong shock travelled to the acceptor because the shock compressed the acceptor. In Figure 4b, the distribution of the mass fraction of the detonated product of Composition B is displayed. The mass fraction of product λ = 1 indicates that Composition B was fully burnt to the gas product. As shown in the figure, the portion of the acceptor behind the shock was burnt. This indicates that the acceptor was detonated.
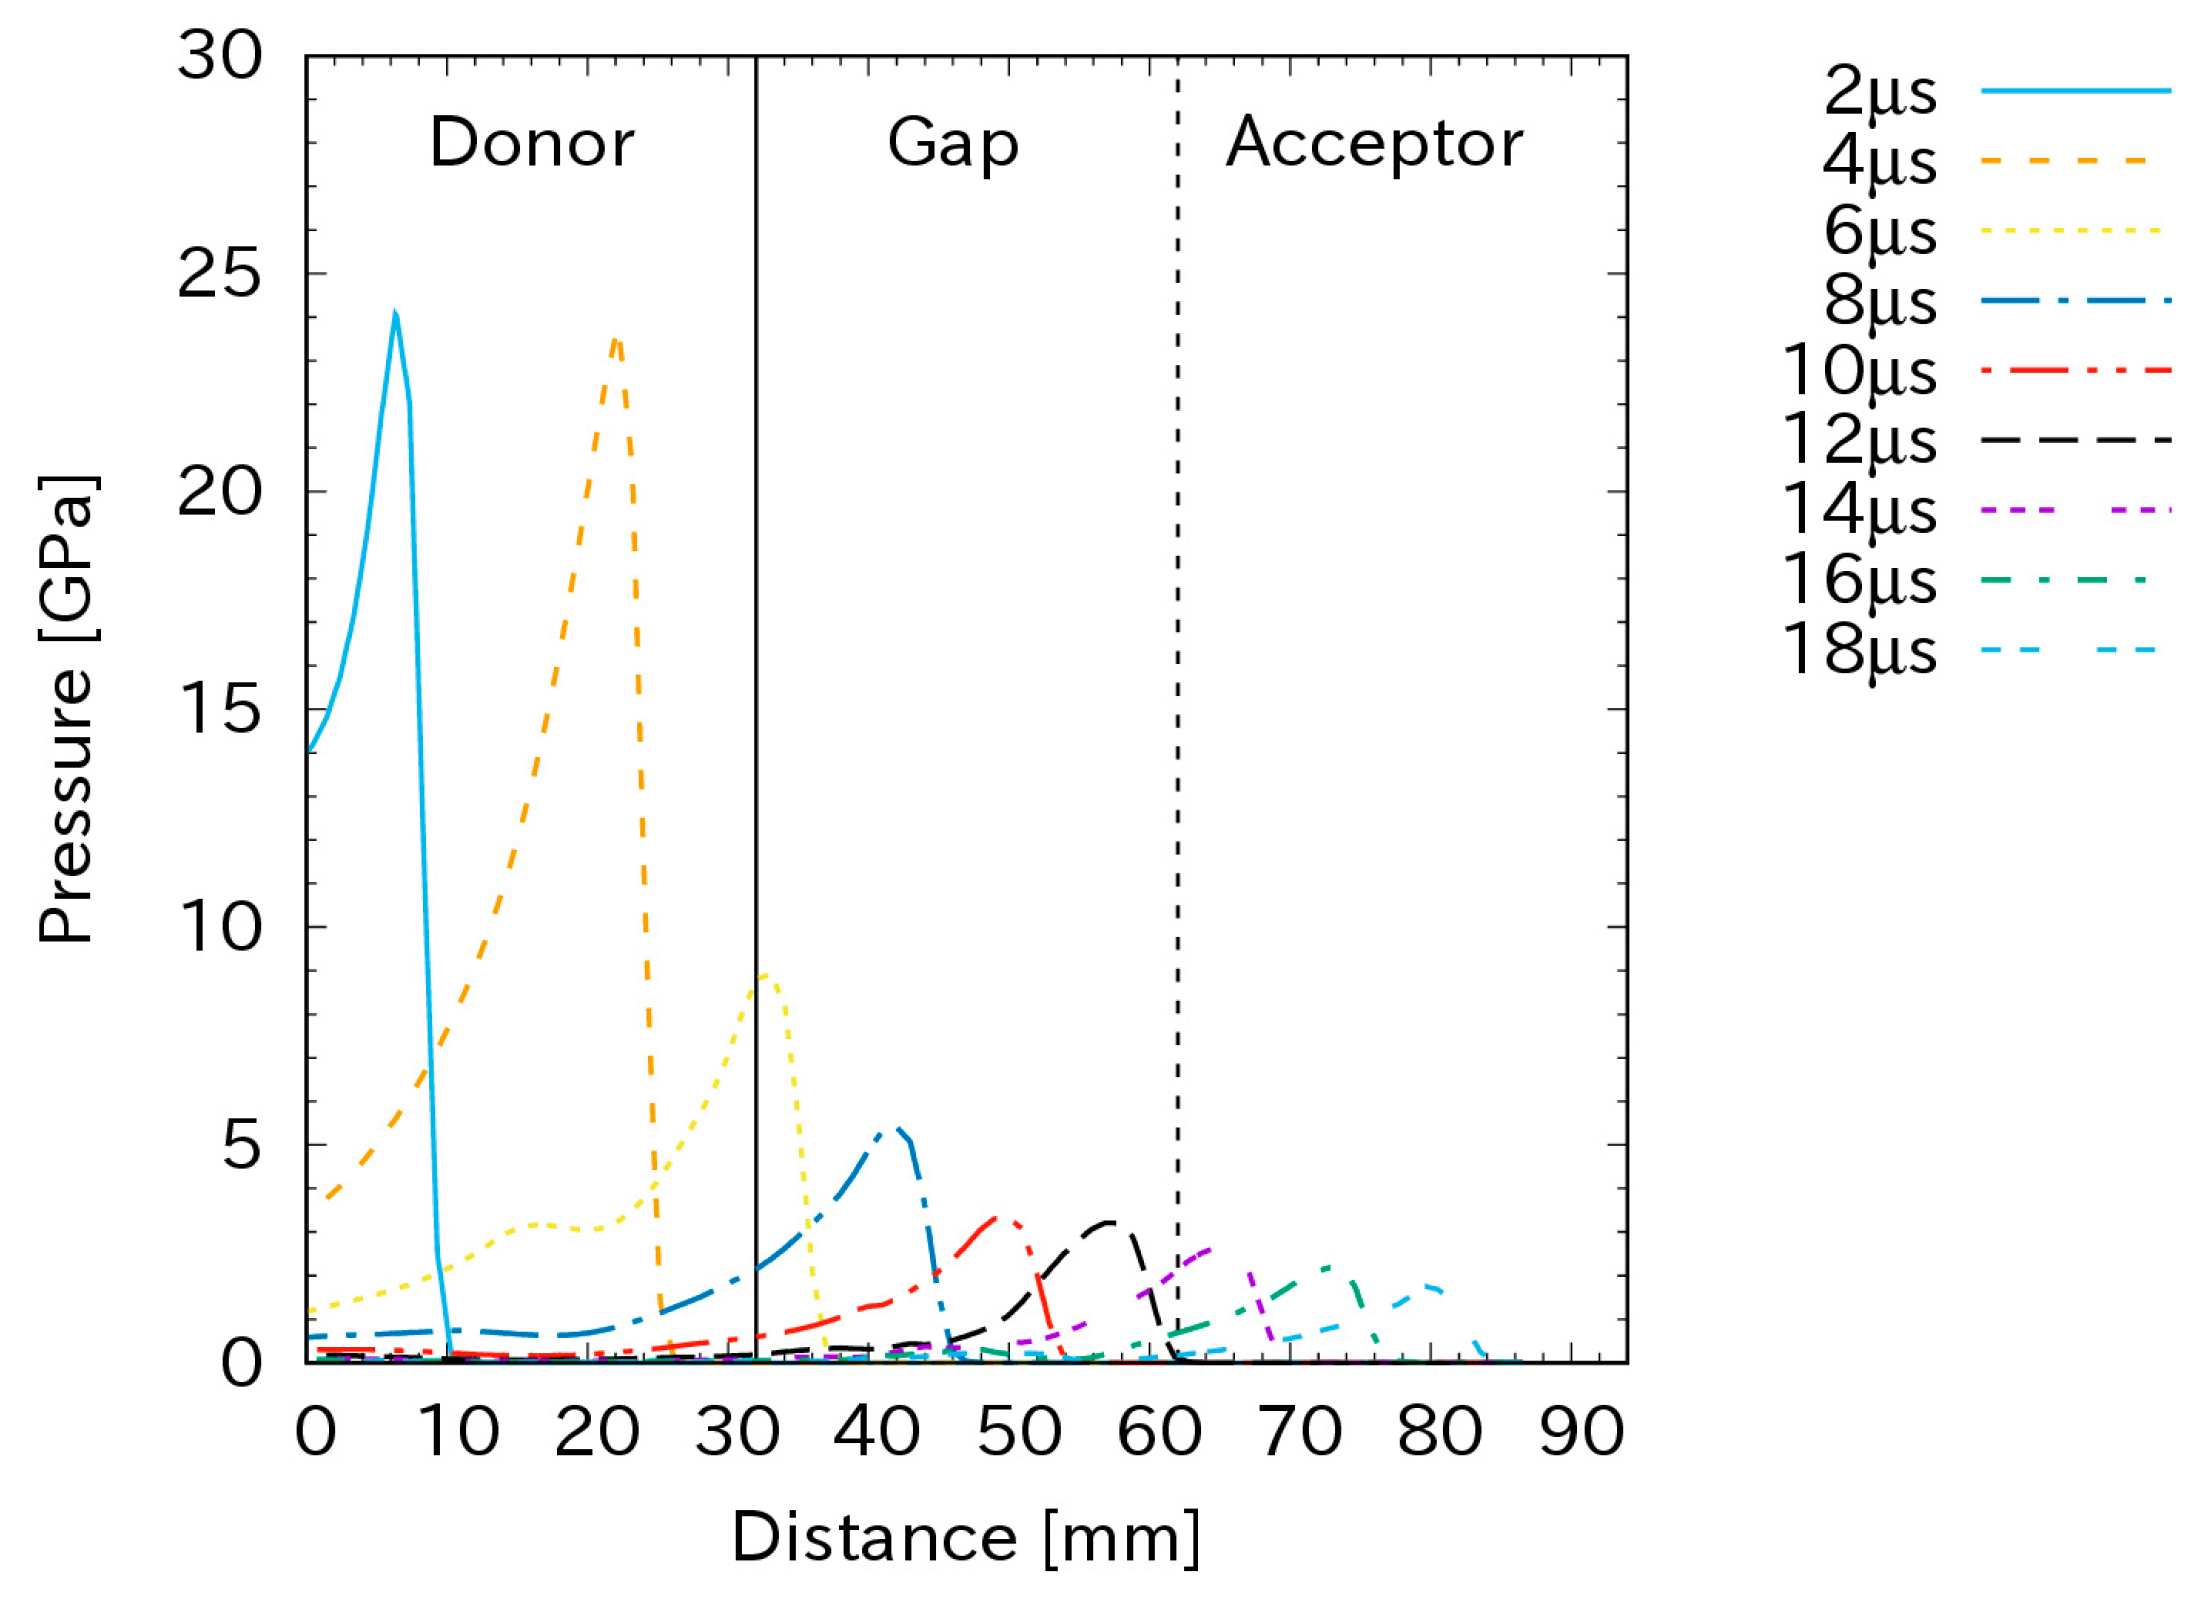
Figure 5 plots the pressure along the axis of the test configuration for various times for a gap length of 15 mm in the case of a charge diameter of 32 mm. Because the detonator created detonation in the donor, the shock propagated steadily here. In the gap, obviously, the shock pressure attenuated to approximately 7.5 GP at the other end of the gap. Similarly to the Pop plot calculation, this shock pressure travelled to the acceptor. Depending on the shock pressure at the interface between the gap and acceptor, the detonation may occur in the acceptor or not. In this case, the peak pressure increased in the acceptor. This implies that detonation occurred.
Figure 6 plots the same pressure as Figure 5 but for a gap length of 30 mm. In this case, the shock pressure propagated steadily in the donor because of detonation and attenuated in the gap as in the case of a gap length of 15 mm. However, the shock pressure attenuated to approximately 2.5 GPa at the interface between the gap and acceptor. This initial shock pressure could not generate detonation in the acceptor. This explains why the shock pressure attenuated in the acceptor, as shown in the figure.
The relation between the gap length and the charge diameter determines whether detonation occurs in the acceptor, as is shown in Figure 7. The circle symbol ᴏ represents the cases in which detonation occurs and the cross symbols × shows the cases where detonation is impossible. The dashed line is the regression line from Kubota’s data [17], which is represented by equation y = 0.210 × 1.387, where y is the gap length and x is the charge diameter. It shows that the log–log of the relation between the critical gap and the charge diameter is linear and approaches Kubota’s numerical study. In his work, an in-house code based on Eulerian frameworks and the constrained interpolation profile (CIP) method for convection was developed for large deformation and multi-material flows. The code also included an Ignition and Growth reactive flow model to solve the shock initiation process.

4. Conclusions

A cost-effective hydrodynamic code for the simulation of shock-to-detonation transition (SDT) was developed based on the open-source code OpenFOAM. The code used a multi-material Eulerian framework. The Harten Lax van-Leer shock capture scheme with the Contact scheme or Advection Upstream Splitting Method were integrated alongside the pre-implemented Kurganov–Tadmor scheme in OpenFOAM. The code was verified by two typical phenomena of SDT: the Pop plot calculation and sympathetic detonation. In the prior verification, the predicted run-to-detonation versus initial shock pressure were in good agreement with an empirical correlation and experiment data. In the later verification, the critical gap versus explosive charge diameter which defines whether an explosive charge is detonated or not was close to the other research data. This and the fact that the code was developed on OpenFOAM imply that the code is an effective simulation alternative for shock-to-detonation transition, a key in the design of explosive use, storage, and transportation.
In the future work, the code will be improved for robust computation.

Author Contributions

Conceptualization, T.X.D., M.Y. and S.I.; methodology, T.X.D., M.Y. and S.I.; software, T.X.D. and M.Y.; validation, T.X.D., M.Y. and S.I.; writing—original draft preparation, T.X.D.; writing—review and editing, T.X.D.; visualization, T.X.D.; All authors have read and agreed to the published version of the manuscript.

Funding

This research received no external funding.

Data Availability Statement

Data are contained within the article.

Conflicts of Interest

Author Masatake Yoshida and Shuichi Ishikura were employed by the company Explosion Research Institute Inc. The remaining authors declare that the research was conducted in the absence of any commercial or financial relationships that could be construed as a potential conflict of interest.

References

  1. Chen, L.; Wang, C.; Feng, C.; Lu, F.; Lu, J.; Wang, X.; Guo, X. Study on random initiation phenomenon for sympathetic detonation of explosive. Def. Technol. 2013, 9, 224–228. [Google Scholar] [CrossRef]
  2. Saburi, T.; Kobota, S.; Wada, Y.; Yoshida, M. Development of numerical code for physical hazard analysis of high-energy materials. Sci. Tech. Energetic Mater. 2013, 74, 124–131. [Google Scholar]
  3. Kim, K.H.; Yoh, J.J. A particle level-set based Eulerian method for multi-material detonation simulation of high explosive and metal confinements. Proc. Combust. Inst. 2013, 34, 2025–2033. [Google Scholar] [CrossRef]
  4. Yang, G.; Fu, Y.; Hu, D.; Han, X. Feasibility analysis of SPH method in the simulation of condensed explosives detonation with ignition and growth model. Comput. Fluids 2013, 88, 51–59. [Google Scholar] [CrossRef]
  5. Ansys Inc. Ansys LS-DYNA. Multiphysics Solver. Available online: https://www.ansys.com/products/structures/ansys-ls-dyna (accessed on 9 January 2020).
  6. Ansys Inc. Ansys Autodyn. Short Duration, Severe Loading Simulations. Available online: https://www.ansys.com/products/structures/ansys-autodyn (accessed on 9 January 2020).
  7. Yuan, P.; Zhao, Y. Numerical simulation of damage to ship structure by underwater contact explosion shock wave. Chem. Eng. Trans. 2017, 62, 673–678. [Google Scholar]
  8. Chen, J.K.; Ching, H.K.; Allahdadi, F.A. Shock-induced detonation of high explosives by high velocity impact. J. Mech. Mater. Struct. 2007, 2, 1701–1721. [Google Scholar] [CrossRef]
  9. Openfoam. Available online: https://openfoam.org/ (accessed on 9 January 2020).
  10. Menikoff, R. JWL Equation of State; Technical Report 2017, LA-UR-15-29536; Los Alamos National Laboratory (LANL): Los Alamos, NM, USA, 2015. [Google Scholar]
  11. Segletes, S.B. An Analysis on the Stability of the Mie-Gruneisen Equation of State for Describing the Behavior of Shock-Loaded Materials; Technical Report 1991, BRL-TR-3214; U.S. Army Laboratory Command: Adelphi, ML, USA, 1991. [Google Scholar]
  12. Tarver, C.T. Modeling detonation experiments on Triaminotrinitrobenzene (TATB)-based explosives LX-17, PBX 9502, and ultrafine TATB. Energetic Mater. 2012, 30, 220–251. [Google Scholar] [CrossRef]
  13. Lorenzo, M.D.; Pelanti, M.P.; Lafon, P. HLLC-type and path-conservative schemes for a single-velocity six-equation two-phase flow model: A comparative study. Appl. Math. Comput. 2018, 333, 95–117. [Google Scholar] [CrossRef]
  14. Shima, E.; Kitamura, K. Parameter-free simple low-dissipation AUSM-family scheme for all speeds. AIAA 2011, 49, 1693–1709. [Google Scholar] [CrossRef]
  15. Urtiew, P.A.; Vandersall, K.S.; Tarver, C.M.; Gacia, F.; Forbes, J.W. Shock initiation of composition B and C-4 explosives: Experiments and modeling. In Proceedings of the International Conference of Shock Waves in Condensed Matter, Saint Petersburg, Russia, 3–8 September 2006. [Google Scholar]
  16. Gibbs, T.R.; Popolato, A. LASL Explosive Property Data; University of California Press: Berkeley, CA, USA, 1980; p. 19. [Google Scholar]
  17. Kubota, S.; Liu, Z.; Otsuki, S.; Nakayama, Y.; Ogata, Y.; Yoshida, M. A numerical study of sympathetic detonation in gap test. Mater. Sci. Forum 2004, 465–466, 163–168. [Google Scholar] [CrossRef]
  18. Kim, B.; Kim, M.; Yoh, J.J. Shock to detonation transition analysis using experiments and models. Proc. Combust. Inst. 2017, 36, 2699–2707. [Google Scholar] [CrossRef]
Figure 1. The pressure history for the initial shock pressure of 4.35 GPa.
Aerospace 12 00214 g001
Figure 2. The run to detonation with impact pressure.
Aerospace 12 00214 g002
Figure 3. The gap test simulation configuration.
Aerospace 12 00214 g003
Figure 4. The distribution of the density (a) and the product mass fraction (b). The shock moves from left to right. The line is the initial position of the gap.
Aerospace 12 00214 g004
Figure 5. The shock propagation in a gap of 15 mm with a charge diameter of 32 mm.
Aerospace 12 00214 g005
Figure 6. The shock propagation in a gap of 30 mm and with a charge diameter of 32 mm.
Aerospace 12 00214 g006
Figure 7. The critical gap for sympathetic detonation, Kubota et al. [17].
Aerospace 12 00214 g007
Table 1. JWL parameters of Composition B [15].
ParameterReactantProductUnit
A 778.15.242[Mbar]
B −0.053010.07678(Mbar]
R1 11.34.2[-]
R2 1.131.1[-]
ω 0.89380.5[-]
E0 -4.9505[MJ/kg]
ρ0 1717.0-[kgm−3]
Table 2. Ignition and Growth parameters of Composition B [15].
ParameterReactantUnit
I4.0 × 1012[s−1]
a0.0367[-]
b0.667[-]
x7.0[-]
G1140.0 × 106[Mbar−2s−1]
c0.667[-]
d1.0[-]
y2.0[-]
G2 1000.0 × 106Mbar−3s−1
e0.222[-]
g1.0[-]
z3.0[-]
λImax0.022[-]
λG1max0.7[-]
λG2min0.0[-]
Table 3. Mie–Gruneisen parameters of aluminum.
ParameterValueUnit
c0 5240.0(ms−1)
a 0.48(-)
s1.4(-)
Γ0 1.97(-)
ρ0 2703.0(kgm−3)
Table 4. Mie–Gruneisen parameters of PMMA [18].
ParameterValueUnit
c0 2180.0(ms−1)
a 0.0(-)
s1.41(-)
Γ0 0.85(-)
ρ0 1182.0(kgm−3)
c0 2180.0(ms−1)
Disclaimer/Publisher’s Note: The statements, opinions and data contained in all publications are solely those of the individual author(s) and contributor(s) and not of MDPI and/or the editor(s). MDPI and/or the editor(s) disclaim responsibility for any injury to people or property resulting from any ideas, methods, instructions or products referred to in the content.