Article

Effects of the Position and Size of the Air Injection Holes in the Flow Structure of a Trapped-Vortex Combustor

by
Luis Alfonso Moreno Pacheco
1,
Juan Gabriel Barbosa Saldaña
1,*,
Edgar Geovany López Jarquín
1,
José Martínez Trinidad
2,
Ricardo Andrés García-León
2,3 and
Miguel Toledo Velázquez
1
1
Laboratorio de Ingeniería Térmica e Hidráulica Aplicada, Sección de Estudios de Posgrado e Investigación, Escuela Superior de Ingeniería Mecánica y Eléctrica-Zacatenco, Instituto Politécnico Nacional, Mexico City 07738, Mexico
2
Laboratorio de Ingeniería de Superficies, Sección de Estudios de Posgrado e Investigación, Escuela Superior de Ingeniería Mecánica y Eléctrica-Zacatenco, Instituto Politécnico Nacional, Mexico City 07738, Mexico
3
Grupo de Investigación en Ingenierías Aplicadas para la Innovación Gestión y Desarrollo (INGAP), Universidad Francisco de Paula Santander Ocaña, Ocaña 546552, Colombia
*
Author to whom correspondence should be addressed.
Aerospace 2025, 12(3), 264; https://doi.org/10.3390/aerospace12030264
Submission received: 5 February 2025 / Revised: 1 March 2025 / Accepted: 10 March 2025 / Published: 20 March 2025
(This article belongs to the Section Aeronautics)

Abstract

:
Combustion efficiency and flame stabilization are two main parameters in combustor design according to current environmental policies imposed on the commercial aviation industry. An alternative for flame stabilization and high efficiency in the combustion process in combustors is the trapped-vortex combustor (TVC) concept. This study uses a numerical simulation for non-reactive flow to determine the optimal location and size of the injection holes for the airflow supplied to a TVC. The results show two vortex flow structures in the cavity that change in size and intensity according to the allocation and size of the injection holes. The optimal behavior is obtained with a set of air injection holes at the top fore wall of the cavity in combination with a second set located at the bottom of the rear wall.

1. Introduction

Current environmental policies, specifically about the emission of polluting and harmful gases, have forced the commercial aeronautical industry to develop technology that is free of pollutants or at least tends to reduce toxic emissions. The approaches to this challenge have focused on increasing the efficiency of gas turbines, having identified niches of opportunity in combustion chambers, specifically in terms of combustion efficiency and flame stability over a wide range of operating conditions.
Both the efficiency and stabilization of the flame in combustors are improved with the implementation of recirculation zones, providing continuous sources of ignition and a mixture of hot products with fresh air and fuel that benefits the combustion process. In some cases, the introduction of conventional swirls or a blunt body is used to generate recirculation zones to drive the hot gases toward the injection zones, mixing the currents and providing the energetic conditions to sustain combustion [1,2].
Different alternatives have been implemented to reduce pollutant emissions without compromising the operating range of the combustors, for example, a variable-geometry combustor, staged combustion, rich–quench–lean (RQL), lean direct injection (LDI), and lean premixed pre-vaporized (LPP), among others. A concise but accurate description of the advantages and disadvantages of these technologies was presented by Yi and Xiaomin et al. [3].
An alternative for flame stabilization and high efficiency in the combustion process in combustors is the concept of the trapped-vortex combustor (TVC). The TVC uses physical cavities in the wall to stabilize the flame [4]. The TVC concept was introduced in 1995 [5] and has become an attractive topic in the scientific community, having several publications related to it over the years. The TVC concept is simple: cavities are used to stabilize the flame by shielding it from the main flow, and the TVC creates recirculation zones; then, air and fuel can be supplied from both the front and rear walls to create a trapped vortex, improving mass and energy transport between the cavity and the main flow. The result is an enhancement in the combustion efficiency, as well as the stabilization of the flame [6,7,8].
There are three benefits of TVCs. Firstly, the vortex formed in the combustion zone can be strengthened by appropriate injections of air and fuel. Furthermore, higher combustion performance can be achieved to produce a mixing vortex. Finally, pollutant emissions can be reduced by controlling the temperature below 1850 K to limit NOx and smoke emissions [9,10]. Moreover, some authors report that the TVC can operate at high inlet velocities up to Ma = 0.77 and has the potential to achieve a reduction of between 10 and 40% in NOx emissions [1,7].
Experimental and numerical studies on the performance of a TVC have been presented by Sighal and Ravinkrishna [4]. In the first publication, they presented a rig for reactive and non-reactive flow experiments considering the influence of a change in L/D (length-to-depth ratio) in the cavity for methane as a working substance. The results showed that for a high inlet velocity, a low L/D ratio is recommended for stable combustion. These experimental results were consistent with the numerical ones presented in the second part [11].
In the last 30 years, different experimental and numerical investigations have been carried out to analyze the advantages of and important progress achieved in these devices. A detailed review of the evolution of the TVC was presented by Zhao and coworkers [12], who described the four generations of TVCs that have been developed so far. Similarly, Jin et al. [3] provided an important overview of several investigations conducted on TVCs and the work presented by Xing et al. [13], who described some important contributions in this area.
Zhao et al. [12] and Yu-ying [14] compared the performance of several combustors and different geometries and operating conditions. However, their studies reported only a few experiments dedicated to analyzing the effects of air injection holes, and the information on their effects on vortex stability did not consider realistic operating conditions. The location of the injection holes for airflow is an important parameter that needs research attention, as well as its influence on the flow stability and its impact on the size of the recirculation zones and vortices in the TVC.
Kumar and Mishra [15] presented an experimental study to find an air injection strategy for a 2D-TVC by comparing two sets' flame blowout limit data. In the first case, they located the injector in the fore wall and close to the cavity side wall; in the second case, the primary air injection was shifted to the cavity trailing edge and opposite the cavity side wall. As a result, in the first case, a shear-driven streamwise vortex flow structure was found in the cavity, but in the second case, a counter-streamwise vortex was established within the cavity. The streamwise vortex flow structure increased the flame stability limit for a broader range, making the fuel–air distribution almost stoichiometric, but for the counter-streamwise vortex, flame stabilization diminished, and the region in the cavity was fuel-lean.
In a different publication by Kumar and Mishra [16], numerical results for a 2-D TVC for reacting flow and a comparison with non-reactive flow were presented. Their numerical results matched qualitatively well with experimental data. They used the two-equation shear stress transport (SST) κ-ω model and simulated turbulence–chemical interaction by using the eddy dissipation concept and employing Ansys Fluent Release 13.0, 2010. They concluded that the flow structure is significantly altered due to the chemical reactions. In this work, the authors presented a brief review of the past attempts by various research groups to understand the flow complexities in a TVC but did not mention the strategy to study the position and size of the injection holes in a TVC.
Guo and coworkers [17] mentioned that the TVC ensures flame stability under a wide range of inlet conditions and stated that different methods have been proposed by varying the locations for supplying fuel and air into the cavity. Air inlets are placed on the front and rear cavity walls, where the fuel is supplied into the cavity with the bow air, which can form a dual-vortex structure that is beneficial for stable and efficient combustion. As a result, a primary vortex occupies most of the cavities, while a secondary vortex is positioned between the primary vortex and the mainstream, effectively insulating the cavity airflow from the influence of the mainstream and ensuring flame stability. However, the authors did not mention the benefits of moving the location of air injection on both the fore and rear cavity walls, nor anything about the size of the injection holes.
Recently, Zhao et al. [18] presented a numerical and experimental study wherein the different modes of air injection into the cavity were analyzed. Their results indicate that the air injection mode influences the flow behavior inside the cavity and, therefore, the flame stabilization and combustion efficiency. They compared four different arrangements for the air injection mode combining front, rear, and front–rear air injection; they concluded that front–rear air injection presented the best performance for the TVC by effectively reducing the drag of the main flow into the cavity, creating a stable large-scale single-vortex flow structure with the highest local equivalence ratio, benefiting lean ignition and blowout performance.
A large-eddy simulation of turbulent mixing in a TVC using a hybrid Eulerian–Lagrangian methodology was presented by Sharifzadeh and Afshari [19]. A planar single-cavity TVC with its length-to-depth ratio set to unity was numerically studied, in which fuel and air jets were introduced into the cavity from the forebody and afterbody, respectively. The paper's main objective was to identify the injection arrangement that provides the most efficient mixing among the considered arrangements under non-reacting conditions. They reported that the configuration with fuel jets adjacent to the cavity inferior wall provides a more homogeneous mixture and better global fuel distribution.
In this paper, a 3D numerical analysis for a real annular TVC with a length-to-depth ratio equal to 1.4, under operating conditions for non-reactive flow, is developed to find an optimal configuration for injection holes located in the fore and rear walls of the cavity. The strategy is to test four different combinations for the position of the injection holes in the fore and rear walls and obtain the best vortex stability inside the TVC for these cases. In the second part of this study, with the optimal injection combination obtained, the influence of the diameter and the number of holes in the injection is analyzed for stability in the vortical structure in the TVC, considering four different diameters for the injection holes. The results will contribute to the technological development of TVCs in the sense that a similar study of these geometrical and operating conditions has not been reported in the literature [8,12,14,20,21].

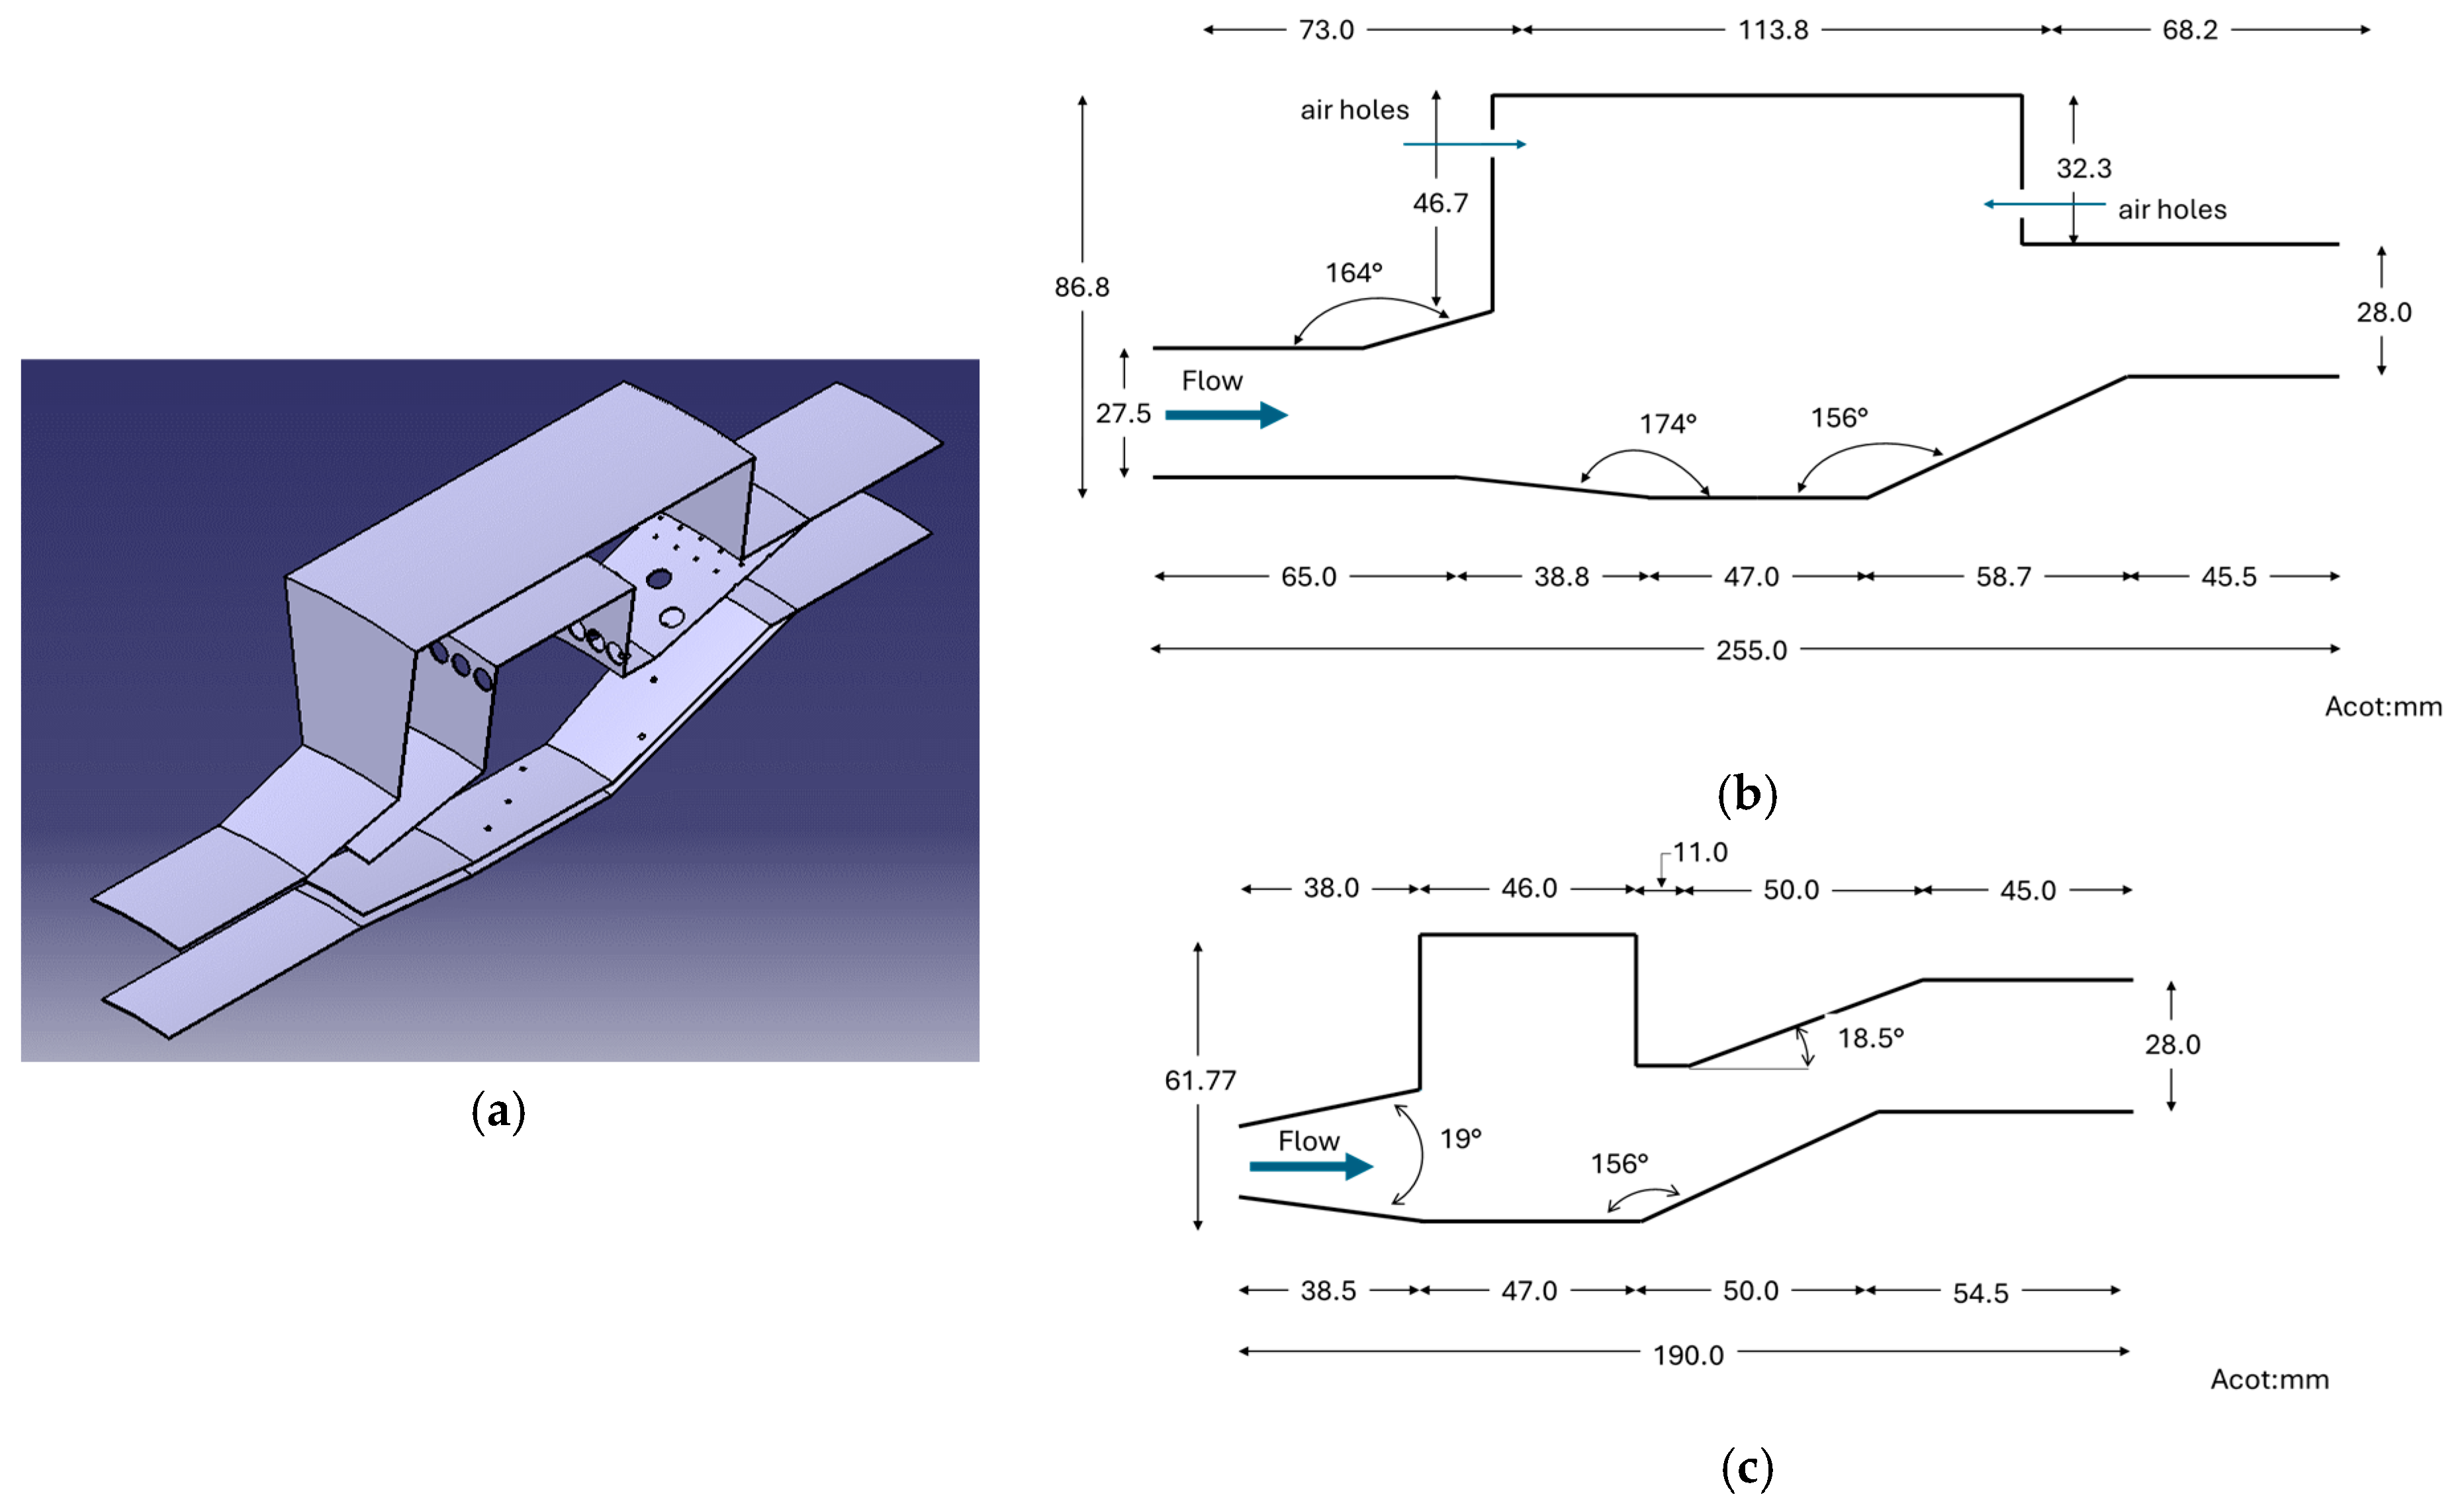
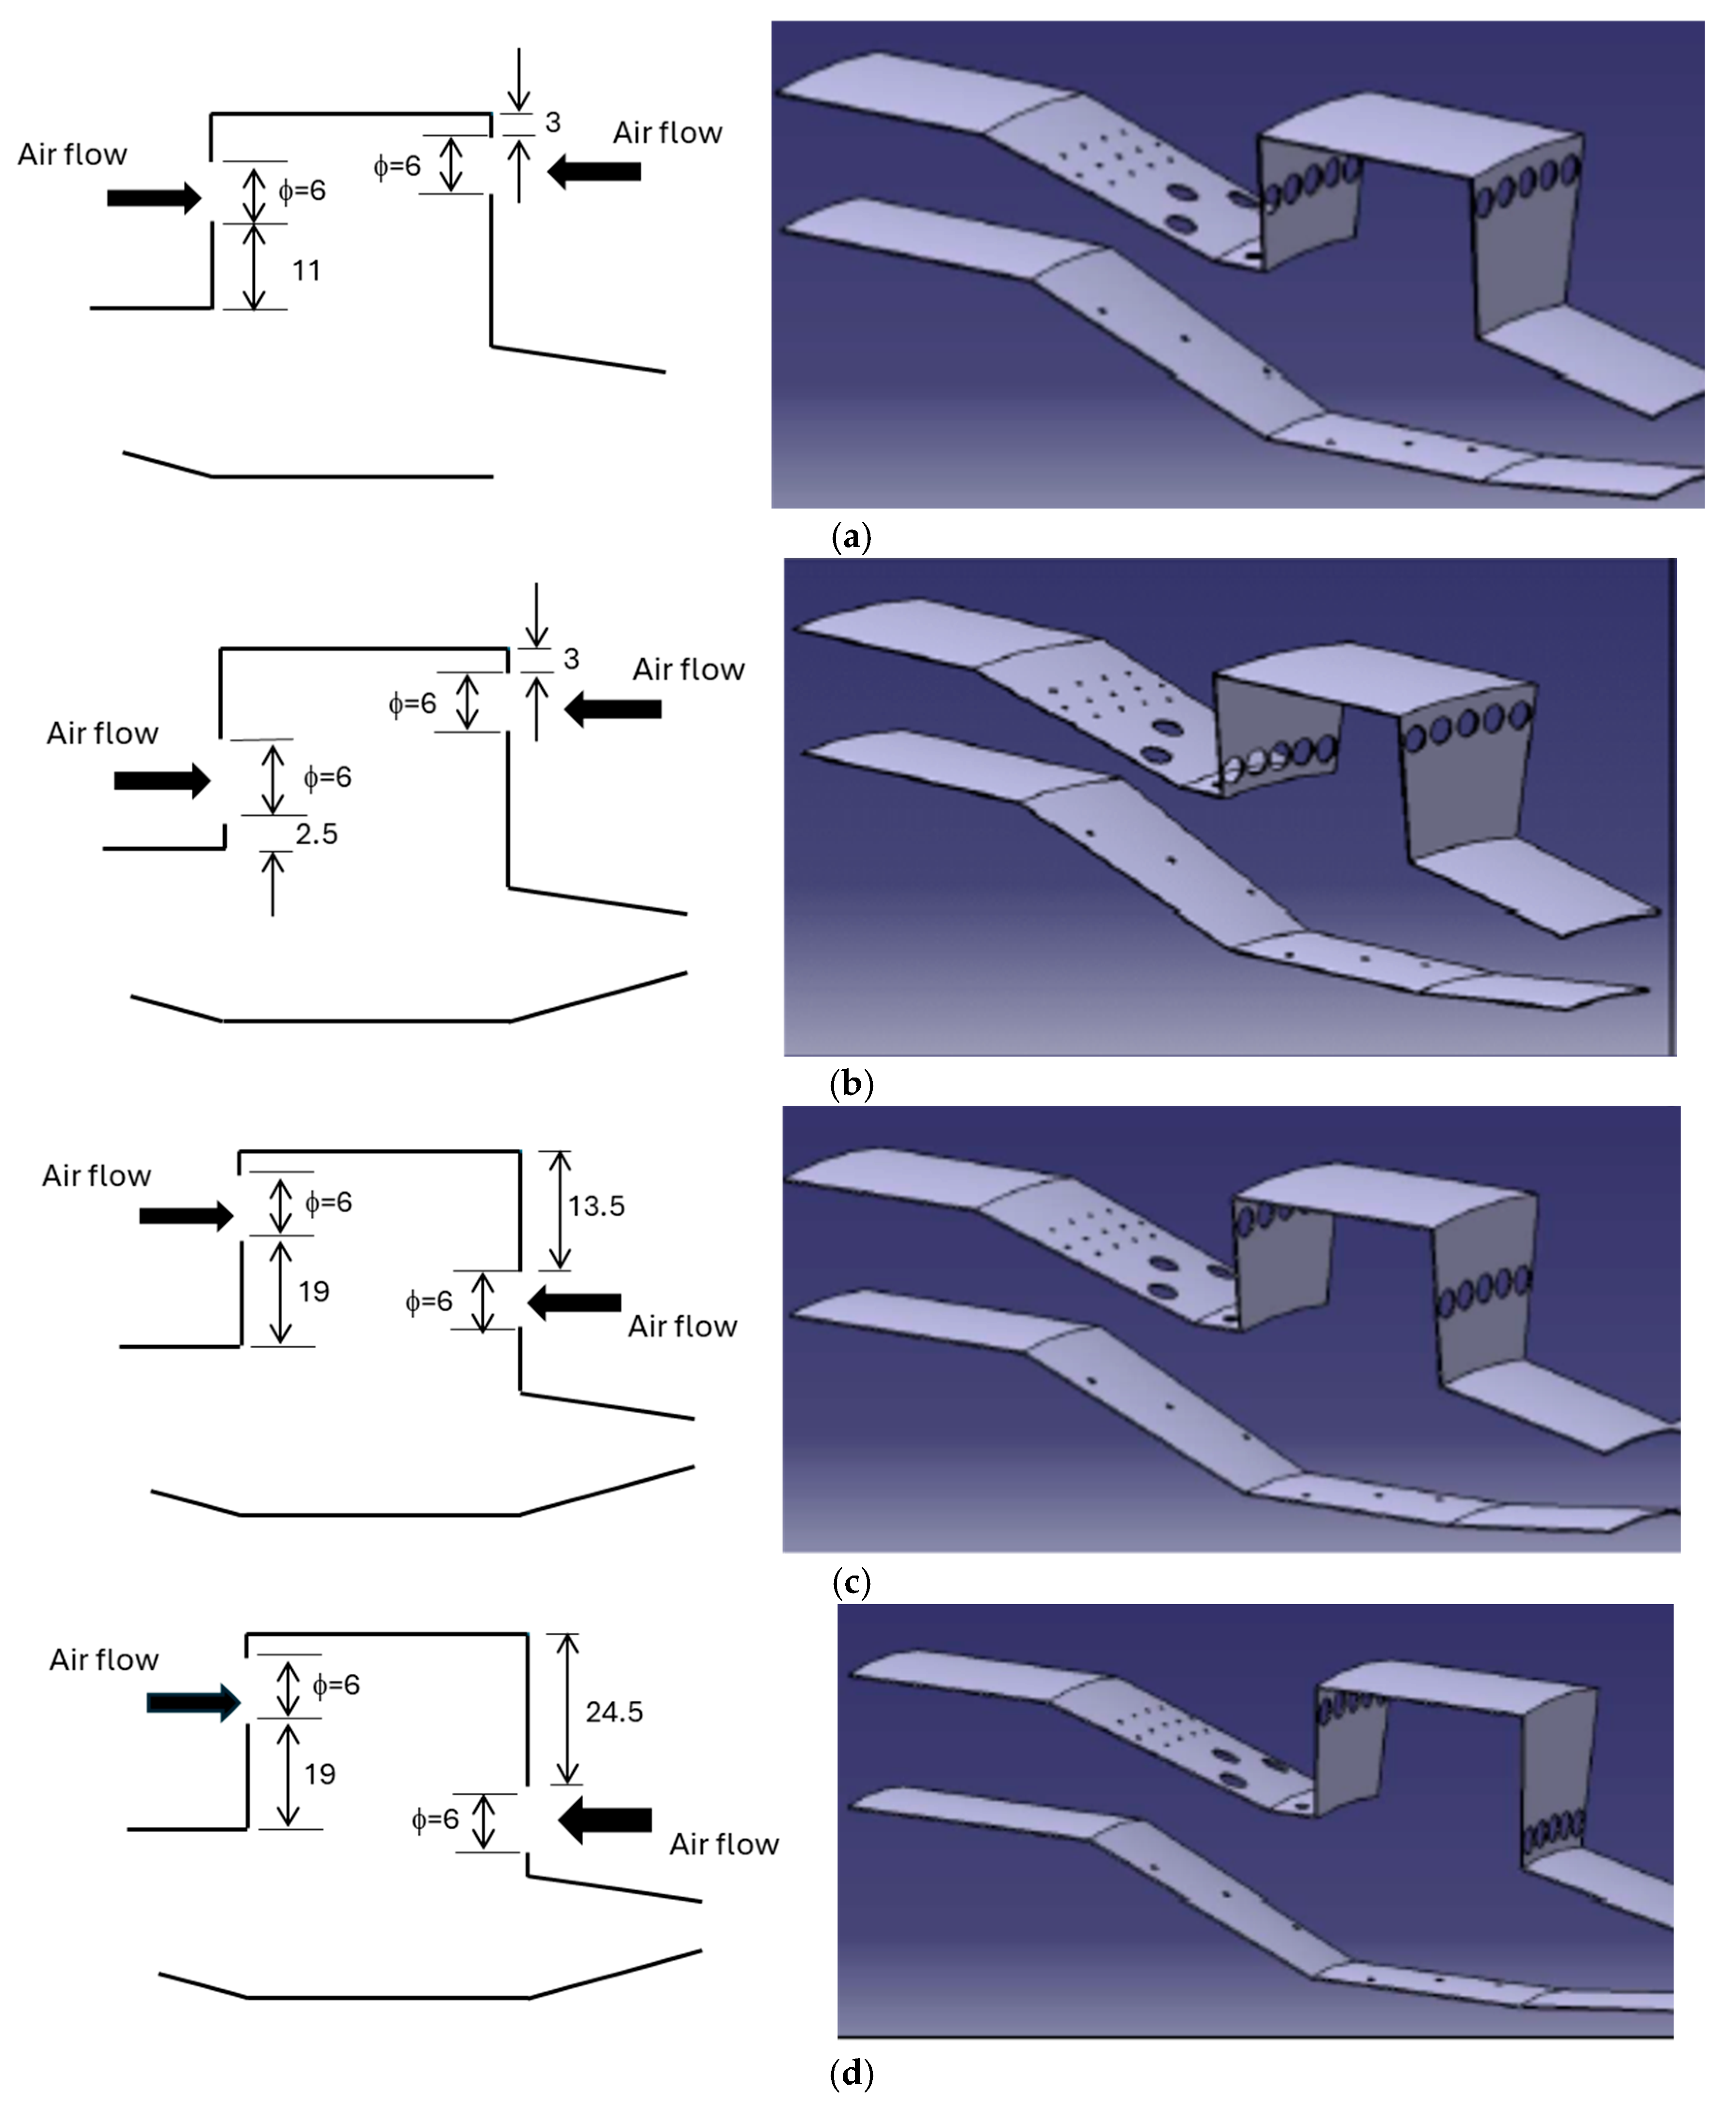
2. Materials and Methods

The selected combustor is an aeronautic turbofan with a thrust/weight ratio of around 8/1. The compressor produces air at 1.4 MPa and 650 K. Several studies have been conducted for this equipment focused on the TVC size and flame stability, as well as different configurations for the swirls in the central duct [2,9,13,22]. The TVC has an axisymmetric annular geometry based on the TVC proposed by Xing et al. and Zhang et al. [2,22]. Figure 1 shows a 15° sector of the TVC and cross-sections of the TVC shell and flame tube, with dimensions given in mm.
The ratio between the length and height in the cavity is defined as follows:
L H = 46   m m 33   m m = 1.39
The result obtained for L/H is close to 1.4, as presented in reference [23]. As mentioned in different publications [21,22,23], the L/H = 1.4 ratio shows a better mixture because a larger portion of the main flow enters the cavity, and under some conditions, a double vortex is formed, positively impacting the combustion’s stability.
The airflow in the TVC passes through 120 holes of 6 mm diameter distributed in two rows. This configuration is appropriate for the TVC working under an RQL regime. One row of holes is in the fore wall of the cavity, while the other row is located in the rear wall of the cavity. This configuration was obtained by testing several combinations of the number of holes and their diameter, resulting from a mass conservation analysis of the airflow required in the TVC cavity for an equivalence ratio that would provide the best performance according to previous studies. The TVC operating conditions are summarized in Table 1.
Figure 2 shows a two-dimensional casing section, the flame tube, and the air holes’ locations proposed for the study cases in this work.
The total area of the airflow inlet was kept constant to avoid any variation in the equivalence ratio; thus, an increase in the hole diameter required a decrease in the number of holes, as shown in Table 2. It is important to mention that the hole diameters for cases W and X were 30% and 60% larger than the original holes, while those for cases Y and Z were 30% and 60% smaller than the original holes. Sections of the frontal views of the cavity for these study cases are shown in Figure 3.

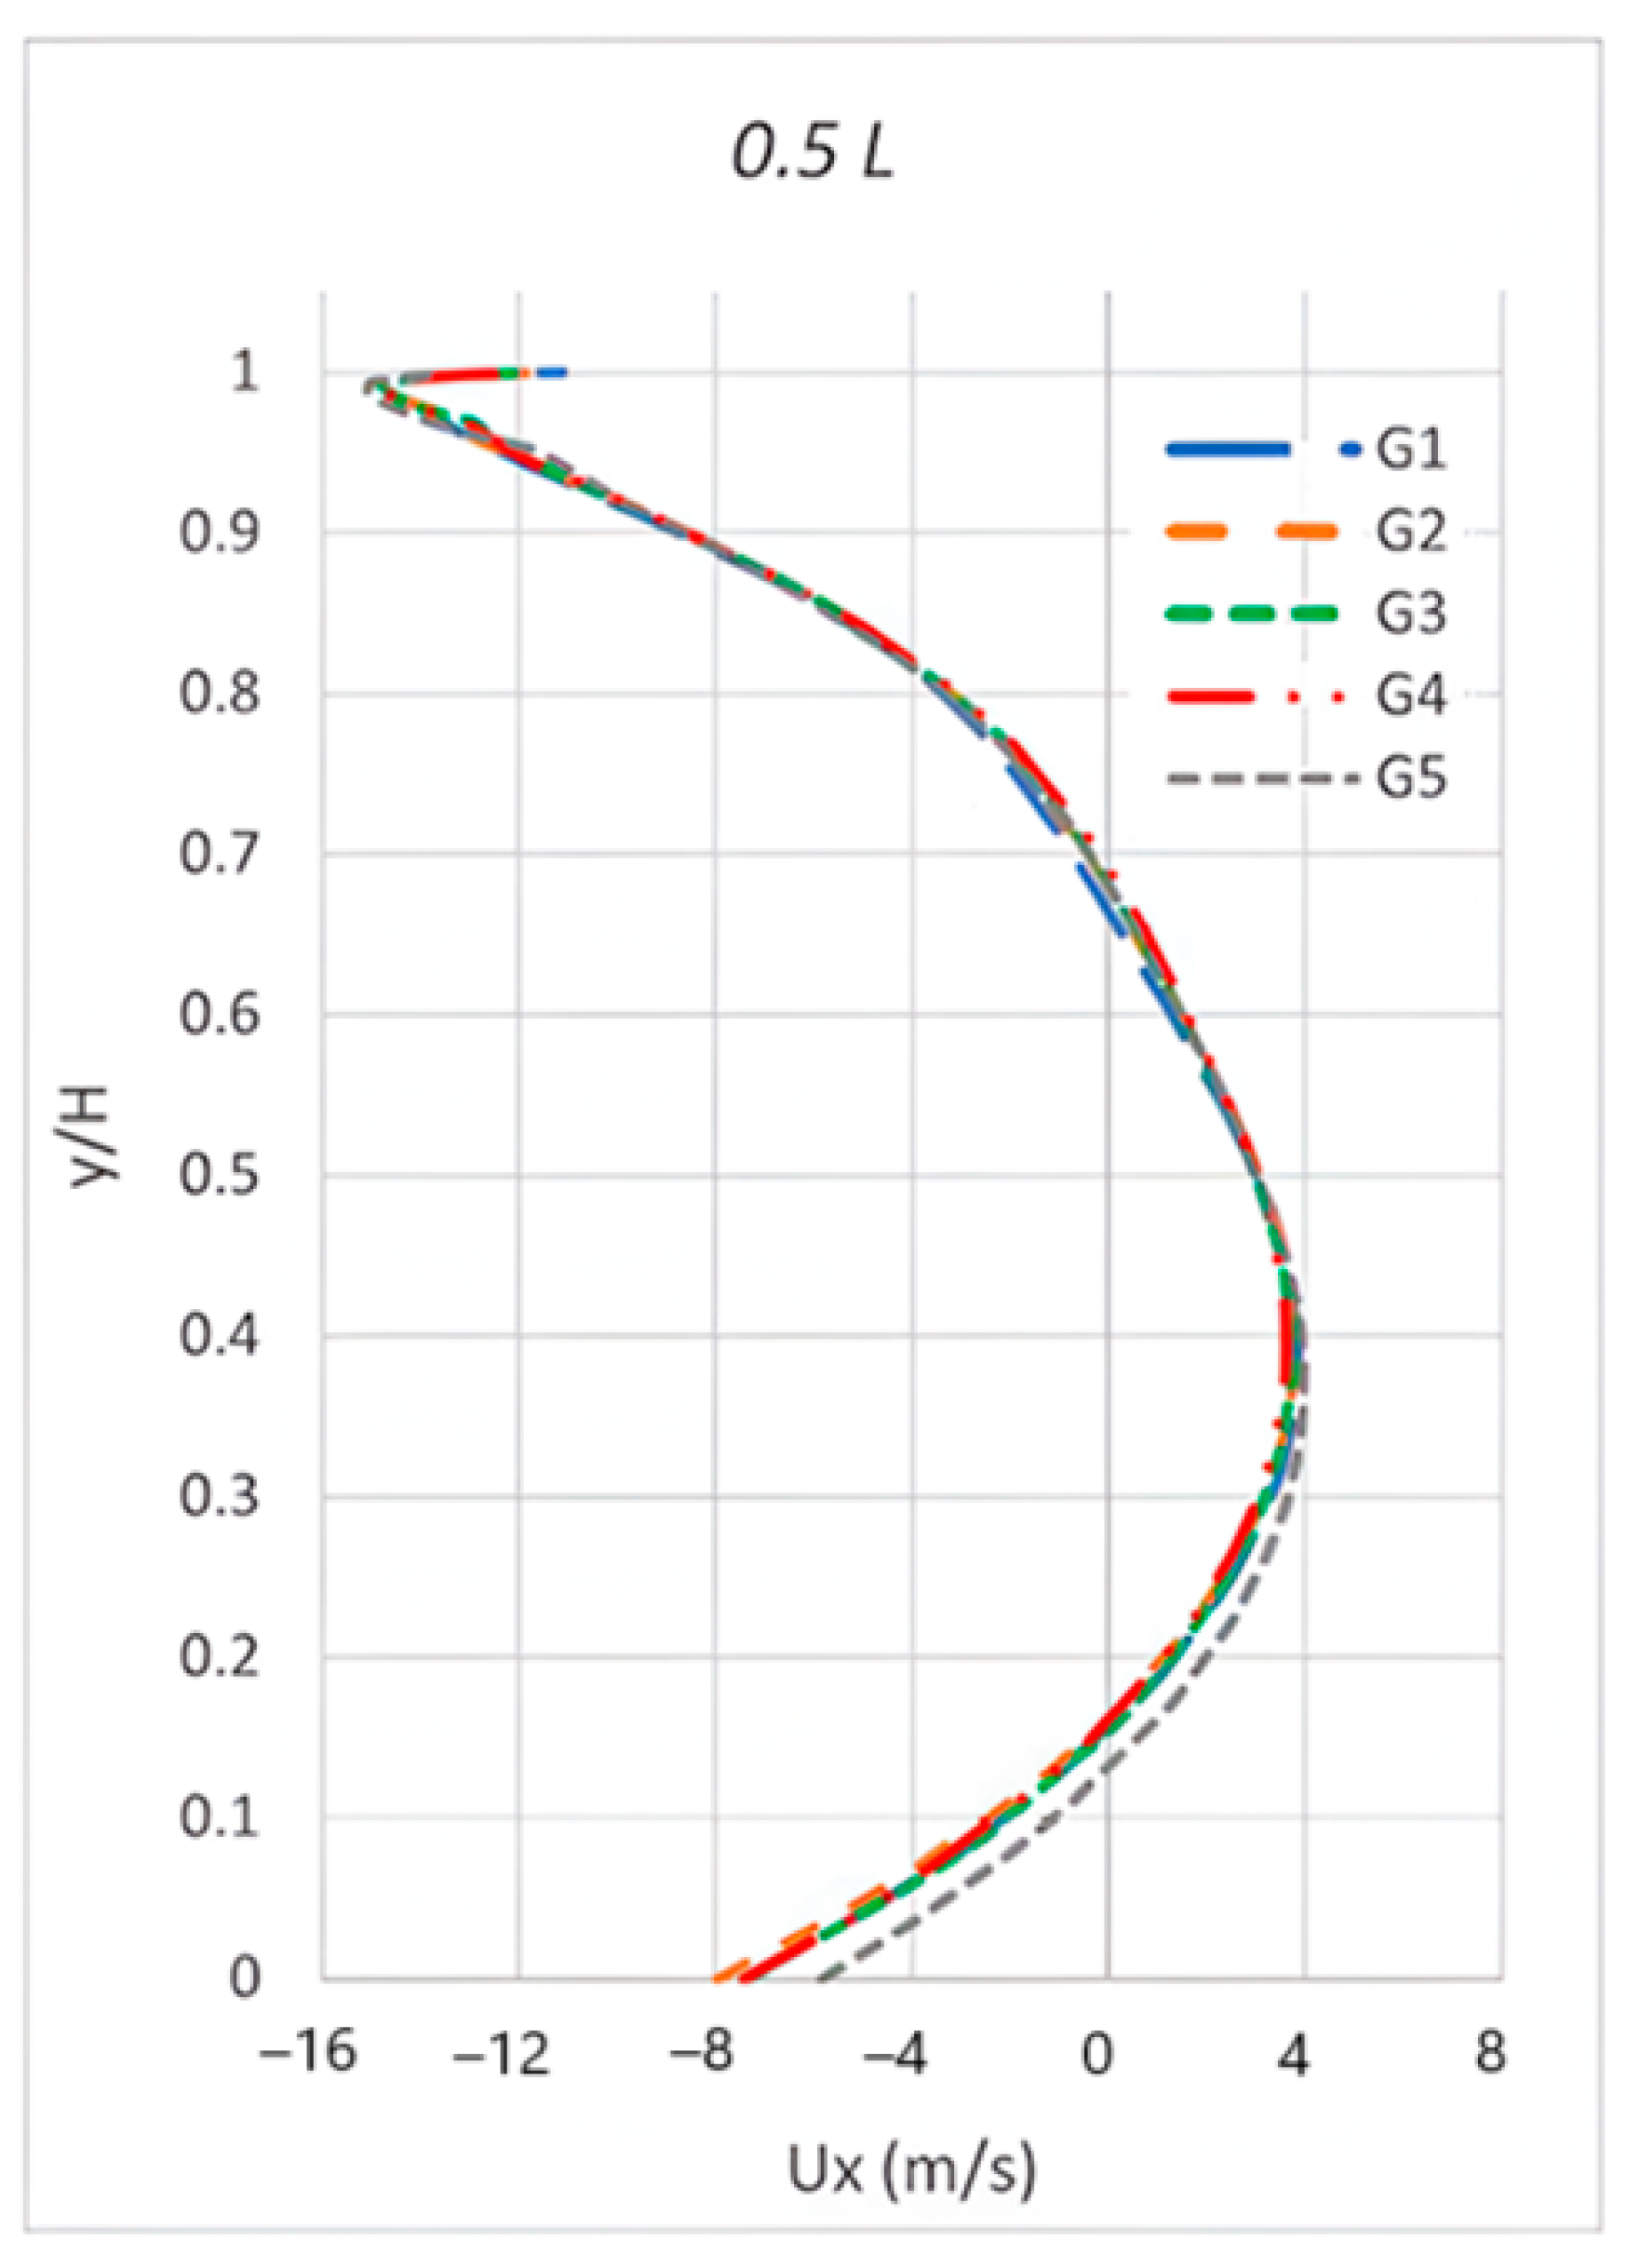
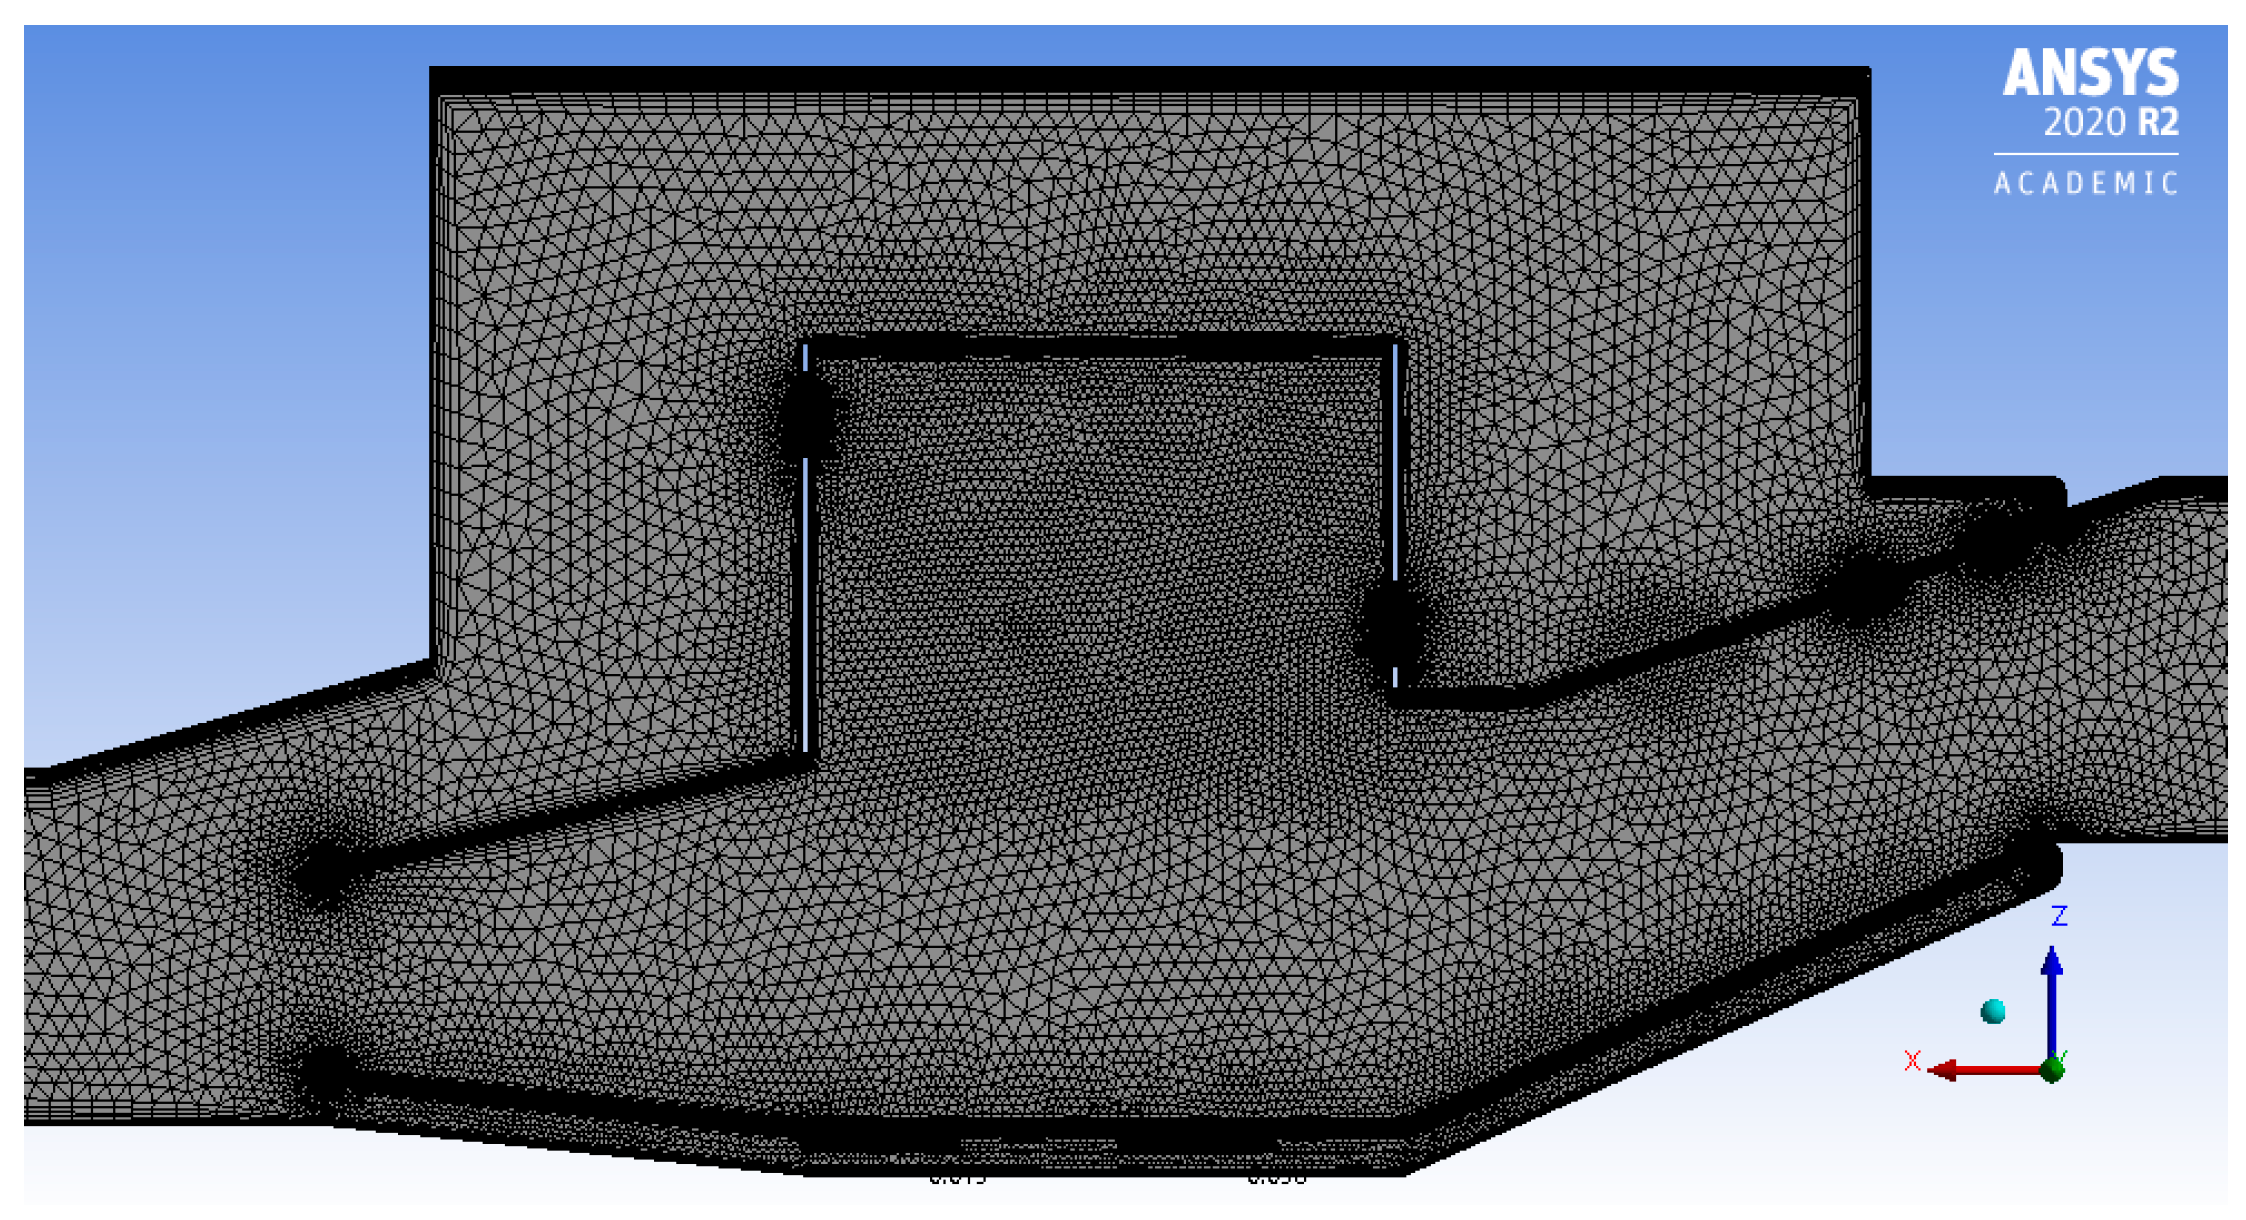
Numerical Methodology

The software used for the numerical analysis was OpenFOAM V2206 (Open Field Operation and Manipulation), a free software product based on finite element analysis and the C++ programming language.
The geometrical domain consisted of the TVC combustor, including the cavity, air admission, injection, and dilution holes. The exterior core for secondary airflow circulation was also part of the geometric domain.
The numerical analysis was performed for air at a constant specific heat. The flow behavior, specifically the vortex inside the cavity, was the main objective to determine the combustion efficiency and flame stability for the TVC. The steady-state continuity and momentum equations were solved by OpenFOAM-rhoSimpleFoam solver, which is a steady-state turbulent flow solver used in addition to the SIMPLE algorithm to solve the pressure–velocity linkage in the steady-state Navier–Stokes equations in the computational domain [24]. The turbulence model utilized in the numerical solution was the κ−ε model. Translational periodic boundary conditions were applied to the lateral sides of the domain. Mass flow and pressure were imposed as inlet and outlet boundary conditions. In addition, the mesh had local refinement, and a boundary layer approximation and inflation layer were applied in the vicinity of the cavity and near the wall regions.
Five different grid sizes were evaluated for the grid independence study. The grids were generated using the ANSYS R20 student version. The finest grid comprised 7,195,663 cells, and the next one had 10% fewer cells. A summary of the evaluated grid sizes and geometric features of each grid is presented in Table 3.
The convergence of the solution was established using the GCI (Grid Convergence Index), proposed by Roache and Celik [25,26], which has been widely used to monitor errors in the discretization process for TVCs and verify convergence [27,28].
Figure 4 shows the axial velocity profile at x/L = 0.5 for the proposed grid sizes. L is the axial length of the cavity.
The CGI method results showed that the error for G4 was less than the values presented in the literature [26,28]. Then, this grid size was chosen for the productive runs because the computational time for convergence was reduced; additionally, the results were qualitatively and quantitatively corrected and did not change drastically from those obtained with finer grids. Some important details for the grid size are summarized in Table 4.
The chosen grid size was about 5,863,447 hexahedral cells with a minimum orthogonality quality of 0.15 and a maximum skewness of 0.849. In this sense, the proposed grid is of excellent quality. Figure 5 shows a representation of the lateral view of the grid.
A numerical validation was performed by comparison with the experimental results published in reference [8]. The velocity profiles at different axial positions matched, as presented in Figure 6. Although there were differences in the geometry used in the reference and the one in this document, the numerical results qualitatively and quantitatively reproduced the velocity profile reasonably well at almost all positions in comparisons with the experimental data, validating the numerical procedure and the turbulence model.

3. Results and Discussion

The flow inside the TVC can be described utilizing the total pressure, streamlines, and turbulence intensity [29]. The other parameters considered for the analysis in this work are the velocity ratio in the cavity, the velocity gradient, and the Q criterion to identify the vortex in the cavity in planes aligned with the injection holes and in planes in the middle of the holes.
In the first part, the objective is to obtain the best stability of the vortex in the TVC for four different locations of the airflow injection, identified as cases A, B, C, and D.

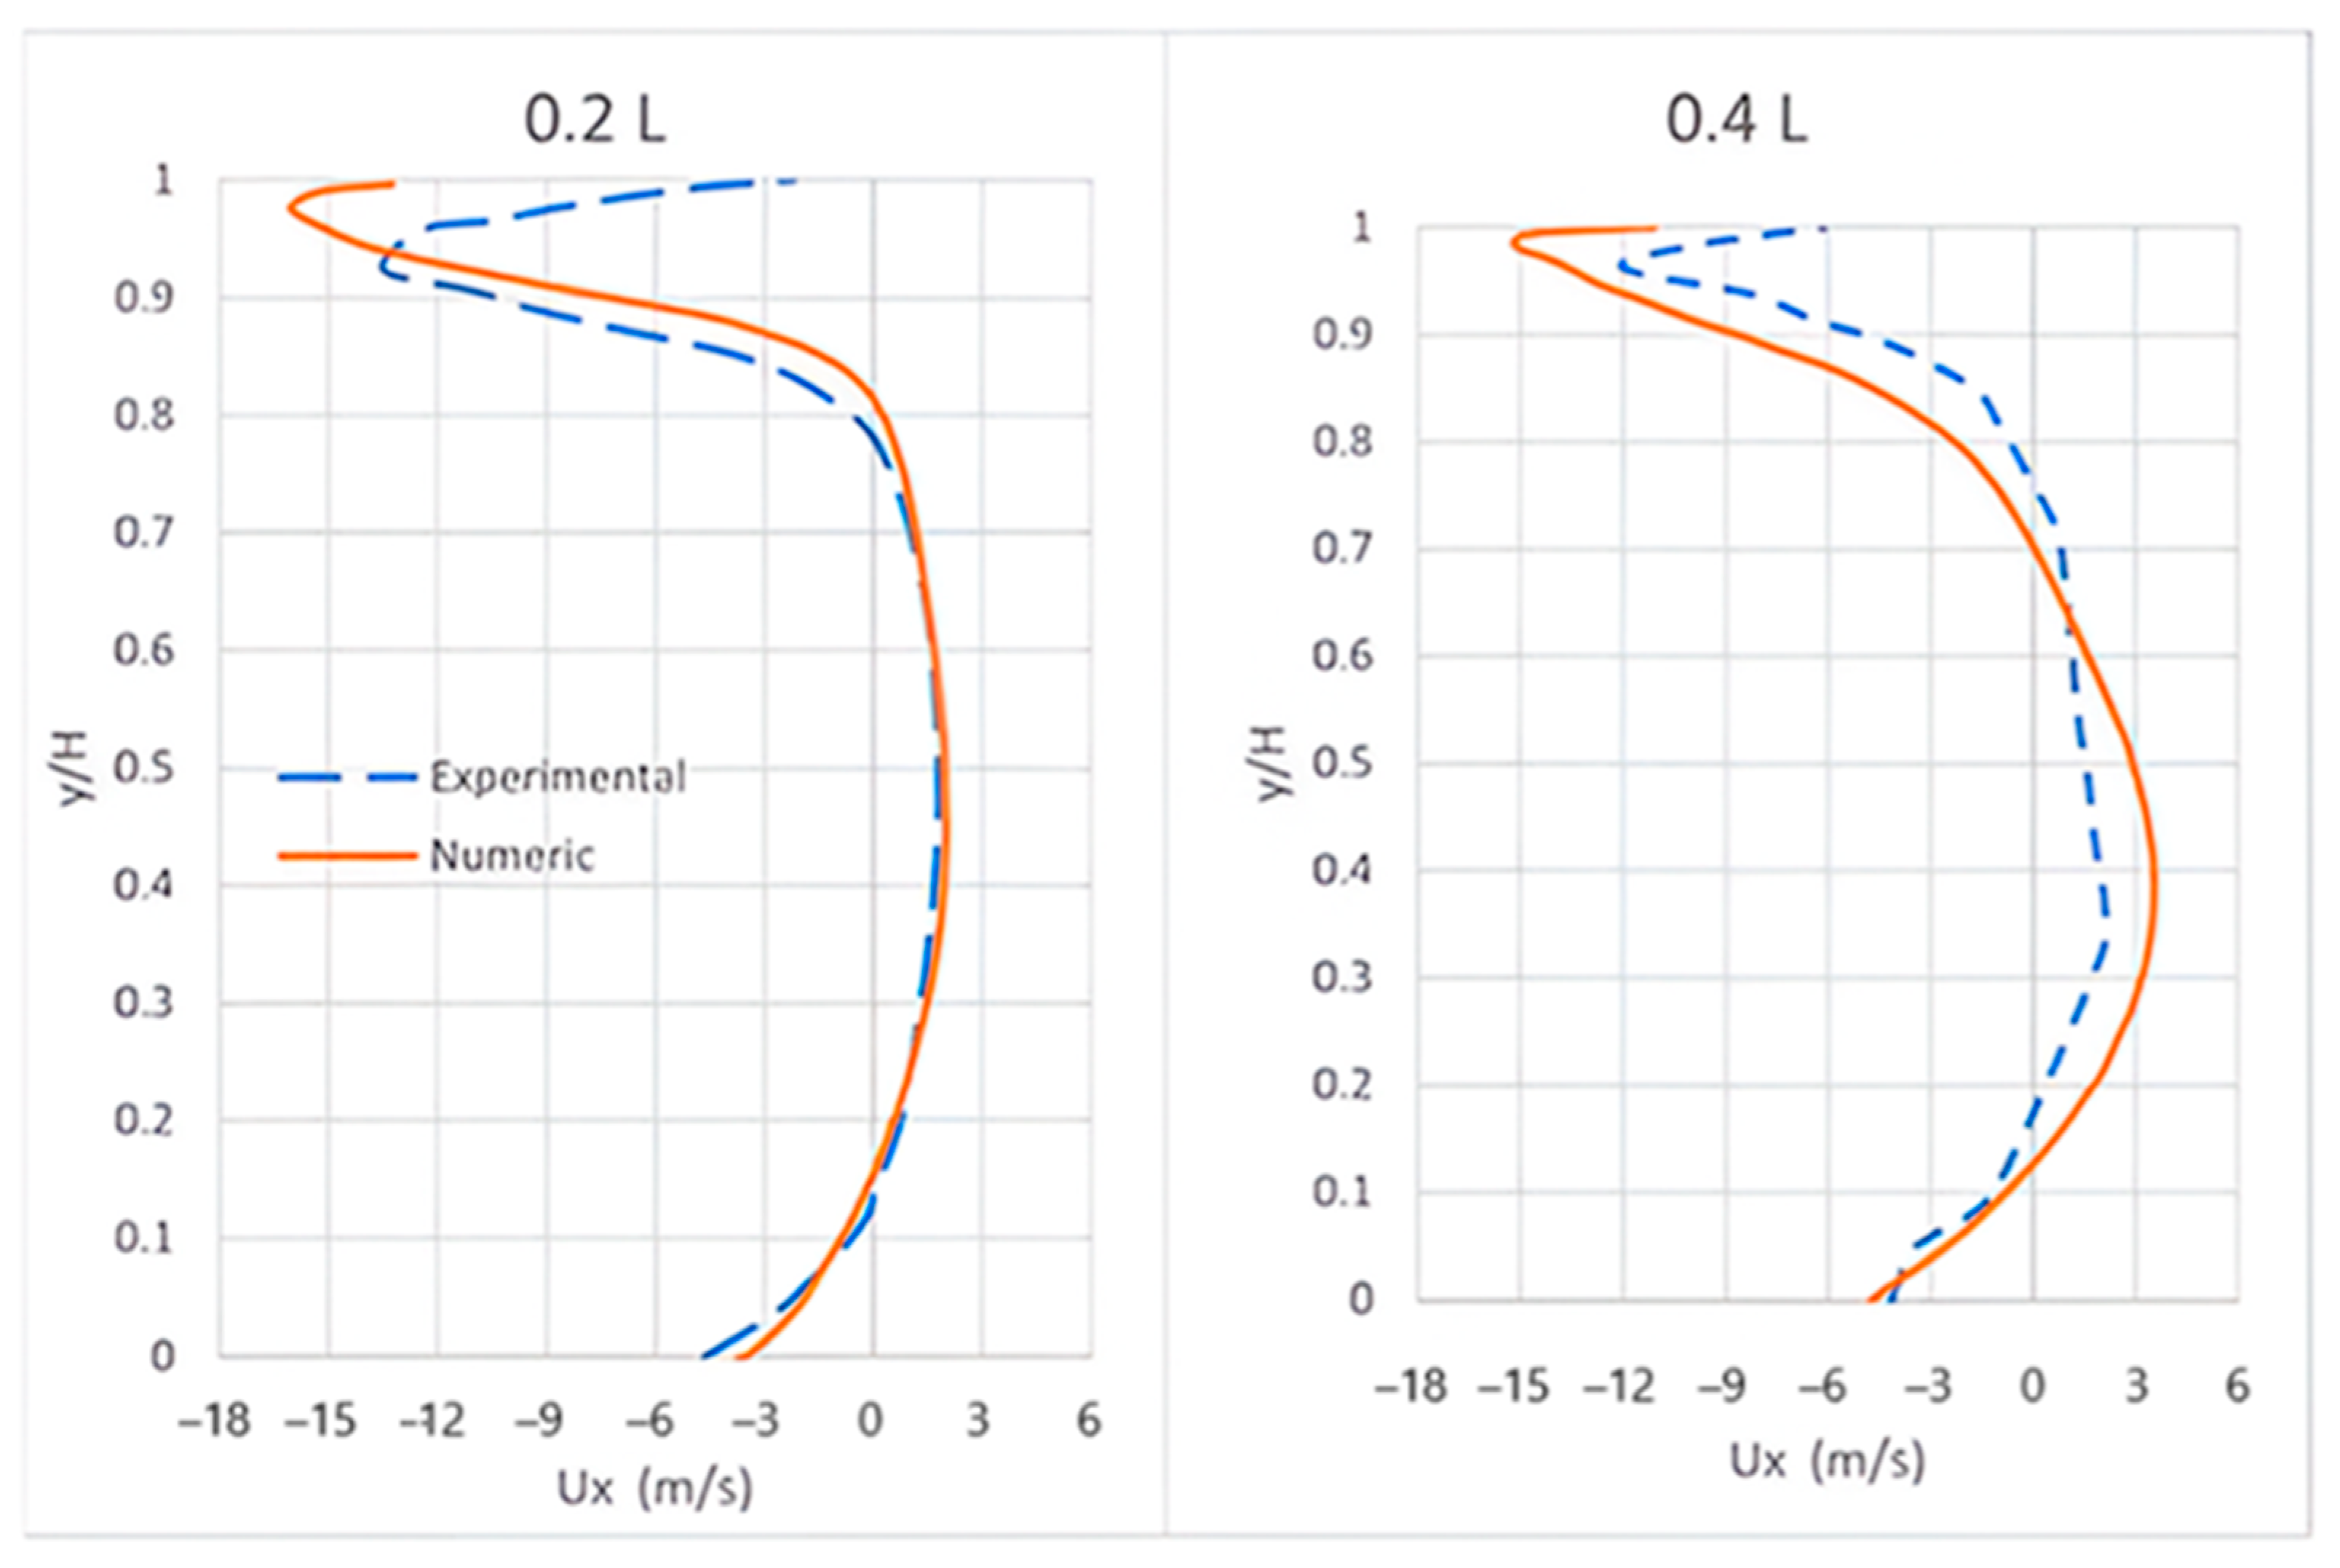
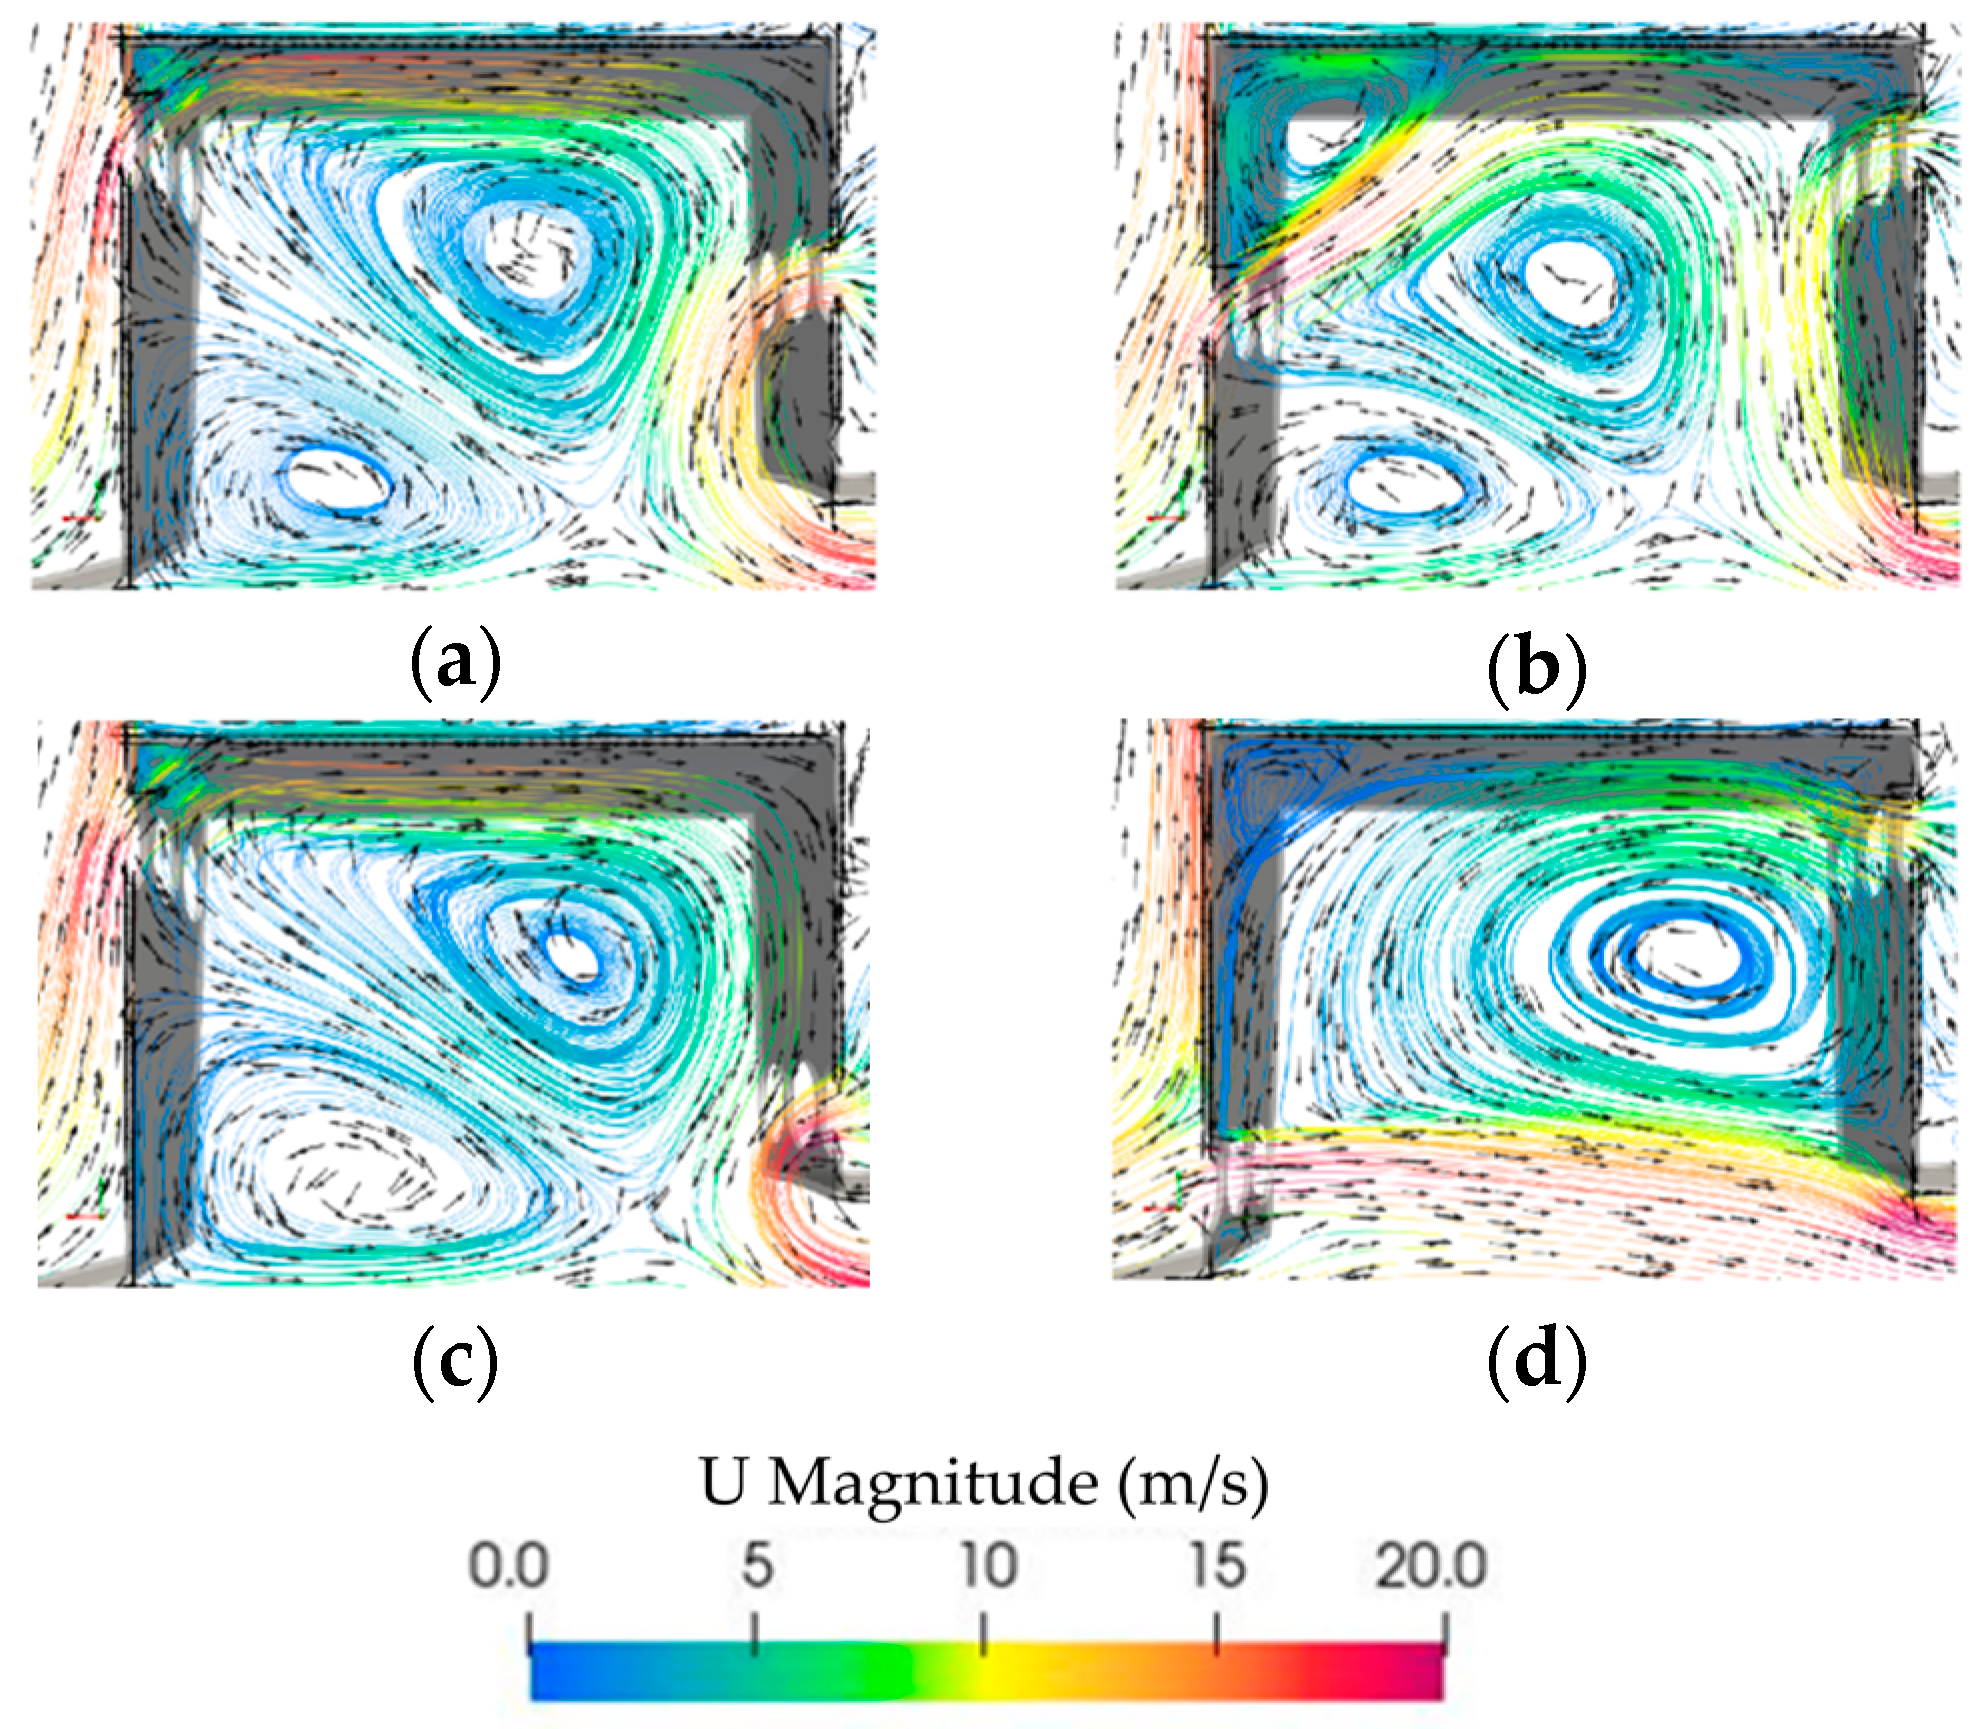
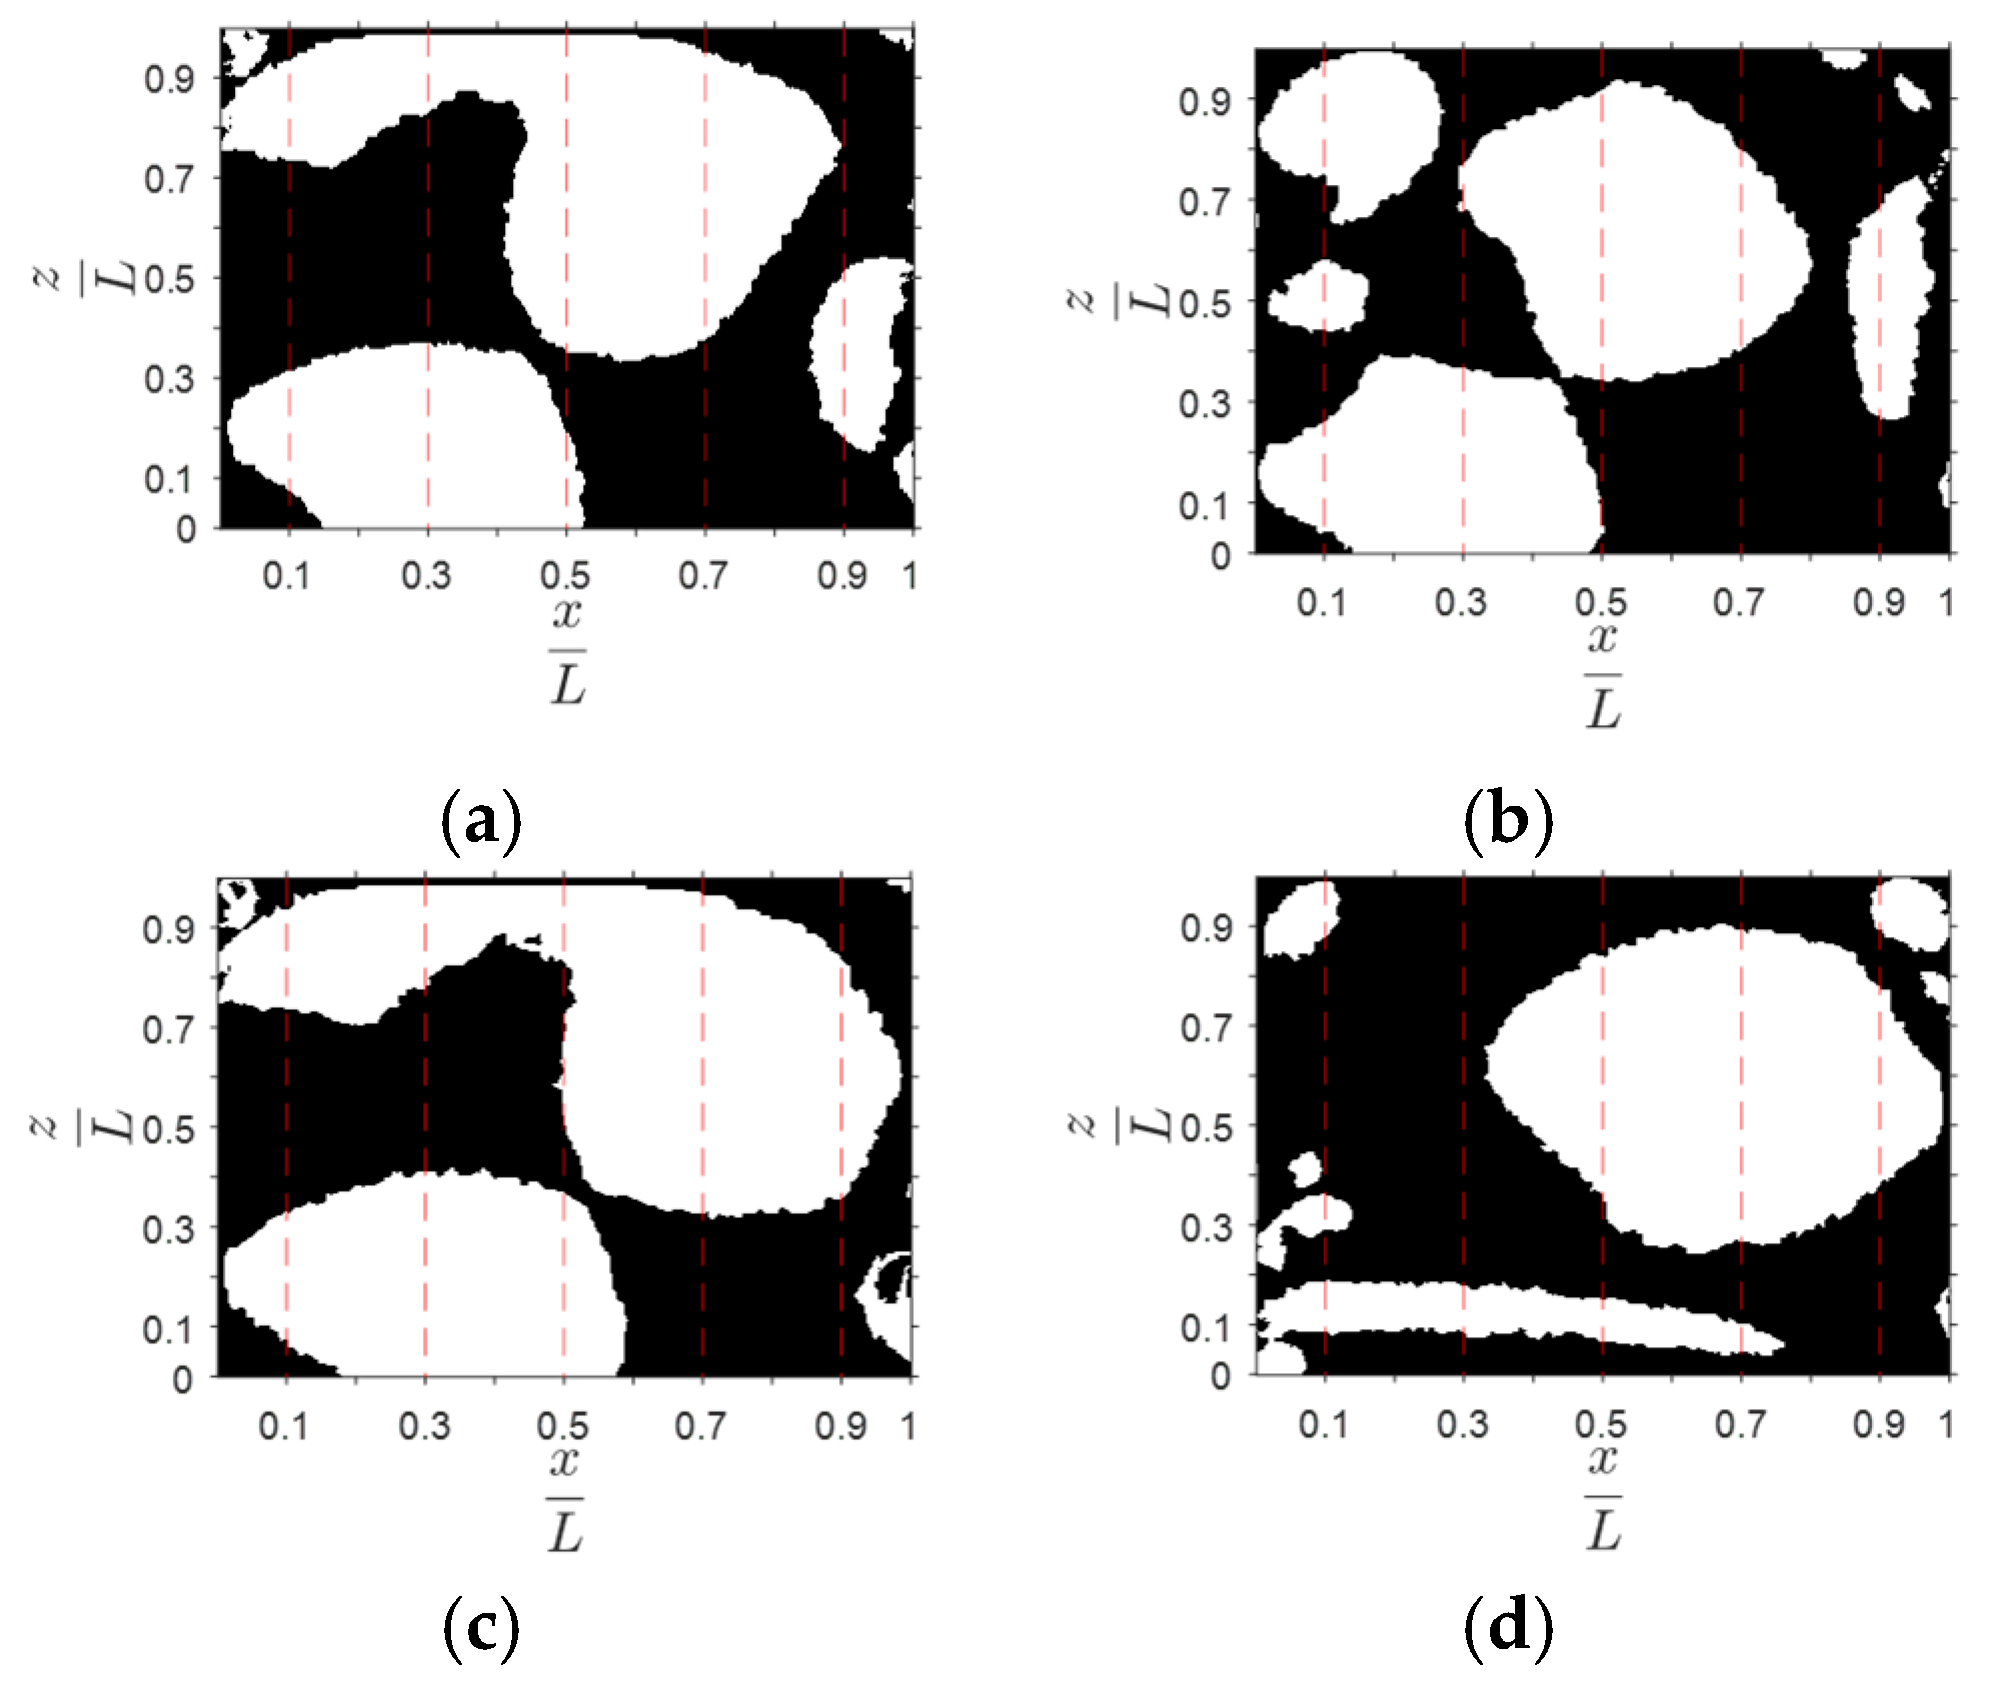
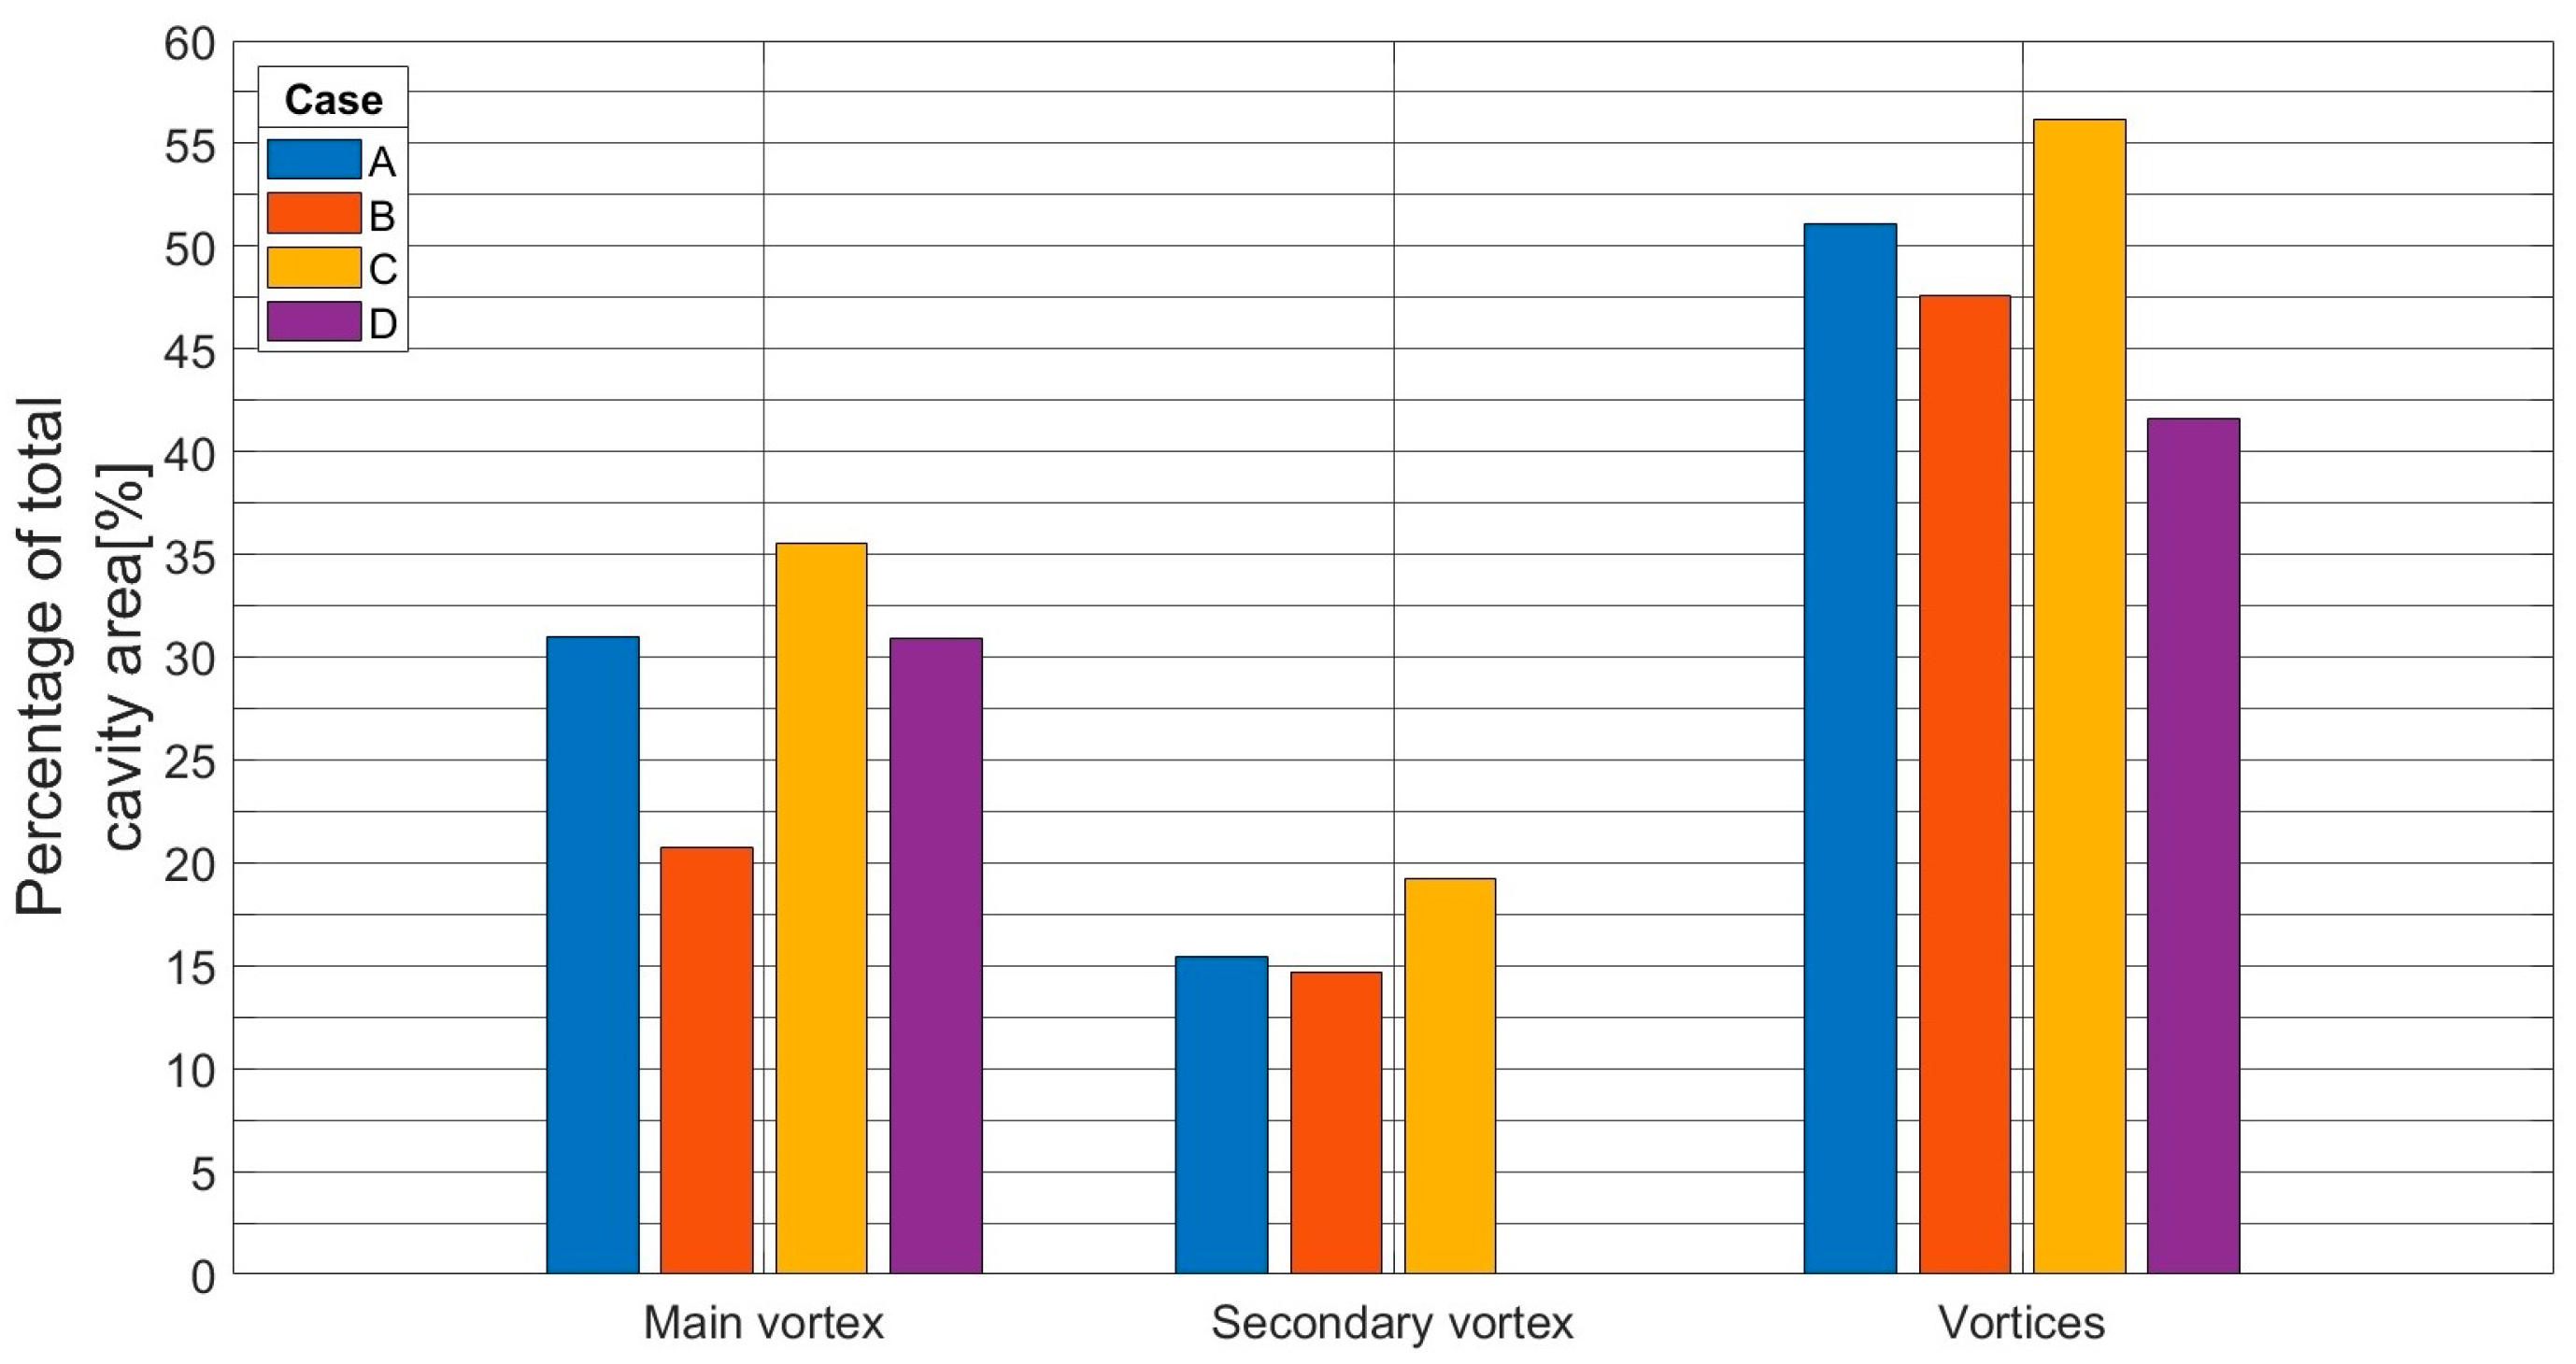
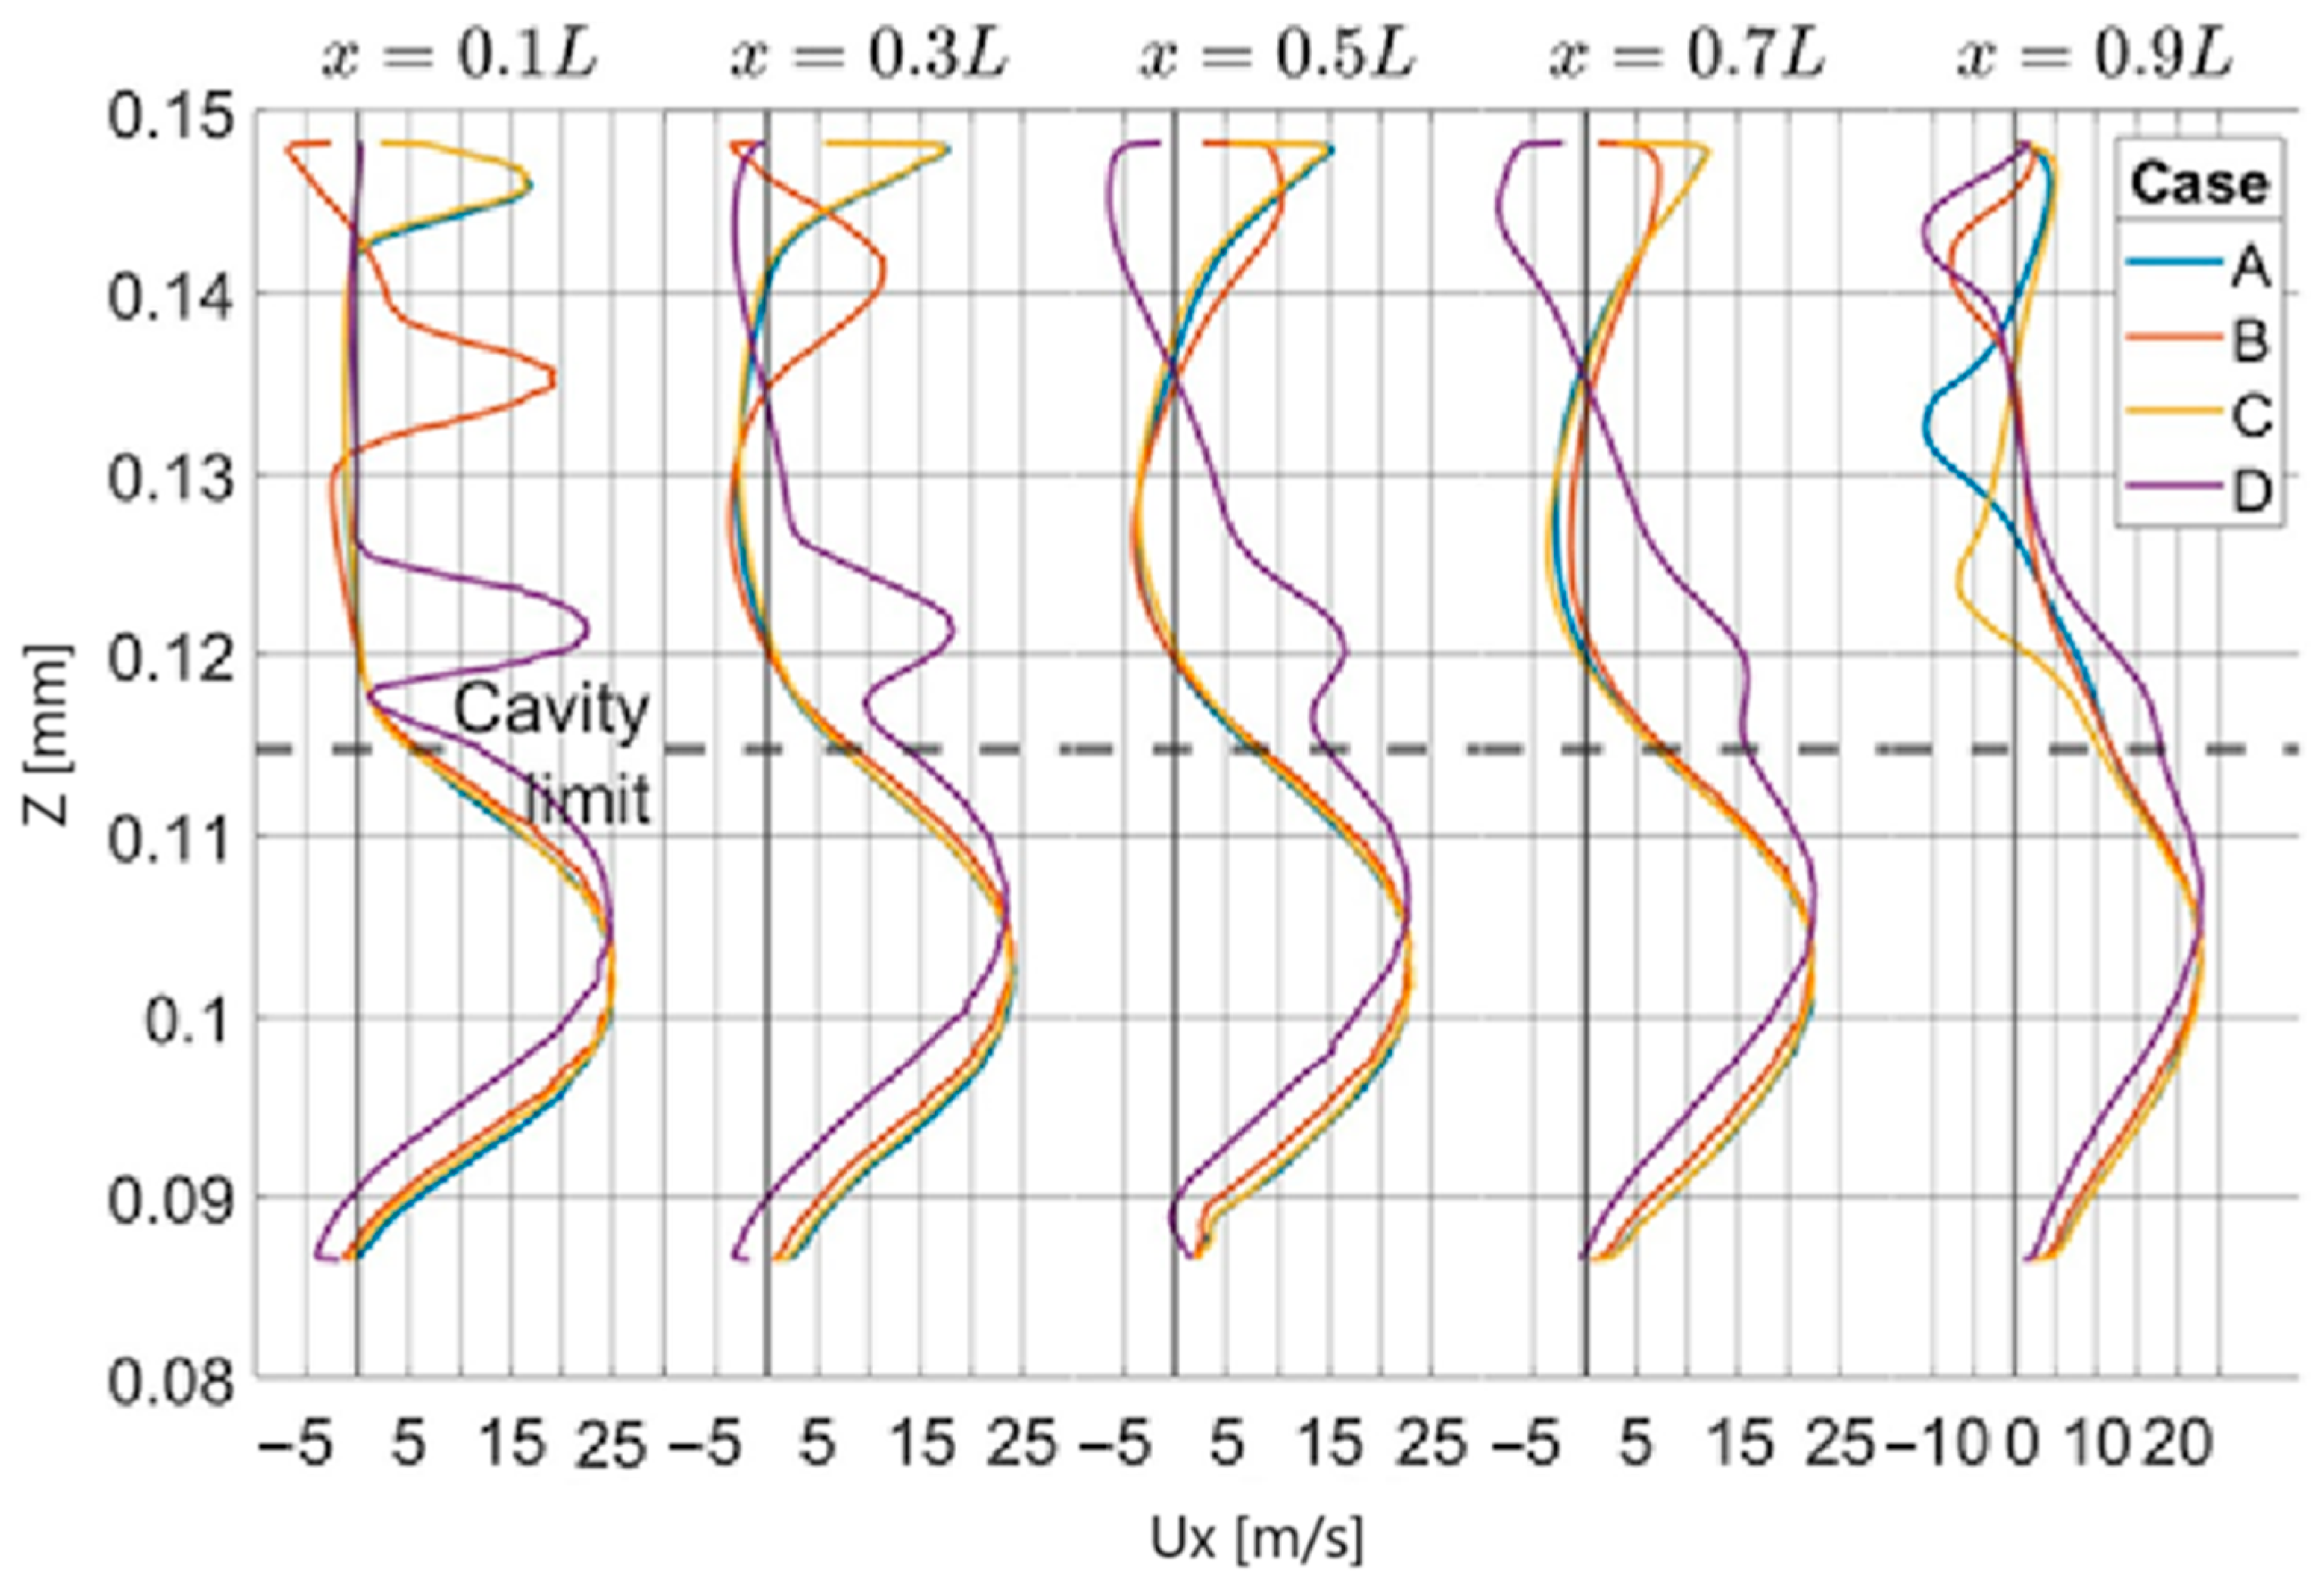
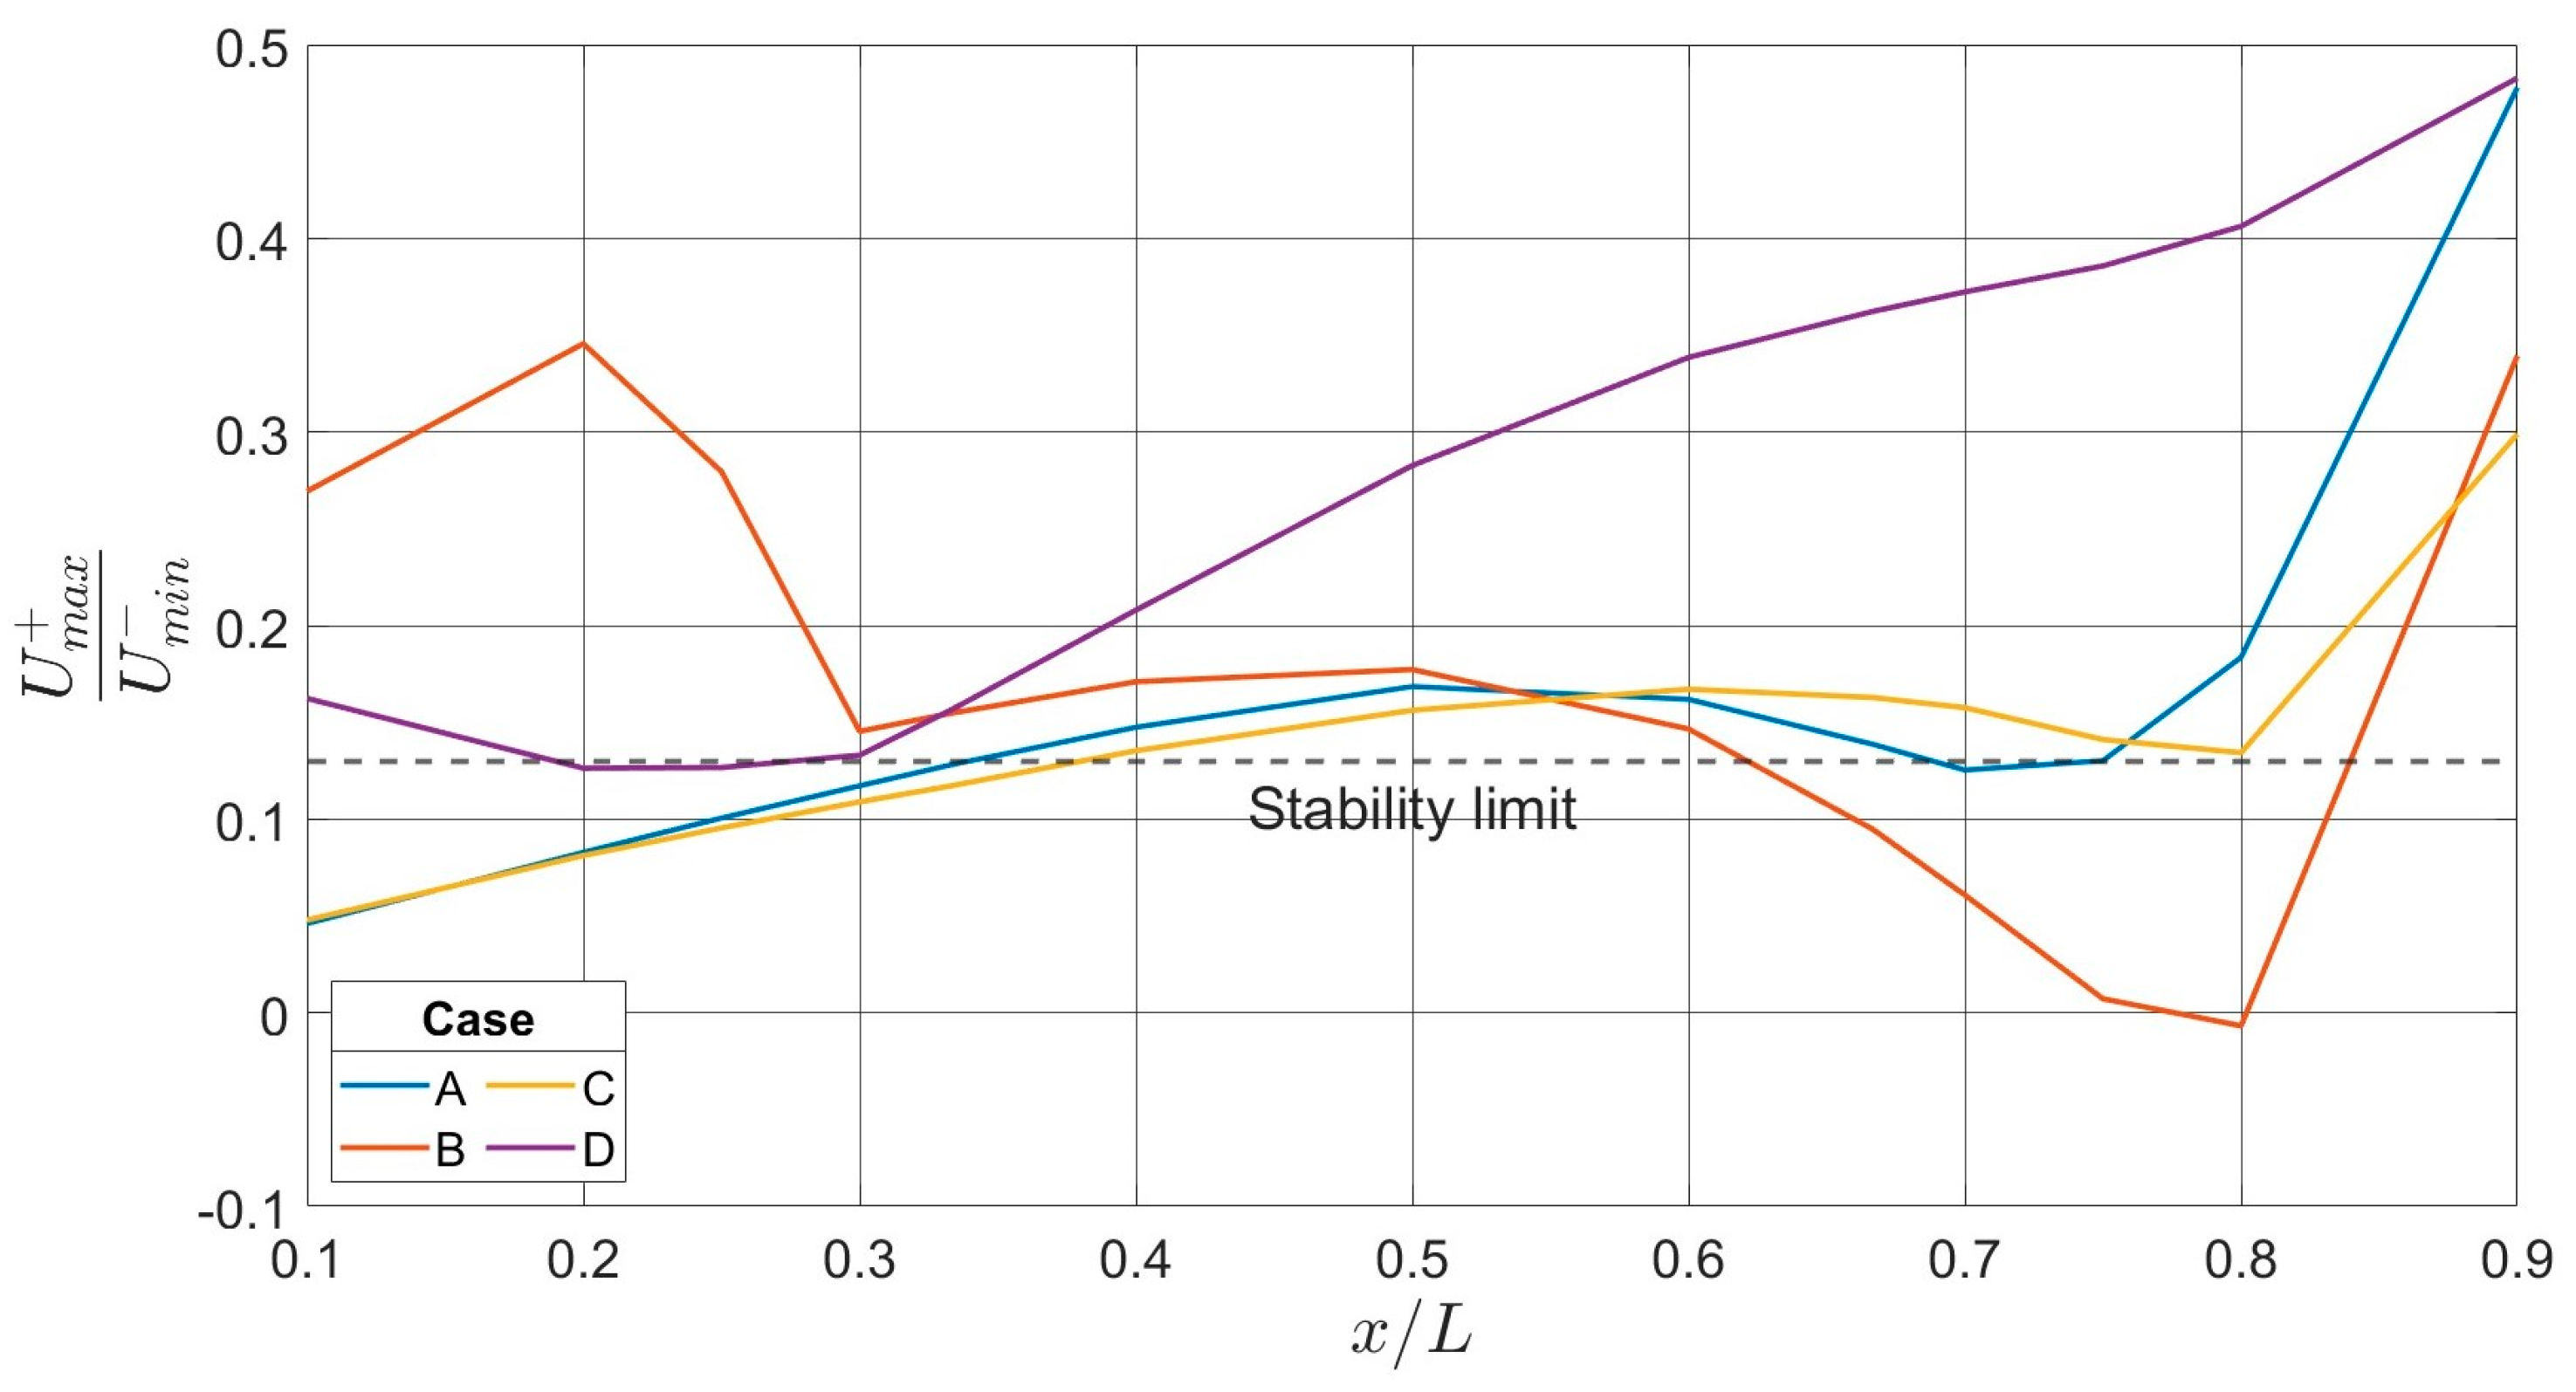
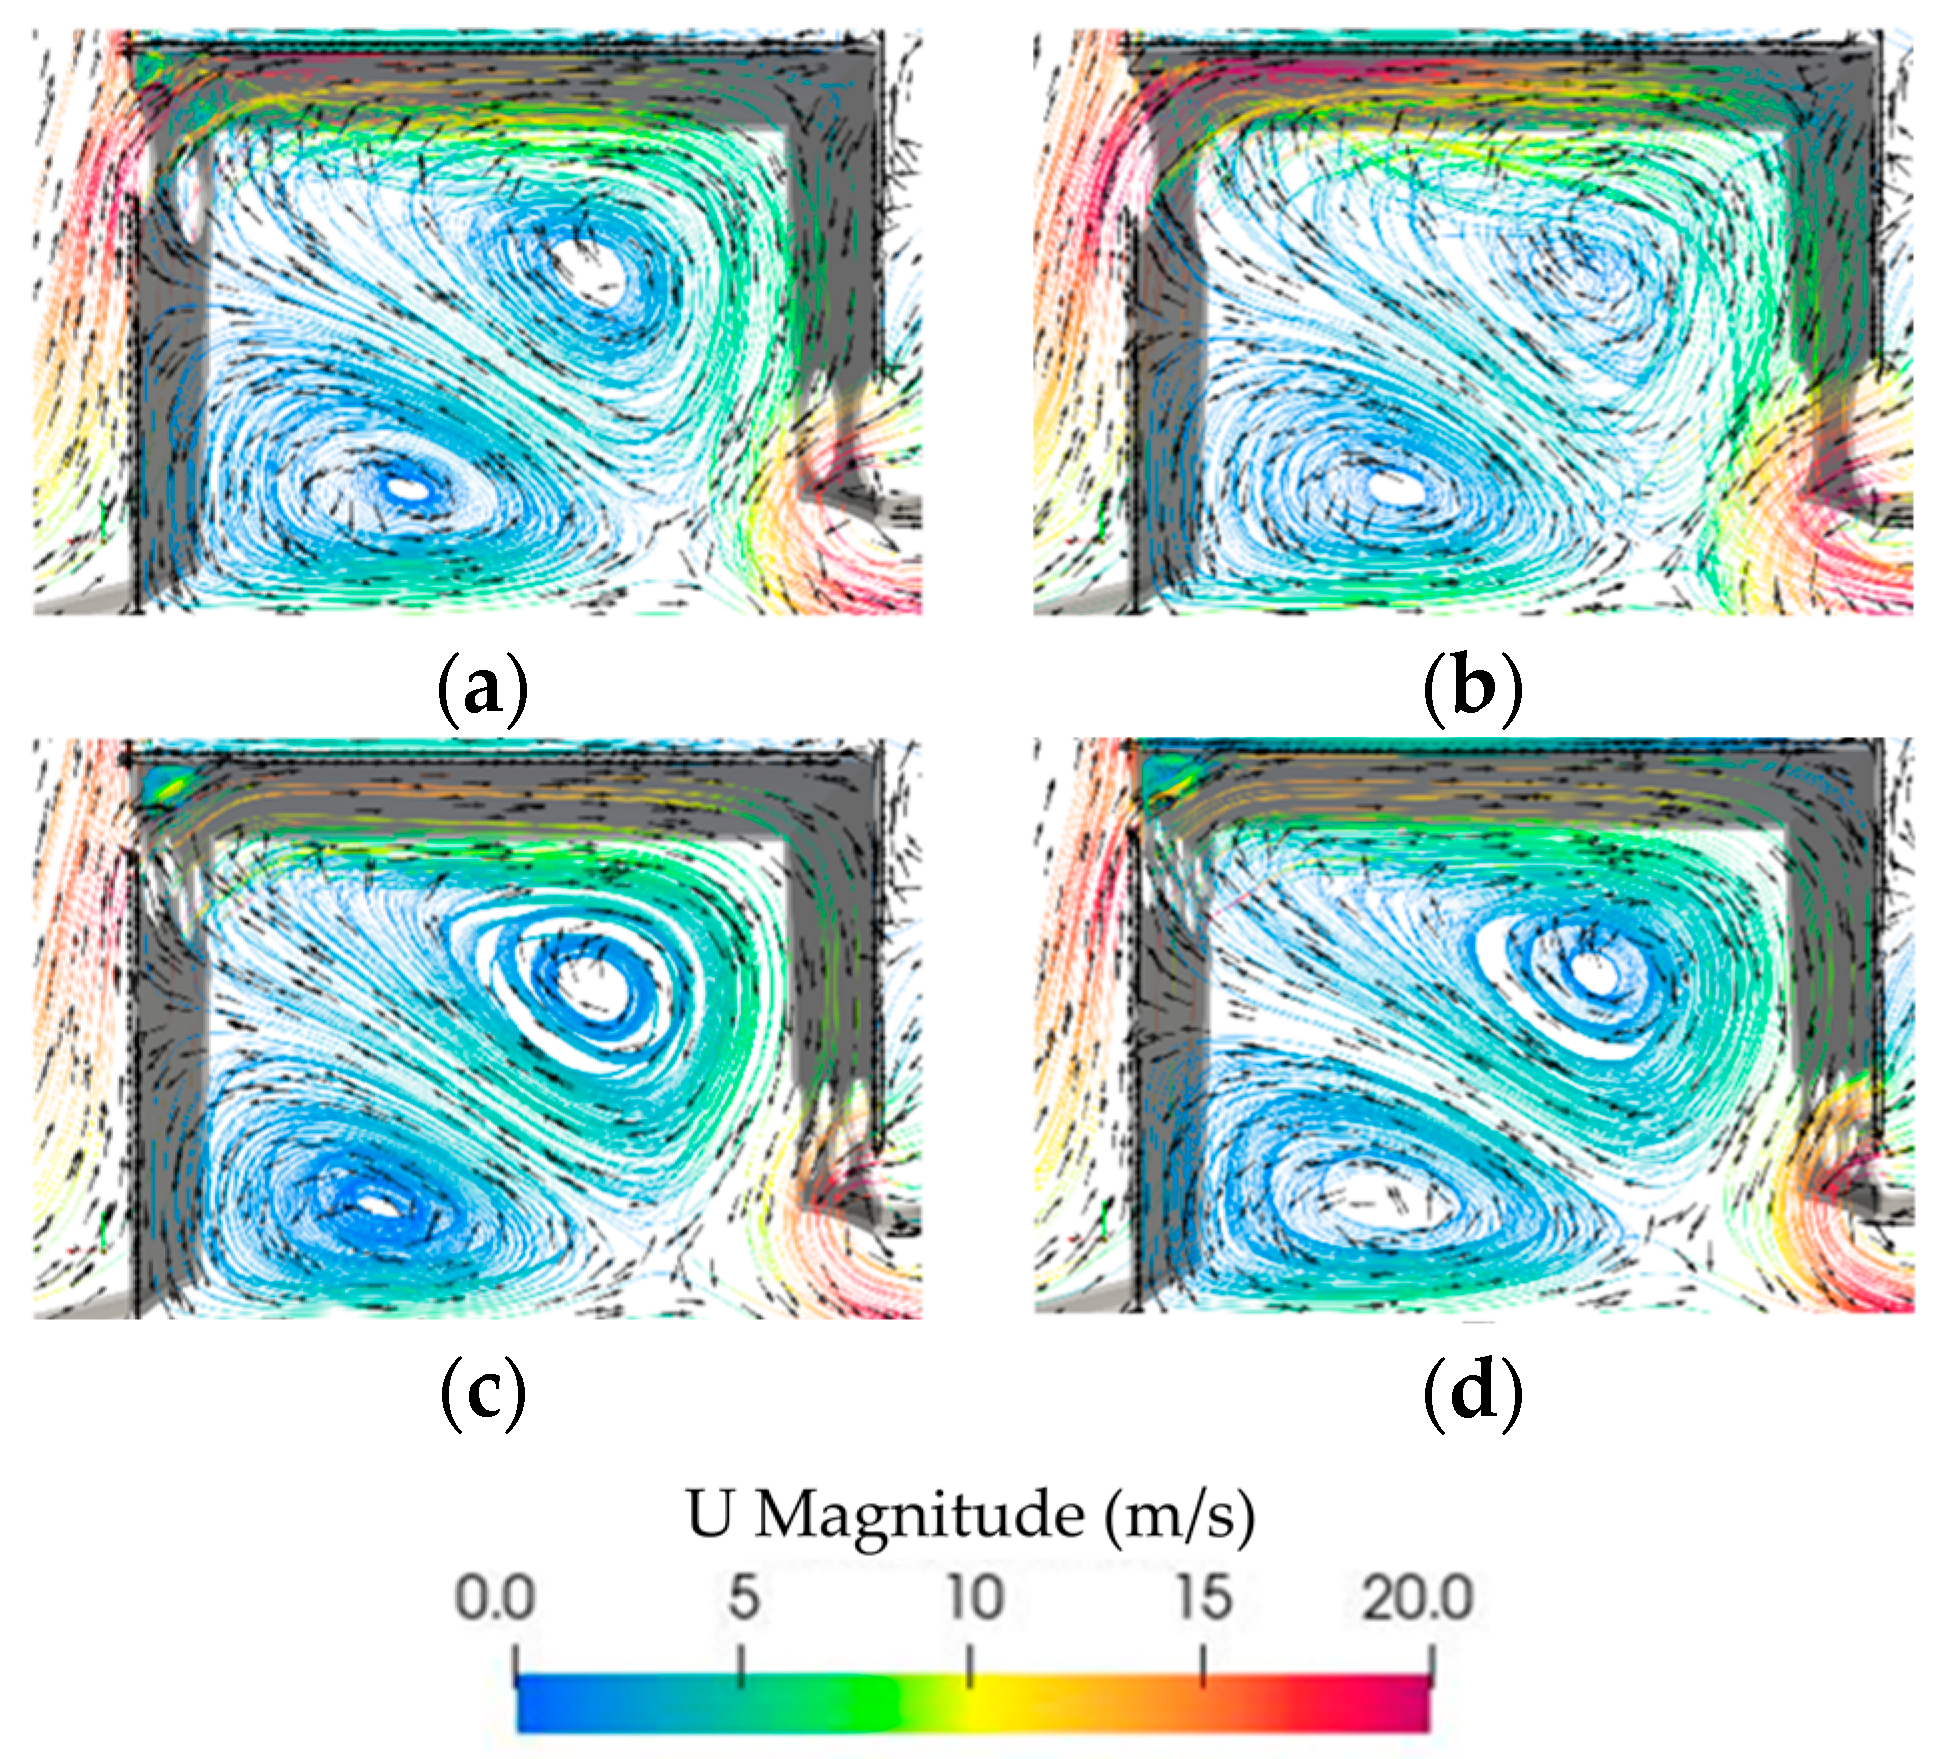
3.1. Results and Discussion for Cases A, B, C, and D

The value for pressure loss in a conventional combustion chamber reported in the specialized literature is in the range of 4% to 6% [30] for the same simulated operating conditions as for the TVC. Therefore, it can be said that the pressure loss for non-reactive flow in the TVC is lower than the pressure loss in a conventional gas turbine.
The value remains constant even for the simulated cases for the TVC [31]. This particularity can be attributed to the fact that for cases A–D, the dimensions and operating conditions in the TVC are the same; therefore, changing the location of the air inlet in the cavity does not have a considerable impact on the pressure loss in the TVC, as can be seen in Figure 7.
The vortex inside the cavity was qualitatively compared for the studied cases using the streamlines, as presented in Figure 8.
It can be observed in Figure 8 that for cases A and C, there are two vortices inside the cavity. The main and bigger one is counterclockwise and is located on the right; its extension goes from the superior to the bottom wall of the cavity and is caused by the main flow at the inlet on the left side. There is also a clockwise secondary vortex located in the bottom left corner. This secondary vortex improves the mixing between the cavity’s combustion gases and the air from the compressor.
In case B, a third vortex is in the upper left corner of the cavity because the main flow inlet has been displaced towards the inferior wall. The two vortices mentioned for A and C are also present for case B. However, for case D, only one vortex is present, occupying almost all the space inside the cavity, and its center is displaced towards the superior right corner because the secondary airflow entering through the holes in the fore wall displaces the main flow vortex, limiting not only its size but also the mixing.
Figure 9 shows the presence of vortex structures using the Q criterion. The Q criterion relates vortices to areas where the magnitude of the vorticity is greater than the magnitude of the deformation rate, mathematically meaning that the second invariant of the velocity gradient tensor has a positive value. In the figure, each white zone identifies a vortex zone [32].
Figure 10 compares the areas occupied by the vortices for cases A, B, C, and D. As can be seen, case C is the one with the highest percentage of the cavity area occupied by vortices. In this sense, more than half of the cavity area is occupied by a vortex zone.
Figure 11 shows the axial velocity profiles at different stages in the axial direction. Cases A and C have similar behavior, but not at stage x = 0.9 L, since in this axial position, the flow is affected by the secondary airflow entering through the holes in the rear wall. However, beyond the rear wall, the influence of the secondary flow is lost. Note that the main vortex can recirculate the secondary flow, enhancing the mixing.
To quantify the stability of the flow in the cavity using the axial velocity, the concept of the ratio of the maximum positive and maximum negative velocities along an axial position is presented in Figure 12. A ratio higher than 0.13 means an unstable flow and a separation point if a vortex is in the axial position [31,33]. The zones with a high ratio are areas with high axial velocity gradients.
For case A, at stages x/L = 0.1 and x/L = 0.3, the velocity ratio is less than 0.13; thus, the flow is stable, and the vortex in this zone has no separation. However, for axial positions x/L = 0.4, 0.5, and 0.7, the value is slightly higher than the instability criterion, but the main and secondary vortices are located in these areas, and there is no separation. For case B, at x/L = 0.1, x/L = 0.2, and x/L = 0.3, the high value of the velocity ratio is due to the high velocity gradient associated with the velocity at the airflow inlet. Small vortex zones are also present. In these cases, there is flow separation in the main vortex.
For x/L = 0.1, x/L = 0.2, x/L = 0.3, and x/L = 0.4 for case C, the behavior is like that of case A. The shear layer and the secondary vortex are stable because the velocity ratio is lower than the stability criterion. Case D has higher values for the velocity ratio; therefore, this case presents more flow instabilities along the cavity.
The best flow stability in the analyzed cases is for case C. Although case A has similar behavior, the main advantage of case C is that the size of the recirculation zone is the largest, and the adverse influence of the flow from the back wall is the smallest. This behavior is the main reason why this configuration was selected in the next part of the analysis for the TVC combustor. In the next paragraphs, the influence of the orifice diameter on flow stabilization is presented considering four different diameters for the injection orifices: 3.5 mm, 4.2 mm, 7.8 mm, and 9.5 mm for the W, X, Y, and Z study cases.

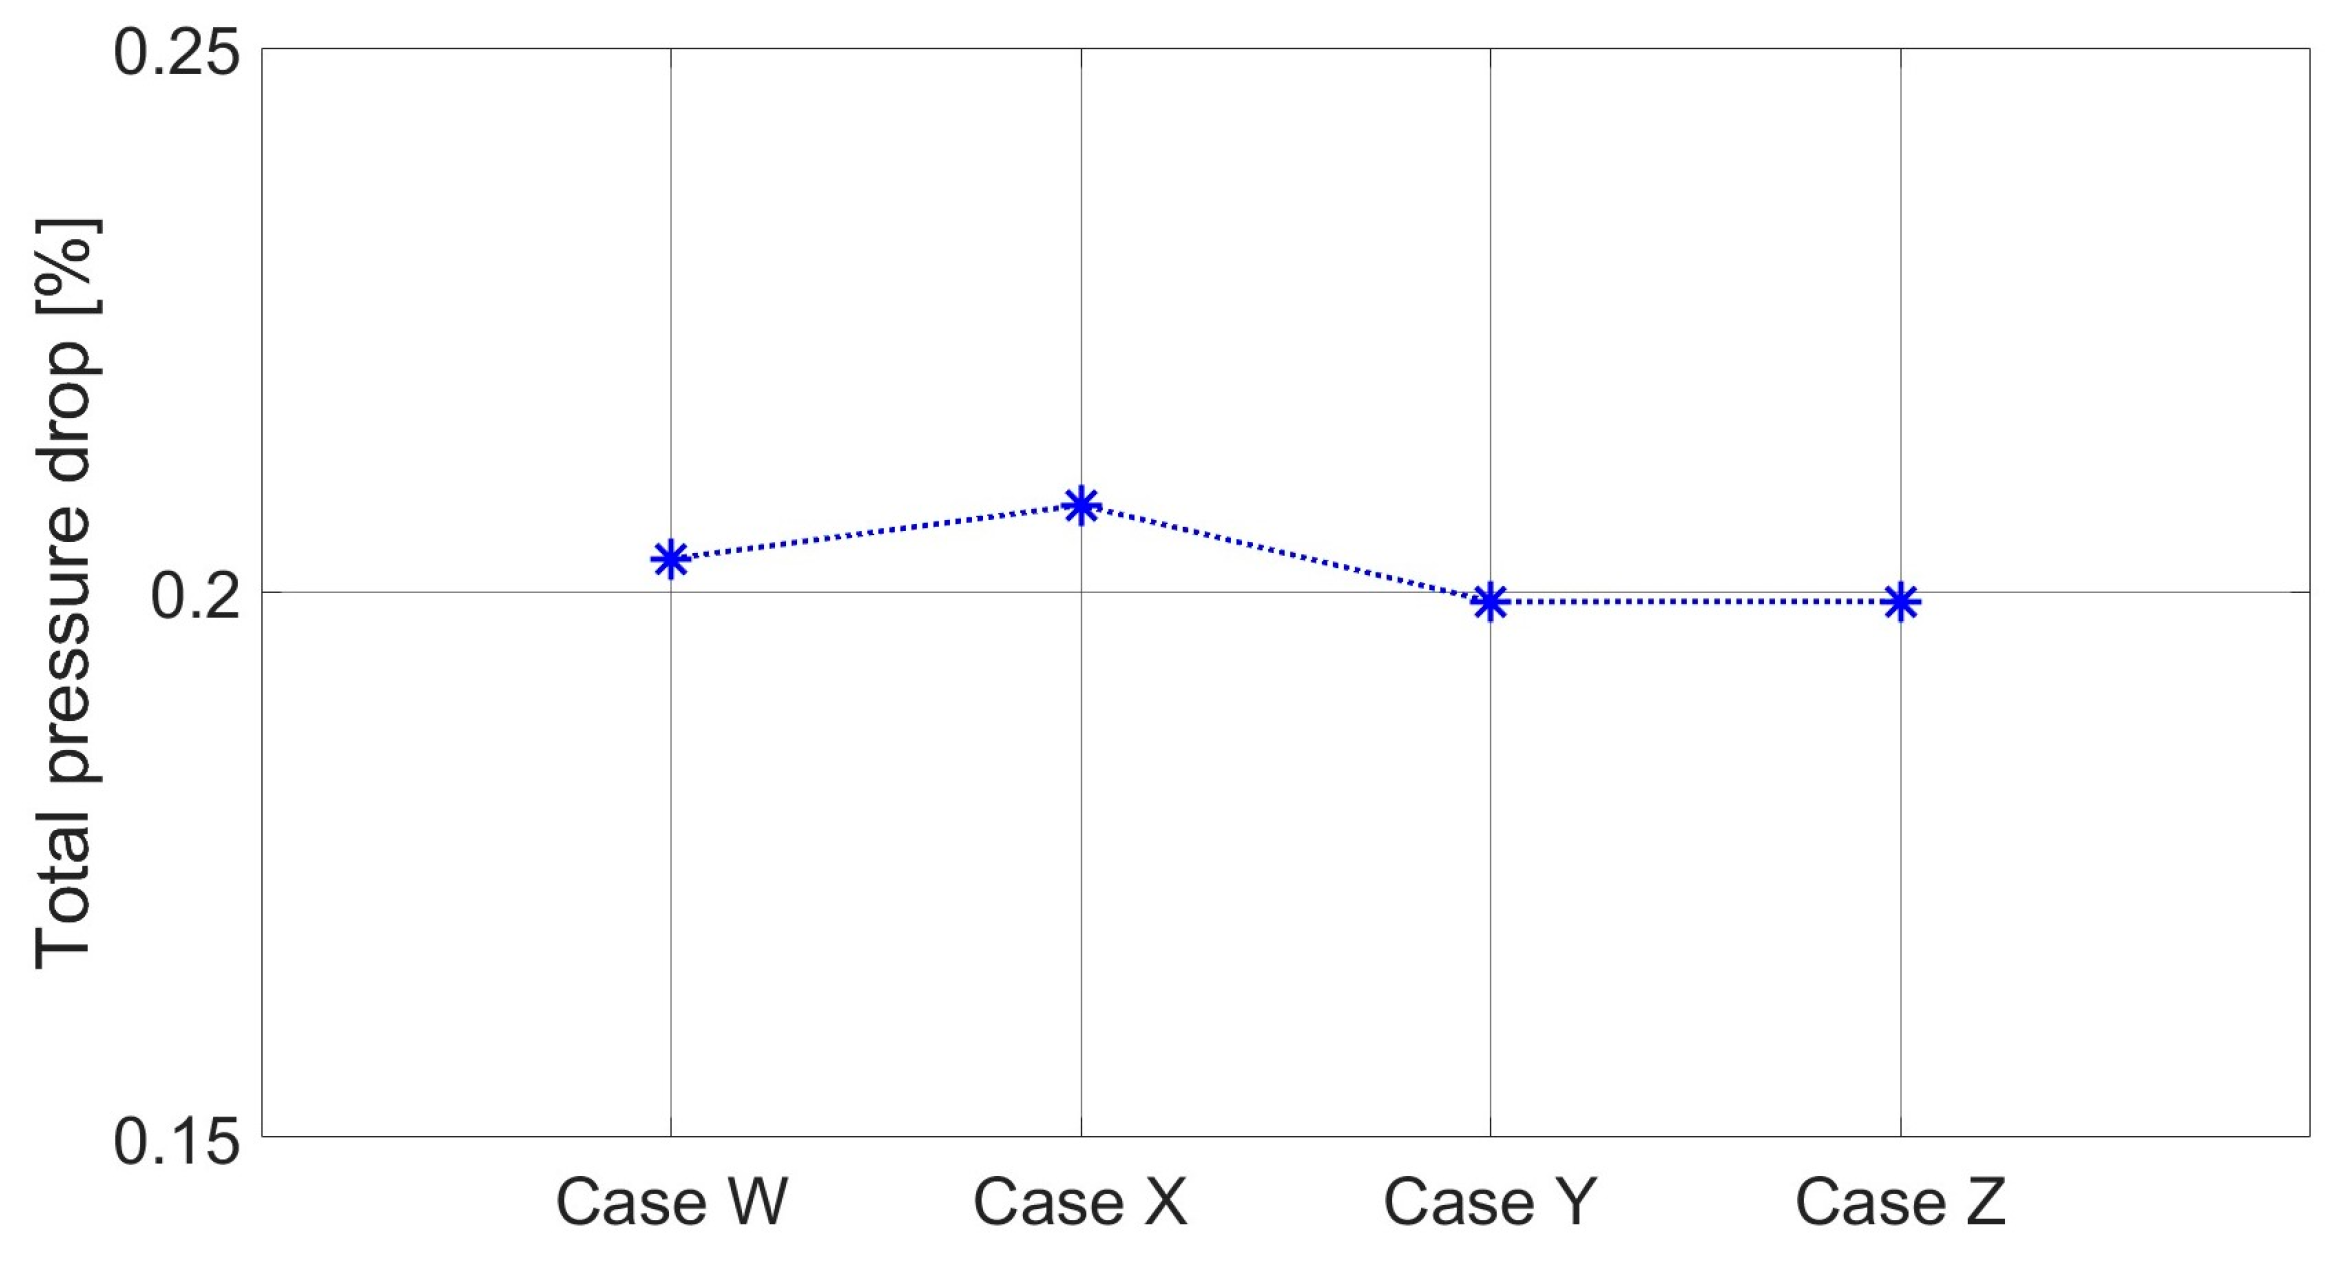
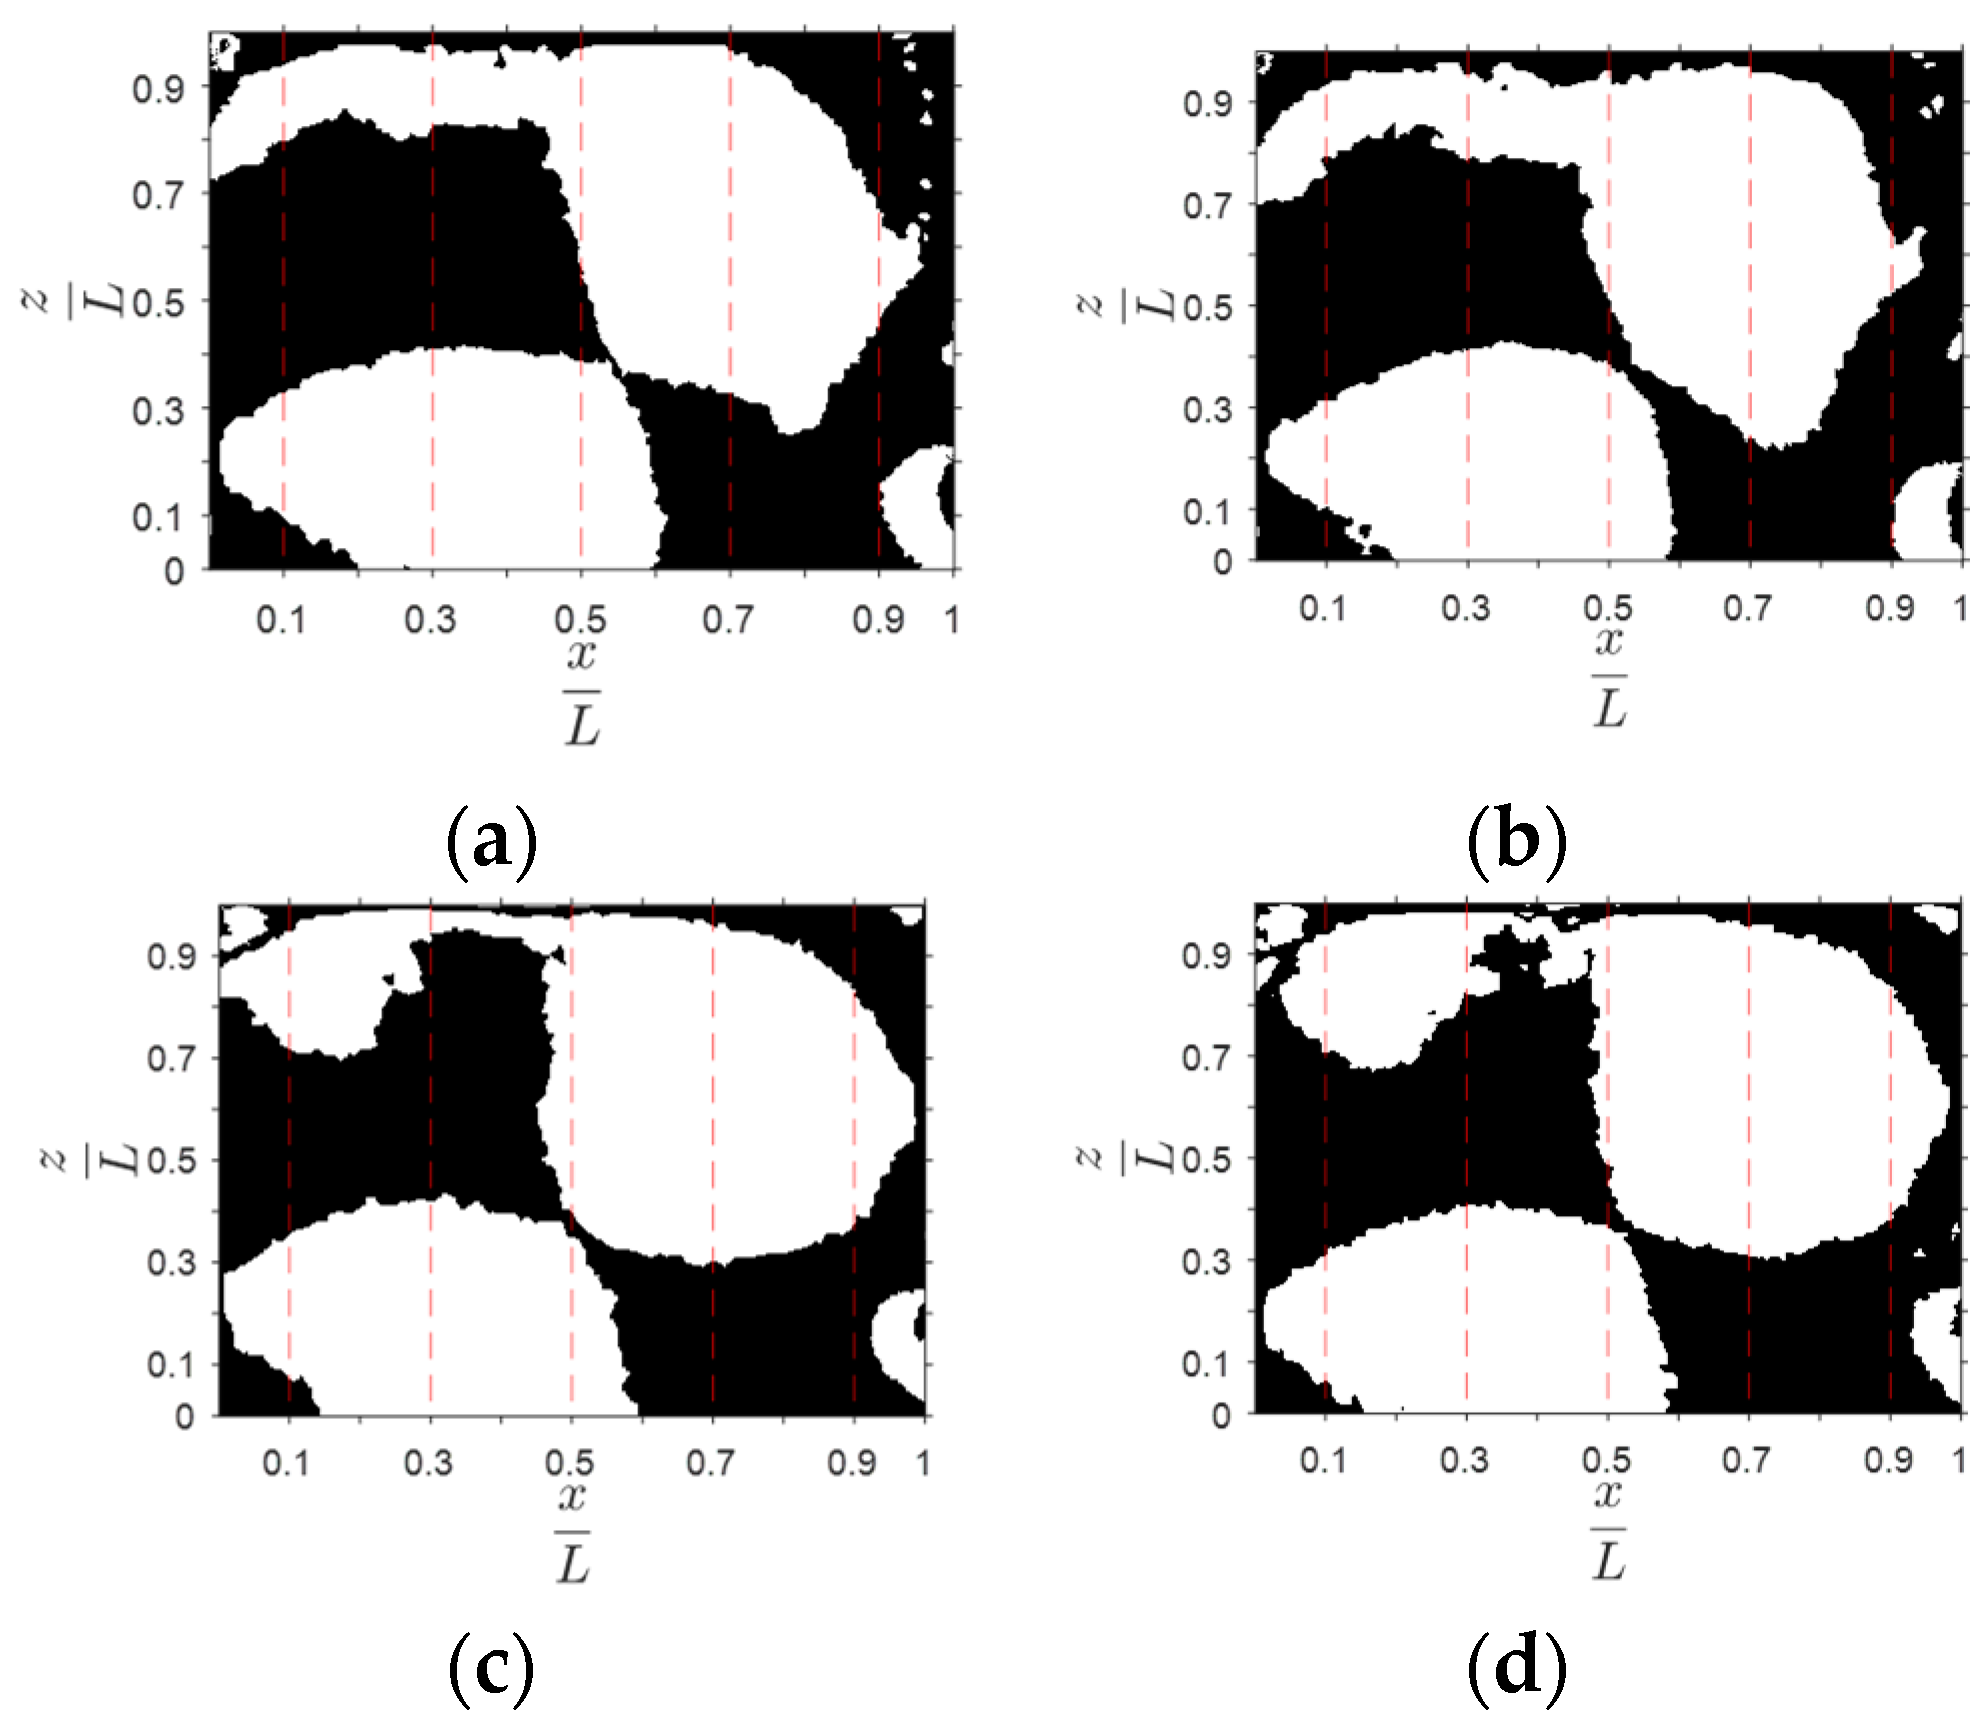
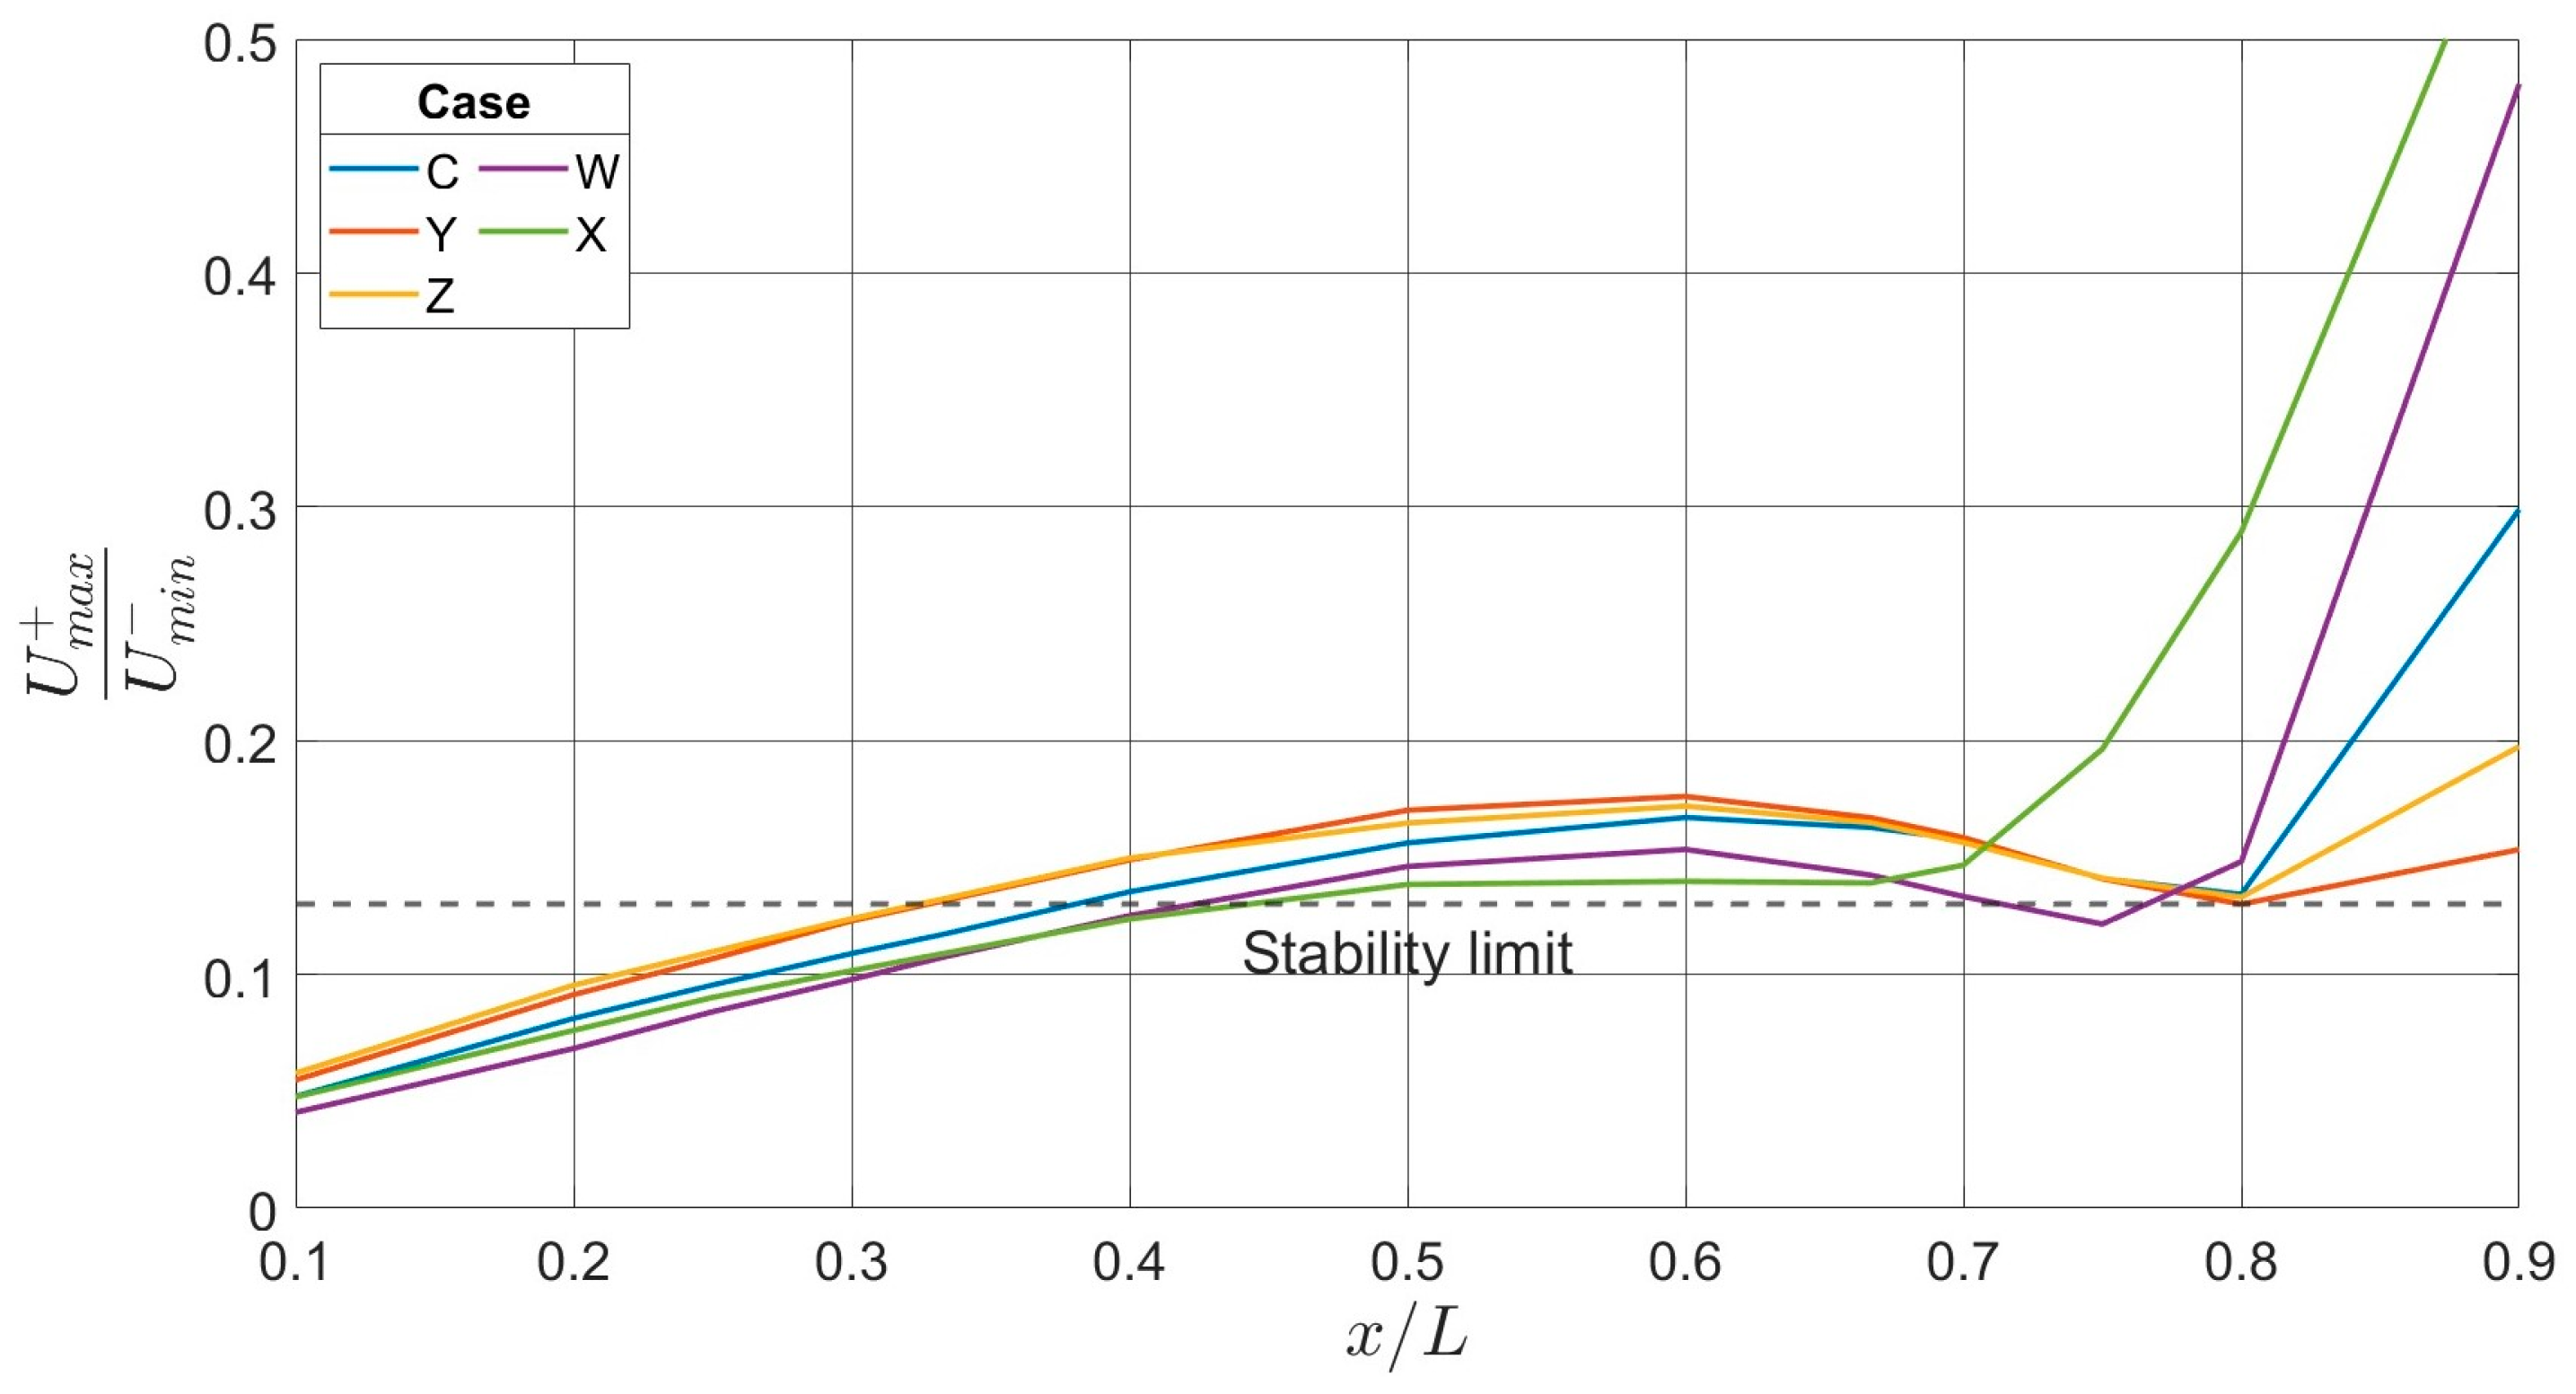
3.2. Results and Discussion for Cases W, X, Y, and Z

Figure 13 shows the total pressure loss for cases W, X, Y, and Z. As mentioned above, changing the configuration of the holes for the secondary flow in the cavity does not have a significant impact on the total pressure loss since the pressure depends on the airflow velocity at the inlet, which, for these cases, remains constant.
Figure 14 shows the presence of two vortex zones. It can also be observed that cases W and X have a more chaotic structure in the main vortex compared with case C. For Y and Z, there are no significant differences in the secondary vortex.
Figure 15 shows the results of applying the Q criterion for identifying recirculation zones to cases W, X, Y, and Z. In all four cases, vortex zones are present, but the size of the recirculation zone is different for each case. Because the location of the injection holes is invariant, the vortex distribution in the cavity is the same for the analyzed cases. Figure 15 confirms that the secondary vortex (smaller vortex) maintains its extension and structure, but the area for the main vortex is slightly modified due to the change in the diameter of the injection holes.
Figure 16 shows the area of the vortex zones occupying the cavity for cases W, X, Y, and Z. As can be seen, the largest area is for case Y, and the smallest area is for case X. Also, case Z shows a bigger zone than case C for the main vortex and a zone of the same size for the secondary vortex. It can be said from Figure 16 that as the hole diameter increases, the vortex zone occupied by the main vortex is smaller. It is not convenient to have a larger orifice diameter than that in the original case (ϕ = 0.006 m). In search of a better mix, what is convenient is to have diameters equal to or smaller than that in the original case.
Figure 17 shows the velocity ratio for different axial positions in the cavity. It can be observed that for x/L < 0.50, there are no noticeable differences in the cases analyzed. However, for x/L > 0.75, there are significant differences, with case X presenting the highest value of the velocity ratio and, therefore, greater flow instabilities in this section. Case X presents an increase in the velocity ratio for x/L > 0.7, but for 0.1 < x/L < 0.7, the velocity ratio is slightly different from the instability limit (0.13).
The sudden increase in the velocity ratio for case C is because the diameter of the injection holes increases, so the velocity of the current flow entering the cavity increases. Therefore, a higher ratio is presented for positive and negative velocities, and the secondary airflow has greater momentum.
This velocity influences positions far from the rear wall of the cavity, increasing the velocity ratio. This behavior is reinforced by the streamlines and the Q criterion showing that the main vortex occupies a significantly smaller area in the W and X cases compared to the C, Y, and Z cases. This result confirms that the positive and negative velocity ratio and the presence of a vortex are related. Since the total area of the injection holes remains constant in the study cases, the change in the main flow velocity produces different mass flow in the holes, so for each configuration, there are different equivalent values for non-reactive flow.
Table 5 compares the air mass flow distribution in the TVC for different hole diameters in the cavity wall.
As the hole diameter increases, a larger amount of secondary flow passes through the cavity through the holes in the wall. This behavior reduces the fuel/air ratio (FAR) in the TVC for reactive flow conditions, reducing the local equivalence ratio.
When the TVC operates with fuel injections, it is considered an RQL scheme [27,31], and the cavity provides all the energy required for combustion, functioning as the primary zone of the combustor. Under this condition, for liquid fuel [27], efficiencies higher than 99% have been found with 1.2 < ϕcavity < 3.8. Furthermore, it has been shown that for ϕcavity ≈ 1.6, as obtained for case Y, the liquid fuel can evaporate entirely inside the cavity, resulting in high-intensity and efficient combustion.
According to the numerical results for non-reactive flow, the combination of the injection holes for case D (0.0042 m) and the Y configuration is the one that has the best behavior for flow stabilization, the most significant recirculation zone, and the best airflow distribution for the TVC.

4. Conclusions

Air injection holes could be a way for the vortex to be enhanced and the flow instabilities in TVCs to be suppressed. Therefore, different locations and diameters of air injection holes were numerically simulated for non-reactive flow conditions for a TVC. Changes in the location and diameter of the injection holes produced differences in the flow behavior inside the TVC, mainly in the position and size of the recirculating zones inside the TVC.
Although variations in the positions of the injection holes and modifications in the hole diameters did not affect the pressure loss, the flow behavior in the cavity was greatly affected by the holes’ positions and diameters. The area occupied by the primary vortex decreased for larger-diameter holes, but the secondary vortex was unaffected by the diameter change.
An optimal combination was found when air injection holes with a diameter of 0.0042 mm were located at the top of the fore wall and the bottom of the rear wall for an RQL operation scheme in the TVC. Also, Case Y presented higher-stability conditions in almost all of the axial positions of the TVC.

Author Contributions

Conceptualization, methodology, validation, writing—original draft, software, L.A.M.P.; formal analysis, investigation, writing—original draft, J.G.B.S. and E.G.L.J.; investigation, validation, visualization, writing—review paper, editing, J.M.T., R.A.G.-L., and M.T.V. All authors have read and agreed to the published version of the manuscript.

Funding

This research was financially supported by the CONAHCYT in the form of scholarships and by the IPN in its SIP researching programs and BEIFI scholarships.

Data Availability Statement

Dataset available on request from the authors.

Conflicts of Interest

The authors declare no conflicts of interest.

Abbreviations

The following abbreviations are used in this manuscript:
HCavity height
LCavity length
m ˙ Air mass flow
PPressure
TTemperature
UAxial velocity
xAxial coordinate, axial direction
yVertical coordinate, vertical direction
zTransverse coordinate, transverse direction
Subscripts
AtTotal area
maxMaximum
minMinimum
t3Total at the combustor inlet
t4Total at the combustor outlet
Greek
ϕDiameter

References

  1. Jin, Y.; Li, Y.; He, X.; Zhang, J.; Jiang, B.; Wu, Z.; Song, Y. Experimental investigations of flow field and combustion characteristics of a model trapped vortex combustor. Appl. Energy 2014, 134, 257–269. [Google Scholar] [CrossRef]
  2. Xing, F.; Zhang, S.; Wang, P.; Fan, W. Experimental investigation of a single trapped-vortex combustor with a slight temperature raise. Aerosp. Sci. Technol. 2010, 14, 520–525. [Google Scholar] [CrossRef]
  3. Jin, Y.; He, X.; Zhang, J.; Jiang, B.; Wu, Z. Experimental study on emission performance of an LPP/TVC. Chin. J. Aeronaut. 2012, 25, 335–341. [Google Scholar] [CrossRef]
  4. Singhal, A.; Ravikrishna, R.V. Single cavity trapped vortex combustor dynamics-Part 1: Experiments. Int. J. Spray Combust. Dyn. 2011, 3, 23–44. [Google Scholar] [CrossRef]
  5. Katta, V.R.; Roquemore, W.M. Numerical studies on trapped-vortex concepts for stable combustión. In Proceedings of the ASME-Turbo Asia Conference, Jakarta, Indonesia, 5–7 November 1996. [Google Scholar]
  6. Li, M.; He, X.; Zhao, Y.; Jin, Y.; Yao, K.; Ge, Z. Performance enhancement of a trapped-vortex combustor for gas turbine engines using a novel hybrid-atomizer. Appl. Energy 2018, 216, 286–295. [Google Scholar] [CrossRef]
  7. Ezhil Kumar, P.K.; Mishra, D.P. Numerical simulation of cavity flow structure in an axisymmetric trapped vortex combustor. Aerosp. Sci. Technol. 2012, 21, 16–23. [Google Scholar] [CrossRef]
  8. Zhu, Y.; Jin, Y.; He, X. Effects of location and angle of primary injection on the cavity flow structure of a trapped vortex combustor model. Optik 2019, 180, 699–712. [Google Scholar] [CrossRef]
  9. Zhang, R.C.; Hao, F.; Fan, W.J. Combustion and stability characteristics of ultra-compact combustor using cavity for gas turbines. Appl. Energy 2018, 225, 940–954. [Google Scholar] [CrossRef]
  10. Zhang, R.; Fan, W. Experimental study of entrainment phenomenon in a trapped vortex combustor. Chin. J. Aeronaut. 2013, 26, 63–73. [Google Scholar] [CrossRef]
  11. Singhal, A.; Ravikrishna, R.V. Single cavity trapped vortex combustor dynamics-Part 2: Simulations. Int. J. Spray Combust. Dyn. 2011, 3, 45–62. [Google Scholar] [CrossRef]
  12. Zhao, D.; Gutmark, E.; Goey, P. A review of cavity-based trapped vortex, ultra-compact, high-g, inter-turbine combustors. Prog. Energy Combust. Sci. 2018, 66, 42–82. [Google Scholar] [CrossRef]
  13. Xing, F.; Wang, P.; Zhang, S.; Zou, J.; Zheng, Y.; Zhang, R.; Fan, W. Experiment and simulation study on lean blow-out of trapped vortex combustor with various aspect ratios. Aerosp. Sci. Technol. 2012, 18, 48–55. [Google Scholar] [CrossRef]
  14. Liu, Y.Y.; Li, R.M.; Liu, H.X.; Yang, M.L. Effects of Fueling Scheme on the Performance of a Trapped Combustor Rig. In Proceedings of the 45th AIAA/ASME/SAE/ASEE Joint Propulsion Conference, Denver, CO, USA, 2–5 August 2009. [Google Scholar]
  15. Ezhil Kumar, P.K.; Mishra, D.P. Flame Stability Characteristics of Two-Dimensional Trapped Vortex Combustor. Combust. Sci. Technol. 2016, 188, 1283–1302. [Google Scholar] [CrossRef]
  16. Ezhil Kumar, P.K.; Mishra, D.P. Numerical study of reacting flow characteristics of a 2D twin cavity trapped vortex combustor. Combust. Theory Model. 2017, 21, 658–676. [Google Scholar] [CrossRef]
  17. Guo, Y.; Gong, C.; Huang, Y.; Duan, F.; He, X. Combustion and emission performance of swirling-flow single trapped vortex combustor. Appl. Therm. Eng. 2017, 236, 121678. [Google Scholar] [CrossRef]
  18. Zhao, Y.; Gong, C.; Li, M. Effect of air-injection mode on mainstream-forced entrainment and combustion characteristics of a cavity-based combustor. Phys. Fluids 2024, 36, 087128. [Google Scholar] [CrossRef]
  19. Sharifzadeh, R.; Afshari, A. Numerical investigation of flow field effects on fuel–air mixing in a non-reacting trapped vortex combustor with different injection arrangements. Eur. J. Mech./B Fluids 2020, 82, 106–122. [Google Scholar] [CrossRef]
  20. Burrus, D.L.; Roquemore, W.M.; Johnson, A.W.; Shouse, D.T. Performance Assessment of a Prototype Trapped Vortex Combustor Concept for Gas Turbine Application. In Proceedings of the ASME-IGTI, New Orleans, LA, USA, 4–7 June 2001. [Google Scholar]
  21. Roquemore, W.; Shouse, D.; Burrus, D.; Johnson, A.; Cooper, C.; Duncan, B.; Hsu, K.-Y.; Katta, V.; Sturgess, G.; Vihinen, I. Trapped vortex combustor concept for gas turbine engines. In Proceedings of the 39th Aerospace Sciences Meeting and Exhibit, Reno, NV, USA, 8–11 January 2001. [Google Scholar] [CrossRef]
  22. Zhang, R.; Fan, W.; Shi, Q.; Tan, W. Structural design and performance experiment of a single vortex combustor with single-cavity and air blast atomisers. Aerosp. Sci. Technol. 2014, 39, 95–108. [Google Scholar] [CrossRef]
  23. Mishra, D.P.; Sudharshan, R. Numerical analysis of fuel-air mixing in a two-dimensional trapped vortex combustor. Proc. Inst. Mech. Eng. Part G J. Aerosp. Eng. 2010, 224, 65–75. [Google Scholar] [CrossRef]
  24. Reddy, J.N.; Anand, N.K.; Roy, P. Finite Element and Finite Volume Methods for Heat Transfer and Fluid Dynamics; Cambridge University Press: Cambridge, UK, 2023. [Google Scholar]
  25. Roache, P.J. Quantification of uncertainty in computational fluid dynamics. Annu. Rev. Fluid Mech. 1997, 29, 123–160. [Google Scholar] [CrossRef]
  26. Celik, I.B.; Ghia, U.; Roache, P.J.; Freitas, C.J.; Coleman, H.; Raad, P.E. Procedure for estimation and reporting of uncertainty due to discretization in CFD applications. J. Fluids Eng. Trans. ASME 2008, 130, 0780011–0780014. [Google Scholar] [CrossRef]
  27. Jin, Y.; He, X.; Zhang, J.; Jiang, B.; Wu, Z. Numerical investigation on flow structures of a laboratory-scale trapped vortex combustor. Appl. Therm. Eng. 2014, 66, 318–327. [Google Scholar] [CrossRef]
  28. Li, M.; He, X.; Zhao, Y.; Jin, Y.; Ge, Z.; Sun, Y. Dome structure effects on combustion performance of a trapped vortex combustor. Appl. Energy 2017, 208, 72–82. [Google Scholar] [CrossRef]
  29. Vengadesan, Y.; Sony, C. Enhanced vortex stability in trapped vortex combustor. Aeronaut. J. 2010, 114, 333–337. [Google Scholar]
  30. Lefebvre, A.H.; Ballal, D.R. Gas Turbine Combustions: Alternative Fuels and Emissions; CRC Press: Boca Raton, FL, USA, 2010. [Google Scholar]
  31. Agarwal, K.K.; Ravikrishna, R.V. Experimental and numerical studies in a compact trapped vortex combustor: Stability assessment and augmentation. Combust. Sci. Technol. 2011, 183, 1308–1327. [Google Scholar] [CrossRef]
  32. Zhan, J.M.; Li, Y.T.; Onyx Wai, W.H.; Hu, W.Q. Comparison between the Q criterion and Rortex in the application of an in-stream structure. Phys. Fluids 2019, 31, 121701-1–121701-7. [Google Scholar] [CrossRef]
  33. Elliott, G.S.; Samimy, M. Compressibility effects in free shear layers. Phys. Fluids A 1990, 2, 1231–1240. [Google Scholar] [CrossRef]
Figure 1. (a) A 15° section of the tube flame for the TVC, (b) a cross-section of the TVC casing, and (c) a cross-section of the flame tube.
Aerospace 12 00264 g001
Figure 2. Different positions for the locations of the air holes in the cavity shown in cross-sectional views: (a) case A, (b) case B, (c) case C, and (d) case D.
Aerospace 12 00264 g002
Figure 3. Sectors of the frontal view of the cavity: (a) case W, (b) case X, (c) case Y, and (d) case Z.
Aerospace 12 00264 g003
Figure 4. Axial velocity profiles for different grid sizes.
Aerospace 12 00264 g004
Figure 5. Lateral view for grid G4 with 5 × 10⁶ nodes.
Aerospace 12 00264 g005
Figure 6. Numerical validation at different axial positions.
Aerospace 12 00264 g006
Figure 7. Pressure drops in the combustor in cases A, B, C, and D.
Aerospace 12 00264 g007
Figure 8. Flow structures in the cavity: (a) case A, (b) case B, (c) case C, and (d) case D.
Aerospace 12 00264 g008
Figure 9. Q criterion vortex identification results: (a) case A, (b) case B, (c) case C, and (d) case D.
Aerospace 12 00264 g009
Figure 10. Comparison of the vortex sizes for cases A, B, C, and D.
Aerospace 12 00264 g010
Figure 11. Axial velocity profiles for the cavity in cases A, B, C, and D.
Aerospace 12 00264 g011
Figure 12. Maximum and minimum axial velocities ratio for the cavity in cases A, B, C, and D.
Aerospace 12 00264 g012
Figure 13. Pressure drops in the combustor in cases W, X, Y, and Z.
Aerospace 12 00264 g013
Figure 14. Flow structures in the cavity: (a) case W, (b) case X, (c) case Y, and (d) case Z.
Aerospace 12 00264 g014
Figure 15. Q criterion vortex identification results: (a) case W, (b) case X, (c) case Y, and (d) case Z.
Aerospace 12 00264 g015
Figure 16. Comparison of the vortex size for cases C, W, X, Y, and Z.
Aerospace 12 00264 g016
Figure 17. Maximum and minimum axial velocities ratio for the cavity in cases W, X, Y, and Z.
Aerospace 12 00264 g017
Table 1. Operating parameters for the TVC [22].
ParameterValue
Air mass flow m ˙ A t 3.3   k g s
Temperature at the combustor inlet T t 3 650   K
Total pressure P t 3 1400   k P a
Temperature at the combustor outlet T t 4 1400 K
Table 2. Configurations for different hole diameters in the cavity.
Configuration Hole   Diameter   m Holes by Row
Original 0.006 120
W 0.0078 72
X 0.0095 48
Y 0.0042 240
Z 0.0035 360
Table 3. Grid sizes evaluated for the grid independence study.
G 1 G 2 G 3 G 4 G 5
Cells 7,195,663 6,589,762 5,863,447 5,020,880 4,289,118
Negative cells 0 0 0 0 0
Orthogonality 0.152 0.15 0.153 0.15 0.158
Maximum skewness 0.839 0.841 0.85 0.847 0.849
Computing time 12.92   h 11.46   h 7.80   h 7.4   h 7.19   h
Table 4. Grid size parameters.
ParameterValue
Element size 2.5   m m
Growing rate 1.25
Minimum number of cells in the aperture 5
Skewness 0.8
Inflation methods S m o o t h t r a n s i t i o n
Inflation layers 7
Table 5. Mass flow distributions in the combustion chamber for different hole diameters.
C a s e   Z C a s e   Y C a s e   C C a s e   W C a s e   X
Hole   diameter   m m 0.0035 0.0042 0.006 0.0078 0.0095
Number of holes in the cavity 360 240 120 72 48
Primary   mass   flow   % 67.063 67.153 66.826 66.968 67.004
Sec ondary   mass   flow   % 32.937 32.847 33.174 33.032 32.996
Mass   flow   through   the   cavity   by   the   holes   % 23.592 19.946 18.122 24.7395 24.881
F A R c a v i t y 0.09452 0.1118 0.1231 0.0901 0.0896
ϕ c a v i t y 1.4279 1.689 1.8589 1.3617 1.354
Disclaimer/Publisher’s Note: The statements, opinions and data contained in all publications are solely those of the individual author(s) and contributor(s) and not of MDPI and/or the editor(s). MDPI and/or the editor(s) disclaim responsibility for any injury to people or property resulting from any ideas, methods, instructions or products referred to in the content.

