Article

Online Estimation Method and Verification of Sampling Mass for Lunar Drilling in the Chang’E-6 Mission

1
State Key Laboratory of Robotics and System, Harbin Institute of Technology, Harbin 150001, China
2
Beijing Institute of Spacecraft System Engineering, Beijing 100094, China
3
Beijing Spacecrafts, Beijing 100090, China
*
Author to whom correspondence should be addressed.
Aerospace 2025, 12(4), 331; https://doi.org/10.3390/aerospace12040331
Submission received: 26 February 2025 / Revised: 2 April 2025 / Accepted: 10 April 2025 / Published: 11 April 2025
(This article belongs to the Section Astronautics & Space Science)

Abstract

:
The Chang’E-6 lunar mission successfully collected the lunar back surface and subsurface lunar regolith by excavating and drilling and returned the lunar regolith samples to the earth. Drilling–sampling system exhibits highly nonlinear characteristics due to the stratified structure of lunar regolith and unknown physical property parameters, making it prone to abnormal operating conditions and sampling disturbances. Furthermore, constrained by extraterrestrial environmental limitations, the system can only obtain health parameters, operational protocol parameters, and drilling status parameters while lacking direct measurement data on sampling mass. The development of online estimation methods for sampling mass under nonlinear and under-sensing characteristics poses significant technical challenges. Based on the mechanism of machine–regolith interaction and the experimental data of ground drilling and sampling, this paper constructs a sampling status identification model and a fuzzy pre-judgment model of sampling mass based on the downhole WOB based on the response characteristic parameters of the drilling–sampling stage. According to the telemetry data of Chang’E-6 lunar surface drilling–coring operation, the drilling–sampling mass is predicted to be 292.4 g, and the error between the predicted result and the actual sampling mass of 320 g is within 10%. This estimation method provides a new idea for the prediction of the fidelity sampling efficiency of extraterrestrial objects.

1. Introduction

As the closest celestial body to the Earth, the moon is an important outpost for space exploration [1]. The lunar surface and its deep layers contain abundant resources and valuable information resources, making lunar exploration a globally recognized scientific priority [2]. The course of lunar exploration can be divided into three phases: Earth-based observation, orbital remote sensing, and in situ surface exploration. Earth-based observation phase mainly relies on telescopes and ground-based radars (GBR) to initially analyze the topography of the lunar surface and orbital parameters, with relatively low precision [3]. In the orbital remote sensing phase, high-resolution observation of the whole lunar surface was realized by carrying spectrometers and other payloads onboard orbiting vehicles. The lunar orbiter program implemented by the United States (1966–1967) systematically obtained high-precision images of the whole Moon, and the SMART-1 probe (2003) launched by ESA completed the verification of new space technology such as solar-powered ion-propulsion technology while orbiting the Moon for exploration [4].
Entering the stage of in situ exploration, countries have realized refined exploration of local areas through lunar landers and rovers. The U.S. has completed six manned lunar landings and artificial sampling missions through the Apollo mission, and the Lunar mission (Russia) has realized three unmanned sample return missions; since the 21st century, Chang’E-5 has successfully landed and obtained young basalt samples, and revised the time limit of the moon’s volcanic activity to 2 billion years [5,6]; Japan’s SLIM mission (2024) has broken through with 100 m accuracy for targeted lunar landing technology, and India’s Chandrayaan-3 mission (2024) has achieved the first soft landing near the South Pole [7,8]. Currently, only the United States, the Soviet Union/Russia, and China have mastered lunar surface sample-return technology, and among the many exploration models, the Chang’E-6 probe (2024) realized the first lunar backside sampling, drilling a 320 g in situ sample.
The lunar far side cannot be observed from Earth because of the equal period of revolution and rotation. It preserves the original landform and ancient rock and contains rich geological information [9,10]. The first acquisition of in situ sequence lunar regolith by the Chang’E-6 and its return to the earth can not only obtain the physical and chemical properties of lunar regolith but also provide information on lunar regolith thickness, sequence structure, and density distribution. This will provide important data for the study of the early history of the moon and the earth, and reveal the formation and evolution history of the moon [11,12,13].
In the six Apollo manned lunar missions in the United States, astronauts collected a total of 381.7 kg of lunar regolith samples through hollow thin-walled tubes and hand-held rotary percussive drilling tools. They only relied on the drilling reaction force to artificially determine the drilling conditions, it is impossible to judge the sampling status in the current drilling operation stage in real time [14,15,16,17]. A total of 0.32 kg lunar regolith samples were collected by the Soviet Union’s Luna series of automatic lunar drilling and coring missions. Among them, Luna 20 and Luna 24 terminated the sampling mission in advance due to harsh working conditions [18,19]. A total of 1731 g lunar regolith samples were successfully collected by the Chang’E-5 mission in China by means of excavating and drilling. Similar to the Luna series, Chang’E-5 lacks real-time identification and pre-judgment of drilling–sampling status during the drilling operation stage, as well as quantitative evaluation of sampling indicators, resulting in the inability to accurately determine the sampling status and sampling mass [20,21,22].
Drilling–sampling is a highly uncertain and nonlinear physical system. The current research mainly focuses on two aspects: ① Using the traditional system identification algorithm or artificial intelligence technology, the identification model is constructed according to the load parameters to judge the sampling state information (such as drillability, compactness, etc.); ② By analyzing the on-orbit data and ground historical tests, sudden events such as plugging and sticking of the load parameters under stable or disturbed conditions are studied to optimize the drilling procedures [23,24,25]. However, there is a lack of real-time estimation models for sampling mass. At the same time, due to the lack of understanding of the subsurface structure of lunar regolith, it is still a major challenge to establish an accurate sampling mass estimation model [26,27].
In this paper, the physical model of drilling–coring is constructed based on the analysis of the mechanism of regolith–machine interaction. Based on the ground verification data, the SVM sampling status identification model based on drilling load parameters and the sampling mass prediction model based on downhole WOB are studied. The estimation model can realize the real-time estimation of the sampling mass in the drilling and drilling operation stage, the auxiliary identification of the particle event, and the suggestion of the drilling force threshold at the bottom of the hole under the high injection target. In addition, the real-time estimation model effectively supports the adjustment of more efficient drilling–sampling procedures and provides a basis for reasonable ground decision-making.
The dissertation is structured as follows:
Section 1 describes the research background and current advancements in lunar drilling–sampling technology, analyzes the difficulties in online estimation of sampling mass, and clarifies the research objectives and technical routes. Section 2 analyzes the operational principles and composition of the drilling system, establishes the physical-mechanical model of drilling tools, and reveals the theoretical correlation between downhole WOB and the sampling mass. Section 3 elucidates the coupling relationship between coring load–drilling force and sampling state, develops a drilling state classification model based on support vector machine (SVM) algorithms, and constructs an empirical model for online estimation of sampling mass. Section 4 realizes the identification of abnormal events in Chang’E-6, the estimation of mission sampling mass, and the suggestion of drilling danger threshold based on the online estimation model. Section 5 systematically summarizes the theoretical innovation and engineering application value of this research.

2. Drilling–Sampling Device System Structure and Principle

2.1. Drilling–Sampling Device System Structure

The Chang’E-6 detector is composed of an orbiter, returner, riser, and lander [28]. The main structure of the drilling–sampling device is fixedly connected to the lander, and the top is connected to the top of the riser. The drilling–sampling device is composed of a drilling mechanism, coring drill, shaping mechanism, unfolding mechanism, and supporting mechanism. It is responsible for completing the tasks of rotary impact sampling, core lifting and sealing, winding and shaping, sample transportation, and so on [29,30]. The composition of the drilling–sampling device system is shown in Figure 1.
Drilling–sampling system integrates three categories of sensors, which are oriented to monitoring its own health status, operational protocol status, and drilling process status. The system health parameters include motor temperature (TM), drive current (IM), etc.; operational protocol parameters comprise rotary speed (n), penetration rate (vp), and impact frequency (fp); drilling parameters incorporate drilling force (FL), coring load (FTX), drilling rod torque (MQD), drilling depth (z), downhole WOB, and chip removal resistance. The chip removal resistance and downhole WOB are derived through the fixed structural model of the drilling tool and system mechanical equilibrium equations, respectively. The drilling parameters characterize the dynamic load characteristics of the drilling tool under varying operational conditions and protocol parameters, serving as a critical basis for intelligent identification of sampling conditions.
The double-pipe single-bag coring drilling tool of Chang’E-6 is mainly composed of a coring drill, casing pipe, coring pipe, and flexible coring tube. During drilling and sampling, the driving unit drives the drill pipe to rotate at a speed of n and feed downward at a feed rate of vp; the core pipe does not rotate circumferentially but feeds together with the drill pipe. With the feed of the coring pipe, the flexible coring tube will continue to turn inside the coring pipe, and the lunar regolith entering the coring drill will be wrapped in the coring tube “without slip” [31]. After the drilling is completed, the lifting rope will lift the coring tube upward, and the eight-character spring sealer at the end of the flexible coring tube will complete the sealing to ensure that the lunar regolith does not fall.
Aiming at the lunar regolith coring process, the whole drilling–sampling device is taken as the research object, based on the “without slip” coring mechanism, when the flexible coring tube is in a uniform inversion state, the whole coring–drilling tool is in a static equilibrium state, and the normal drilling load mechanics link balance formula is established, as shown in Equation (1).
F L + G = F TX F P + F D
The drilling force (FL) is defined as the feed force exerted on the drill rod, while the chip removal resistance refers to the lunar regolith gravitational force acting in the chip chute of the drilling tool. The downhole WOB corresponds to the mechanical resistance encountered at the tool–terrain interface, and the coring load (FTX) represents the force on the top of the flexible coring tube.

2.2. Analysis of Drilling–Coring Physical Model

During the drilling operation stage, the drilling tool is continuously drilling, and the lunar regolith is continuously filled into the flexible coring tube. At this time, it can be preliminarily considered that there is a correlation between the coring load FTX and the sampling mass m. However, due to the poor sampling caused by drilling conditions such as particle sticking, the change of coring load may not be obvious. Therefore, there is great uncertainty in directly estimating the sampling mass by coring load. The drilling tool-particle interaction will directly cause the downhole WOB FD to change significantly. Therefore, the sampling mass is estimated based on the downhole WOB FD, and the physical model of drilling–coring is analyzed.
In Equation (1), the chip removal resistance FP can be regarded as the gravity of the lunar regolith retained in the spiral groove of the drill pipe when it moves upward, which is neglected. FTX, FL, and G are all measurable data, so the downhole WOB FD is simplified as follows in Equation (2):
F D = F L + G F TX
In order to further analyze the relationship between the downhole WOB and the sampling mass, according to the position of each part of the regolith relative to the drilling tool during the coring process [24]. The regolith in contact with the drilling tool is divided into four parts (I, that has entered the flexible coring tube; II, in the inner hole of the coring bit; III, outside the drilling tool; and IV, disturbed), and five kinds of contact stresses are shown at the regolith boundary: σ1, σ2, σ3, σ4, and σ5, as shown in Figure 2.
Among them, σ1 is the contact stress of regolith I acting on boundary ①, σ2 is the contact stress of regolith II acting on boundary ②, σ3 is the contact stress of regolith III acting on boundary ②, σ2 = σ3, σ4, and σ5 are the vertical compressive stress and horizontal compressive stress of disturbed regolith.
In the drilling stage, the whole sample moves upward relative to the coring tube. At this time, the regolith is in a passive state. Assuming that the regolith can only slide as a whole, the relationship between the height of regolith I and σ1 should satisfy the following equation [31]:
σ 1 = ρ g D 4 μ K p ( 1 exp ( 4 μ K p z 1 D ) ) + Q 0 exp ( 4 μ K p z 1 D )
For regolith II in the inner hole of the drill bit, ignoring the internal displacement of the soil, the overall upward movement relative to the drill bit is synchronized with the slip of regolith I, and a mechanical balance is formed at the boundary ①. From this, the relationship between σ1 and σ2 is obtained by analyzing the infinitesimal of regolith II, such as Equation (4) [31].
σ 1 = σ 2 + D 4 μ K p ρ g + 4 μ σ rot D 1 exp 4 μ K p z 2 D exp 4 μ K p z 2 D
σ rot = ω 2 D 2 ρ 12 is the centrifugal inertial force produced by the rotary action, which is the rotary angular velocity of the drilling tool, and z1 is the height of the regolith II.
For the disturbed regolith IV, the downhole WOB is the intuitive expression of its stress on the drilling tool, which is composed of two parts: soil cutting load FD1 and accumulated chip load FD2, as shown in Figure 3. In the drilling process, the cutting resistance EP of the cutting edge per unit width is integrated along the direction of the cutting edge to obtain the soil cutting load FD1. Due to the spiral accumulation area formed by lunar soil chips in the chip removal groove of the drill bit, the accumulation chip load FD2 is generated on the inner side of the chip removal groove of the drill bit [32,33,34].
The accumulation volume of lunar soil chips formed at the chip removal groove of the drill bit is very small, so the accumulation chip load can be ignored [32]. The downhole WOB FD can be regarded as FD1 (the vertical contact stress σ4 of disturbed regolith IV), as shown in Equation (5):
σ 4 = F D 1 A
In geotechnical mechanics, the ratio of horizontal compressive stress to vertical compressive stress after soil compression is the lateral earth pressure coefficient K [35]. The lateral earth pressure coefficients at σ4 and σ5 are defined as K1, and the lateral earth pressure coefficients at σ5 and σ3 are defined as K2. Ignoring the supporting stress of in situ lunar regolith, the supporting stress σ3 of regolith III is obtained from the mechanical relationship, as shown in Equation (6):
σ 3 = σ 5 K 2 = σ 4 K 1 K 2 = F D 1 K 1 A K 2
Substituting Equation (6) into Equations (3) and (4) from the mechanical equilibrium relationship at the boundary 2, it is obtained that the downhole WOB FD has the following relationship with the drilling depth z.
z = D 4 μ K p l n 4 μ K p K 1 F D + A K 2 D ρ g + μ ω 2 D 3 1 exp 4 μ K p z 1 D ρ g A K 2 D exp 4 μ K p z 1 D + 1
The above analysis shows that there is a strong correlation between the downhole WOB and the injection mass in the stable injection state. However, under the disturbance state, the mechanical equilibrium relationship between the regoliths fluctuates. In order to reduce the error of the estimated sampling mass, it is very important to establish an accurate state classification model and then to calculate the sampling mass by matching different correlation coefficients.

3. Estimation Method and Validation of Sample Collection Quantity

In the drilling–sampling process, the interaction between the drilling tool and particles tends to cause drilling fluctuations. This fluctuation will significantly affect the sampling status, which may affect the overall sampling mass during the drilling operation stage. In order to effectively estimate the sampling mass, it is necessary to further systematically identify and classify the sampling status in the drilling operation. Secondly, based on the classification results of the sampling status identification and the relationship between the downhole WOB and the injection height, the sampling mass estimation model is constructed.

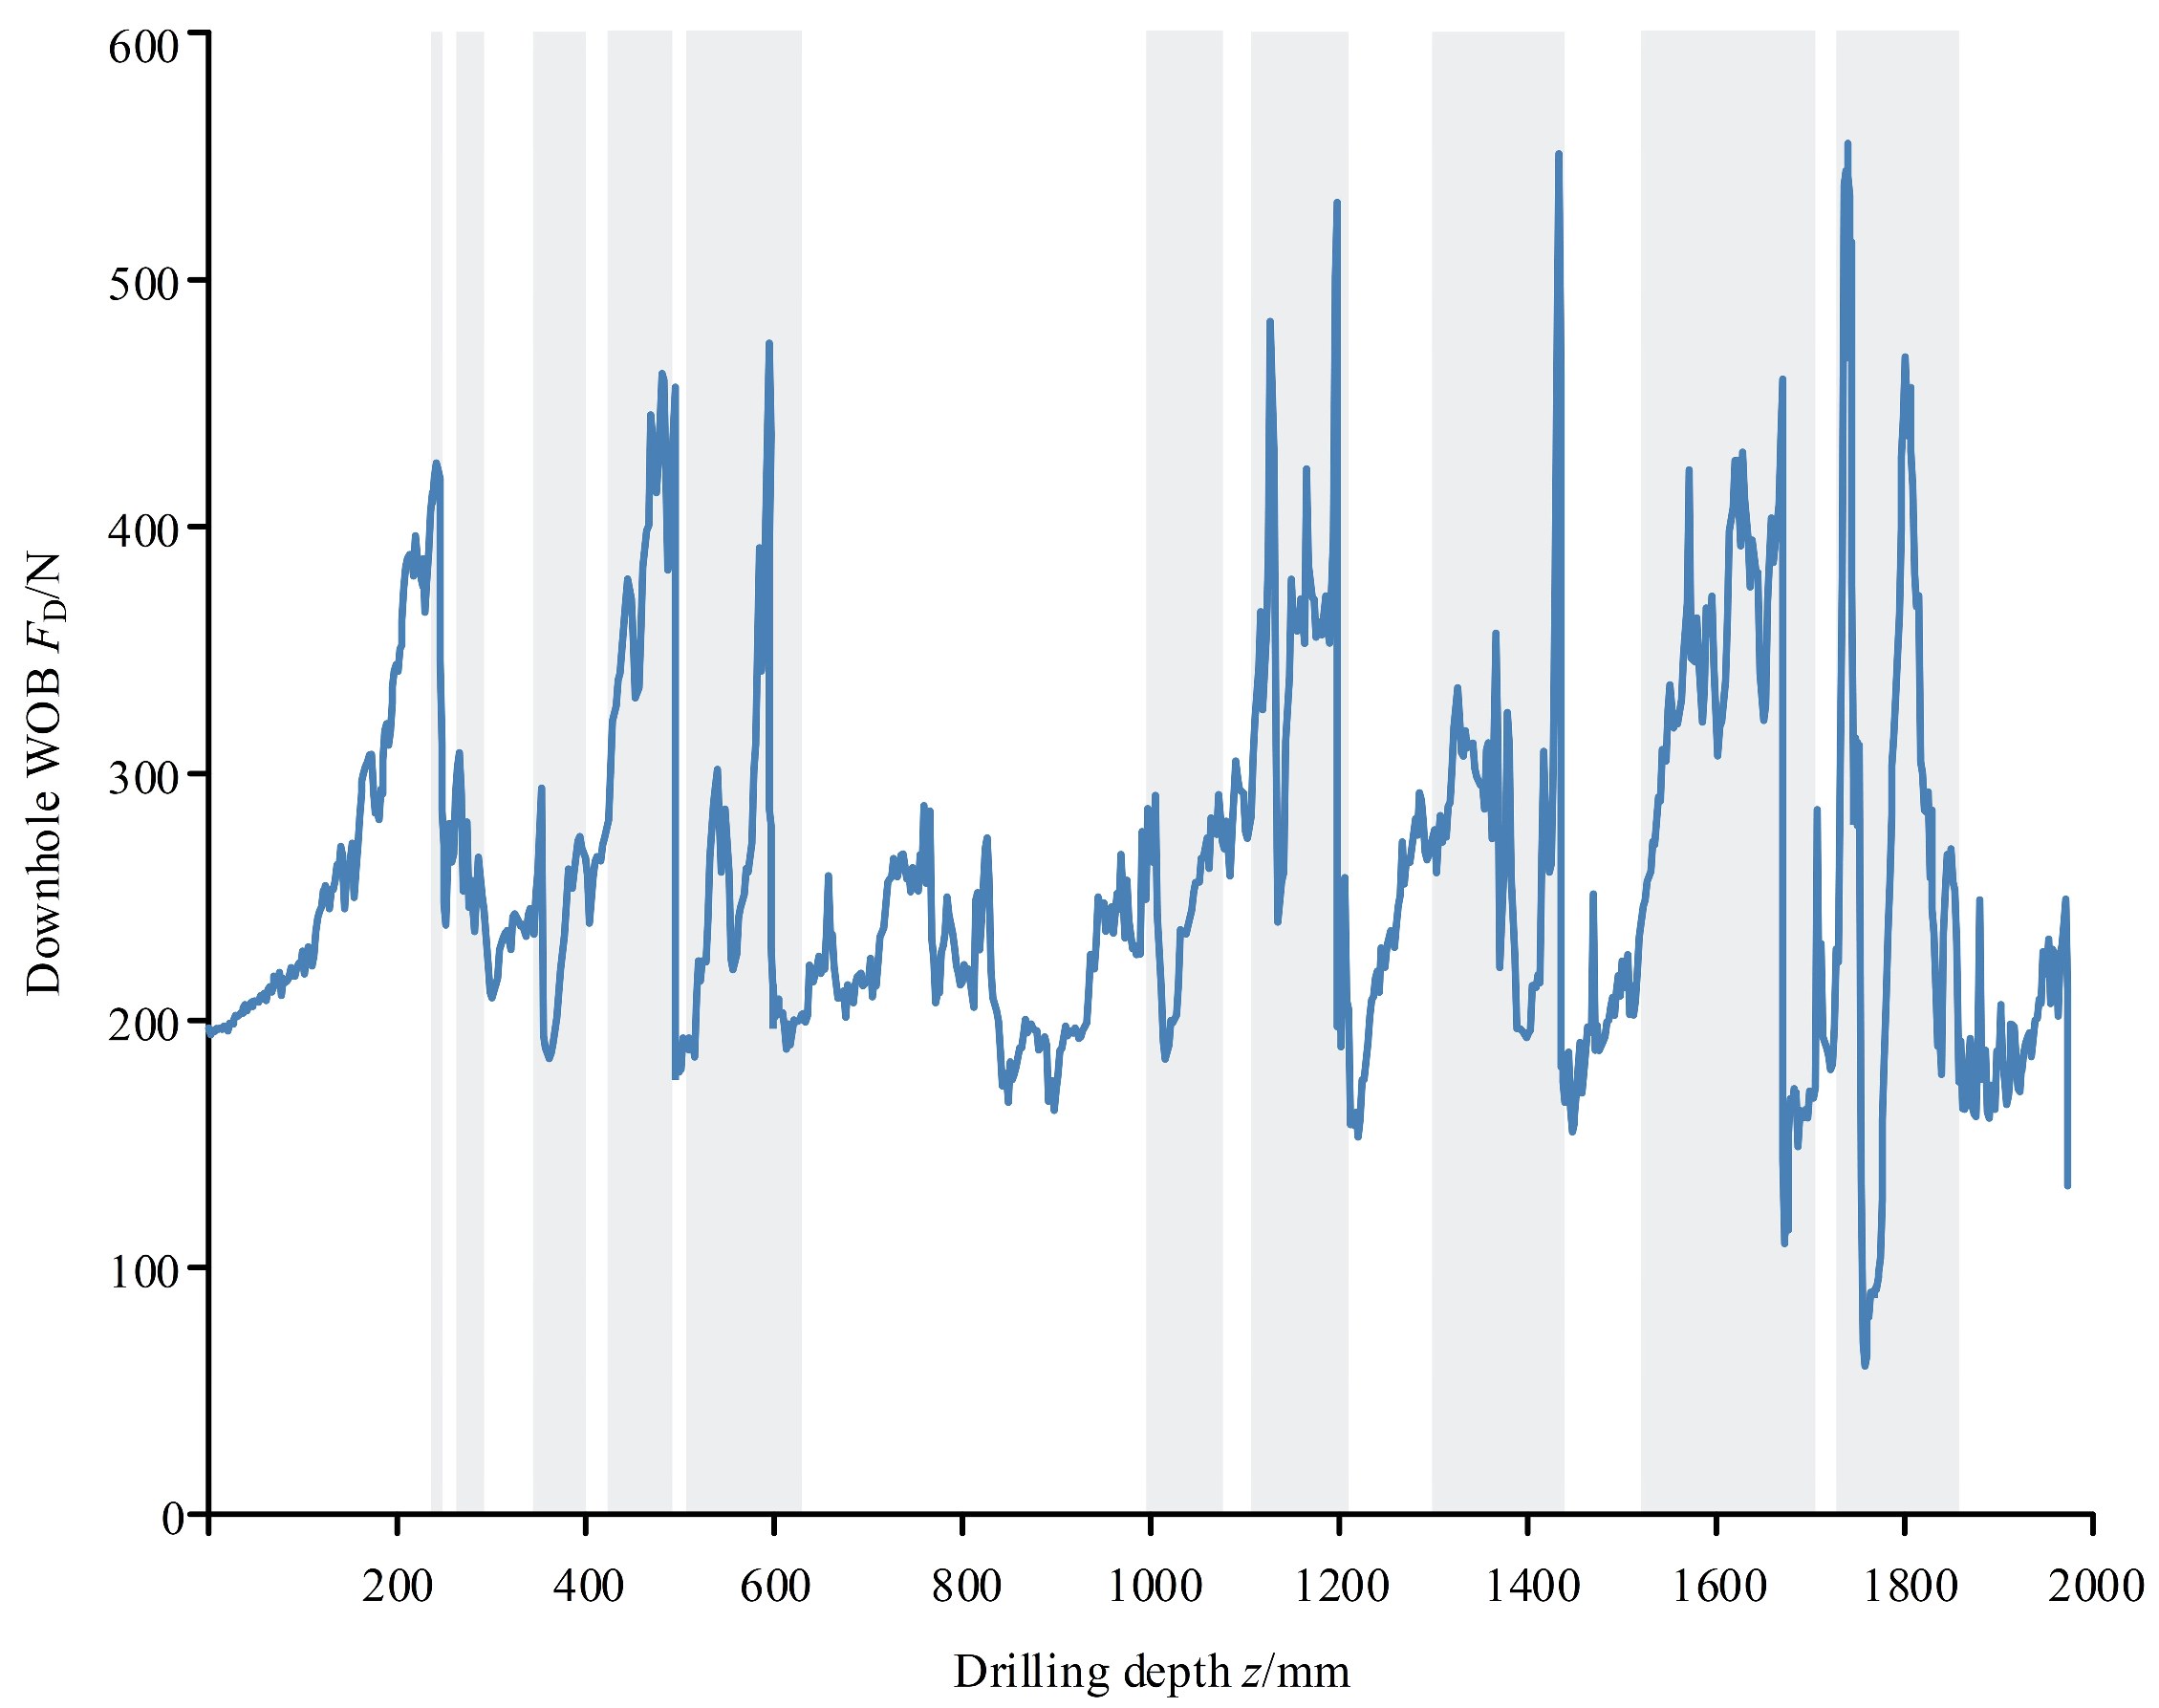
3.1. Analysis of Response Characteristics of Regolith–Machine Interaction

From the analysis of the mechanical transmission link of the normal drilling load in Section 2, it can be seen that the coring load FTX is the main and direct parameter to characterize the sampling status. However, the stability or fluctuation of FTX does not always directly reflect the stability of the sampling status. When encountering particles during drilling, other load parameters (drilling force FL, etc.) will also change accordingly. This is mainly based on the coring load, combined with the drilling force load parameters to assist in judging the drilling process of the particles and the influence on the sampling status, which lays a foundation for further establishment of the sampling status identification model.

3.1.1. Correlation Analysis of Coring Load and Sampling Status

According to the load characteristics of the coring load, the test data are screened into the stable stage of the coring load and the fluctuating stage of the coring load, and the correlation analysis between the drilling load parameters and the sampling status is carried out for different coring load stages.
Among them, the coring load stable stage and fluctuating stage are defined: 10 data points of the drilling subsystem are taken as a data segment. If the change amplitude of the coring load FTX is greater than or equal to 40 N in the data segment, the data segment is defined as the coring load fluctuating stage; otherwise, the data segment is defined as the coring load stable stage.
The frequency of the fluctuating stage of the coring load corresponding to each group was correlated with the sampling mass. It was found that there were 11 groups of experiments with a sampling mass of more than 500 g, of which 8 groups of the fluctuating stage of the coring load did not occur more than 3 times, with an overall proportion of 72%. In the test with sampling mass below 300 g, the proportion of coring load fluctuating section with three or more times is more than 70%. The preliminary results show that the variation characteristics of the coring load are related to the sampling status. The higher the frequency of the coring load fluctuating stage, the worse the drilling sampling status.
In order to further determine the relationship between the variation characteristics of the coring load and the sampling status, the fluctuating data segments of the coring load in each group of tests were counted, and the maximum fluctuating amplitude, average fluctuating amplitude, and occurrence frequency in the data segments were accumulated, respectively. The correlation analysis between the sampling mass and the two fluctuating characteristic values was established. In the test with sampling mass below 400 g, the maximum fluctuating value of 8 groups of tests exceeded 150 N, and that of 2 groups did not exceed 90 N. The sampling mass of the test with the maximum fluctuating value below 140 N exceeded 300 g. The maximum fluctuating amplitude of the coring load was highly correlated with the sampling status, which was inversely correlated, as shown in Figure 4a. For the average fluctuating amplitude of the coring load, the data are concentrated in 60–100 N, which is not directly related to the sampling mass and cannot be used as a basis for judging the sampling status, as shown in Figure 4b.
From the analysis of the correlation between the coring load and the sampling status in Figure 4, it can be seen that when the coring load is stable, the sampling mass increases and the sampling status is stable. When the coring load fluctuates, the sampling mass is reduced, which is negatively correlated with the maximum fluctuating amplitude, and the sampling status fluctuates. However, there is still a small mass of sampling in the test with less fluctuating stage of coring load or lower maximum fluctuating amplitude of coring load, which indicates that the single index of coring load cannot accurately distinguish between stability and fluctuating. Therefore, other drilling load parameters should be introduced to assist in judging the sampling status.

3.1.2. Correlation Analysis of Drilling Force and Sampling Status

In order to improve the accuracy of sampling status judgment, the correlation analysis between drilling force and sampling status is carried out based on the judgment results of the coring load. The drilling force stable stage and fluctuating stage are defined: 10 data points are taken as a data segment. If the drilling force change amplitude in the data segment is greater than or equal to 100 N, the drilling force fluctuating stage is defined; otherwise, the data segment is defined as the drilling force stable stage.
The maximum fluctuating amplitude and average fluctuating amplitude of the drilling force of the test sample are calculated according to the accumulation of the fluctuating data segment of the coring load, and the correlation analysis is carried out with each group of sampling quantity. Statistics show that except for a few discrete points, the maximum fluctuating amplitude of the drilling force is negatively correlated with the sampling mass, that is, the larger the maximum drilling force amplitude is, the more unstable the sampling status is, as shown in Figure 5a. However, the average drilling force amplitude has no obvious correlation with the sampling mass and cannot be used to judge the sampling status, as shown in Figure 5b. Therefore, the maximum fluctuating amplitude should be considered as the key index to evaluate the stability of the drilling force.
From the correlation analysis between drilling force and sampling status in Figure 5, it can be seen that when the drilling force is stable, the sampling status is relatively stable with the increase of sampling mass. When the drilling force fluctuates, the sampling mass decreases and the sampling status fluctuates. Combined with the analysis results of the data characteristics of the coring load, the method of judging the sampling status by the load characteristics of the coring load and the drilling force is effective. The overall idea of judging the coring status by taking the coring load as the main index and the drilling force as the auxiliary index can be determined to accurately identify and classify the sampling status.

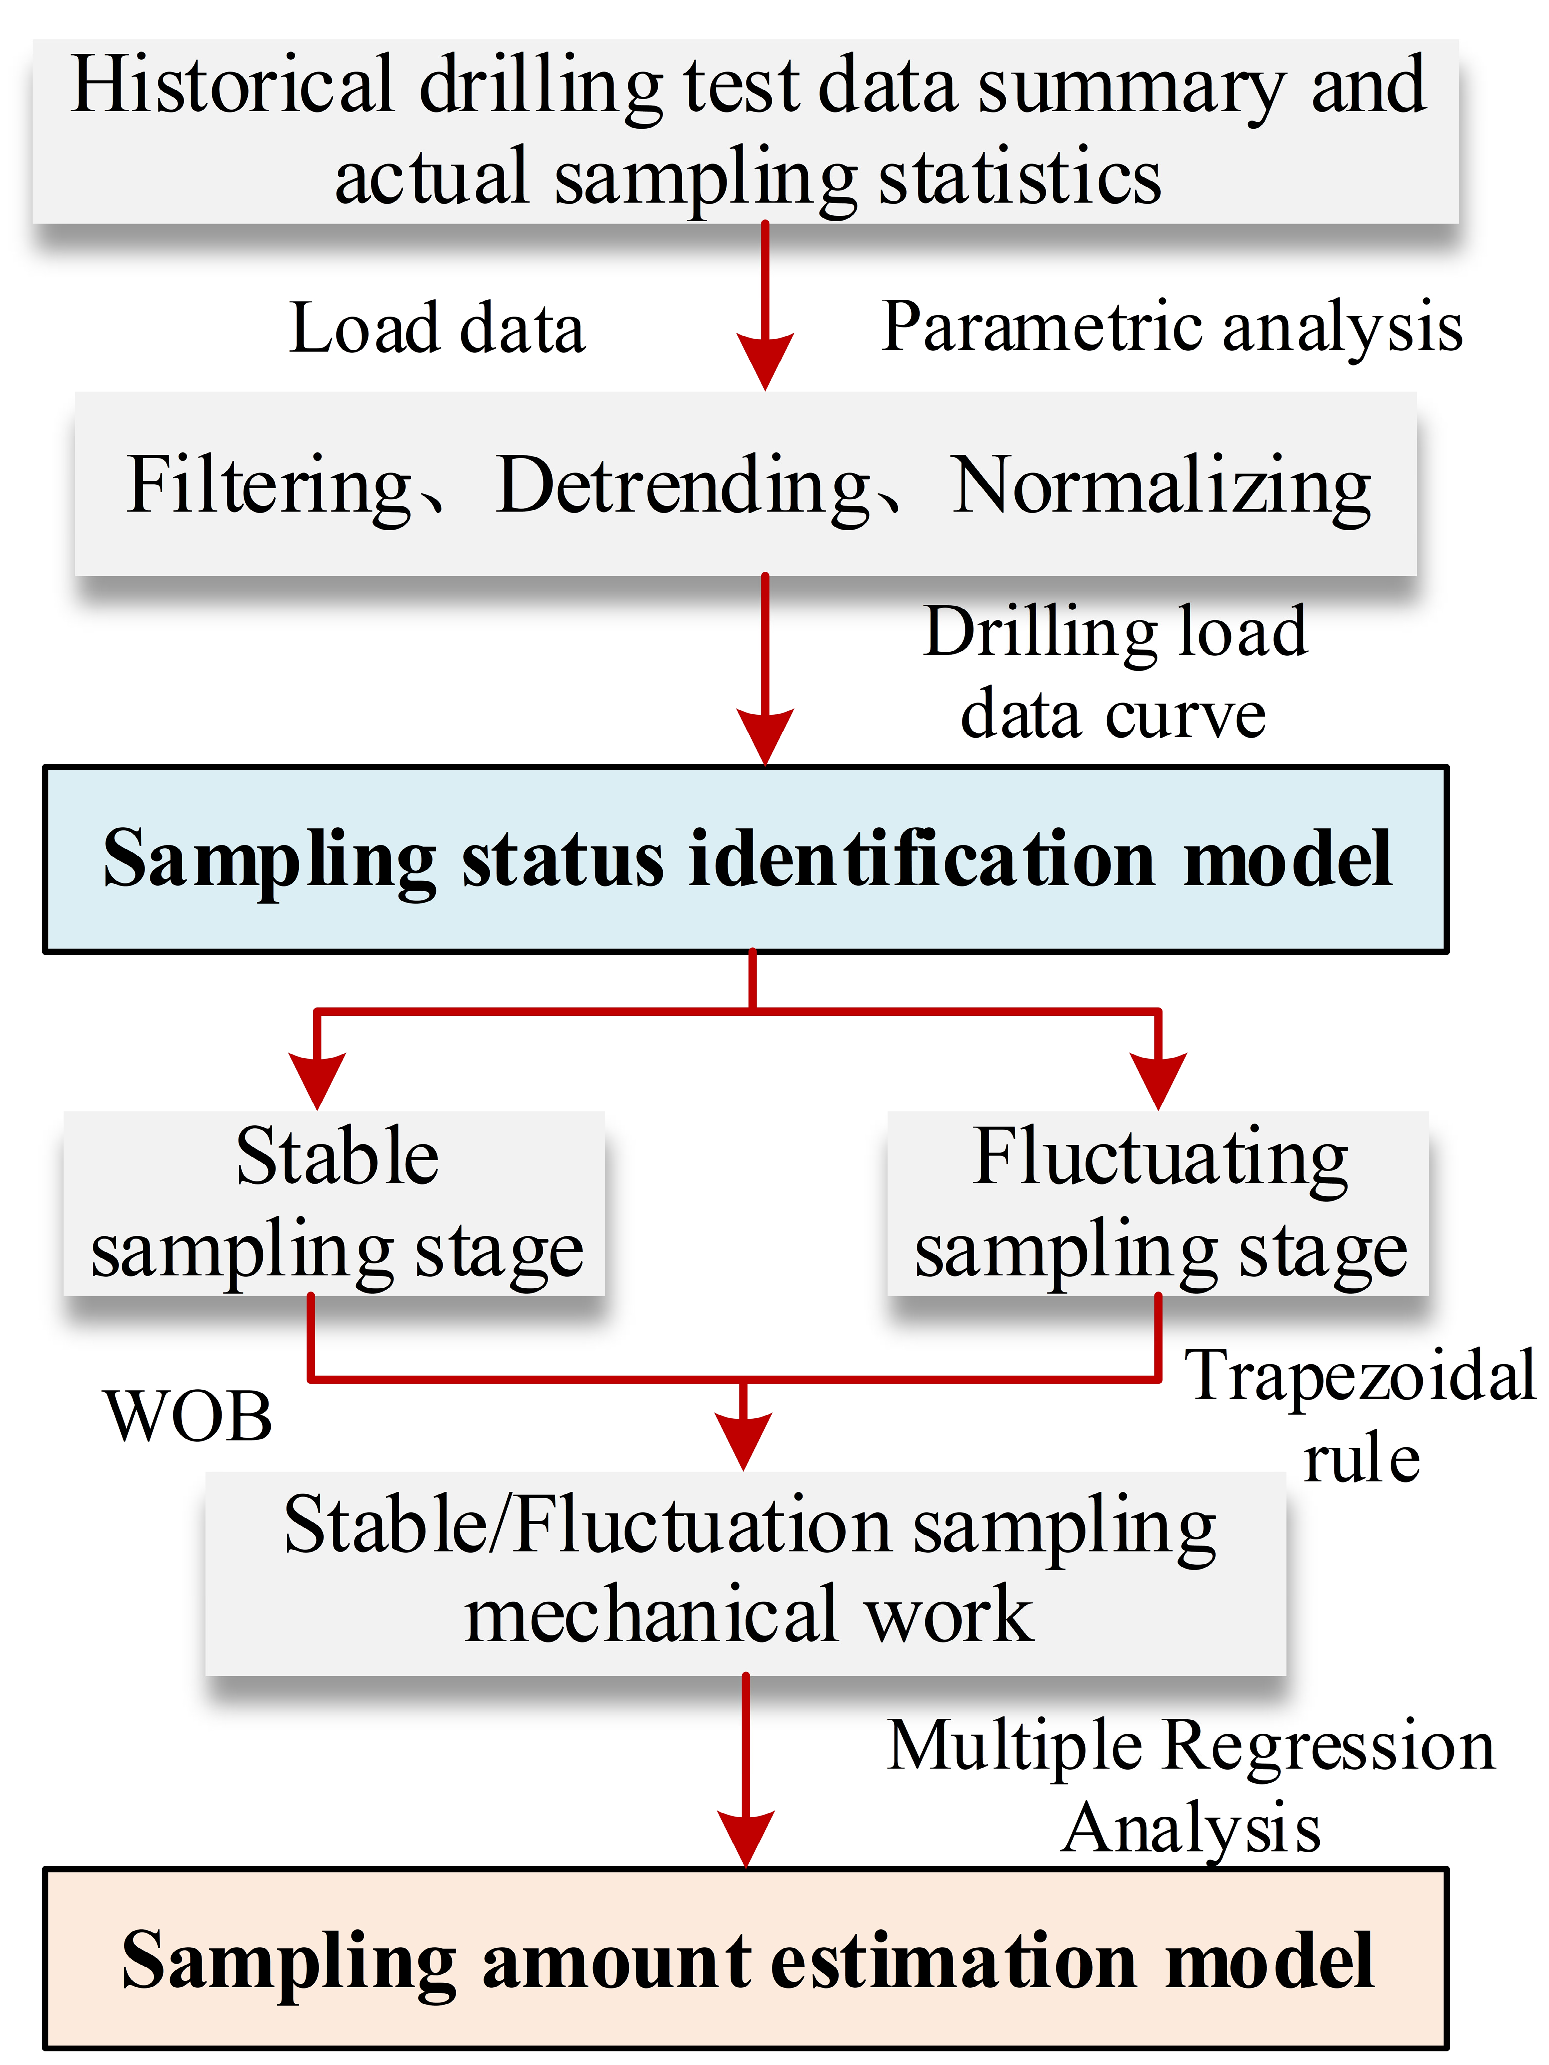
3.2. Construction of Sampling Status Identification Model

Based on the response characteristics of the regolith–machine interaction and the analysis of the previous ground test data, it is found that there is a close relationship between the coring load and the drilling force in the mechanical transmission link and data statistics. Whether there is a coupling between the two methods in the identification of the sampling status needs to be further decoupled by the method of support vector machine (SVM) step-by-step judgment to obtain a more accurate sampling status judgment result. The schematic diagram is shown in Figure 6.
According to the sample database established in Section 3.1, each drilling test is divided into sampling stable samples and fluctuating samples from the perspective of sampling mass, which are used as training samples for sampling status identification. At the same time, combined with the fluctuating degree of drilling load, the samples are further subdivided into the stable and fluctuating samples of coring load FTX and drilling force FL, which are used as the data input of the subsequent sampling status identification model.
The I-level model of sampling status takes the coring load as the main index and preliminarily judges whether there is fluctuation in the sampling state according to the fluctuating degree of the coring load. The II-level model of sampling status takes the drilling force as the main index, and the stable section selected in the I-level model is judged twice, and finally, the judgment result of the sampling status is obtained.

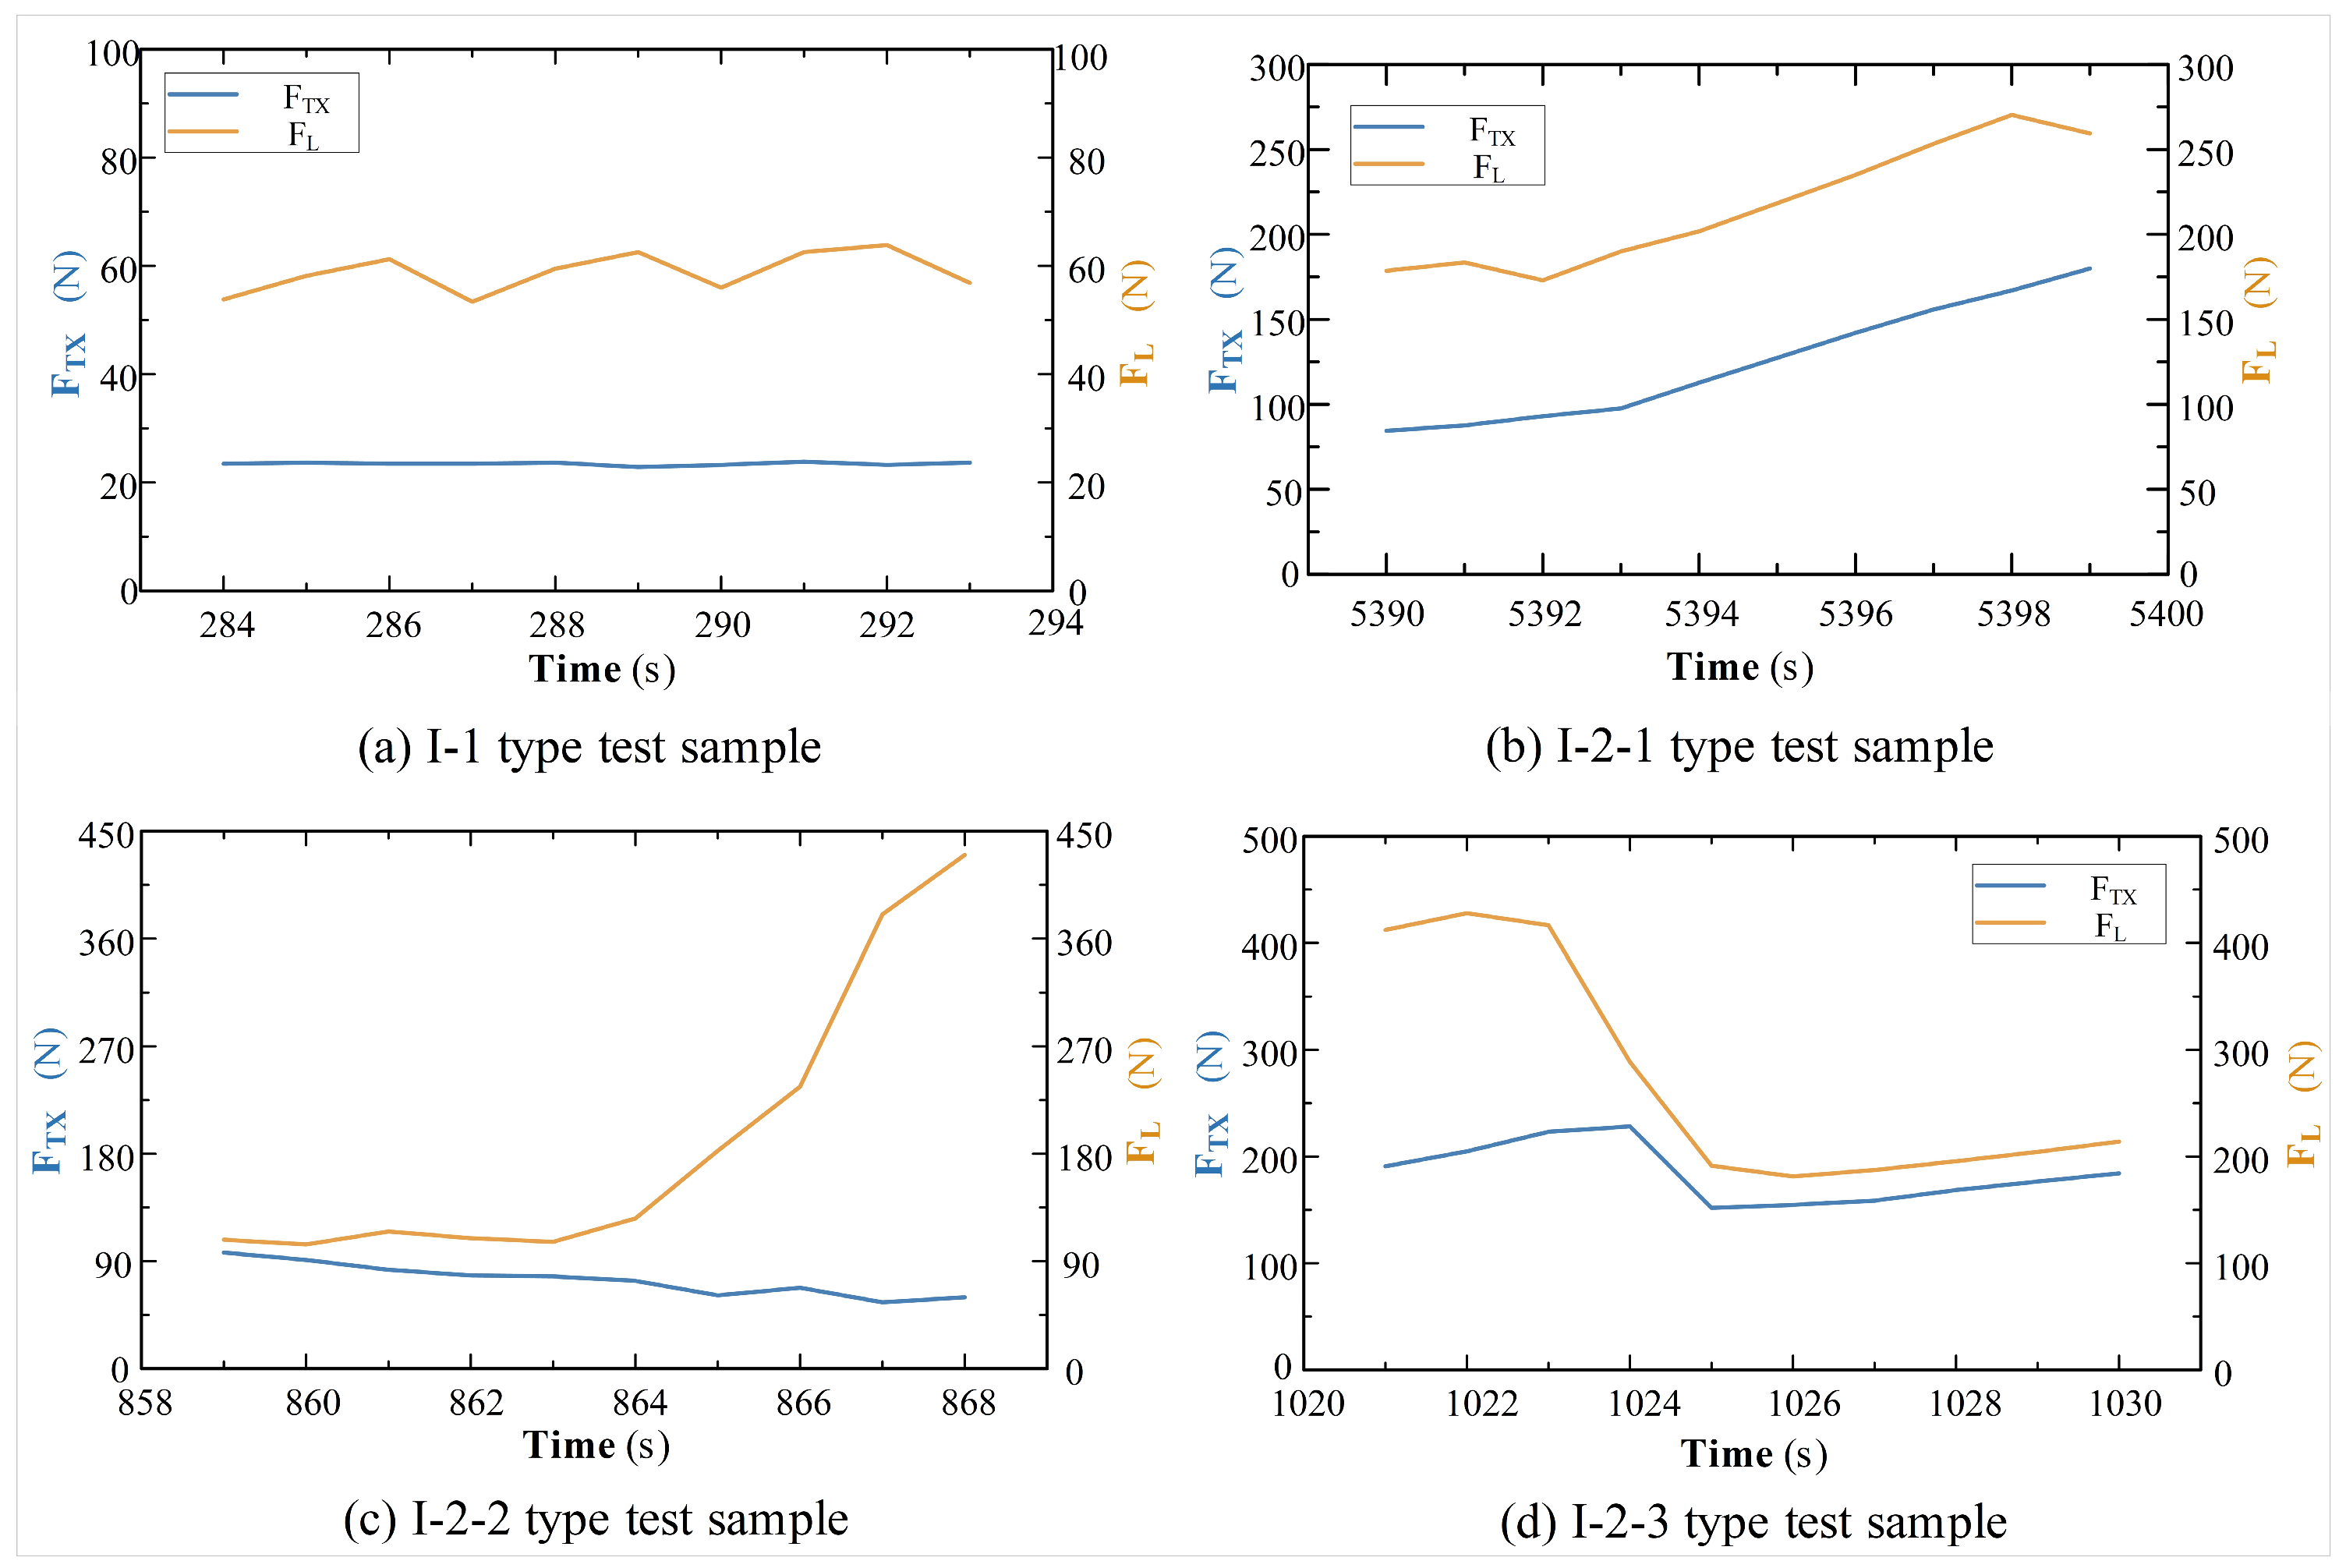
3.2.1. Selection of Sample Division

  • I-level model of sampling status learning samples
The I-level model of sampling status is based on the change state of the coring load and temporarily ignores the drilling force status to select and classify the learning samples. The samples are divided into two types of test samples: stability and fluctuation.
  • Type I-1 test sample: coring load stable stage.
The data segment with stable linear growth of coring load is selected. ① The lunar regolith in the sampling channel in this data segment continues to pass through the core sampling without slip and is in a stable state of sampling. ② In this data section, the large particles at the inlet of the drill bit are blocked, so the coring load remains stable without further injection. The sample size selected was 57. The selected sample features are shown in Figure 7a.
  • Type I-2 test sample: coring load fluctuating stage.
The data segment with fluctuation of coring load is selected, and there are three kinds of fluctuating coring load in this data segment. ① Critical scale particles lead to flexible coring tube sticking: the coring load increases with a large slope or increases by a large margin, and the selected sample characteristics are shown in Figure 7b. ② Lunar regolith falling due to particle aggregation stagnation or operation procedure adjustment: the phenomenon of coring load decreasing occurs, and the selected sample characteristics are shown in Figure 7c. ③ Small particles enter the soft bag and lead to stagnation: the phenomenon of coring load fluctuating occurs, and the selected sample characteristics are shown in Figure 7d. The sample size selected was 62.
2.
II-level model of sampling status learning samples
The II-level model of sampling status takes the drilling force as the main index on the basis of the I-level model and classifies the stable sections selected from the I-level model in detail.
  • Type II-1 test sample: coring load stable, drilling force stable stage.
The data section with a stable coring load and stable drilling force is selected. The drilling force and coring load are stable in this data section. The lunar regolith in the sampling channel continues to pass through the non-slip core sampling and is in a stable state of sampling. The sample size selected was 20. The selected sample features are shown in Figure 8a.
  • Type II-2 test sample: coring load stable, drilling force fluctuating stage.
In the data section where the coring load is stable but the drilling force fluctuates greatly, due to the large particles encountered at the drill bit, some lunar regolith samples that have entered the soft bag may fall during the process of the drilling tool breaking through the large particles. Therefore, this kind of working condition is also considered as the sampling fluctuating stage. The sample size selected was 37. The selected sample features are shown in Figure 8b.

3.2.2. Identification Model Construction

According to the change of drilling load characteristics of four types of test samples, the test samples are introduced into the support vector machine (SVM) algorithm for training, so as to establish the SVM hierarchical sampling status classification model. In the drilling stage, every 10 data points are defined as a data segment. In the I-level and II-level models of sampling status, the time domain characteristics such as the mean value, peak-to-peak difference, root mean square (RMS), and fitting slope of the coring load and drilling force are used as input parameters. At the same time, the output parameters are the sampling stable stage (represented by 0) and the sampling fluctuating stage (represented by 1), and finally, the sampling status identification results are generated.
The test data of 7 non-learning samples are selected to test the identification model. The drilling load curve and the final identification results are as follows: Figure 9.
In order to validate the model, we adopted the threshold-based classification method (coring load < 40 N; drilling force < 100 N) previously used in building the sample library. By comparing and analyzing the results with the SVM-based hierarchical state classification model, we found that the percentage of stable–stable stages identified by the SVM model resulted in an average decrease of 29.2%, as shown in Table 1, which is lower on average compared to the threshold method. This difference stems from the multidimensional decision-making capability of the model, which learns four feature parameters for determination rather than relying on a fixed threshold for force load fluctuation. The sample learning method successfully identifies fluctuating states that cannot be detected by the threshold analysis. The construction of the classification model with high discrimination accuracy provides the necessary prerequisites for the construction of the subsequent drilling sampling volume prediction model.

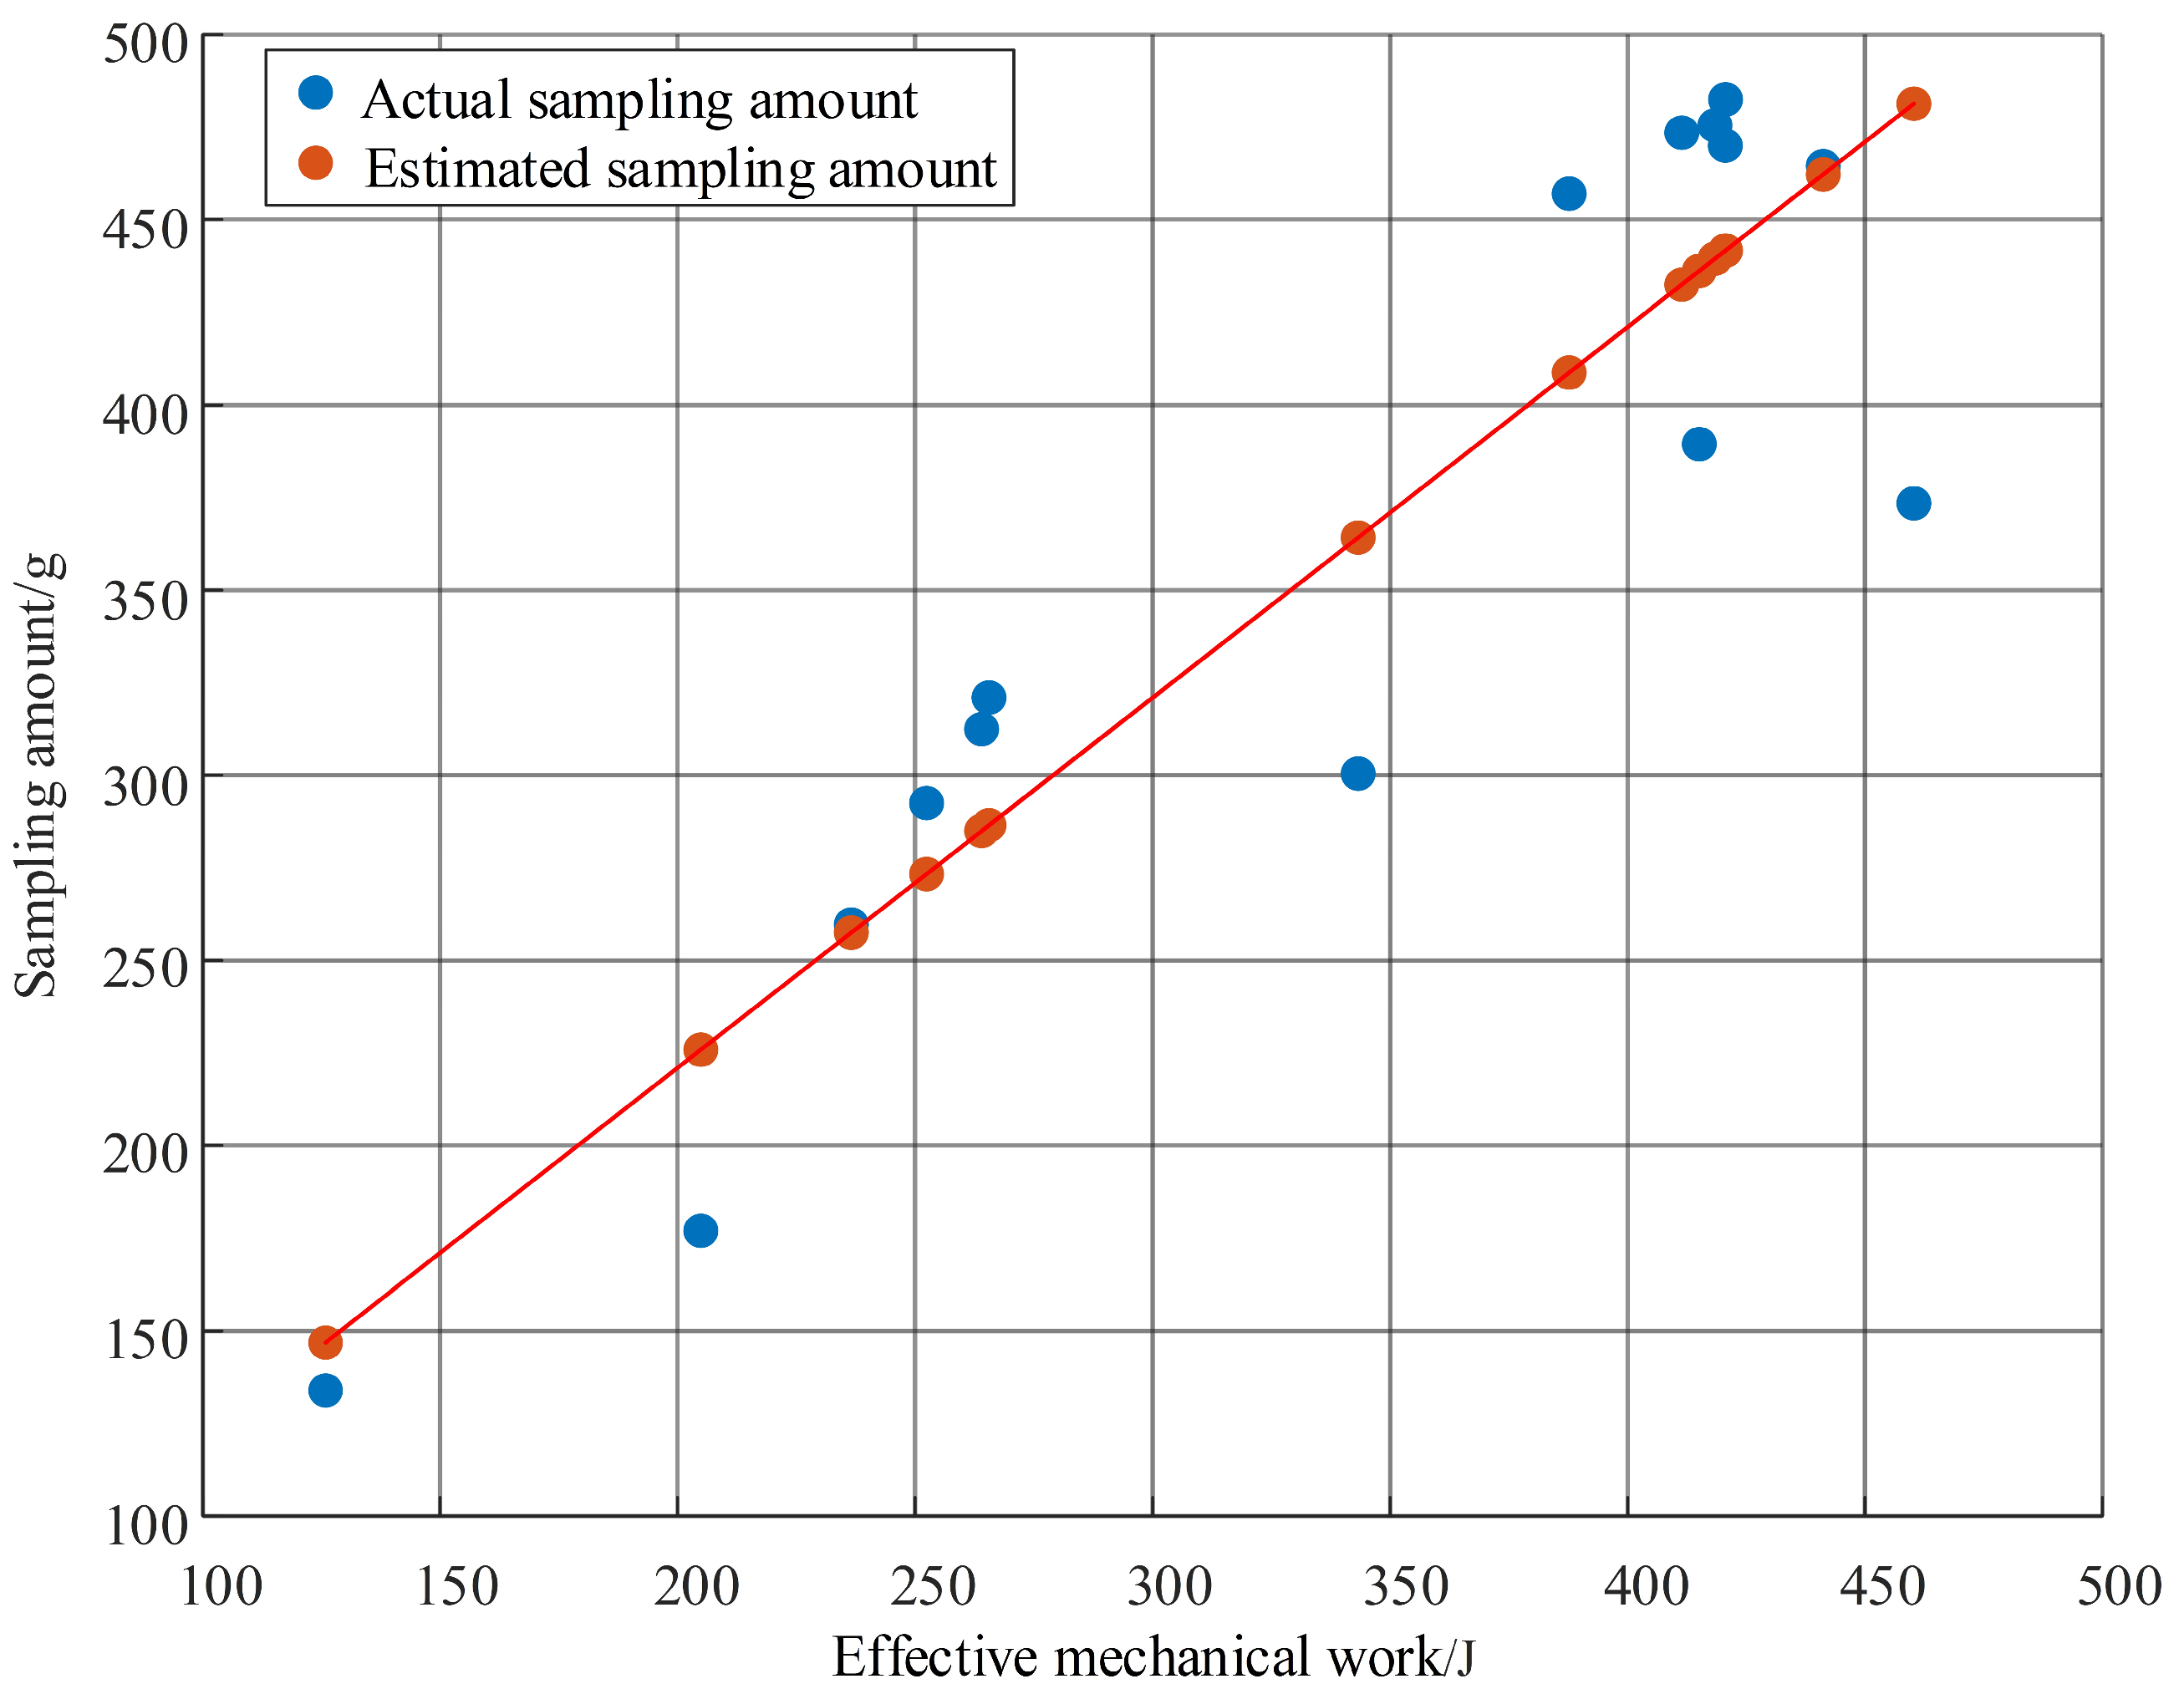
3.3. Analysis and Verification of Drilling–Sampling Mass Estimation Method

Through the ground drilling operation test, the database of ground operation load and actual sampling mass was established based on the operation load and state response information. After filtering and normalizing the drilling load curve, the correlation mapping model between the actual sampling mass and the load parameters was constructed based on the identification results of the sampling status, and the dynamic prediction of the sampling mass based on the downhole WOB FD was realized, providing a quantitative reference for the manual intervention of the drilling–coring strategy. The establishment of the sampling mass estimation model based on the downhole WOB is shown in Figure 10.
Due to the different sampling effects of stable and fluctuating states in the drilling process, based on the sampling status identification model, the drilling process can be divided into stable stage and fluctuating stage, and the downhole WOB FD and drilling depth z curve are obtained according to the drilling load mechanics link, the background shadow part is the result of filtering out the fluctuating stage, as shown in Figure 11.
The data segmentation method of the sampling status identification model is used, and every 10 data points in the whole drilling operation process are regarded as a data segment. Combined with the curve of pressure load and drilling depth, the area ( Δ S ) of each data section is calculated by the trapezoidal rule. Based on the classification results of the stable stage and the fluctuating stage in Figure 11, the stable stage area S1 and the fluctuating stage area S2 are obtained by accumulating each data ( Δ S ) segment in turn.
Using the multiple linear fitting method, the area of the stable stage S1 and the area of the fluctuating stage S2 are taken as the independent variables, and the actual sampling mass mactual of the sample is selected as the dependent variable to obtain the fitting equation between mactual and S1, S2. Considering that the area enclosed by the downhole WOB FD and the drilling depth z can be regarded as the operation mechanical work, the fitted S1 and S2 can be integrated into the effective sampling mechanical work W, and finally, the sampling mass estimation model based on the downhole WOB FD is formed.
W = 1.9595 S 1 + 1.7120 S 2 m = W + 21.0276
According to the above model establishment method, the estimated sampling mass of 15 groups of sample test sets was calculated, the estimated value of sampling mass was summarized, and the fitting effect diagram was drawn (Figure 12). In order to evaluate the accuracy of the prediction results, the error test was carried out on the results, and the relevant test results are shown in Table 2. The model exhibited a mean prediction error of 11.82% with a standard deviation of 8.71 on the test dataset.
It can be seen from Figure 12 and Table 1 that the actual sampling mass is evenly distributed near the sampling mass estimation line, indicating that there is a significant positive correlation between the sampling mass and the effective sampling mechanical work. The correlation coefficient is 0.8586, indicating that the model has high consistency. The overall error of the test set is less than 30%, and the error of nine groups is less than 10%. Therefore, these results verify the validity of the estimation model, which can provide a quantitative reference for the real-time prediction of the sampling mass during the on-orbit drilling operation of Chang’E-6.

4. Analysis of On-Orbit Drilling Operation Status of Chang’E-6

4.1. On-Orbit Drilling–Sampling Mass Estimation

Based on the sampling status identification model, the telemetry data of the drilling operation were classified. It can be observed that with the increase of drilling depth z, the drilling force FL and the downhole WOB FD show a significant upward trend. In the depth interval ZA and ZB, the drilling load fluctuates greatly and is in the stage of sampling fluctuation. The telemetry data of the drilling operation stage is shown in Figure 13.
The whole drilling operation process was relatively smooth in the early stage. In the depth range of 0–404 mm, the load data rose steadily, the fluctuating amplitude was small, the injection state was relatively stable, and the FD increased by about 80 N evenly. The depth range of 404–560 mm is the ZA-1 to ZA-2 fluctuating range. It is judged that small particles were encountered in this range, and the drilling load fluctuated greatly. At 450.66 mm, due to the drilling force exceeding the pre-programmed design threshold, FD increased sharply from 306 N to 400 N, and FL increased sharply from 239 N to 343 N. The adjustment procedure of the emergency plan for start-up operation was activated to restart drilling. After the particles were transferred at 487.2 mm, the drilling load rose briefly and then decreased rapidly to a stable trend. The average FTX was stable at 3.3 N. The drilling load fluctuated slightly in the depth range of 560–724 mm, and the overall trend regression was stable. The depth range of 724–895 mm is the ZB-1 to ZB-2 fluctuating range. It is judged that the non-nominal condition was encountered again in this stage. At this time, the particles entered the coring channel, causing the stress damage of the sample in the flexible coring tube, which led to the fluctuation of the coring load. In the meantime, due to the interaction between the particles and the drill bit and the lunar regolith at the bottom of the hole, the drilling load increased and fluctuated violently. The peak value of FD was about 143 N higher than that of ZB-1. After that, the drilling procedure was adjusted to increase the advance-to-rotation ratio to continue the drilling operation. Due to the subsequent rapid growth trend of FD and FL again and the small FTX (about 5.8 N) still exists, the remote control shutdown was carried out at 1035.3 mm according to the operation plan, and the drilling sampling was completed.
According to the results of sampling status identification, the sampling mechanical work in the stable stage and the fluctuating stage of drilling was calculated, respectively, and the effective sampling mechanical work of the drilling operation was 271.4 J. Based on the sampling mass estimation model, the sampling mass of Chang’E-6 drilling operation was finally estimated to be 292.4 g. Compared with the actual sampling mass of 320 g, the error is within 10%, which again verifies the accuracy of the prediction model.
After analyzing the fluctuating range of the drilling load curve, it is found that the downhole WOB FD fluctuates violently near 350 N, accompanied by significant changes in core lifting force FTX and drilling force FL. In the stable range, the fluctuation of FD is small, usually below 50 N. Therefore, 350 N can be used as the risk threshold of FD fluctuating, and the change amplitude should be marked at this threshold, and a plan should be made in time to ensure a high-quality injection state.

4.2. Response Analysis of Non-Nominal Conditions

In the drilling operation, there are two fluctuating concentration intervals: ZA at 404–560 mm depth and ZB at 724–895 mm depth. Combined with the ground verification test, it is judged that non-nominal conditions are encountered in both intervals.
The internal force load curve is relatively stable in the depth range of 0–404 mm, and the average sampling mass in this depth range is estimated to be 0.2945 g/mm. The average sampling mass in the ZA interval is estimated to be 0.2885 g/mm, which is slightly less than the stable sampling quality. At the same time, the downhole WOB FD increases sharply from 306 N to 390 N from 404 mm to 450.7 mm, and the change amplitude is more than 80 N. The coring load FTX increased steadily from 72.3 N to 83.8 N. Combined with the ground drilling–coring test, it is judged that small-scale particle sticking was encountered. The entanglement between the drilling tool and the particles caused the drilling load to fluctuate violently, and the particles were continuously shifted to the side of the drilling tool, as shown in Figure 14. At the depth of 450.7 mm, the FL exceeded the limit due to the difficulty of the drilling tool to move the particles, which led to the shutdown. After adjusting the operation procedure to switch to high speed and low feed mode, the particles were moved at 487.2 mm, and the drilling load increased briefly and then decreased rapidly to a stable trend.
FD fluctuated greatly at 525.8 mm, and FTX decreased sharply at 535.9 mm (the decrease was more than 117 N). Combined with the above phenomenon and the ground test, it is judged that critical large-scale particle jamming occurred in the sampling area of the drilling tool in the fluctuating range. The critical large-scale particles, which are similar to the diameter of the injection channel, appeared below the drilling tool. After the particles enter, they continuously rubbed with the drill bit and the injection channel, resulting in a large fluctuation of FD. While the particles were stuck, the soft bag could not be injected normally, and the FTX decreased sharply, as shown in Figure 15b I particles.
In the ZB interval, the downhole WOB FD began to rise sharply at 726 mm, with an increase of more than 138 N, and fluctuated greatly in the depth ranges of 726.7–747 mm and 751.1–797.8 mm, with the maximum fluctuating amplitudes of 142 N and 124 N, respectively. The coring load FTX began to decrease at 745 mm (the decrease was more than 10 N) and fluctuated greatly in the depth range of 757.2–874.9 mm. The fluctuating amplitude is more than 20 N, and the minimum coring load was 13 N, as shown in Figure 15a. In the stable section before the ZB interval, that is, the internal force load curve in the depth range of 560–724 mm was in a stable state as a whole, and the average sampling mass was 0.2991 g/mm. The average sampling mass in the ZB interval was only 0.2387 g/mm. It is judged that the ZB interval encountered non-nominal conditions, and it showed a more obvious sampling disturbance state than the ZA interval. Combined with the above phenomena and the ground test conditions, it is judged that the drilling tool in the fluctuating interval encountered the critical large-scale particle stuck again in the injection area, near the soft bag, and rubbed frequently, resulting in the fluctuation of the coring load and affecting the whole fluctuating interval, as shown in Figure 15b II particles.

5. Conclusions

Through the summary and analysis of the ground drilling test, a sampling status identification model with the coring load as the main index and the drilling force as the auxiliary index is constructed, which provides a feasible method for the classification of sampling status.
Based on the mechanism of regolith–machine interaction and the analysis of the transmission link of drilling mechanics, combined with the identification results of sampling status, a sampling mass estimation model based on the drilling force at the bottom of the hole was formed, which provides a quantitative reference for the real-time sampling mass of drilling operation.
According to the telemetry data characteristics of the Chang’E-6 lunar back drilling operation process, the on-orbit drilling–sampling mass was predicted to be 292.4 g based on the sampling mass estimation model. Combined with the response mechanism of regolith-machine interaction and the ground drilling verification test data, the operation process analysis and three obvious non-nominal conditions interpretation were carried out.

Author Contributions

Conceptualization, G.Z. and L.G.; methodology, G.Z.; software, G.Z.; validation, G.Z., W.Z., L.G. and S.J.; investigation, G.Z.; resources, N.Z.; writing—original draft preparation, G.Z.; writing—review and editing, W.Z., X.D. and N.Z.; visualization, G.Z., L.G., X.D. and Z.D.; supervision, Z.D.; project administration, Z.D.; funding acquisition, Z.D. All authors have read and agreed to the published version of the manuscript.

Funding

This research was funded by Key Research and Development Program of Heilongjiang Province (2024ZXDXB52).

Data Availability Statement

Due to confidentiality policies, the raw data of this study cannot be disclosed or shared.

Conflicts of Interest

Author Nai Zhang was employed by the company Beijing Spacecrafts. The remaining authors declare that the research was conducted in the absence of any commercial or financial relationships that could be construed as a potential conflict of interest.

Abbreviations

The following abbreviations are used in this manuscript:
WOBweight on bit
FLdrilling force
Ggravity of coring drill
FTXcoring load
FDdownhole WOB
FPchip removal resistance
ρbulk density
μstatic friction coefficient
KPsteering coefficient, determined by the internal friction angle of soil
Dflexible coring tube diameter
Q0pressure at depth of z = 0
Ahorizontal contact area between drilling tool and lunar regolith

References

  1. Li, C.; Su, Y.; Pettinelli, E.; Xing, S.; Ding, C.; Liu, J.; Ren, X.; Lauro, S.E.; Soldovieri, F.; Zeng, X. The Moon’s Farside Shallow Subsurface Structure Unveiled by Chang’E-4 Lunar Penetrating Radar. Sci. Adv. 2020, 6, eaay6898. [Google Scholar] [CrossRef] [PubMed]
  2. Hao, H.; Gao, M.; Wu, Y.; Gao, Z.; Li, Y.; Zhou, X.; Chu, P.; Wang, X.; Li, J.; Zhou, L. Design, Test, and Verification of in-Situ Condition Preserved Coring and Analysis System in Lunar-Based Simulation Environment. Int. J. Min. Sci. Technol. 2024, 34, 1259–1272. [Google Scholar] [CrossRef]
  3. Xu, J.; Ding, C.; Su, Y.; Ding, Z.; Yang, S.; Li, J.; Dong, Z.; Sharma, R.; Qiu, X.; Lei, Z. Lunar Exploration Based on Ground-Based Radar: Current Research Progress and Future Prospects. Remote Sens. 2024, 16, 3484. [Google Scholar] [CrossRef]
  4. Gaddis, L.R.; Joy, K.H.; Bussey, B.J.; Carpenter, J.D.; Crawford, I.A.; Elphic, R.C.; Halekas, J.S.; Lawrence, S.J.; Xiao, L. Recent Exploration of the Moon: Science from Lunar Missions since 2006. Rev. Mineral. Geochem. 2023, 89, 1–51. [Google Scholar] [CrossRef]
  5. Tian, H.-C.; Wang, H.; Chen, Y.; Yang, W.; Zhou, Q.; Zhang, C.; Lin, H.-L.; Huang, C.; Wu, S.-T.; Jia, L.-H. Non-KREEP Origin for Chang’e-5 Basalts in the Procellarum KREEP Terrane. Nature 2021, 600, 59–63. [Google Scholar] [CrossRef] [PubMed]
  6. Jayathilake, B.A.C.S.; Ilankoon, I.M.S.K.; Dushyantha, M.N.P. Assessment of Significant Geotechnical Parameters for Lunar Regolith Excavations. Acta Astronaut. 2022, 196, 107–122. [Google Scholar] [CrossRef]
  7. Ishida, T.; Fukuda, S.; Kariya, K.; Kamata, H.; Takadama, K.; Kojima, H.; Sawai, S.; Sakai, S. Vision-Based Navigation and Obstacle Detection Flight Results in SLIM Lunar Landing. Acta Astronaut. 2025, 226, 772–781. [Google Scholar] [CrossRef]
  8. Mathew, N.; Durga Prasad, K.; Prasad Vajja, D.; Aasik, V.; Mohammad, F.; Pramod, P.P.; Satheesh Chandran, M.; John Antony, K.; Ram Prabhu, M.; Dhanya, M.B. Chandra’s Surface Thermophysical Experiment (ChaSTE) Onboard Chandrayaan 3 Lander. Adv. Space Res. 2025, 75, 5936–5945. [Google Scholar] [CrossRef]
  9. Li, C.; Zuo, W.; Wen, W.; Zeng, X.; Gao, X.; Liu, Y.; Fu, Q.; Zhang, Z.; Su, Y.; Ren, X. Overview of the Chang’e-4 Mission: Opening the Frontier of Scientific Exploration of the Lunar Far Side. Space Sci. Rev. 2021, 217, 35. [Google Scholar] [CrossRef]
  10. Li, C.; Hu, H.; Yang, M.-F.; Liu, J.; Zhou, Q.; Ren, X.; Liu, B.; Liu, D.; Zeng, X.; Zuo, W. Nature of the Lunar Far-Side Samples Returned by the Chang’E-6 Mission. Natl. Sci. Rev. 2024, 11, nwae328. [Google Scholar] [CrossRef]
  11. Badescu, V. (Ed.) Moon: Prospective Energy and Material Resources; Springer: Berlin/Heidelberg, Germany, 2012; pp. 268–278. ISBN 978-3-642-27968-3. [Google Scholar]
  12. Ding, L.; Zhou, R.; Yuan, Y.; Yang, H.; Li, J.; Yu, T.; Liu, C.; Wang, J.; Li, S.; Gao, H. A 2-Year Locomotive Exploration and Scientific Investigation of the Lunar Farside by the Yutu-2 Rover. Sci. Robot. 2022, 7, eabj6660. [Google Scholar] [CrossRef] [PubMed]
  13. Yue, Z.; Gou, S.; Sun, S.; Yang, W.; Chen, Y.; Wang, Y.; Lin, H.; Di, K.; Lin, Y.; Li, X. Geological Context of the Chang’e-6 Landing Area and Implications for Sample Analysis. Innovation 2024, 5, 100663. [Google Scholar] [CrossRef] [PubMed]
  14. Gao, M.; Wang, X.; Zhang, G.; Li, M.; Liu, T.; Hao, H.; Li, C.; Xie, H. The Novel Idea and Technical Progress of Lunar In-Situ Condition Preserved Coring. Geomech. Geophys. Geo-Energ. Geo-Resour. 2022, 8, 46. [Google Scholar] [CrossRef]
  15. Knez, D.; Khalilidermani, M. A Review of Different Aspects of Off-Earth Drilling. Energies 2021, 14, 7351. [Google Scholar] [CrossRef]
  16. Zacny, K.; Paulsen, G.; Szczesiak, M.; Craft, J.; Chu, P.; McKay, C.; Glass, B.; Davila, A.; Marinova, M.; Pollard, W. LunarVader: Development and Testing of Lunar Drill in Vacuum Chamber and in Lunar Analog Site of Antarctica. J. Aerosp. Eng. 2013, 26, 74–86. [Google Scholar] [CrossRef]
  17. Lin, Y.; Yang, W.; Zhang, H.; Hui, H.; Hu, S.; Xiao, L.; Liu, J.; Xiao, Z.; Yue, Z.; Zhang, J. Return to the Moon: New Perspectives on Lunar Exploration. Sci. Bull. 2024, 69, 2136–2148. [Google Scholar] [CrossRef]
  18. Wang, Y.; Wang, J.; Zhang, G.; Gao, M.; Zhang, X.; Xie, H. Advances in Drill-Based Sampling Technology for Extraterrestrial Bodies. Space Sci. Rev. 2024, 220, 66. [Google Scholar] [CrossRef]
  19. Robinson, M.S.; Plescia, J.B.; Jolliff, B.L.; Lawrence, S.J. Soviet Lunar Sample Return Missions: Landing Site Identification and Geologic Context. Planet. Space Sci. 2012, 69, 76–88. [Google Scholar] [CrossRef]
  20. Zhang, T.; Pang, Y.; Zeng, T.; Wang, G.; Yin, S.; Xu, K.; Mo, G.; Zhang, X.; Wang, L.; Yang, S. Robotic Drilling for the Chinese Chang’E 5 Lunar Sample-Return Mission. Int. J. Robot. Res. 2023, 42, 586–613. [Google Scholar] [CrossRef]
  21. Ivanov, M.A.; Head, J.W.; Hiesinger, H. New Insights into the Regional and Local Geological Context of the Luna 16 Landing Site. Icarus 2023, 400, 115579. [Google Scholar] [CrossRef]
  22. Wu, F.-Y.; Li, Q.-L.; Chen, Y.; Hu, S.; Yue, Z.-Y.; Zhou, Q.; Wang, H.; Yang, W.; Tian, H.-C.; Zhang, C. Lunar Evolution in Light of the Chang’e-5 Returned Samples. Annu. Rev. Earth Planet. Sci. 2024, 52, 159–194. [Google Scholar] [CrossRef]
  23. Zhang, T.; Zhang, Y.; Xu, K.; Ding, X.; Wei, H.; Chao, C.; Wang, B.; Wang, B. Robotic Drilling Tests in Simulated Lunar Regolith Environment. J. Field Robot. 2021, 38, 1011–1035. [Google Scholar] [CrossRef]
  24. Cannon, H.N.; Stoker, C.R.; Dunagan, S.E.; Davis, K.; Gómez-Elvira, J.; Glass, B.J.; Lemke, L.G.; Miller, D.; Bonaccorsi, R.; Branson, M. MARTE: Technology Development and Lessons Learned from a Mars Drilling Mission Simulation. J. Field Robot. 2007, 24, 877–905. [Google Scholar] [CrossRef]
  25. Glass, B.; Cannon, H.; Branson, M.; Hanagud, S.; Paulsen, G. DAME: Planetary-Prototype Drilling Automation. Astrobiology 2008, 8, 653–664. [Google Scholar] [CrossRef]
  26. Tang, J.-Y.; Deng, Z.-Q.; Chen, C.-B.; Wang, Y.-C.; Quan, Q.-Q.; Jiang, S.-Y.; Tang, D.-W. Review of Planetary Drilling & Coring Technologies Oriented Towards Deep Space Exploration. J. Astronaut. 2017, 38, 555. [Google Scholar] [CrossRef]
  27. Zhang, Y.; Zhang, T.; Wei, H.; Liu, J.; Wang, W.; Yuan, X.; Pang, Y.; Guan, Y.; Hou, X.; Xu, K. Advances in Extraterrestrial Drilling Technology to Discover the Secrets Hidden Inside Celestial Bodies. Space Sci. Rev. 2022, 218, 47. [Google Scholar] [CrossRef]
  28. Huang, W.; Rong, W.; Liu, D.; Jiang, C.; Jia, H.; Bao, J.; Fang, J. Design and Realization of Recovery System of Chang’e-5 Reentry Spacecraft. Space Sci. Technol. 2021, 2021, 9898756. [Google Scholar] [CrossRef]
  29. Zheng, Y.; Yang, M.; Deng, X.; Jin, S.; Peng, J.; Su, Y.; Gu, Z.; Chen, L.; Pang, Y.; Zhang, N. Analysis of Chang’e-5 Lunar Core Drilling Process. Chin. J. Aeronaut. 2023, 36, 292–303. [Google Scholar] [CrossRef]
  30. Jiang, S.-Y.; Liang, J.-N.; Lai, X.-M.; Deng, X.-J.; Pang, Y.; Zhang, W.-W.; Tang, J.-Y.; Quan, Q.-Q.; Peng, J.; Zhang, G.; et al. Analysis on Drilling and Coring Process and Lunar Regolith Stratification State Interpretation in Chang’E-5. J. Mech. Eng. 2022, 58, 348–360. [Google Scholar] [CrossRef]
  31. Quan, Q.-Q.; Shi, X.-M.; Tang, D.-W.; Jiang, S.-Y.; Deng, Z.-Q. Analysis and test research on influencing factors of drilling and coring quantity of lunar soil simulant. J. Beijing Univ. Aeronaut. Astronaut. 2015, 41, 2052–2060. [Google Scholar] [CrossRef]
  32. Quan, Q.-Q.; Chen, C.-B.; Deng, Z.-Q.; Tang, J.-Y.; Tang, D.-W. On Modeling Drilling Load in Lunar Regolith Simulant. Chin. J. Mech. Eng. 2018, 31, 20. [Google Scholar] [CrossRef]
  33. Quan, Q.; Tang, J.; Yuan, F.; Jiang, S.; Deng, Z. Drilling Load Modeling and Validation Based on the Filling Rate of Auger Flute in Planetary Sampling. Chin. J. Aeronaut. 2017, 30, 434–446. [Google Scholar] [CrossRef]
  34. Fan, X.; Xu, C.; Liang, L.; Chen, Q.; Deng, J. Analytical Solution for Displacement-Dependent Passive Earth Pressure on Rigid Walls with Various Wall Movements in Cohesionless Soil. Comput. Geotech. 2021, 140, 104470. [Google Scholar] [CrossRef]
  35. Akbari Garakani, A.; Pirjalili, A.; Desai, C.S. An Effective Stress-Based DSC Model for Predicting the Coefficient of Lateral Soil Pressure in Unsaturated Soils. Acta Geotech. 2021, 16, 3813–3830. [Google Scholar] [CrossRef]
Figure 1. Composition of Chang’E-6 drilling–sampling device system.
Aerospace 12 00331 g001
Figure 2. Physical model of drilling–coring.
Aerospace 12 00331 g002
Figure 3. Downhole WOB composition.
Aerospace 12 00331 g003
Figure 4. Correlation analysis between coring load and sampling status. (a) The relationship between the maximum fluctuation amplitude of the sampling amount. (b) The relationship between the average fluctuation amplitude of the sampling amount.
Aerospace 12 00331 g004
Figure 5. Correlation analysis between drilling force and sampling status. (a) The relationship between the maximum fluctuation amplitude of the sampling amount. (b) The relationship between the average fluctuation amplitude of the sampling amount.
Aerospace 12 00331 g005
Figure 6. Establishment of the SVM model for sampling status identification.
Aerospace 12 00331 g006
Figure 7. I-level model of sampling status learning sample selection features.
Aerospace 12 00331 g007
Figure 8. II-level model of sampling status learning sample selection features.
Aerospace 12 00331 g008
Figure 9. 2023030101 drilling test sampling status identification results.
Aerospace 12 00331 g009
Figure 10. Establishment of the sampling estimation model at the downhole WOB.
Aerospace 12 00331 g010
Figure 11. 2023060911 downhole WOB load curve. (Note: The background shadow part is the result of filtering out the fluctuating stage.)
Aerospace 12 00331 g011
Figure 12. Fitting curve of sampling mass and effective sampling mechanical work.
Aerospace 12 00331 g012
Figure 13. Drilling load telemetry data curve. (Note: The background shadow part is the result of filtering out the fluctuating stage.)
Aerospace 12 00331 g013
Figure 14. Drilling load curve and mechanism of ZA fluctuating interval.
Aerospace 12 00331 g014
Figure 15. Drilling load curve and mechanism of ZB fluctuating interval.
Aerospace 12 00331 g015
Table 1. Classification model and threshold method determination results.
Test
Number
Percentage of the Stable Stage in Ι-Level ModelPercentage of the Stable Stage in II-Level ModelPercentage of Stable Stage for the Threshold MethodDecline Rate
201703170290.1639%67.2131%92.58%34.54%
201705310494.2308%77.8846%92.09%20.30%
2017060302100%91.4894%98.78%7.38%
202303010185.2332%78.9474%96.76%30.45%
2020304270185.5932%78.8136%98.87%31.77%
202304270294.1176%63.7255%96.17%37.63%
202304280185.7143%65.9341%97.98%42.32%
Table 2. Sample size prediction test set.
Test
Number
Estimated Sampling Mass (g)Actual Sampling Mass (g)Testing Set
Error
2024051001462.2168464.50.49%
2023042710481.3341373.528.87%
2023042714439.4387475.57.58%
2023042809432.4797473.58.66%
2023042812441.6663482.58.46%
2023042816285.0223312.58.79%
2023052301146.87971349.61%
2023052401364.2651300.521.22%
2023052402256.649432120.05%
2023052403225.909517727.63%
2023052501441.64814706.03%
2023060101408.675945710.57%
2023060102273.3930292.56.53%
2023060201436.1698389.511.98%
2020120201257.5665259.720.83%
Disclaimer/Publisher’s Note: The statements, opinions and data contained in all publications are solely those of the individual author(s) and contributor(s) and not of MDPI and/or the editor(s). MDPI and/or the editor(s) disclaim responsibility for any injury to people or property resulting from any ideas, methods, instructions or products referred to in the content.

