Article

Numerical Analyses of Aerodynamic and Aeroacoustic Interaction Characteristics of Rear-Mounted Propeller on Highspeed Helicopter

College of Aerospace Engineering, Nanjing University of Aeronautics and Astronautics, Nanjing 210016, China
*
Author to whom correspondence should be addressed.
Aerospace 2025, 12(4), 343; https://doi.org/10.3390/aerospace12040343
Submission received: 23 March 2025 / Revised: 11 April 2025 / Accepted: 13 April 2025 / Published: 15 April 2025
(This article belongs to the Special Issue Aerodynamics and Aeroacoustics of Unsteady Flow)

Abstract

:
To study the interference effects of the fuselage/rear-mounted propeller on the aerodynamic and aeroacoustic characteristics at a forward speed of Ma = 0.323, a multi-component flowfield simulation and an aeroacoustic prediction method were employed. Firstly, hybrid grids were adopted in the embedded grid system, and a new boundary identification method was developed to address the overlap problem by adjusting the grid boundary based on entities. The simulations were based on the URANS and FW-H equations. The employed numerical analysis methods were validated through comparisons with experimental data. Then, the aerodynamic and aeroacoustic characteristics of the propeller were analyzed, and the interference of the fuselage with the propeller was discussed in detail. Key findings included the following. Under fuselage interference, the sound pressure level (SPL) of the propeller at those observers near the forward flight direction increased dramatically, by more than 10 dB, especially in the range of two to six times the fundamental frequency. A downward vertical velocity reduced the SPLs beneath the fuselage, while an upward one had the opposite effect. The flat/vertical tails’ deceleration effect caused a thrust surge in the propeller, with most magnitudes around 20%. At different forward speeds, the thrust surge and SPL changes were similar.

1. Introduction

Conventional helicopters face limitations in terms of their maximum forward speeds and ranges due to the susceptibility of their rotors to aerodynamic phenomena like surge/stall during high-speed forward flight. This has become a major obstacle in further expanding the application areas of helicopters. To improve the integrated mission effectiveness of helicopters, a coaxial-rotor helicopter using the advancing blade concept [1,2] was proposed for higher speed limits. For high-speed helicopters, lift was generated solely by the advancing side of the rotors, while forward propulsion was achieved by utilizing a propeller, such as the X-2 or S-97. Due to the compact structure and high-speed capabilities of coaxial helicopters, the rear-mounted propeller was susceptible to the influences of the flat/vertical tail and the wake generated by the coaxial rotors. The interference caused by these factors could significantly impact the aerodynamic and aeroacoustic performance of the helicopter [3,4], consequently affecting its overall flight performance. Therefore, it is of great theoretical significance and practical value to study the aerodynamic/aeroacoustic characteristics of propellers while considering the influence of other components’ interferences.
In recent years, researchers have conducted experimental validation and numerical simulations to investigate the aerodynamic characteristics of propellers. Lorber [5] and Bowles [6] conducted experimental studies on the Sikorsky X-2 and the S-97 full-size models, respectively, then simulated the rotor/fuselage flowfield using the virtual blade model method (VBM). Some conclusions were obtained by analyzing the interference effects between the coaxial rotors and propeller in low-speed states. Stokkermans [3], Frey [7], Thiemeier [8], and Blacha [9] analyzed the aerodynamic interference characteristics by using simplified blade models for the RACER helicopter. The results showed significant mutual-interference effects between the wings and rear-mounted propellers. Boisard [4] paid attention to the interference effects of rotors/fuselage with propellers. The flowfield simulation results were compared using the unsteady Reynolds-averaged Navier–Stokes (URANS) equation and the VBM method. It was observed that, at higher speeds, the influence of the rotors on the propeller was significantly diminished. Additionally, the aerodynamic and aeroacoustic characteristics of an electric vertical take-off and landing aircraft were investigated using the in-house Helicopter Multi-Block3 numerical framework [10,11,12,13,14]. These studies reflect the possibility of strong interference between the rear-mounted propeller and neighboring components. Considering the poor effects due to coaxial-rotor wake interferences [4], the fuselage wake serves as an important source of interference in the propeller during high-speed flight.
In terms of flowfield simulation methods, the spatial locations of the components are closely adjacent to each other, resulting in the serious problem of grid/entity overlap when using embedded grid systems. Hu [15,16] improved the embedded-grid method to address the issue of overlap between the grids of the blade and trailing edge, achieving certain results. Zou [17] proposed a numerical fitting method using an unstructured grid, which contributed to improving the accuracy of flowfield simulation. It is well known that the implicit hole-cutting (IHC) method [18,19,20] is a good approach in dealing with complex aircraft configurations, because it allows multiblock grids to overlap with each other. This method decreases the grid generation time and provides great flexibility to handle topologically complex configurations, but the generation of overlapping grid connectivity is an expensive and challenging task. Moreover, postprocessing is problematic because hole cells are not blanked by the cell selection process. In addition, some new grid assembly strategies have been proposed and applied in overset grid studies [21,22,23,24]. As a result, the computational time of the grid assemble process was extremely reduced. Such studies have contributed valuable insights for the advancement of simulation methods for fuselage/propeller systems.
Additionally, several studies have focused on propellers’ aeroacoustic characteristics. Oehrle [25] conducted an initial investigation into the effects of component interference on propeller aeroacoustics in the hovering state of a RACER helicopter. Several studies [26,27] have investigated the effects of propeller/wing interference on near-field aeroacoustics by using a non-constant pressure field. Myers [28] concentrated on the scattering effects of fuselage interference on rotor aeroacoustics.
Research on the aerodynamic and aeroacoustic characteristics of propellers has revealed several deficiencies. Firstly, it was found that there could be significant interference between the fuselage and the rear-mounted propeller during high-speed flight. Secondly, the accuracy of the flowfield analysis, which was based on a simplified blade model, was insufficient in capturing the intricate flow details of the propeller under interference conditions. Additionally, the effects of aerodynamic interference on the aeroacoustic characteristics of the propeller were given less attention due to limitations in the accuracy of the flowfield simulation.
Based on the previous work [29,30] and the CLORNS code [31,32], a multi-component flowfield simulation method with an adaptive boundary method was developed. The main objective of the present work was focused on developing a better understanding of the interference effects on the propeller aerodynamics and aeroacoustics during high-speed cruising. The experimental data of the AH-1G in forward flight and the NACA fuselage/rotor were used to validate the proposed numerical analysis method. As the main study subject, the fuselage/propeller flowfield at high speed was simulated, and the aerodynamic and aeroacoustic characteristics of the propeller under interference were analyzed in detail. Then, the effects of variable horizontal and vertical velocities on the aerodynamic and aeroacoustic characteristics were calculated and analyzed, and some new conclusions were drawn.

2. Numerical Method

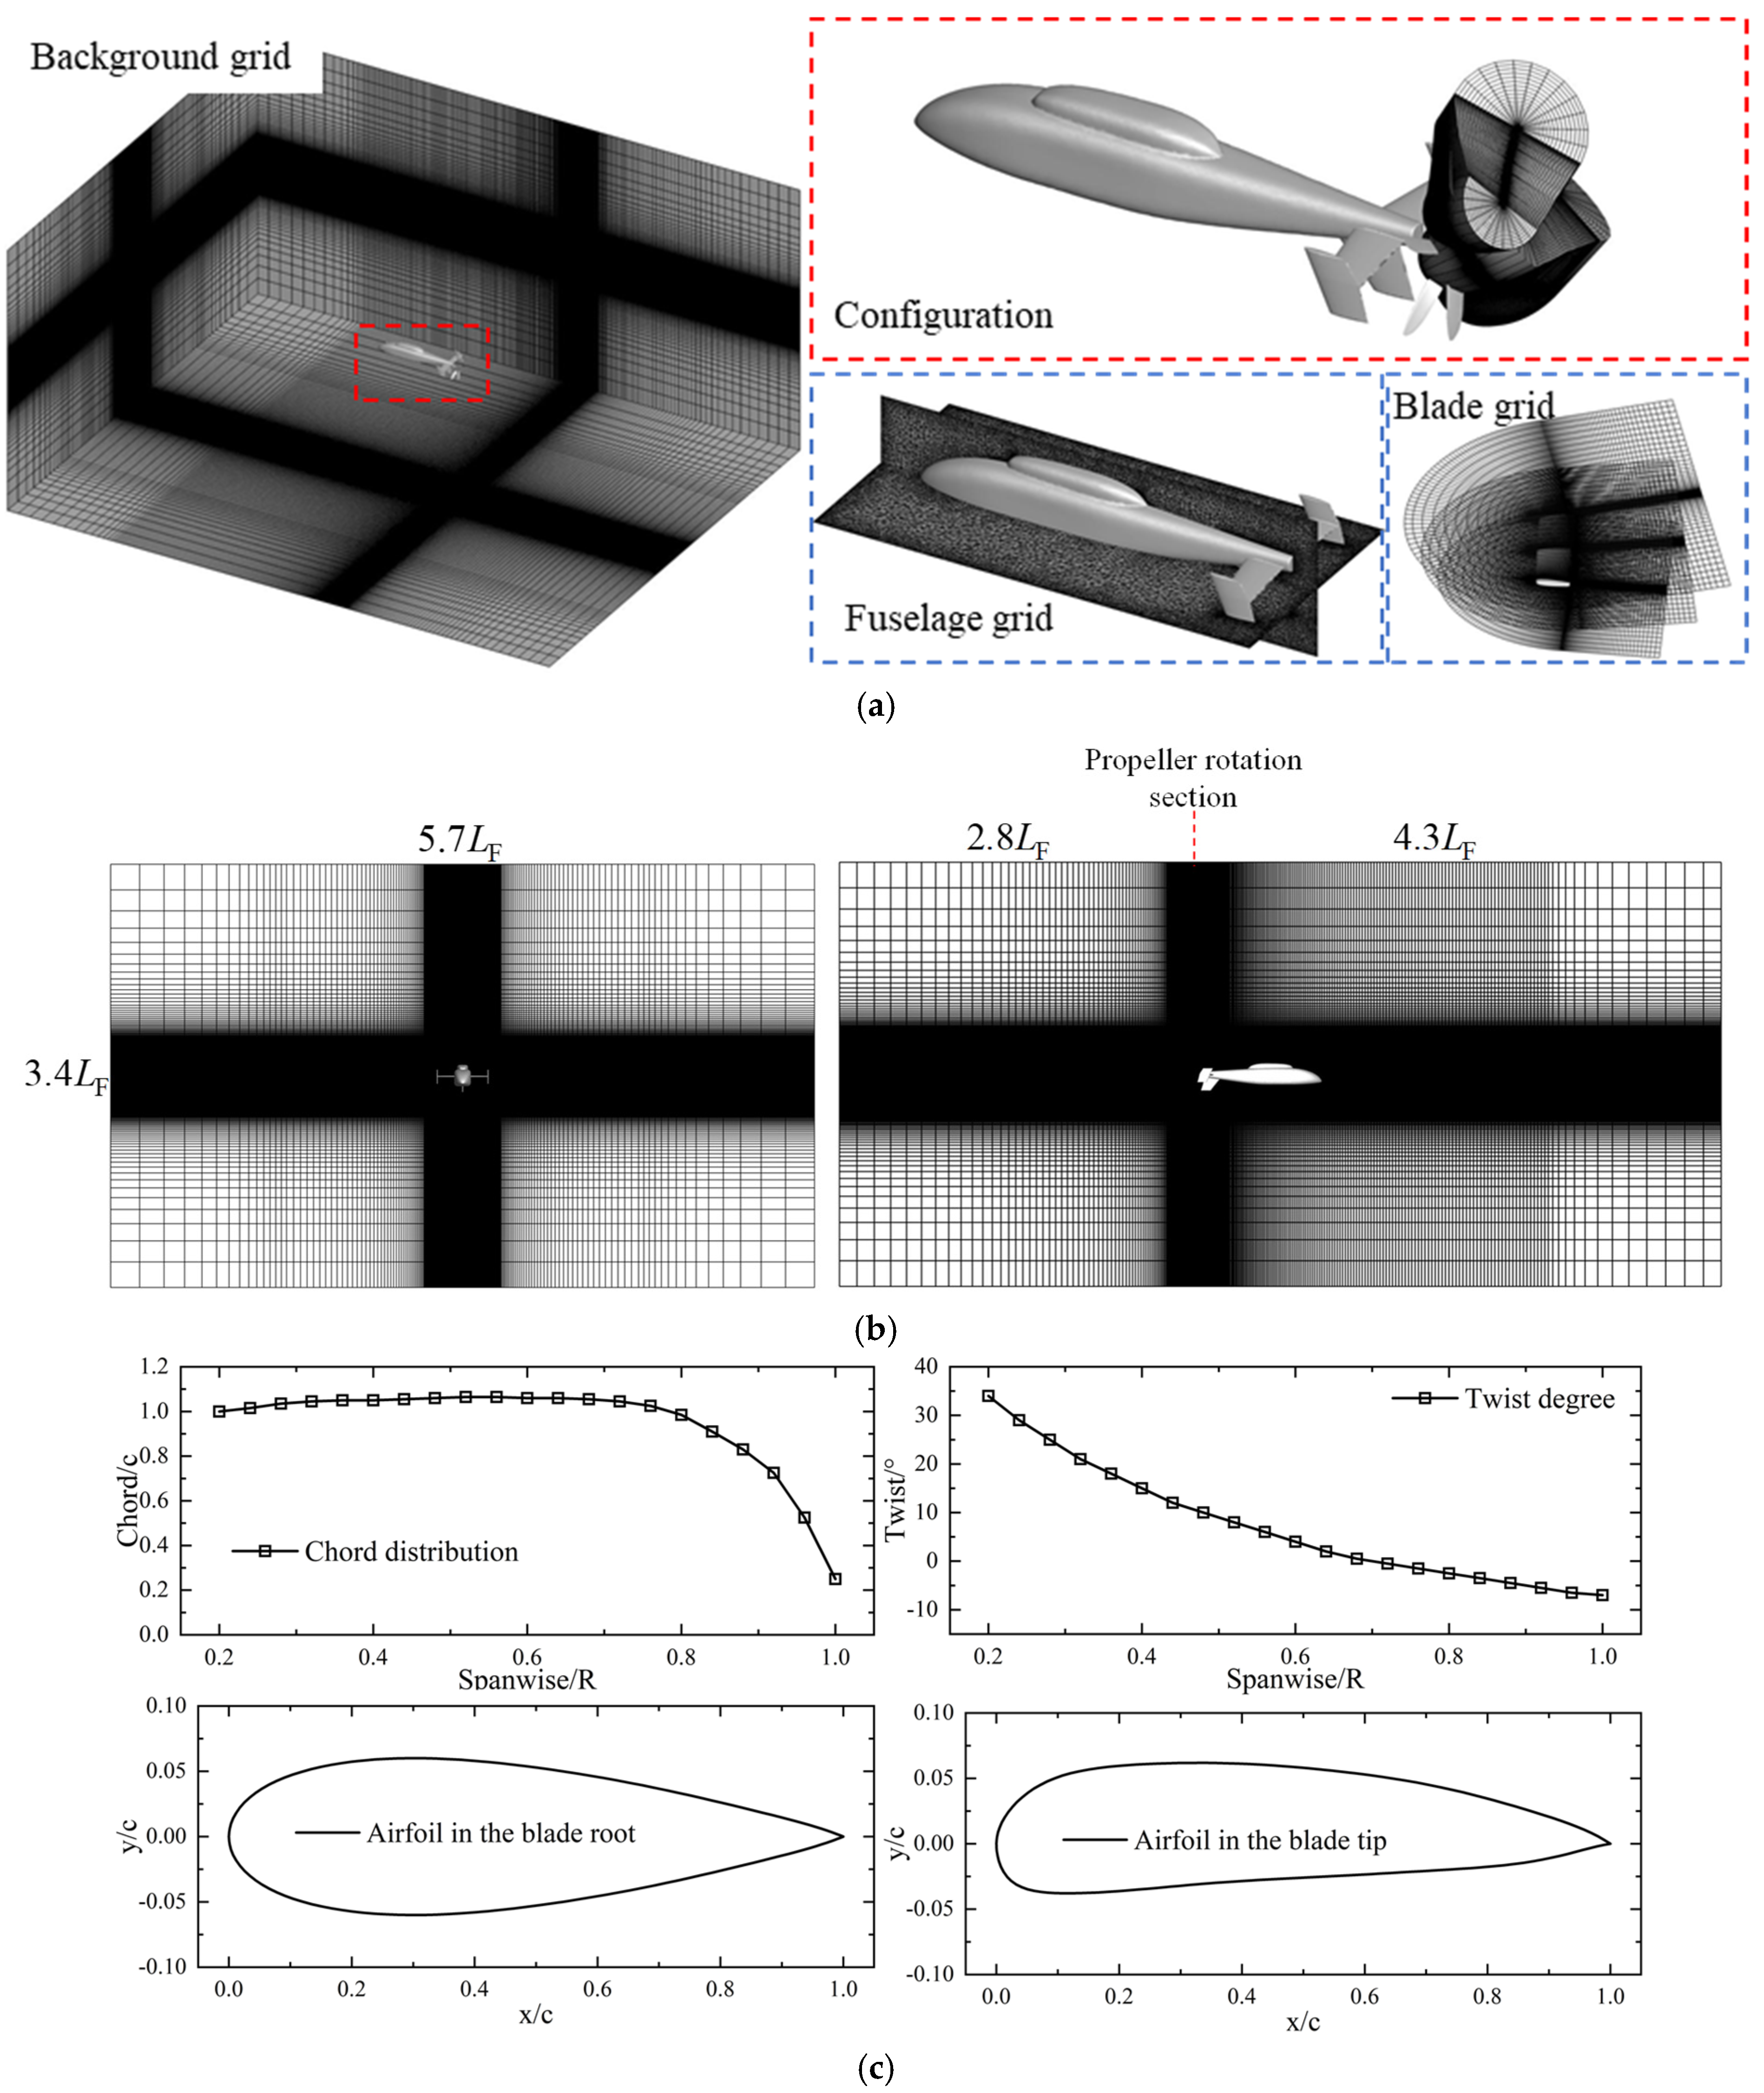
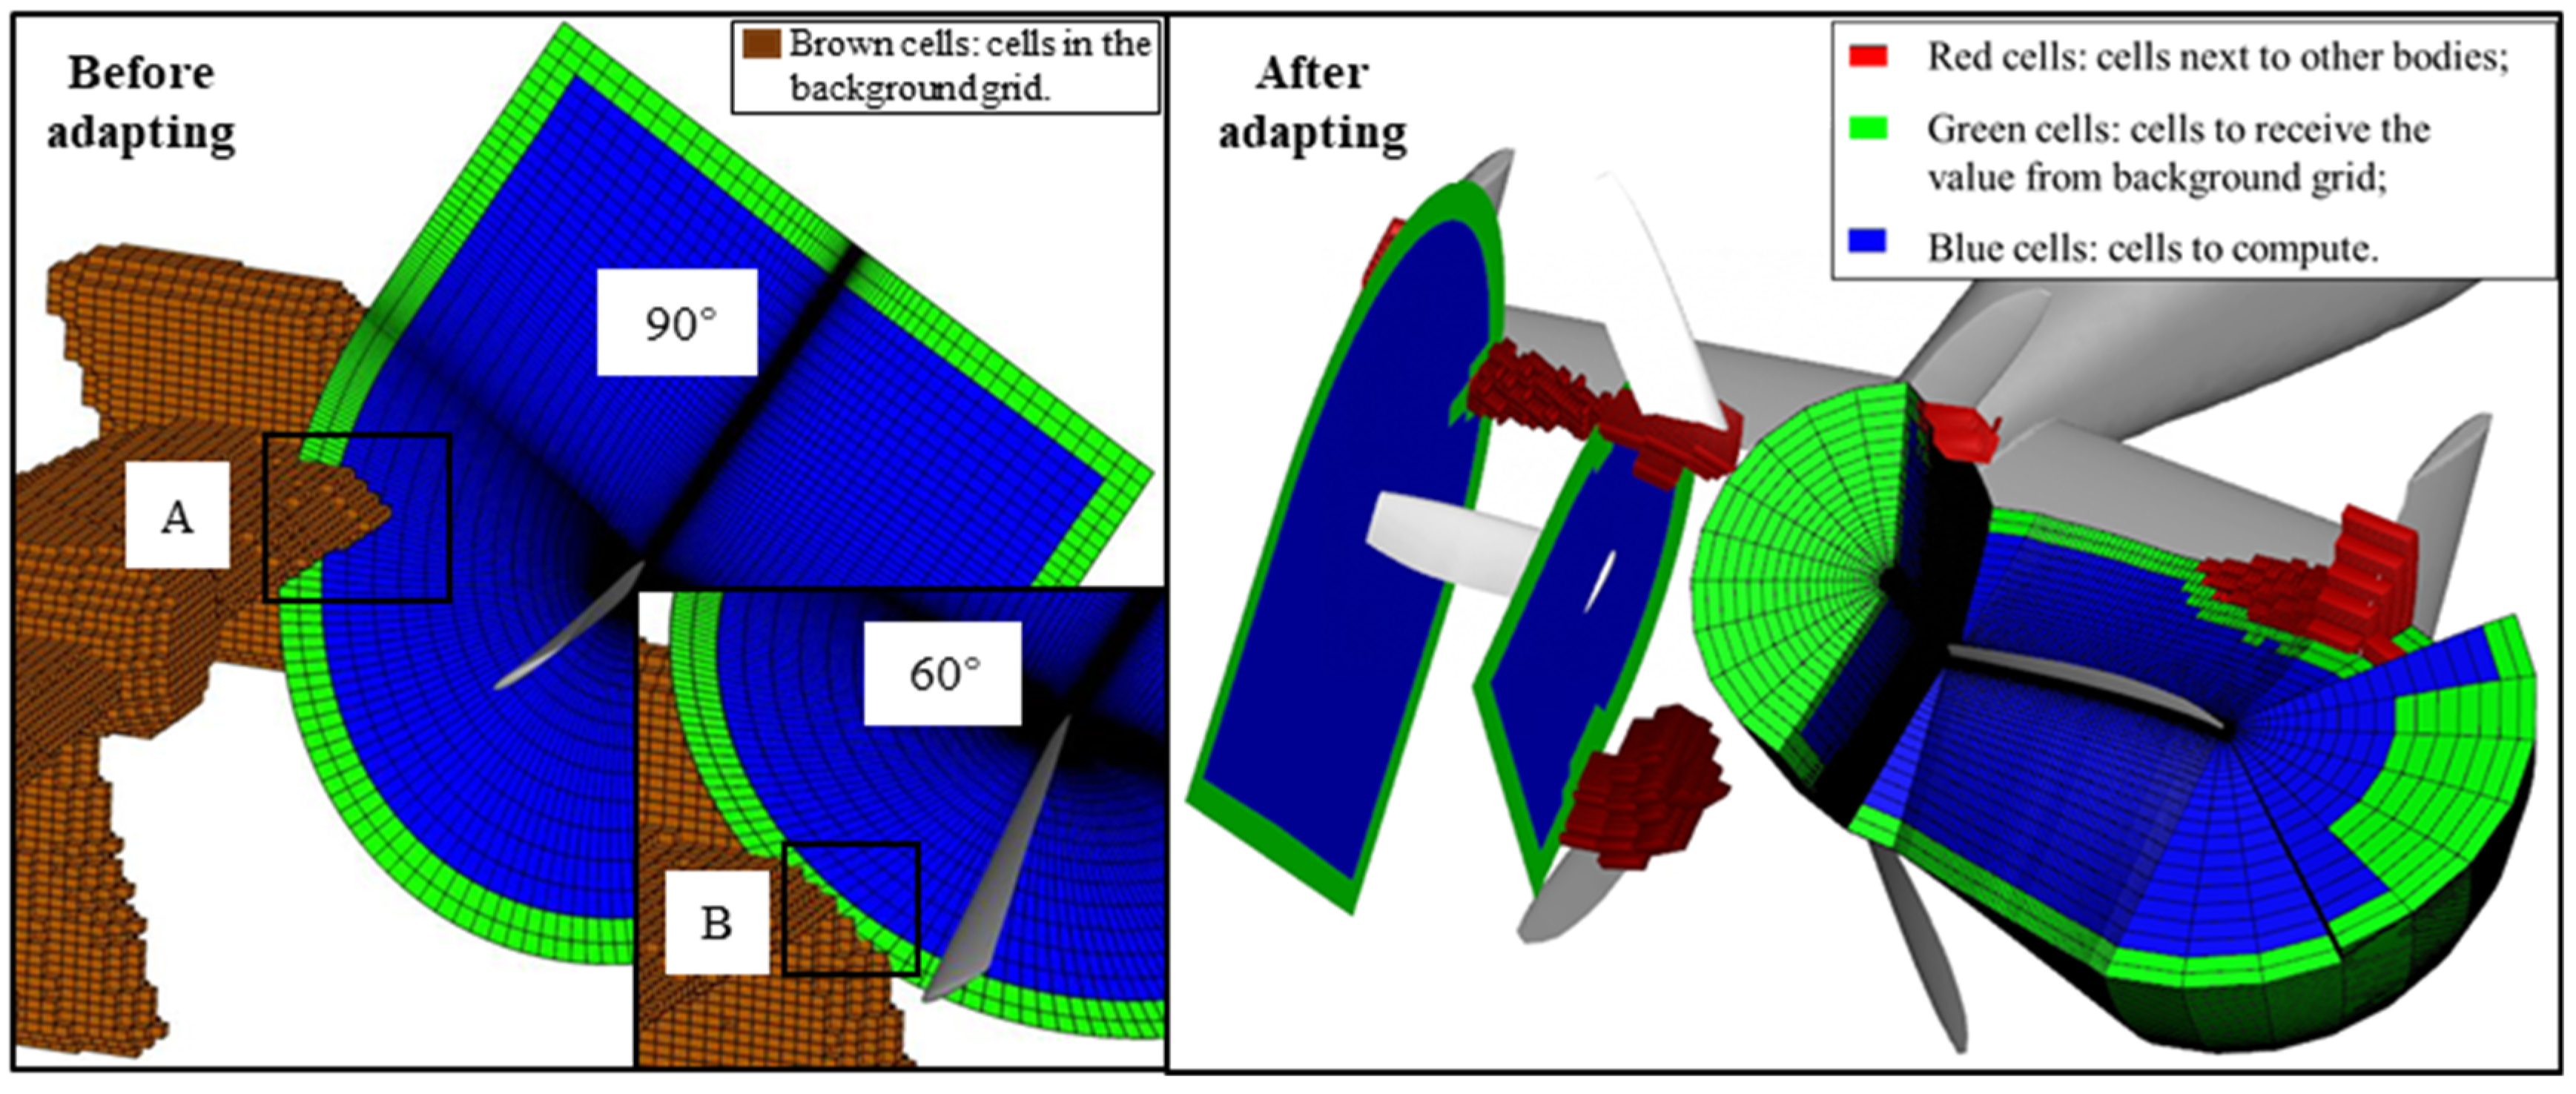
2.1. Adaptive Boundary Method in the Hybrid Grid System

The propeller serves as a crucial propulsion source for a high-speed coaxial-rotor helicopter. In order to simulate the flowfield surrounding the fuselage and propeller and account for interferences, a moving embedded grid method was utilized. Figure 1a illustrates the implementation of overlapping grids, with a C-O topology employed for the blades and an unstructured grid employed for the fuselage. All grids for the structures were assembled within the background grid. The computational domain dimensions are also shown in Figure 1b. Figure 1c illustrates the geometric parameters of the propeller blade employed in the study.
In multi-component moving embedded grid systems, a spatial issue arises when the computational zone of a moving grid overlaps with other component entities in both time and space. The overlap creates a situation where the boundary cells acquire values from neighboring “hole” cells within a different entity, thereby compromising the reliability of the simulation. The complexity of the fuselage further exacerbates the overlap problem between the blade grids and the fuselage entity. To address this problem, a novel boundary identification method was developed by adjusting the grid boundary based on the entities involved. During each iterative step, when the body-fitted receiving cell overlapped with the “hole” cells in the background grid, the receiving markers were assigned to infield cells. Through multiple iterations, all marked receiving cells gradually moved away from the background mesh “hole” cells.
Figure 2 depicts the grid boundaries before and after the implementation of the identification method. It was evident that overlaps occurred at multiple azimuths between the boundary cells (green cells) of the blade grid in regions A/B and the fuselage “hole” cells in the background grid. Transmitting the values directly would result in the boundary cells receiving values from deactivated fuselage “hole” cells in the background grid during computational iterations. However, after applying the method, it could be observed that the new boundary cells were well adapted with the respective entities, effectively avoiding the grid/entity overlap issues. In Figure 2, red cells indicate disabled cells that overlapped with the fuselage or other blade entities, and these cells were excluded from numerical computation. The green grids represent the adaptive boundary cells of the blade grid that received values from cells in the background grid, while the blue grids denote the computational cells.
Figure 3a illustrates the iterative process of boundary cells in blade grids. Firstly, hole pre-processing was performed on the background grid, and intergrid interpolation coefficients and donor elements were identified using a non-search method based on inverse mappings of the computational space [33]. When an overlap problem occurred, infield cells were selected as new boundary cells based on the vector direction from the center of the cells to the center of gravity of the blade. Subsequently, new donor cells were searched for and values were transferred to the new boundary cells during the iterative process. Figure 3b presents the adaptation of the outer boundary cells to the fuselage entity and other blade entities. It could be observed that, within the computational region inside the blade grid, at least two layers of cells were marked as boundary cells in any direction and were maintained at a distance from other entities. This indicated that the employed boundary identification method effectively avoided overlap problems between grids and other component entities, thereby enhancing the robustness of the multi-component grid system.

2.2. CFD Method

The flowfield surrounding the fuselage and propeller was simulated by using the CLORNS computational fluid dynamics (CFD) solver code [31,32]. This solver incorporates a newly implemented boundary identification method and is designed to solve the URANS equations in an integral form.
t Ω W d Ω + Ω ( F c F v ) d S = 0 ,
where W denotes the conservative variables, F c is the convective flux, and F v is the viscous flux.
W = ρ ρ u ρ v ρ w ρ E , F c = ρ V V ω ρ u V V ω + n x p ρ v V V ω + n y p ρ w V V ω + n z p ρ H V V ω + V ω p , F v = 0 n x τ x x + n y τ x y + n z τ x z n x τ y x + n y τ y y + n z τ y z n x τ x x + n y τ x y + n z τ x z n x Θ x + n y Θ y + n z Θ z ,
where u, v and w are velocity components; ρ , p , E , H are the density, pressure, total internal energy and total enthalpy, respectively; Ω is the volume of cells; S is the area of the cell surface; V ω = u e , v e , w e T is the frame velocity; V = u , v , w T is the fluid velocity; n = n x , n y , n z T is the cell surface normal vector; and τ , Θ are the viscous stress tensor terms and heat flux.
The CLORNS solver utilized the Roe scheme for numerical computation and employed an explicit dual-time stepping approach for unsteady calculations. To simulate turbulence viscosity and viscous fluxes, the S-A turbulence model was applied. The farfield boundary was treated with a reflection-free boundary condition, while a slip-free adiabatic boundary condition was employed for the object surface boundary. It is important to note that the momentum source method lacks sufficient accuracy as a flowfield simulation method for noise prediction, especially with weak simulation capabilities for the rotor vortex system. However, due to the relatively low probability of interference between the vortex system of the coaxial rotors and the propeller at high speeds, the downwash flow of the coaxial rotors becomes the main influencing factor of the rotors on the propeller. Therefore, it is acceptable to use the momentum source method to account for the impact of the downwash flow on the flowfield.

2.3. Aeroacoustic Analogy Method

The FW-H equation [34] has been widely employed to predict propeller or rotor noise. The Ffowcs Williams and Hawkings equation with a penetrable data surface (FW-H_pds) [35] and the adaptive integrating surface method [29] were utilized to calculate the farfield noise generated by the propeller, taking into account its high rotational speed and forward flight velocity. Additionally, a code for FW-H calculations based on the propagation time was implemented in the aeroacoustic prediction [30] to enhance the computational efficiency.
p ( x , t ) = p L ( x , t ) + p T ( x , t ) + p Q ( x , t ) ,
where
p L ( x , t ) = 1 4 π c 0 f = 0 l ˙ i r ^ i r ( 1 M a r ) 2 r e t d s + 1 4 π f = 0 l r l i M a i r 2 ( 1 M a r ) 2 r e t d s + 1 4 π c 0 f = 0 l r ( r M ˙ a i r ^ i + c 0 M a r c 0 M a 2 ) r 2 ( 1 M a r ) 3 r e t d s ,
p T ( x , t ) = 1 4 π f = 0 ρ 0 V n ( r M ˙ a i r ^ i + c 0 M a r c 0 M a 2 ) r 2 ( 1 M a r ) 3 r e t d s + 1 4 π f = 0 ρ 0 V ˙ n r ( 1 M a r ) 2 r e t d s
where c 0 and ρ 0 represents the speed of sound and density, respectively; the scalars r represent the distance between the observer point and the sound source point; s represents the surface area of the sound source; the superscript “ · ” denotes the derivative with respect to time t, and the subscript “ret” denotes the delay time τ ; r ^ represents the unit distance vectors between the observer point and the sound source point; M a represents the Mach number vector of the sound source surface; V n represents the normal velocity of the sound source surface; l represents the load of the sound source surface; the subscript “r” denotes the dot product of the vector and r ^ ; and the simultaneous subscripting “i” of two vectors denotes the dot product of the two vectors.

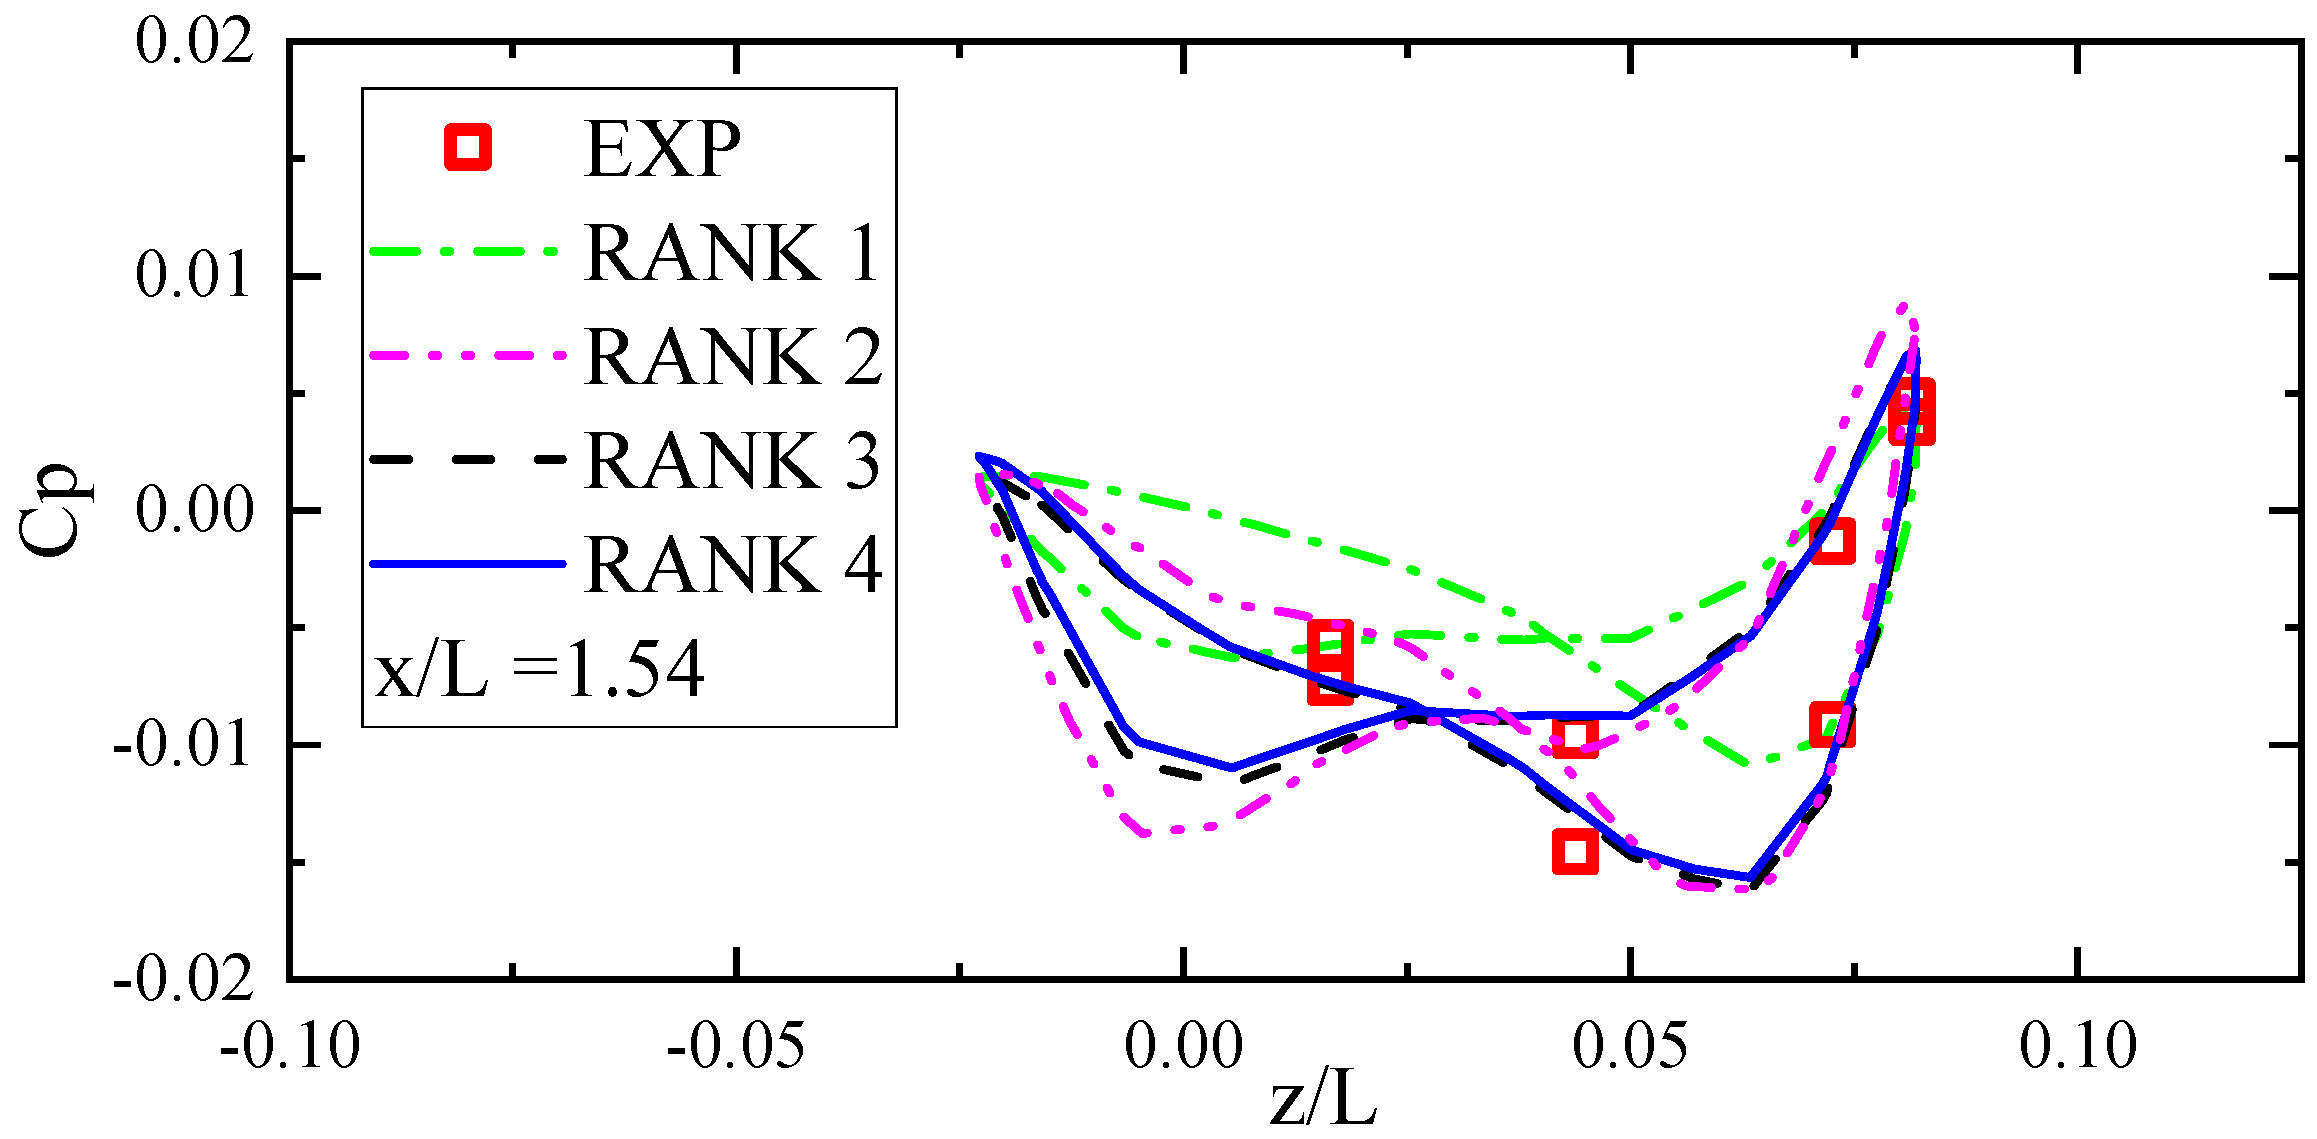
3. Method Validation

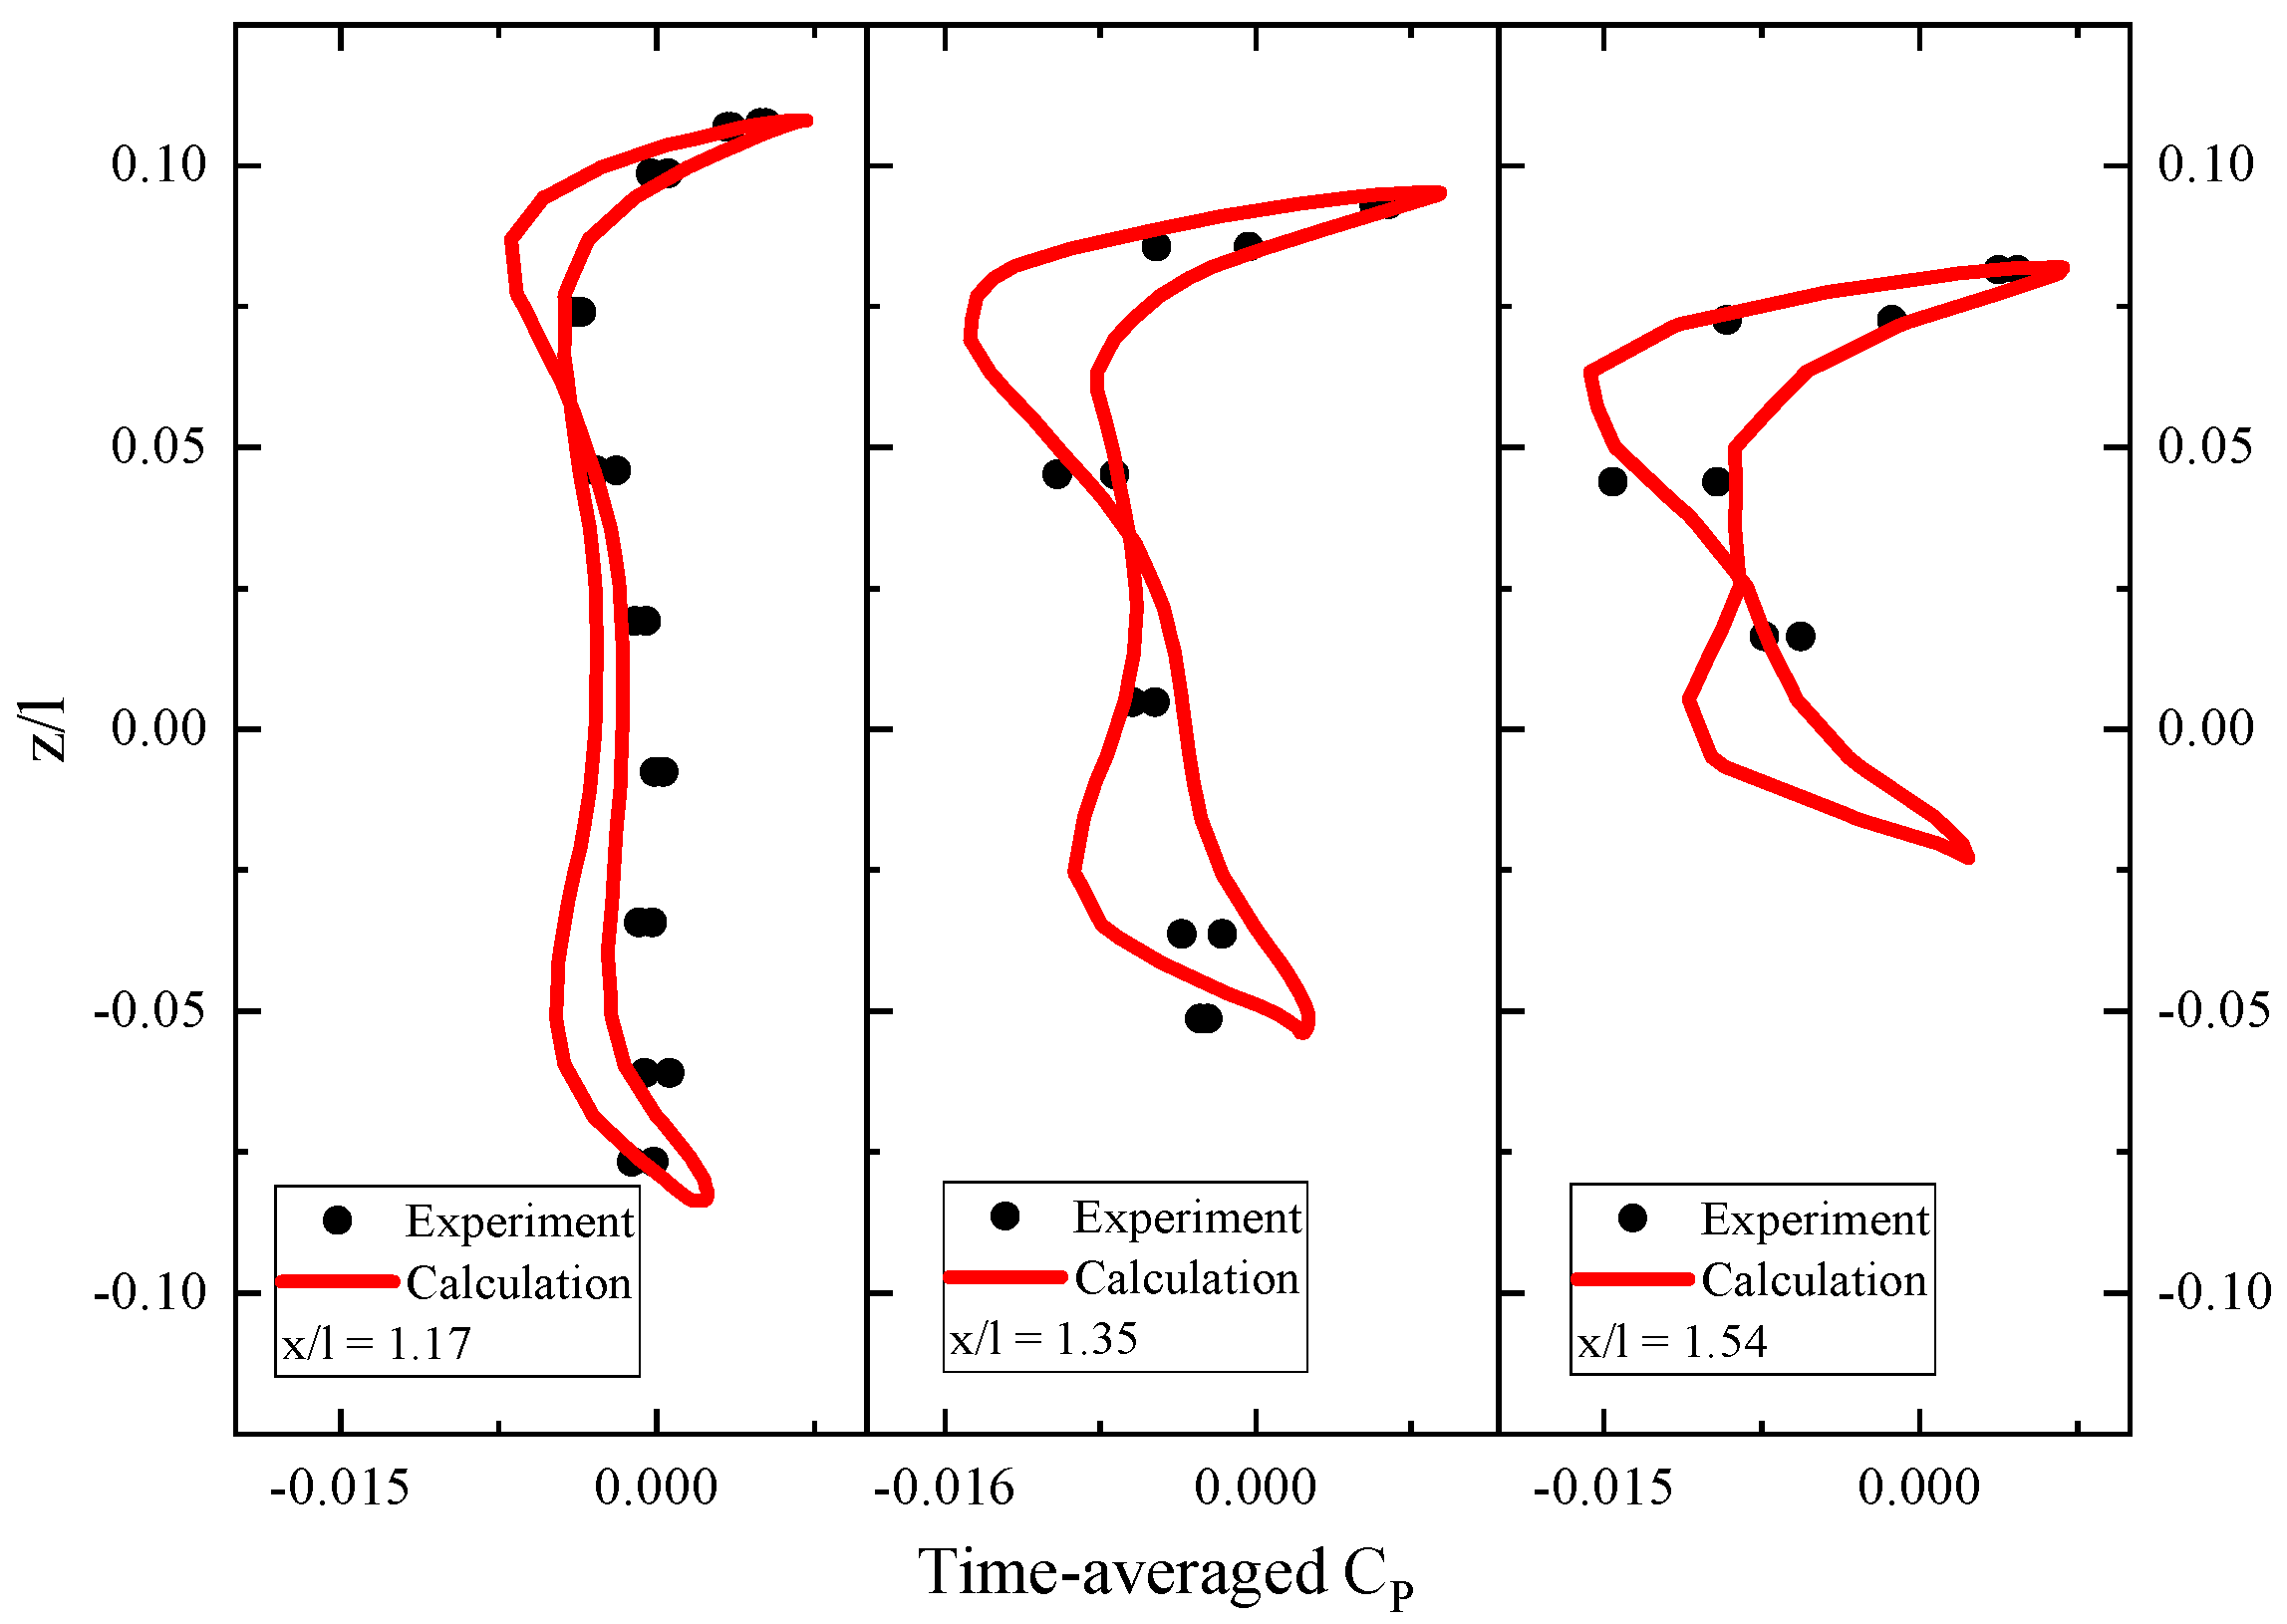
3.1. CFD Method Validation

The boundary method was validated using a well-known NASA ROBIN test case [36]. The test case chosen was given by M a t i p = 0.53 , μ = 0.05 and θ 0.7 = 8.9 . The calculated CT/σ value was 0.0654, closely matching the actual value of 0.0649 for the selected case. The experimental Cp value was extracted from the reported data for the selected test case in ref. [36]. The computational grids used for these calculations, along with the respective relative positions, are depicted in Figure 4. The rotor in the case consisted of four rectangular blades with an aspect ratio of 13 and a linear twist of −8°. The half-length of the fuselage, denoted as L, was equal to 15.05 times the blade chord length, c, which was measured as 66.3 mm. Additionally, the fuselage center was offset from the rotor center by −0.768 c.
Cp = p p / ρ V 2 .
Table 1 presents the grid quantities of the four grid systems utilized for grid convergence verification, while the comparison of the results is depicted in Figure 5. It was evident that the computational results of RANKS 1 and 2 deviated significantly from the experimental values. In contrast, the results of RANKS 3 and 4 showed close agreement with each other and demonstrated good alignment with the experimental values. Considering the trade-off between computational efficiency and accuracy, the grid configuration represented by RANK 3 was deemed suitable for the numerical simulations conducted.
Figure 6 illustrates the comparison of the surface pressure coefficients on various fuselage sections at a scale of RANK 3. The results clearly indicated that the calculated values for each section exhibited excellent agreement with the corresponding experimental values. In this case, the calculation time step was defined as the duration required for the blades to rotate through a 1° azimuth angle in the flowfield simulation.

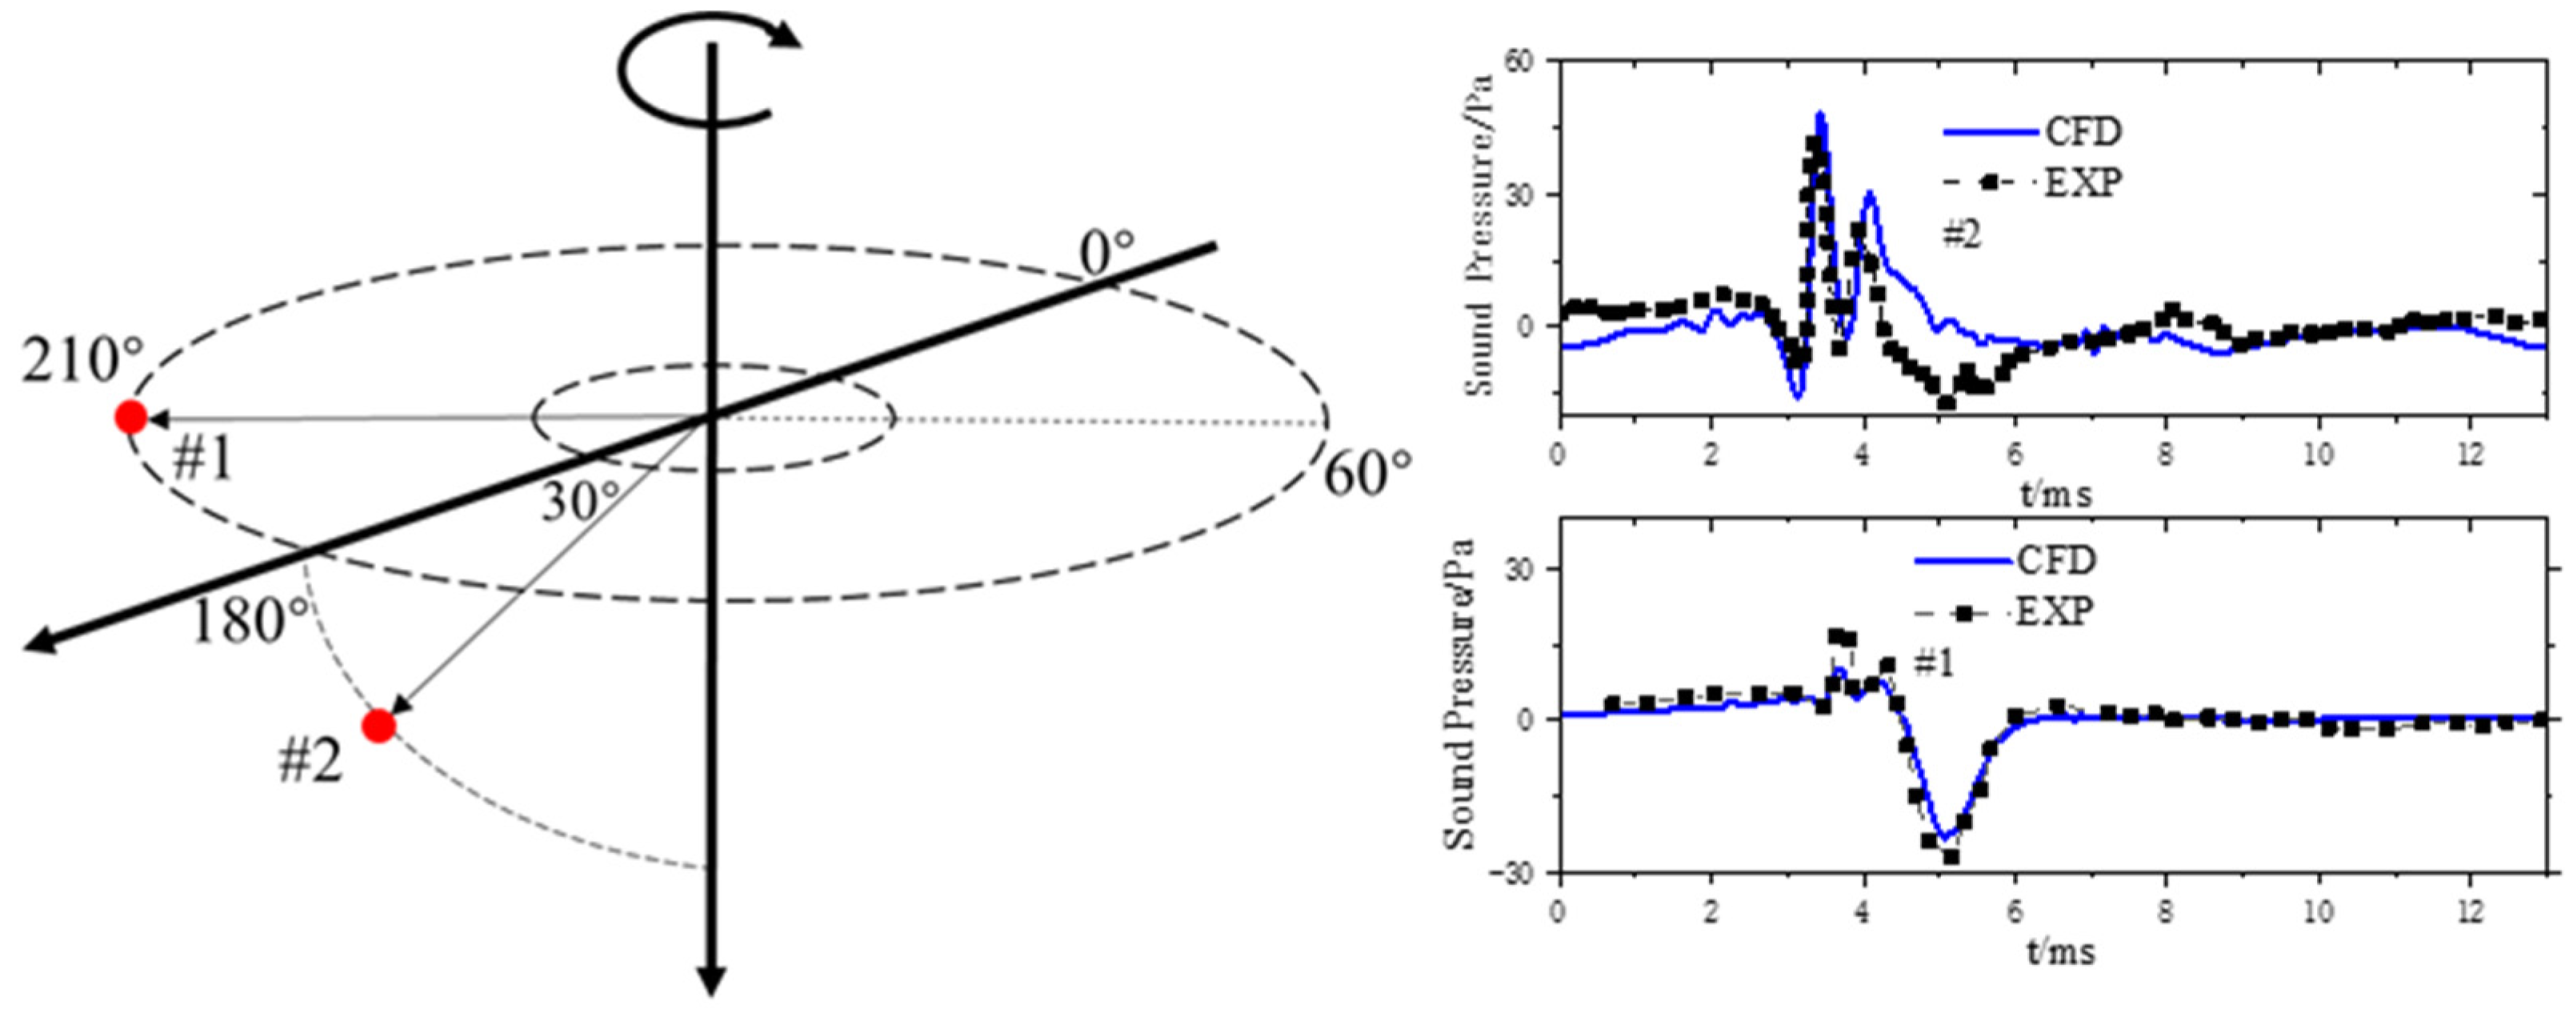
3.2. Aeroacoustic Prediction Method Validation

The rotor–vortex interference noise case of the AH-1G rotor (state 10,014 [37]) was selected for validation, taking into account the potential influence of the wake on the propeller. Figure 7 illustrates the close agreement between the predicted and experimental noise results of the two observers. The chosen observers were positioned at a distance of 31.7 c from the center of the rotor (where c represents the chord length of the AH-1G rotor). Observer #2 was situated at an azimuth angle of 180° and an angle of −30° with respect to the rotor disk, while observer #1 was located at an azimuth angle of 210° and an angle of 0° with respect to the rotor disk. In this case, the calculation time step was defined as the duration required for the blades to rotate through a 0.5° azimuth angle in the flowfield simulation.

4. Numerical Results

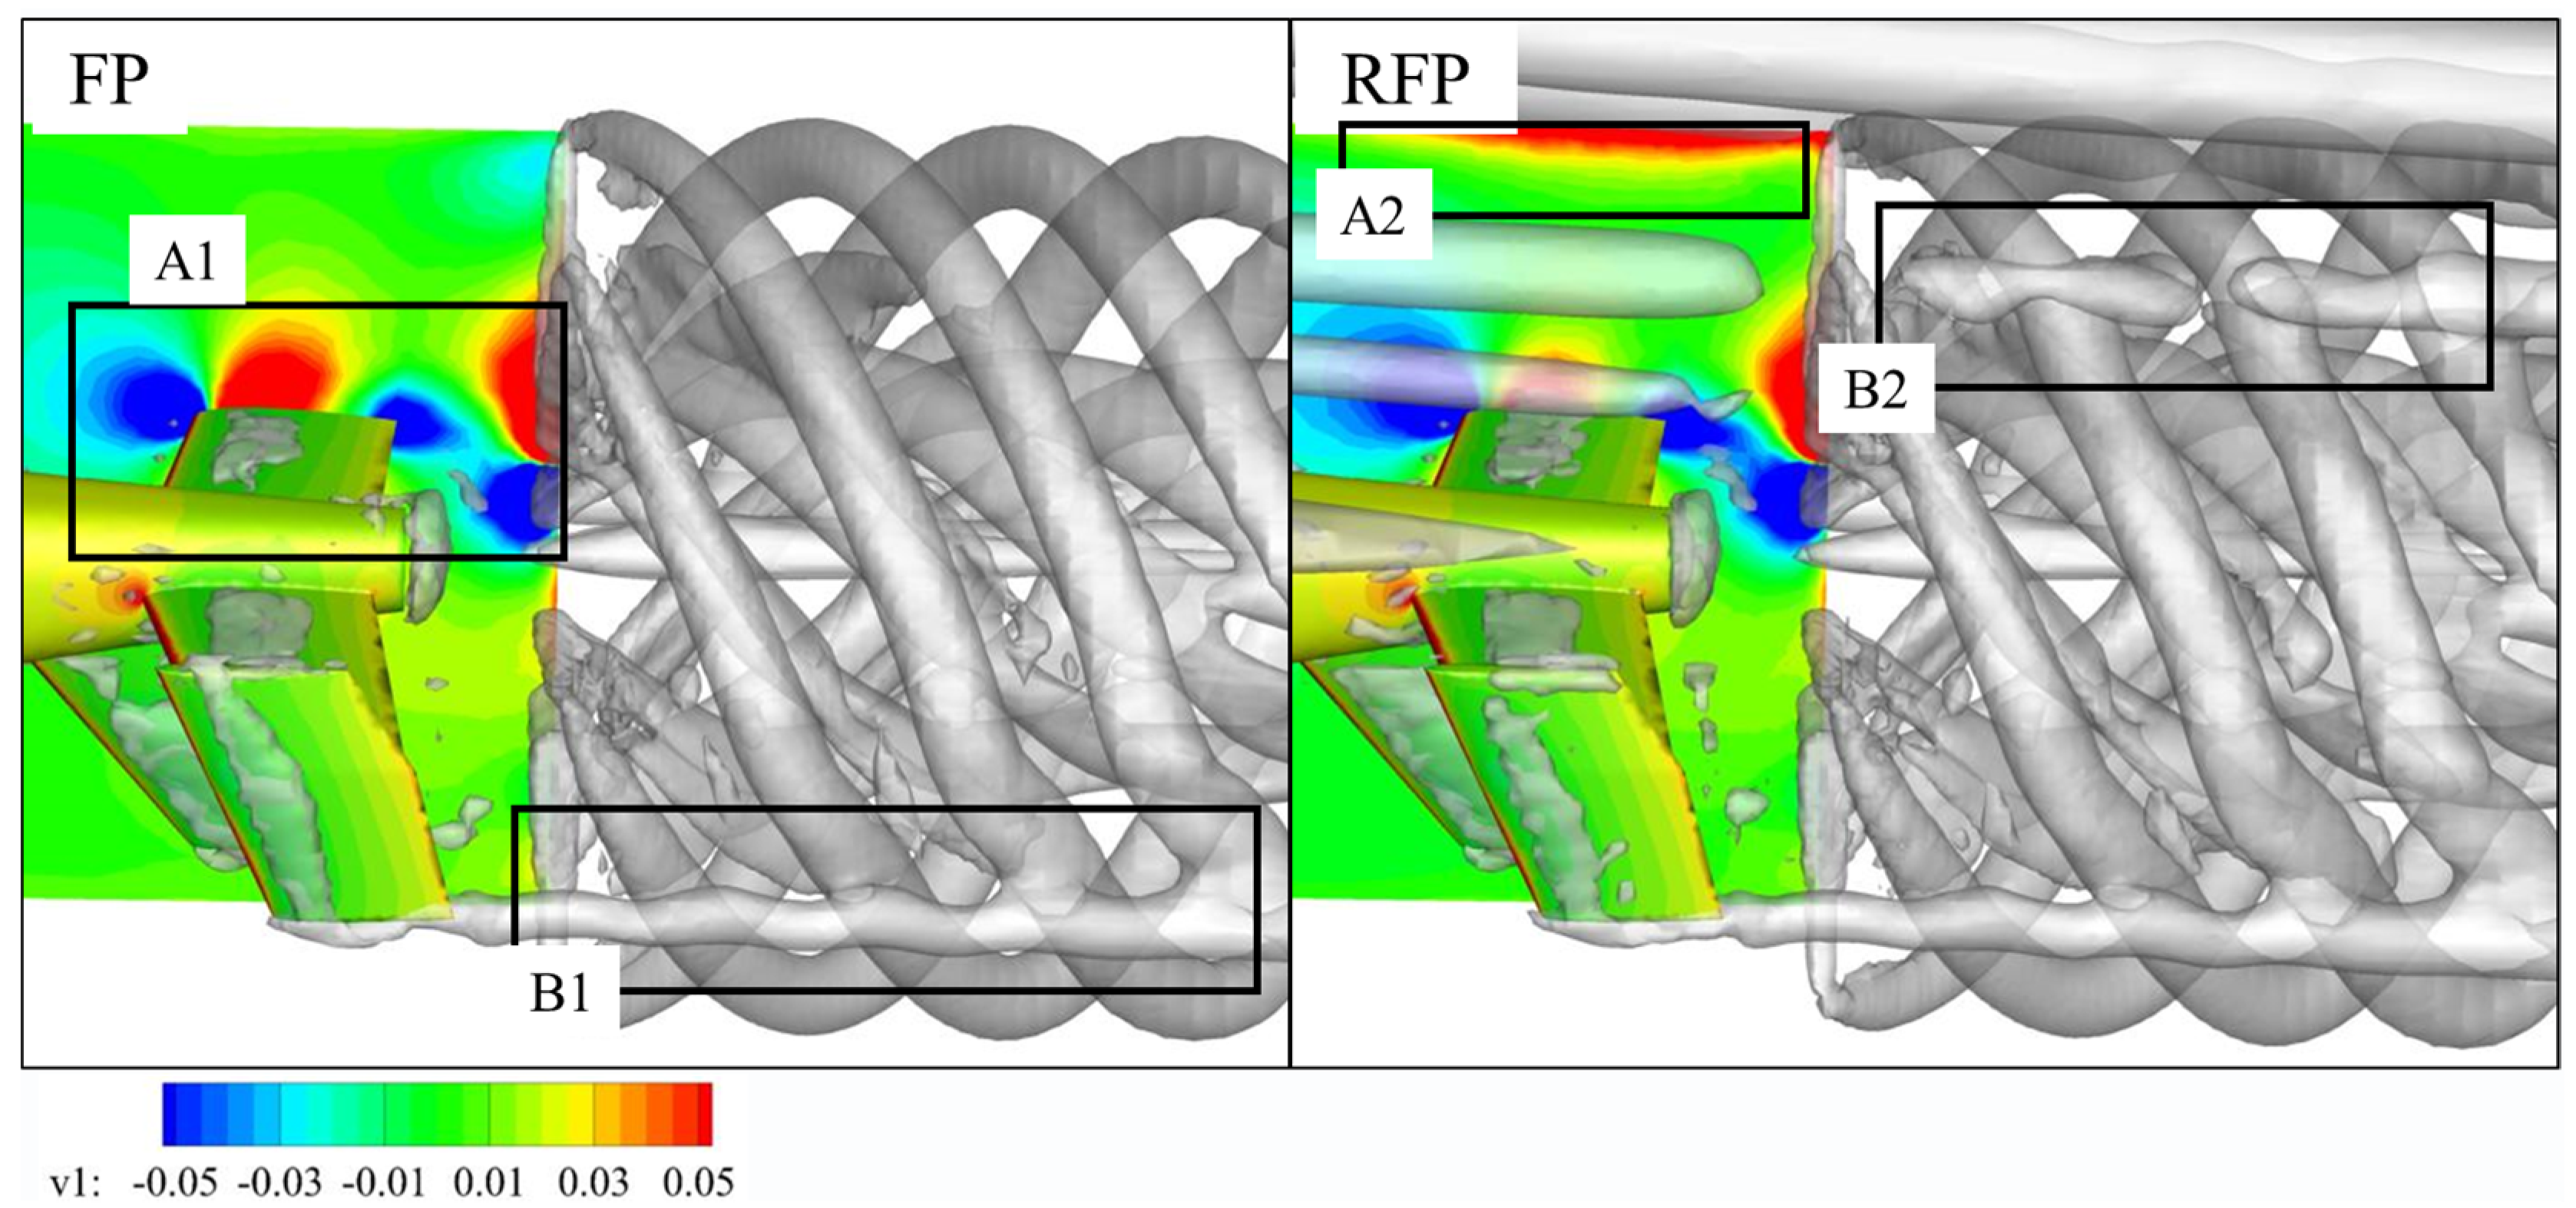
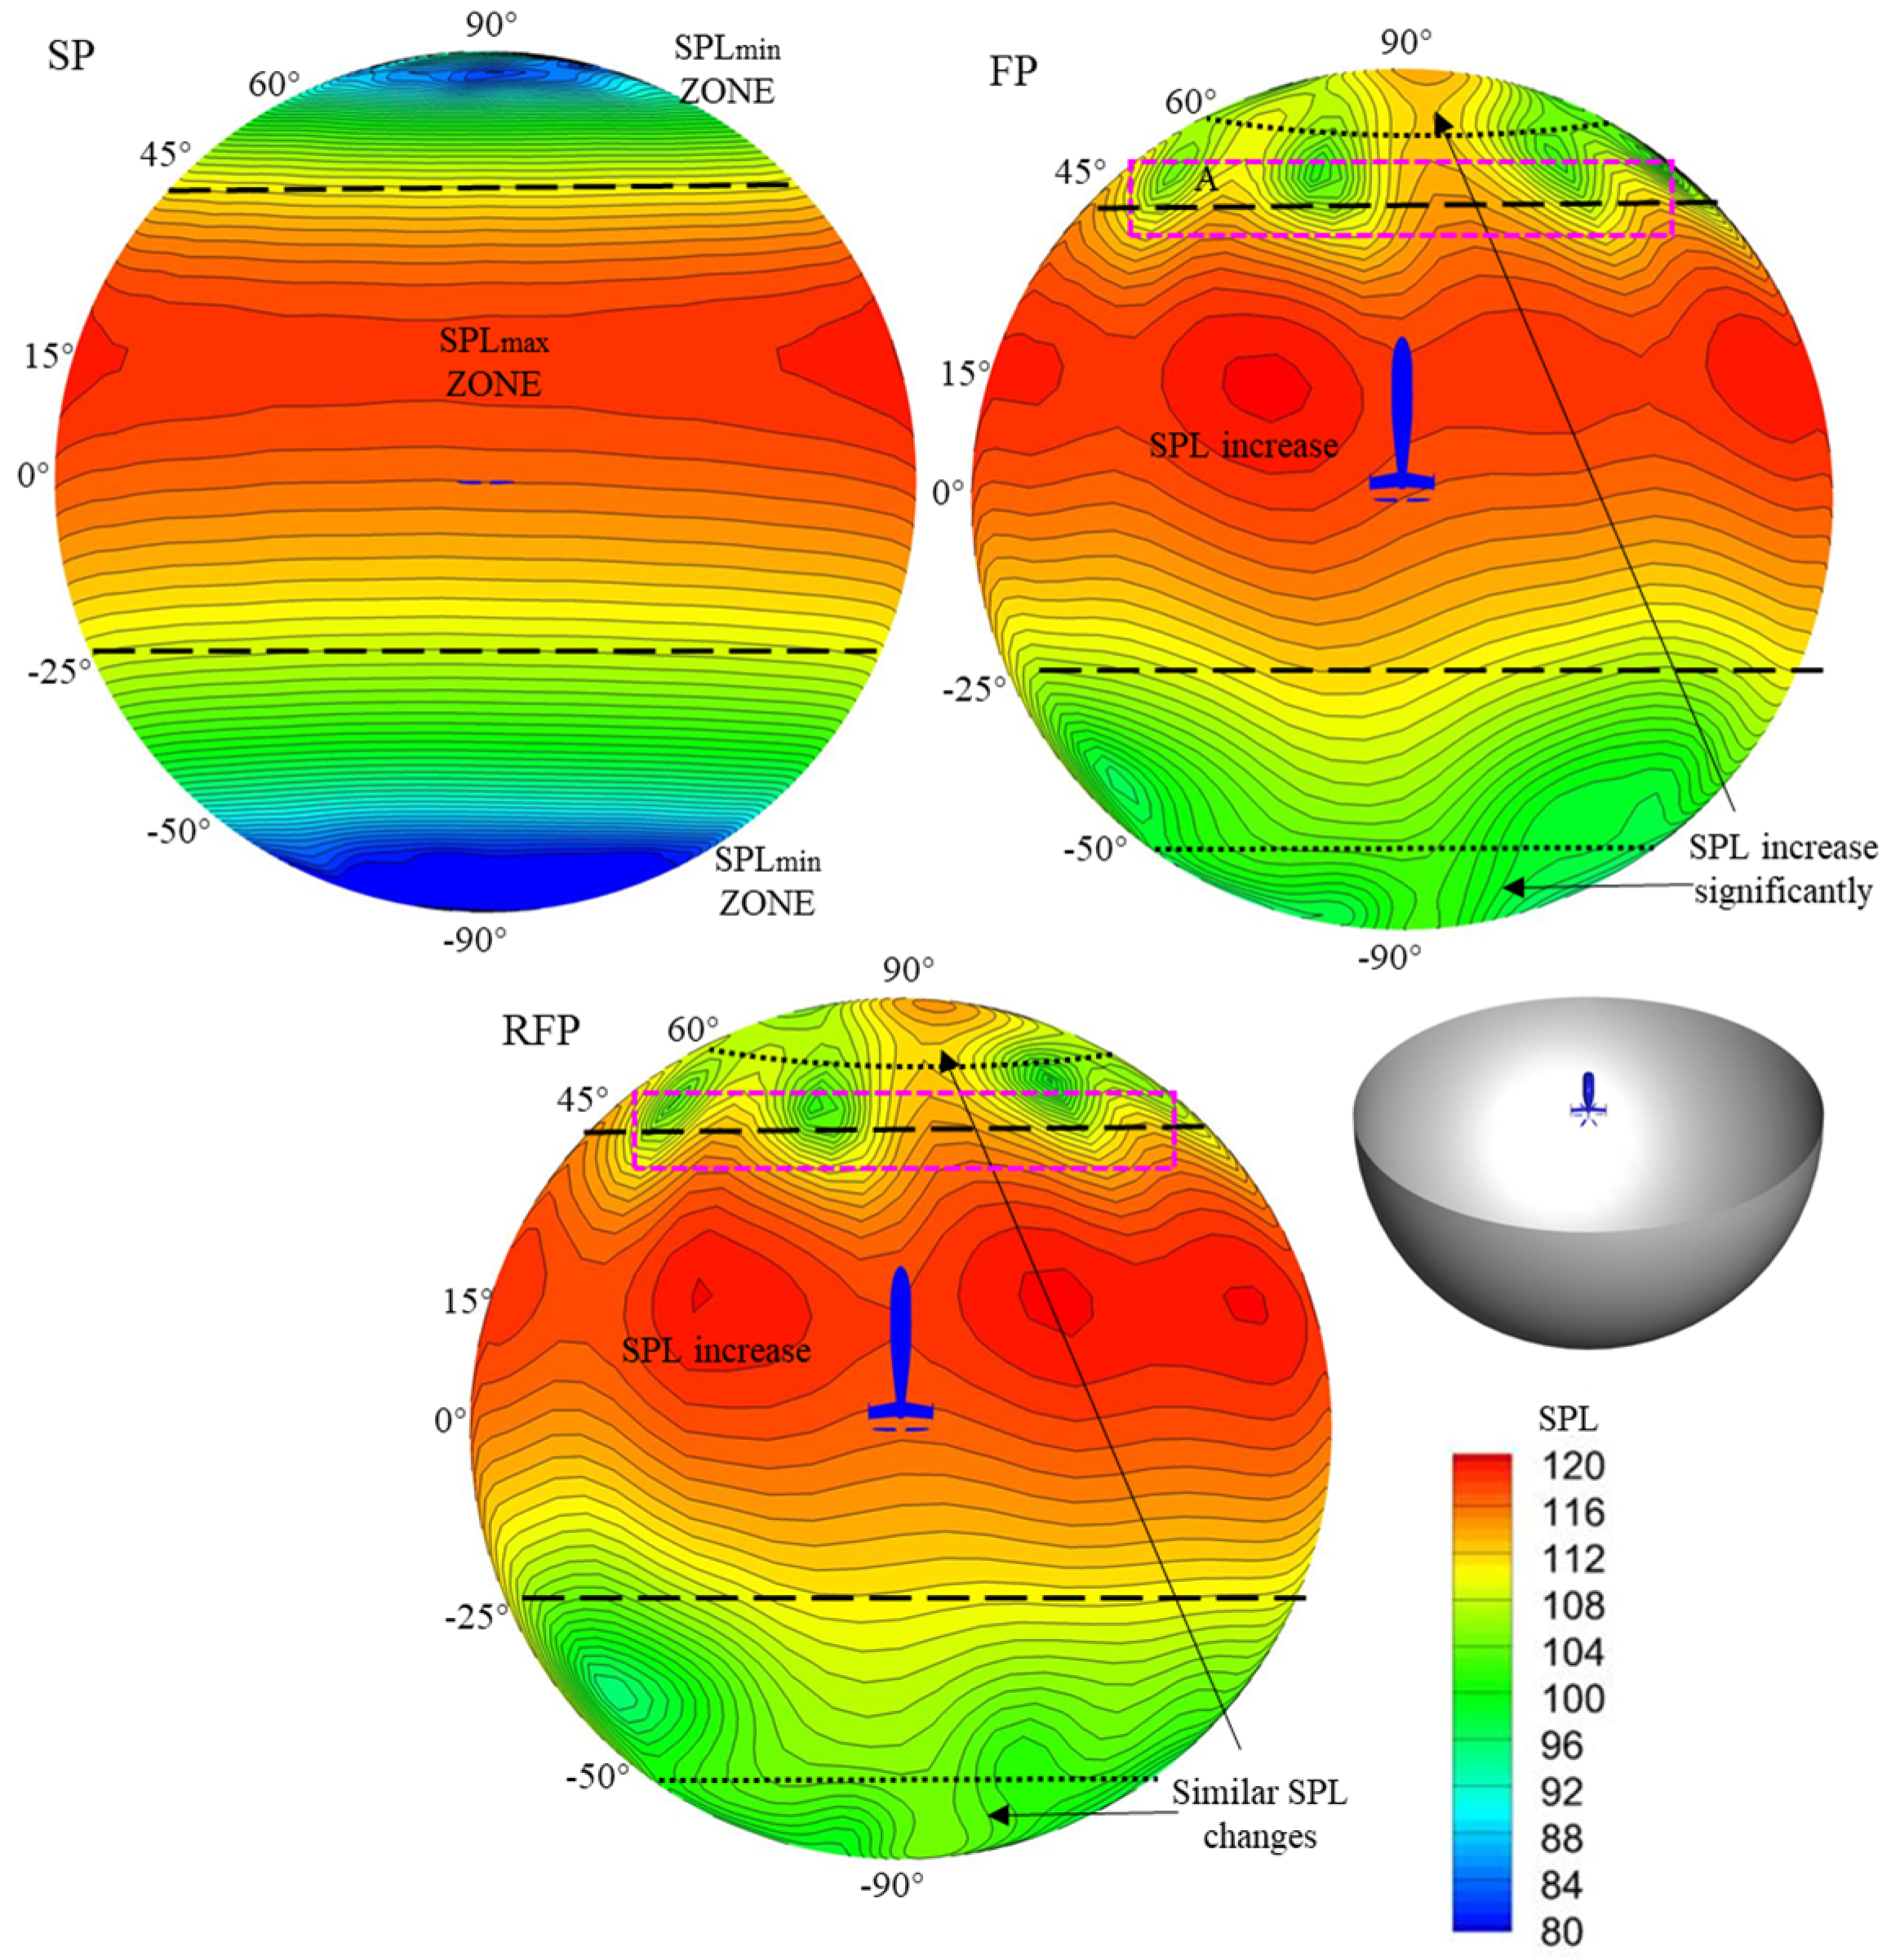
4.1. Forward Flight Case

Referring to a series of high-speed helicopter studies [38,39,40] that reported maximum flight speeds ranging from 370 km/h to 463 km/h, the high-speed state with a forward speed of 396 km/h (Ma = 0.323) was selected for the simulation of the fuselage/propeller flowfield. In this state, the collective pitch was set to 37.4°, the inflow angle was −2°, and other parameters were as listed in Table 2. Figure 8 illustrates three computational configurations depicting the relative positions of the components: a single propeller configuration (SP), a fuselage and propeller configuration (FP), and a coaxial-rotor/fuselage/propeller configuration (RFP). The front part of the fuselage was modeled based on the ROBIN fuselage, while the tail configuration, which included the side-tail, mid-tail, and flat-tail components, was based on the S-97 helicopter. The grid quantities were as follows: 6 × 239 × 79 × 72 for the blade grids, 3,869,580 for the fuselage grid, and 441 × 356 × 237 for the background grid. Consequently, the total number of grids was approximately 4.9 × 10⁷. Table 3 lists the boundaries and boundary conditions adopted in the numerical simulation and noise prediction.
The flowfields of the three configurations are depicted in Figure 9. The variation in the v1 distribution caused by the fuselage and coaxial rotors is shown in zones A1 and A2, respectively. In zone A1, the negative value of v1 was attributed to fuselage interference, which led to a decrease in the axial velocity (v) behind the fuselage. Conversely, in zone A2, the value of v1 was influenced by the interference of the coaxial rotors, resulting in an increase in v. As a result, the blades experienced lower v when rotating to the rear of the flat tail and higher v when moving just above it. Furthermore, the deceleration effect of the fuselage in zone A1 was slightly enhanced in the RFP configuration, possibly due to the downwash from the coaxial rotor altering the relative angle of attack of the flat tail and intensifying the deceleration effect. The influence of the fuselage and coaxial rotor on the axial velocity could be observed through changes in the thrust of the blades. The shedding vortex emitted by the fuselage was gradually entangled with the tip vortex of the propeller in zone B1, resulting in the notable distortion of the tip vortex. On the other hand, the tip vortex was relatively unaffected by the coaxial rotors in zone B2. This result suggested that the fuselage/coaxial rotors interfered more with the downstream vortex and were less likely to interfere with the flowfield near the blades.
The decrease in axial velocity led to an increase in the relative angle of attack of the blade, resulting in a thrust surge at the corresponding azimuths. The dFy/Fy,SP distribution is shown in Figure 10, where dFy/Fy,SP represents the comparison of the spanwise thrust of a single blade in the FP and RFP configurations to the results in the SP configuration. In zone A, significant thrust surges could be observed at azimuth angles of 90° and 270°, when the blade moved behind the flat tail on both sides. These thrust surges were influenced by the deceleration of the axial flow behind the flat tail. In zone B, the thrust at an azimuth angle of 180° exhibited a significant increase only at the root position due to the presence of a shorter mid-tail. Moreover, there was a decrease in thrust near the A zone, particularly close to the thrust surge azimuths. This decrease could be attributed to the fuselage obstruction, which reduced the cross-sectional area of airflow and had a lesser impact. Figure 10b demonstrates a significant decrease in thrust in zone C, corresponding to the effects of the accelerating flow caused by the coaxial rotors shown in Figure 9. In zone D, there was a general increase in the thrust when the azimuths corresponded to the A2 zone in Figure 9. The results suggested that the decelerating effects on the airflow were further enhanced when there was a downwash flow from the coaxial rotor.
Figure 11 presents the distribution of the sound pressure levels (SPL) of propeller noise on the aeroacoustic radiation hemisphere beneath the fuselage. In the SP configuration, the results showed the clear intensity stratification of the SPLs. The main direction of noise propagation fell within the interval of (−25°, 45°), while the secondary directions were within intervals of (45°, 60°) and (−50°, −25°). The high-angle intervals, (60°, 90°) and (−90°, −50°), exhibited the smallest SPL distributions. In the FP configuration, the SPLs at the hemispheric poles (90° and −90°) were significantly increased, and, in some instances, they exceeded those in the original secondary direction. These results indicated that fuselage interference could lead to more pronounced propeller noise in front of the fuselage. Additionally, in the A zone, situated at the secondary propagation direction, there were approximately three zones with higher SPL distributions, which might be attributed to the periodic interference of the six blades by the wake of the fuselage. Consequently, within a complete aeroacoustic radiation sphere, the interference resulted in six zones with higher SPL distributions, appearing as three regions of high noise within the hemisphere. In the RFP configuration, the SPL distribution in the high-angle interval was similar to that in the FP configuration, with a slight increase in the SPL peak within the interval of (−25°, 45°). It could be assumed that the influence of the coaxial rotors on the propeller noise was less significant in the high-angle interval. By considering the results from Figure 10 and Figure 11 for the FP and RFP configurations, the following conclusions could be inferred. The changes in the SPLs that were observed in the main and secondary propagation directions originated from the influences of the fuselage/coaxial rotors on the thrust of the blades across various azimuths. Furthermore, the significant increase in the SPLs in the high-angle interval could be attributed to the aerodynamic disturbances caused by the fuselage on the thrust surge and fallback.
It is important to note that the momentum source method lacks sufficient accuracy as a flowfield simulation method for noise prediction. As a result, this section only presents an exploratory study of propeller noise in the RFP configuration. The subsequent section does not include an analysis of propeller noise in the RFP configuration.

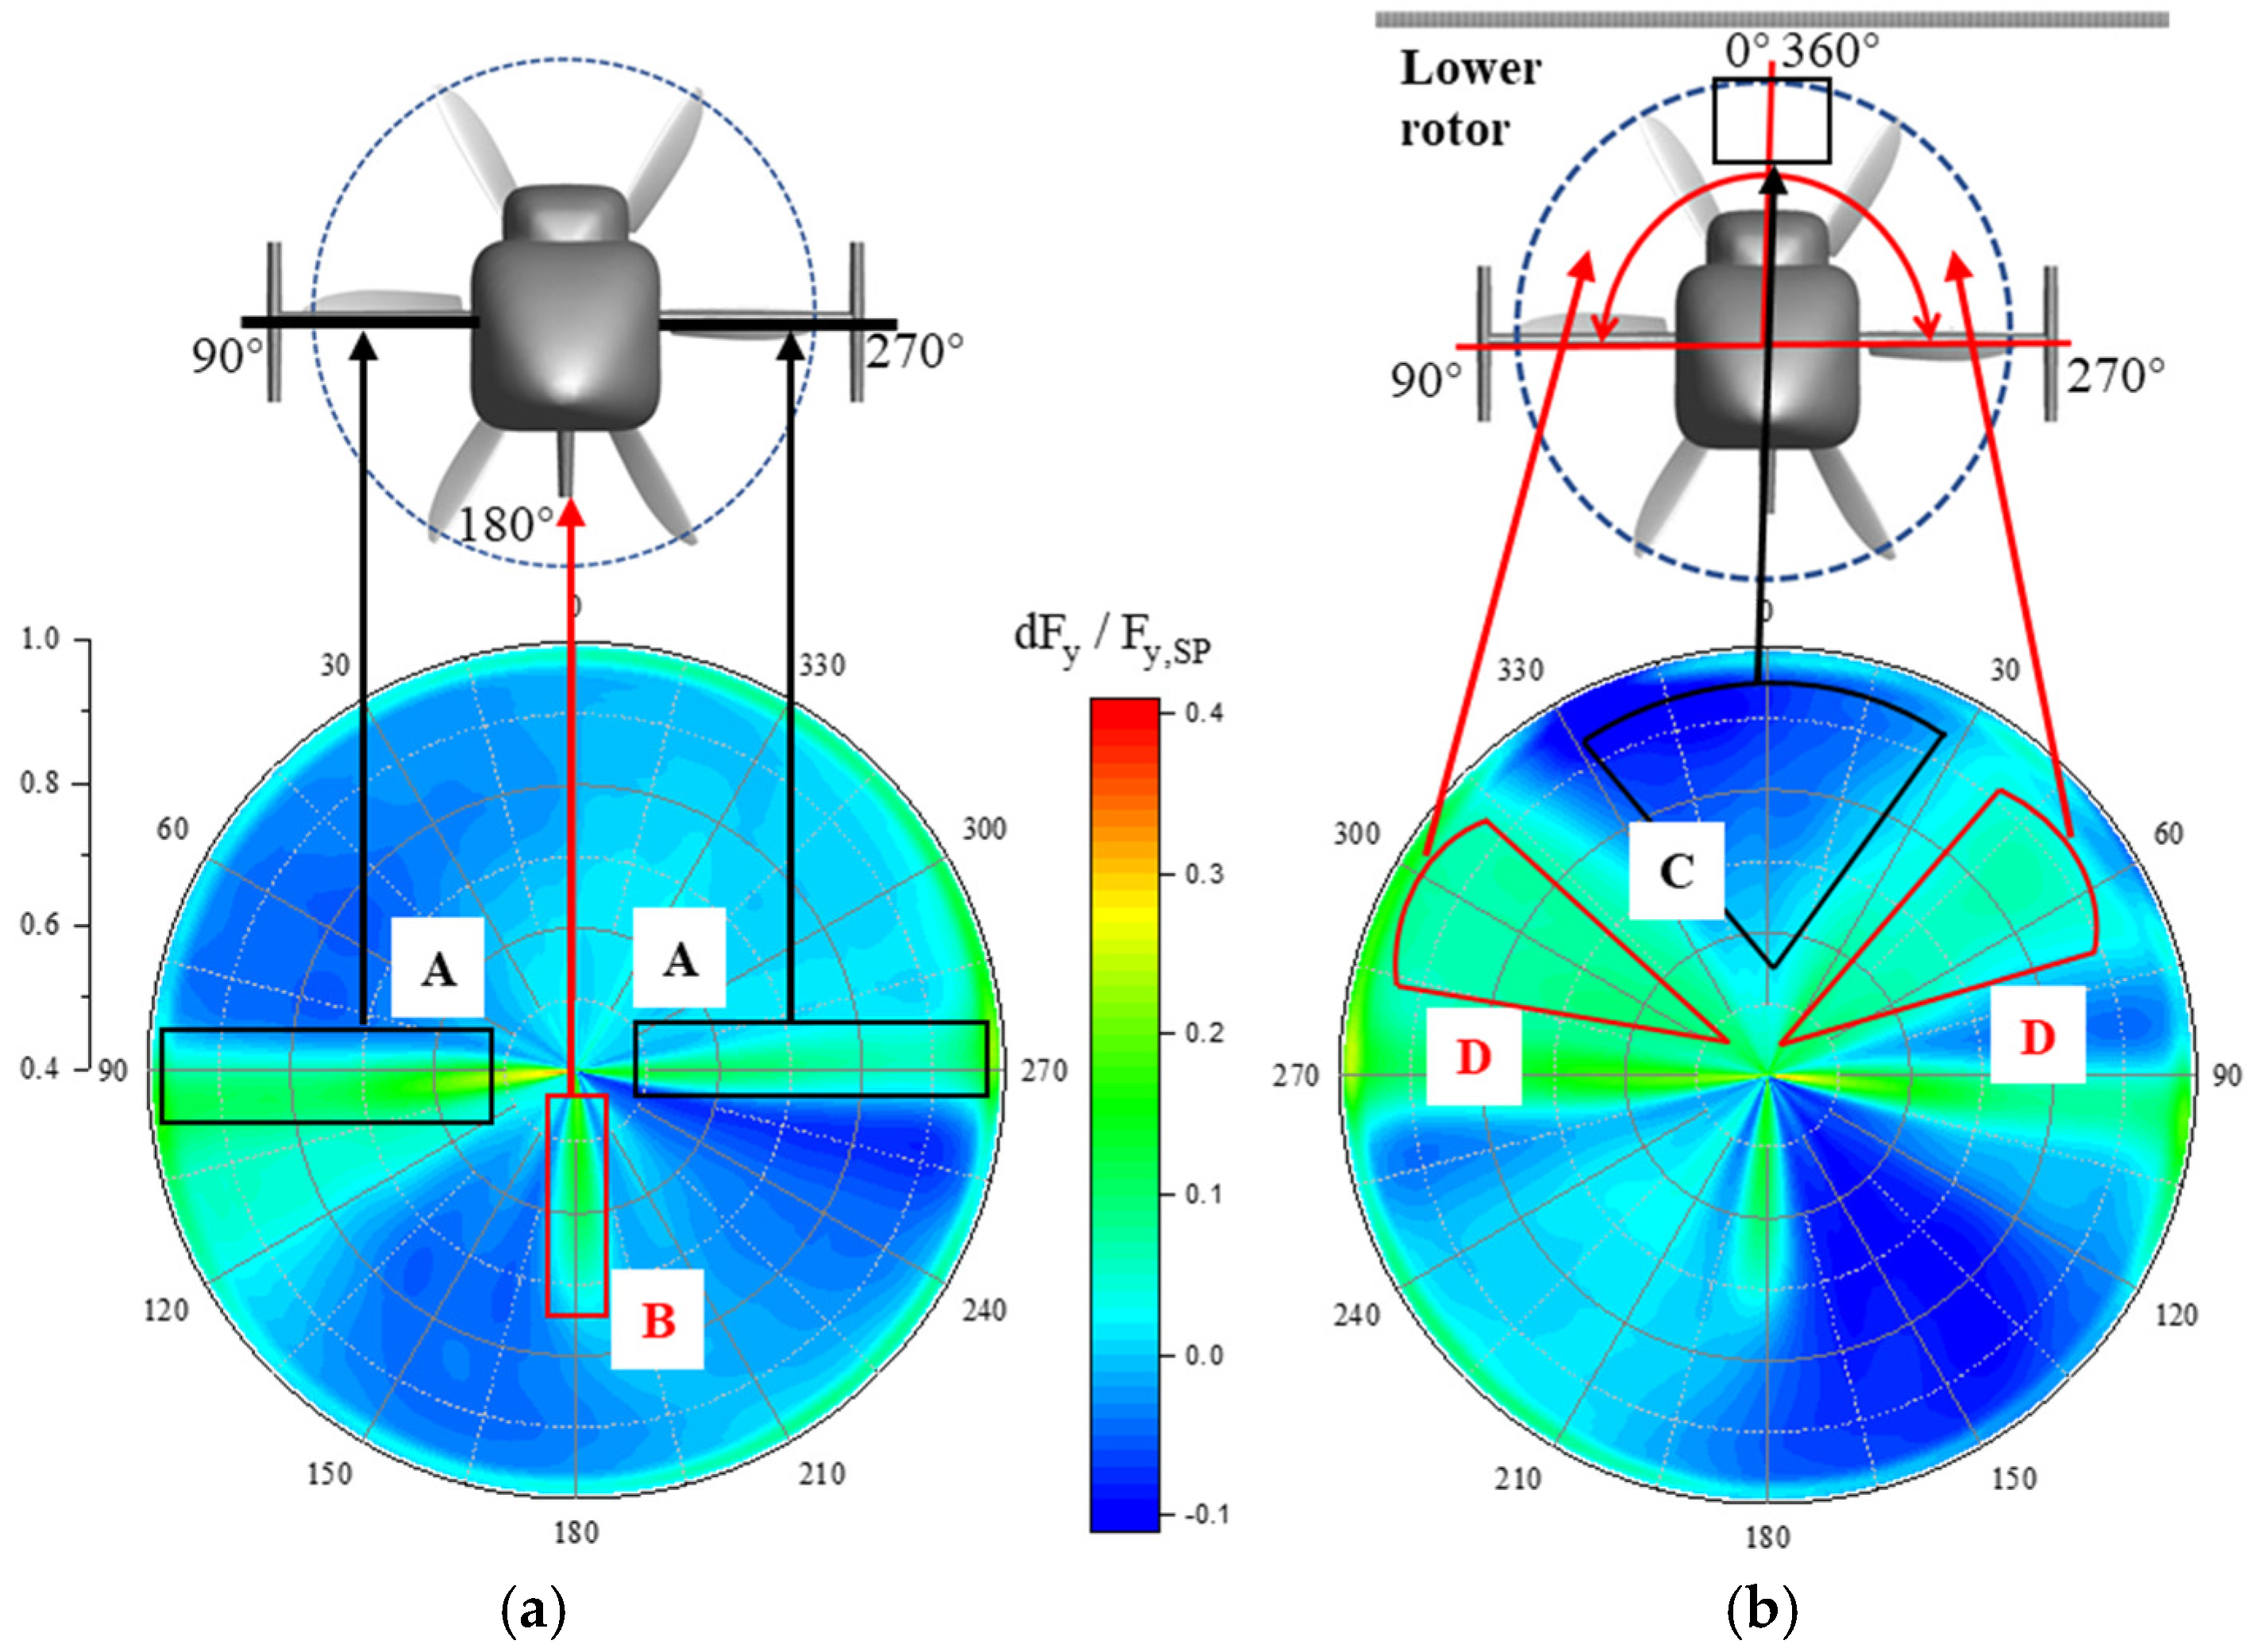
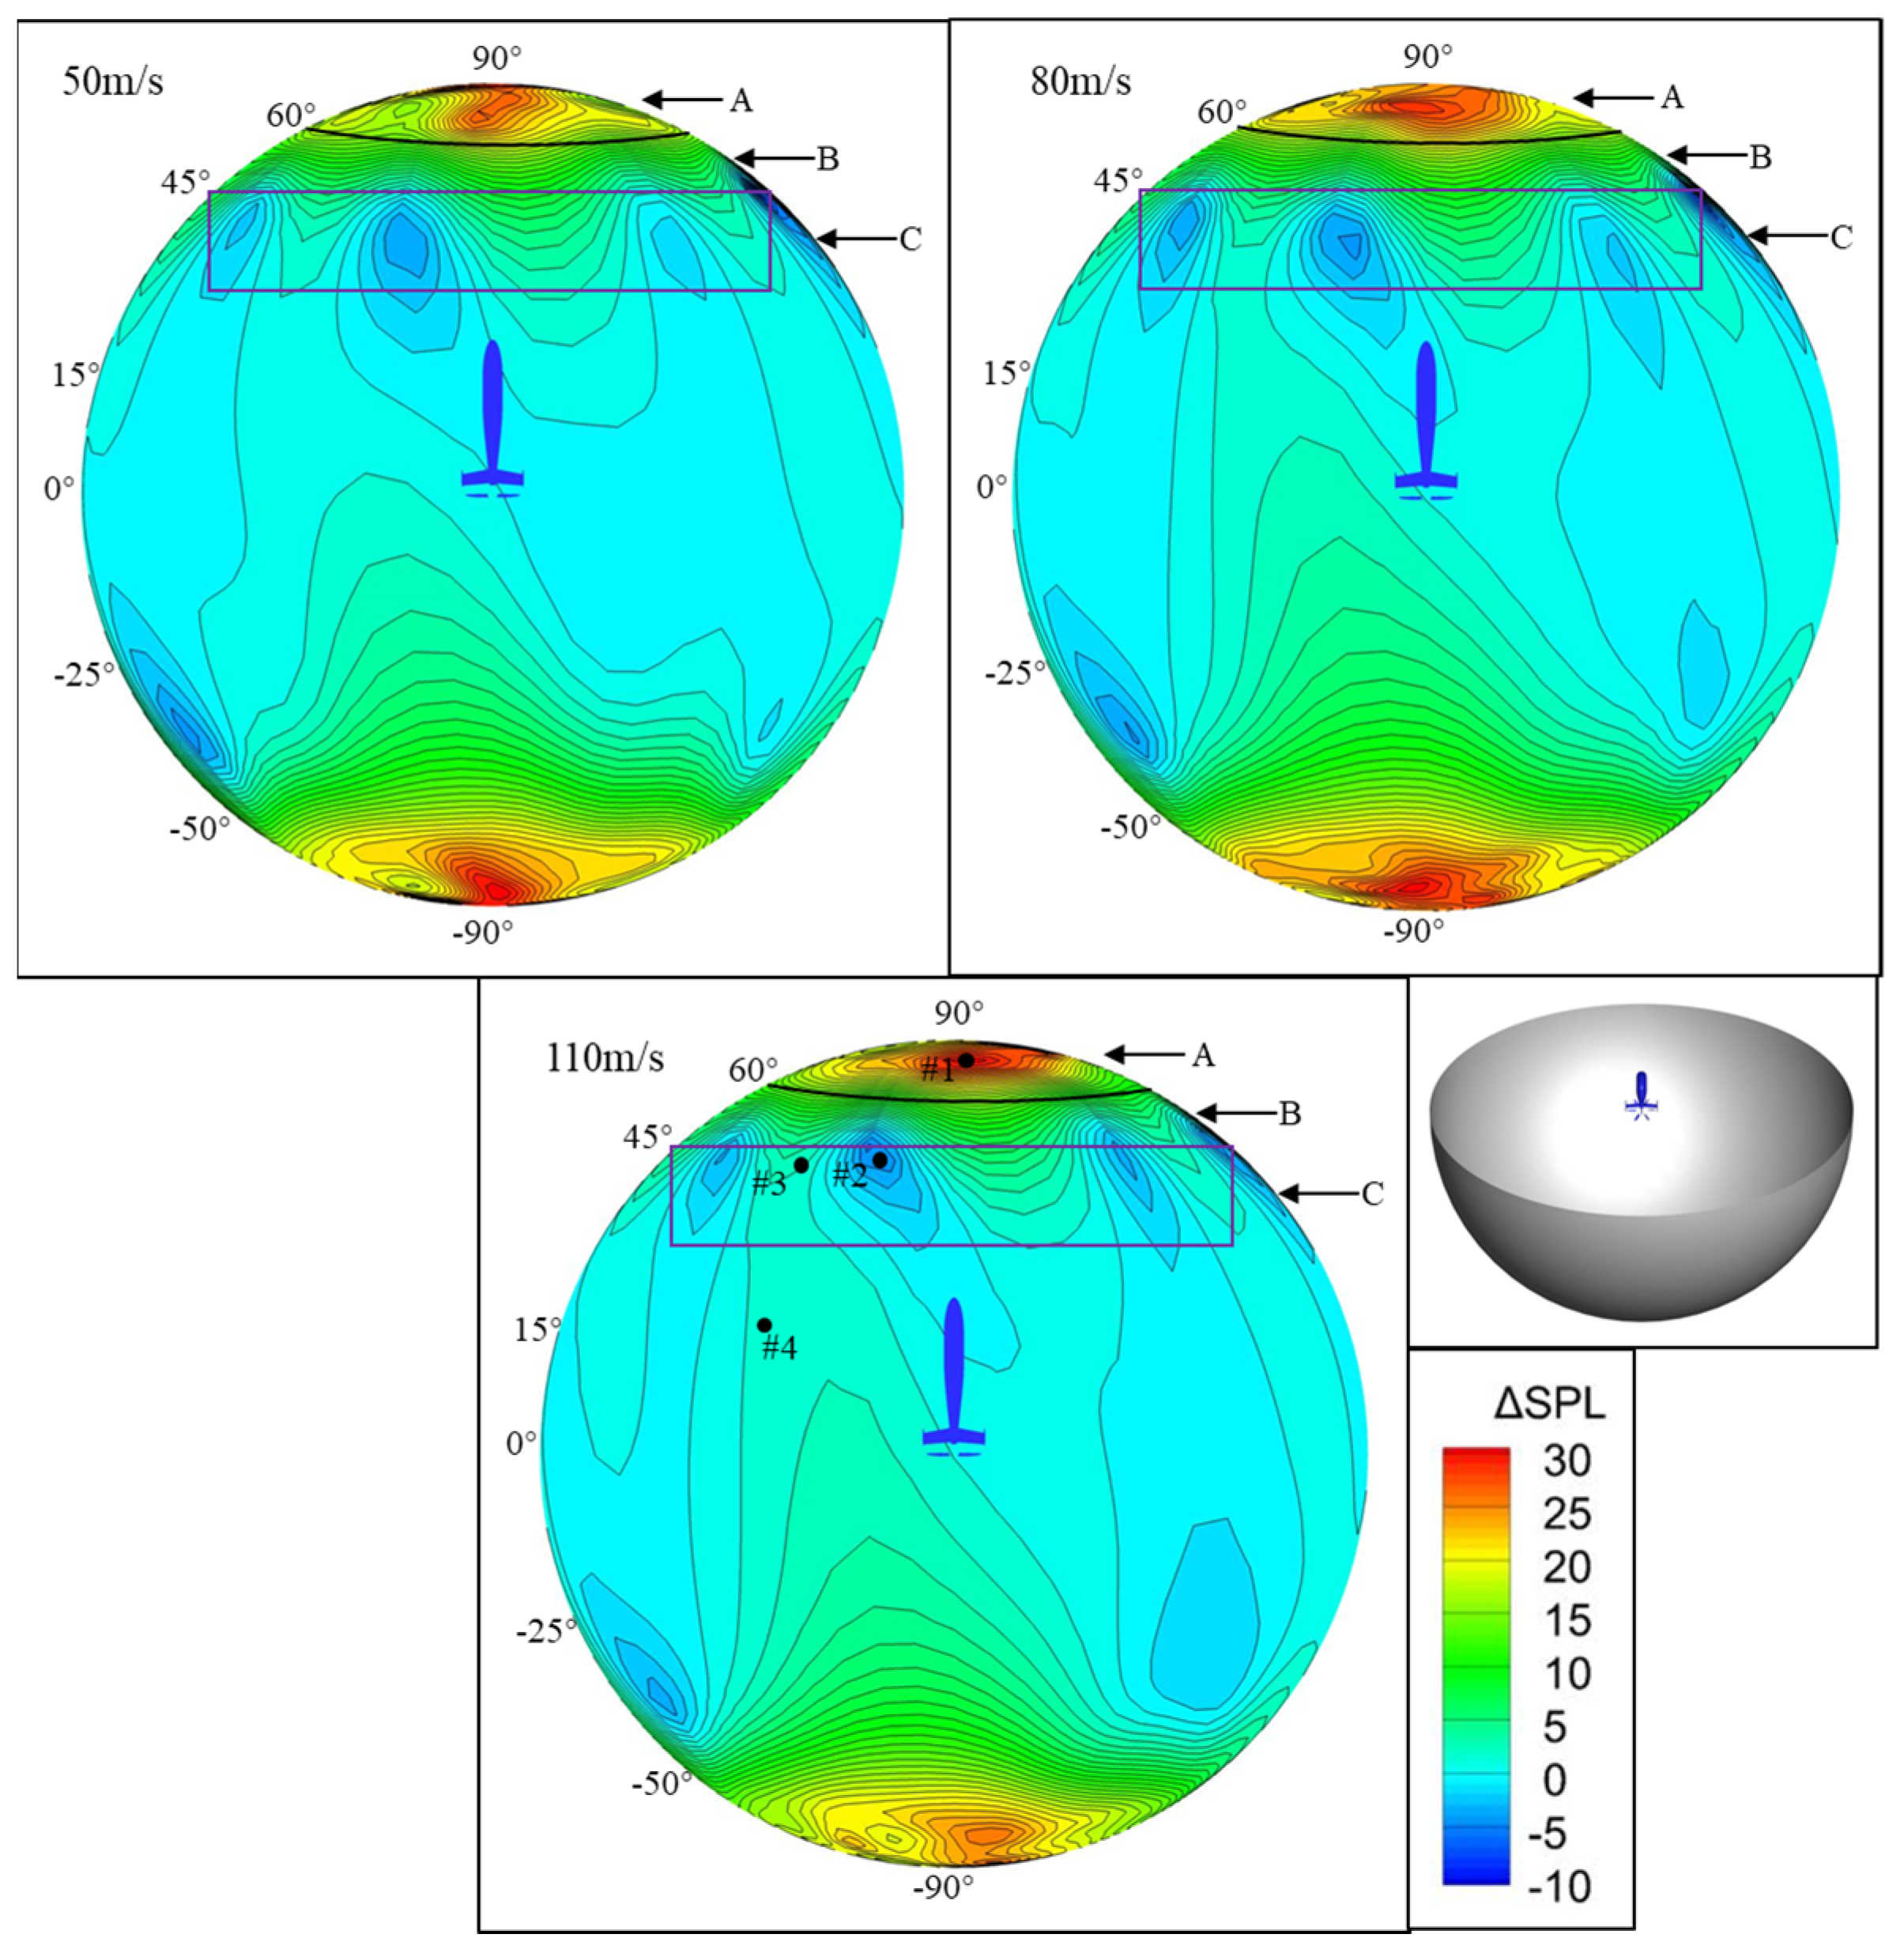
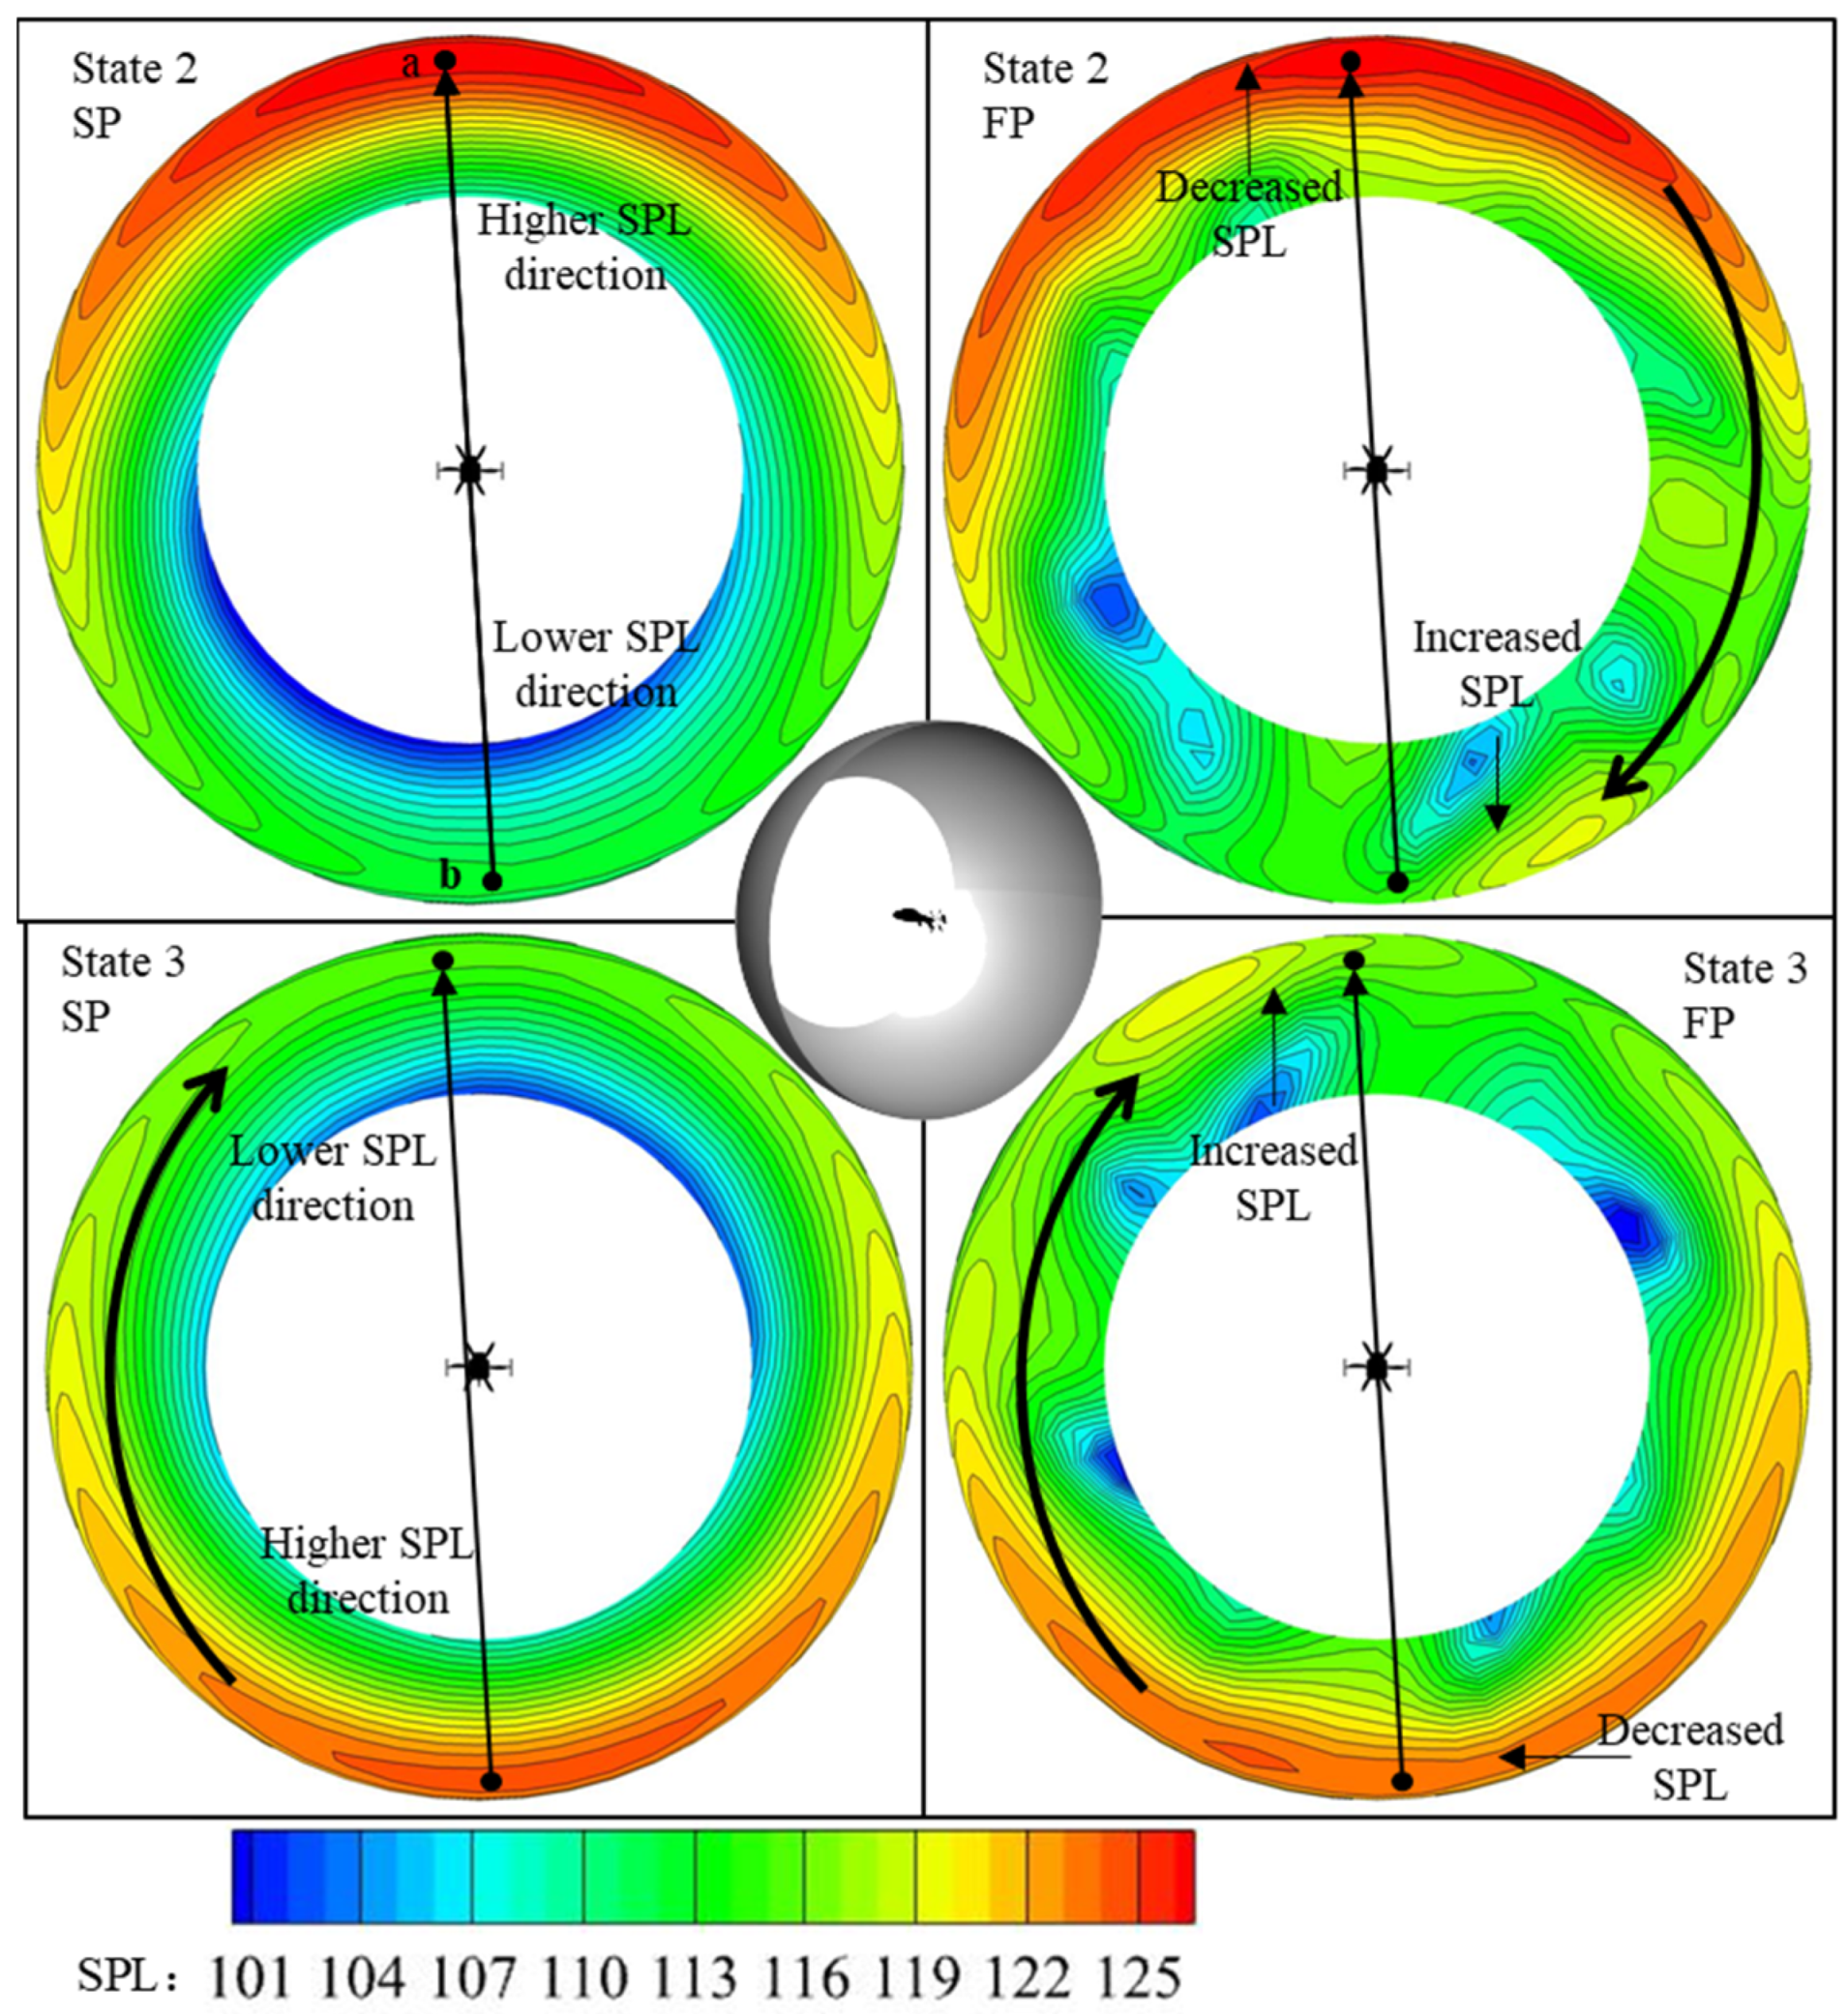
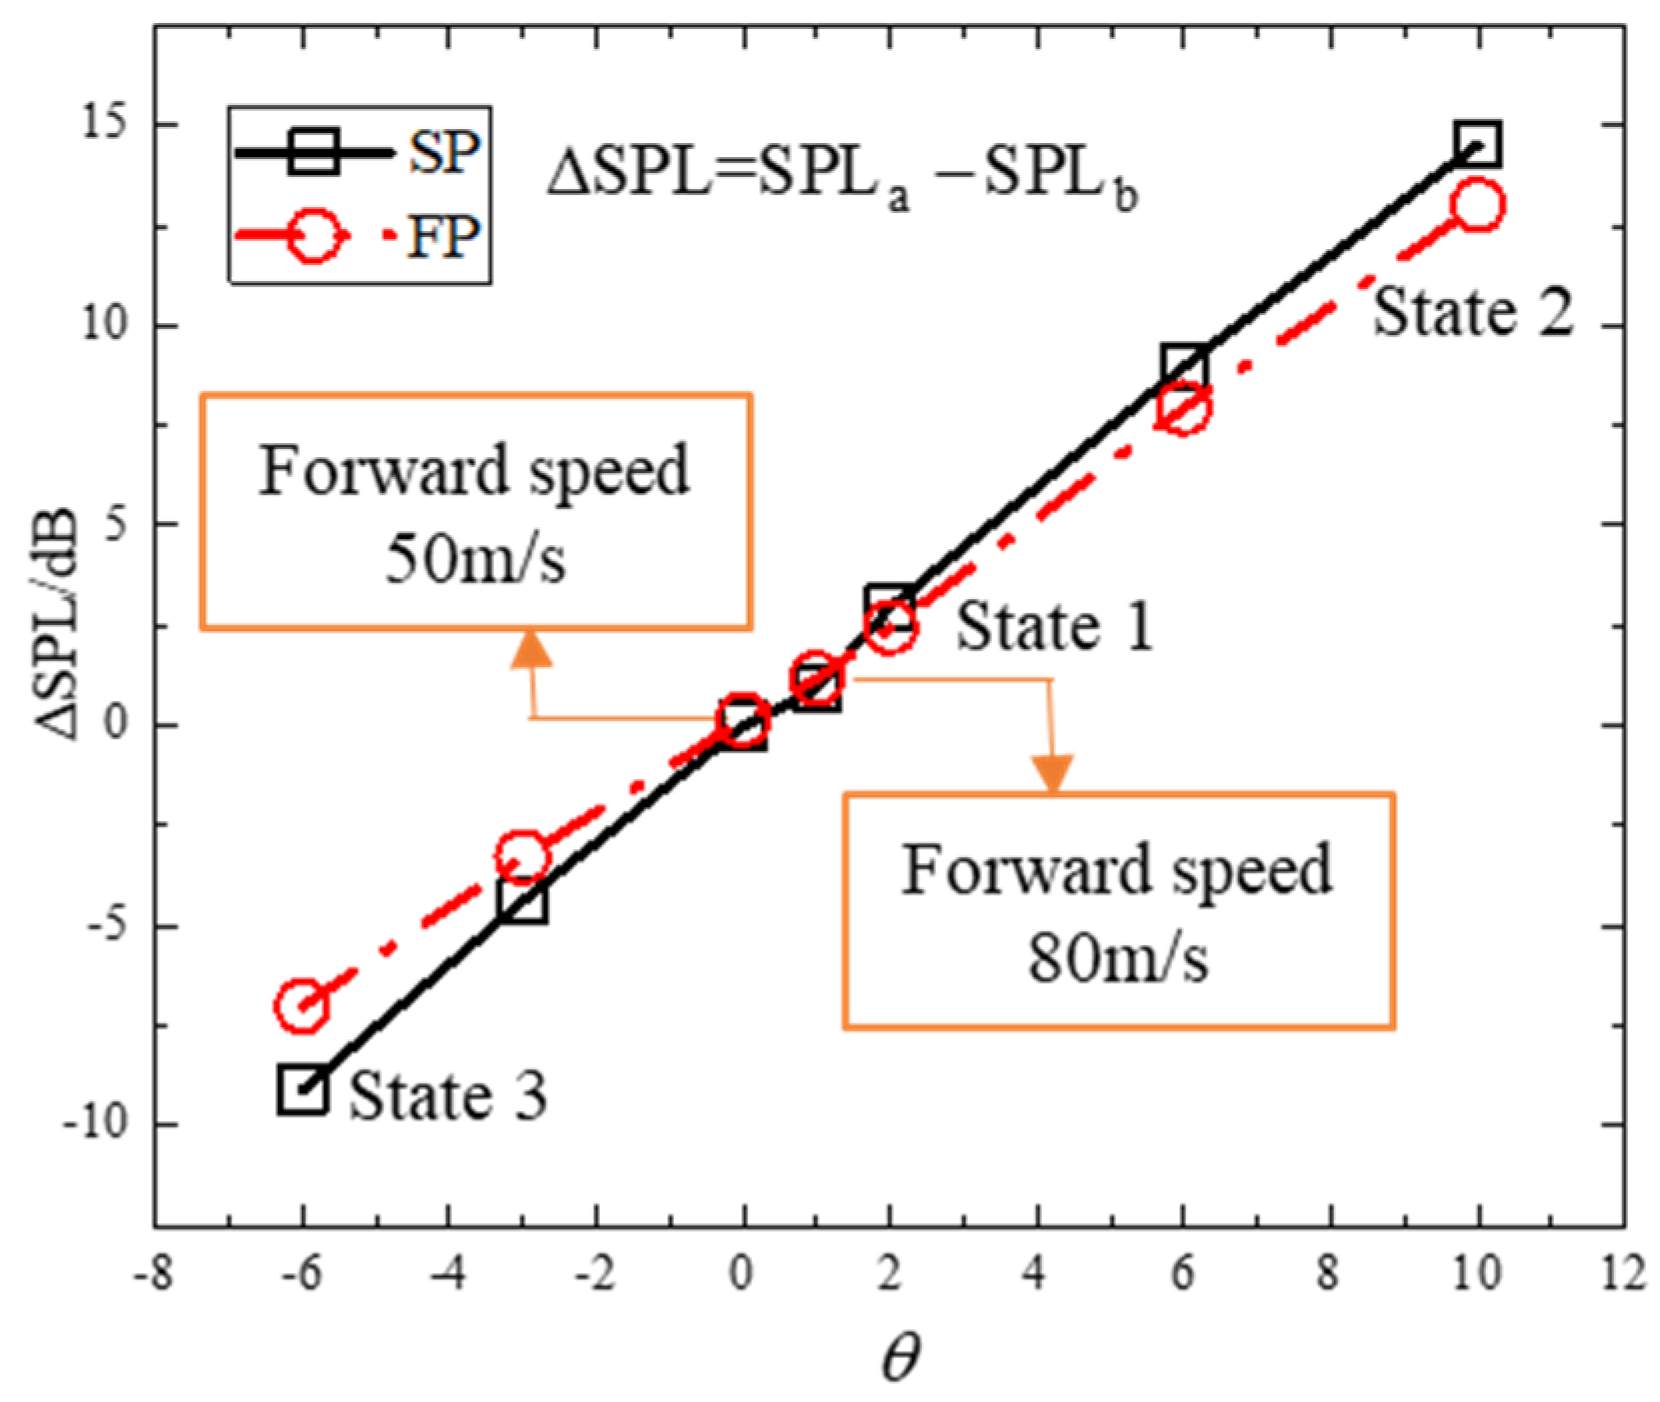
4.2. Effects of Horizontal Flight Speed

The influence of the isolated fuselage on the axial flow velocity at the display section is depicted in Figure 12. It is evident that, as the forward flight speed increases, the deceleration effect of the tails on the flow slightly intensifies. Figure 13 presents the thrust trends of a single blade with azimuth for three different forward speeds: 50 m/s (μ = 0.180), 80 m/s (μ = 0.288), and 110 m/s (μ = 0.396). Three thrust surges of a single blade could be observed within one rotation cycle, with magnitudes of approximately 20%, 10%, and 20%, respectively, remaining consistent across different forward speeds. The two larger surges occurred at approximately 90° and 270° azimuth behind the flat tails, while the smaller surge occurred at 180° azimuth behind the mid-vertical tail. These results indicate that the length of the flat/mid-vertical tails influenced the aerodynamic interferences of the fuselage on the blade thrust to a certain extent. Additionally, the 110-SP and 80-SP curves exhibited period fluctuations of 17.5% and 7.4%, respectively, attributed to the respective pitch angles of 2° (at 110 m/s) and 1° (at 80 m/s) set in the flight speed conditions. It is notable that a smaller pitch angle led to larger fluctuations in the blade thrust.
Figure 14 presents the ΔSPL distributions on the hemisphere beneath the fuselage, where ΔSPLs represent the difference between the SPLs in the FP configuration and those in the SP configuration. It was evident that the ΔSPL distributions on the hemisphere showed a high degree of similarity across various forward speeds. The ΔSPLs generally ranged from 5 to 15 dB within interval B of (45°, 60°), while, in interval A, above 60°, the magnitude of the ΔSPL could exceed 20 dB. The significant increase in the SPLs was likely linked to multiple thrust surges. Moreover, three distinct zones of SPL reduction were observed for observers within interval C, close to 45°. Notably, the effects of this reduction became more pronounced with higher forward speeds.
The frequency-domain ΔSPL distributions for the selected observers from Figure 14, along with the total noise SPLs, are presented in Figure 15. Notably, for observer #4, positioned at 15°, the ΔSPLs at low and medium frequencies exhibited minimal variations, with significant deviations observed only at frequencies from 8f0 to 10f0 (where the fundamental frequency f0 was 265.41 Hz). Observer #1 consistently exhibited larger ΔSPLs across all frequencies, particularly from f0 to 3f0, which were substantially higher compared to the other observers. Meanwhile, in Figure 15, observer #2 had positive ΔSPL values, while observer #3 had negative ΔSPL values. However, spectrograms revealed that both observers had greater ΔSPLs ranging from 2f0 to 6f0. The primary distinction between observers #2 and #3 lay in the presence of a significant negative value at f0 for observer #2, while observer #3 exhibited ΔSPLs at f0 that were essentially equal to 0 dB. This distinction suggested that the reduced noise at f0 was the primary factor contributing to the three regions within interval C, as depicted in Figure 15.
Figure 16 illustrates the time-domain sound pressure at observer #2, revealing three additional negative peaks of varying amplitudes in the T1, T2, and T3 regions. These peaks corresponded to instances of interference with the flat/vertical tails occurring in one rotational cycle. Moreover, a substantial decrease in the original peak was apparent within the T4 region. This decline might be attributed to the positive peaks generated by the interference canceling out the original negative peaks, consequently leading to a reduction in the SPL at f 0 .
The results revealed a consistent influence of fuselage interference on both the aerodynamics and aeroacoustics of the propeller across various forward flight speeds. Regarding aerodynamics, a notable thrust surge was observed specifically at azimuths located behind the flat/vertical tails. As for aeroacoustics, there were distinct and amplified increases in the SPLs at higher frequencies for all selected observers. Additionally, substantial SPL increases were observed from 2f0 to 6 f0 for the observers positioned in the interval above 30°.

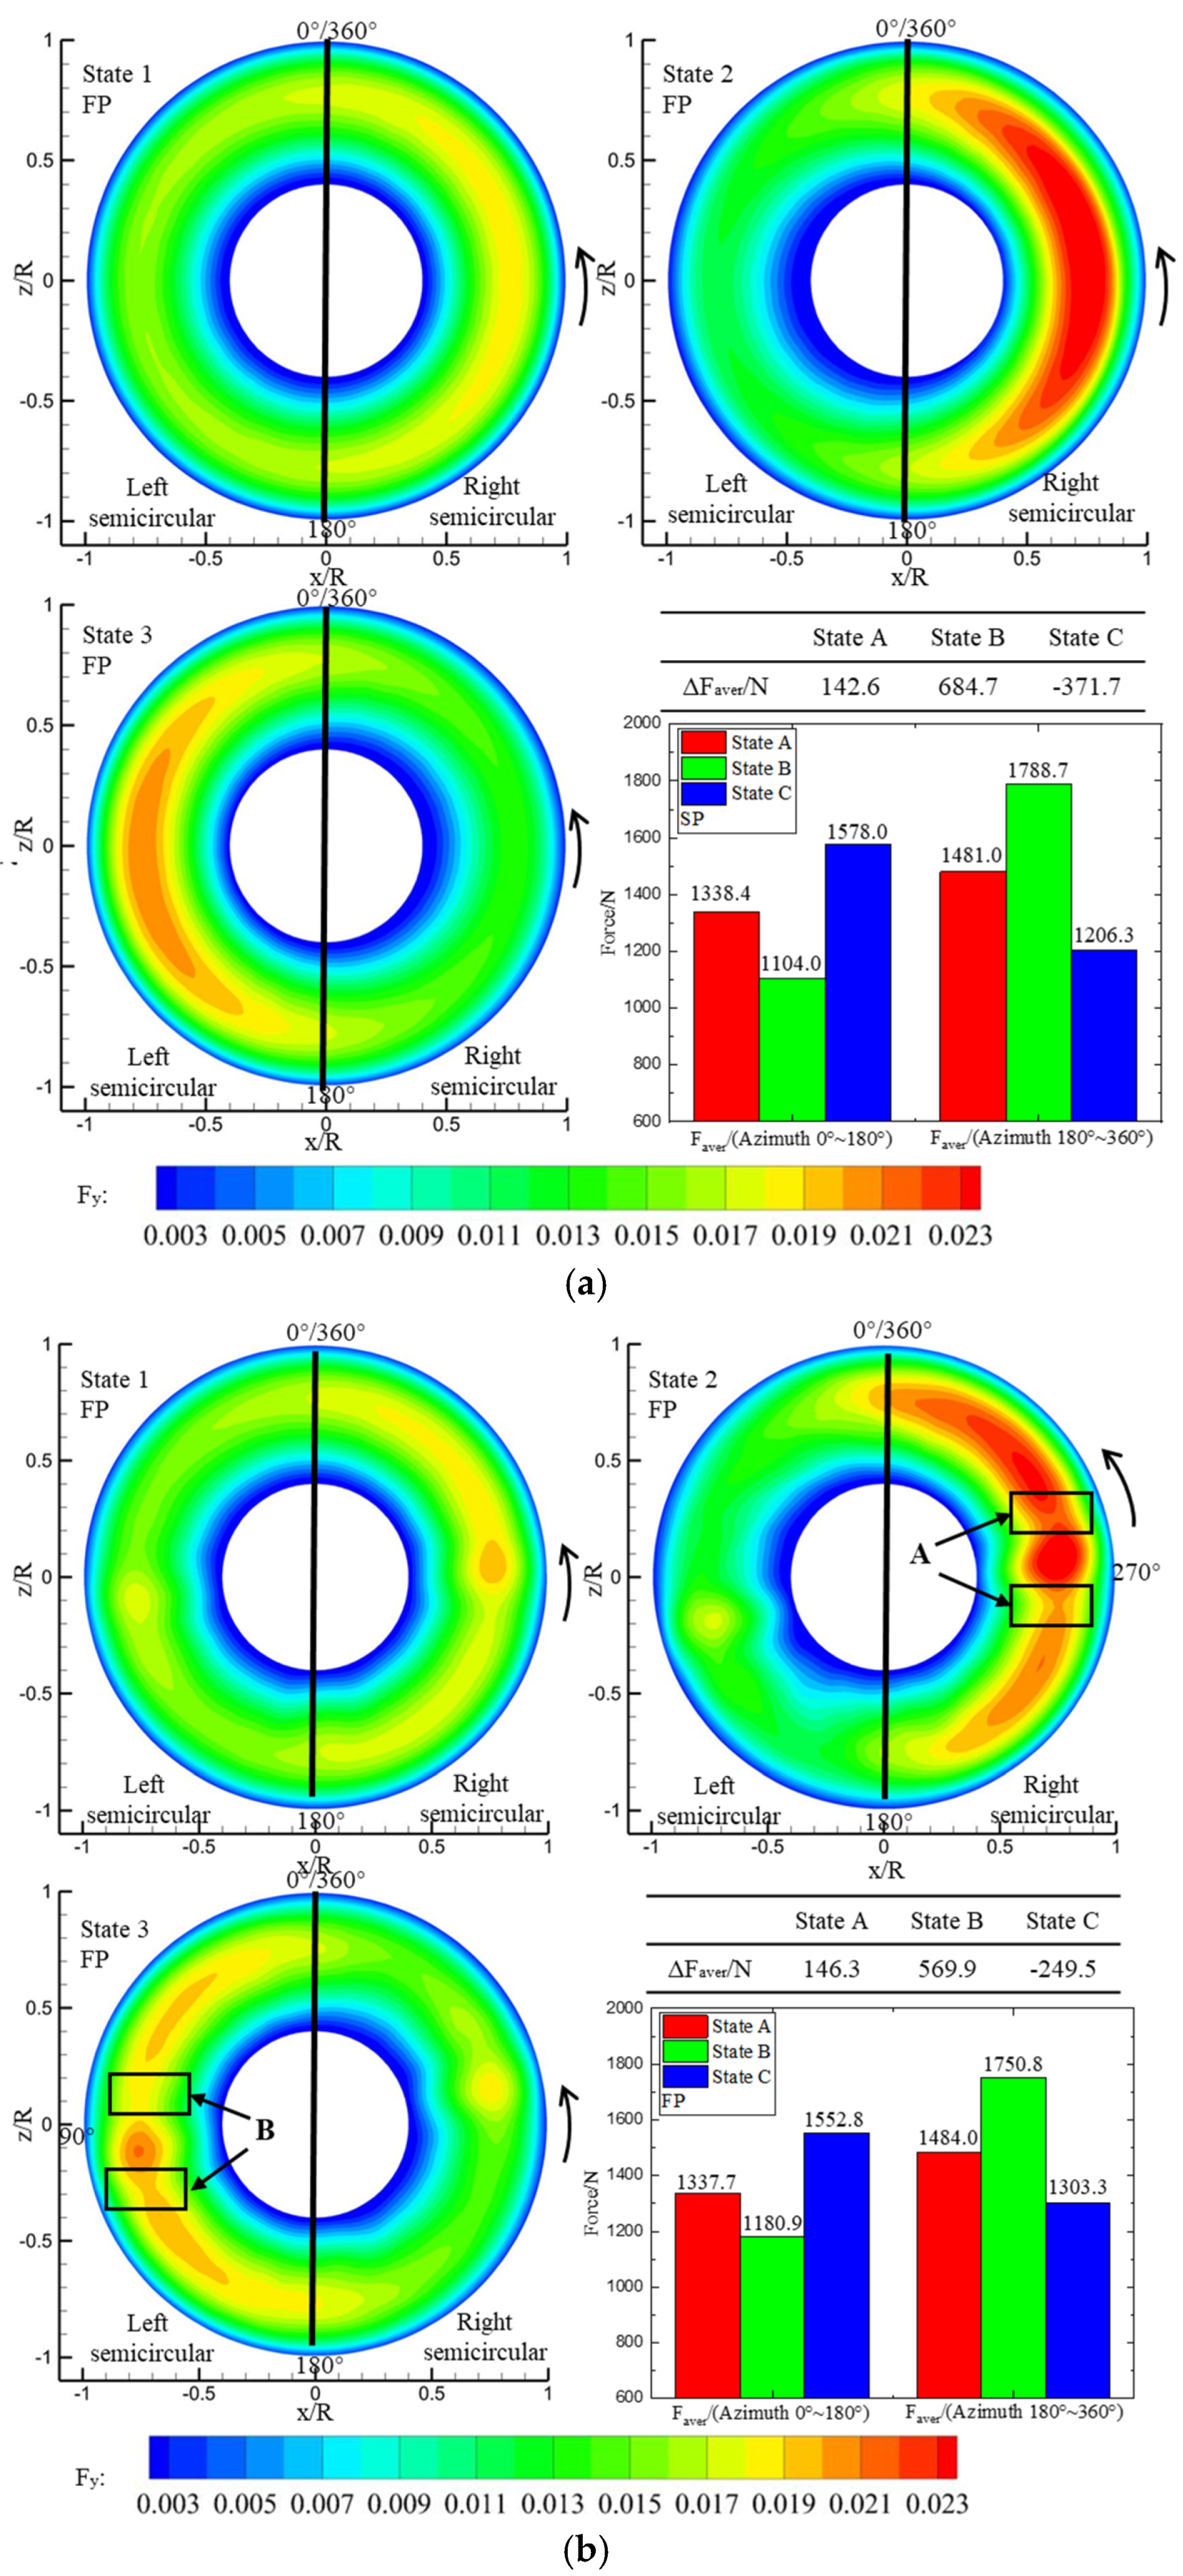
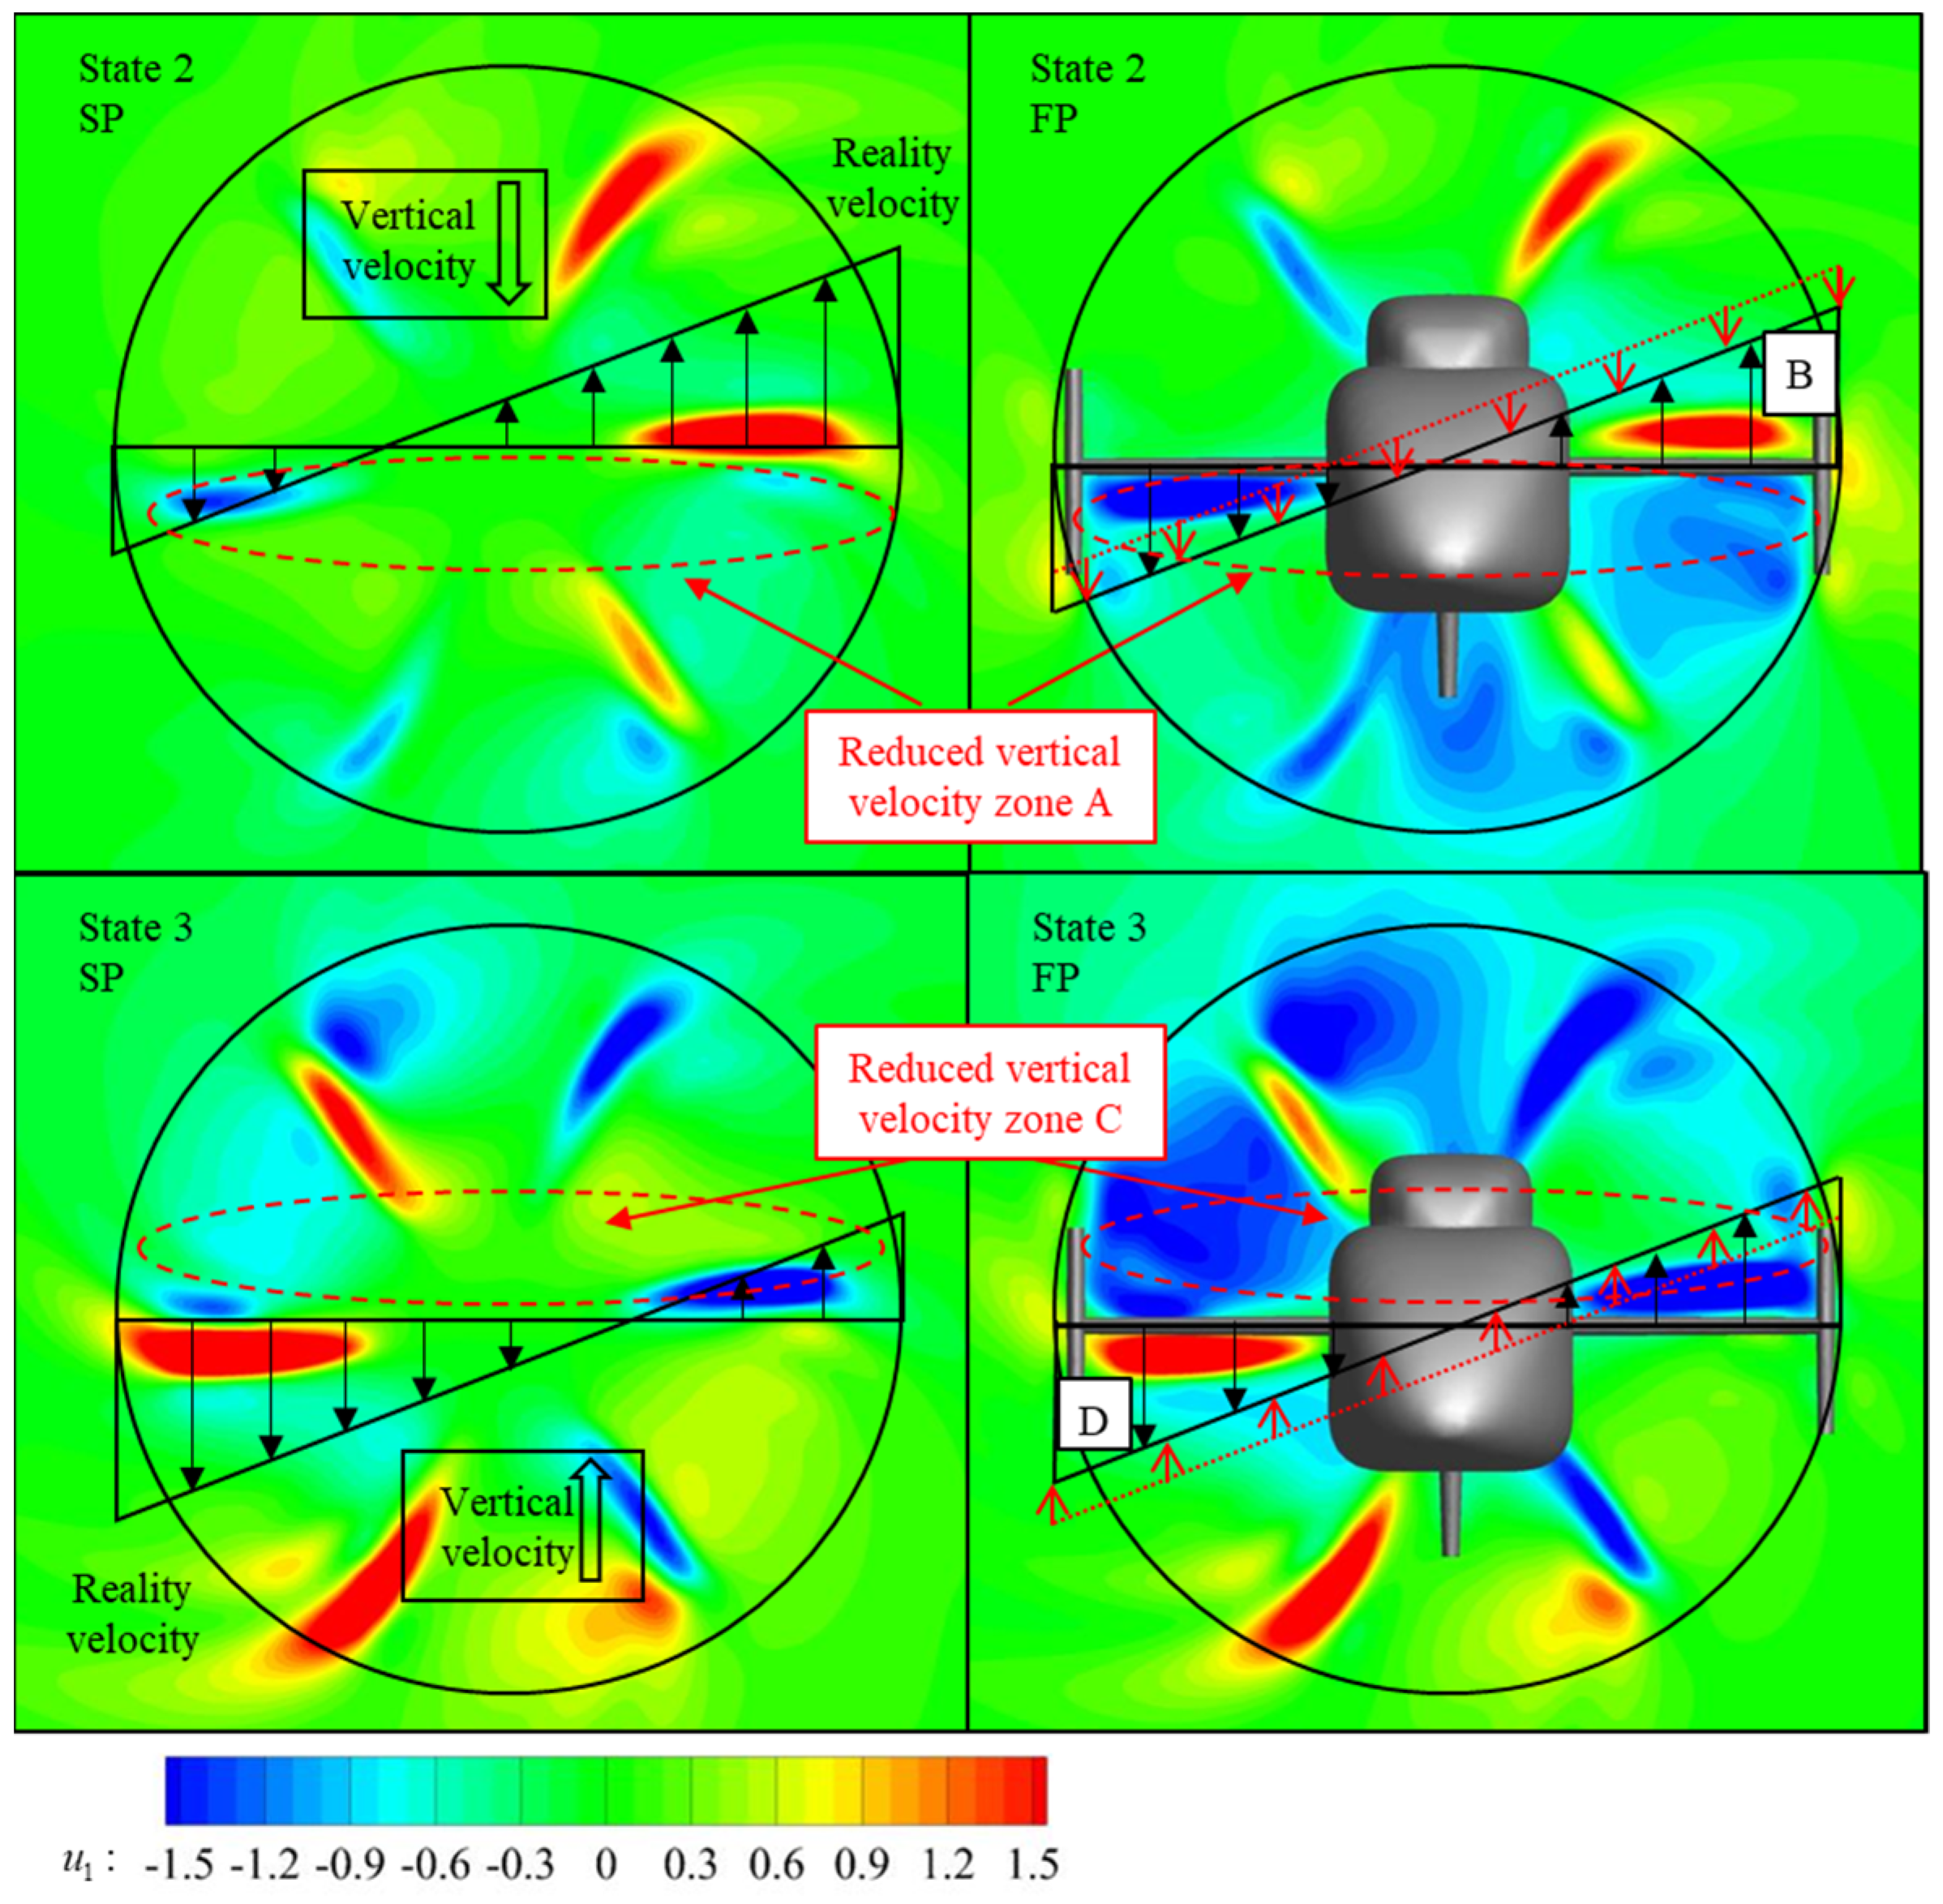
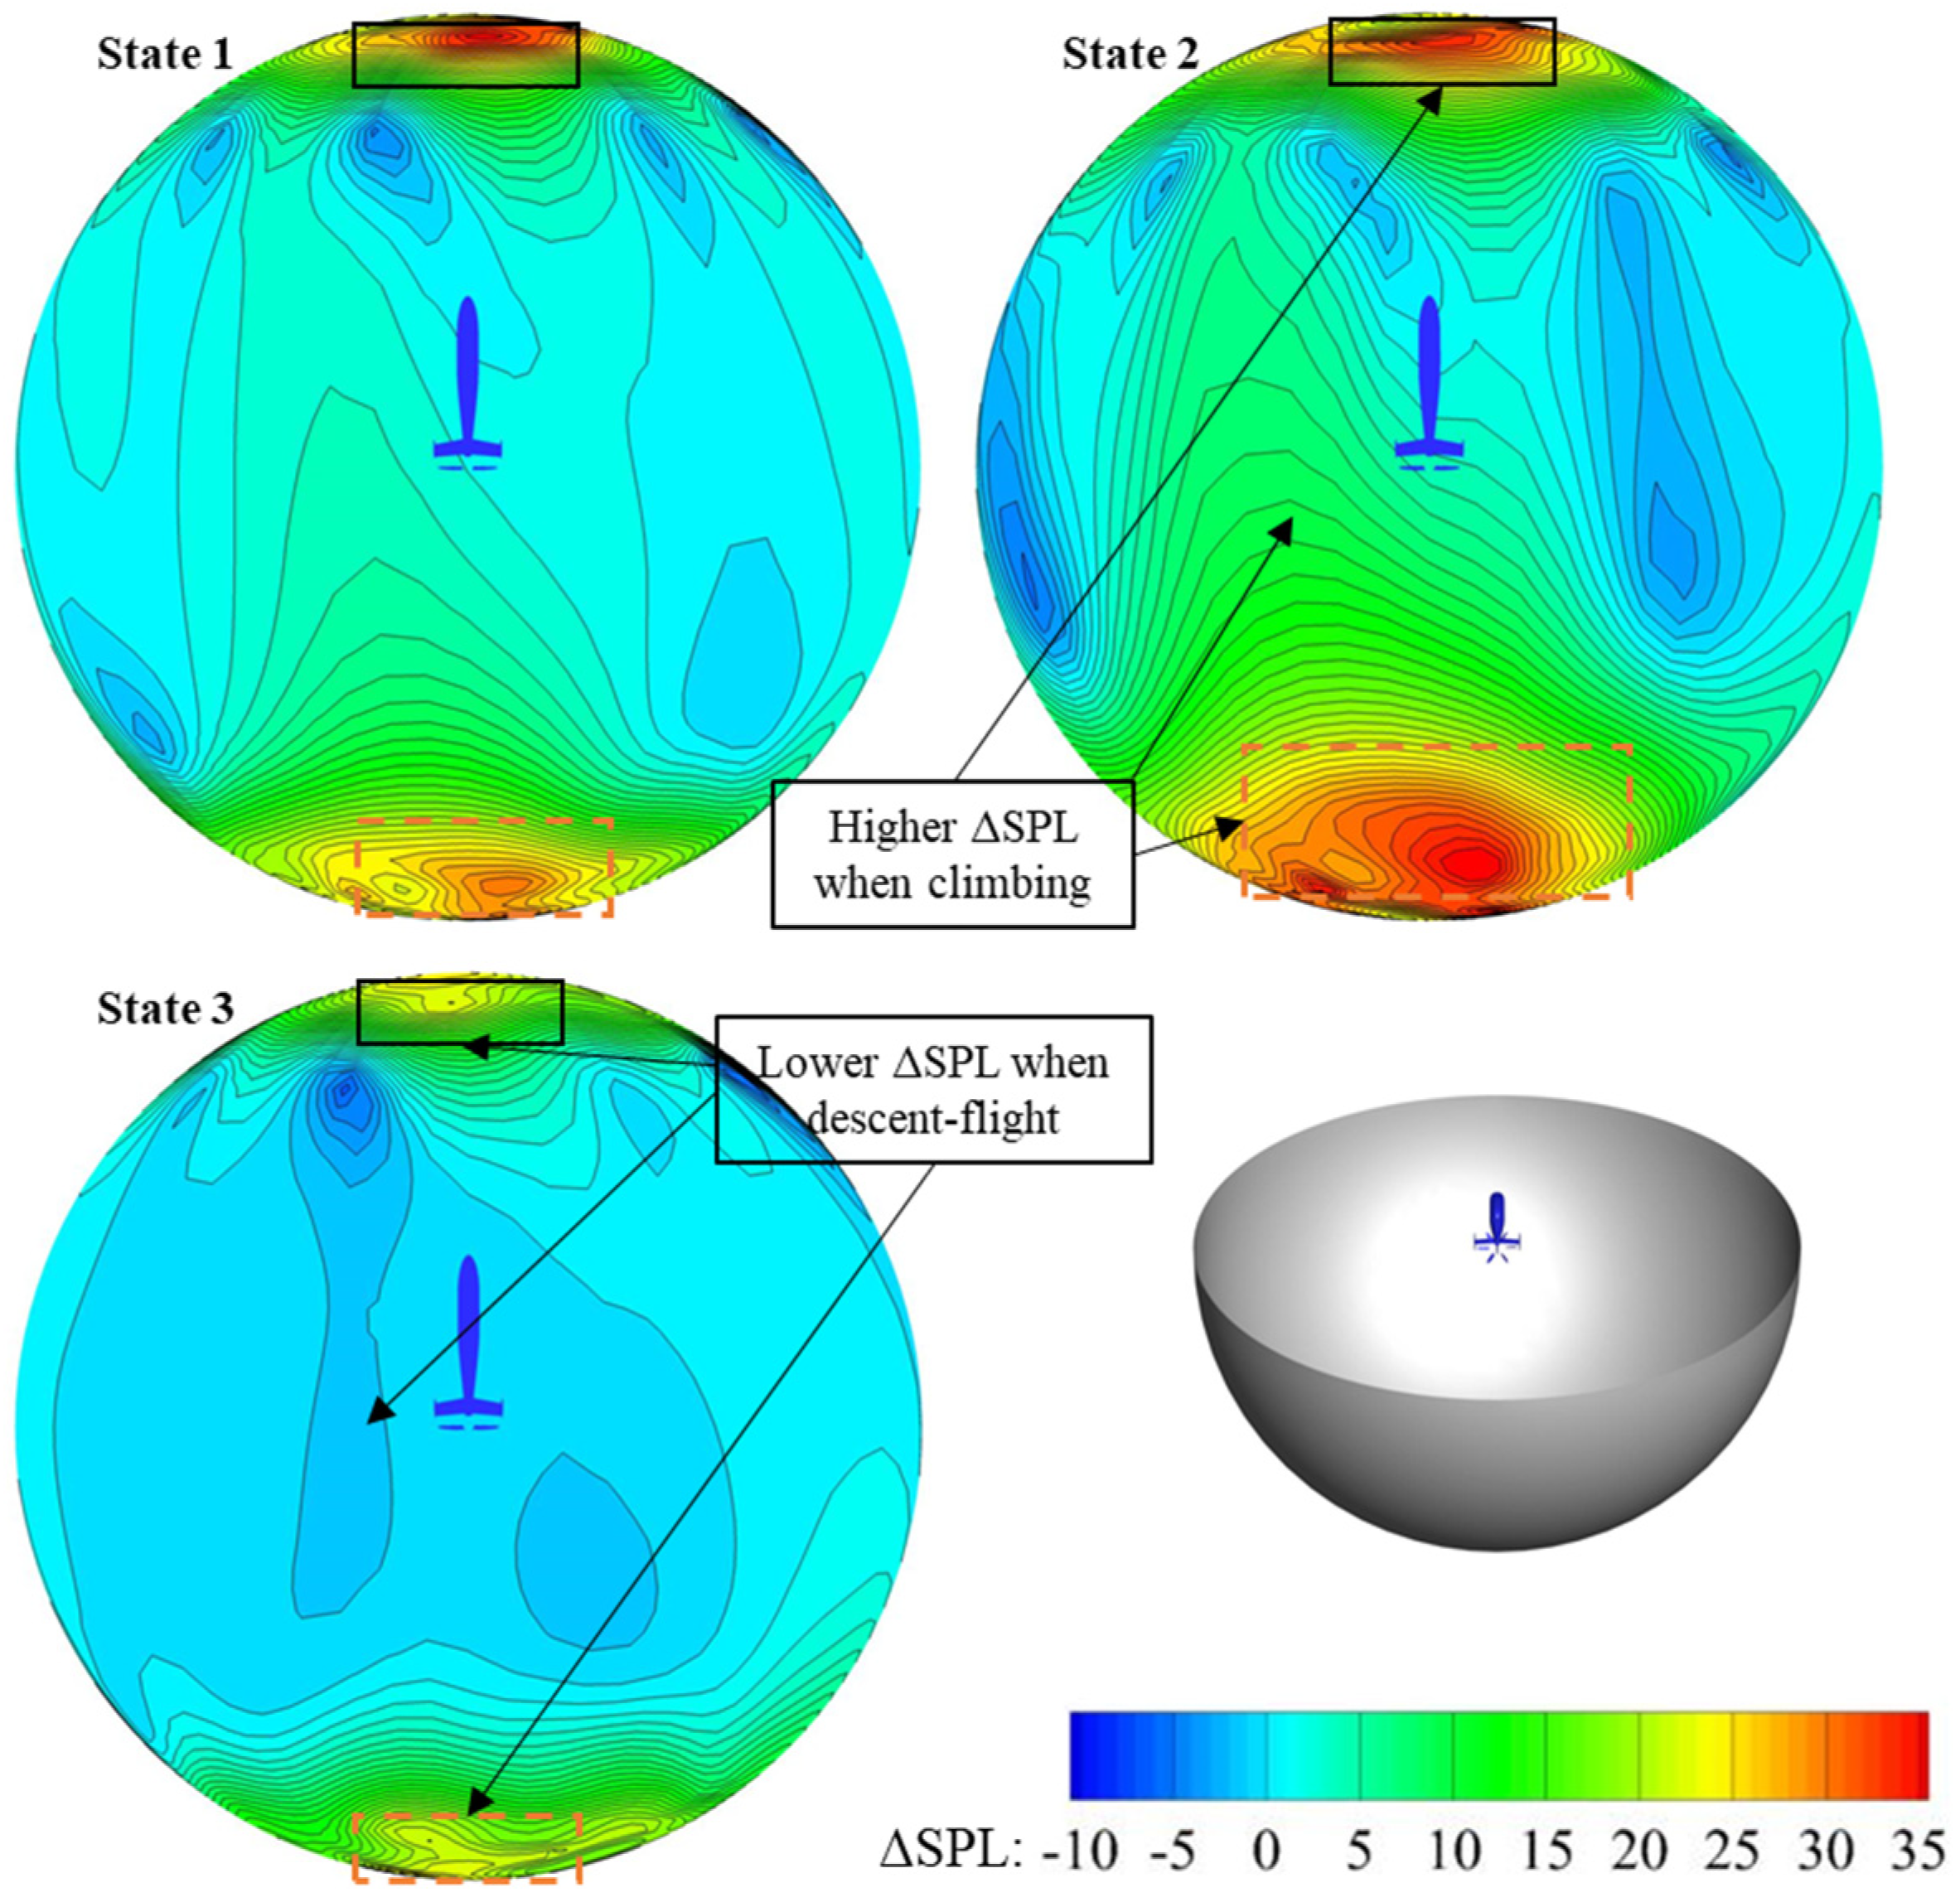
4.3. Effects of Vertical Flight Speed

Utilizing the conditions established at the forward speed of 110 m/s, calculations were conducted for the climbing and incline–descent states. Despite having the same resultant velocity, these states exhibited distinct vertical velocity components relative to the fuselage. In the climbing state (State 2), the vertical velocity was measured at 19.1 m/s, while, in the incline–descent state (State 3), it was measured at −11.5 m/s. By contrast, the previously examined state (State 1) showcased a vertical velocity of 3.83 m/s.
Figure 17a presents the spreading distribution of a single blade thrust at different azimuthal positions for the three states. It was evident that a noticeable thrust offset was distributed in the left and right semicircles when there was a vertical flight speed. Interestingly, the thrust offset direction in State 3 was the opposite to that in State 1 and State 2, indicating a clear correlation between the thrust offset and vertical speed. The thrust offset arose from the fact that the vertical flight speed acted as a “forward speed” for the propeller, resulting in the division of the disc into two parts, similar to an “advancing side” and “retreating side”. The limited rotor cycle pitch capabilities on the propeller would lead to significant thrust offset even with small vertical speeds. In Figure 17a, the mean thrust values for the left and right semicircles are presented, along with the difference between them. Notably, the difference in mean thrust between the left and right semicircles was particularly significant in State 2, where the vertical speed was the largest. Consequently, it could be anticipated that, when a helicopter executes a horizontal maneuver, a significant thrust offset would also occur between the upper and lower semicircles.
Figure 17b illustrates the effects of fuselage interference on the thrust offset. It was observed that the presence of fuselage deceleration flow led to a significant surge in thrust at the 270° azimuth in State 2 and the 90° azimuth in State 3. In the A and B regions, located on both sides of the surge azimuth, there was a more pronounced reduction in thrust compared to the SP configuration. As a result, the thrust offset in State 2 and State 3 showed some improvement compared to the SP configuration, with the average thrust difference between the left and right semicircles decreasing from 684.7 N and −371.7 N to 569.9 N and −249.5 N, respectively. These findings indicate that fuselage interference could mitigate the thrust offset caused by the vertical speed.
Figure 18 illustrates the distribution of u1 in State 2 and State 3 under two different configurations. In State 2, as the vertical airflow passes through the region below the flat tail (region A in Figure 18), the vertical velocity is significantly reduced. This reduction in vertical velocity weakens the impact of the “advancing” and “retreating” sides of the propeller disc. The thrust of the propeller blades is closely related to the angle of attack, and the angle of attack is influenced by the local flow velocity. When the vertical airflow is decelerated by the flat tail, it changes the angle of attack and the thrust distribution across the propeller disc. In State 3, the situation is similar, but the region where the vertical velocity experiences a significant reduction (region C in Figure 18) is positioned above the flat tail. These findings suggest that the vertical airflow in opposite directions undergoes a more noticeable deceleration effect after passing through the flat tail, ultimately reducing the thrust offset typically observed in the SP configuration. Furthermore, negative u1 distributions were observed in regions B and D on the “advancing” side. This phenomenon could be attributed to the flat tail causing a more pronounced deceleration effect on the vertical airflow, leading to a blocking effect and resulting in a reduction in the incoming flow vertical velocity.
The results of the ΔSPL distribution on the hemisphere in different states are presented in Figure 19. It was evident that the trend of the ΔSPL distribution on the hemisphere remained consistent across different states, while the intensity difference was more pronounced. In the two pole regions of the hemisphere, State 1 and State 2 exhibited significantly higher ΔSPL values. Specifically, in State 2, the poles had larger ΔSPL values due to a greater downward vertical velocity, whereas, in State 3, the poles had smaller ΔSPL values due to an upward vertical velocity. This indicated a general correlation between the ΔSPL value and the vertical velocity on the aeroacoustic radiation hemisphere. Considering the impact of the vertical velocity on the thrust offset, it could be concluded that there were potential effects of the vertical velocity on the offset of propeller noise.
The SPL distributions in States 2 and 3 are illustrated in Figure 20. They were located above the aeroacoustic radiation hemisphere in front of the fuselage. It was evident that the SPL distribution exhibited a distinct directional pattern in the SP configuration for both States 2 and 3. In State 3, where the vertical speed was upward (similar to a diagonally descending flight state), the directional effect resulted in significantly higher noise under the fuselage, potentially exacerbating the helicopter noise pollution. These findings highlight the phenomenon of thrust and noise offset caused by the vertical speed, with the directionality of the thrust and noise offset directly influenced by the direction of the vertical flight speed.
Based on the discovery of the attenuating effect of fuselage interference on thrust offset, shown in Figure 17, the SPL difference between observers a and b was chosen as a reference to measure the noise offset. Figure 21 illustrates the ΔSPLs between observers a and b for various flight cases. It was evident that there was a clear positive correlation between the ΔSPL and θ . Furthermore, fuselage interference had a suppressing effect on the noise offset phenomenon, as demonstrated by the reduction in the absolute values of the ΔSPLs by 1.53 dB and 2.09 dB for State 2 and 3, respectively, in the FP configuration. Conversely, the noise offset was less pronounced at a small θ , making it challenging to observe reduction effects.

5. Conclusions

This study developed a boundary identification method applied within the CFD method. The flowfield simulation and aeroacoustic prediction of the fuselage/propeller were carried out during high-speed flight. Then, the effects of interference on the aerodynamic/aeroacoustic characteristics of the propeller were analyzed, and the following conclusions were obtained based on the results.
(1) By adjusting the grid boundary based on entities, the boundary identification method improved the robustness of the hybrid grid system. By comparing the numerical results with the experimental data, it was proven that the method could effectively simulate the flowfield of the propeller/fuselage and avoid the transmission error caused by the overlap problem.
(2) The surge in propeller thrust was caused by the deceleration effect of the flat/vertical tails at the corresponding azimuthal angle, with most magnitudes being about 20%. In the aeroacoustic radiation sphere, the propeller ΔSPLs exhibited a significant increase in the forward flight direction, whereas they were relatively smaller in other directions.
(3) At different forward speeds, the magnitude of the thrust surge and ΔSPLs was similar. For the observers near the forward flight direction, the SPLs were significantly increased from 2 f 0 to 6 f 0 in the frequency domain. In particular, the SPLs at the fundamental frequency were also increased significantly for the observers in front of the fuselage.
(4) The presence of a vertical velocity component led to the noticeable phenomenon of thrust offset. This phenomenon was caused by the asymmetry of the relative velocities induced by the vertical velocity on both sides of the thrust propeller. It also caused an SPL offset in the propeller in the circumferential direction. The degrees of thrust and SPL offset were almost positively correlated with the vertical velocity.
(5) The deceleration effect of the tail (especially the horizontal tail) on the airflow reduced the asymmetry of the relative velocities, weakened the thrust offset to a certain extent, and thus reduced the SPL offset of the propeller.

Author Contributions

Validation, W.B.; writing—original draft, D.S.; visualization, X.C.; supervision, W.B.; project administration, Q.Z. All authors have read and agreed to the published version of the manuscript.

Funding

This study was supported by the National Natural Science Foundation of China (No. 12032012).

Data Availability Statement

The original contributions presented in this study are included in the article. Further inquiries can be directed to the corresponding author.

Conflicts of Interest

The authors declare no conflict of interest.

References

  1. Ruddell, A.J. Advancing blade concept (ABC) development. J. Am. Helicopter Soc. 1976, 22, 13–23. [Google Scholar] [CrossRef]
  2. Derosa, S.; Eadie, W.; Eller, E. S-97TM Adaptive Survivability; American Helicopter Society International Forum: Fairfax, VA, USA, 2013. [Google Scholar]
  3. Stokkermans, T.; Veldhuis, L.; Soemarwoto, B.; Fukari, R.; Eglin, P. Breakdown of aerodynamic interactions for the lateral rotors on a compound helicopter. Aerosp. Sci. Technol. 2020, 101, 105845. [Google Scholar] [CrossRef]
  4. Boisard, R. Numerical analysis of rotor/propeller aerodynamic interactions on a high-speed compound helicopter. J. Am. Helicopter Soc. 2022, 67, 012005. [Google Scholar] [CrossRef]
  5. Lorber, P.; Law, G.; O’neill, J.; Aircraft, S.; Bowles, P.; United Technologies Research Center. Overview of S-97 RAIDER scale model tests. In Proceedings of the 72nd Annual Forum of the American Helicopter Society, West Palm Beach, FL, USA, 17–19 May 2016. [Google Scholar]
  6. Bowles, P.O.; Matalanis, C.G.; Bbttisti, M. Full-configuration CFD analysis of the S-97 RAIDER. In Proceedings of the 75th Annual Forum of the Vertical Flight Society, Philadelphia, PA, USA, 3–16 May 2019. [Google Scholar]
  7. Fery, F.; Thiemeier, J.; Oehrle, C.; Keßler, M.; Krämer, E. Aerodynamic interactions on Airbus helicopters’ compound helicopter RACER in cruise flight. J. Am. Helicopter Soc. 2020, 65, 1–14. [Google Scholar] [CrossRef]
  8. Thiemeier, J.; Öhrle, C.; Frey, F.; Keßler, M.; Krämer, E. Aerodynamics and flight mechanics analysis of Airbus Helicopters’ compound helicopter RACER in hover under crosswind conditions. CEAS Aeronaut. J. 2020, 11, 49–66. [Google Scholar] [CrossRef]
  9. Blacha, M.; Fink, A. Clean Sky 2: Exploring new rotorcraft high speed configurations. In Proceedings of the 43rd European Rotorcraft Forum, Milan, Italy, 12–15 September 2017. [Google Scholar]
  10. Zhang, T.; Barakos, G.N.; Furqan. On the aerodynamic performance of redundant propellers for multi-rotor eVTOL in cruise. Aerosp. Sci. Technol. 2024, 145, 108846. [Google Scholar] [CrossRef]
  11. Zhang, T.; Barakos, G.N.; Furqan; Foster, M. High-fidelity aerodynamic and acoustic design and analysis of a heavy-lift eVTOL. Aerosp. Sci. Technol. 2023, 137, 108307. [Google Scholar] [CrossRef]
  12. Zhang, T.; Barakos, G.N.; Furqan; Foster, M. Multi-fidelity aerodynamic design and analysis of propellers for a heavy-lift eVTOL. Aerosp. Sci. Technol. 2023, 135, 108185. [Google Scholar] [CrossRef]
  13. Zhang, T.; Barakos, G.N. High-fidelity numerical investigations of rotor-propeller aerodynamic interactions. Aerosp. Sci. Technol. 2022, 124, 107517. [Google Scholar] [CrossRef]
  14. Steijl, R.; Barakos, G.N.; Badcock, K. A framework for CFD analysis of helicopter rotors in hover and forward flight. Int. J. Numer. Methods Fluids 2006, 51, 819–847. [Google Scholar] [CrossRef]
  15. Hu, Z.Y.; Xu, G.H.; Shi, Y.J. A robust overset assembly method for multiple overlapping bodies. Int. J. Numer. Methods Fluids 2020, 93, 653–682. [Google Scholar] [CrossRef]
  16. Hu, Z.Y.; Xu, G.H.; Shi, Y.J. A new study on the gap effect of an airfoil with active flap control based on the overset grid method. Int. J. Aeronaut. Space Sci. 2021, 22, 779–801. [Google Scholar] [CrossRef]
  17. Zou, D.; Bonfiglioli, A.; Paciorri, R.; Liu, J. An embedded shock-fitting technique on unstructured dynamic grids. Comput. Fluids 2021, 218, 104847. [Google Scholar] [CrossRef]
  18. Chang, X.; Ma, R.; Wang, N.; Zhao, Z.; Zhang, L. A parallel implicit hole-cutting method based on background mesh for unstructured Chimera grid. Comput. Fluids 2020, 198, 104403. [Google Scholar] [CrossRef]
  19. Champasak, P.; Panagant, N.; Pholdee, N.; Bureerat, S.; Rajendran, P.; Yildiz, A.R. Grid-based many-objective optimiser for aircraft conceptual design with multiple aircraft configurations. Eng. Appl. Artif. Intell. 2023, 126, 106951. [Google Scholar] [CrossRef]
  20. Jiang, W.; Zhang, Y.; Yang, A. Numerical simulations of complex aircraft configurations using structured overset grids with implicit hole-cutting. Aerosp. Sci. Technol. 2019, 94, 105402. [Google Scholar] [CrossRef]
  21. Liu, T.; Qu, K.; Cai, J.; Pan, S. A three-dimensional aircraft ice accretion model based on the numerical solution of the unsteady Stefan problem. Aerosp. Sci. Technol. 2019, 93, 105328. [Google Scholar] [CrossRef]
  22. Pang, C.; Gao, Z.; Yang, H.; Chen, S. An efficient grid assembling method in unsteady dynamic motion simulation using overset grid. Aerosp. Sci. Technol. 2021, 110, 106450. [Google Scholar] [CrossRef]
  23. Qi, H.; Xu, G.; Lu, C.; Shi, Y. A study of coaxial rotor aerodynamic interaction mechanism in hover with high-efficient trim model. Aerosp. Sci. Technol. 2019, 84, 1116–1130. [Google Scholar] [CrossRef]
  24. Hwang, Y.J.; Kwon, O.J. Assessment of S-76 rotor hover performance in ground effect using an unstructured mixed mesh method. Aerosp. Sci. Technol. 2019, 84, 223–236. [Google Scholar] [CrossRef]
  25. Oehrle, C.; Fery, F.; Thiemeier, J.; Manuel, K.; Ewald, K. Coupled and trimmed aerodynamic and aeroacoustic simulations for Airbus Helicopters’ compound helicopter RACER. J. Am. Helicopter Soc. 2019, 64, 1–14. [Google Scholar] [CrossRef]
  26. Chirico, G.; Barakos, G.N.; Bown, N. Propeller installation effects on turboprop aircraft acoustics. J. Sound Vib. 2018, 424, 238–262. [Google Scholar] [CrossRef]
  27. Higgins, R.J.; Barakos, G.N.; Shahpar, S.; Tristanto, I. A computational fluid dynamic acoustic investigation of a tiltwing eVTOL concept aircraft. Aerosp. Sci. Technol. 2021, 111, 106571. [Google Scholar] [CrossRef]
  28. Myers, M.K.; Hausmann, J.S. Computation of acoustic scattering from a moving rigid surface. J. Acoust. Soc. Am. 1992, 91, 2594–2605. [Google Scholar] [CrossRef]
  29. Chen, S.Y.; Zhao, Q.J.; Ma, Y.Y. An adaptive integration surface for predicting transonic rotor noise in hovering and forward flights. Chin. J. Aeronaut. 2019, 32, 2047–2058. [Google Scholar] [CrossRef]
  30. Chen, X.; Zhang, K.; Zhao, Q.; Wang, W. Numerical analysis of rotor aeroacoustic characteristics during collective pitch aperiodic variation in hover. Aerosp. Sci. Technol. 2022, 124, 107411. [Google Scholar] [CrossRef]
  31. Li, P.; Zhao, Q.J.; Zhu, Q. CFD calculations on the unsteady aerodynamic characteristics of a tilt-rotor in a conversion mode. Chin. J. Aeronaut. 2015, 28, 1593–1605. [Google Scholar] [CrossRef]
  32. Zhao, Q.J.; Zhao, G.Q.; Wang, B. Robust Navier-Stokes method for predicting unsteady flowfield and aerodynamic characteristics of helicopter rotor. Chin. J. Aeronaut. 2018, 31, 214–224. [Google Scholar] [CrossRef]
  33. Meakin, R. A new method for establishing intergrid communication among systems of overset grids. In Proceedings of the 10th Computational Fluid Dynamics Conference, Honolulu, HI, USA, 24–27 June 1991. [Google Scholar]
  34. Farassat, F.; Succi, G.P. A review of propeller discrete frequency noise prediction technology with emphasis on two current methods for time domain calculations. J. Sound Vib. 1980, 71, 399–419. [Google Scholar] [CrossRef]
  35. Francescantonio, P.D. A new boundary integral formulation for the prediction of sound radiation. J. Sound Vib. 1997, 202, 491–509. [Google Scholar] [CrossRef]
  36. Roe, P.L. Approximate Riemann solvers, parameter vectors, and difference schemes. J. Comput. Phys. 1981, 43, 357–372. [Google Scholar] [CrossRef]
  37. Raymond, E.M.; Susan, A.G. Steady and periodic pressure measurements on a generic helicopter fuselage model in the presence of a rotor. NASA Tech. Memo. 2000, 210286. [Google Scholar]
  38. Ho, J.C.; Yeo, H. Analytical study of an isolated coaxial rotor system with lift offset. Aerosp. Sci. Technol. 2020, 100, 105818. [Google Scholar] [CrossRef]
  39. Jia, Z.; Lee, S. Impulsive loading noise of a lift-offset coaxial rotor in high-speed forward flight. AIAA J. 2020, 58, 687701. [Google Scholar] [CrossRef]
  40. Hayami, K.; Sugawara, H.; Yumino, T.; Tanabe, Y.; Kameda, M. CFD analysis on the performance of a coaxial rotor with lift offset at high advance ratios. Aerosp. Sci. Technol. 2023, 135, 108194. [Google Scholar] [CrossRef]
Figure 1. Computational grid and geometric parameters. (a) Background grid and all body-fitted grids. (b) Computational domain dimensions. (c) Geometric parameters of propeller blade.
Aerospace 12 00343 g001
Figure 2. Grid boundary before and after the boundary identification method. (Regions A/B are the cross-sectional areas where overlaps occur at azimuths of 90° and 60°, respectively).
Aerospace 12 00343 g002
Figure 3. Adaptive boundary of blade grid. (a) Flowchart to select boundary cells adaptive to the body. (b) Adaptive effects of some sections.
Aerospace 12 00343 g003
Figure 4. Grid configuration and relative positions in the case.
Aerospace 12 00343 g004
Figure 5. Comparison of pressure coefficients calculated with different numbers of grids.
Aerospace 12 00343 g005
Figure 6. Pressure coefficient C P distributions on the fuselage surface for various sections.
Aerospace 12 00343 g006
Figure 7. Comparison of sound pressure between calculation and tests.
Aerospace 12 00343 g007
Figure 8. Three configurations for flow simulation.
Aerospace 12 00343 g008
Figure 9. The flowfields of the FP and RFP configurations. ( v 1 = ( v v ) / v , where v represents the local forward speed and v represents the initial forward speed).
Aerospace 12 00343 g009
Figure 10. Distribution of dFy/Fy,SP along the azimuths and spanwise. (dFy/Fy,SP = (Fy − Fy,SP)/Fy,SP, where Fy represents the thrust in the FP or RFP configuration and Fy,SP represents the thrust in the SP configuration). (a) FP configuration. (The letters A and B mark two zones where the aerodynamic forces change significantly.) (b) RFP configuration. (The letters C and D mark two zones where the aerodynamic forces change significantly).
Aerospace 12 00343 g010
Figure 11. SPL distribution in the aeroacoustic radiation hemisphere for three configurations.
Aerospace 12 00343 g011
Figure 12. Distribution of the axial velocity variation at three forward speeds.
Aerospace 12 00343 g012
Figure 13. Distribution of the blade thrust along azimuths at different forward speeds.
Aerospace 12 00343 g013
Figure 14. ΔSPL distribution at three forward speeds in the sound hemisphere.
Aerospace 12 00343 g014
Figure 15. ΔSPL distribution in frequency domain at different speeds.
Aerospace 12 00343 g015
Figure 16. Sound pressure in time domain of observer #2.
Aerospace 12 00343 g016
Figure 17. Comparison of thrust for different vertical velocities (Faver represents the average thrust of the blade in the semicircle). (a) Fy distribution and Faver in left and right semicircles in SP configuration. (b) Fy distribution and Faver in left and right semicircles in FP configuration.
Aerospace 12 00343 g017
Figure 18. u1 distribution at different states ( u 1 = ( u u ) / u , where u represents the real-time vertical velocity, and u represents the initial vertical velocity).
Aerospace 12 00343 g018
Figure 19. Aeroacoustic radiation sphere in different flight states.
Aerospace 12 00343 g019
Figure 20. Aeroacoustic radiation hemisphere in different flight states.
Aerospace 12 00343 g020
Figure 21. Variation in noise offset in two configurations ( θ = arcsin u V , where u represents the vertical velocity, and V represents the resultant velocity).
Aerospace 12 00343 g021
Table 1. Gird convergence verification.
Grid QuantityFuselage Grid/MillionBlade Grid/MillionBackground Grid/MillionTotal Grid/MillionComputational Time/HourAerodynamic Pressure Error/%
RANK 11.92.414.218.5245.70.88
RANK 23.43.821.929.1467.10.72
RANK 34.04.630.839.4594.50.59
RANK 45.15.342.953.3746.60.58
Table 2. Numerical simulation parameters.
Fuselage LengthFuselage WidthPropeller RadiusPropeller ChordPropeller RPMAir Density
5.46 m2.27 m1.0 m0.154 m2655 r/min1.225 kg/m3
Table 3. Boundaries and boundary conditions.
Boundary Boundary Condition
Numerical simulation
(URANS)
Fuselage surfaceSlip-free adiabatic boundary condition
Propeller blade surfaceSlip-free adiabatic boundary condition
Farfield boundaryReflection-free boundary condition
Noise prediction
(FW-H equations)
Fuselage Farassat1A
PropellerFW-H_pds
Disclaimer/Publisher’s Note: The statements, opinions and data contained in all publications are solely those of the individual author(s) and contributor(s) and not of MDPI and/or the editor(s). MDPI and/or the editor(s) disclaim responsibility for any injury to people or property resulting from any ideas, methods, instructions or products referred to in the content.

