Article

Development of a Modular Test Rig for In-Flight Validation of a Multi-Hole Probe Onboard the e-Genius-Mod

Institute of Aircraft Design (IFB), University of Stuttgart, Pfaffenwaldring 31, 70569 Stuttgart, Germany
*
Authors to whom correspondence should be addressed.
Aerospace 2025, 12(4), 345; https://doi.org/10.3390/aerospace12040345
Submission received: 17 February 2025 / Revised: 22 March 2025 / Accepted: 11 April 2025 / Published: 15 April 2025

Abstract

:
Scaled flight demonstrators have played an important part throughout the history of aviation. Ranging from aviation pioneers to renowned institutions like the National Aeronautics and Space Administration (NASA), many actors have relied on miniaturized models in both research and development. Despite the age of the method, sub-scale models are still being used as a low-cost option for flight tests in realistic flight conditions. One utilization aspect that is becoming increasingly popular is as a flying test platform for the development and testing of new aviation technologies or capabilities. By conducting flight tests in real atmospheric conditions, it enables a low-cost link between analytical studies and full-scale testing, consequently closing the gap between Technology Readiness Levels (TRLs) 4 and 6, which is both time- and cost-efficient. For this paper, the utilization of the e-Genius-Mod, a modular scaled version of the all-electric e-Genius aircraft, as a versatile platform for testing new technologies is being investigated. As a case study, a multi-hole probe (MHP) is installed onto the aircraft through a custom-made wing adapter and connected to an independent data collection system. By using Computational Fluid Dynamics (CFD) simulations and wind-tunnel tests, the probe installation is validated, paving the way for upcoming flight tests.

1. Introduction

The use of sub-scale models during the development process of aircraft and other aerial vehicles is as old as aviation itself. Pioneers like Leonardo da Vinci or the Wright Brothers built scaled-down versions of their designs to understand their behavior during flight and thus make improvements to their vehicles [1]. As the role of unmanned aerial vehicles, especially fixed-wing aircraft, has increased significantly in recent decades, new tools and methods have emerged, making accurate and systematic tests possible. One of the most noticeable organizations contributing a great deal of research was the National Advisory Committee for Aeronautics (NACA) in the United States, which later became NASA. Sub-scale models have played a significant role as a research tool for almost 100 years now. According to Chambers [1], the research fields investigated with sub-scale models include, among others, aerodynamics, aircraft structures, propulsion, and flight controls. The models are categorized into two groups: static and dynamic models. The former are generally used in wind tunnels under controlled conditions, while dynamic models are mostly operated outside of facilities in free flight. Within the scope of this paper, these free-flying (mostly scaled) models will be referred to as scaled flight demonstrators (SFDs).

1.1. The Role of SFDs in Aviation

The major advantage of SFDs over static models is the inclusion of vehicular motions during testing. This enables sub-scale models to experience flight conditions outside the normal flight envelope, which are on the one hand hard to study in static testing conditions and on the other considered too dangerous for full-scale testing. However, with the introduction of new analytical tools, like CFD simulations, the fields of application for SFDs have narrowed. This is especially noticeable for conventional tube-and-wing designs, where the vast amount of available information has even led to the creation of analytical textbook design methods, like Torenbeek [2], Raymer [3], and Roskam [4], just to name a few.
Consequently, the role of SFDs has changed since the early days of aviation. In a review from 2021, Sobron et al. [5] created an overview of the active SFDs used for scientific research within the previous decade. It detected a growing interest in SFDs as a low-cost technology testing platform, evaluating new technologies or configurations. As SFD-components become cheaper and more powerful, flight tests in real atmospheric environments become more accessible. Another interesting finding was the popularity of so-called demonstrative scaling, in which scaled models or technologies do not necessarily follow traditional scaling laws since the focus lies in testing the basic functionality or understanding fundamental effects. Especially during the early stages of development, test results from SFDs could make a great impact on future development without consuming valuable resources. Also, when the textbook methods are unable to provide sufficient information, e.g., for unconventional configurations and technologies, SFDs can provide critical information. Examples of state-of-the-art development methods, along with their strengths and limitations, are listed below (Table 1):
An early example is the Vought–Sikorsky V-173 ‘Flying Pancake’, which was tested at one of the NACA research facilities. Despite the disappointing first test flight, the lessons learned resulted in crucial modifications, massively improving the flight characteristics [1]. More recent examples include the X-48B LSV, an 8.5% scaled Blended Wing Body (BWB), which first flew in 2007 and also aimed to examine handling characteristics [10]. Similar research questions led to the development of the VELA and consequently VELA2 [15] at the University of Stuttgart as part of the German K2020 project (see Figure 1), which marks the beginning of the unmanned aerial vehicle (UAV) research group at the Institute of Aircraft Design (IFB) in 2005. Notable follow-up projects include the Innovative Evaluation Platform (IEP), which was designed and built in 2010 as part of the European research project NACRE [13,16], in order to investigate its potential multidisciplinary use by using a modular structure for rapid configuration changes. Currently, the main focus of the UAV research group lies in the e-Genius-Mod, which will be described in more detail in the following subsection.

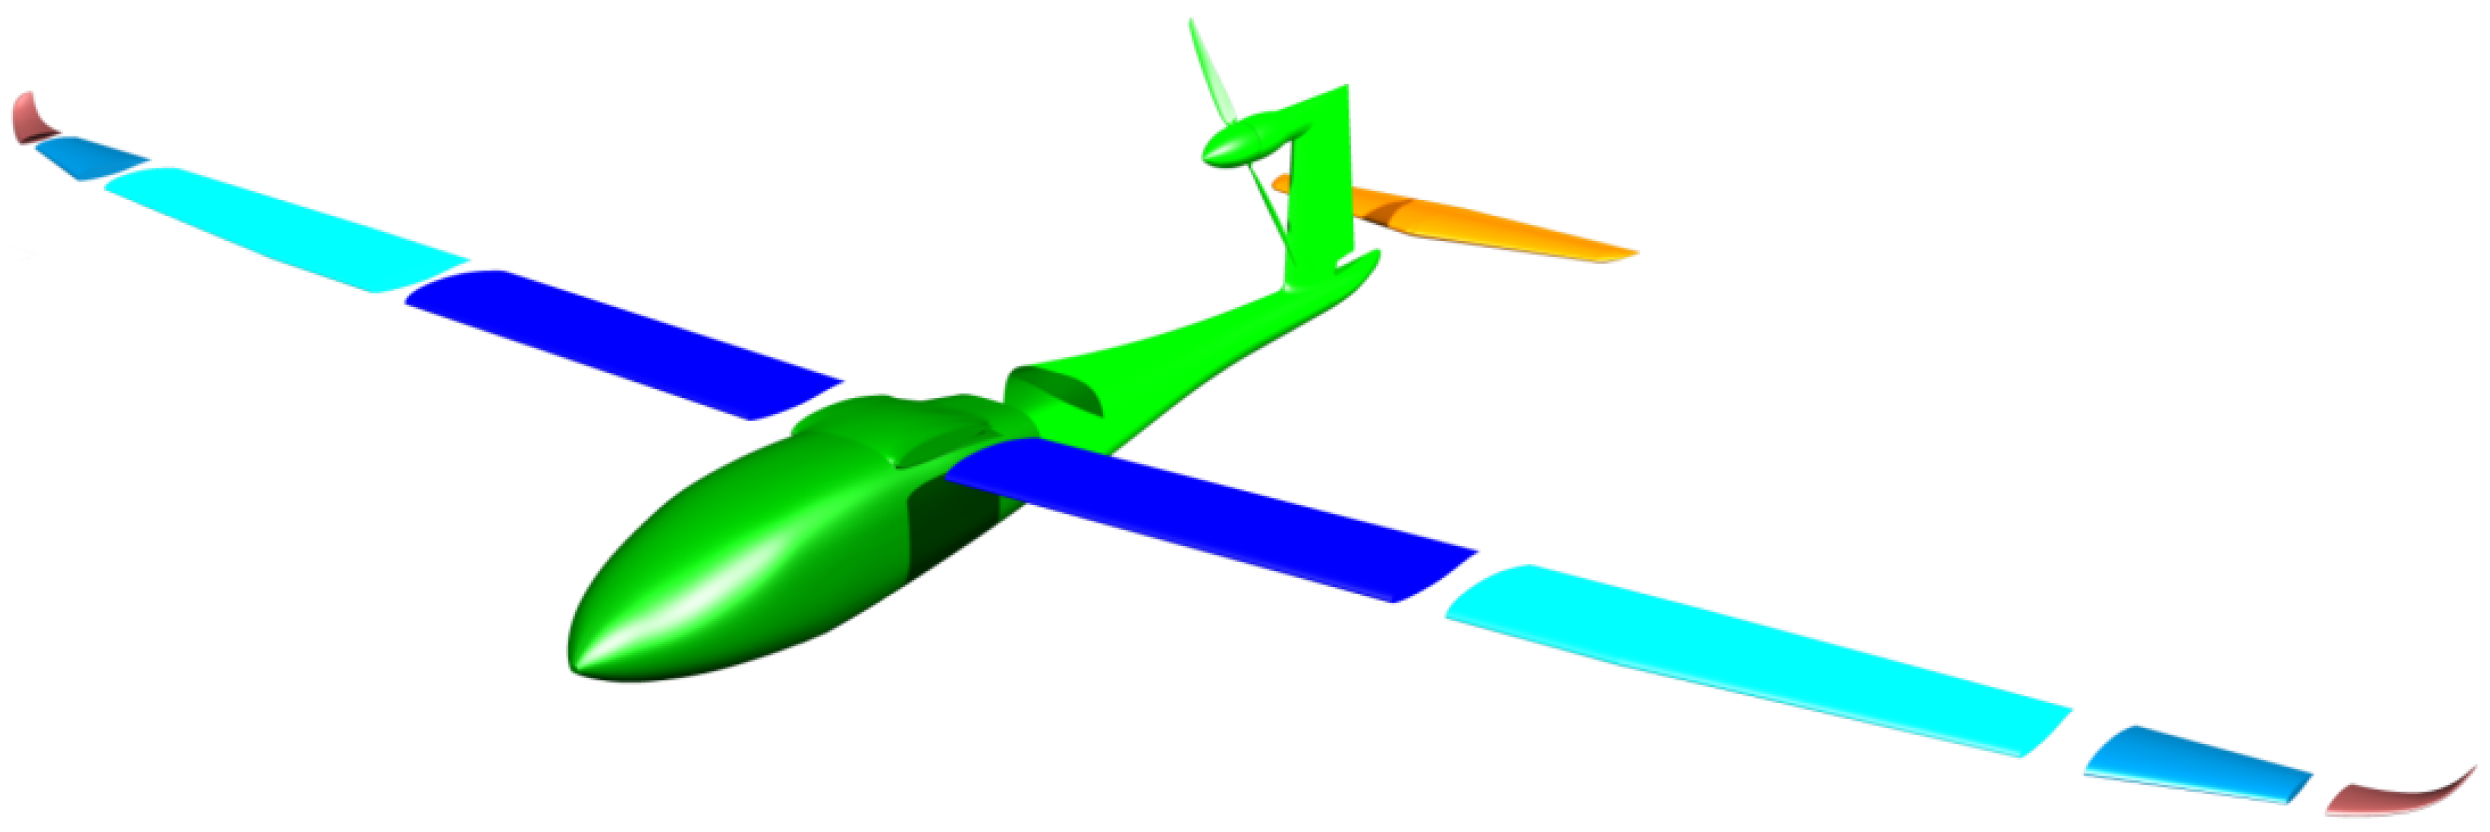
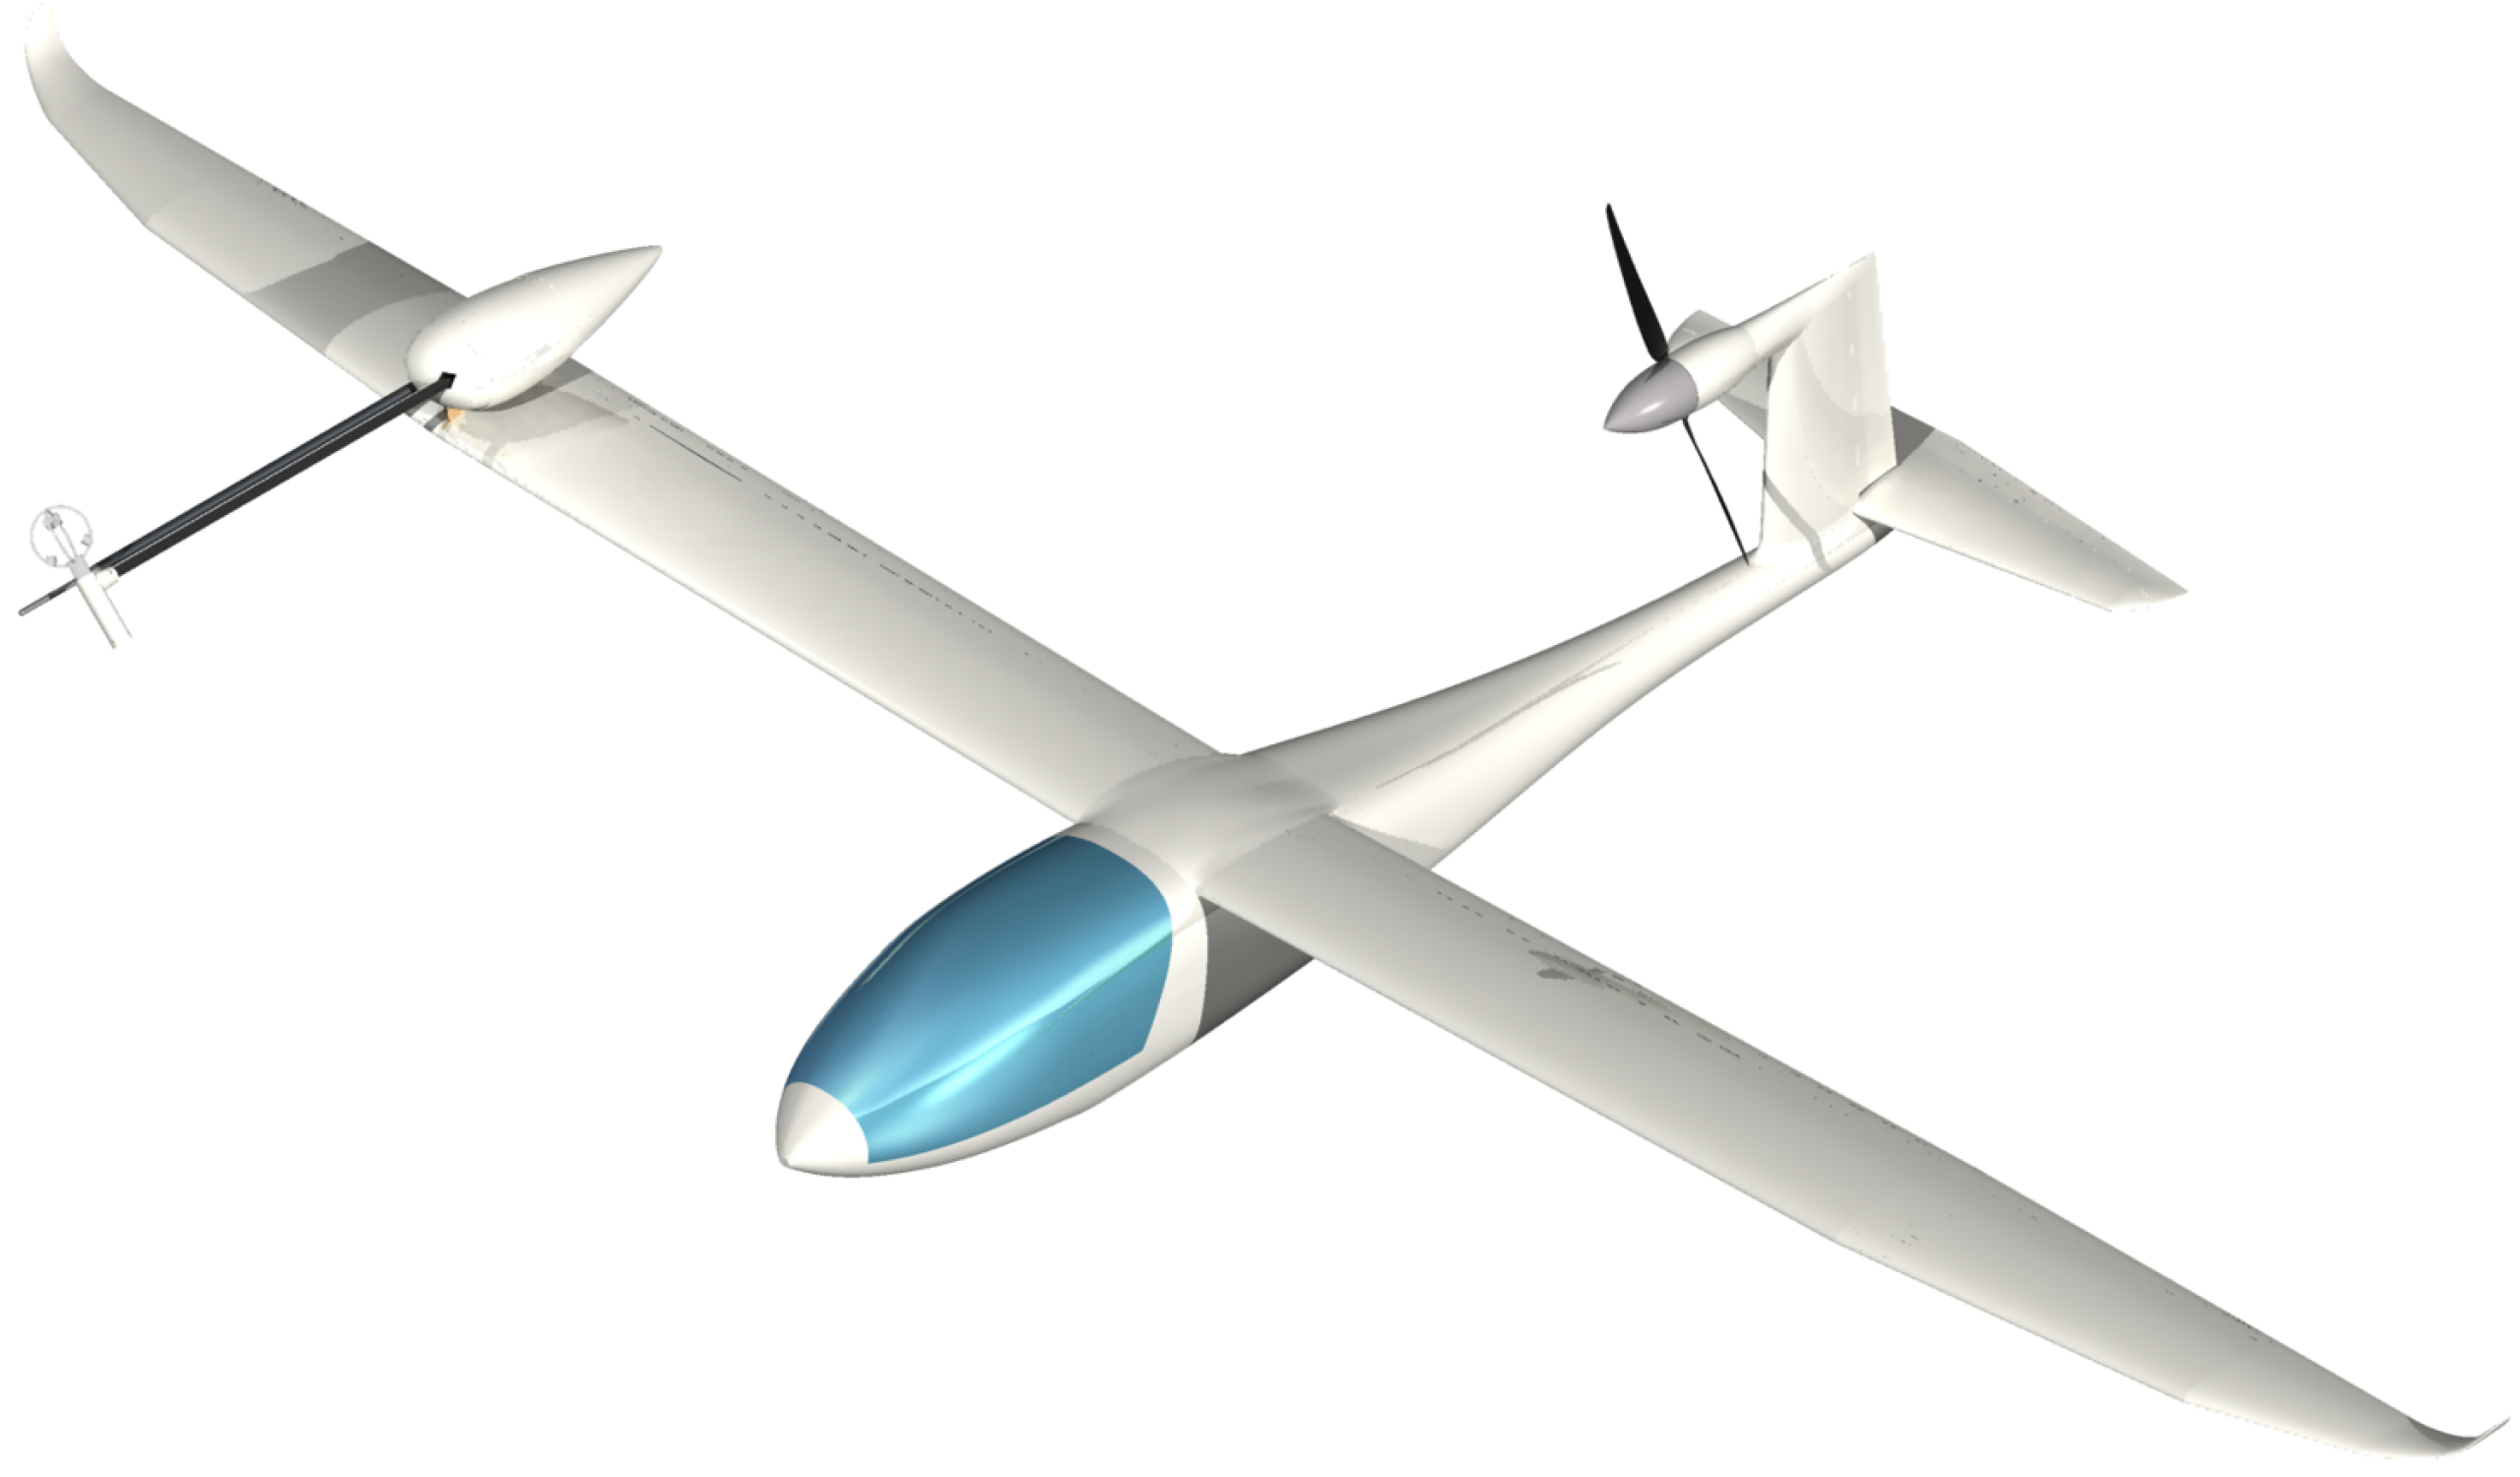
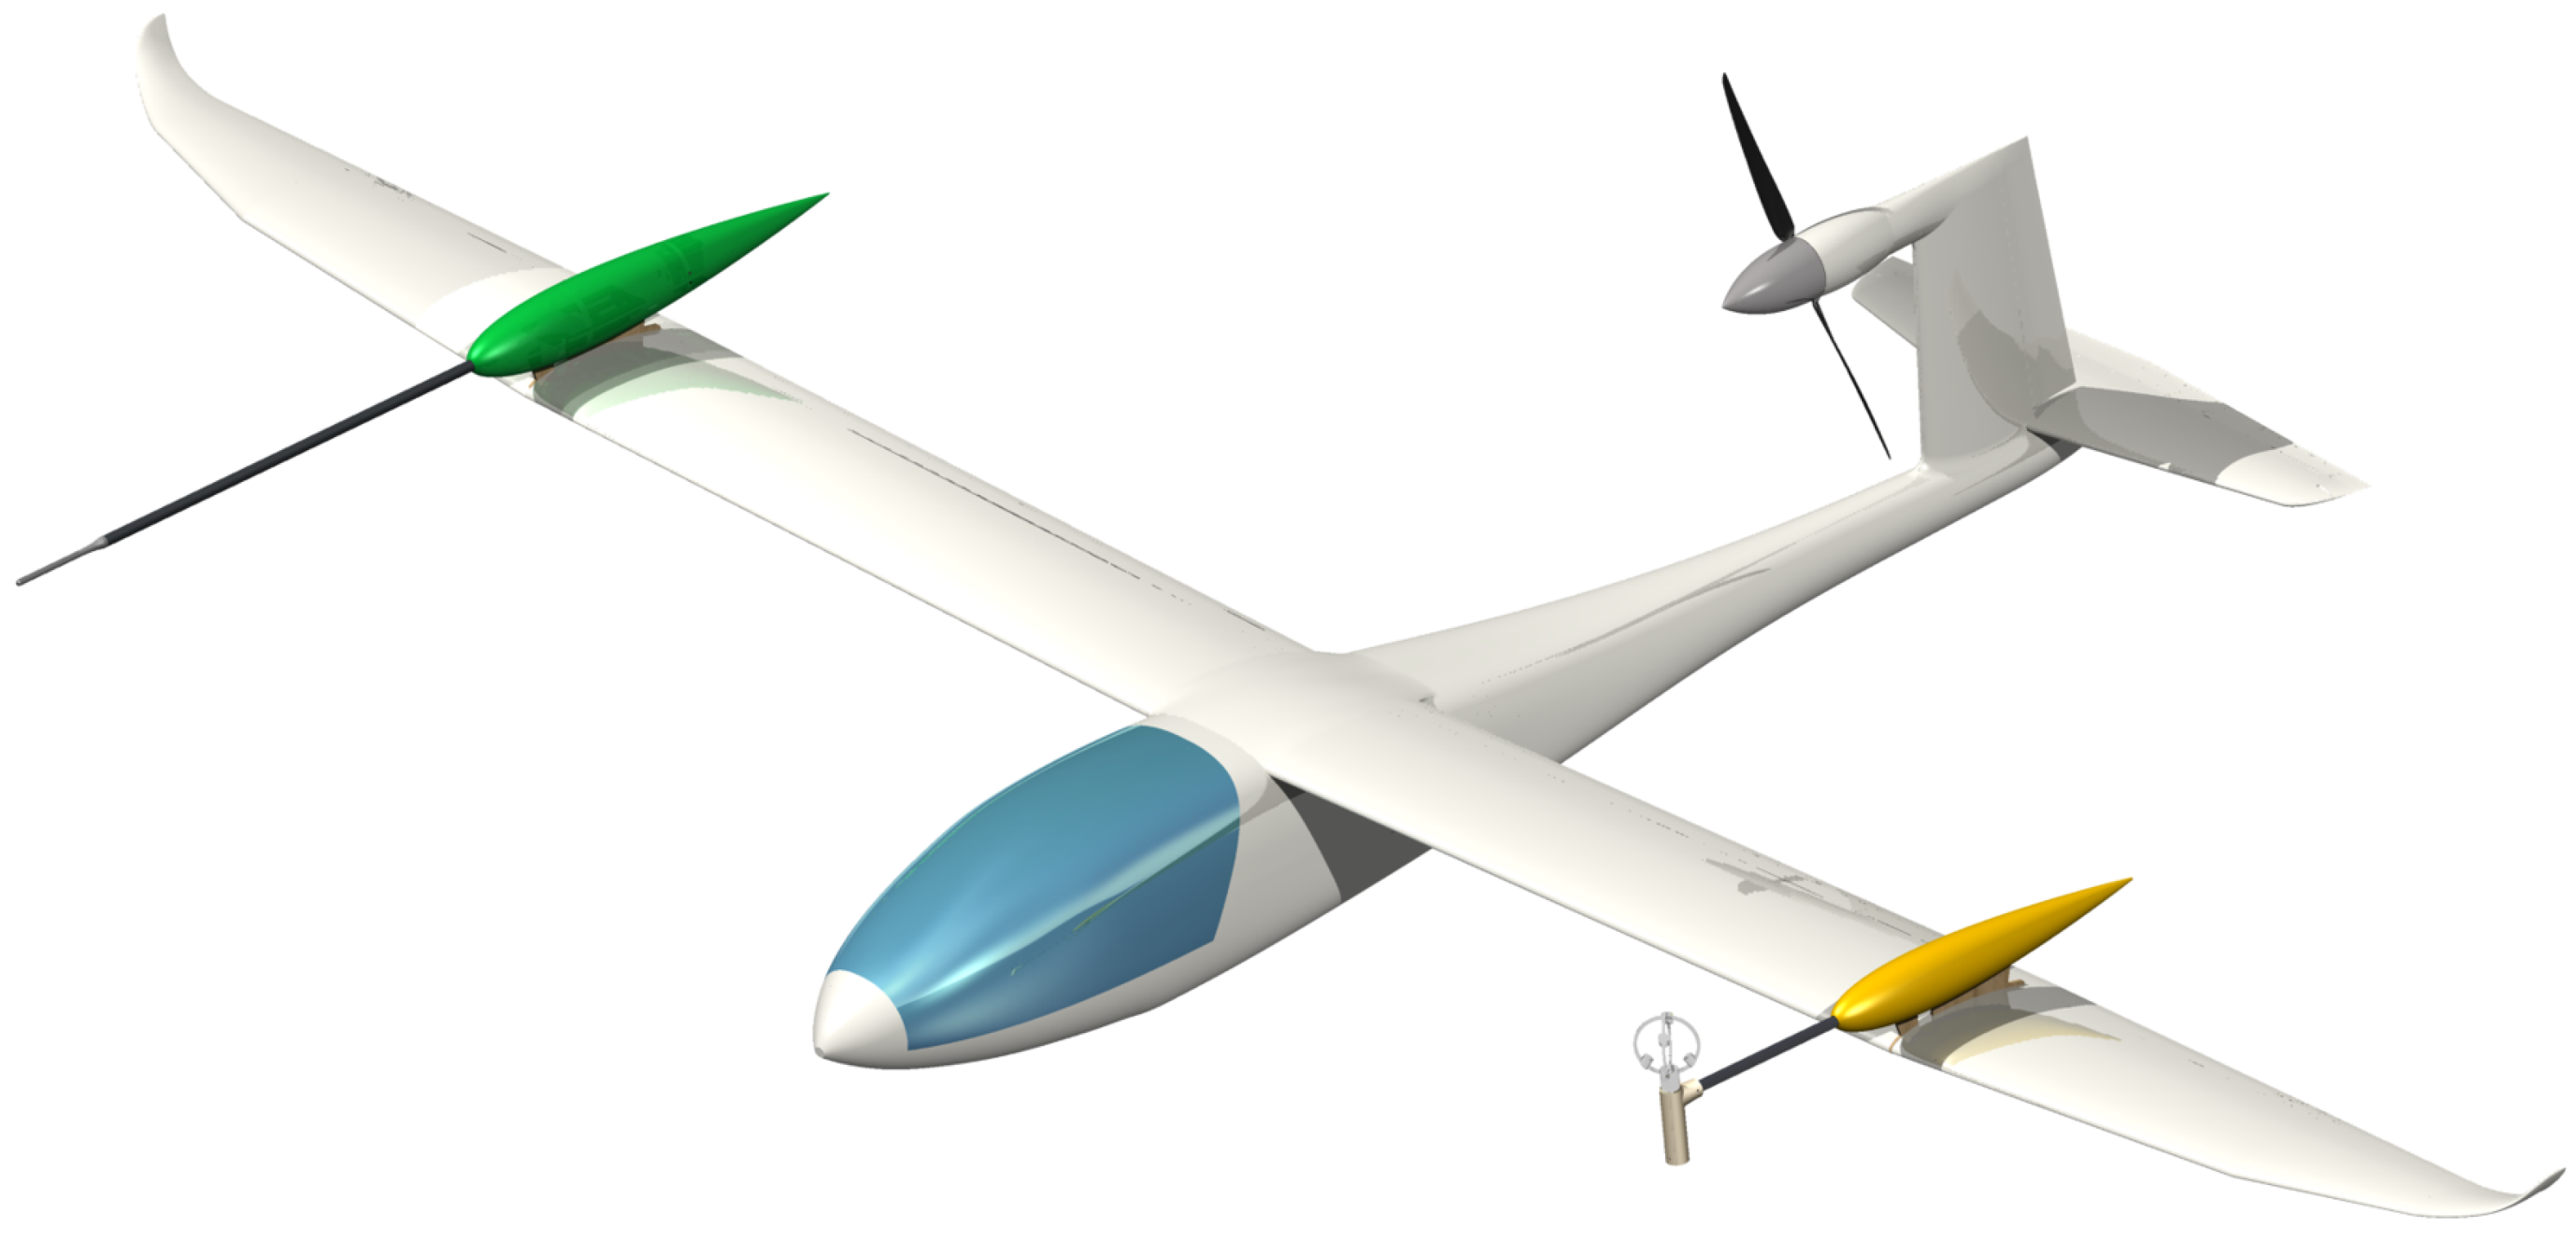
1.2. The e-Genius-Mod

The e-Genius-Mod is a modular free-flight test platform, which is a 1:3 scaled model of the e-Genius, an all-electric motor glider [12]. Both aircraft were designed and manufactured at the IFB and are valuable tools for in-flight research. A side-by-side comparison of both aircraft is shown in Figure 2. In accordance with the recent trend in SFD testing, which is described in the previous subsection, the e-Genius-Mod is a demonstrative scaled model. This was achieved by conducting the scaling in compliance with the Froude number [12]. The resulting dimensions of the e-Genius-Mod are listed in Table 2.
The main purpose of the e-Genius-Mod is to serve as a technology test bed in order to demonstrate new aircraft designs and technologies during free-flight conditions [17]. Following the approach used during NACRE (“New Aircraft Concept Research”), the e-Genius-Mod features a modular airframe, making both time- and cost-effective changes. Being equipped with a wide array of measurement equipment, the e-Genius-Mod serves as a so-called ‘flying wind tunnel’, collecting the relevant data needed to evaluate the performance and effectiveness of new technologies (see Table 3) [18].
Table 2. Technical data of the e-Genius-Mod [12,18].
ParameterValue
Aircraft length2.95 m
Wing span5.62 m
Wing area1.5 6m2
Aspect ratio20.2
Maximum take-off mass (MTOM)41 kg
Maximum payload10 kg
Electric drive power5 kW
Max. thrust156 N
Design speed24.8 m/s
Battery capacity63 Ah 1
1 Flight test characteristic.
Since the finalization of the manufacturing process, the e-Genius-Mod has conducted a wide range of research flights. After examining the performance of the base configuration [18], wingtip propellers were installed to interact with the wingtip vortexes as part of the research project ELFLEAN (“Elektrische Flächenendantriebe zur Entwicklung energieeffizienter und leiser Flugzeuge”), an electric wingtip propulsion system for the development of energy-efficient and noise-reduced airplanes. Among other results, a reduction in aerodynamic drag was shown when using the propellers in a tractor configuration rotating opposite to the vortexes [17]. As the next step, the tail rotor was removed and replaced by a total of eight propellers, distributed over the wing. The goal of the resulting research project VELAN (“Verteilte elektrische Antriebe”), regarding distributed electric propulsion, is to investigate the interdisciplinary influence of distributed electric propulsion (DEP). Although the project is still ongoing at the time of publication, the follow-up project eMission has been approved, in which further modifications will be made in terms of aerodynamics, propulsion, and flight dynamics. The evolution of the e-Genius-Mod from its original configuration to the VELAN configuration is shown in Figure 3.

1.3. Utilization of the e-Genius-Mod as a Technology Test Platform

During the test campaign of ELFLEAN, it became clear that testing in real atmospheric conditions can potentially induce large measurement errors [19]. Especially, vertical gusts and turbulence can cause significant measurement errors as they influence both the altitude and velocity of the aircraft, which is being controlled by the autopilot, as well as its attitude. In addition to the solutions proposed by the authors, the detectability of these atmospheric influences could lead to more precise measurement for flights. However, this requires precise measurement equipment that can detect even the smallest atmospheric disturbances. As a result, the research project OptiDeV (“Optimierte Datenerfassung zur Vermessung von Strömungsbedingungen im Freiflug”), regarding optimized data acquisition for the measurement of flow conditions in flight tests, was initiated in order to investigate the degree to which the existing measurement equipment is able to register such atmospheric disturbances. As Table 3 indicates, a five-hole probe with a corresponding air data computer is already part of the standard measurement system of the e-Genius-Mod.
Table 3. List of measurement devices installed onboard the e-Genius-Mod [18].
UnitSensor TypeVariable
Board computer [Pixhawk 4®]
by Holybro (Hongkong)
Inertial Measurement Unit (IMU)
 
Estimation via Kalman filter
(IMU, GPS, Magnetometer
Barometer)
Linear accelerations
Rotation rates
Position
Attitude
Velocity
Air data boom
+Computer [VectoDAQ]
by Vectoflow GmbH
(Gilching, Germany)
5-hole probe
with temperature sensor
True air speed (TAS)
Angle of attack ( α )
Angle of sideslip ( β )
Air density ( ρ )
Actuator [Volz DA15N]
by Volz Servos GmbH & Co. KG
(Offenbach am Main, Germany)
Magnet sensor
 
 Rotor sensor
Control surface
 
Deflection angle
The project OptiDeV is divided into two separate parts as both the University of Stuttgart and Vectoflow GmbH focus on different research subjects and goals. In this paper, only the research subjects of the University of Stuttgart will be addressed, which are
  • Measurement of atmospheric influences during free flight;
  • Utilization of UAVs as technology demonstrators.
In order to address these research subjects, a five-hole probe will be installed onboard the e-Genius-Mod and tested during free flight. By analyzing and comparing the data to reference measurements, the accuracy of the probes and their capability to detect small atmospheric disturbances, such as vertical winds and gusts, can be defined. The second research goal addresses the potential of using UAVs to test and validate new technologies during free flight. The main difference from previous research conducted with the e-Genius-Mod is that the airframe only serves as a carrier for the tested technology. Since conducting flight tests on full-scale aircraft is both time-consuming and expensive, UAVs could help to increase the TRL by conducting tests in a relevant environment. This approach is not new as, e.g., the development of the FLEXI-bird benefited from such in-flight testing [13]. In that case, small model aircraft, so-called Lifters, were used to test the hard- and software of the avionic system in order to minimize risks.
As this utilization approach has not yet been tested for the e-Genius-Mod, this project aims to prove its capability as a technology demonstrator. Although one could argue that smaller and cheaper UAVs may be better suited for such test flights, they are, however, limited in terms of payload volume and mass. Moreover, compared to full-scale airplanes, the e-Genius-Mod is by far more simple and cost-efficient to operate.

2. Test Setup

Within the following paragraphs, the approach is explained in which the research subjects from Section 1 are being addressed. Prior to the design and manufacturing of the modular test rig (Section 2.3), the concept of the flight campaign is described, during which the functional capabilities of the MHP are being analyzed (Section 2.1). Subsequently the technical details of the MHP (Section 2.2.1) and the selection of the in-flight reference system (Section 2.2.2) are laid out.

2.1. Flight Campaign

Validating the MHP requires at least one reference measurement, which serves as a basis. Within this project, two measurement systems are intended to be used: one in-flight system, which will be installed onboard the e-Genius-Mod, alongside the MHP (Section 2.2.2Section 2.3), and one ground-based measurement system, consisting of Light Detection and Ranging (LIDAR) devices. By utilizing two separate reference systems, the accuracy and resolution of the measured data can be improved. Another positive effect is redundancy in case one of the reference measurement systems either fails during testing or records faulty data.
The planned flight path is displayed in Figure 4 and has already been used during previous flight campaigns [17,18]. It is flown by the onboard autopilot, commanding both airspeed and altitude to preset values. Advantageous features of this flight path are its long, straight tracks and the intersection in the center. This intersection lies within the measurement area of the ground-based LIDAR systems (purple square), enabling two passages of the e-Genius-Mod during one revolution.
The flight path can be categorized into 3 sections: Within the measurement section (green track), the e-Genius-Mod is commanded to achieve a horizontal, stationary flight. This is followed by a turn (red track) and a section for leveling off and stabilizing the aircraft (orange track) before re-entering the measurement section. Due to airspace restrictions and to ensure good visibility of the aircraft, an altitude of 300 m is set.
Although the goal of the flight campaign is to detect atmospheric disturbances, the magnitude of such should be kept low to ensure a safe flight with statistical accuracy and maximum repeatability. Through experiences from previous flights, suitable atmospheric conditions are often experienced when flying early in the morning [17,18,19].

2.2. Onboard Measurement Equipment

As mentioned, two types of onboard measurement equipment are used within the project. The first type is the MHP (Section 2.2.1), which will be examined in terms of accuracy and ability to measure small atmospheric winds and gusts. The selection of the in-flight measurement system is carried out in Section 2.2.2. As this paper focuses on the development of the modular test rig, the LIDAR system will not be addressed in detail.

2.2.1. MHP (Five-Hole Probe)

The MHP consists of a straight probe with 5 holes on its head and a static ring at the shaft. It is connected via pressure tubes to a computational unit, called the VectoDAQ, which uses the pressure values together with temperature data provided by a corresponding sensor to calculate a set of 62 physical parameters. An excerpt is presented in Table 4. In addition, two IMU sensors are mounted on the probe: one at the base and one at the tip (see Figure 5). These will later be used to examine whether probe vibrations will have an impact on the measurements. Each IMU is connected to a Nucleo board, which processes the raw data and provides acceleration and gyroscopic data (see Table 4).
Two probes were tested, which only differ in length. The short probe is 500 mm long, while the long probe offers 1000 mm, with both sharing the same width of 18 mm. The measurement rate lies at 25 Hz. For simplicity reasons, the probes will be referred to as MHPs.

2.2.2. Reference Measurement Device

In order to evaluate the accuracy of the MHPs and to assess the ability to detect small atmospheric disturbances, a reference measurement system is needed. Together with the specification that the system is going to be installed onboard the e-Genius-Mod, the following requirements arise:
  • Sufficient accuracy;
  • Small size;
  • Light weight;
  • High robustness;
  • Efficient power consumption;
  • Availability.
After an evaluation process, the TriSonica™Mini and TriSonica™Sphere by LI-COR Environmental, LLC (Lincoln, NE, USA) remained as potential reference systems. Both devices are ultrasonic anemometers (UAs), meaning the wind velocity and direction are determined through ultrasonic waves, which are emitted and absorbed by transceivers on the device. Both devices are advertised as suited for UAV operations and are compact and light. The specifications of both UAs are listed in the following table (Table 5):
Although the TriSonica™Mini is both smaller and weighs only a quarter of the larger TriSonica™Sphere, the latter device is ultimately chosen. The main reason includes the higher accuracy and resolution, which are critical for the planned atmospheric measurements. In addition, the installed accelerometer on the TriSonica™Sphere is advantageous, eliminating the need for additional IMUs. Another important parameter is the data output rate. Although both probes are able to achieve higher data rates than the 25 Hz of the MHP, the high rate of the TriSonica™Sphere makes it more likely to detect very brief atmospheric changes, which might remain unnoticed by the TriSonica™Mini.
The UA is mounted to the e-Genius-Mod via a mount adapter and carbon tube (Figure 6). This solution was chosen as the carbon tube is connected to the wing adapter in the exact same way as the MHP. As a result, both probes are compatible with each other’s mounting points. The installation on the e-Genius-Mod is described in detail in the next chapter (Section 2.3).

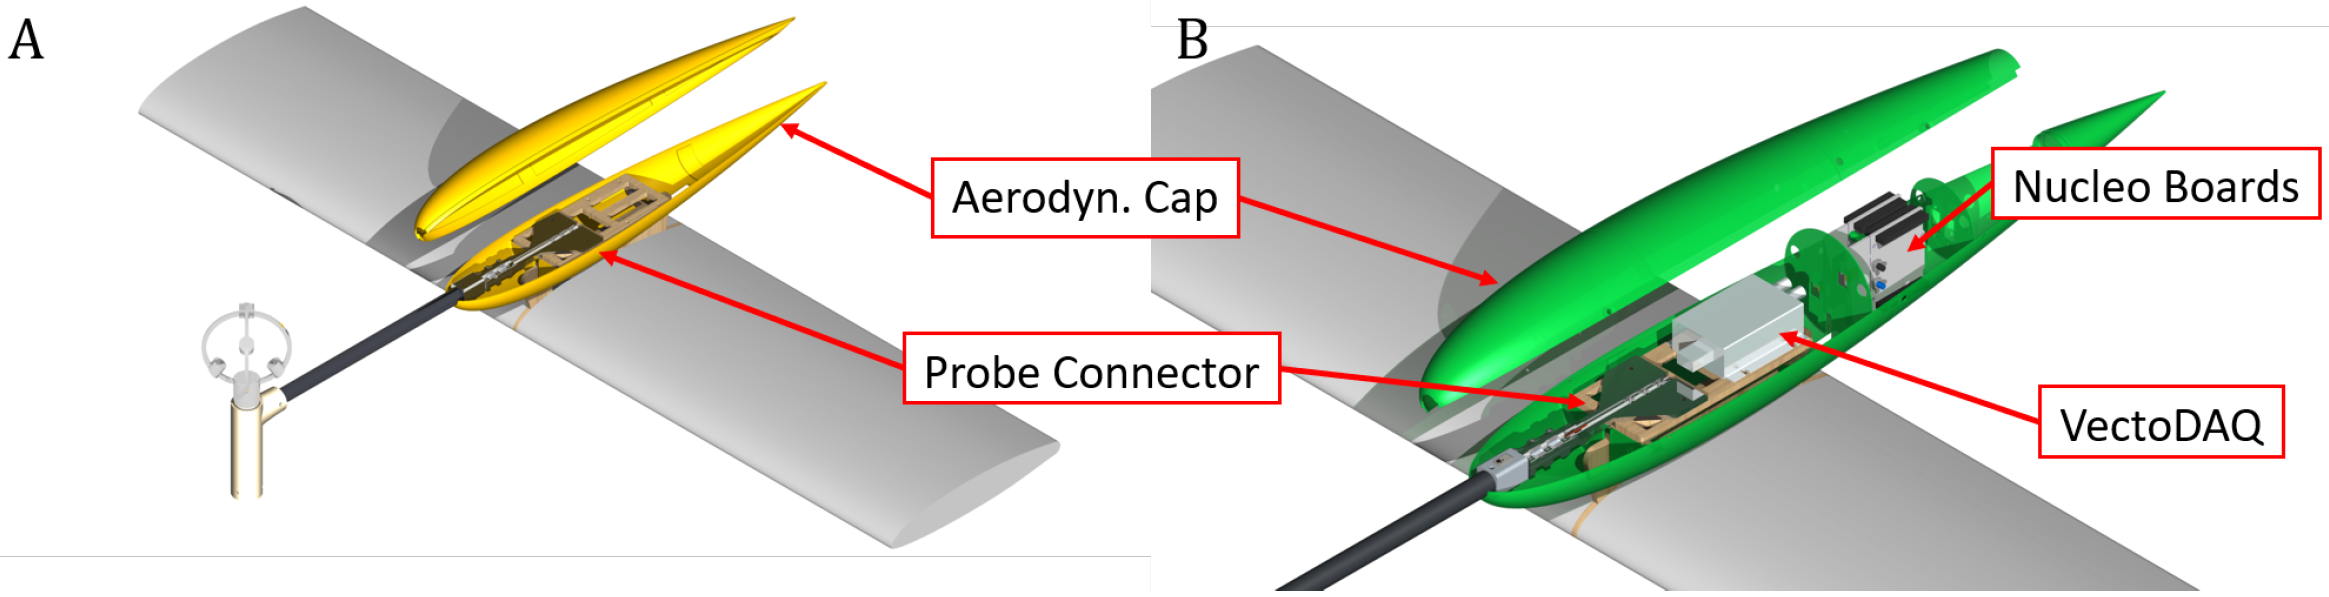
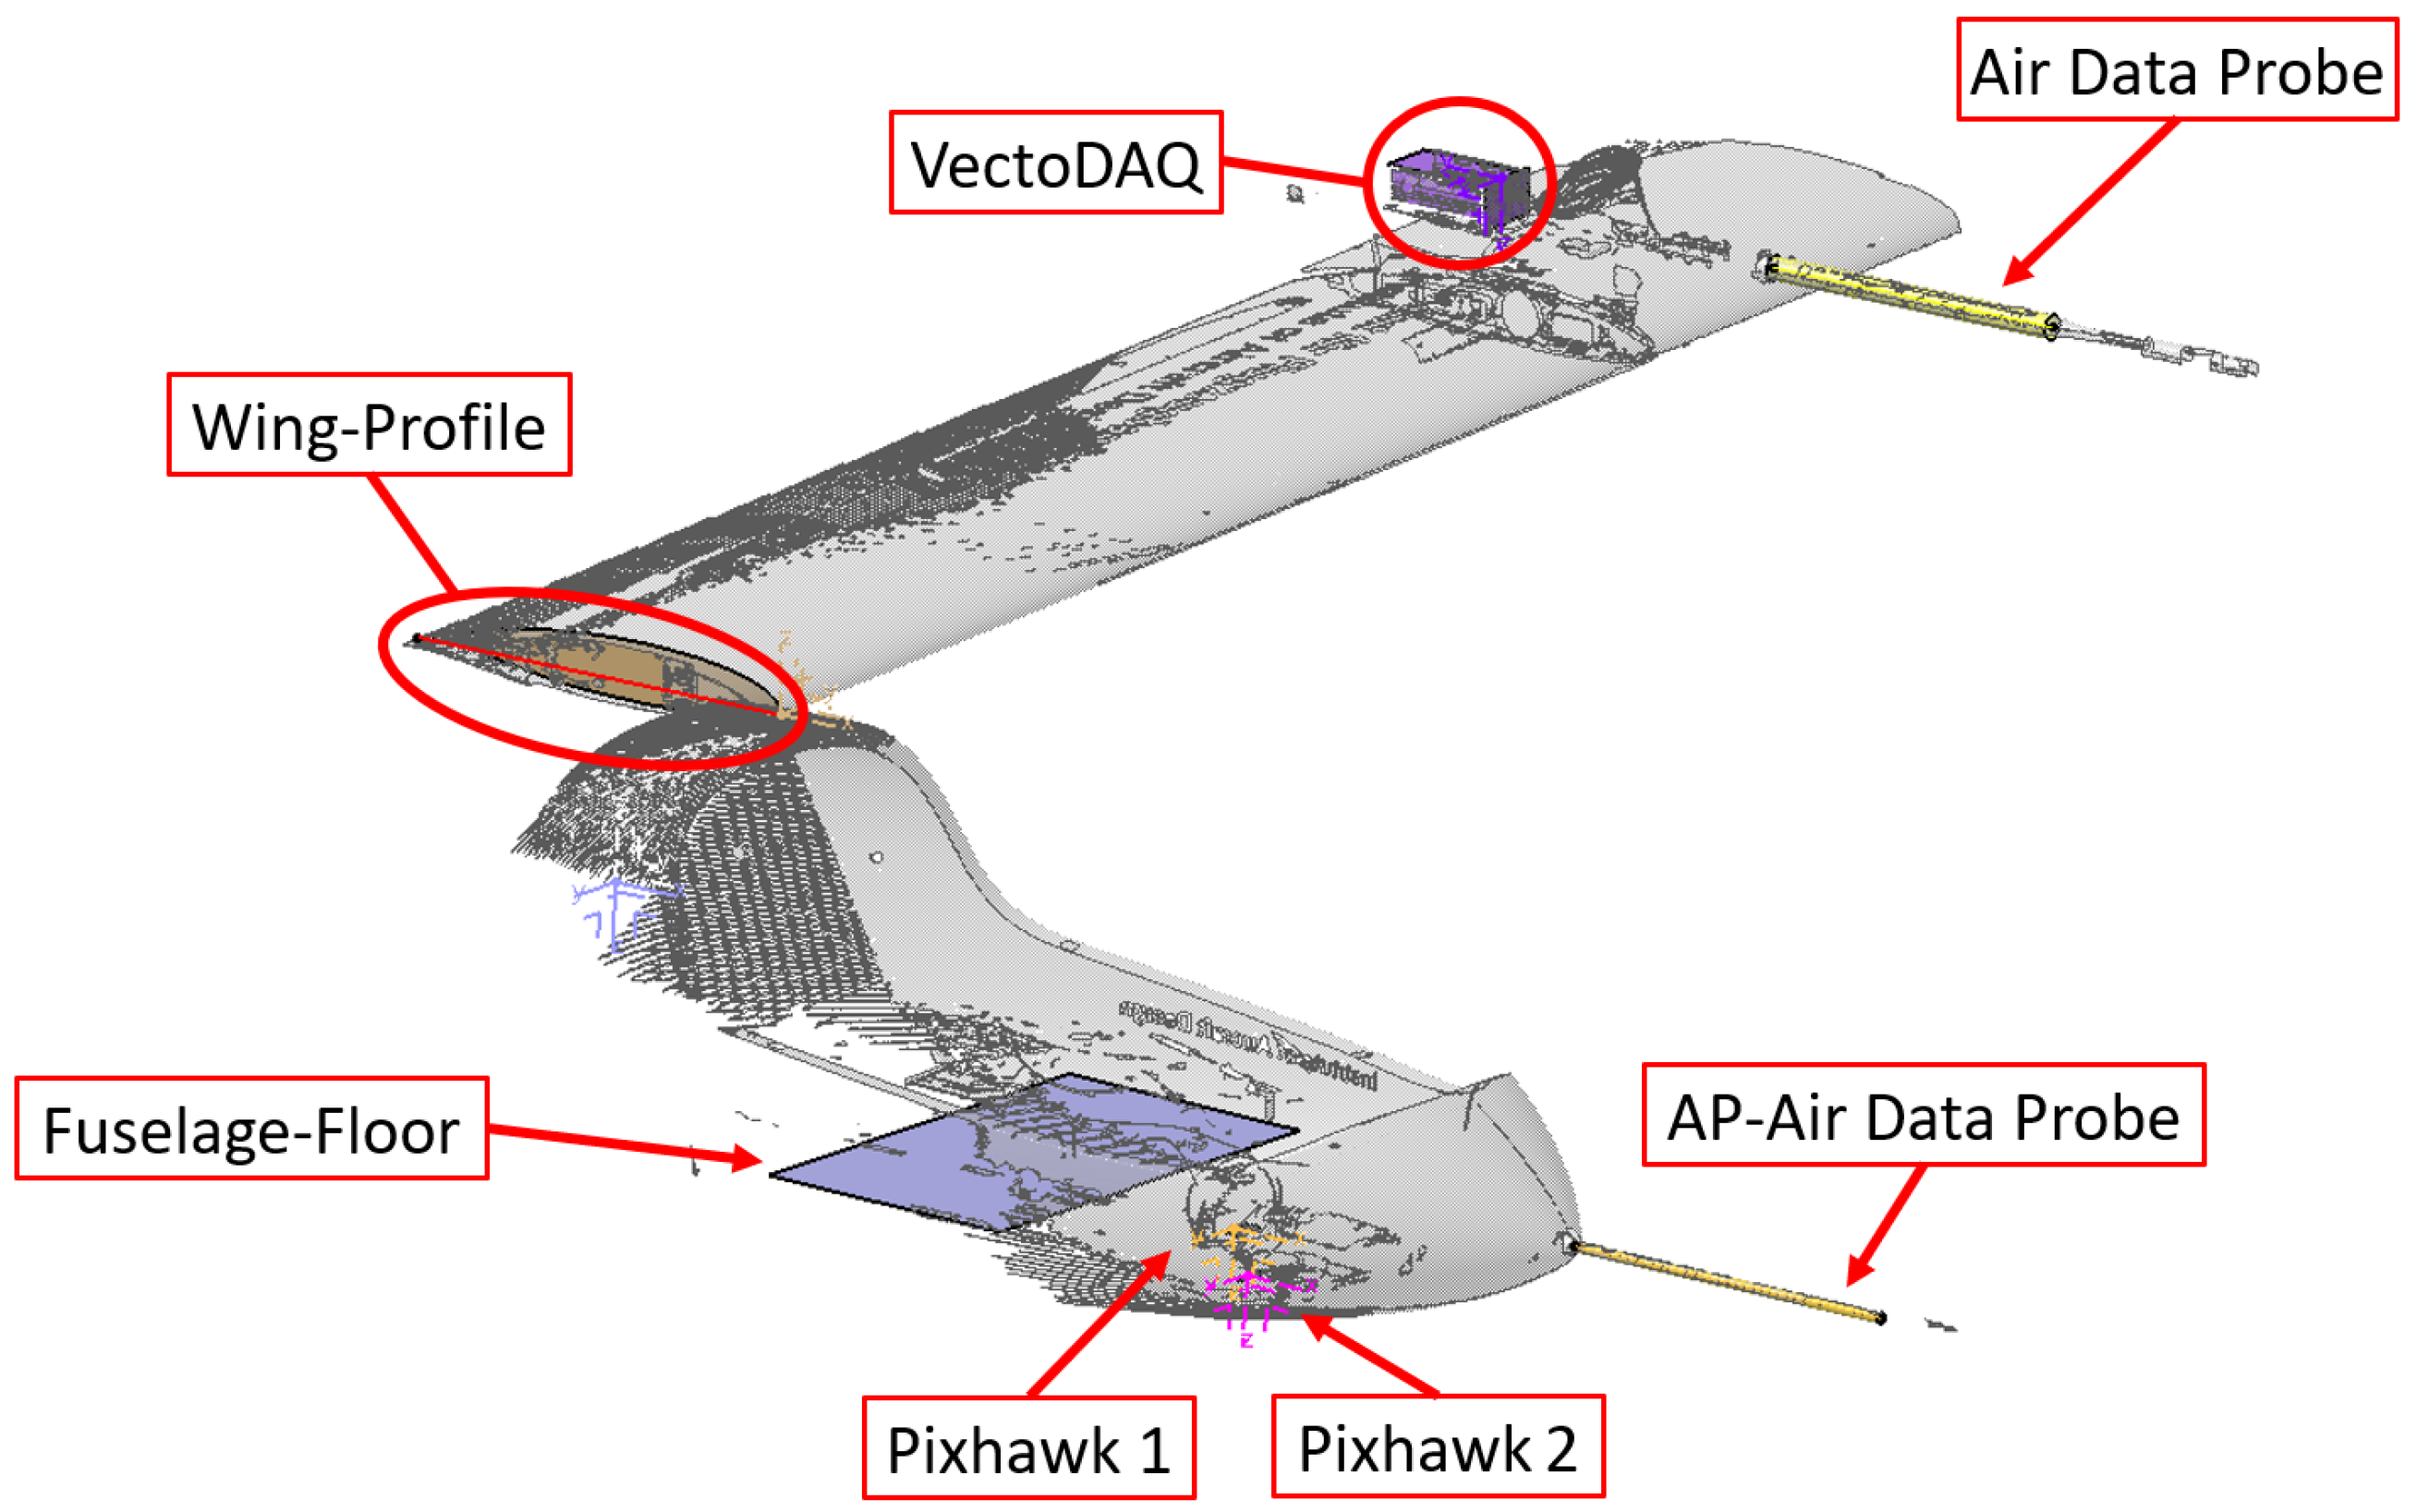
2.3. Installation Onboard the e-Genius-Mod

The MHP and UA are installed on the e-Genius-Mod through a wing adapter, ensuring incident flow to the probes without any interference by the airframe. Initially, an installation inside the nose was considered, as often occurs during test flights of new aircraft. But, since the spot is occupied by the MHP used by the autopilot, the alternative spot was selected.
By taking advantage of the modularity of the e-Genius-Mod, a simple adapter design could be realized [12]. Since the wing is segmented into 8 parts (see Figure 7), an additional rib is placed between the inner and adjacent wing segments. The mounting platform is then placed upon the rib and encased by an aerodynamic cap.
Two adapter concepts were implemented, which will be presented in detail in the next sub-chapters (Section 2.3.1 and Section 2.3.2). The single-adapter concept puts both probes onto the same adapter, enabling the devices to experience similar flow conditions. To rule out any interference between the probes, the installation position is verified using CFD simulations and wind-tunnel tests.
The double-adapter concept consists of two adapters, each holding a single measurement system. The adapters are placed on each side of the wing, ruling out any interference between the individual probes. However, the trade-off is that both probes may experience slightly different flow fields. Therefore, both adapter concepts were realized and will be used during flight tests.

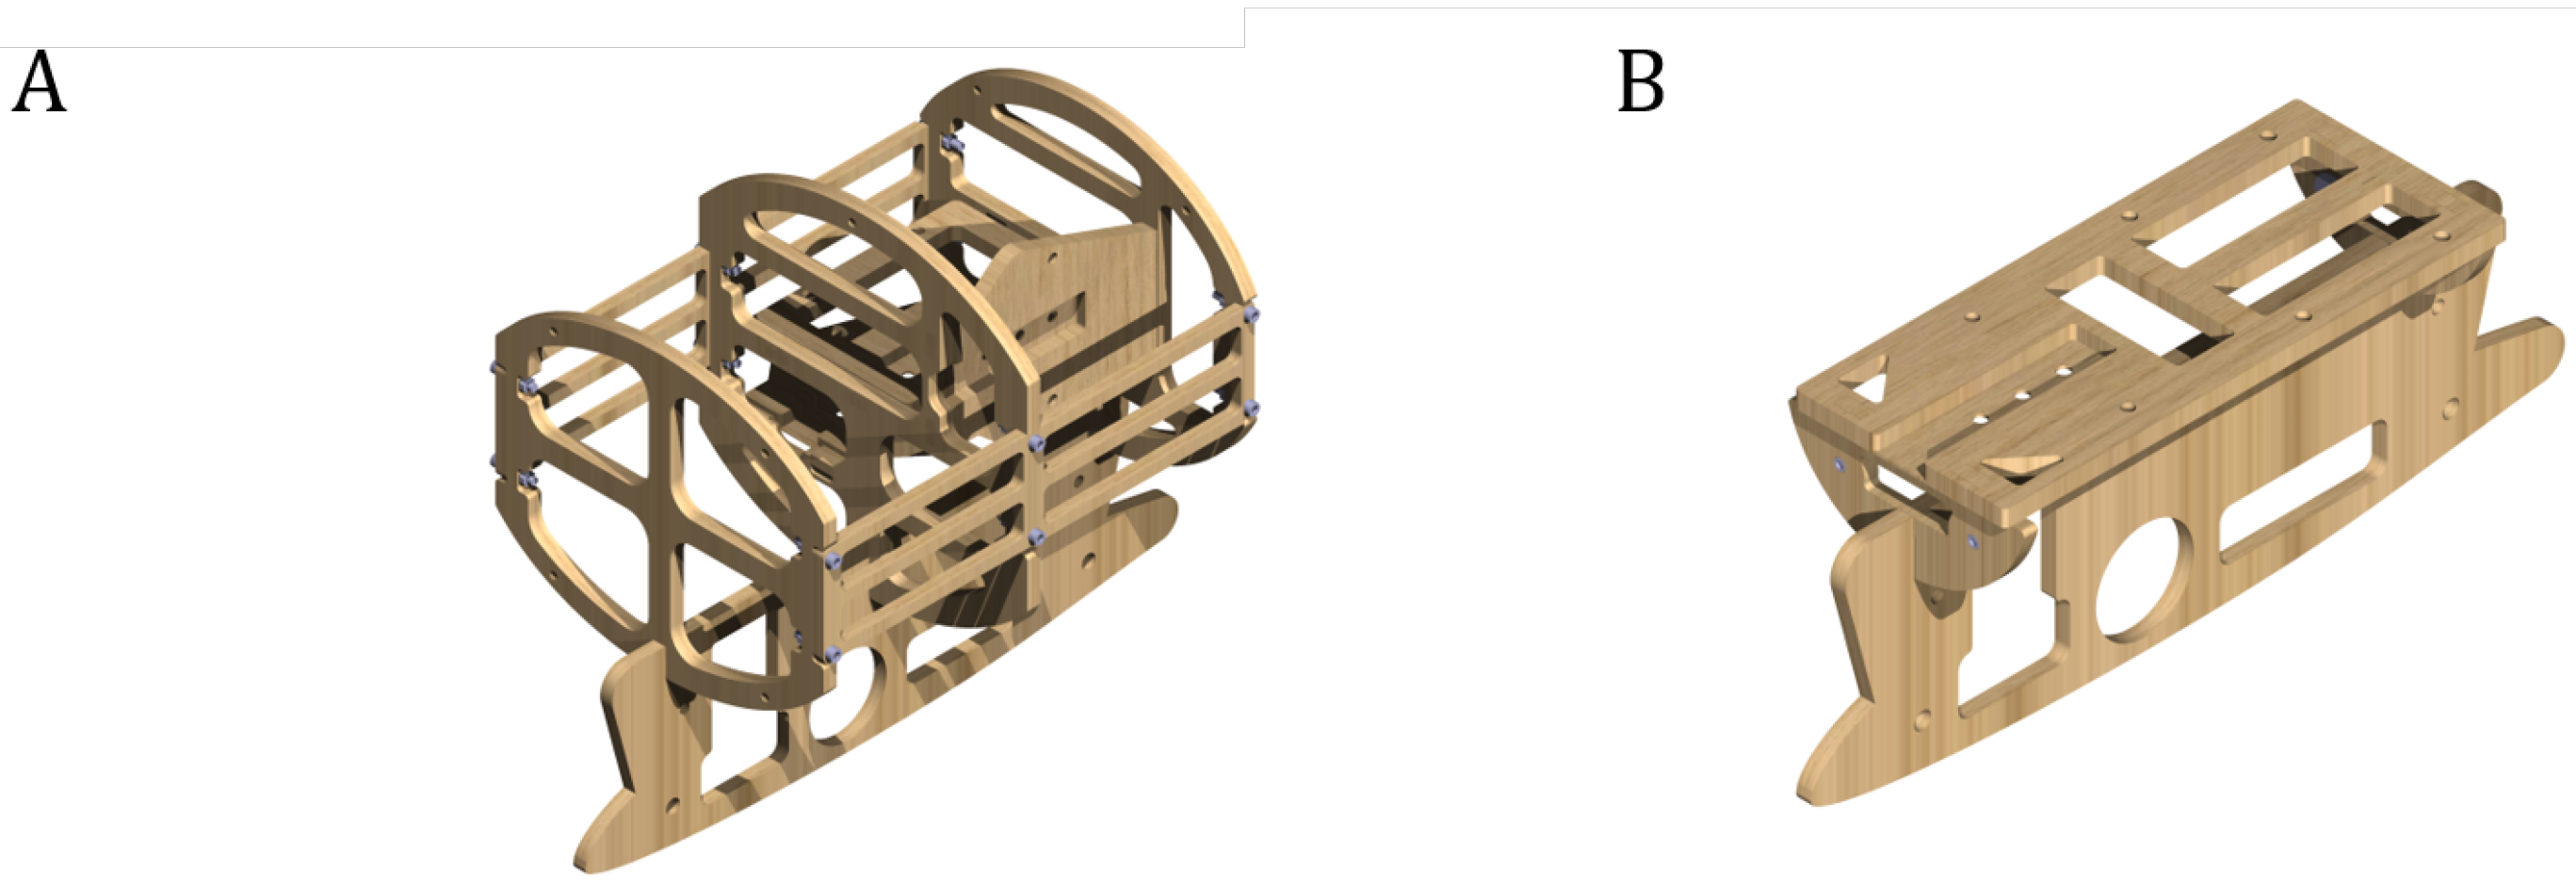
2.3.1. Single-Adapter Concept

The single-adapter concept combines both probes into one single wing adapter. By placing both probes close together, the local flow conditions can be measured twice, improving the comparability of each data set. It is thus critical to chose the right placement of both probes: if the distance between the MHP and UA is too small, flow interference may cause unusable data. In case the distance is too large, the concept of local flow measurements cannot be realized. Additionally, the adapter would probably become too large and thus difficult to realize. Consequently, before conducting any flight tests, the correct probe placement needs to be verified. This was achieved by first running CFD simulations (Section 3.1) and subsequently conducting wind-tunnel tests (Section 3.2).
The probe configuration consists of a rib adapter, an aerodynamic cap consisting of four individual parts, and two probe connectors, in which the probes are attached to the wing adapter. The rib adapter (Figure 8A) is composed of aircraft plywood, the probe connectors consist of steel, and the aerodynamic cap was manufactured by selective laser sintering (SLS). The selected material is PA2201, a polyamid-12 powder suitable for SLS printing. The aerodynamic cap is based on an NACA0028 profile, and its width is expanded to enclose the inner structure. The final probe configuration is displayed in Figure 9.
Inside the aerodynamic cap, both the VectoDAQ and the Nucleo boards for the IMUs are mounted onto the structure on top of the rib adapter. The power and data cables for the measurement systems run through the inside of the wing into the fuselage. The placement of the system on the e-Genius-Mod is shown in Figure 10. The architecture of the power and data system is laid out in Section 2.3.3.

2.3.2. Double-Adapter Concept

The double-adapter concept consists of the rib adapter (see Figure 8B), an aerodynamic cap, and the probe connector. Although the rib adapter and probe connector are identical for both the MHP and UA, the aerodynamic caps differ in size. Both caps are based on an NACA0015 profile, with the UA cap being 600 mm long, while the MHP cap measures 725 mm in length. The difference results from the space needed to integrate the Nucleo boards. Like in the single-adapter concept, the VectoDAQ is also placed within the wing adapter.
Since the data processing of the UA is conducted inside the device, no additional equipment is needed. The data cable runs directly through the wing towards the fuselage of the aircraft. Both concepts are displayed in Figure 11.
The aerodynamic caps are manufactured using additive manufacturing and consist of polyethylene terephthalate glycol (PETG), the adapter rib consists of aircraft plywood, and the probe connectors are composed of steel. Both adapters are placed on each side of the aircraft, as shown in Figure 12. The advantage of this configuration is the free airflow to the probes without any possible interference and the symmetrical arrangement. However, the risk during measurements is that both systems may not experience the same local disturbances.

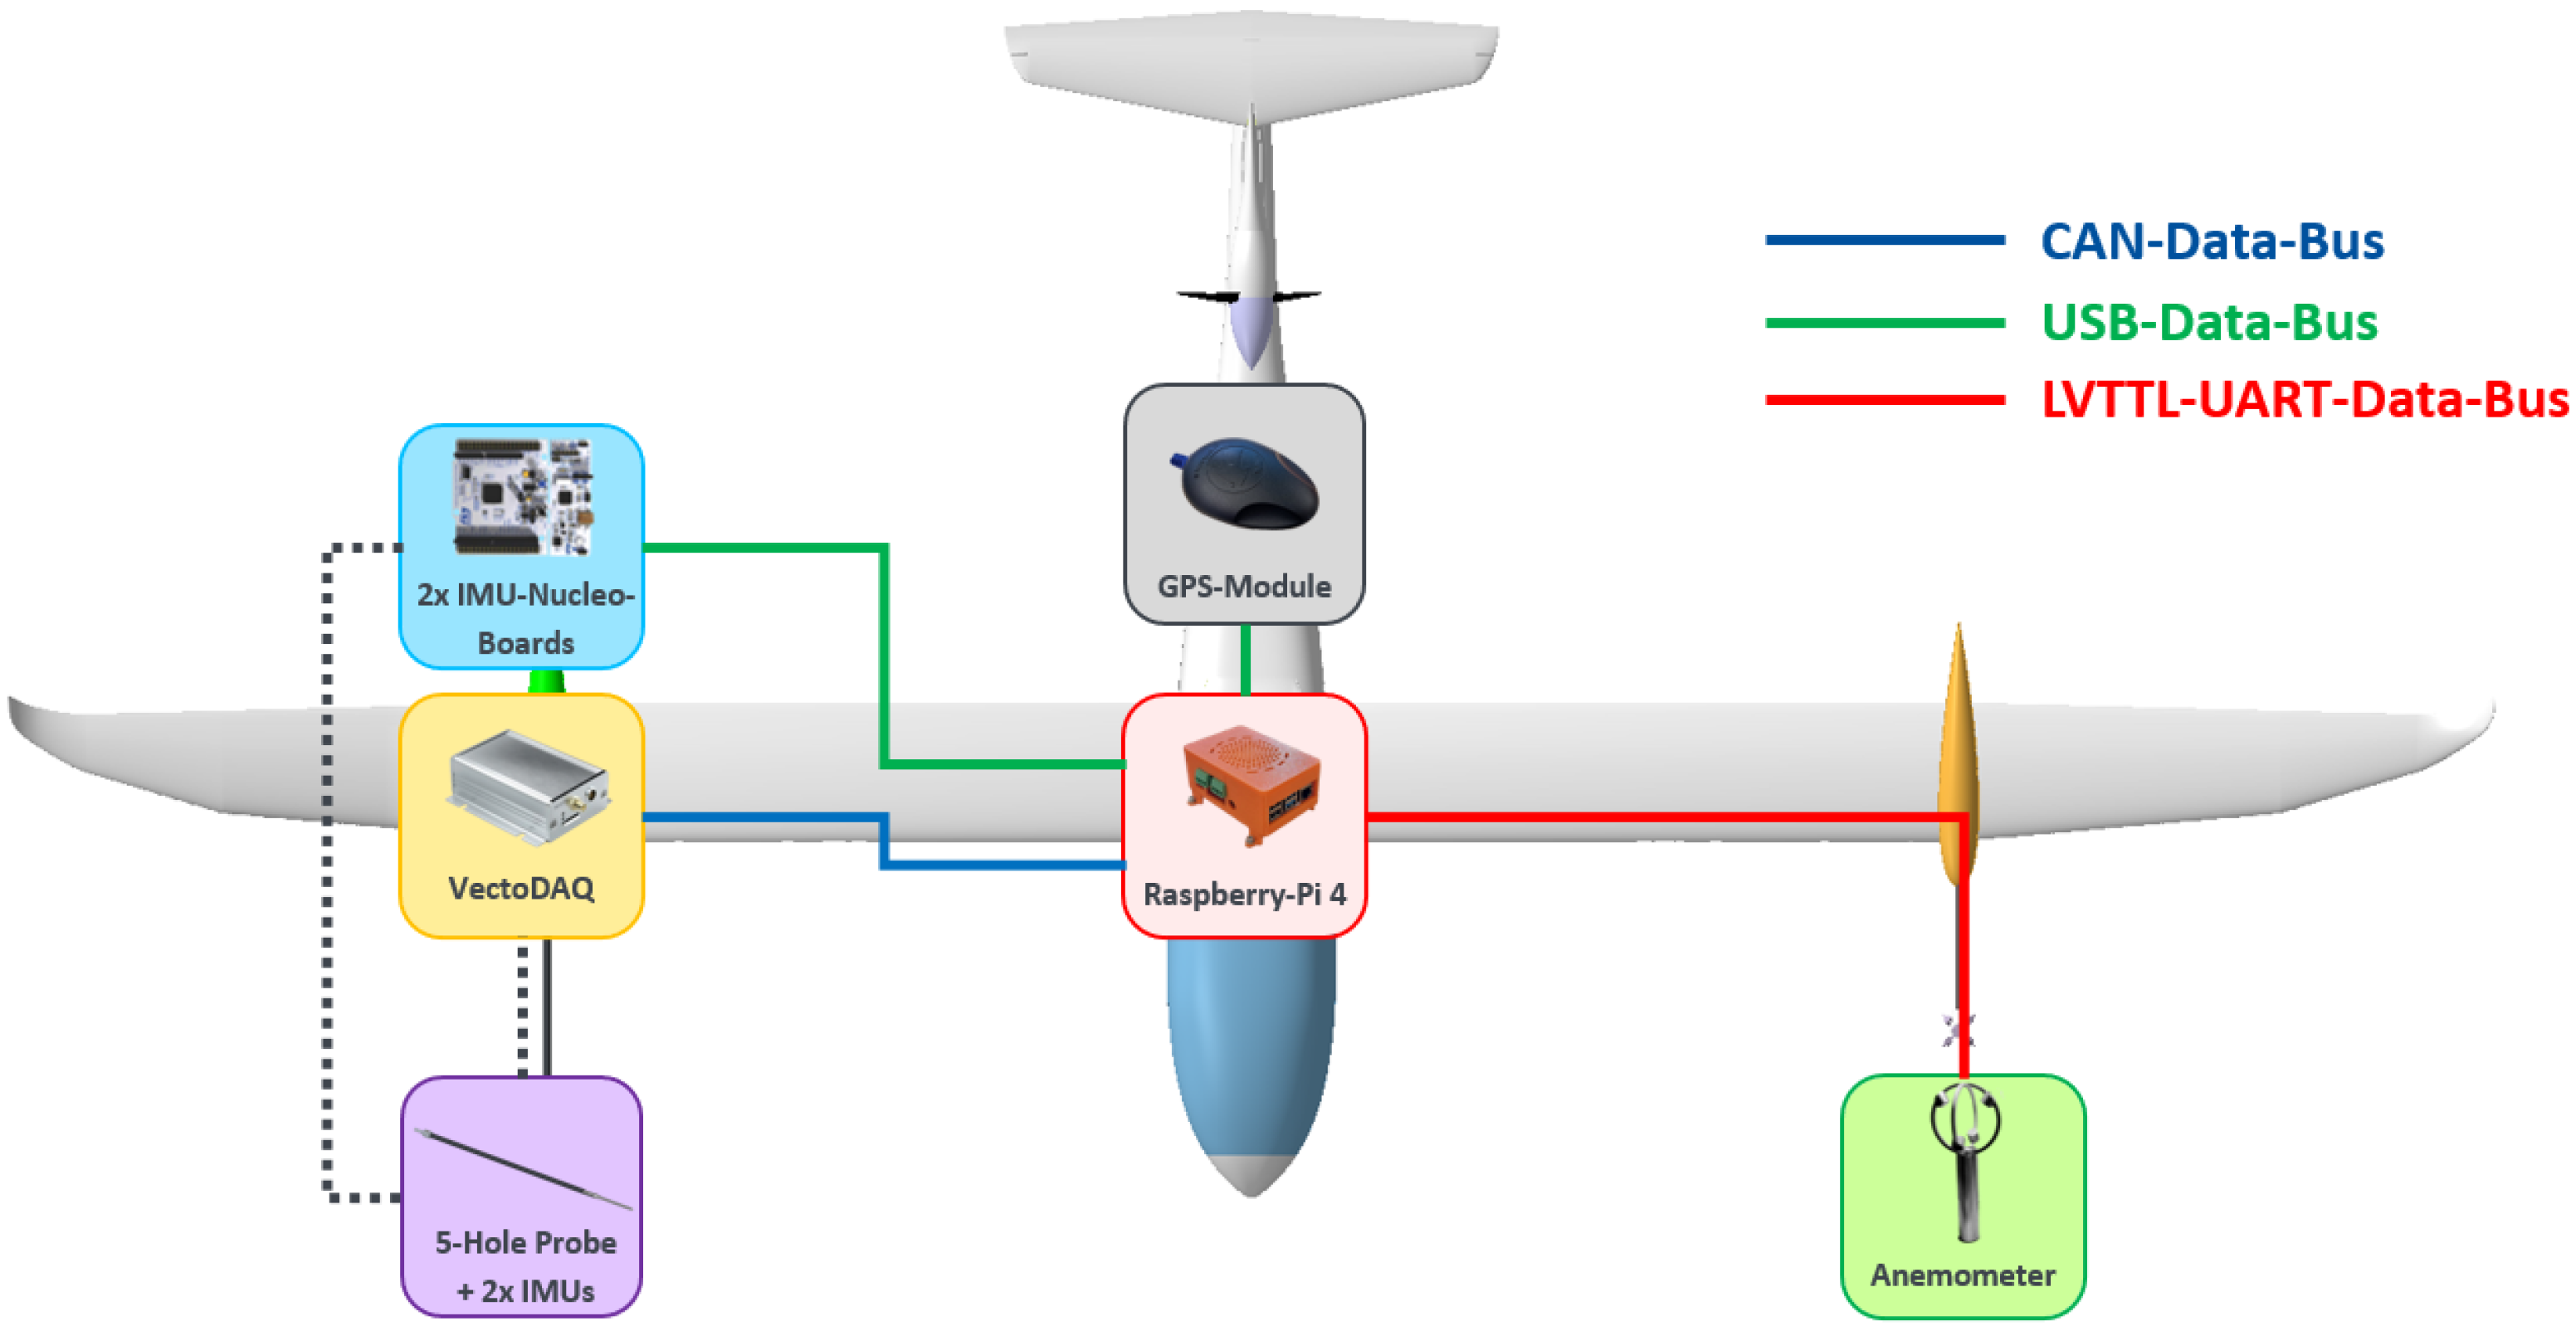
2.3.3. Measurement System Architecture

As described in Section 1, the e-Genius-Mod is equipped as a flying wind tunnel, with numerous measurement devices onboard (see Table 3). All devices are connected to the centralized autopilot, which for the e-Genius-Mod is the centralized board computer, which logs all data on its microSD card. The largest advantage of using one centralized storage device is its simplicity regarding data synchronization. However, the number of ports are limited.
Since the ports on the e-Genius-Mod board computer are mostly already occupied, a new independent logging system was developed on the basis of the developments by Bolle [22]. As data logger, a Raspberry Pi 4B was selected. The Raspberry Pi is a small computer consisting of only one board, with a series of ports and available extensions, which can be easily installed depending on the application. The available communication protocols for the measurement devices are listed below in Table 6. As the Raspberry Pi only features USB ports in its standard configuration, some extensions are needed.
To receive air flow data from the MHP, the data logger was extended with a PiCAN2 DUO SMPS, allowing it to communicate with the VectoDAQ. By utilizing a USB-to-TTL Adapter, the UA is connected via LVTTL-UART. The remaining two devices, both Nucleo boards and the GPS-Module, are linked to the data logger through the integrated USB ports. A schematic picture of the measurement system is displayed in Figure 13 for the double-adapter configuration. The composition for the single adapter is identical, except that the UA and MHP are placed within the same wing adapter.
Unlike the measurement devices, the data logger and GPS-Module are located inside the fuselage of the e-Genius-Mod. This was conducted in order to keep the size of the wing adapters to an absolute minimum to ensure as little aerodynamic drag as possible. All data cables from the measurement devices to the data logger run through the wing, along with the electrical power lines.
Since the measurement system is independent, the data logged on the data logger need to be synchronized with the data collected by the board computer. Without a physical connection between both computers, a common reference time is necessary. As the board computer uses GPS to identify its position and ground speed, the GPS-timestamp is used as reference for the data synchronization [22].

3. System Verification

While the double-adapter concept ensures atmospheric measurements without interference, the single adapter bears the risk of placing both probes without sufficient distance to each other. To rule out possible measurement errors, both CFD simulations and wind-tunnel tests were carried out. The results are presented in the following paragraphs (Section 3.1 and Section 3.2). Finally an optical 3D scan was conducted to quantify the exact installation positions of all probes. The extracted values will be used during post-processing to compensate for possible installation errors.

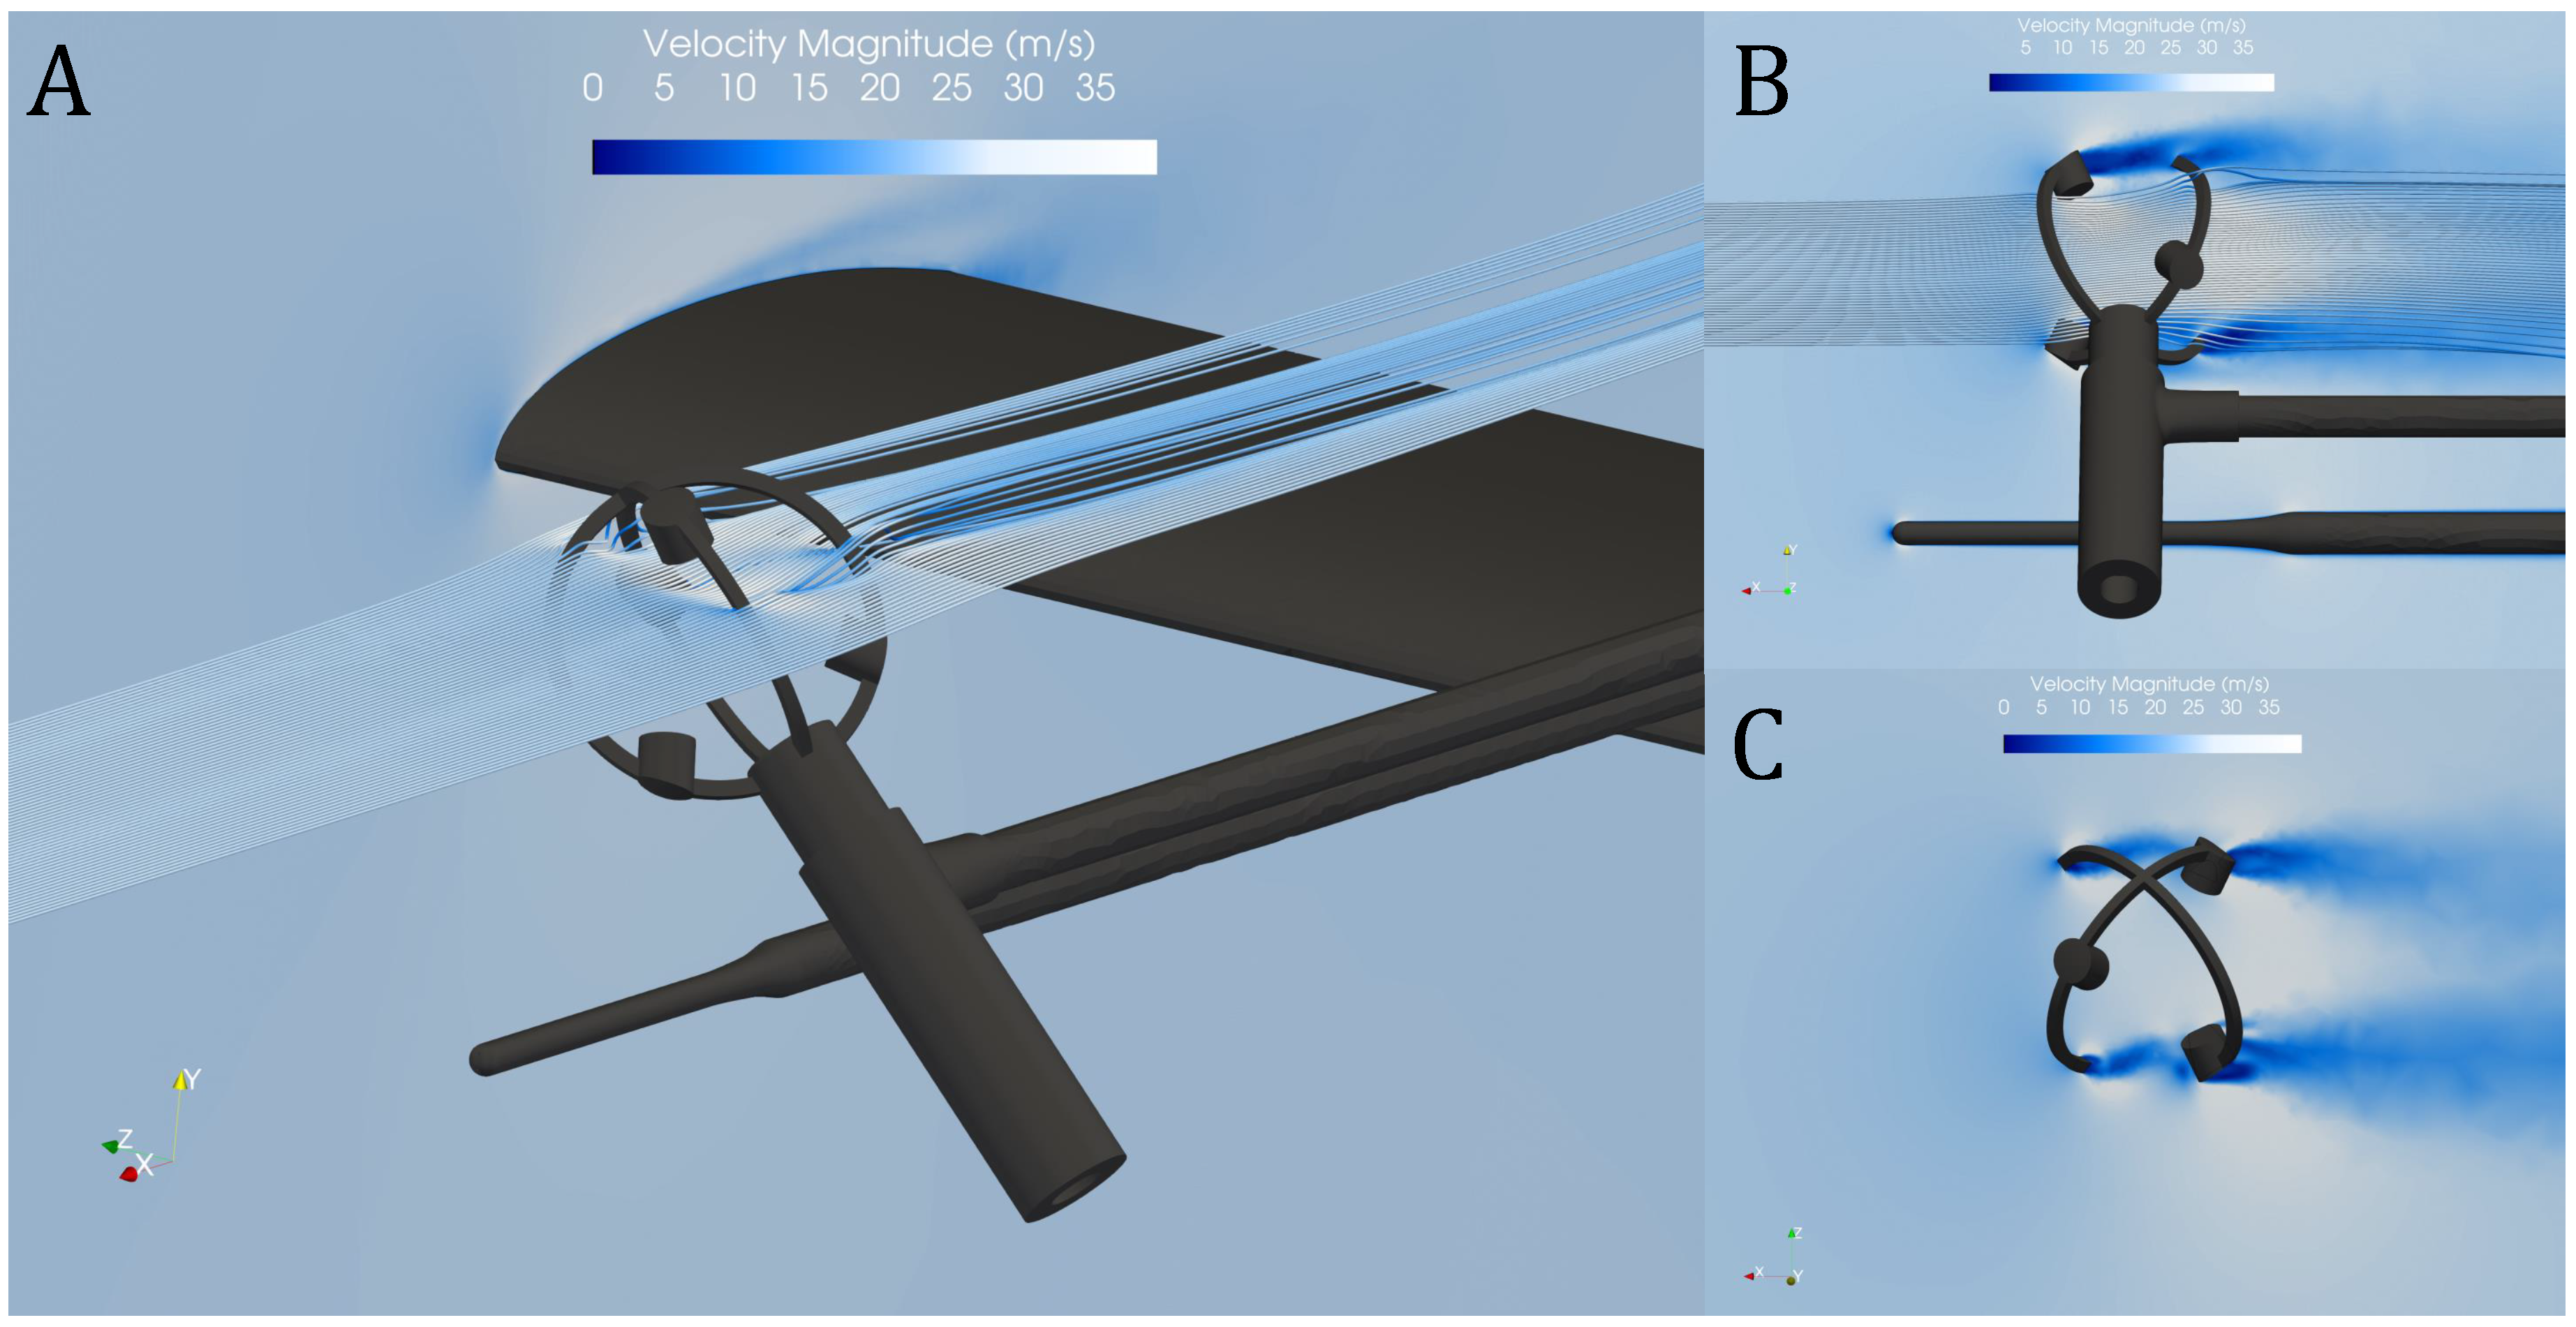
3.1. CFD Simulations

3.1.1. Grid Generation and Setup

To ensure accurate aerodynamic predictions, a computational mesh was generated with a target wall-normal spacing corresponding to y + = 1 , adhering to best practices for near-wall turbulence modeling. The first layer height was set to 2.2116 × 10 5 m , with a total of 20 layers in the boundary region and a growth rate of 1.4 to adequately resolve the boundary layer. The final mesh consisted of 6,819,935 elements seen in Figure 14A, with refinement focused on critical flow regions shown in Figure 14B,C. An unstructured tetrahedral mesh was employed to capture complex geometries and flow features effectively.
The mesh provided a smooth transition from fine boundary layer elements to coarser far-field elements, balancing computational efficiency with solution accuracy. This setup facilitated the resolution of key aerodynamic characteristics and enabled the use of the SST k ω turbulence model for reliable predictions. The simulation was carried out under sea-level conditions, with an inlet flow velocity of 25   m / s . In addition, a grid independence study has been conducted to ensure the accuracy of the results, as shown in Table 7.

3.1.2. Results and Discussion

The results illustrated in Figure 15 show the velocity magnitude contours and streamlines around the MHP, the UA, and the half-wing model. The aerodynamic behavior and flow interactions are highlighted, providing insights into the performance of the integrated sensors. The isometric view in Figure 15A demonstrates smooth streamlines around the UA sensor, indicating minimal disruptions to the flow field. The velocity contours show uniform flow behavior over the wing, with no significant flow separations or turbulence caused by their integration.
In the side view in Figure 15B, the streamlines confirm that the UA is strategically positioned to avoid significant wake interference. The flow remains well-aligned and undisturbed in regions critical for accurate MHP and UA readings, validating the effectiveness of the placement in minimizing aerodynamic impact.
The top view in Figure 15C highlights wake regions downstream of the UA sensor. These wake zones are confined and narrow, with gradual velocity decay downstream, suggesting minimal drag effects introduced by the UA assembly. The smooth alignment of streamlines in this view further emphasizes that the flow around the MHP and UA remains undisturbed, ensuring reliable data acquisition.
Overall, the simulation results validate the aerodynamic integration of the MHP and the UA. The narrow wake regions, smooth flow behavior, and absence of significant disturbances indicate that the design ensures accurate measurements without compromising aerodynamic performance. These findings confirm the suitability of the setup for the intended operational conditions.

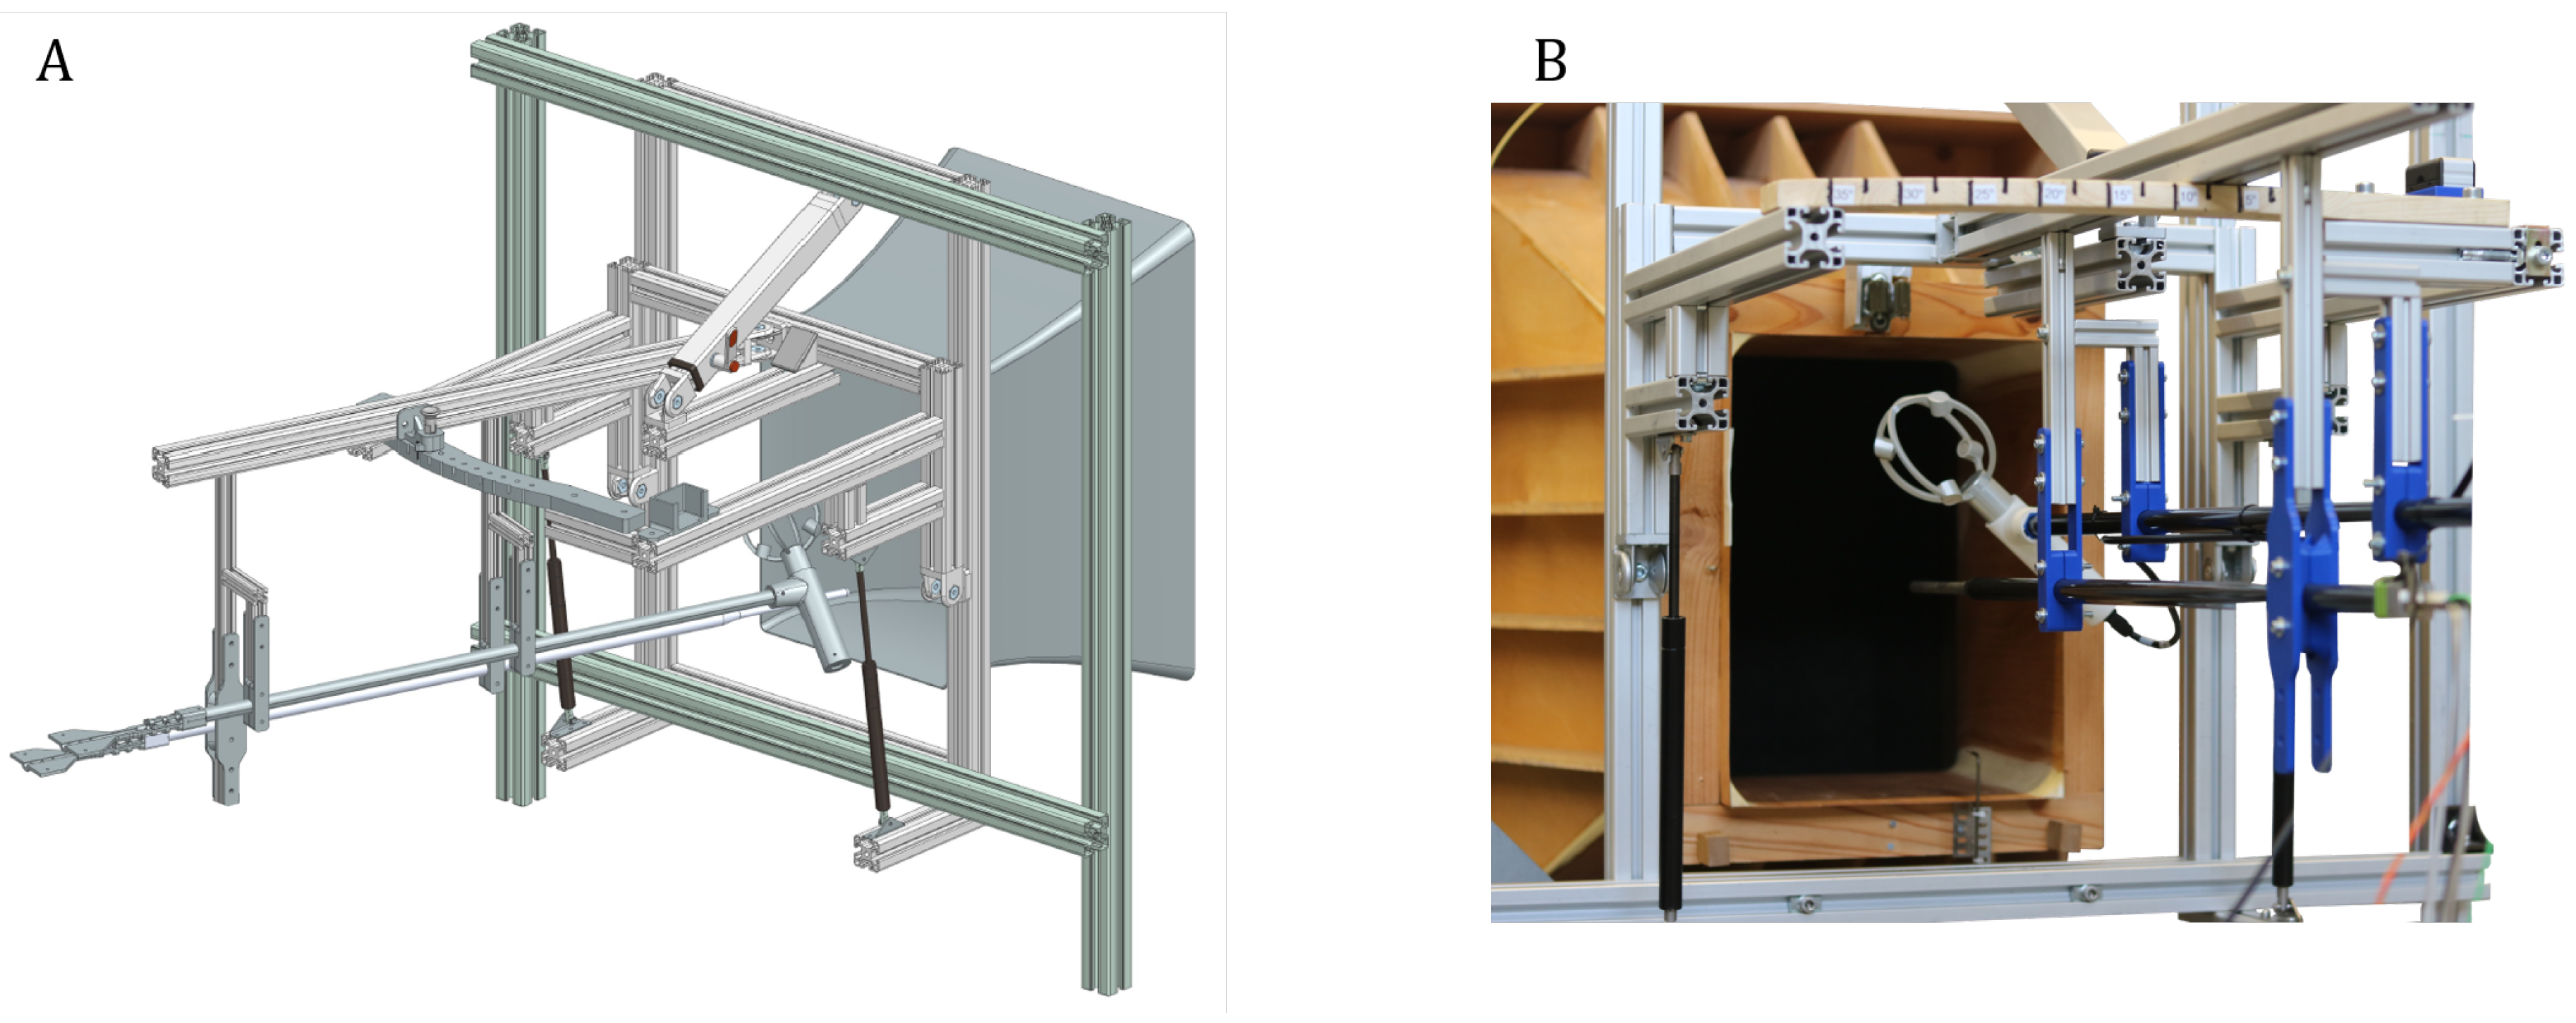
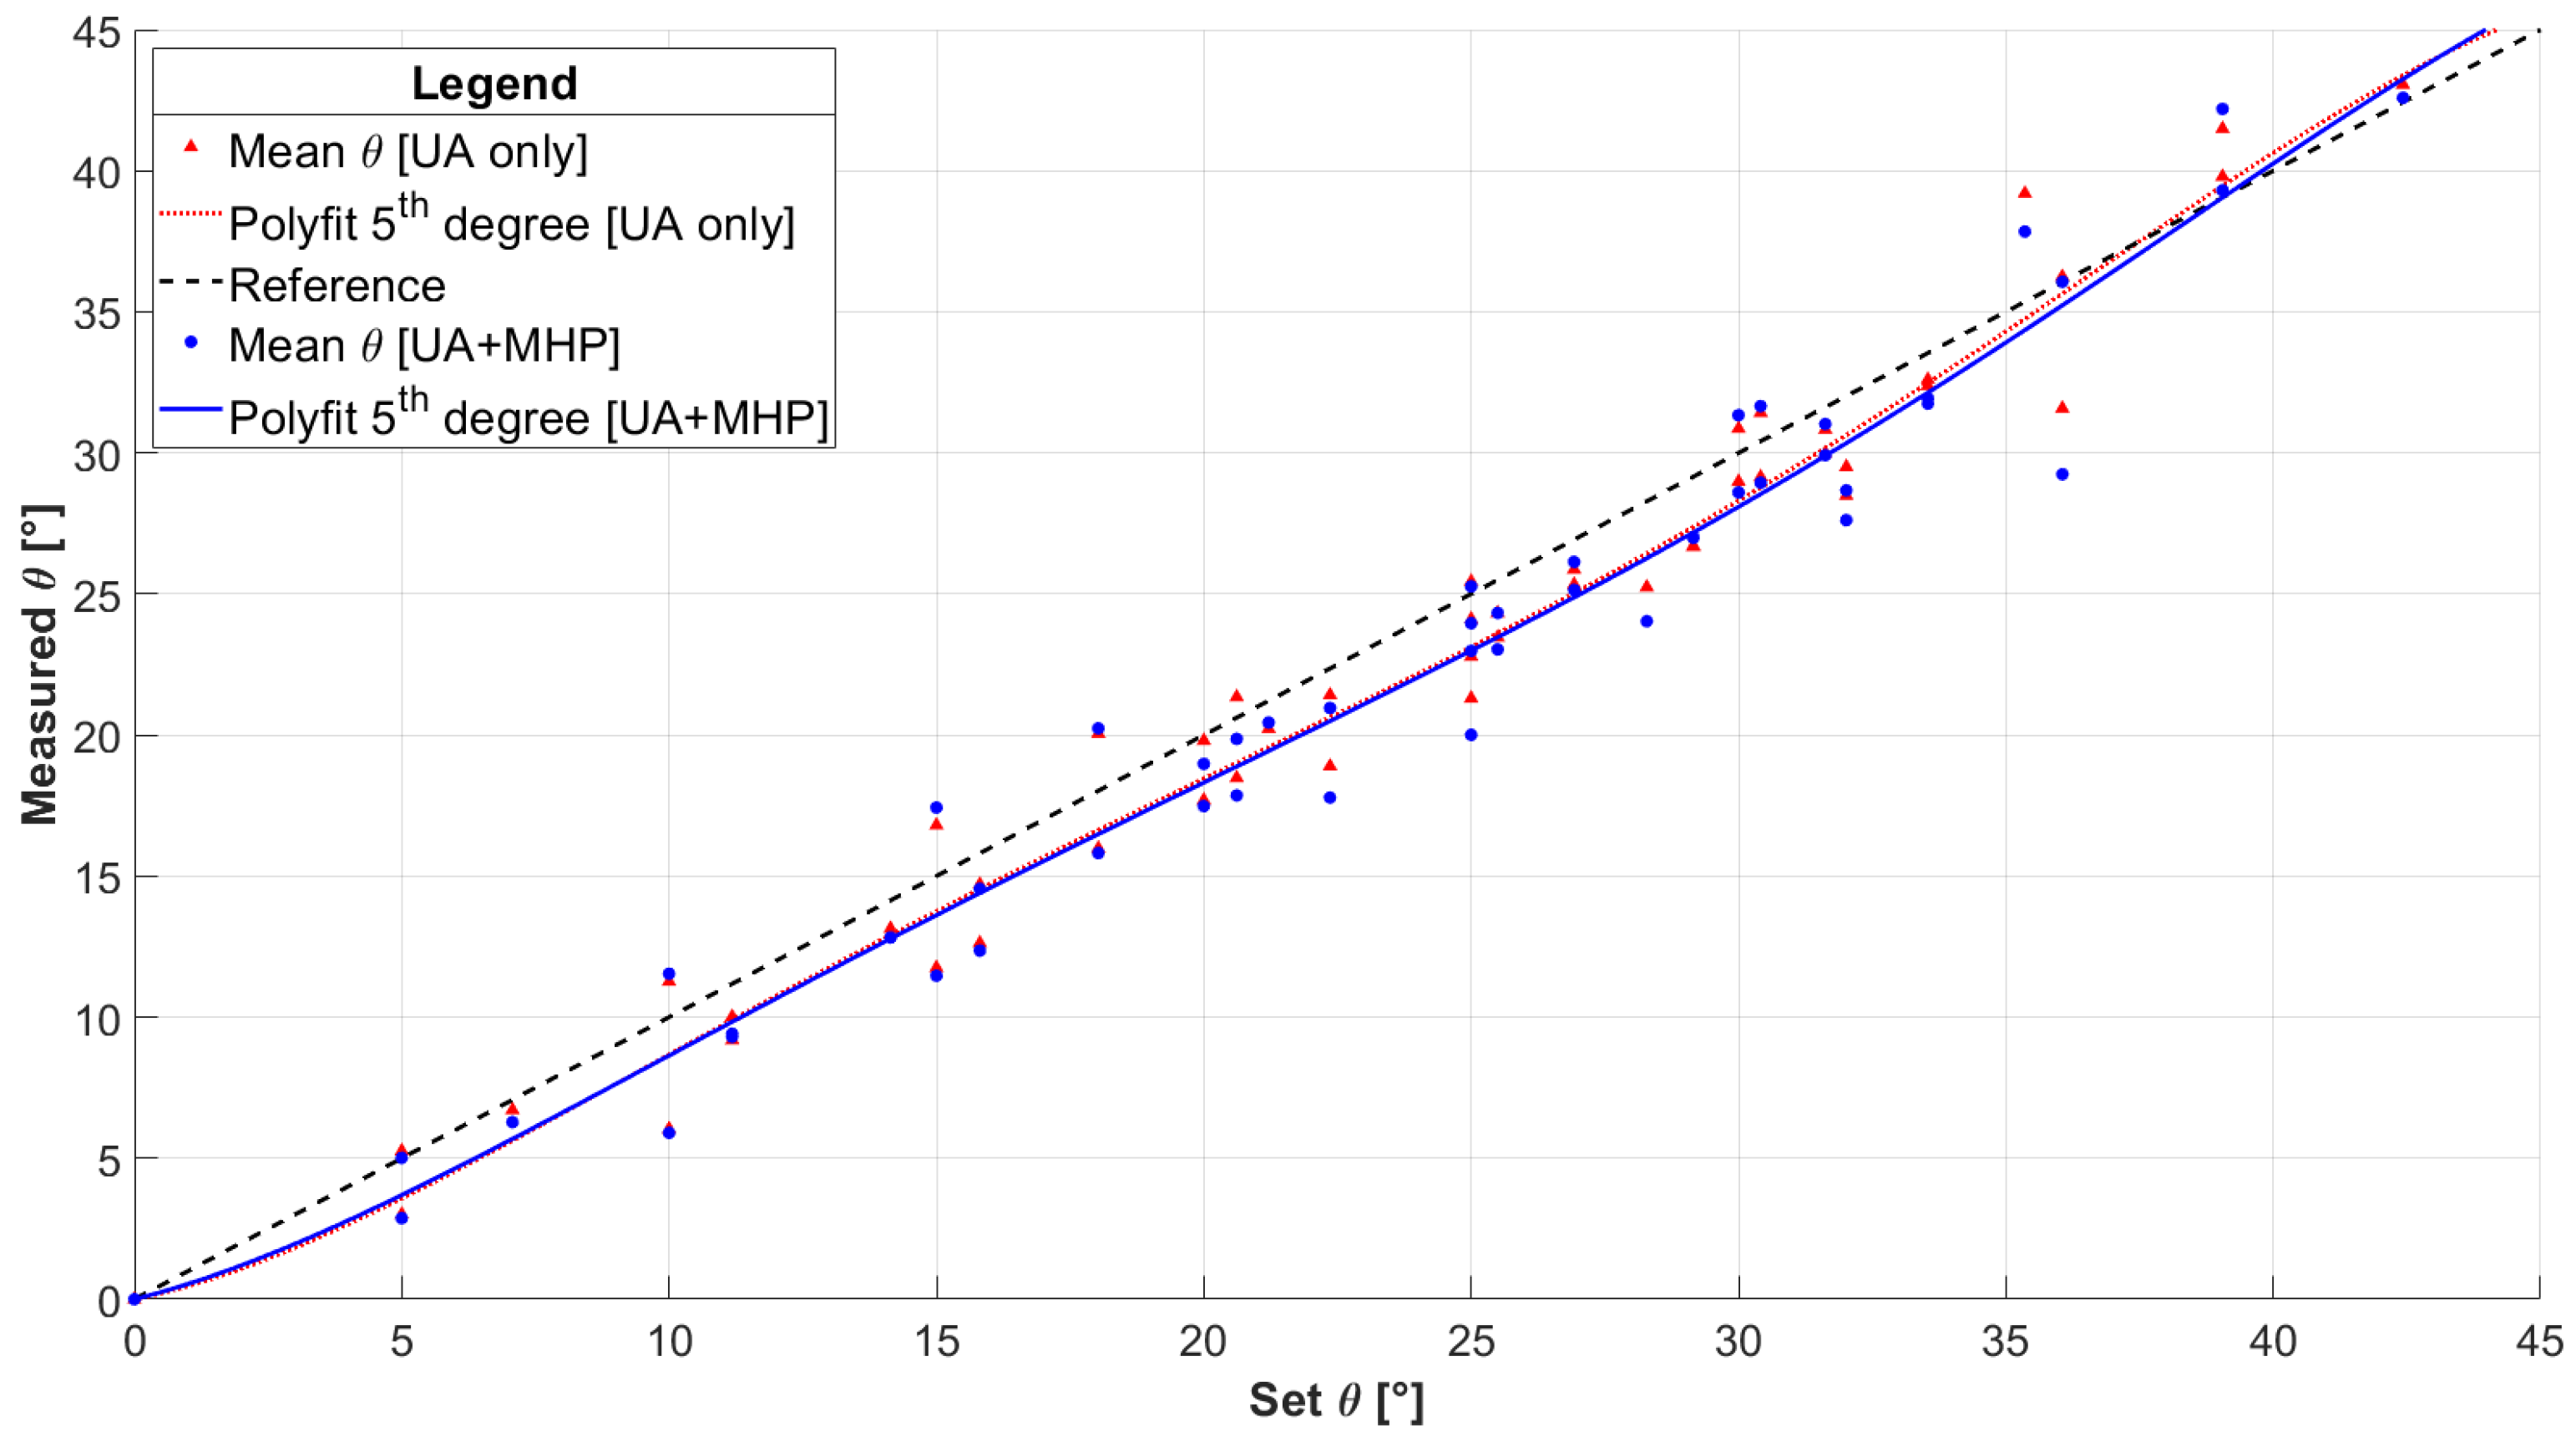
3.2. Wind-Tunnel Tests

Based on the positive CFD simulation results, tests inside a wind tunnel were conducted to rule out mutual interference. The test series was conducted at a free-jet wind tunnel at the Institute of Aerodynamics and Gas Dynamics (IAG) at the University of Stuttgart. To enable the testing of both probes in their designated installation positions, a custom test rig was designed, manufactured, and tested (Figure 16). The design of the test rig makes it possible to rotate the probes around two axes, simulating both the angle of attack and the angle of side-slip [23].
In the process, the position angle θ is defined as
θ = α 2 + β 2 ,
with α representing the angle of attack and β the angle of side-slip. The range of θ during testing varied between θ = 0 ° ( α = 0 ; β = 0 ) and θ = 42.43 ( α = 30 ; β = 30 ). With each angle set by steps of Δ α = Δ β = 5 , this resulted in a total of 49 different positions. The air velocity was set to 15.2   m / s .
The measurements were conducted for three different configurations:
  • Only the MHP;
  • Only the UA;
  • Both MHP and UA.
By comparing the measured angles with the set angles for each of the 49 positions, possible interference between the MHP and UA can be identified.
The comparison of the results from the MHP measurement data is shown in Figure 17. The straight measurement line represents the set angles. The mean values of the measured angles are displayed by single data points. Red points indicate data measured with only the MHP being mounted to the test rig; blue points show data measured by the MHP with both probes positioned next to each other. The respective curves were created using fifth degree polynomial curve fitting to the measurement points.
For small values of θ , both curves remain close to the reference line, showing not only good agreement between each other but also high measurement precision of the MHP. With increasing values for θ , both curves slightly begin to deviate from the reference line before separating at around θ = 30 . Since only small values for θ are expected during the measurement path (see Section 2.1), the results for the MHP not only indicate no signs of interference from the UA but also high precision.
However, for the UA, large measurement errors were observed during wind-tunnel testing. In Figure 18, this is indicated by the deviation of both fitting curves from the reference curve. Based on several follow-up measurements, the errors were found to be reproducible, indicating either a fault within the UA or a constant external interference. A possible indication for the measurement errors was found in the user manual [24]. Because of the UA relying on ultrasonic waves for its measurements, external noise can have an influence on the data set. The manufacturer points out that this is a known problem for some wind tunnels.
In terms of interference between the MHP and UA, the measured data from the UA also do not indicate any interference between the installed probes. This agrees with the CFD simulations (see Section 3.1) regarding the feasibility of the single-adapter concept. It will consequently be used during flight tests in addition to the double-adapter concept.
Because the measurement accuracy of the UA could not be verified during wind-tunnel testing, this needs to be confirmed during flight tests. With the LIDAR system being used as a second reference system, the authors are confident that any inaccuracies can be spotted during flight testing. In addition, the UA was sent to the manufacturer some time after the wind-tunnel tests due to an unrelated technical defect. It has since been repaired and re-calibrated.

3.3. Measurement of Installation Position

Despite great efforts during design and manufacturing, small deviations in the manufactured parts cannot be entirely ruled out. If kept to a minimum, the resulting measurement errors will not have a significant impact during analysis. In order to identify, quantify, and if necessary correct resulting measurement errors, an optical 3D scan was carried out using an optical 3D scanner by Carl Zeiss IQS Deutschland GmbH (Oberkochen, Germany). During the post-processing in CATIA V5, the exact position and orientation of all the relevant components could be extracted (Figure 19). In summary, all the deviations remained small. The orientation error of the MHP, for example, remained below 1° of its intended value. To improve the results during post-processing even further, these values will be used to correct the data, e.g., through a transformation matrix.

4. Discussion

During this study, the possibility of using the e-Genius-Mod as a low-cost technology demonstrator was investigated. As case study, MHPs were installed on the e-Genius-Mod through a customized wing adapter, taking advantage of its modularity. In order to validate its measurement accuracy during free flight and investigate its capability to detect small atmospheric disturbances, an experimental setup consisting of both in-flight and ground-based reference measurement systems was developed. For the in-flight measurement system, a UA was selected regarding ground-based-system LIDAR devices. Due to limited ports on the flight computer, an independent data acquisition system was developed based on a Raspberry Pi.
Two wing adapter concepts were used during the flight campaign, with the probes either placed next to each other for better comparability during post-processing or on each side of the wing. To ensure that no interference occurred between both probes, CFD simulations and wind-tunnel tests were conducted, both confirming the chosen installation position. A problem with the data acquired from the UA was discovered, which is suspected to have been caused by noise created by the wind tunnel. Despite inaccuracies, the UA was retained as a reference system during flight tests as the problem is assumed not to occur during flight and with the LIDAR devices present as a second reference. With the help of an optical 3D scan, the measurement data can be corrected from manufacturing and installation errors during post-processing.

5. Conclusions

The e-Genius-Mod’s utilization range as a flexible platform for technology demonstrations has been extended by exploiting both its modularity and payload capacity. Adding to the existing studies, showcasing both the ability to measure flight characteristics [18] and investigating the impact of new aircraft configurations [17,19] during free flight, the ground-work laid by this paper enables the e-Genius-Mod to both measure atmospheric influences and validate them by using in-flight and ground-based reference measurements.
The following steps include testing and evaluating the methods and systems described during free-flight tests. Based on both the data extracted and the experiences during flight tests, a possible new method for testing, evaluating, and thus advancing the development of new technologies could be derived.

Author Contributions

Conceptualization, E.J.N. and D.P.B.; Data curation, E.J.N.; Formal analysis, E.J.N., S.H. and H.S.; Funding acquisition, D.P.B. and A.S.; Investigation, E.J.N., S.H. and H.S.; Methodology, E.J.N., S.H. and D.P.B.; Project administration, E.J.N., D.P.B. and A.S.; Resources, D.P.B.; Software, E.J.N.; Supervision, D.P.B. and A.S.; Validation, E.J.N., S.H. and H.S.; Visualization, E.J.N., S.H. and H.S.; Writing—original draft, E.J.N. and S.H.; Writing—review and editing, D.P.B. and A.S. All authors have read and agreed to the published version of the manuscript.

Funding

This research was supported by Federal Ministry for Economic Affairs and Energy on the basis of a decision by the German Bundestag. Project: OptiDeV—Optimized Data Acquisition for Measuring Flow Conditions in Flight Tests (20Q2126B).

Data Availability Statement

The raw data supporting the conclusions of this article will be made available by the authors on request.

Acknowledgments

The research activities are conducted in cooperation with Vectoflow GmbH, who kindly provided the two MHPs used within the project. The UA selected for the in-flight reference measurement is owned by the Stuttgart Wind Energy (SWE) chair at the University of Stuttgart and was given to the authors during tests. In addition, the authors thank the Institute of Aerodynamics and Gas Dynamics (IAG) at the University of Stuttgart for the assistance during the wind-tunnel tests.

Conflicts of Interest

The authors declare no conflicts of interest.

Abbreviations

The following abbreviations are used in this manuscript:
ADPAir Data Probe
BWBBlended Wing Body
CADComputer-Aided Design
CANController Area Network
CFDComputational Fluid Dynamics
DEPDistributed Electric Propulsion
EIAElectronic Industries Association
GPSGlobal Positioning System
IAGInstitut für Aerodynamik und Gasdynamik/Institute of Aerodynamics and Gas Dynamics
IEPInnovative Evaluation Platform
IFBInstitut für Flugzeugbau/Institute of Aircraft Design
IMUInertial Measurement Unit
LIDARLight Detection and Ranging
LVTTLLow-Voltage Transistor–Transistor Logic
MHPMulti-Hole Probe
MTOMMaximum Take-Off Mass
NACANational Advisory Committee for Aeronautics
NASANational Aeronautics and Space Administration
PETGPolyethylene Terephthalate Glycol
SFDScaled Flight Demonstrator
SLSSelective Laser Sintering
SWEStuttgart Wind Energy
TASTrue Air Speed
TRLTechnology Readiness Level
UAUltrasonic Anemometer
UARTUniversal Asynchronous Receiver Transmitter
UAVUnmanned Aerial Vehicle
USBUniversal Serial Bus

References

  1. Chambers, J.R. Modeling Flight: The Role of Dynamically Scaled Free-Flight Models in Support of NASA’s Aerospace Programs; NASA: Washington, DC, USA, 2010.
  2. Torenbeek, E. Synthesis of Subsonic Airplane Design: An Introduction to the Preliminary Design of Subsonic General Aviation and Transport Aircraft, with Emphasis on Layout, Aerodynamic Design, Propulsion and Performance, 1st ed.; 8. repr ed.; Kluwer Academic Publ: Dordrecht, The Netherlands, 1982. [Google Scholar]
  3. Raymer, D.P. Aircraft Design: A Conceptual Approach, 5th ed.; AIAA Education Series; AIAA American Institute of Aeronautics and Astronautics: Reston, VA, USA, 2012. [Google Scholar]
  4. Roskam, J. Preliminary Sizing of Airplanes, 4th ed.; Airplane Design/Jan Roskam; DARcorporation: Lawrence, KS, USA, 2005; Volume Part I. [Google Scholar]
  5. Sobron, A.; Lundström, D.; Krus, P. A Review of Current Research in Subscale Flight Testing and Analysis of Its Main Practical Challenges. Aerospace 2021, 8, 74. [Google Scholar] [CrossRef]
  6. Taufik, N.Z.B.; Zaidaan, S.; Mahmoud, E.; Abdallah, A.M.; Manaa, Z.; Abro, G.E.M.; Taib, M.N. Design and Analysis of the Effect of Trimmable Vertical Stabilizers for Enhanced Aircraft Maneuverability and Directional Stability. In Proceedings of the 2024 IEEE 12th Conference on Systems, Process & Control (ICSPC), Malacca, Malaysia, 7 December 2024; IEEE: New York, NY, USA, 2024; pp. 251–256. [Google Scholar] [CrossRef]
  7. Fujii, K. Progress and future prospects of CFD in aerospace—Wind tunnel and beyond. Prog. Aerosp. Sci. 2005, 41, 455–470. [Google Scholar] [CrossRef]
  8. Zhu, W. Models for wind tunnel tests based on additive manufacturing technology. Prog. Aerosp. Sci. 2019, 110, 100541. [Google Scholar] [CrossRef]
  9. Xiang, H.; Li, Y.; Chen, S.; Li, C. A wind tunnel test method on aerodynamic characteristics of moving vehicles under crosswinds. J. Wind Eng. Ind. Aerodyn. 2017, 163, 15–23. [Google Scholar] [CrossRef]
  10. Risch, T.; Cosentino, G.; Regan, C.; Kisska, M.; Princen, N. X-48B Flight-Test Progress Overview. In Proceedings of the 47th AIAA Aerospace Sciences Meeting Including the New Horizons Forum and Aerospace Exposition, Orlando, FL, USA, 5–8 January 2009. [Google Scholar]
  11. Schmollgruber, P.; Toussaint, C.; Lepage, A.; Bremmers, F.; Jentink, H.; Timmermans, L.; Genito, N.; Rispoli, A.; Meissner, D.; Kierbel, D. Validation of scaled flight testing. In Proceedings of the 33rd Congress of the International Council of the Aeronautical Sciences, Stockholm, Sweden, 4–9 September 2022. [Google Scholar]
  12. Bergmann, D.P.; Denzel, J.; Baden, A.; Kugler, L.; Strohmayer, A. Innovative Scaled Test Platform e-Genius-Mod—Scaling Methods and Systems Design. Aerospace 2019, 6, 20. [Google Scholar] [CrossRef]
  13. Kittmann, K. Entwicklung Einer Modularen Messplattform zur Analyse des Potenzials von Freiflugmessungen; University Stuttgart: Stuttgart, Germany, 2013. [Google Scholar] [CrossRef]
  14. Dantsker, O.D.; Mancuso, R.; Ward, B.; Miller, C.; Shea, D.F.; Collins, K. Flight Testing Instrumentation Development and Integration for a Subscale Integrated High Lift Propulsor Testbed. In Proceedings of the AIAA SCITECH 2025 Forum, Orlando, FL, USA, 6–10 January 2025. [Google Scholar]
  15. Trittler, M.; Fichter, W.; Voit-Nitschmann, R.; Schmoldt, R.; Kittmann, K. Preliminary System Identification of the Blended Wing Body Flight Demonstrator VELA 2 from Flight Data. In Proceedings of the AIAA Atmospheric Flight Mechanics Conference and Exhibit, Honolulu, HI, USA, 18–21 August 2008. [Google Scholar] [CrossRef]
  16. Goraj, Z.; Kitmann, K.; Voit-Nitschmann, R.; Szender, M. Design and integration of flexi-bird-a low cost sub-scale research aircraft for safety and environmental issues. In Proceedings of the 27th International Congress of the Aeronautrical Science, Nice, France, 19–24 September 2010. [Google Scholar]
  17. Pfeifle, O.; Notter, S.; Fichter, W.; Paul Bergmann, D.; Denzel, J.; Strohmayer, A. Verifying the Effect of Wingtip Propellers on Drag Through In-Flight Measurements. J. Aircr. 2022, 59, 474–483. [Google Scholar] [CrossRef]
  18. Bergmann, D.; Denzel, J.; Pfeifle, O.; Notter, S.; Fichter, W.; Strohmayer, A. In-flight Lift and Drag Estimation of an Unmanned Propeller-Driven Aircraft. Aerospace 2021, 8, 43. [Google Scholar] [CrossRef]
  19. Pfeifle, O.; Fichter, W.; Bergmann, D.; Denzel, J.; Strohmayer, A.; Schollenberger, M.; Lutz, T. Precision performance measurements of fixed-wing aircraft with wing tip propellers. In Proceedings of the AIAA Aviation 2019 Forum, Dallas, TX, USA, 17–21 June 2019. [Google Scholar] [CrossRef]
  20. Anemoment LLC. TriSonica Mini Wind & Weather Sensor; Anemoment LLC: Longmont, CO, USA, 2022. [Google Scholar]
  21. Anemoment LLC. TriSonica Sphere Wind Flux Sensor; Anemoment LLC: Longmont, CO, USA, 2022. [Google Scholar]
  22. Bolle, S. Design of a Reference Measurement System for In-Flight Validation of an Air Data Probe for Free-Flight Measurements. Bachelor’s Thesis, University of Stuttgart, Stuttgart, Germany, 2023. [Google Scholar]
  23. Streit, H. Design of a Wind Tunnel Test Bed for the Validation of a Free-Flight Measurement System. Bachelor’s Thesis, University of Stuttgart, Stuttgart, Germany, 2024. [Google Scholar]
  24. LI-COR Inc. LI-560 Instruction Manual; LI-COR Inc.: Lincoln, NE, USA, 2024. [Google Scholar]
Figure 1. The VELA2 research aircraft by the University of Stuttgart.
Aerospace 12 00345 g001
Figure 2. Comparison of the (A) e-Genius and (B) e-Genius-Mod.
Aerospace 12 00345 g002
Figure 3. Evolution of the e-Genius-Mod.
Aerospace 12 00345 g003
Figure 4. Planned flight path during the test campaign. The green path marks the measurement path, the red dotted line the turn, and the orange dashed line is used for stabilization. The measurement area of the LIDAR is marked by the purple rectangle [18].
Aerospace 12 00345 g004
Figure 5. Rendering of the Vectoflow GmbH MHP with attached IMUs. The positions of both IMUs are marked by the red circles. The actual IMU at the probe’s tip is enclosed by the carbon tube.
Aerospace 12 00345 g005
Figure 6. Installation assembly of the UA.
Aerospace 12 00345 g006
Figure 7. Segment overview of the e-Genius-Mod [12].
Aerospace 12 00345 g007
Figure 8. Adapter concepts placed upon the additional rip: (A) single adapter, with capacity for both probes; (B) one of the double adapters, only able to hold one probe.
Aerospace 12 00345 g008
Figure 9. Assembly of the wing adapter of the single-adapter concept.
Aerospace 12 00345 g009
Figure 10. e-Genius-Mod configured in the single-adapter configuration.
Aerospace 12 00345 g010
Figure 11. Assembly of the wing adapters of the double-adapter concept. (A) Assembly for the UA; (B) assembly for the 5-hole probe.
Aerospace 12 00345 g011
Figure 12. e-Genius-Mod configured in the double-adapter configuration.
Aerospace 12 00345 g012
Figure 13. e-Genius-Mod measurement system for the double-adapter configuration.
Aerospace 12 00345 g013
Figure 14. Mesh generation for the model. (A) View of the computational domain, highlighting the smooth transition from the refined mesh near the geometry to the coarser far-field mesh. (B) Close-up of the MHP leading edge. (C) Close-up of the the MHP tube, showing fine mesh resolution for boundary layer capture.
Aerospace 12 00345 g014
Figure 15. Velocity magnitude contours and streamlines around the model. (A) Isometric view; (B) side view; (C) top view.
Aerospace 12 00345 g015
Figure 16. Depiction of the wind-tunnel test rig. (A) Illustration of the CAD model [23]; (B) installation positions of both probes.
Aerospace 12 00345 g016
Figure 17. Comparison of set rotation angles with measured rotation angles for the MHP [23].
Aerospace 12 00345 g017
Figure 18. Comparison of set rotation angles with measured rotation angles for the UA [23].
Aerospace 12 00345 g018
Figure 19. Data processing of the e-Genius-Mod 3D scan in CATIA V5.
Aerospace 12 00345 g019
Table 1. Development methods within aviation research and development.
MethodStrengthsLimitationsExamples
Textbook Methods- Simple usability- Few or no unconventional designs available[2,3,4]
- Covers most conventional designs- Analytical approach based on pre-existing aircraft
- Satisfactory results for conventional designs- Mostly for preliminary design stages only
Simulations- Cost-effective- Long computational results for high-fidelity models[6,7]
- High-quality results possible- Validation required
- High number of tests possible- Not all flight conditions replicable
Wind-tunnel testing- Reproducibility- Limited availability[8,9]
- Controlled test environment- High costs
- Well-known method- Limited number of possible flight condition replications
SFD- Cost-effective- Not all components are scalable[10,11,12,13,14]
- Testing in realistic environment- Uncontrolled atmospheric conditions (Limited reproducibility)
- Less risk compared to full-scaled aircraft- Limits in transferability of results
- Quick design changes- Weather dependency
Table 4. List of measurement data collected through the MHP.
UnitVariableDescription
VectoDAQP1–P5Pressure at holes #1–5
PabsAbsolute pressure
TtcTemperature
α Angle of attack
β Sideslip angle
VmagVelocity magnitude
[…][…]
IMU [Bosch BMI323]AccX, AccY, AccZAcceleration in x, y, z direction
by Bosch Sensortec GmbH (Reutlingen, Germany)GyroX, GyroY, GyroZAngular velocity around x, y, z-axis
[…][…]
Table 5. Specifications of the TriSonica™Mini and Sphere.
TriSonica™Mini [20]TriSonica™Sphere [21]
Size9.1 × 9.1 × 5.2   cm 3 10.2 × 10.2 × 24.9   cm 3
Weight 50   g 225   g
Powermax. 12   mW max. 600   mW
Measurement Range0– 50   m / s 0– 50   m / s
Resolution 0.1   m / s 0.01   m / s
Accuracy ± 0.2   m / s (0– 10   m / s ) ± 0.1   m / s (0– 10   m / s )
± 2 % (11– 30   m / s ) ± 1 % (11– 30   m / s )
± 4 % (31– 50   m / s ) ± 2 % (31– 50   m / s )
Wind Direction0– 359 (u/v)0– 359 (u/v)
± 30 (w) ± 60 (w)
AccelerometerNoYes
Data Output Rate1– 40   Hz 1– 100   Hz
Table 6. Available communication protocols of the measurement devices.
DeviceCommunication Protocol
VectoDAQController Area Network (CAN)
Nucleo Board [STM Nucleo-F303RE]CAN
by STMicroelectronics International N.V.Universal Serial Bus (USB)
(Plan-les-Ouates, Switzerland)
TriSonica™SphereElectronic Industries Association (EIA) 232
EIA422
EIA485
LVTTL-UART 1
GPS-Module [NaviLock NL-602U]USB
by Tragant Handels- und Beteiligungs GmbH (Berlin, Germany)
1 Low-Voltage Transistor–Transistor Logic Universal Asynchronous Receiver Transmitter.
Table 7. Grid independence study.
Grid TypeNumber of Cells c l c d
Coarse3,409,9680.10500.00243
Medium6,819,9350.12580.00260
Fine27,279,7400.12800.00264
Disclaimer/Publisher’s Note: The statements, opinions and data contained in all publications are solely those of the individual author(s) and contributor(s) and not of MDPI and/or the editor(s). MDPI and/or the editor(s) disclaim responsibility for any injury to people or property resulting from any ideas, methods, instructions or products referred to in the content.

