Abstract
Hybrid aircraft offer a logical pathway to reducing aviation’s carbon footprint. The thermal management system (TMS) is often neglected in the assessment of hybrid aircraft performance despite it being of major importance. After presenting the TMS architecture, this study performs a sensitivity analysis on several parameters of a retrofitted hybrid fuel cell aircraft’s performance considering three hierarchical levels: the aircraft, fuel cell system, and TMS component levels. The objective is to minimize CO2 emissions while maintaining performance standards. At the aircraft level, cruise speed, fuel cell power, and ISA temperature were varied to assess their impact. Lowering cruise speeds can decrease emissions by up to , and increasing fuel cell power from 200 kW to 400 kW cuts emissions by . Higher ambient air temperatures also significantly impact cooling demands. As for the fuel cell, lowering the stack temperature from 80 °C to 60 °C increases the required cooling air mass flow by and TMS drag by . At the TMS component level, different coolants and HEX offset-fin geometries reveal low-to-moderate effects on emissions and payload. Overall, despite some design choice improvements, the conventional aircraft is still able to achieve lower CO2 emissions per unit payload.
1. Introduction
The aviation industry is a significant contributor to global emissions [1], with conventional aircraft relying on fossil fuels that produce carbon dioxide (), nitrogen oxides (), and other gases. As the demand for more sustainable aviation solutions grows, hybrid-electric and hydrogen-powered aircraft are emerging as promising alternatives, making them a logical focus for such research aiming to reduce the sector’s carbon footprint. Among these technologies, hydrogen fuel cells have gained attention for their ability to provide clean, efficient power with zero emissions. By integrating fuel cell systems with conventional internal combustion engines (ICEs) in a hybrid-electric architecture, the goal is to reduce aircraft fuel consumption and emissions and improve overall efficiency. However, implementing fuel cells in aviation presents several challenges, including system integration and power management. Another challenge in fuel cell-powered aircraft is thermal management, as the stack generates significant heat that must be dissipated efficiently [2,3]. A hydrogen-powered aircraft for a regional case study is studied in [4], mentioning the importance of evaluating the true impact of the thermal management system (TMS) on aircraft performance.
In this study, a liquid cooling TMS is implemented to ensure optimal operating temperatures in a retrofitted hybrid fuel cell aircraft. Similar TMS sizing and integration have been previously considered in [5], with an evaluation of the additional weight, drag, and power consumption associated with the system. This study focuses on conducting a sensitivity analysis to assess how variations in key parameters and assumptions, such as cruise speed and heat exchanger (HEX) geometry, affect aircraft performance and emissions. While prior sensitivity analyses have been conducted in the context of hybrid-electric propulsion, they primarily focus on battery-based systems. For example, Ref. [6] explores sensitivity on parameters such as design range, battery-specific energy, and battery temperature limits, whereas [7] focuses on TMS-specific design parameters such as coolant flow rate and component efficiencies. In contrast, the present study investigates a fuel cell-based hybrid system, offering insights into how thermal management design choices affect the performance of this specific architecture.
Section 2 introduces the case study, detailing the reference aircraft, mission profile, hybridization strategy, and fuel cell system. Section 3 outlines the liquid cooling TMS and describes the sizing methodology used for component modeling and aircraft integration. Section 4 presents the reference study results, providing baseline data for both the hybrid and conventional ICE aircraft. Finally, Section 5 focuses on the sensitivity analysis, evaluating the impact of key assumptions and parameters on aircraft performance and emissions. A synthesis of the presented results is given in Section 6, and perspectives and limitations are presented in Section 7.
2. Case Study
2.1. Reference Aircraft
The Kodiak 900, shown in Figure 1, is a high-performance turboprop aircraft designed for versatility, efficiency, and rugged operations. Manufactured by Daher, it is an upgraded version of the Kodiak 100, featuring enhanced speed, payload capacity, and fuel efficiency. Powered by a Pratt & Whitney PT6A-140A engine, the Kodiak 900 offers improved cruise performance while still maintaining short take-off and landing capabilities, making it well-suited for operations in remote and unimproved airstrips. With a maximum cruise speed of approximately 210 kts and a range exceeding 1100 NM, the aircraft is ideal for cargo transport, humanitarian missions, executive travel, and tourism [8]. This aircraft will serve as the baseline for an effort to retrofit a general aviation aircraft with the fuel cell system. Some of the key aircraft characteristics to be considered for retrofit include the maximum take-off mass (MTOM) and operating empty mass (OEM), geometry/space allocation, and conventional jet fuel consumption. This information is provided in Appendix A.
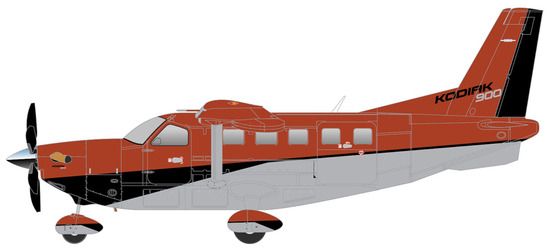
Figure 1.
Kodiak 900 aircraft [8].
2.2. Mission and Hybridization
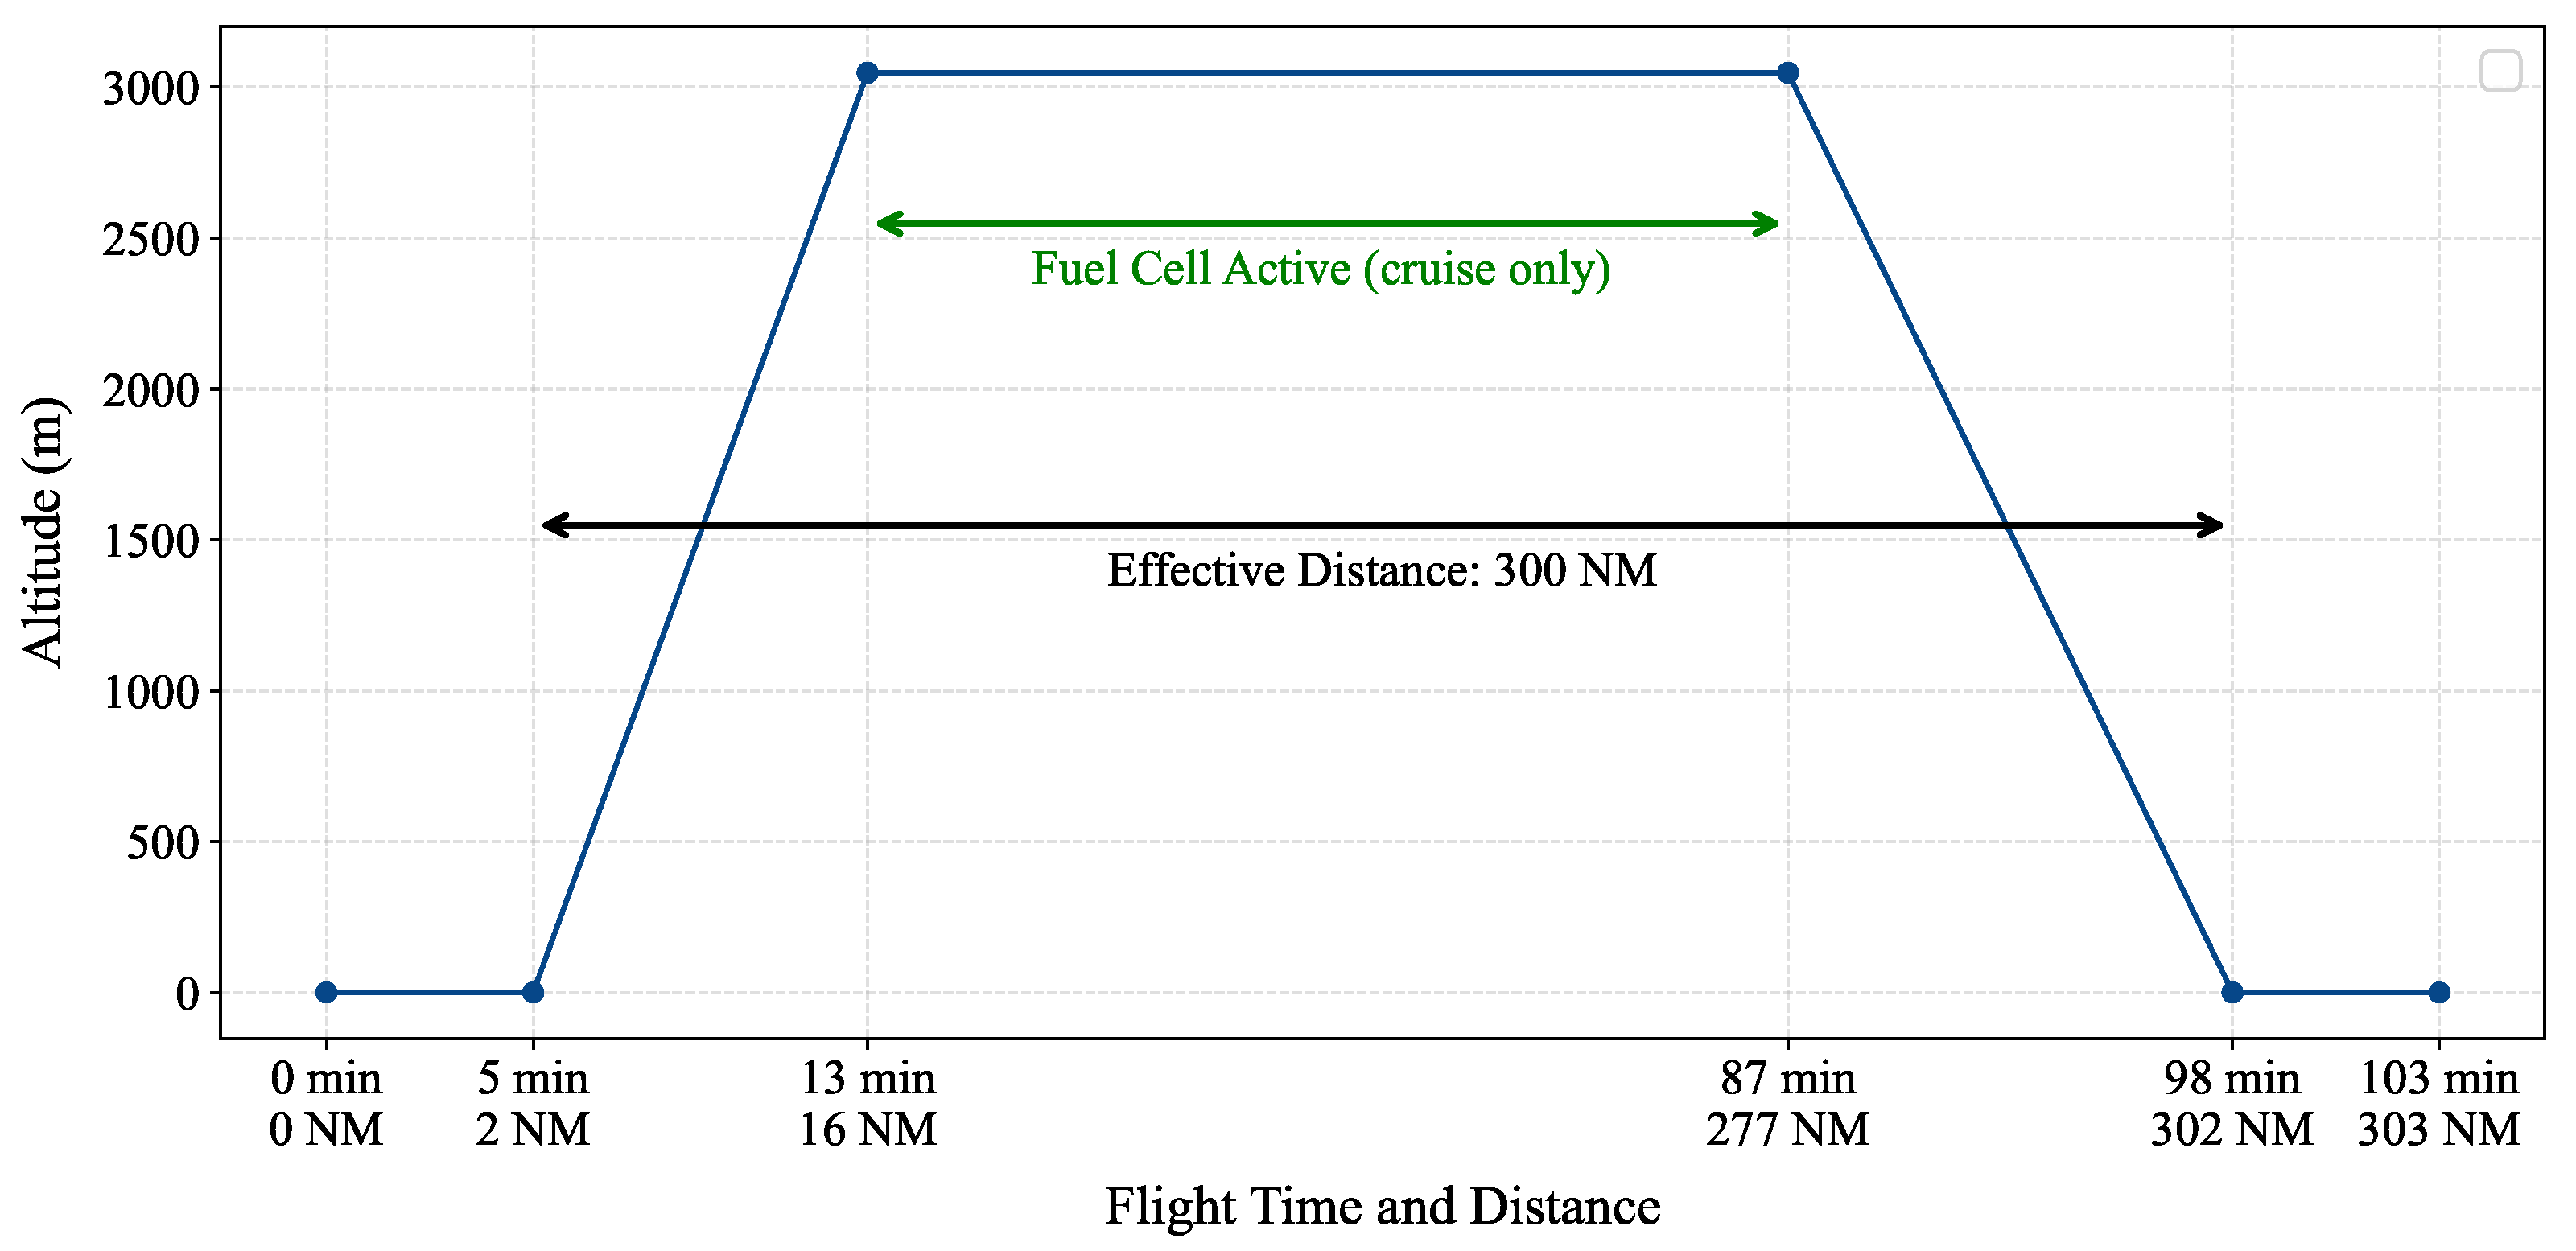
Figure 2 is representative of a short-haul mission, as was considered in this study. The primary mission range, excluding reserve and taxi, is set to 300 NM, reflecting a typical flight distance for departures from small- and medium-sized airports within Europe [9]. A 45 min reserve of fuel in the cruise phase is also considered, thus representing a little under h of flight at maximum cruise speed. Table 1 summarizes the sought-out climb and descent rates used to generate the flight profile, as well as other required characteristics. Furthermore, the fuel cell is assumed to operate exclusively during the cruise phase, providing power only once the aircraft has reached its cruising altitude. A parallel hybrid configuration is considered for the fuel cell/ICE powertrain. In the initial study, the fuel cell is assumed to have a gross output power of 200 kW. However, power losses from the fuel cell balance of plant components and other system inefficiencies result in a lower net power available to the propeller.
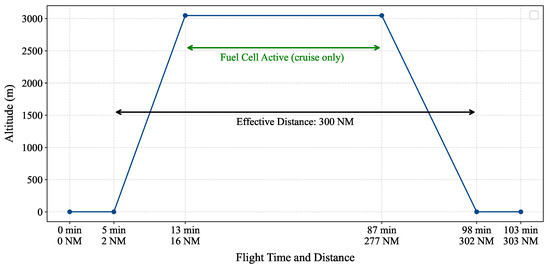
Figure 2.
Flight profile considered for the Kodiak 900. Non-linear time and distance axis.

Table 1.
Summary of taxi, climb, and descent parameters used to determine flight profile.
2.3. Fuel Cell
A low-temperature polymer electrolyte exchange membrane fuel cell (LT-PEMFC) is considered to operate at a stack temperature of 80 °C and pressure of 2 bar. The required air and hydrogen flow supplies can be calculated from derivations provided in [2]. Additional operating conditions are provided in Table A1 in Appendix B. The fuel cell is assumed to operate with an efficiency of , meaning that of the input energy is converted into useful power output. The remaining is lost as waste heat, of which must be managed by the TMS to ensure optimal performance and prevent overheating [10]. For the 200 kW fuel cell, this represents 140 kW of heat to dissipate. A liquid cooling TMS is assumed for the fuel cell cooling and is described below. The hydrogen supply is assumed to be stored cryogenically in liquid form.
3. Thermal Management System
3.1. Liquid Cooling Thermal Management System Architecture
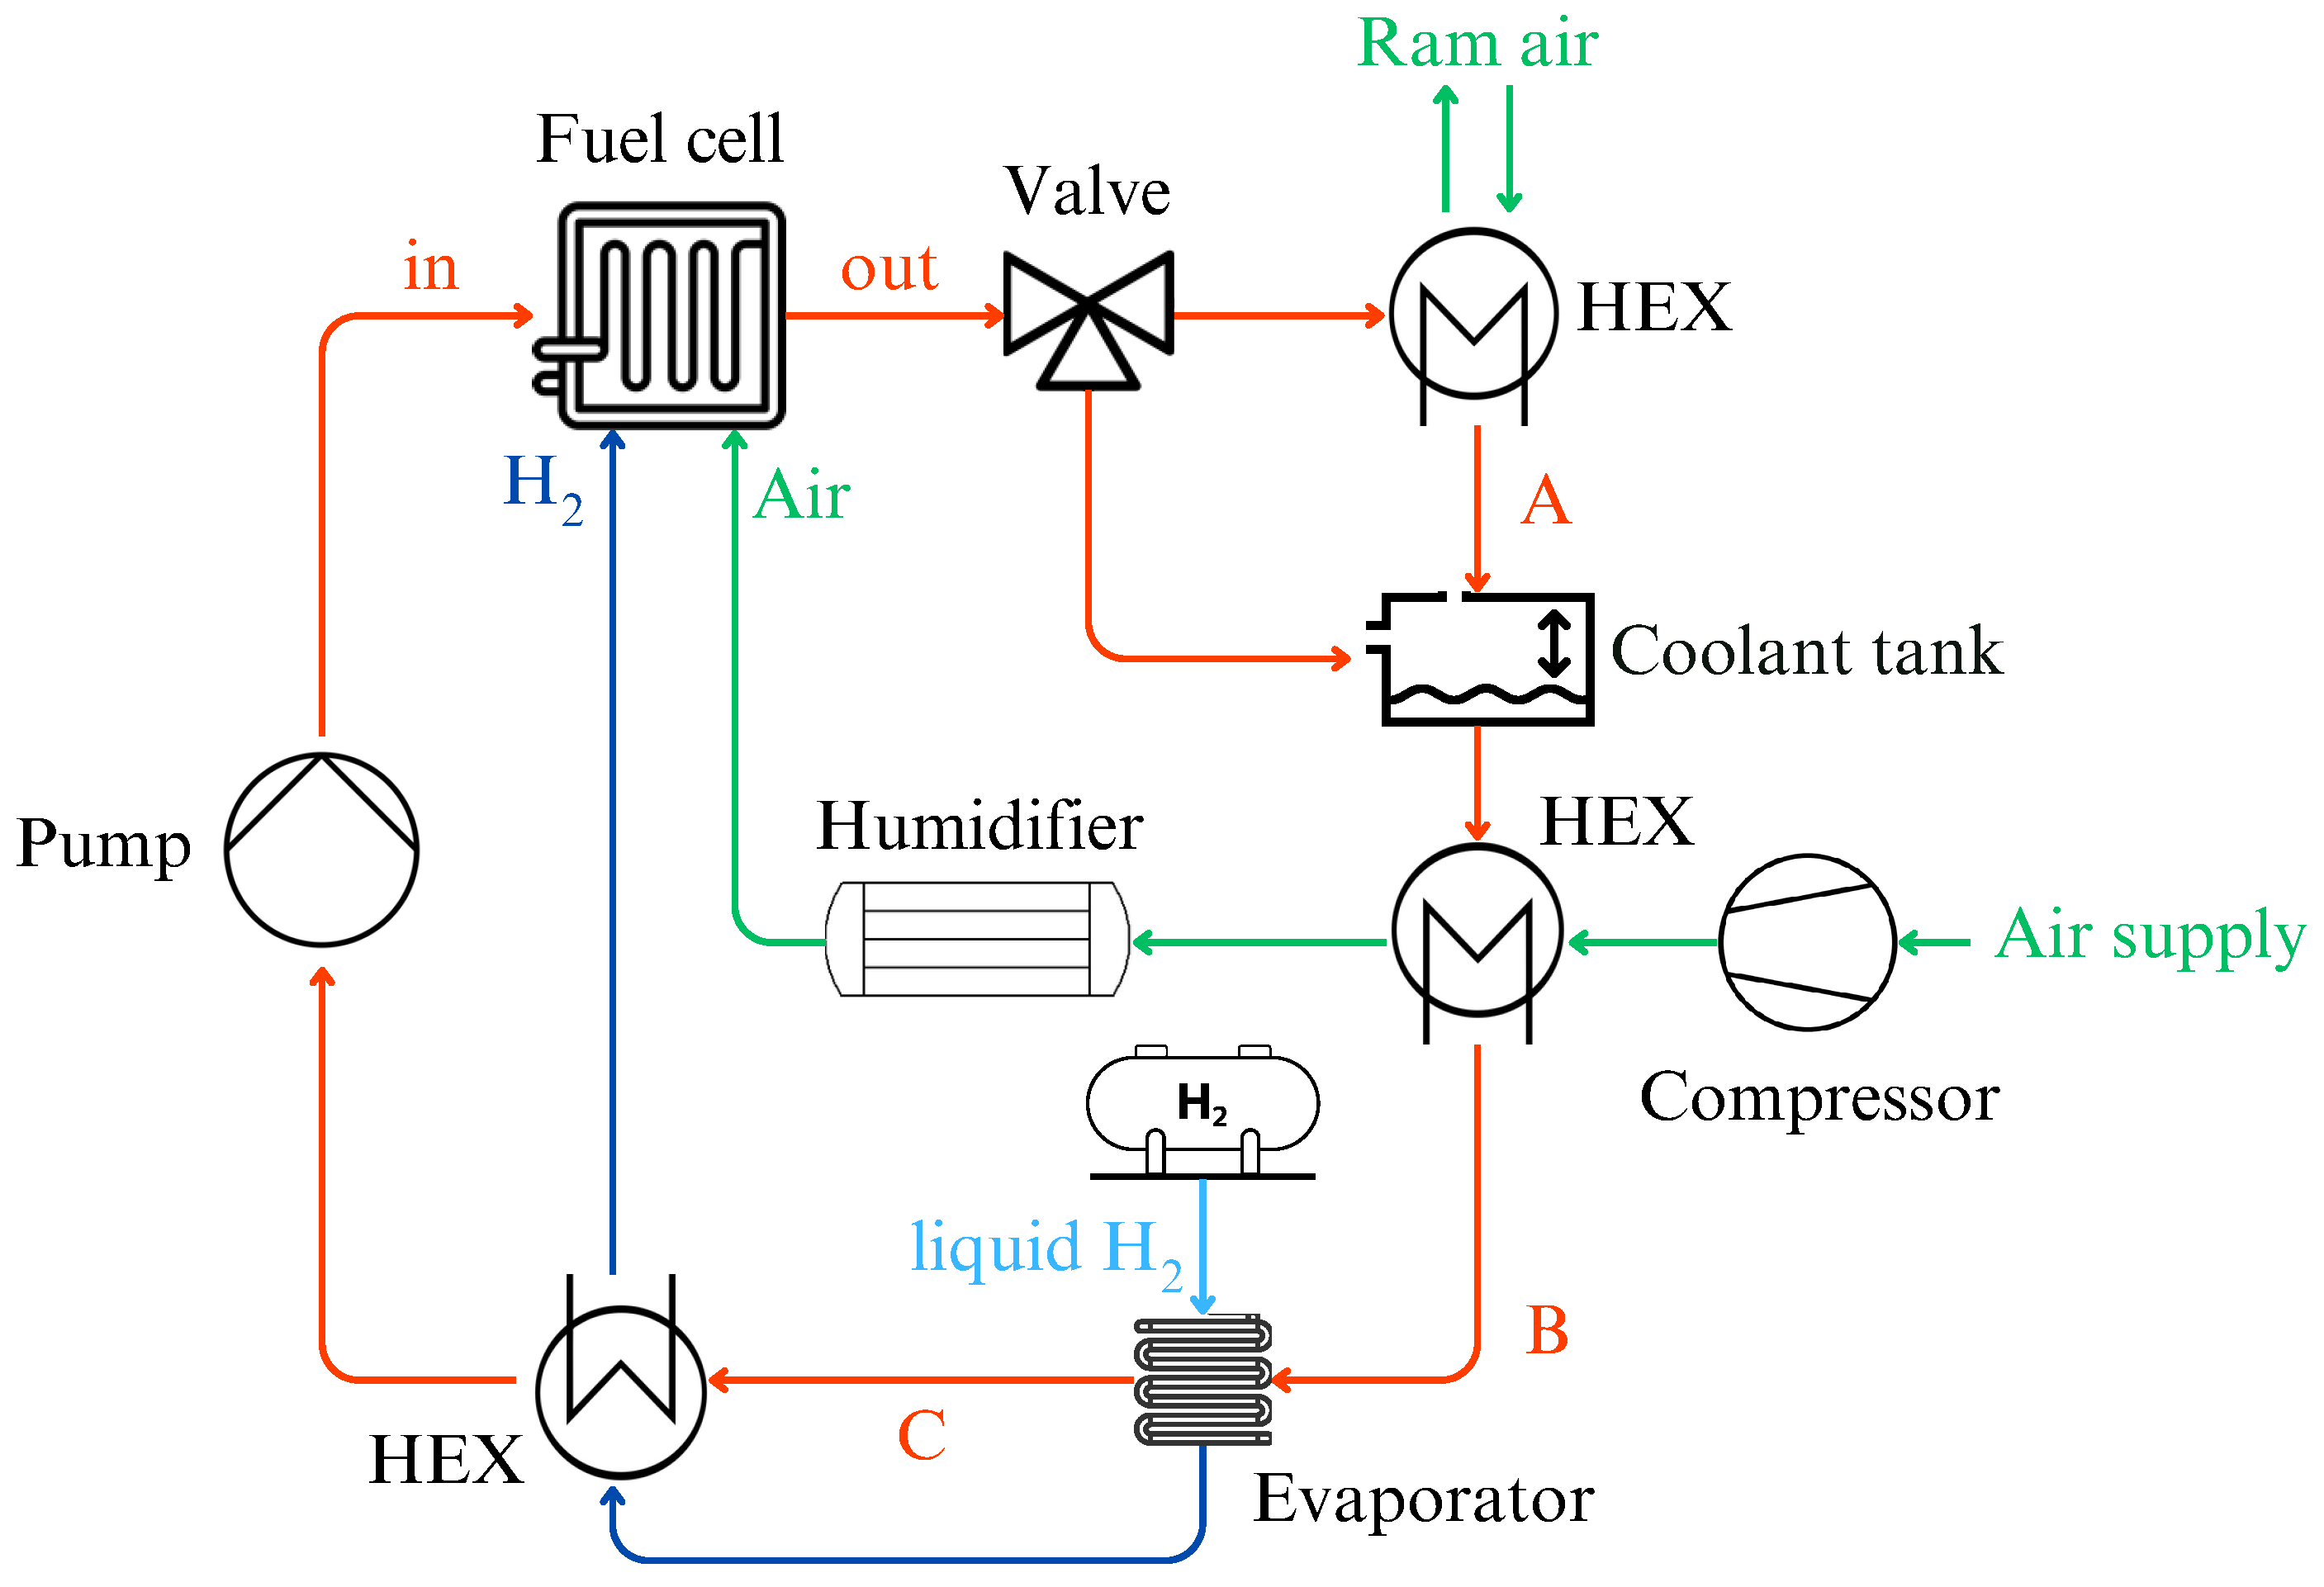
The liquid cooling TMS shown in Figure 3 was developed through an iterative design process and integrates the operating constraints of the fuel cell system. In this architecture, the coolant circulates through the fuel cell, absorbing excess heat, which is then dissipated into the ambient air via a ram air HEX. In this study, this is referred to as the primary HEX. The coolant temperatures at various points in the system are represented by in, out, A, B, and C. The hydrogen supply is stored in a cryogenic tank and must pass through an evaporator and additional HEX before entering the fuel cell, and the oxygen supply is assumed to be captured by a cooling air inlet. Due to the pressure difference between the ambient air and that required by the fuel cell, the oxygen/air supply will undergo a compression that will increase its temperature and generate excess heat. This excess heat, transferred to the coolant, is used to indirectly evaporate the liquid hydrogen and bring it to the required operating temperature. Lastly, in this cooling system, only the air supplied to the fuel cell undergoes external humidification.

Figure 3.
Liquid cooling thermal management system for PEMFC.
3.2. Sizing Methodology
3.2.1. Procedure
The TMS sizing procedure follows a step-by-step approach, starting with defining the case study and power requirements, as carried out in Section 2. The thermal loads can then be evaluated, and the thermal requirements can be established. The component models are then sized to meet these cooling demands, and the additional drag, mass, power consumption, and physical volume of the TMS are computed, allowing the performance of the hybrid aircraft and its integration feasibility to be assessed. As shown in Figure 3, LT-PEMFCs are shown to require a significant amount of balance of plant components to ensure their proper functioning. Although a focus is made in this study on the modeling of the TMS, other non-negligible components need to be considered to fully evaluate the impact of hybridizing an aircraft. This is discussed below.
3.2.2. Component Models
The list of additional components required by the hybrid aircraft, representing both the fuel cell and TMS, is provided in Table 2 with models provided and/or derived from data in [5,11,12,13,14,15,16,17,18,19,20,21,22,23]. The components are grouped into four different subsystems that represent the total balance of the plants of the fuel cell system: air supply, hydrogen supply, cooling, and power conditioning. However, some components fulfill several purposes. For example, the air inlet is considered to be part of the air supply but mainly provides the air used to cool the primary HEX. Similarly, the evaporator is part of the hydrogen supply subsystem, but the latent heat of vaporization of the hydrogen is used to dissipate some of the fuel cell and compressed air heat. An insight into some of the component model features is provided below:
- A flush inlet is used to capture the required cooling and supply airflow;
- The single-stage axial compressor accounts for the pressure drop in the humidifier;
- The HEXs and evaporator are of plate-fin type and are sized knowing the heat transfer coefficient and area required at each heat exchange point throughout the TMS;
- The components are stored both in the belly of the aircraft and the aft of the cabin (the volume is given in Appendix A);
- Safety and certification studies, as well as stability and center of gravity analyses, were not conducted.
The complete list of various assumptions associated with the system and individual components is given in Appendix B. Furthermore, additional information on the integration of the fuel cell system in the aircraft is detailed in Appendix C.
Table 2.
Components of the fuel cell system and the TMS, grouped by subsystem, added to hybridize the aircraft. * Models are provided in [5]. Additional model information used can be found in the corresponding references.
Table 2.
Components of the fuel cell system and the TMS, grouped by subsystem, added to hybridize the aircraft. * Models are provided in [5]. Additional model information used can be found in the corresponding references.
| Air Supply | Hydrogen Supply | Cooling | Stack and Power Conditioning |
|---|---|---|---|
| Air inlet * | Hydrogen tank * | HEX [11] | Fuel cell stack [12,13,14,15,16] |
| Compressor * | Evaporator [11] | Coolant and tank | Motor/converter [17] |
| Diffuser | HEX [11] | Pipes * | Cables [18] |
| Humidifier [19,20,21] | Pump * | ||
| HEX [11] | Valve [22,23] |
4. Reference Hybrid Aircraft
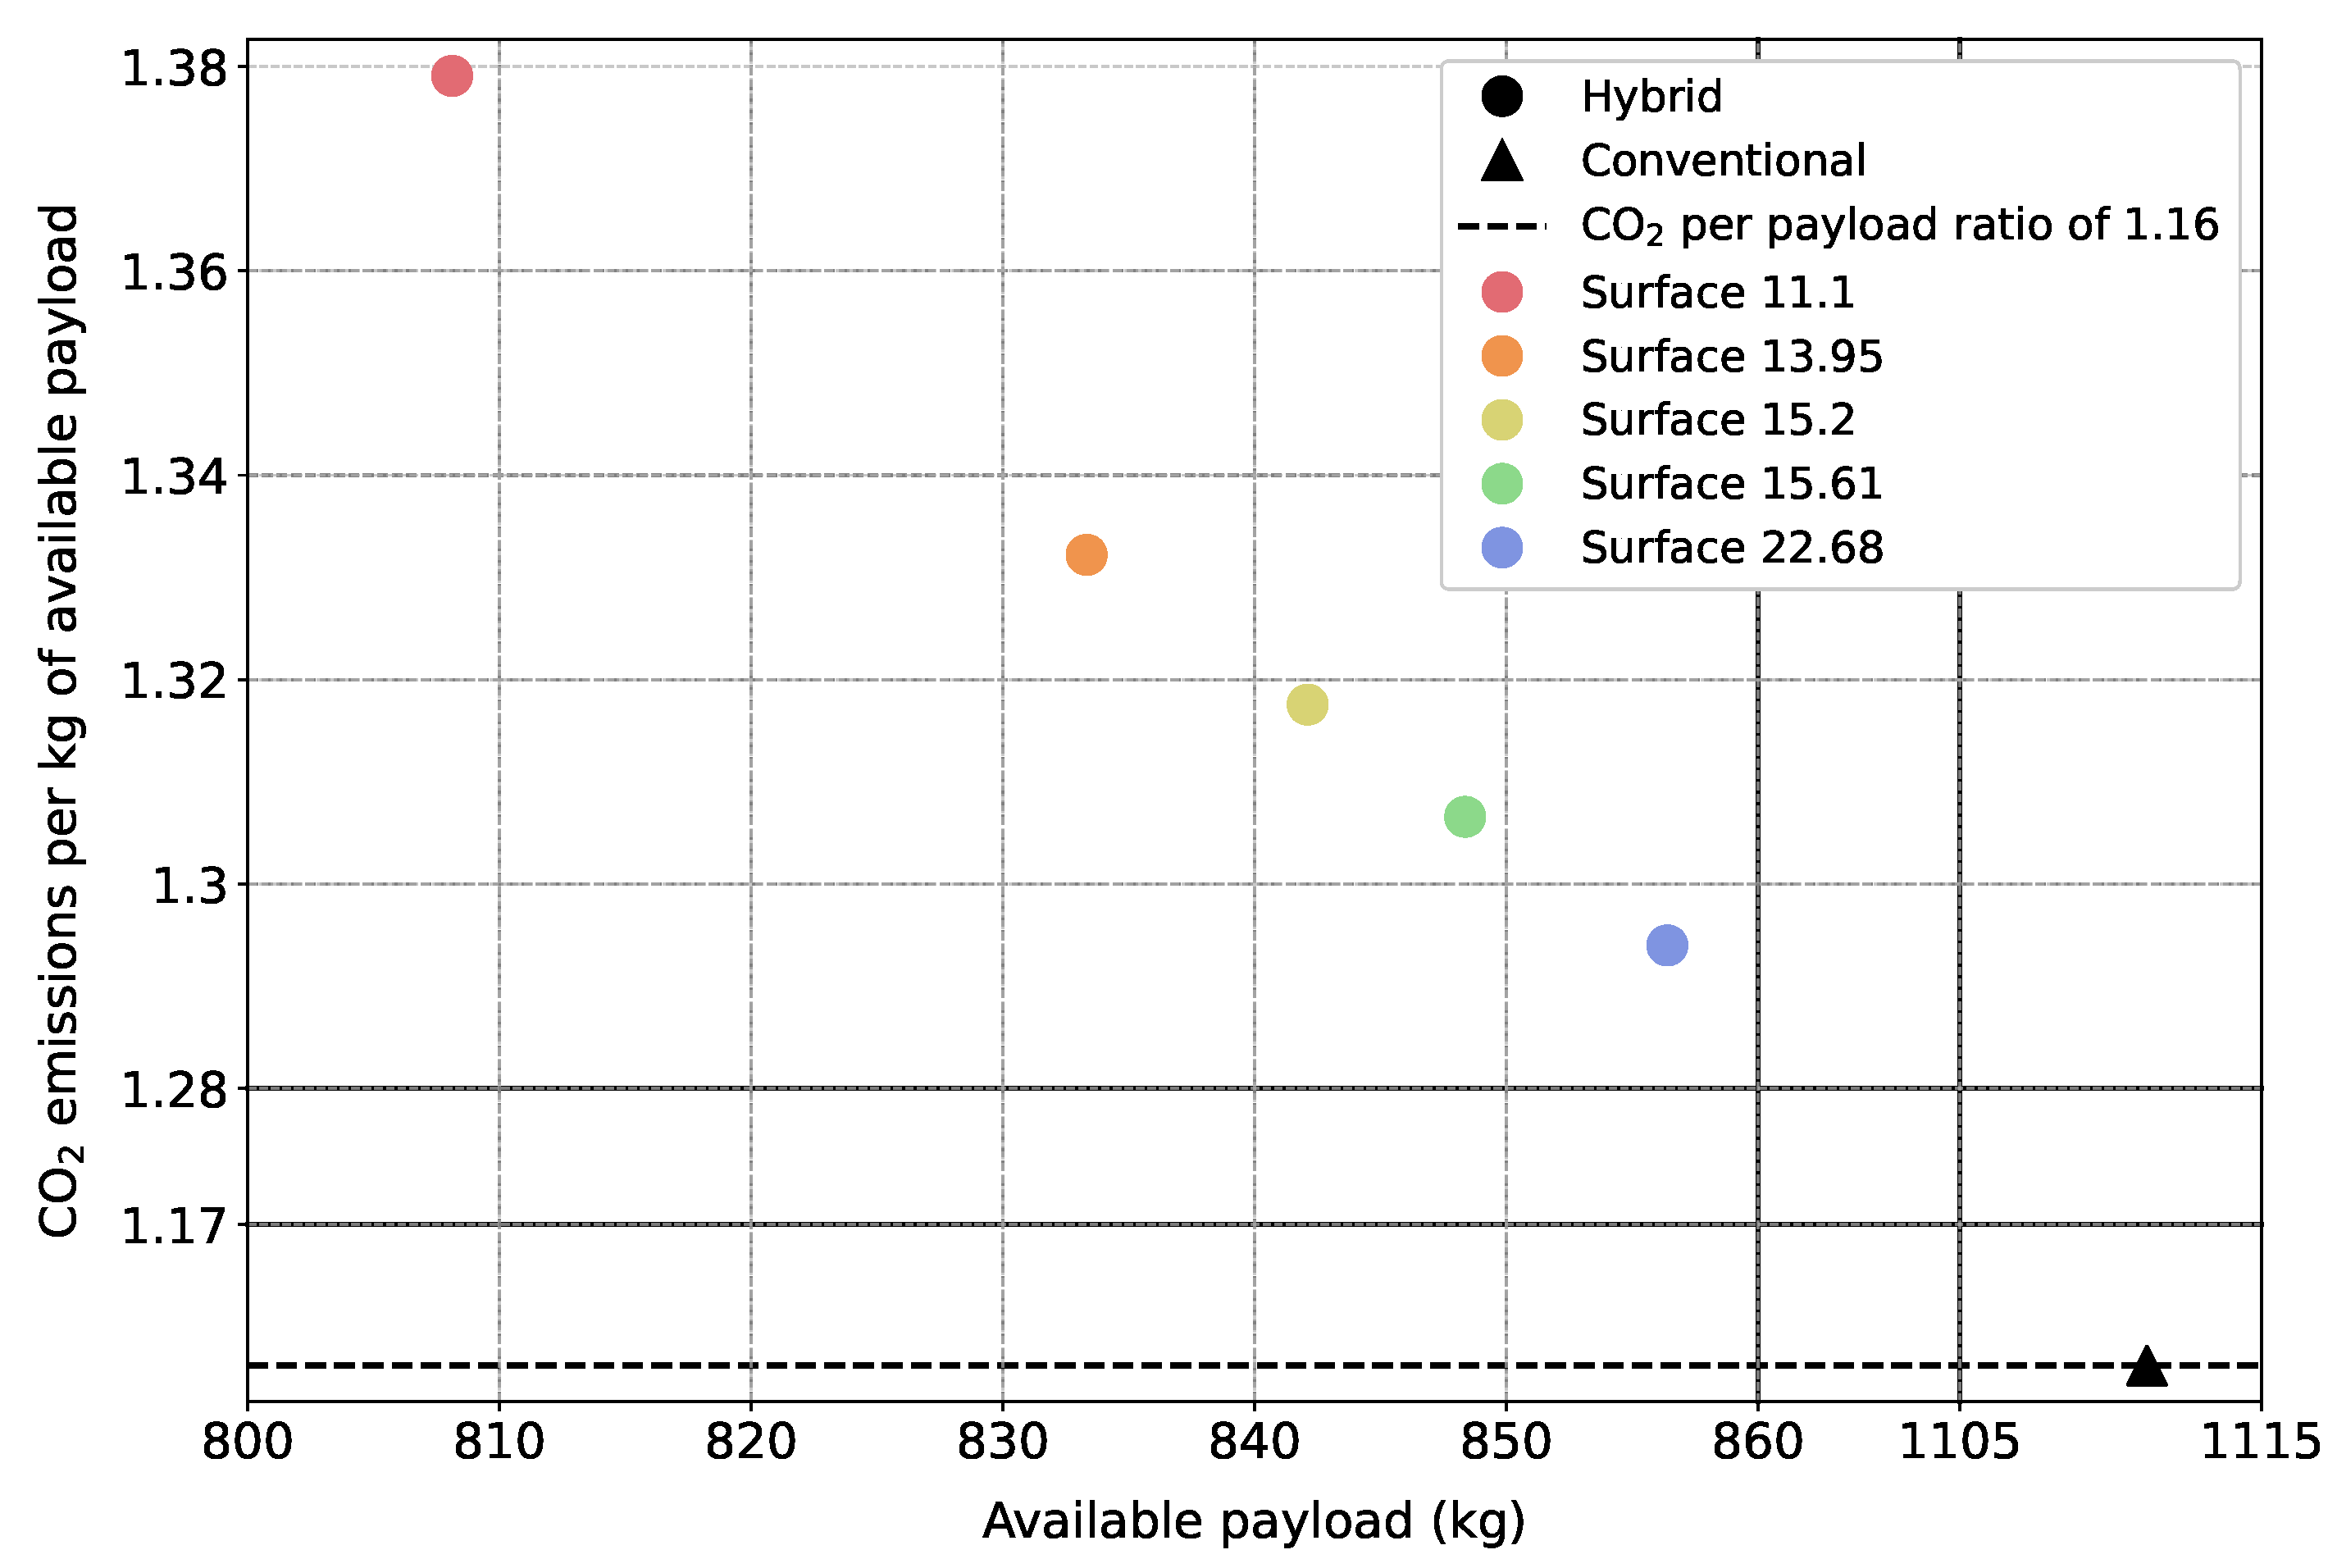
A recap of the assumptions used for the reference hybrid aircraft is provided in Table 3, and Table 4 presents the result compared to its conventional counterpart. The complete assumptions are provided in Appendix B, and additional information concerning these parameters is explained when performing the sensitivity analysis in Section 5. The HEX surface represents the plate-fin geometry, and the denomination “surface 15.61” is explained in further detail later in the paper.
Table 3.
Reference hybrid aircraft initial assumptions. * ISA stands for International Standard Atmosphere. The ISA difference refers to the deviation in the actual atmospheric temperature considered from that defined by the ISA model. † Refer to Section 5.3.2.
Table 4.
Conventional and reference hybrid aircraft at 210 kts. * OEM mass excludes all eight cabin seats. The MTOM is 3625 kg.
The table highlights key parameters such as OEM, fuel consumption (both jet fuel and hydrogen), and available payload capacity. The result of this design will serve as a reference hybridized case to assess the impact of variations in hybridization parameters on aircraft performance. Several key considerations should be noted:
- The number of passengers is limited to eight in the conventional aircraft. A cabin crew of two is also considered;
- The total crew mass is assumed to be 200 kg (for the two crew members) and is already accounted for when deducing the available payload;
- The OEM mass is calculated without the mass of the seats, which is to be included within the design mass of the passengers instead. This ensures that if the resulting payload capacity is insufficient for all eight passengers, the empty seats are also excluded;
- With this adjustment in the OEM mass, the design passenger mass used to calculate the number of passengers from the available payload should include their body weight, luggage, and seat.
As shown, the conventional configuration offers a higher available payload (+263 kg) but consumes more jet fuel (+58 kg) compared to its hybrid counterpart. Assuming a design mass of 100 kg per passenger (including luggage) and a seat mass of 15.4 kg, the hybrid aircraft faces payload limitations that prevent it from accommodating all eight passengers, as this would require a minimum of 924 kg of available payload. Instead, it can carry only seven passengers, which requires a minimum of 808 kg of available payload.
5. Sensitivity Analysis
A sensitivity analysis is essential for evaluating how variations in key parameters impact the effectiveness and feasibility of e-fuel cell integration and its corresponding liquid cooling TMS. The goal is to identify which factors have the most significant influence on fuel savings/emissions and the resulting payload. The sensitivity analysis is structured at three levels to account for assumptions and dependencies that influence system performance at different scales. Variations at one level can propagate to others, making it essential to evaluate the parameters at the aircraft, fuel cell, and TMS component levels separately to fully understand their impact. The following parameters are considered:
- Aircraft level: Cruise speed, fuel cell power, and ISA temperature;
- Fuel cell system level: Stack temperature and hydrogen/air supply entry temperatures;
- TMS component level: Coolant and HEX offset-fin geometry.
In this study, a uniform approach is used to compare the sensitivity analysis results by evaluating the hybrid aircraft’s resulting emissions per kilogram of available remaining payload. This metric provides a standardized measure of environmental impact, allowing for a direct comparison across the different sensitivity cases. The results are provided below.
5.1. Aircraft Level
5.1.1. Cruise Speed
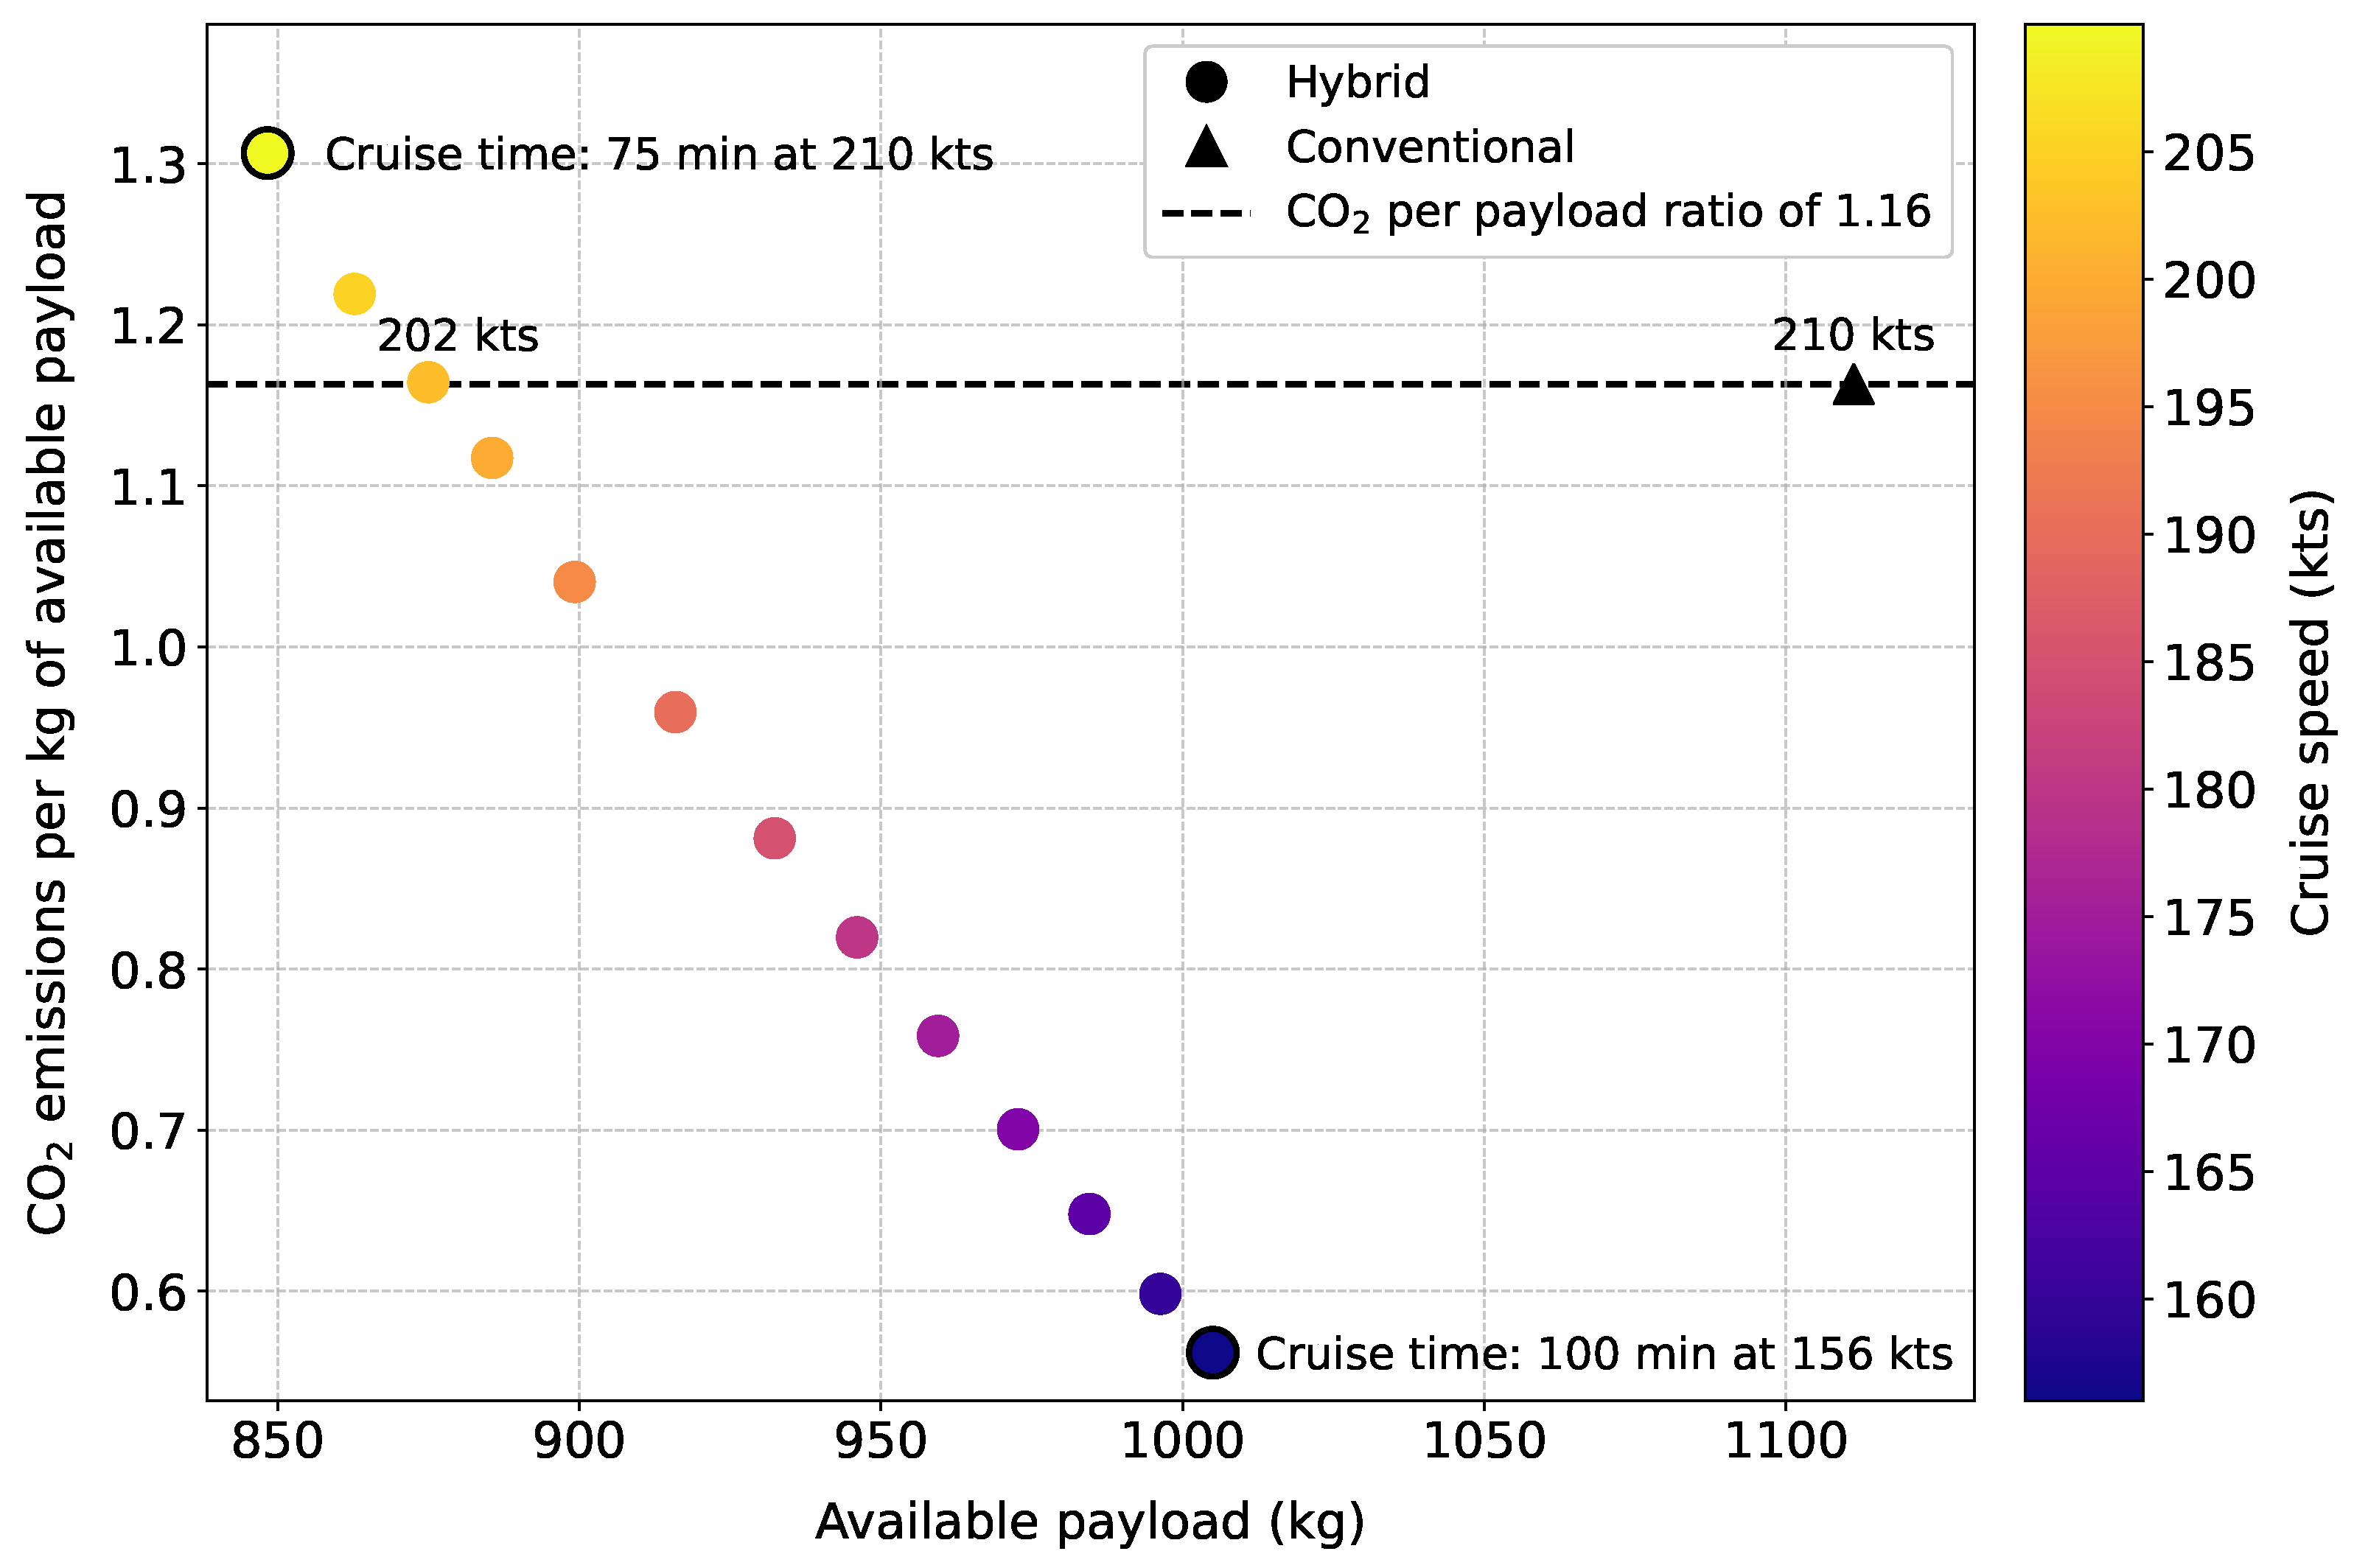
The cruise speed will vary between 156 kts (maximum range speed) and 210 kts (maximum cruise speed). For the considered 300 NM mission, the difference of flying at 156 kts compared to 210 kts leads to an increase in cruise time by around 25 min. For the hybrid aircraft operating with a 200 kW fuel cell and the other parameters provided in Table 3, the resulting emissions per kilogram of available payload and the available payload are shown for various cruise speeds in Figure 4. The point for the conventional (non-hybridized) aircraft operating at its maximum cruise speed is also represented. As can be seen, when referring merely to the hybridized scenario, a decrease in cruise speed leads to an increase in available payload and an overall reduction in emissions per kilogram of available remaining payload. Furthermore, Figure 4 shows that, in order to have the same ratio of emissions per kilogram of available payload as the conventional aircraft (around ), the hybrid version will have to fly at a cruise speed of around 202 kts, which corresponds to an available payload of around 875 kg. However, if the conventional aircraft were also to reduce its cruising speed to about 202 kts, it would, in turn, save on emissions and achieve an even lower ratio (around ). Therefore, the conventional aircraft maintains an advantage in emissions efficiency per payload when compared to aircraft operating at equal speeds.
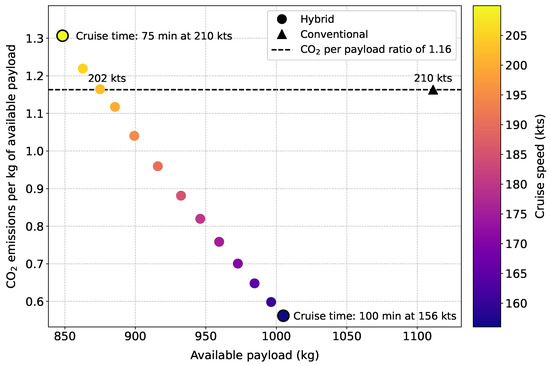
Figure 4.
Hybrid and conventional aircraft emissions per kilogram of available payload and available payload for various cruise speeds.
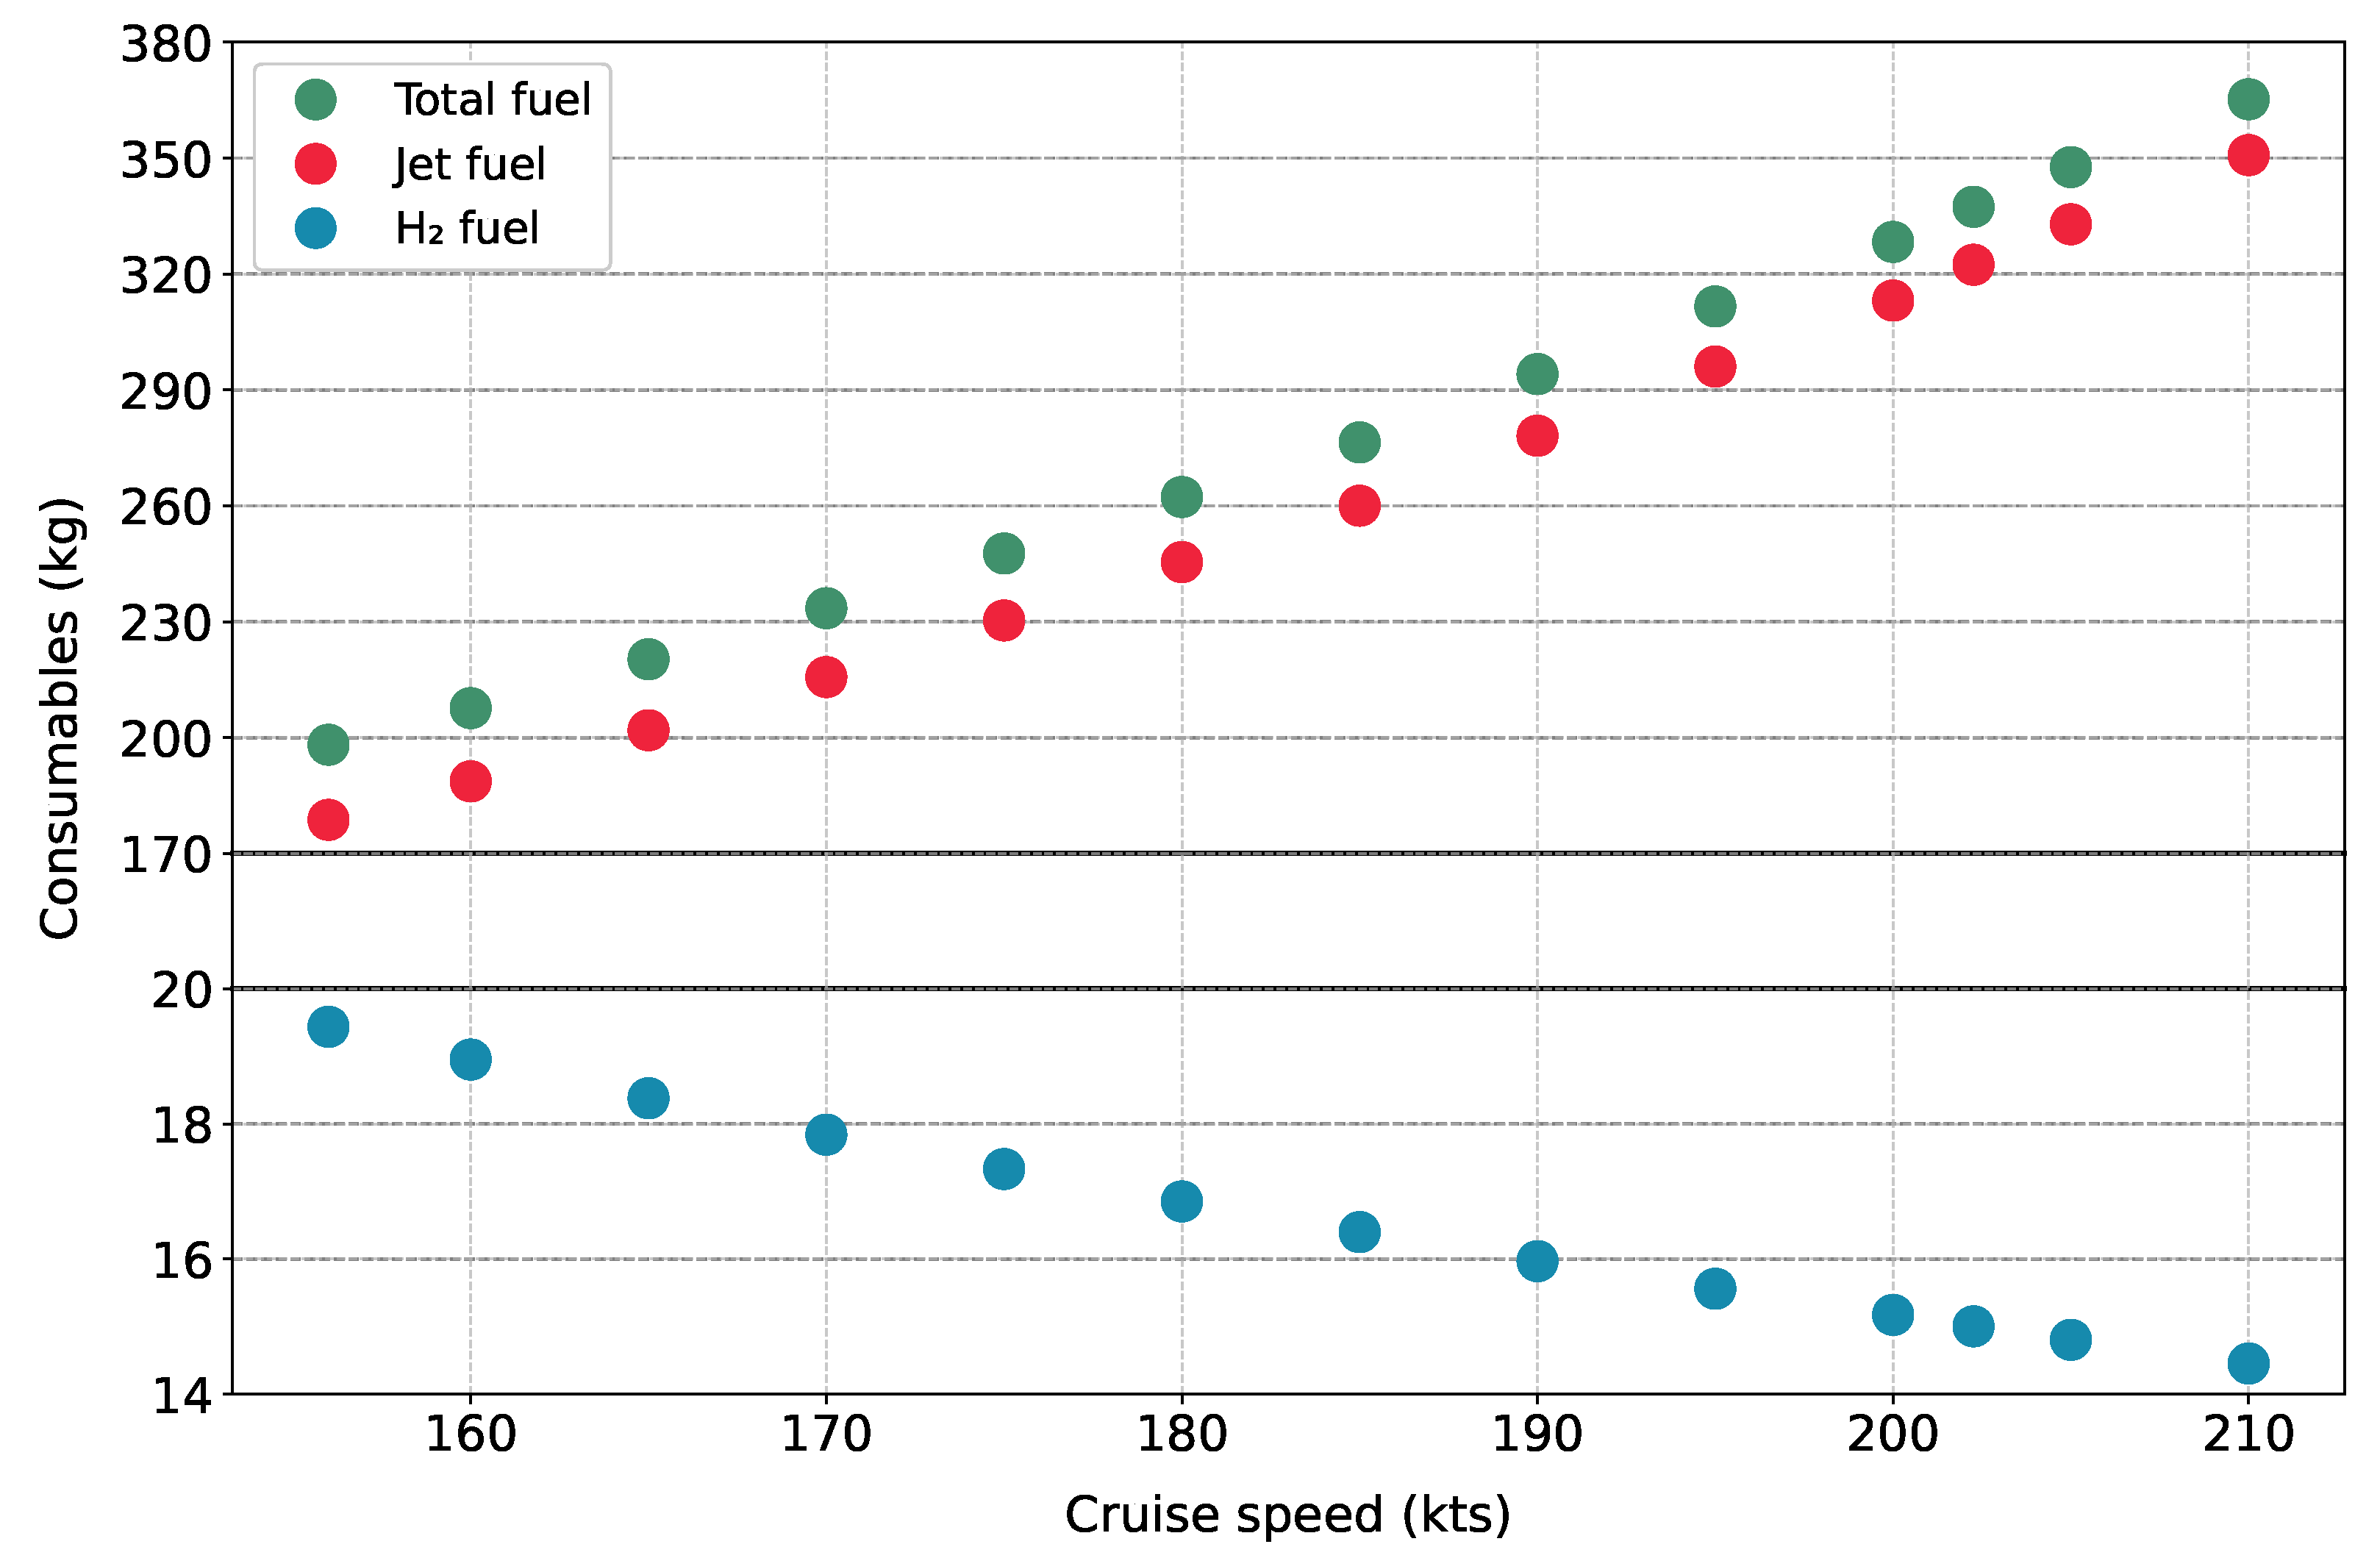
The explicit comparison values of the OEM, fuel consumption, emissions, and available payload are shown in Table 5 for both conventional and hybrid propulsion at various cruise speeds. In addition, the evolutions of the jet fuel and H2 fuel for the various cruise speeds of the hybrid aircraft are provided in Figure 5. As can be deduced, the lower cruise speed results in lower drag and a consequent decrease in jet fuel consumption. However, as the cruise phase is longer, the fuel cell operates longer, and the hydrogen supply increases. The resulting available payload is greatest at lower cruise speeds.
Table 5.
Cruise speed sensitivity analysis results. * OEM mass excludes all eight cabin seats. The MTOM is 3625 kg.
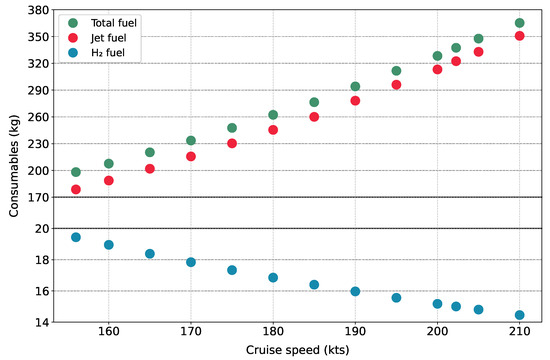
Figure 5.
Hybrid aircraft fuel consumables (hydrogen and jet fuel) for various cruise speeds.
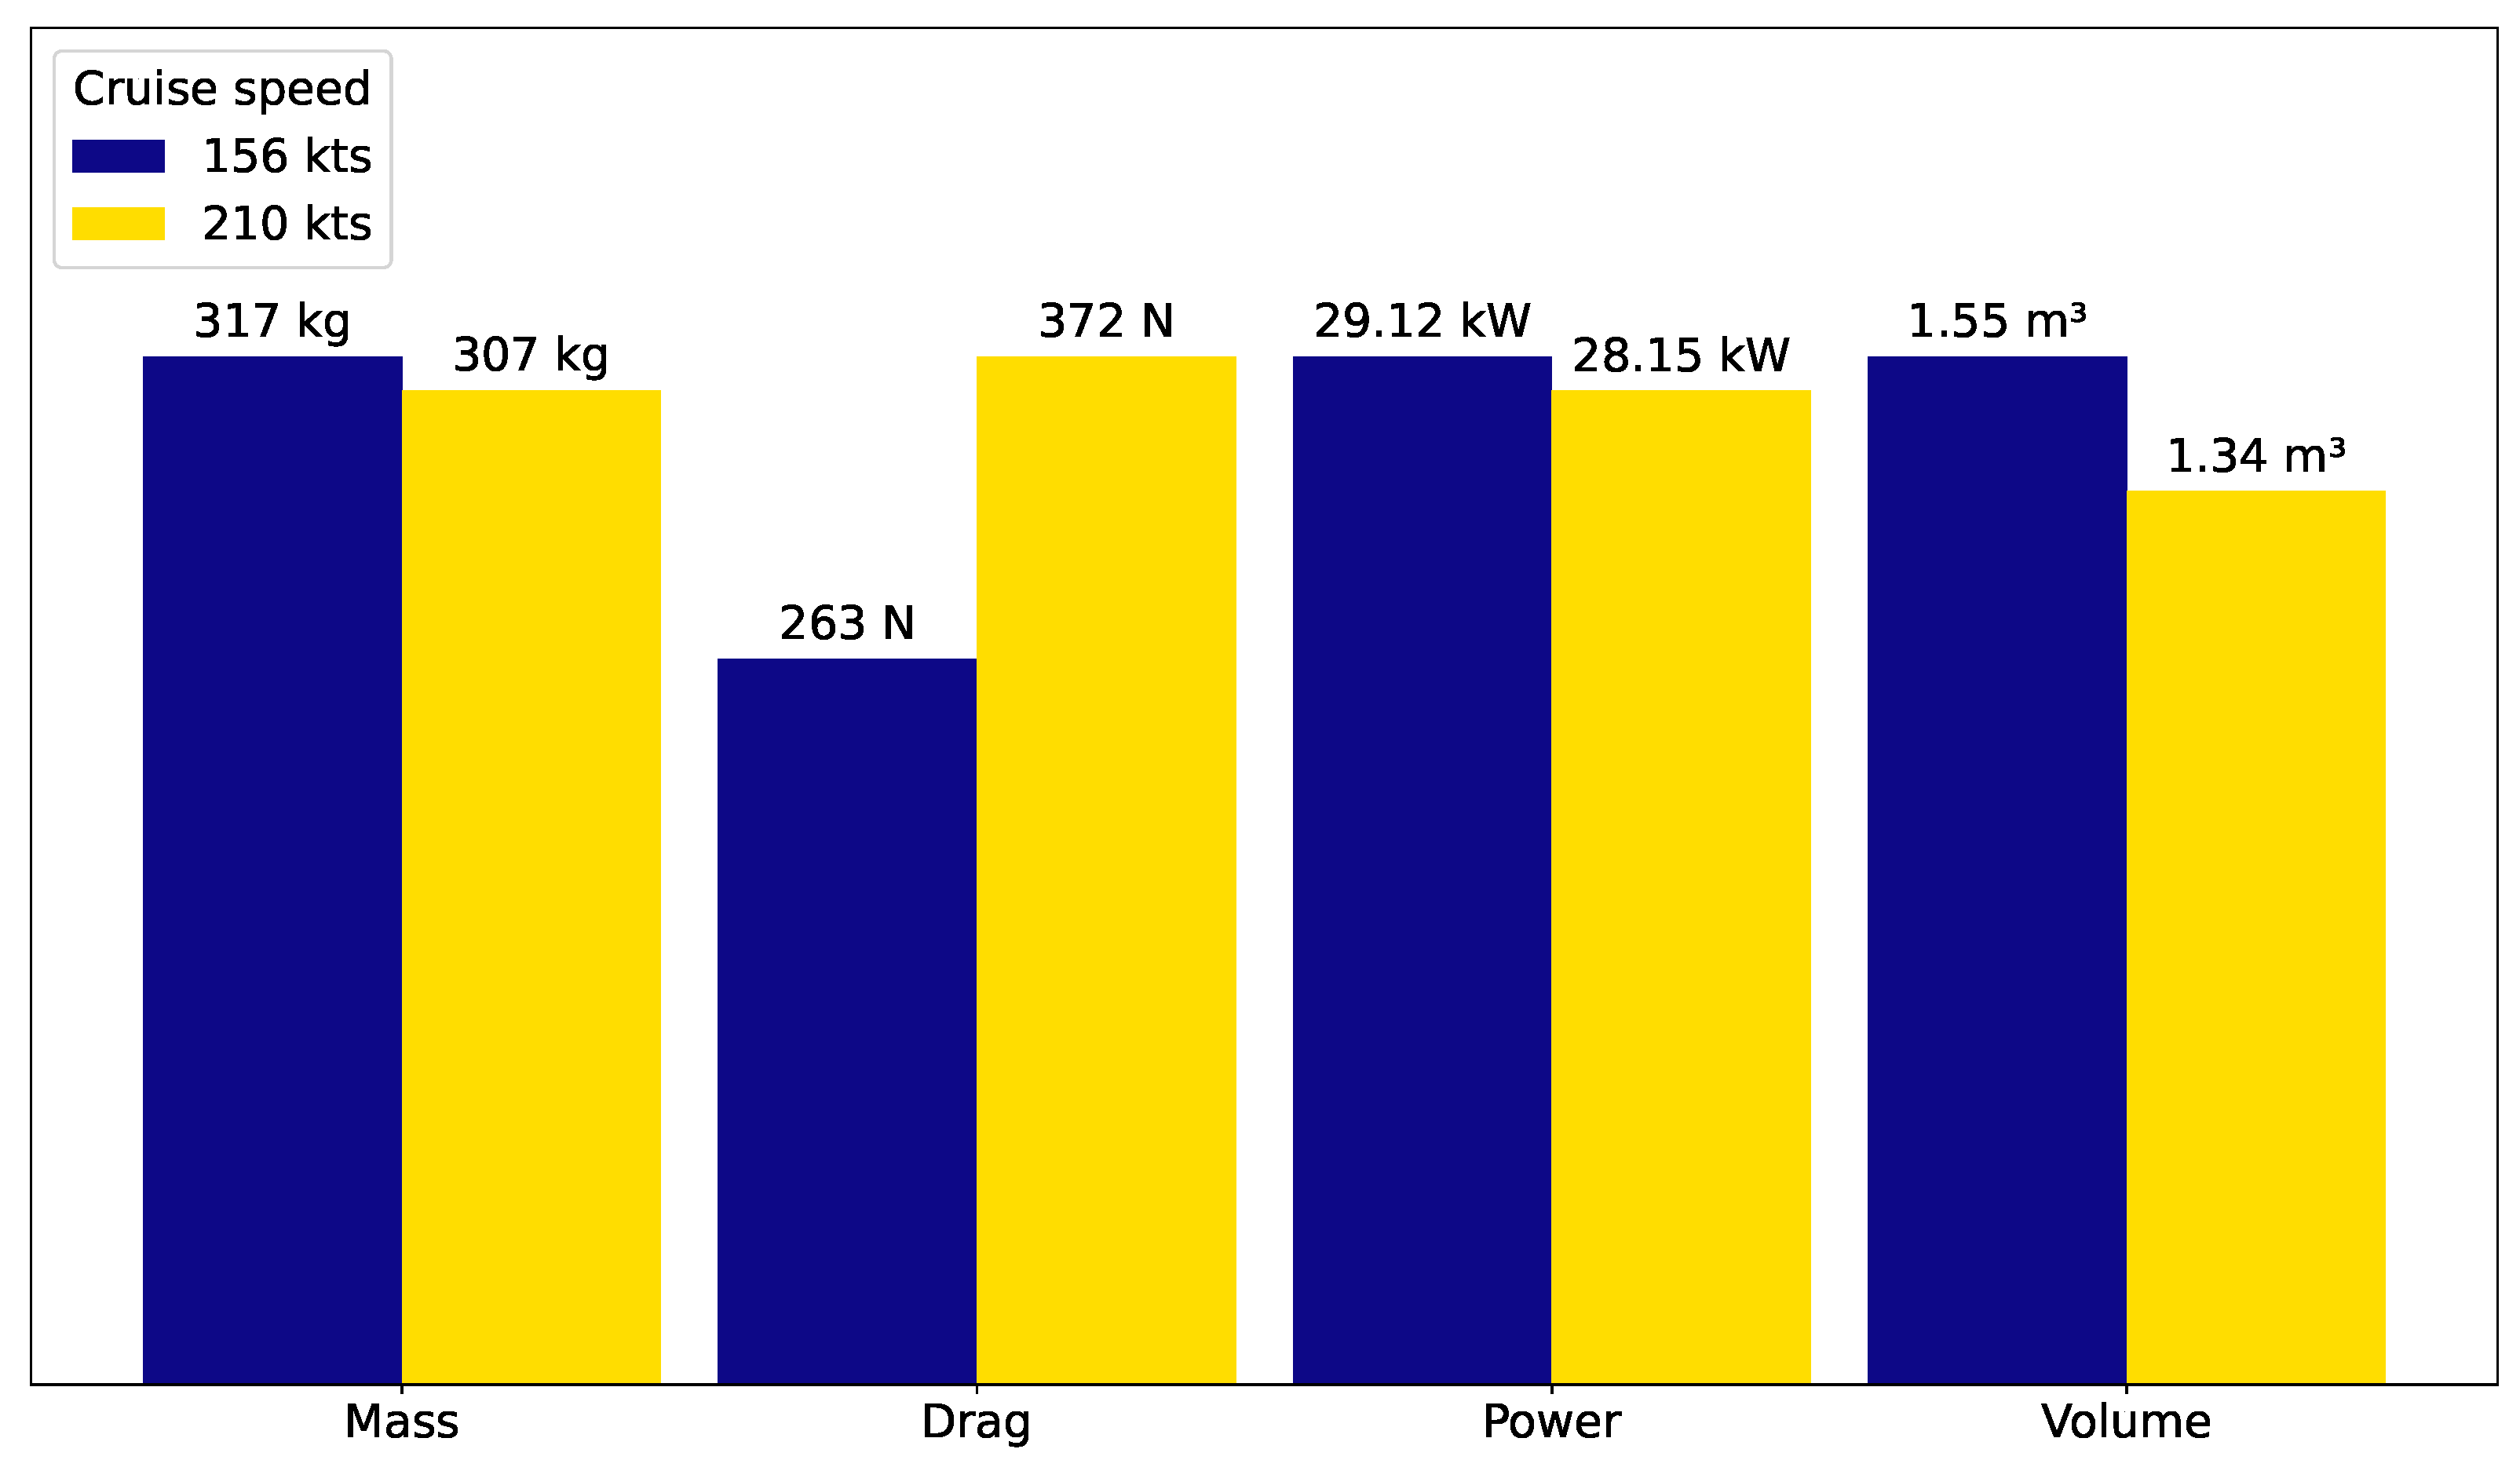
Furthermore, a more in-depth comparison of the mass, drag, power, and volume of the complete fuel cell system (including the TMS) at 156 kts and 210 kts is shown in Figure 6. As expected, the drag decreases at lower speeds. In addition, lower cruise speeds also result in a larger compressor and greater increase in required power due to the resulting dynamic pressure ratio between the ambient air and the stack. Due to the longer cruise phase at lower speeds, the hydrogen tank increases significantly. Recalling the hydrogen tank gravimetric efficiency of provided in Table A2 in Appendix B, the tank mass increases by about 9 kg at the lowest cruise speed, while the volume model leads to an increase of 0.18 m3. In terms of the required global volume, the fuel cell system fits within the available space of at least 100 ft3 (2.83 m3). However, it is important to recall that this assessment does not account for additional safety considerations or design margins, which may impact the feasibility of the integration.
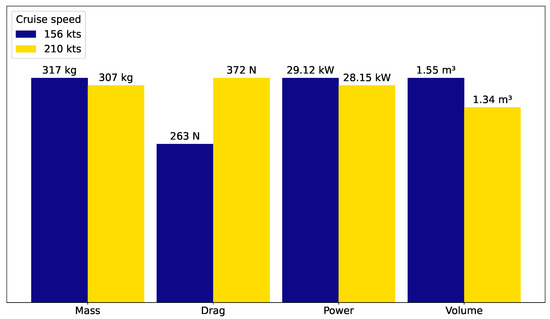
Figure 6.
Fuel cell system mass, drag, power, and volume comparison between 156 kts and 210 kts.
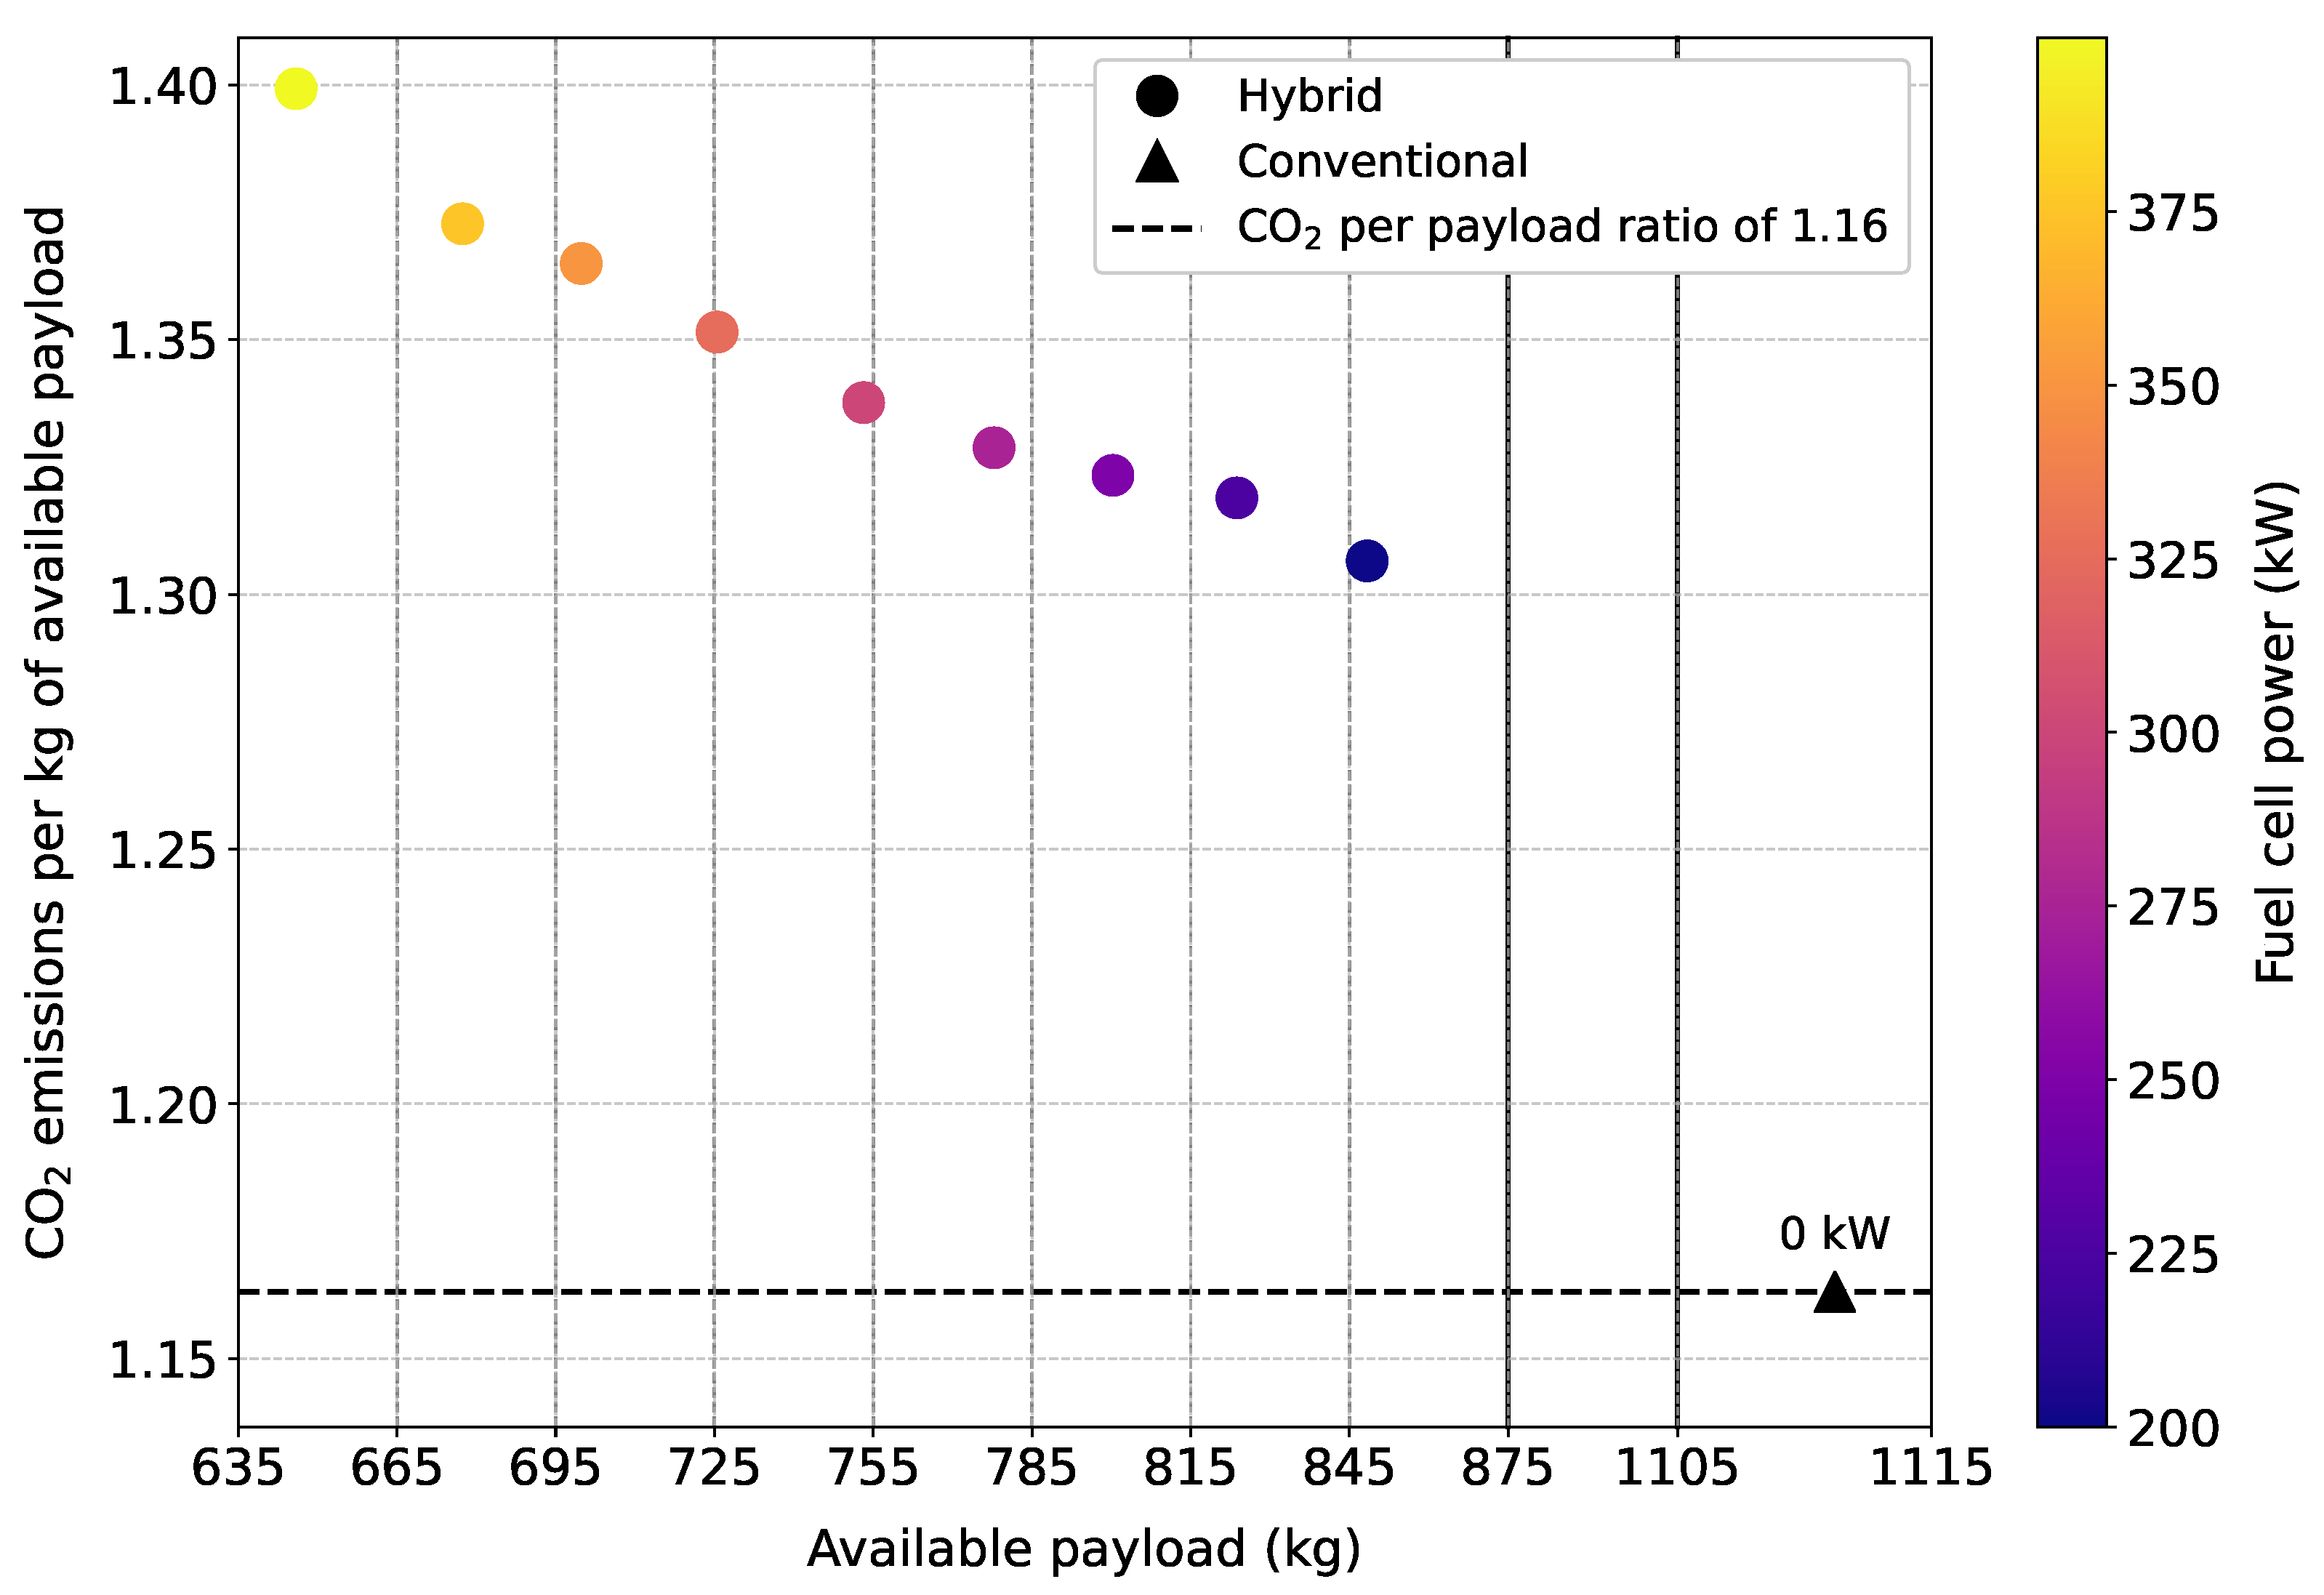
5.1.2. Fuel Cell Power
The fuel cell system power will vary between 200 kW and 400 kW, impacting both the overall hybridization and thermal requirements. Similar to the cruise speed analysis, Figure 7 shows the resulting emissions per kilogram of available payload and the available payload for different fuel cell powers. A higher power output increases heat generation, requiring a more robust cooling system, but also allows for greater fuel cell contribution, potentially reducing reliance on conventional jet fuel during cruise. Conversely, a lower power level reduces cooling constraints but will result in higher jet fuel consumption. This tradeoff is analyzed in depth below.
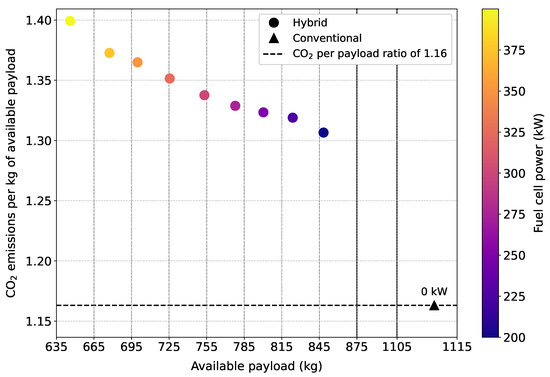
Figure 7.
Hybrid and conventional aircraft emissions per kilogram of available payload and available payload for various fuel cell powers.
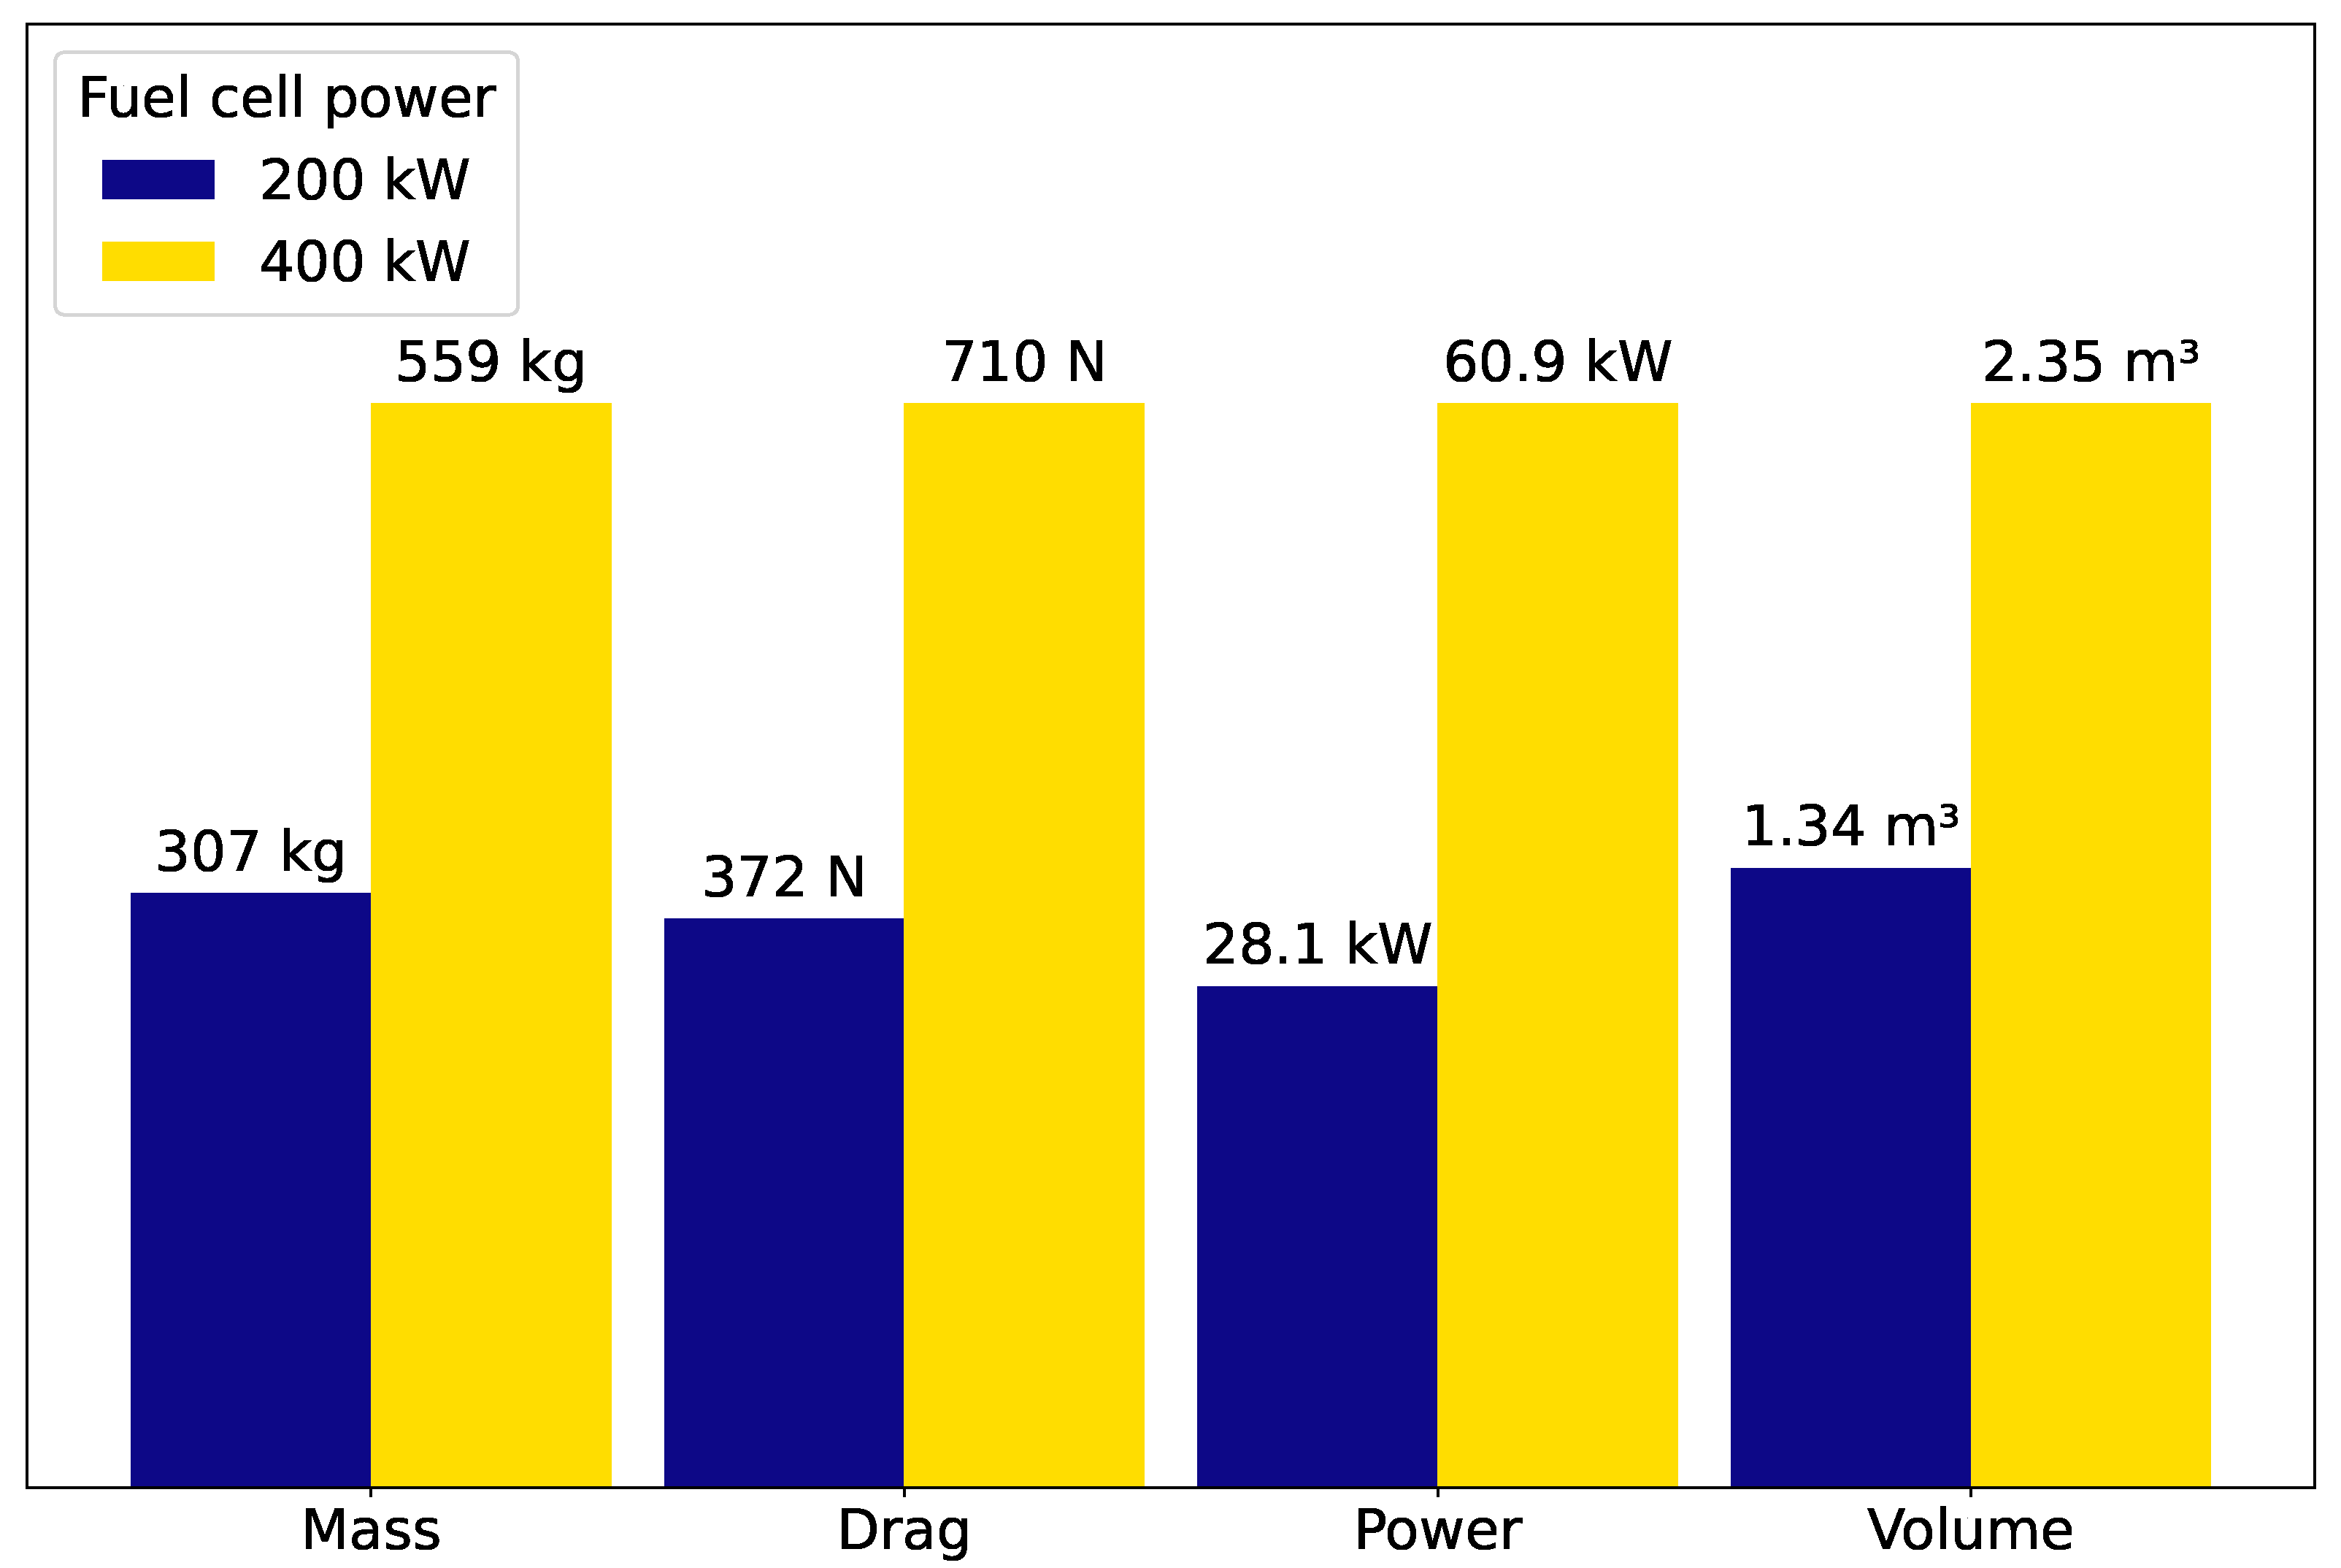
The explicit values of the OEM, fuel consumption, available payload, and emissions are shown in Table 6 for the conventional aircraft and the aircraft hybridized with a 200 kW or 400 kW fuel cell. With respect to the 200 kW fuel cell hybrid aircraft, there is a difference in emissions of around for the 400 kW case study. However, this also leads to of available payload. Furthermore, a more in-depth comparison of the mass, drag, power, and volume of the fuel cell system (including the TMS) for 200 kW and 400 kW of fuel cell power is shown in Figure 8, and the mass breakdown per component is shown in Figure 9. As can be seen, the power required to run the fuel cell system, mostly the compressor, more than doubles for the 400 kW system, with a relatively large increase in the pumping power by around . Despite doubling the fuel cell power, the associated increases in mass, drag, and volume are observed to scale sub-linearly, indicating less-than-proportional growth. This non-linear scaling suggests improved efficiency, as well as more favorable power-to-mass ratios (0.72 kW/kg for 400 kW compared to 0.65 kW/kg for 200 kW) and power-to-volume ratios (170 kW/kg for 400 kW compared to 149 kW/ m3 for 200 kW) for the fuel cell system, making the higher power configuration comparatively advantageous in terms of system performance. However, in terms of aircraft performance, emissions per kilogram of available payload increase with fuel cell power.
Table 6.
Fuel cell power sensitivity analysis results. * OEM mass excludes all eight cabin seats. The MTOM is 3625 kg.

Figure 8.
Fuel cell system mass, drag, power, and volume comparison between 200 kW and 400 kW.
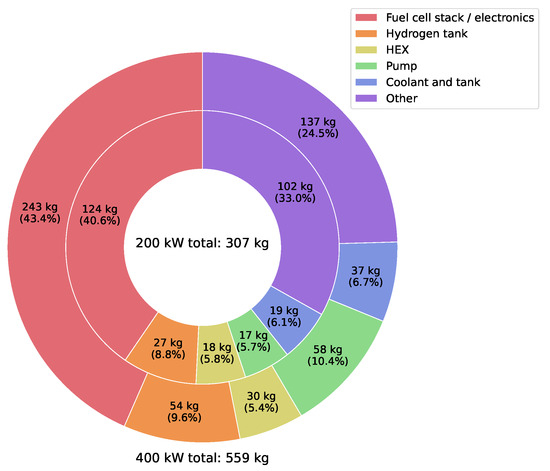
Figure 9.
Fuel cell system mass breakdown between 200 kW and 400 kW fuel cells.
5.1.3. ISA Temperature
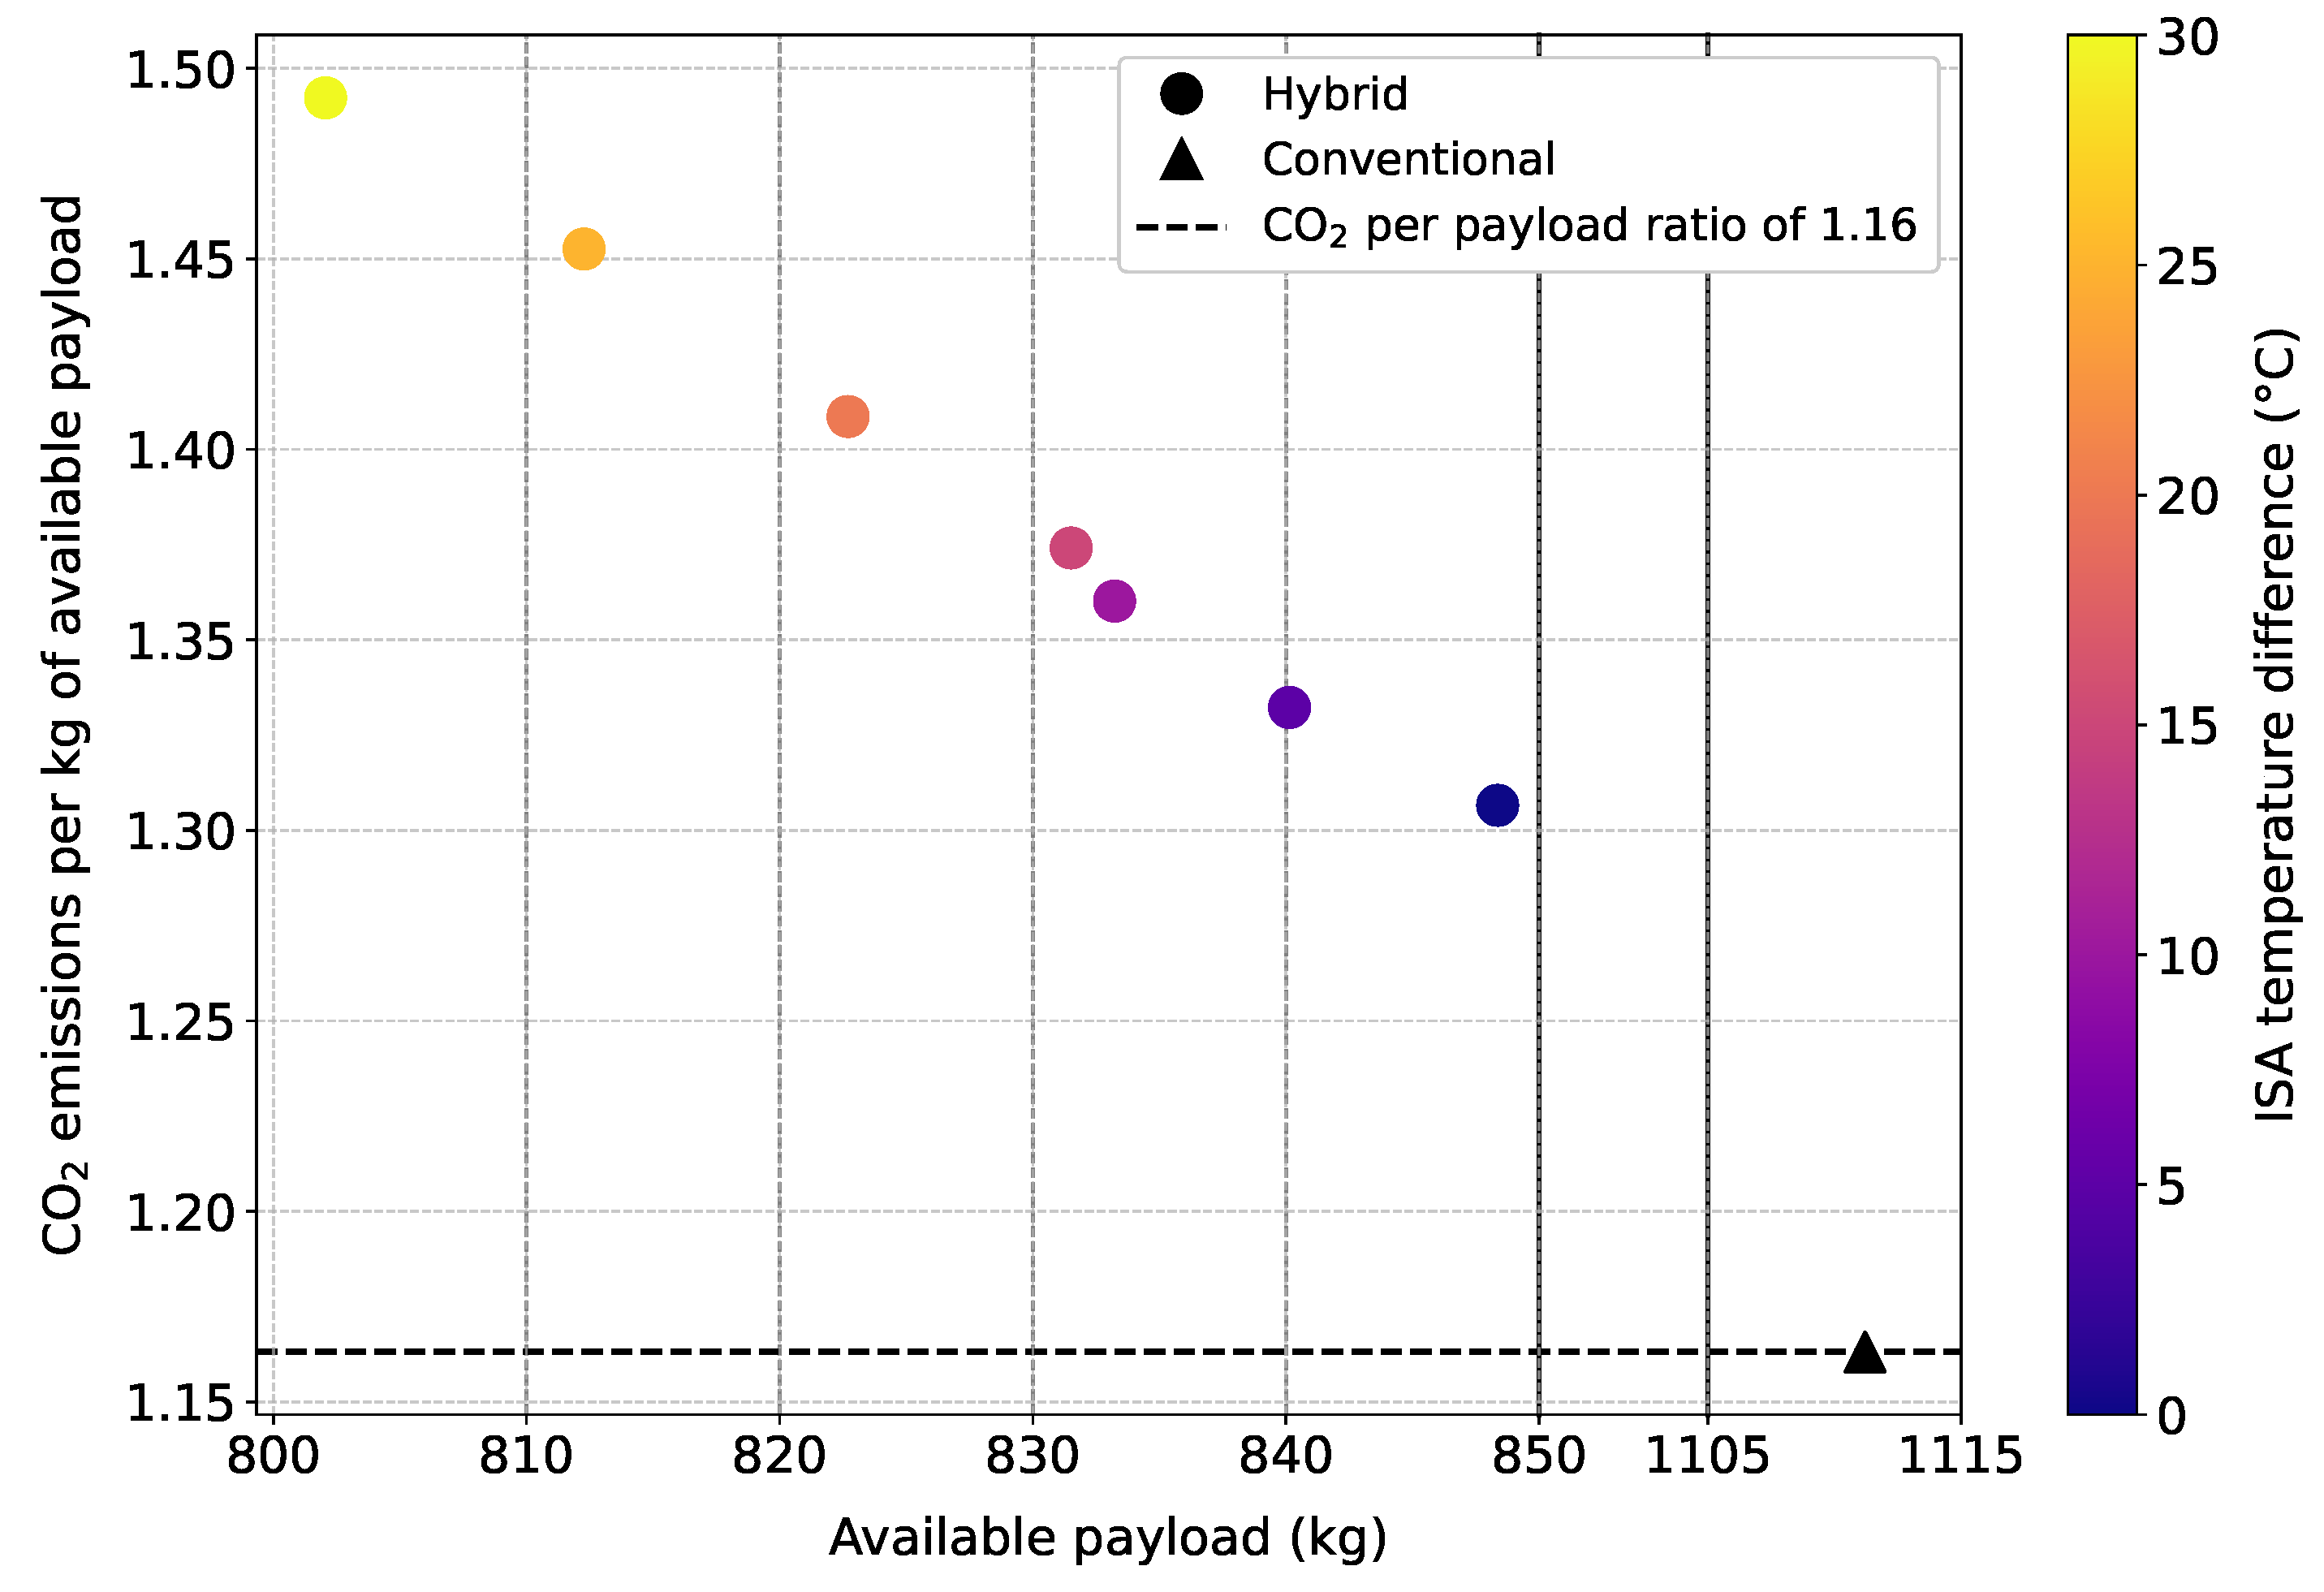
The temperature difference with respect to the ISA model is assumed to vary between +0 °C and +30 °C, representing hot day conditions. Although lower ambient air temperatures introduce their own challenges, such as potential cold start issues, this study focuses only on ISA hotter-than-standard conditions for the sensitivity analysis, as they represent the most thermally challenging scenarios for system performance and integration [24]. In this study, the temperature difference is assumed only to affect the fuel cell system, and no other modifications to the ICE or other components are considered. Figure 10 shows the resulting emissions per kilogram of available payload and the available payload at these different temperatures.
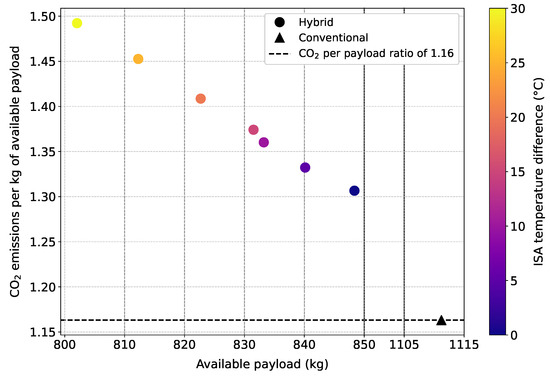
Figure 10.
Hybrid and conventional aircraft emissions per kilogram of available payload and available payload for various ISA temperature differences.
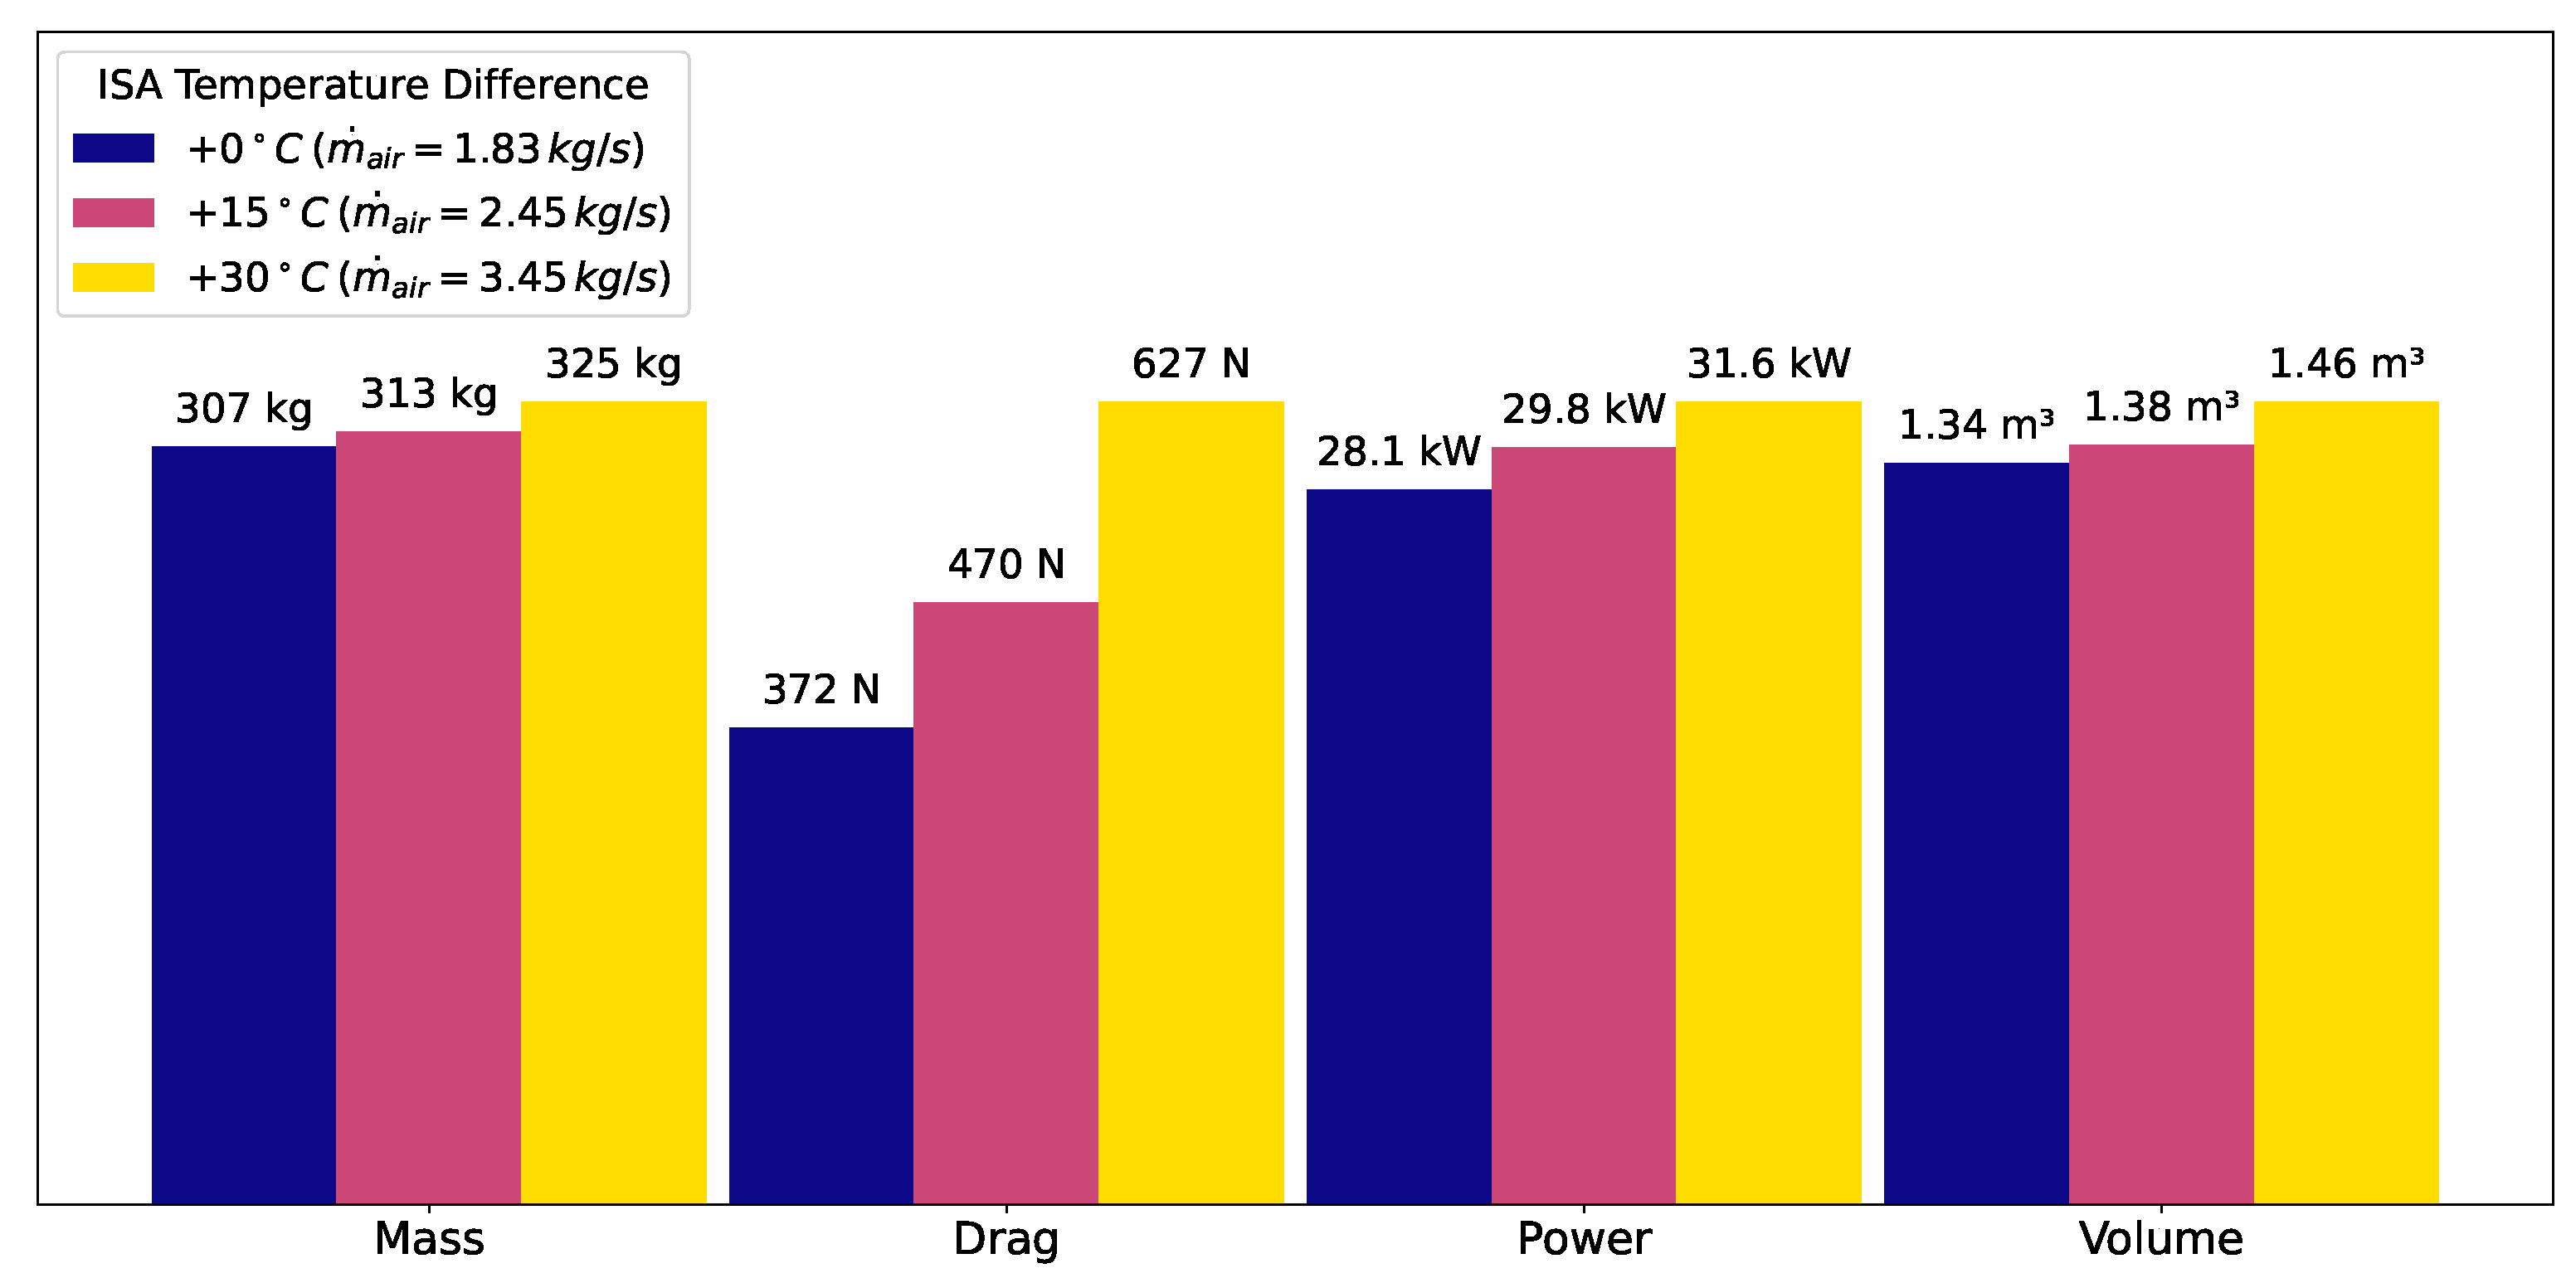
As can be seen, higher ambient temperatures decrease the available payload and increase the emissions per kilogram of available payload. This stems from higher ambient temperatures reducing the temperature gradient between the cooling system and the environment, therefore diminishing the effectiveness of the ram air HEX. Consequently, the cooling system demands increase, requiring a higher mass flow of cooling air. This, in turn, leads to a significant rise in drag. The fuel cell system mass, drag, power, and volume comparison between the reference scenario at ISA +0 °C, +15 °C, and +30 °C is shown in Figure 11. The greatest difference arises from the drag, as mentioned. In addition, there is also a significant increase in power consumption (from the compressor in this case) due to the lower air density. Lastly, the primary HEX experiences the most significant absolute and relative changes among all components when comparing the +0 °C scenario to that at +30 °C. As shown in Table 7, both its mass and volume nearly double under the higher temperature condition.
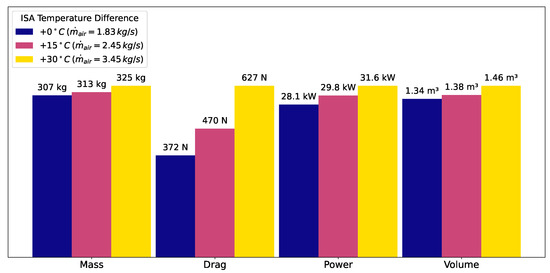
Figure 11.
Fuel cell system mass, drag, power, and volume comparison at different ISA temperature differences.
Table 7.
Primary HEX comparison between hybrid aircraft operating at +0 °C and +30 °C.
5.2. Fuel Cell System Level
5.2.1. Stack Temperatures
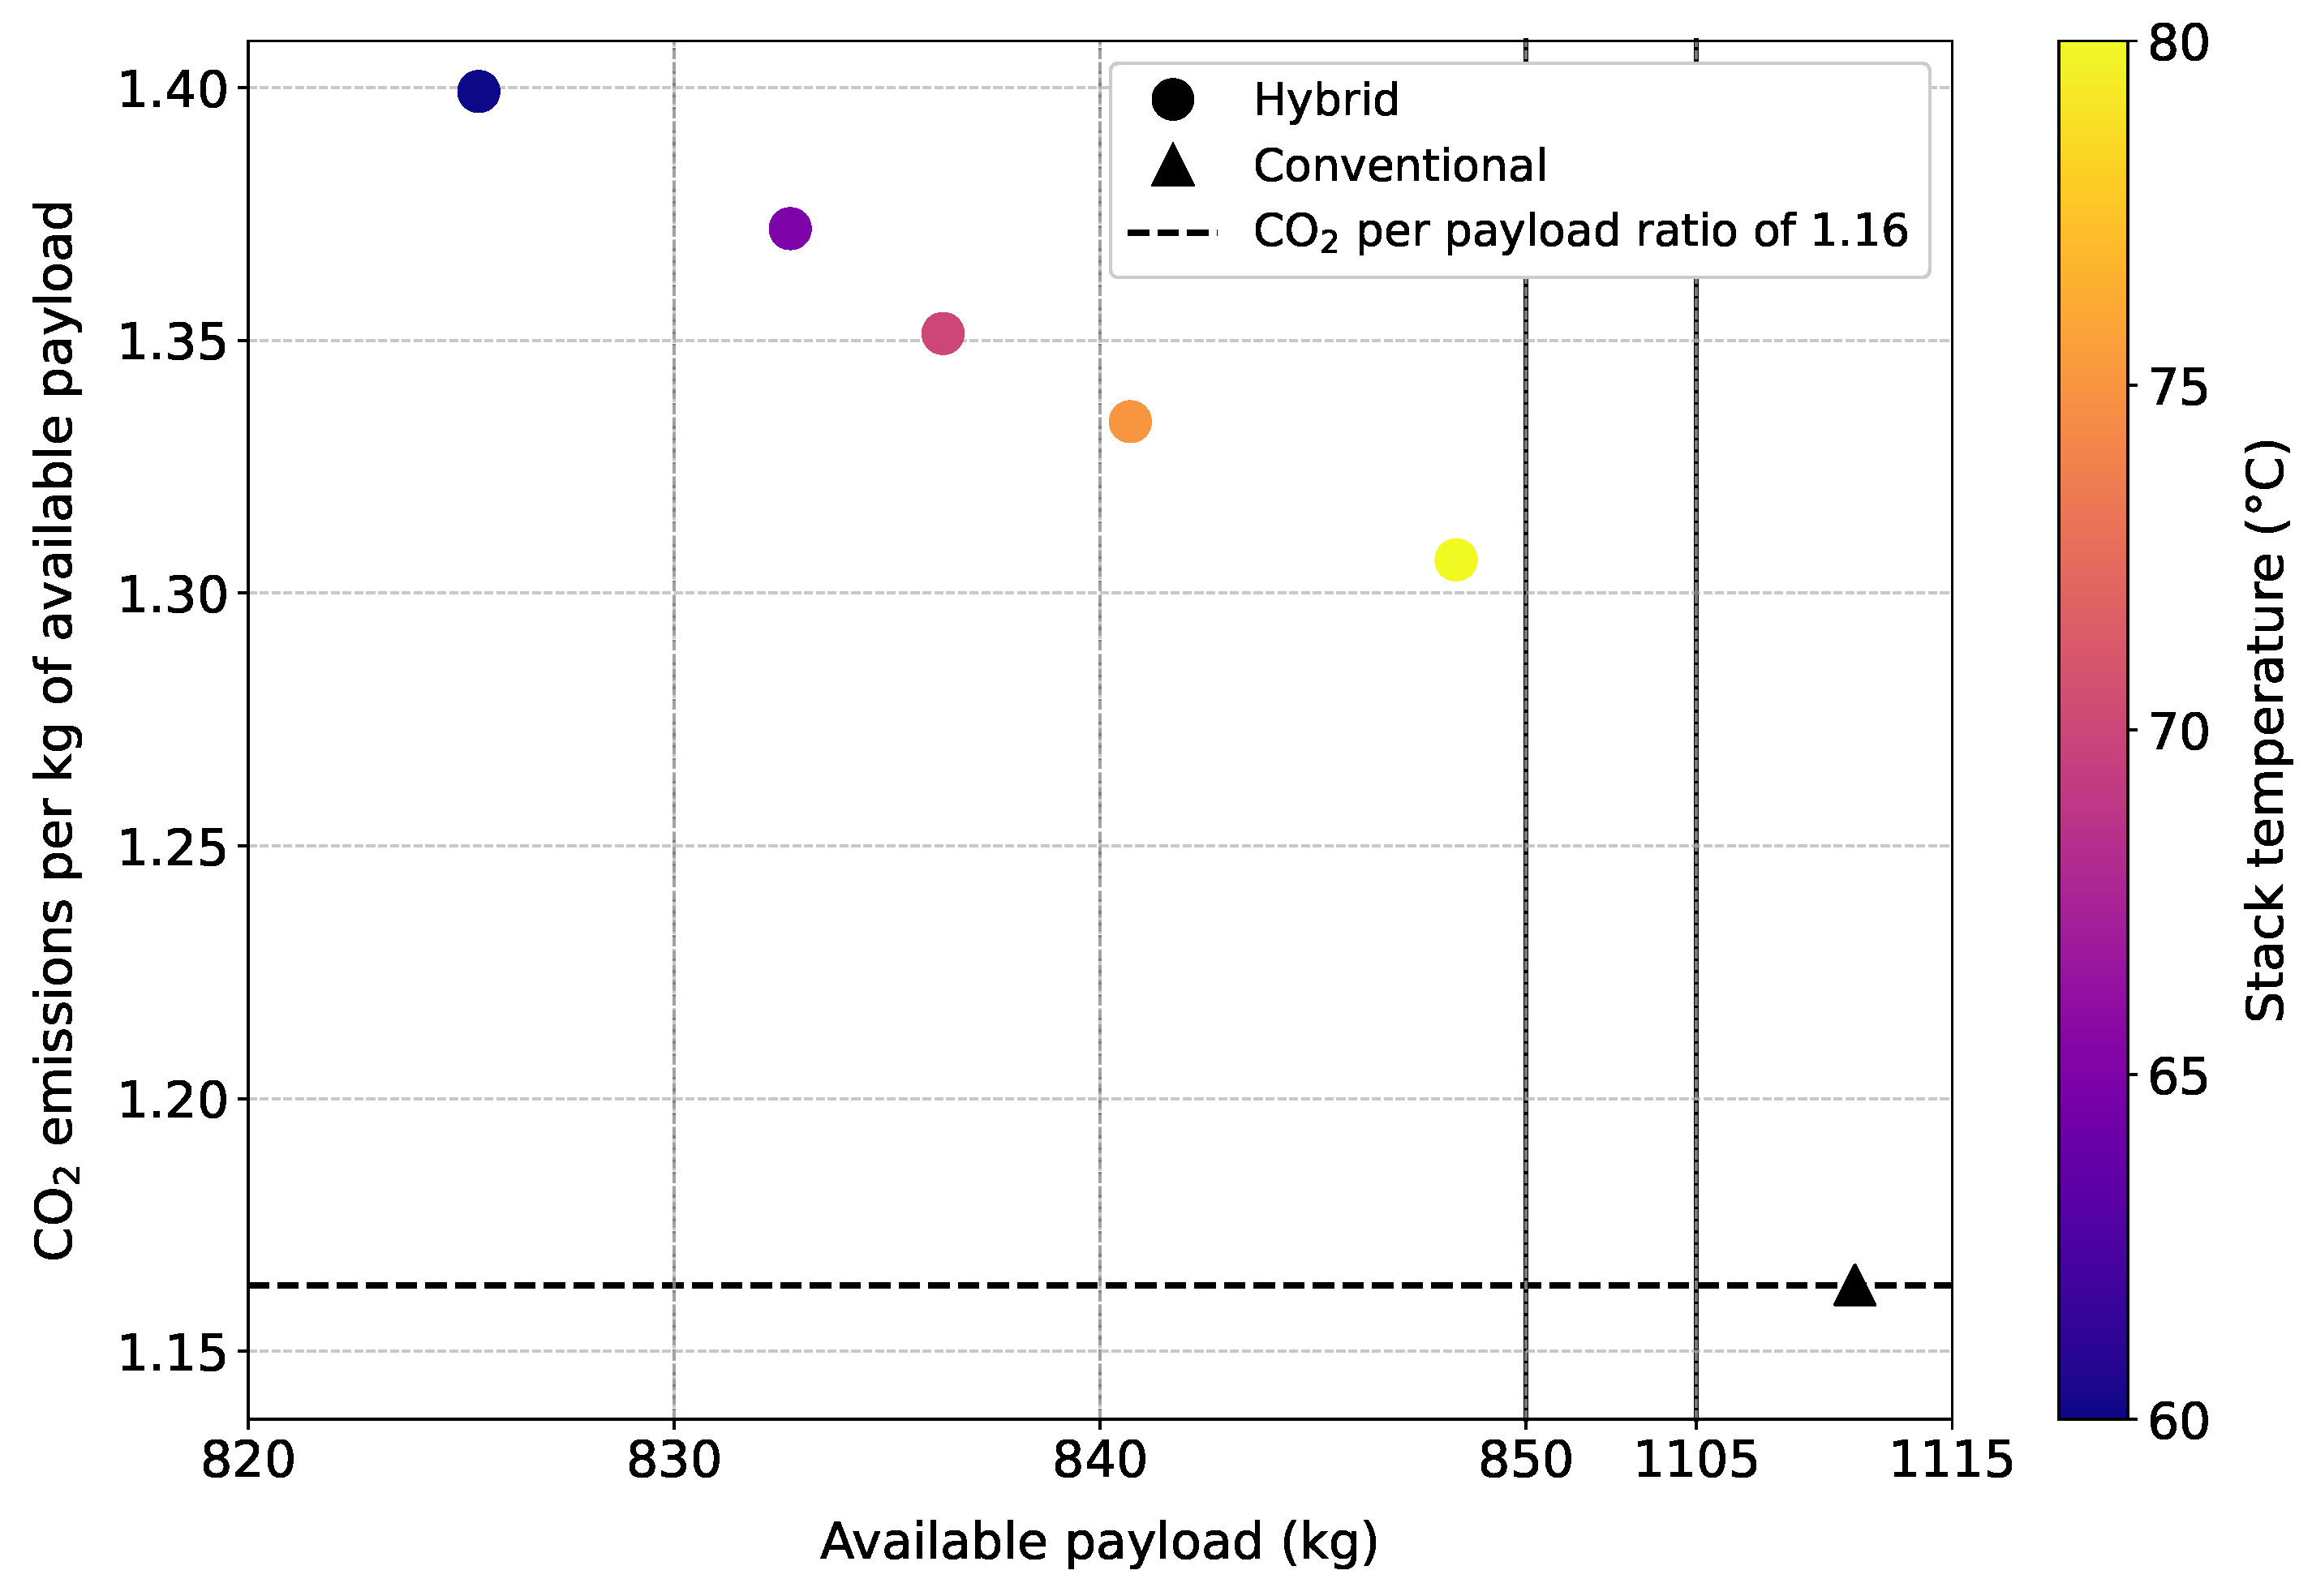
On the fuel cell system level, the choice of stack operating temperature also has a significant effect on the cooling demand. The stack temperature is assumed to vary between 60 °C (333.15 K) and 80 °C (353.15 K), remaining in the operating range for an LT-PEMFC. Furthermore, in this study, no modifications were made to the fuel cell stack model itself, and only the effect on the cooling requirements/heat balance is considered. However, in reality, the stack temperature does influence performance. Specifically, the increase from 60 °C to 80 °C enhances gas diffusivity and membrane conductivity, improving overall fuel cell efficiency. Conversely, at higher temperatures, reduced relative humidity can decrease membrane hydration, potentially limiting performance gains. This is important to consider when interpreting the results, and additional information on the effect of stack operating temperature on fuel cell performance can be found in [25]. Figure 12 shows the resulting emissions per kilogram of available payload for different fuel cell stack temperatures.
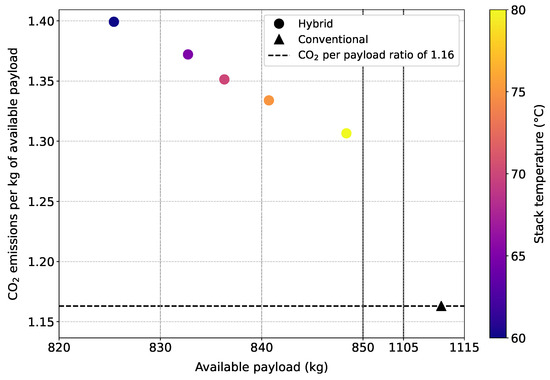
Figure 12.
Hybrid and conventional aircraft emissions per kilogram of available payload and available payload at different fuel cell stack temperatures.
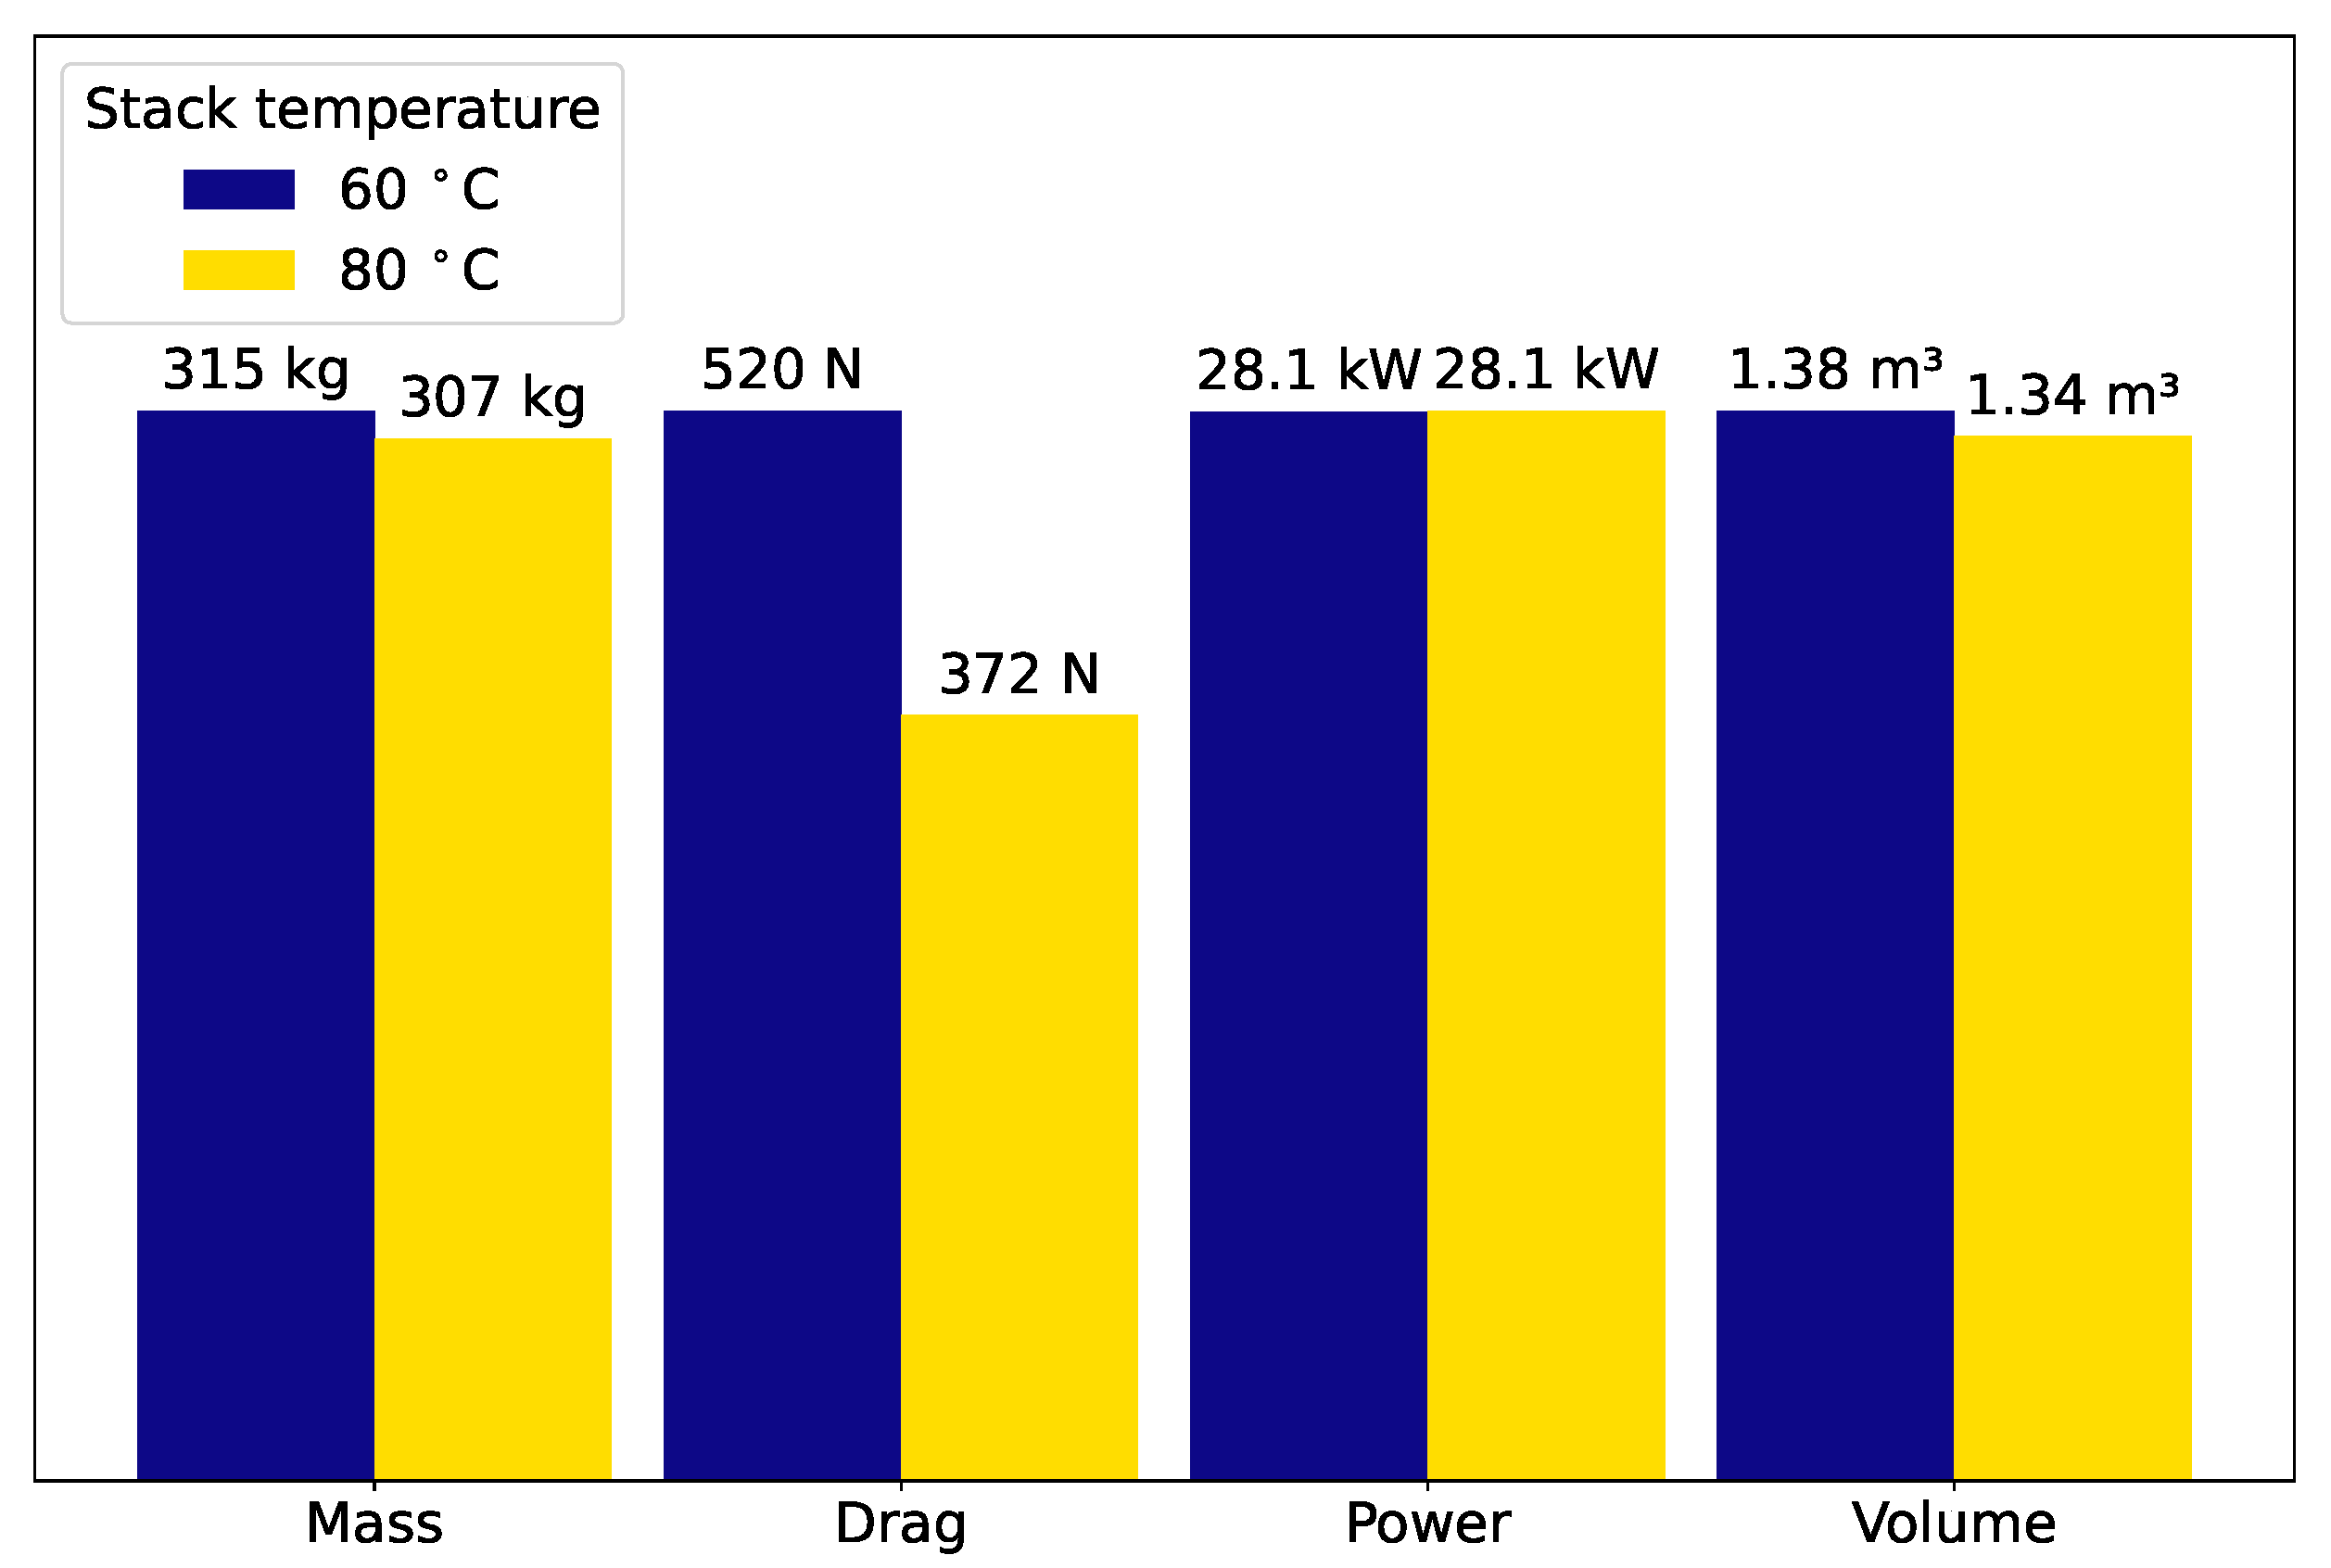
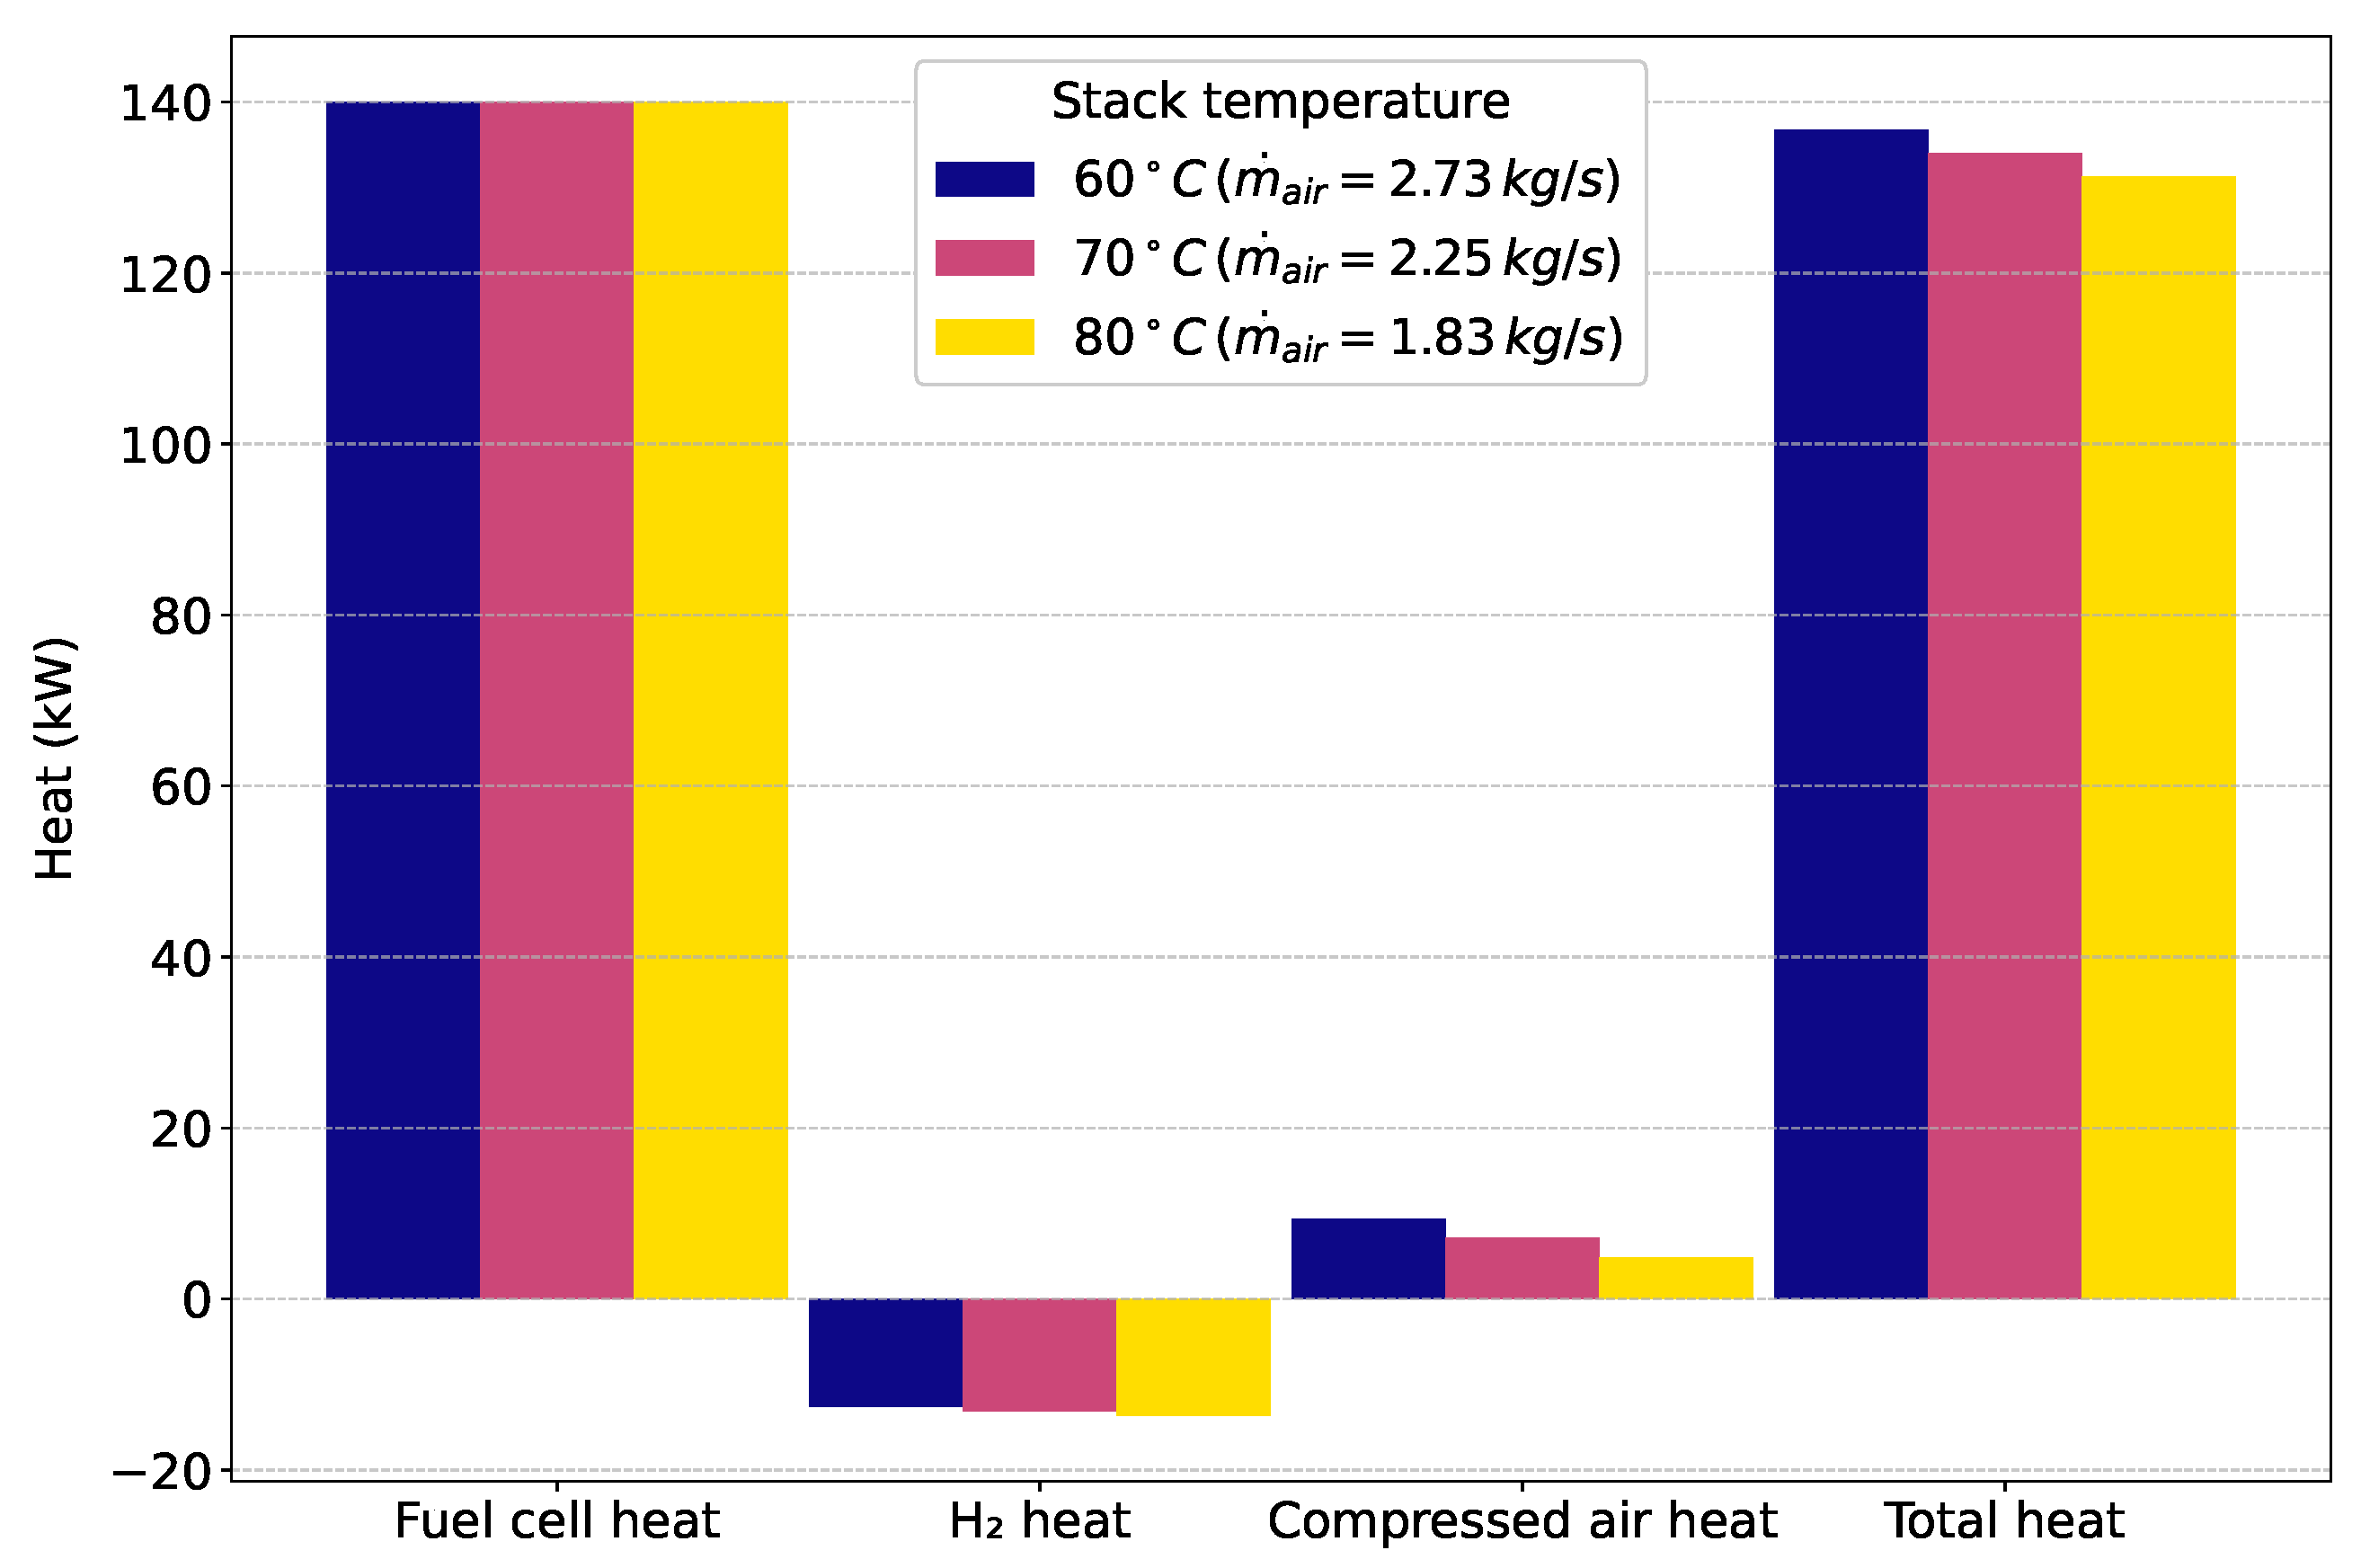
The comparison of the mass, drag, power, and volume of the fuel cell system (including the TMS) for a 60 °C and 80 °C LT-PEMFC is shown in Figure 13, and the overall heat balance for various stack temperatures is given in Figure 14. As can be seen, the higher stack temperatures are more advantageous. A lower stack temperature leads to a lower temperature difference between the eventual hot coolant and ambient air. This results in a higher required mass flow and consequent drag from the inlet, as can be noted in Figure 13. The difference in drag is the biggest relative change between the fuel cell temperatures and results in an increase in jet fuel by around 15 kg when comparing the 60 °C and 80 °C LT-PEMFC. In addition, the lower stack temperature leads to an overall greater heat to dissipate to the ambient air (of the order of 5 kW between 60 °C and 80 °C). This also contributes to the increase in required mass flow and leads to larger HEXs. All in all, however, the difference in the resulting payload and emissions is relatively low compared to the previously studied aircraft-level parameters.

Figure 13.
Fuel cell system mass, drag, power, and volume comparison between 60 °C and 80 °C stack temperatures.
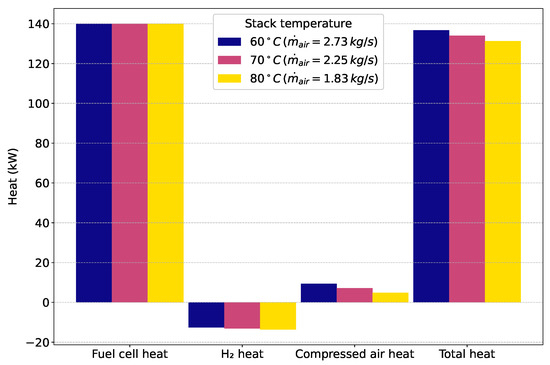
Figure 14.
Heat balance for various stack temperatures.
5.2.2. Entry Temperatures
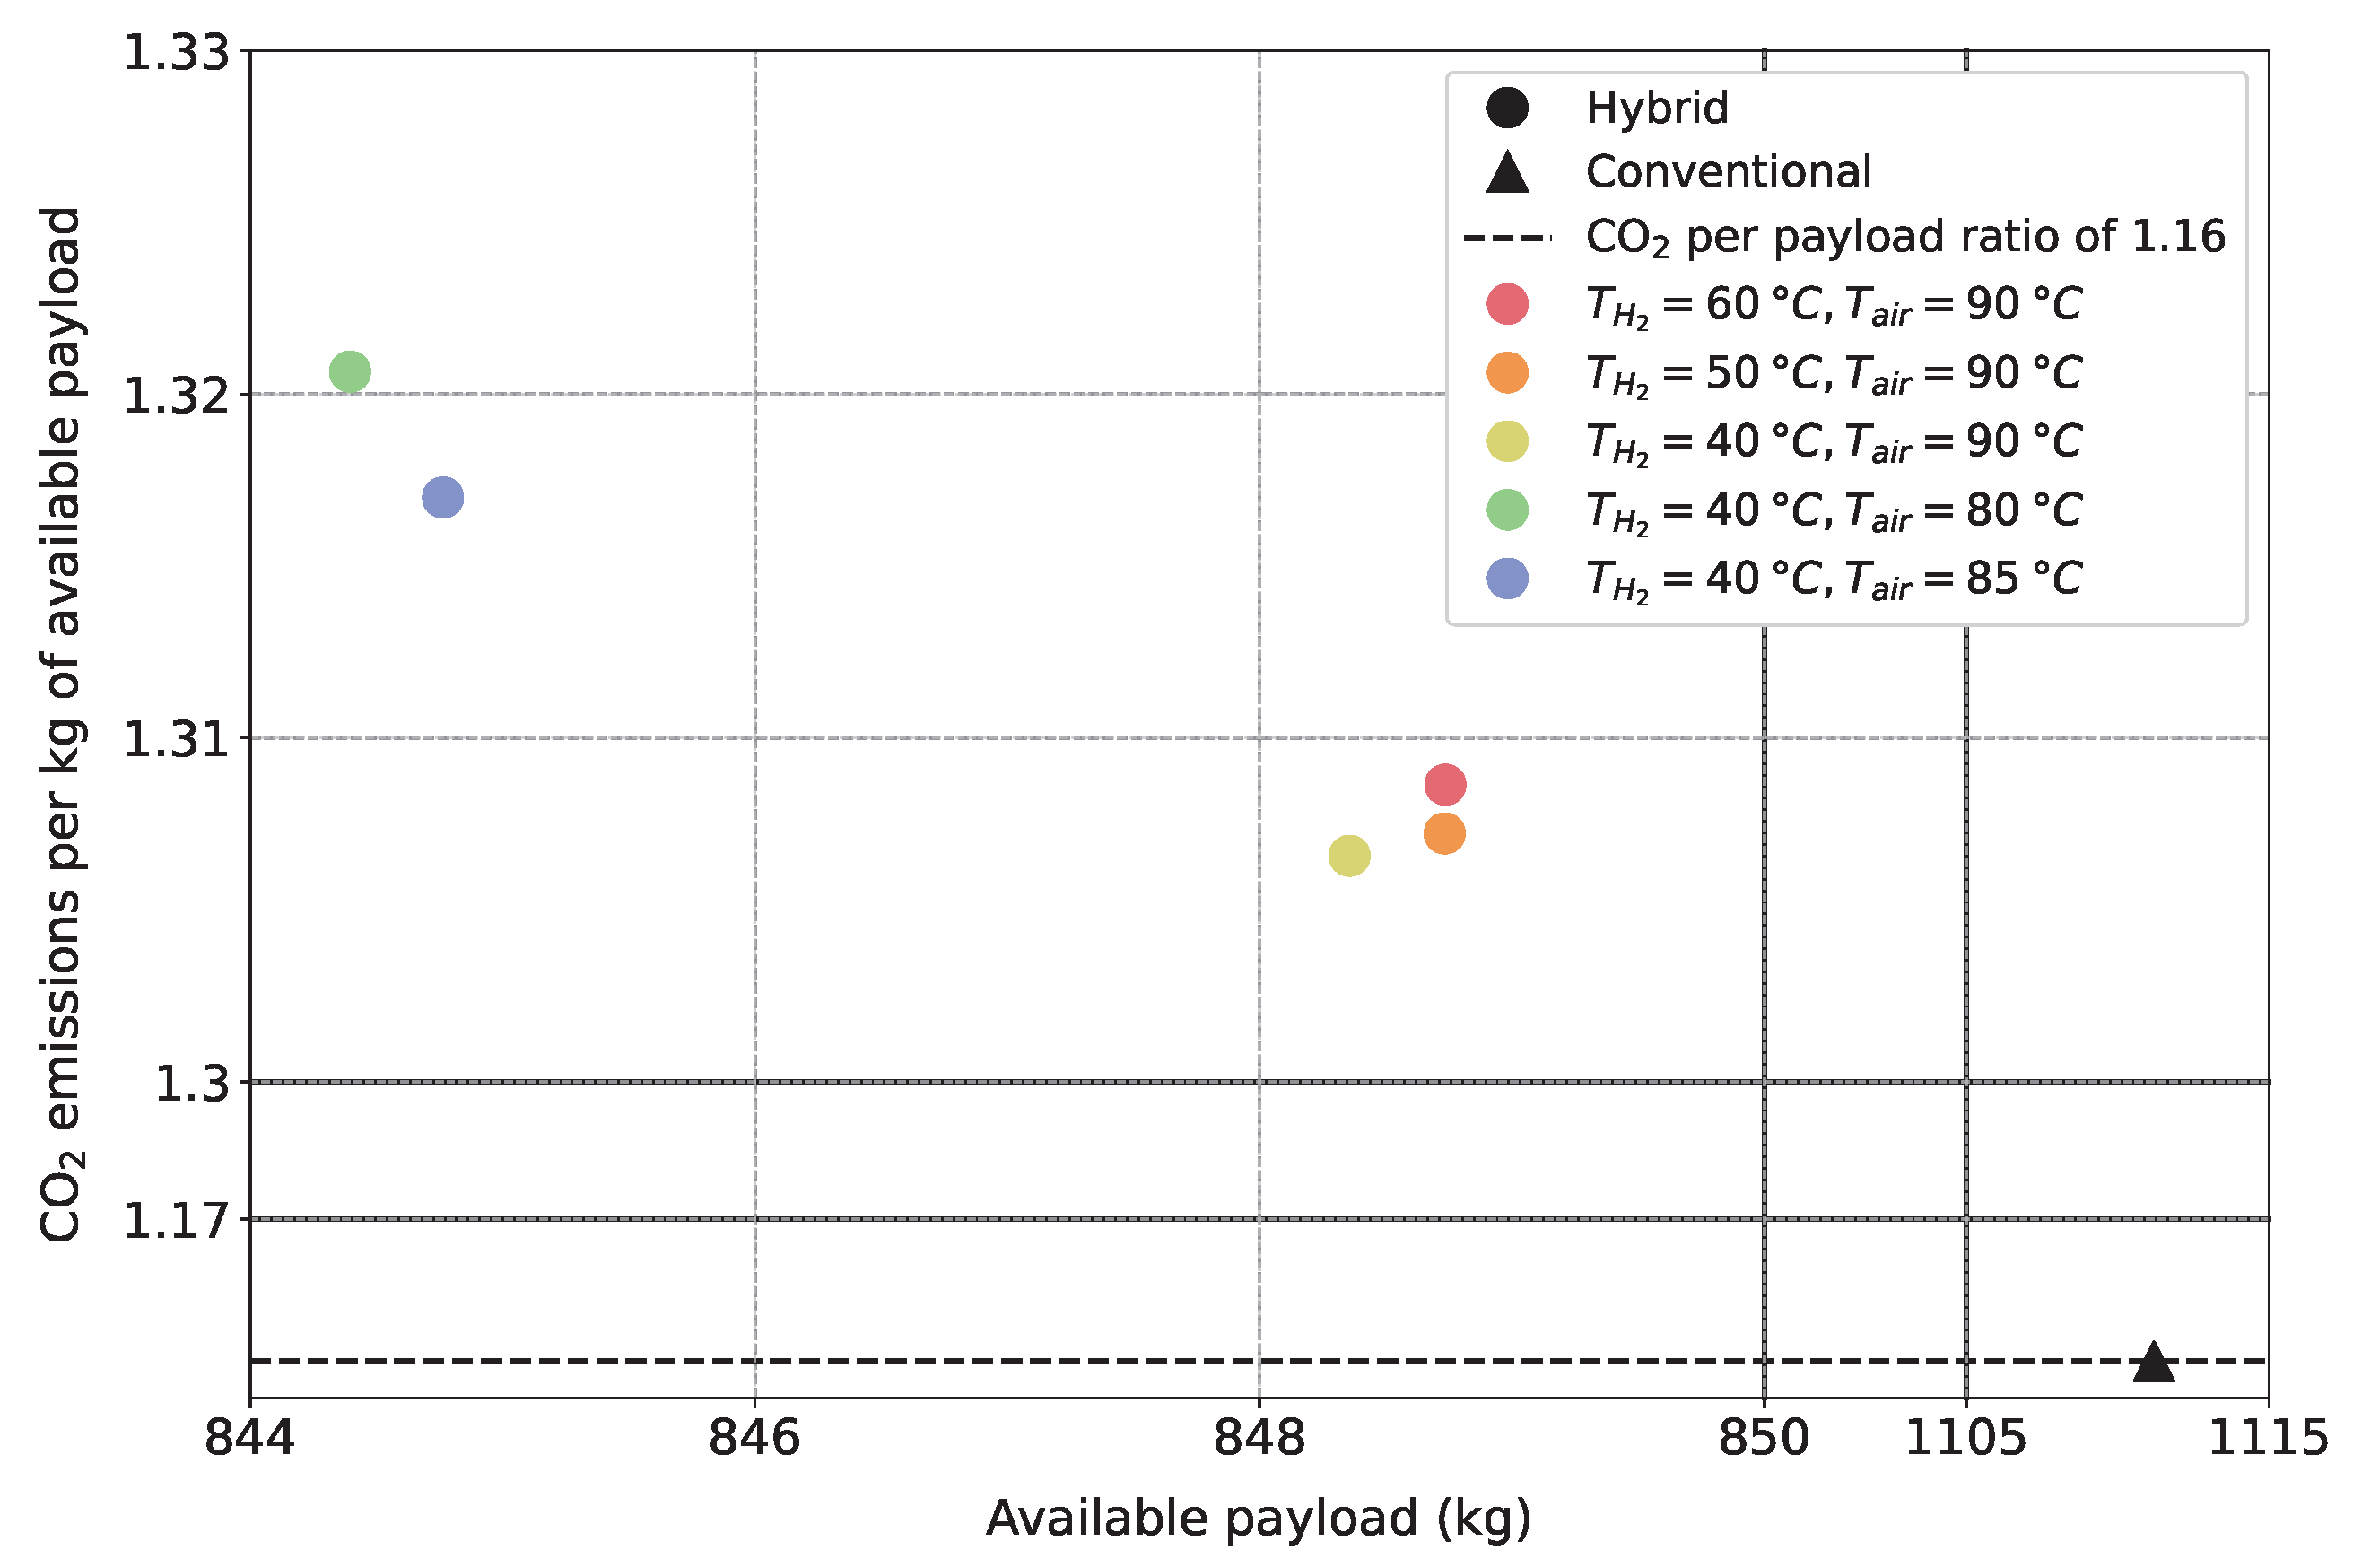
Along with the stack operating temperature, the chosen entry temperatures of both the hydrogen and air supplies also affect the cooling requirements. As can be seen from Figure 3, the liquid hydrogen needs to be first evaporated and then heated up before entering the stack. The hydrogen entry temperature into the stack directly affects the overall heat balance in the TMS, as shown in Figure 3. In this study, the hydrogen entry temperature is varied by −40 °C, −30 °C, and °C relative to the fuel cell temperature, i.e., it will enter the stack at 40 °C, 50 °C, and 60 °C. Meanwhile, the compressed air enters at 0 °C, +5 °C, and +10 °C relative to the fuel cell, i.e., it will enter the stack at 80 °C, 85 °C, and 90 °C. These entry temperatures are chosen because hydrogen is cooler than the fuel cell, whereas compressed air at the given cruise phase and stack pressure always exceeds the stack temperature. Allowing the supply temperatures to differ from the stack temperature simplifies the TMS design, as similarly explored in [26,27,28]. The resulting emissions per kilogram of available payload is shown in Figure 15.
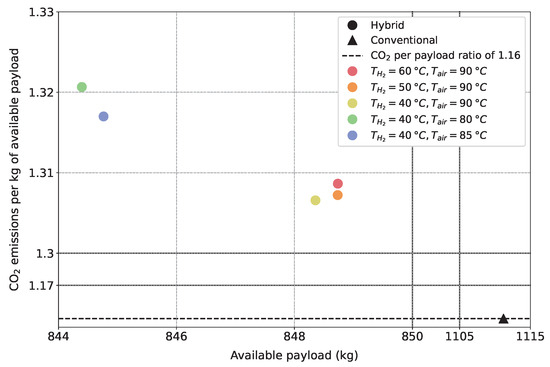
Figure 15.
Hybrid and conventional aircraft emissions per kilogram of available payload and available payload for different hydrogen and air supply entry temperatures.
Overall, compared to the previous studies, the variations here are relatively low, with around 5 kg of payload separating all tested entry temperature combinations. Furthermore, there is a maximum difference of around 3 kW between the configuration resulting in the lowest total heat in the TMS ( = 60 °C, and = 90 °C) and the one resulting in the highest total heat ( = 40 °C and = 80 °C). The most significant relative difference in emissions and payload, however, occurs when the compressed air enters at temperatures higher than the stack temperature. Since the compressed air is typically hotter than the fuel cell stack, allowing a higher air entry temperature reduces the amount of additional heat that must be dissipated by the TMS. For the hydrogen, variations in entry temperature have a minimal impact on the overall TMS. This can be explained as follows: a higher hydrogen entry temperature reduces the amount of heat that needs to be dissipated by the primary (ambient air) HEX, as more of the fuel cell and/or compressed air heat is utilized to raise the hydrogen temperature to near the stack level. Consequently, this reduces the burden on the primary HEX, leading to a lower mass for this component. However, to accommodate the increased heat transfer to the hydrogen, a larger HEX between the hydrogen and coolant is required, resulting in a higher mass for this secondary HEX. These opposing effects tend to balance each other out, leading to a negligible overall impact on the TMS.
5.3. TMS Component Level
5.3.1. Coolant
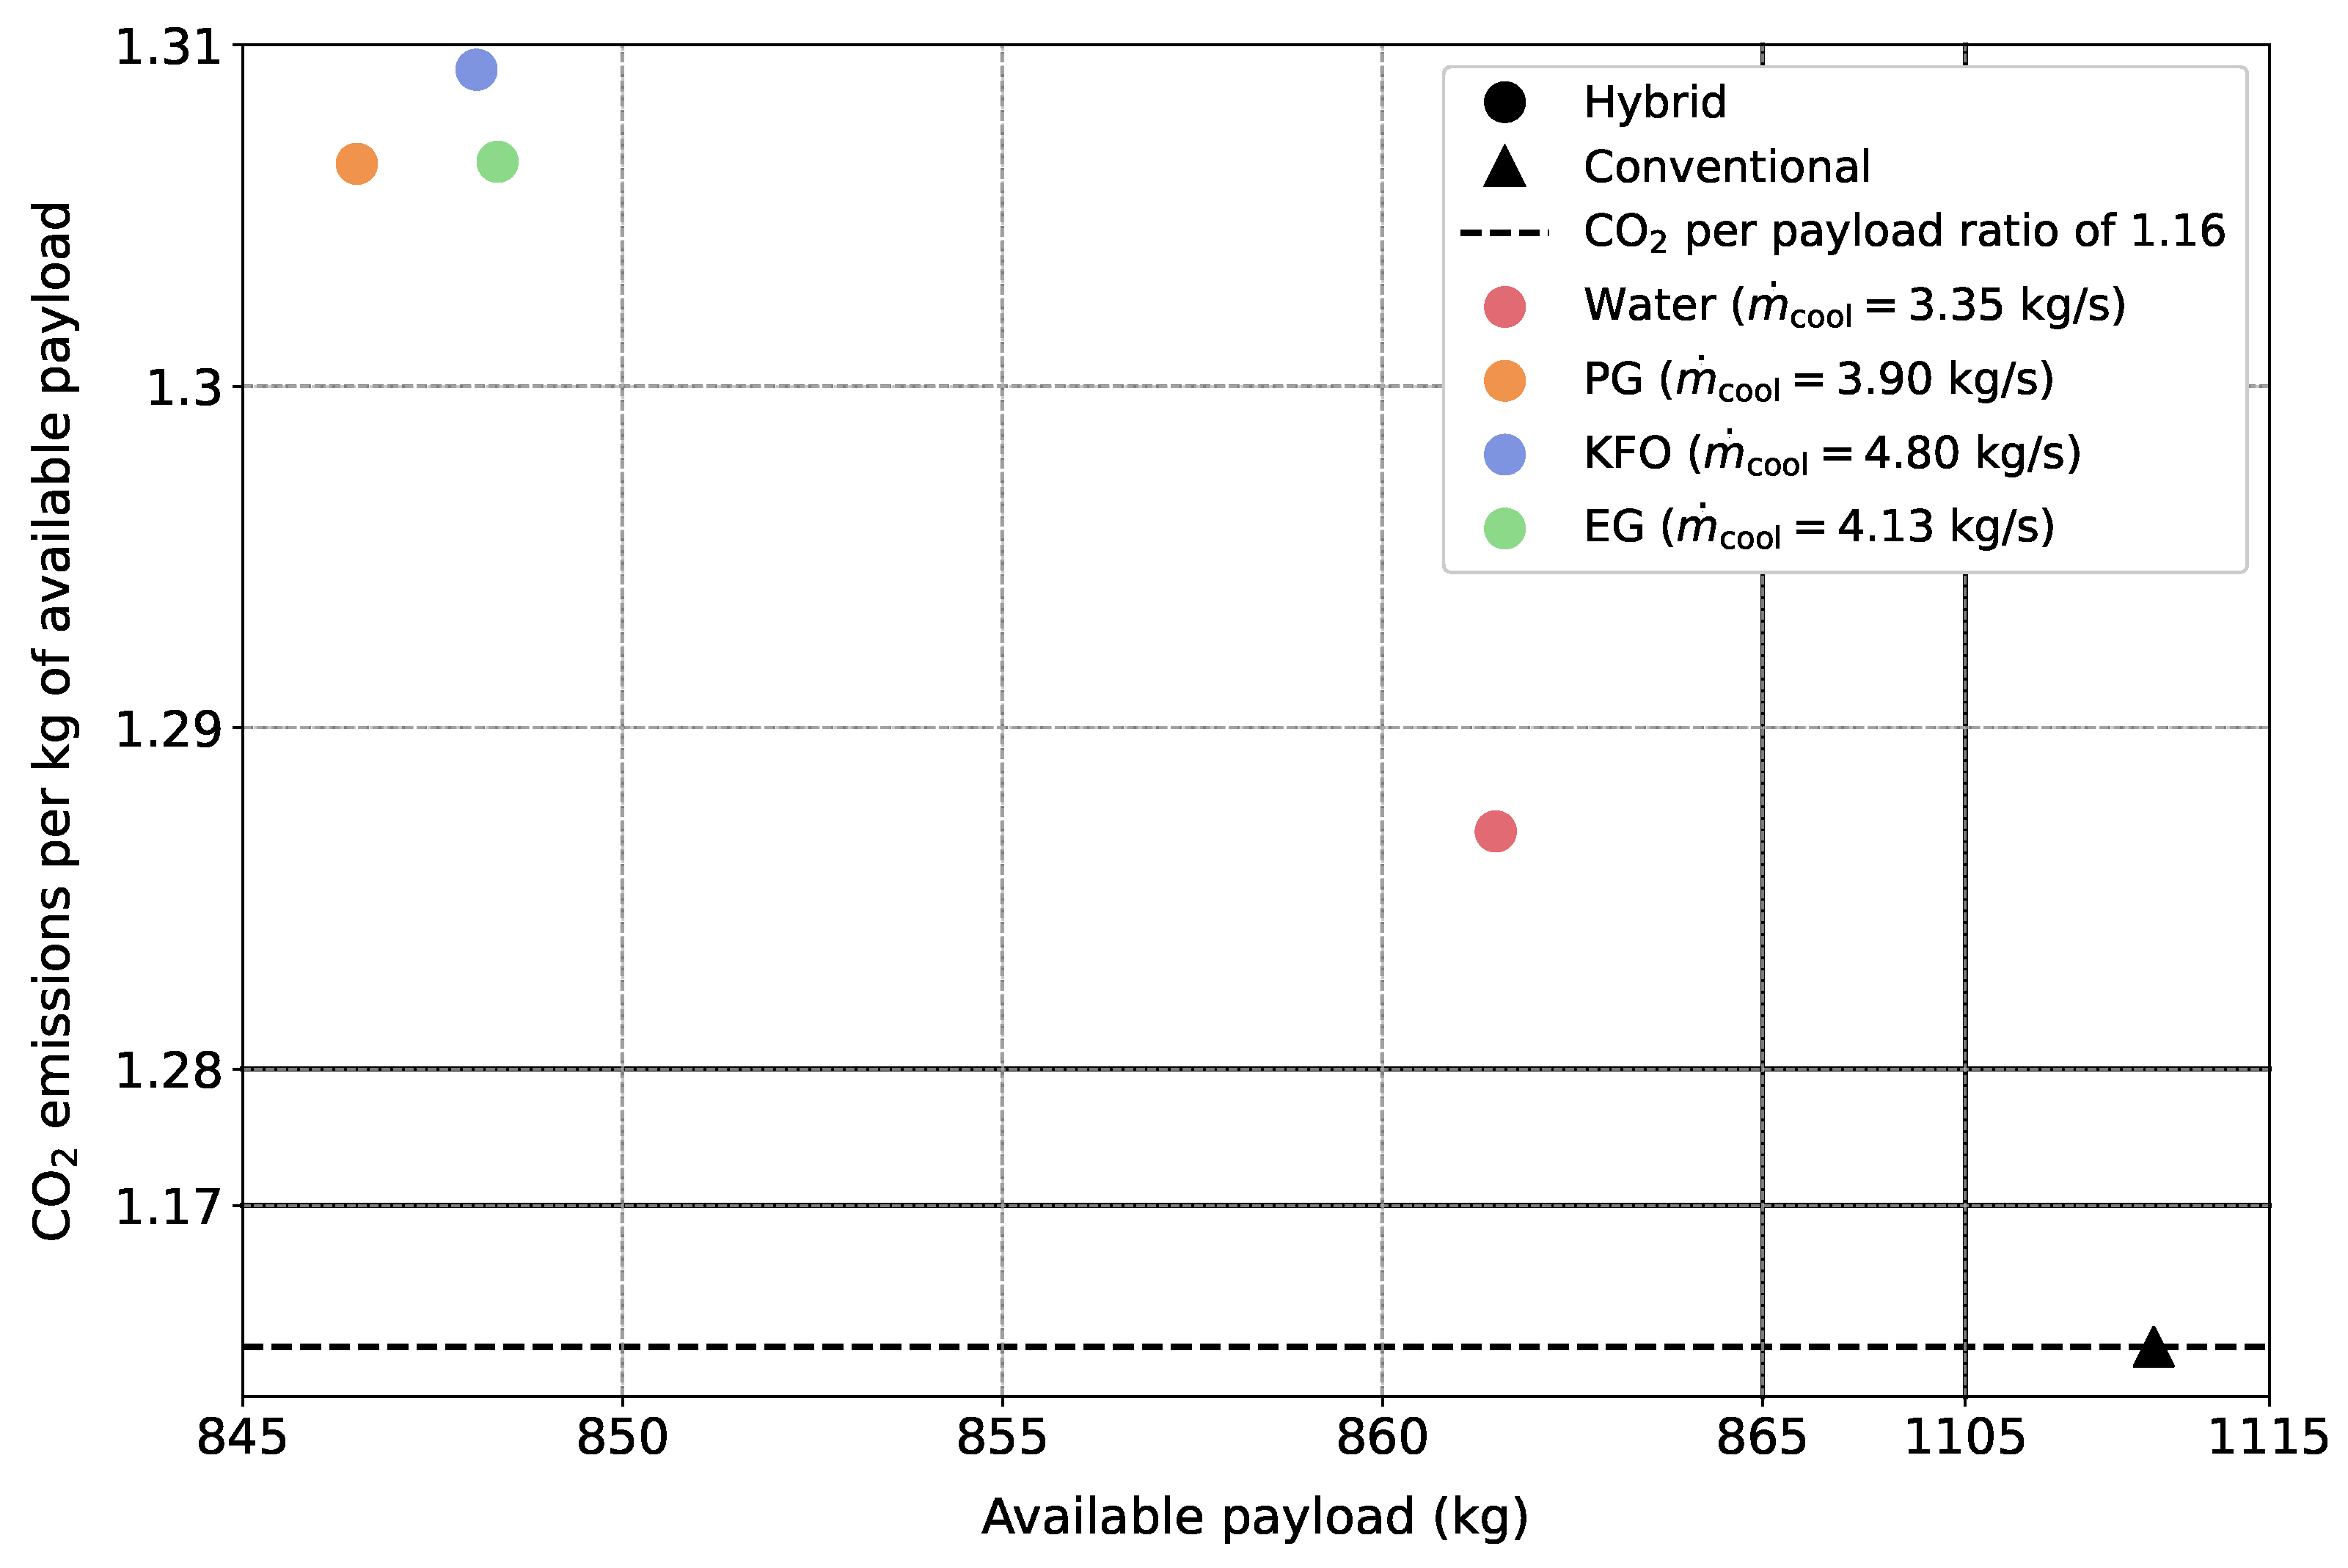
The initial study considers a Ethylene Glycol (EG)/water mixture as the coolant, but alternative coolants such as pure water, propylene glycol (PG) (), and potassium formate (KFO) () can also be analyzed. Each coolant, for example, has a distinct density, thermal conductivity, specific heat capacity, and viscosity, which influence cooling effectiveness, pump power requirements, and HEX performance. The properties of the various fluids are given in Table 8. Figure 16 provides the resulting emissions per kilogram of available payload when using different coolants. By knowing the fuel cell heat and imposed coolant temperature difference of 10 °C, see Appendix B, the required coolant mass flow is deduced and varies based on the specific heat capacity of the fluid. As shown, the emissions per kilogram of available payload are correlated with mass flow, with higher coolant mass flows corresponding to greater ratios.
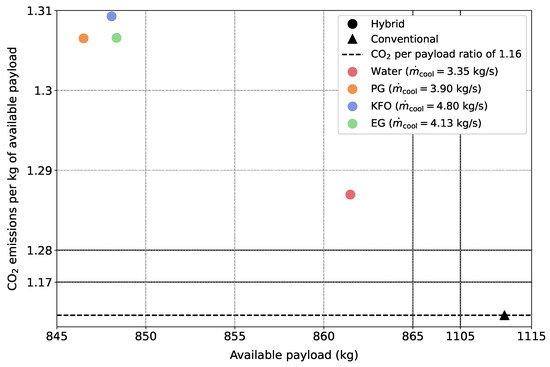
Figure 16.
Hybrid and conventional aircraft emissions per kilogram of available payload and available payload for different TMS coolants.
Water is the most commonly used cooling medium for liquid-cooled LT-PEMFCs. In this study, water is shown to provide the highest available payload and requires the least pumping power (approximately 500W less than other coolants), as well as allowing for smaller HEXs due to its high thermal conductivity. In the case where high-temperature PEMFCs are used, however, water is unsuitable, as the elevated stack temperatures can cause boiling. Additionally, its relatively high freezing point can be problematic in environments where indirect contact with the cryogenic hydrogen (via the HEX) may lead to freezing. To address these limitations, water-based mixtures such as those listed in Table 8 are typically used to extend the operational temperature range. These alternatives are better suited for harsh conditions, and many commercial coolants include corrosion inhibitors [29] in comparison to water.
Table 8.
Comparison of different properties for typical TMS coolants [29,30,31]. Properties are given regarding 20 °C and a pressure of 1 atm.
Table 8.
Comparison of different properties for typical TMS coolants [29,30,31]. Properties are given regarding 20 °C and a pressure of 1 atm.
| Coolant | (kJ/kg/K) | (kg/ m3) | (W/m/K) | (K) | (K) |
|---|---|---|---|---|---|
| Water | 9.98 × 10² | 5.98 × 10⁻¹ | |||
| EG () | 1.06 × 10³ | 3.89 × 10⁻¹ | |||
| PG () | 1.04 × 10³ | 3.59 × 10⁻¹ | |||
| KFO () | 1.26 × 10³ | 5.09 × 10⁻¹ |
5.3.2. HEX Geometry
The geometry of the HEX plays a crucial role in heat transfer efficiency, affecting the heat transfer coefficient, pressure drop, and overall TMS sizing. In this study, a plate-fin HEX with offset-strip fins is considered, but key geometric characteristics such as surface density, plate spacing, fin thickness, and hydraulic diameter were varied according to the pre-existing core geometries provided in [11]. The considered geometries or surfaces are given in Table 9, and additional information on the terms is provided in Appendix D. The emissions per kilogram of available payload are shown in Figure 17.
Table 9.
Offset-strip fins geometrical parameters from [11].
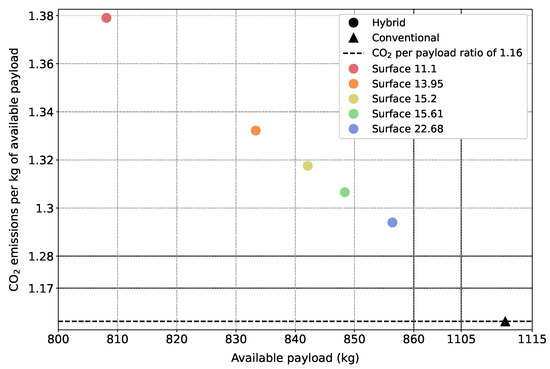
Figure 17.
Hybrid and conventional aircraft emissions per kilogram of available payload and available payload for different HEX geometries.
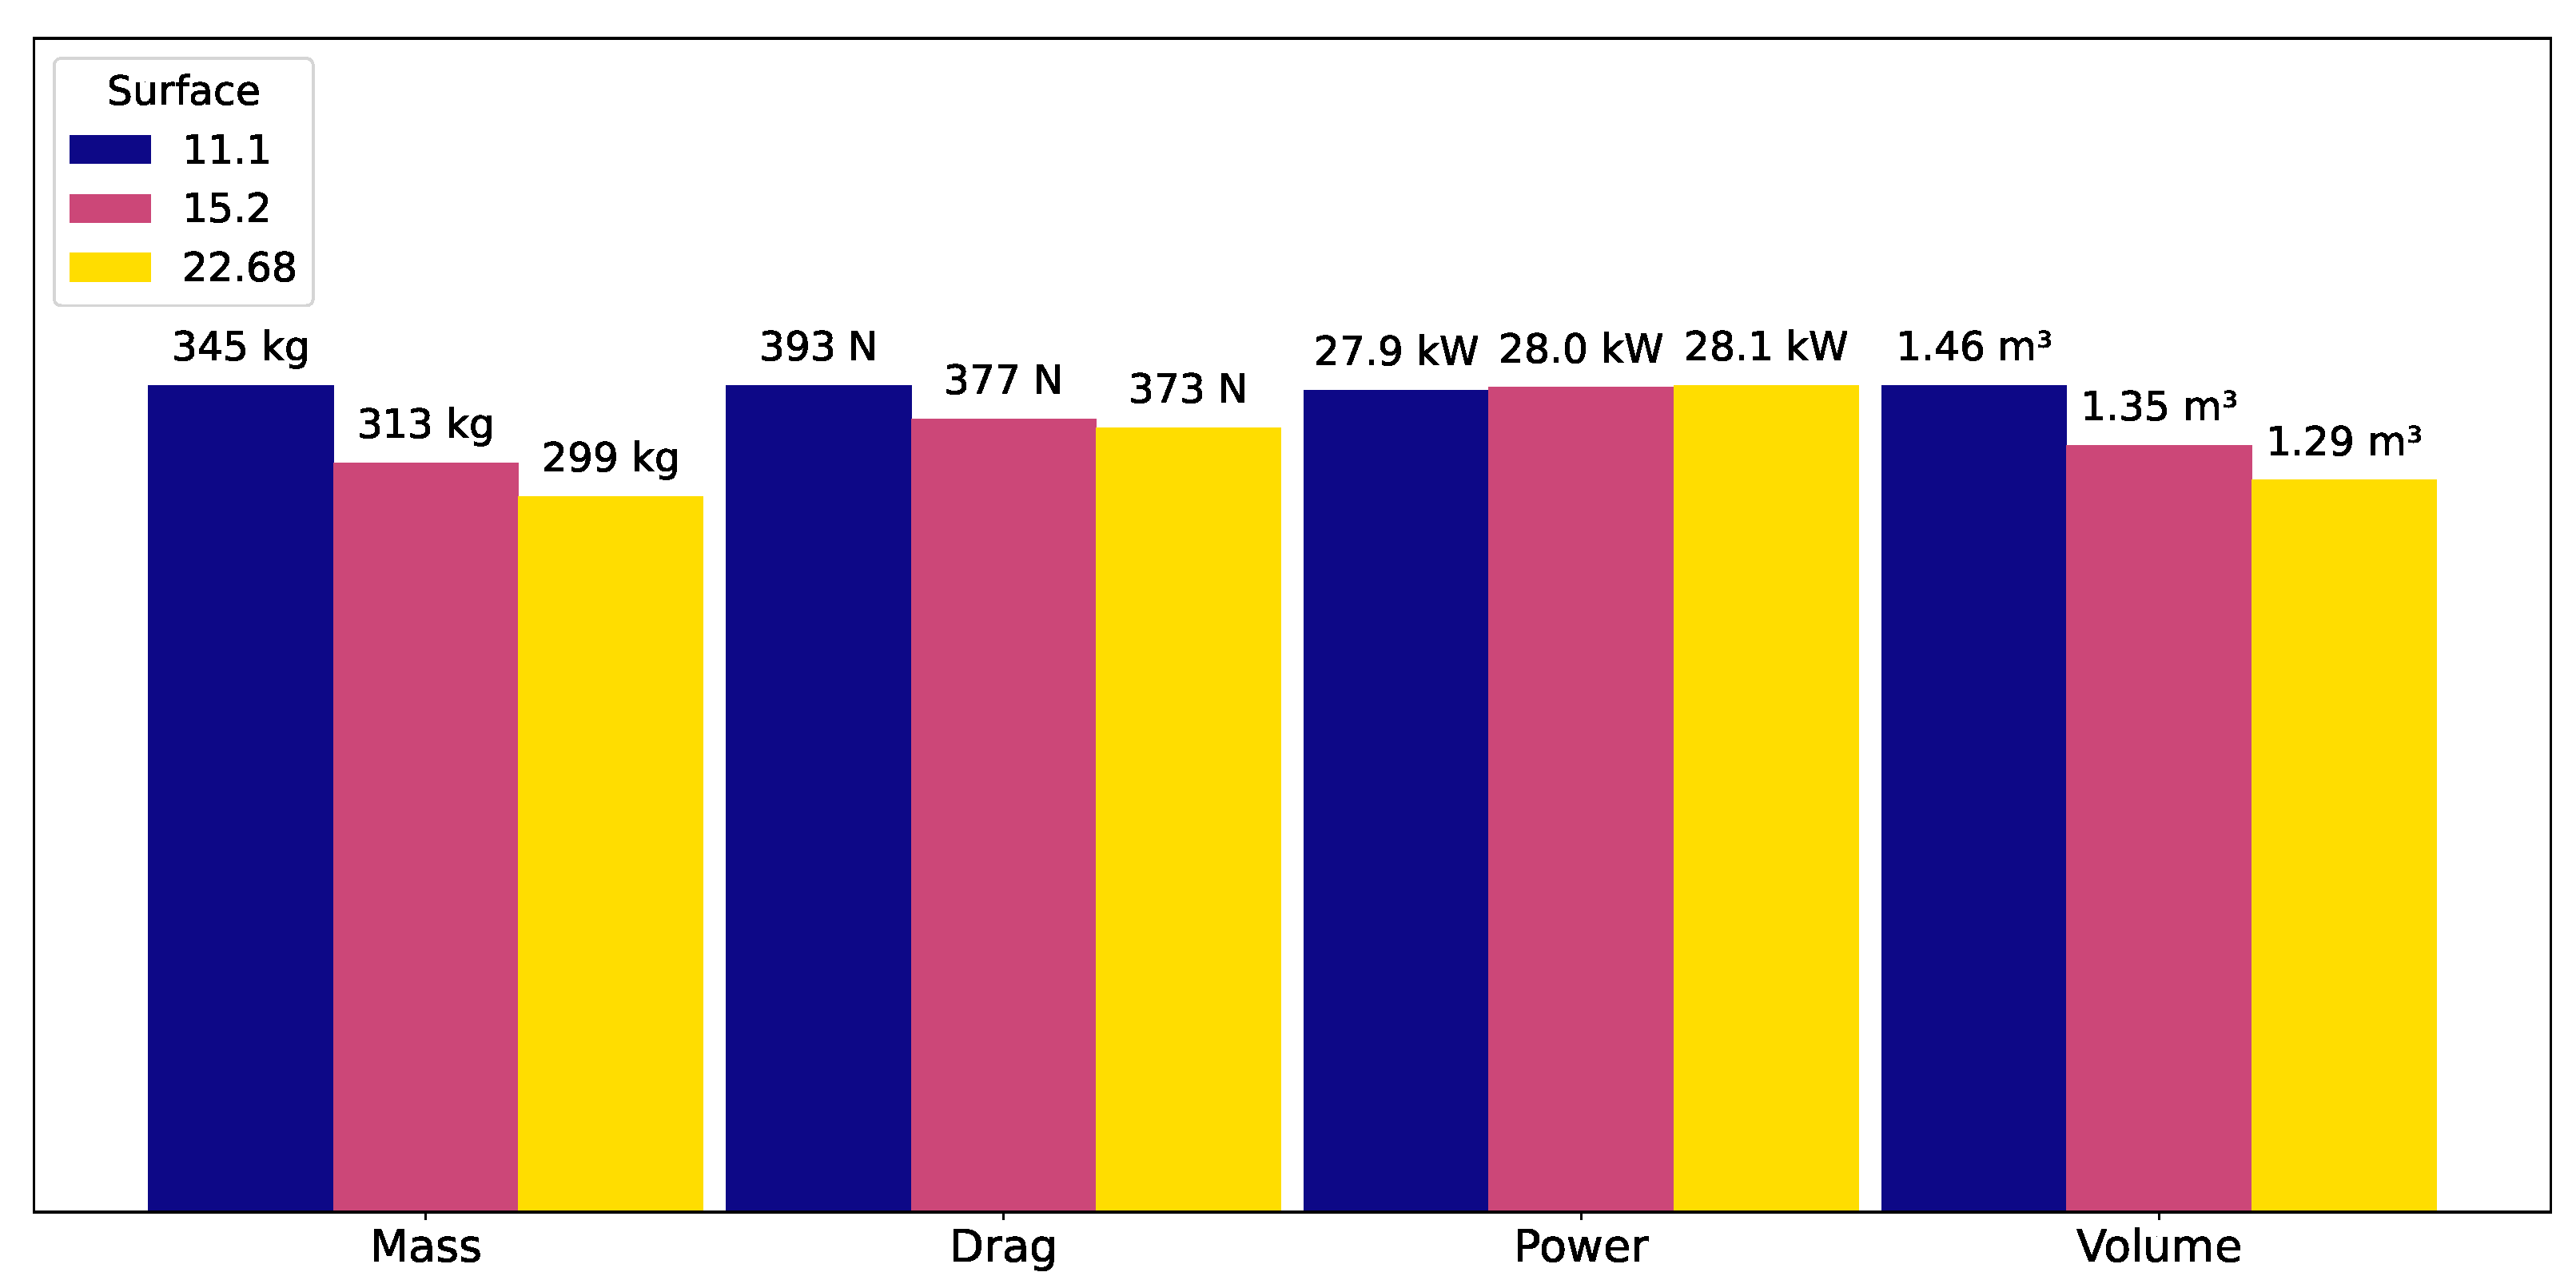
Overall, surface 22.68 demonstrates the best performance in reducing emissions and increasing payload. Figure 18 provides a detailed comparison of the mass, drag, power, and volume of the fuel cell system for three different surface geometries. As shown, surface 11.1 exhibits the highest mass, drag, and volume, and the power consumption is slightly higher for surface 22.68. These results can be explained by analyzing the geometrical parameters in Table 9. HEXs with higher area density () and a greater fin area-to-total surface area ratio () are expected to enhance heat transfer. Specifically, surface 22.68 is the most effective for heat transfer due to its high area density, which reduces HEX volume and the consequent mass. However, this configuration also causes the highest pressure drop because of its small hydraulic diameter (), leading to increased pumping power and overall power consumption. Conversely, surface 11.1 experiences the lowest pressure drop per unit area due to its larger hydraulic diameter, which reduces flow resistance. Nevertheless, its lower fin area-to-total surface area ratio () results in a longer HEX, which in turn would increase the overall pressure drop. Despite this, the tradeoff between a small hydraulic diameter and a longer HEX still results in a lower overall pressure drop for surface 11.1, as shown in Figure 18. Regarding the primary (ambient air) HEX, surface 22.68 results in a higher exiting air velocity due to its smaller hydraulic diameter and higher fin frequency, which increase resistance and accelerate airflow through narrower channels. This higher velocity reduces overall drag when the airflow is re-injected into the ambient environment. Lastly, it is important to note that although surface 22.68 performs the best overall among the geometries studied, manufacturing HEXs with small hydraulic diameters and high fin densities involves increased complexity and cost.
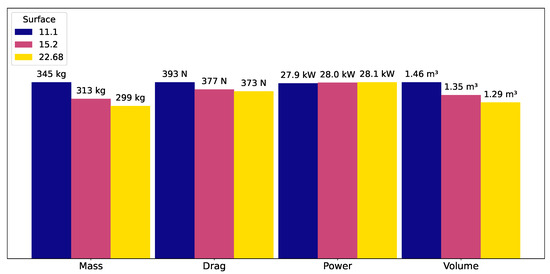
Figure 18.
Fuel cell system mass, drag, power, and volume comparison between three different HEX geometries.
6. Synthesis
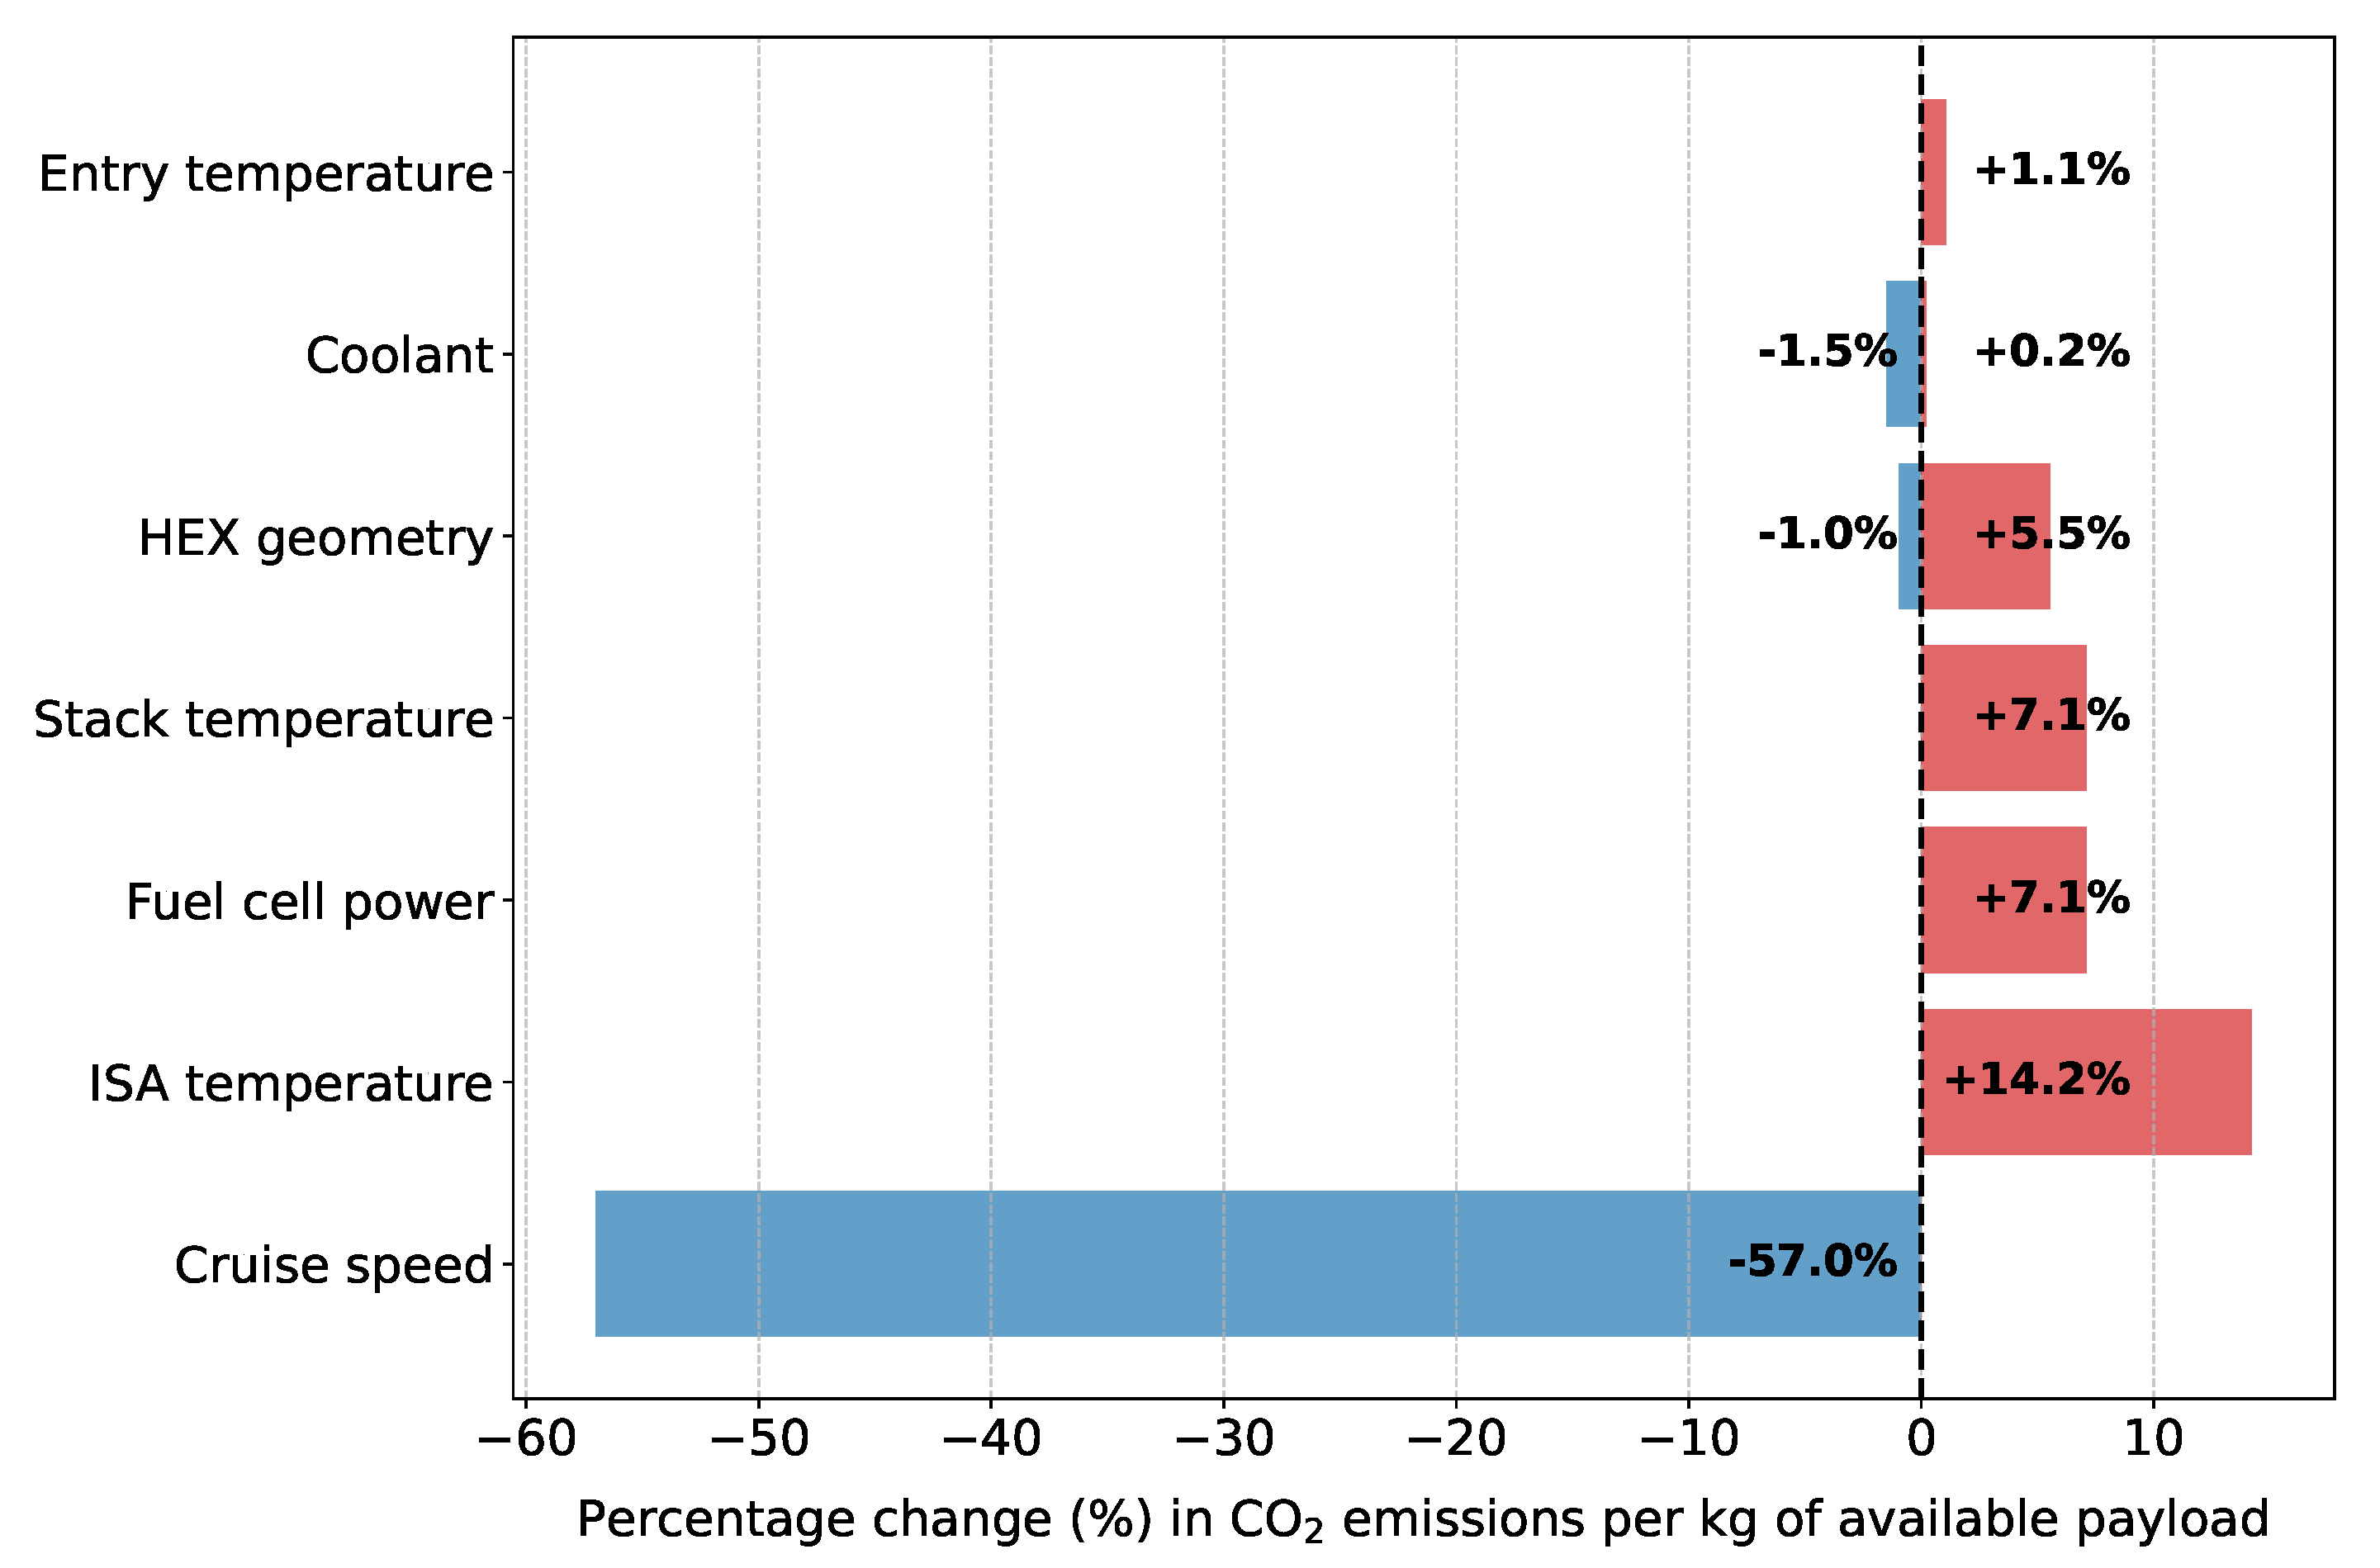
With reference to the initial parameters for the hybrid aircraft in Table 3, the tornado charts in Figure 19 and Figure 20 illustrate the sensitivity to variations in the studied parameters on both outputs: the emissions per kilogram of available payload and available payload. By comparing each parameter against the reference case, the charts provide insight into the most influential factors affecting the performance of the hybrid aircraft. Additionally, this analysis helps assess whether the initial assumptions for the parameters were the most optimized or if alternative configurations could yield better overall performance. A summary of the key takeaways is provided below.

Figure 19.
Tornado diagram showing the relative percentage change in emissions per kilogram of available payload for the studied parameters compared to the reference case.
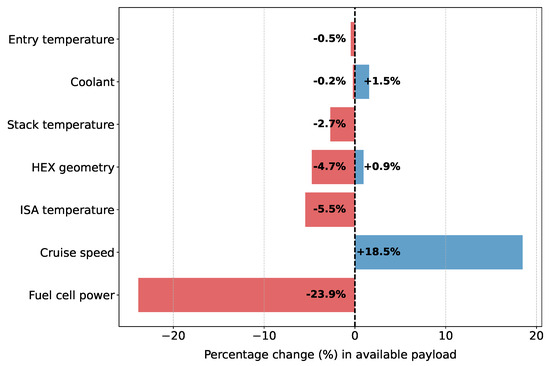
Figure 20.
Tornado diagram showing the relative percentage change in available payload for the studied parameters compared to the reference case.
- Cruise speed: This is the most influential parameter overall, with significant potential reductions in emissions per kilogram of available payload and gains in payload when decreasing the cruise speed;
- Fuel cell power: The most influential parameter on the available payload, whereas the impact on emissions per kilogram of available payload is less significant;
- ISA temperature: This has a significant effect on the emissions per kilogram of available payload and a lower effect on available payload. Higher ISA temperature differences lead to both an increase in the emissions per kilogram of available payload and a decrease in available payload;
- Stack temperature: This has an overall moderate impact on both outputs, with higher stack temperatures leading to increased performance;
- Entry temperatures: This is the least influential parameter; very marginal differences can be observed regarding the outputs;
- Coolant: This has an overall minimal impact on both outputs, with water being only slightly more optimal;
- HEX geometry: This has an overall moderate impact on both outputs, with surface 22.68 being the best-suited geometry.
Based on the tornado charts presented above, a refined study can be conducted by selecting only the parameters that yield the best performance, with the exception of cruise speed. While cruise speed is the most influential parameter, to ensure a fair comparison under the same mission profile as the conventional aircraft, a maximum cruise speed of 210 kts is maintained. The parameters selected for this final study are summarized in Table 10.
Table 10.
Reference hybrid aircraft final assumptions. * ISA stands for International Standard Atmosphere. The ISA difference refers to the deviation in the actual atmospheric temperature considered from that defined by the ISA model. † Refer to Table 9.
The resulting emissions per kilogram of available payload and the available payload are given in Figure 21 for both the initial and final study. As can be seen, the final study allows for some improvement in both outputs; however, it is still not comparable to the conventional aircraft.
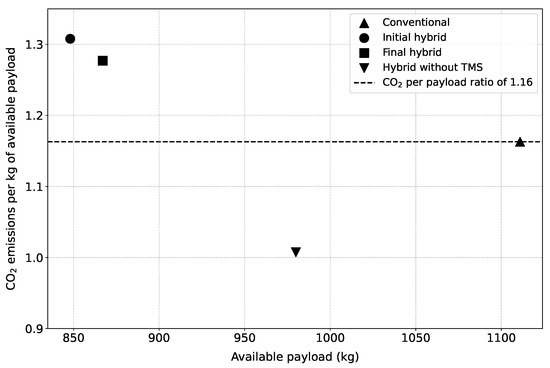
Figure 21.
Hybrid and conventional aircraft emissions per kilogram of available payload and available payload for different studies.
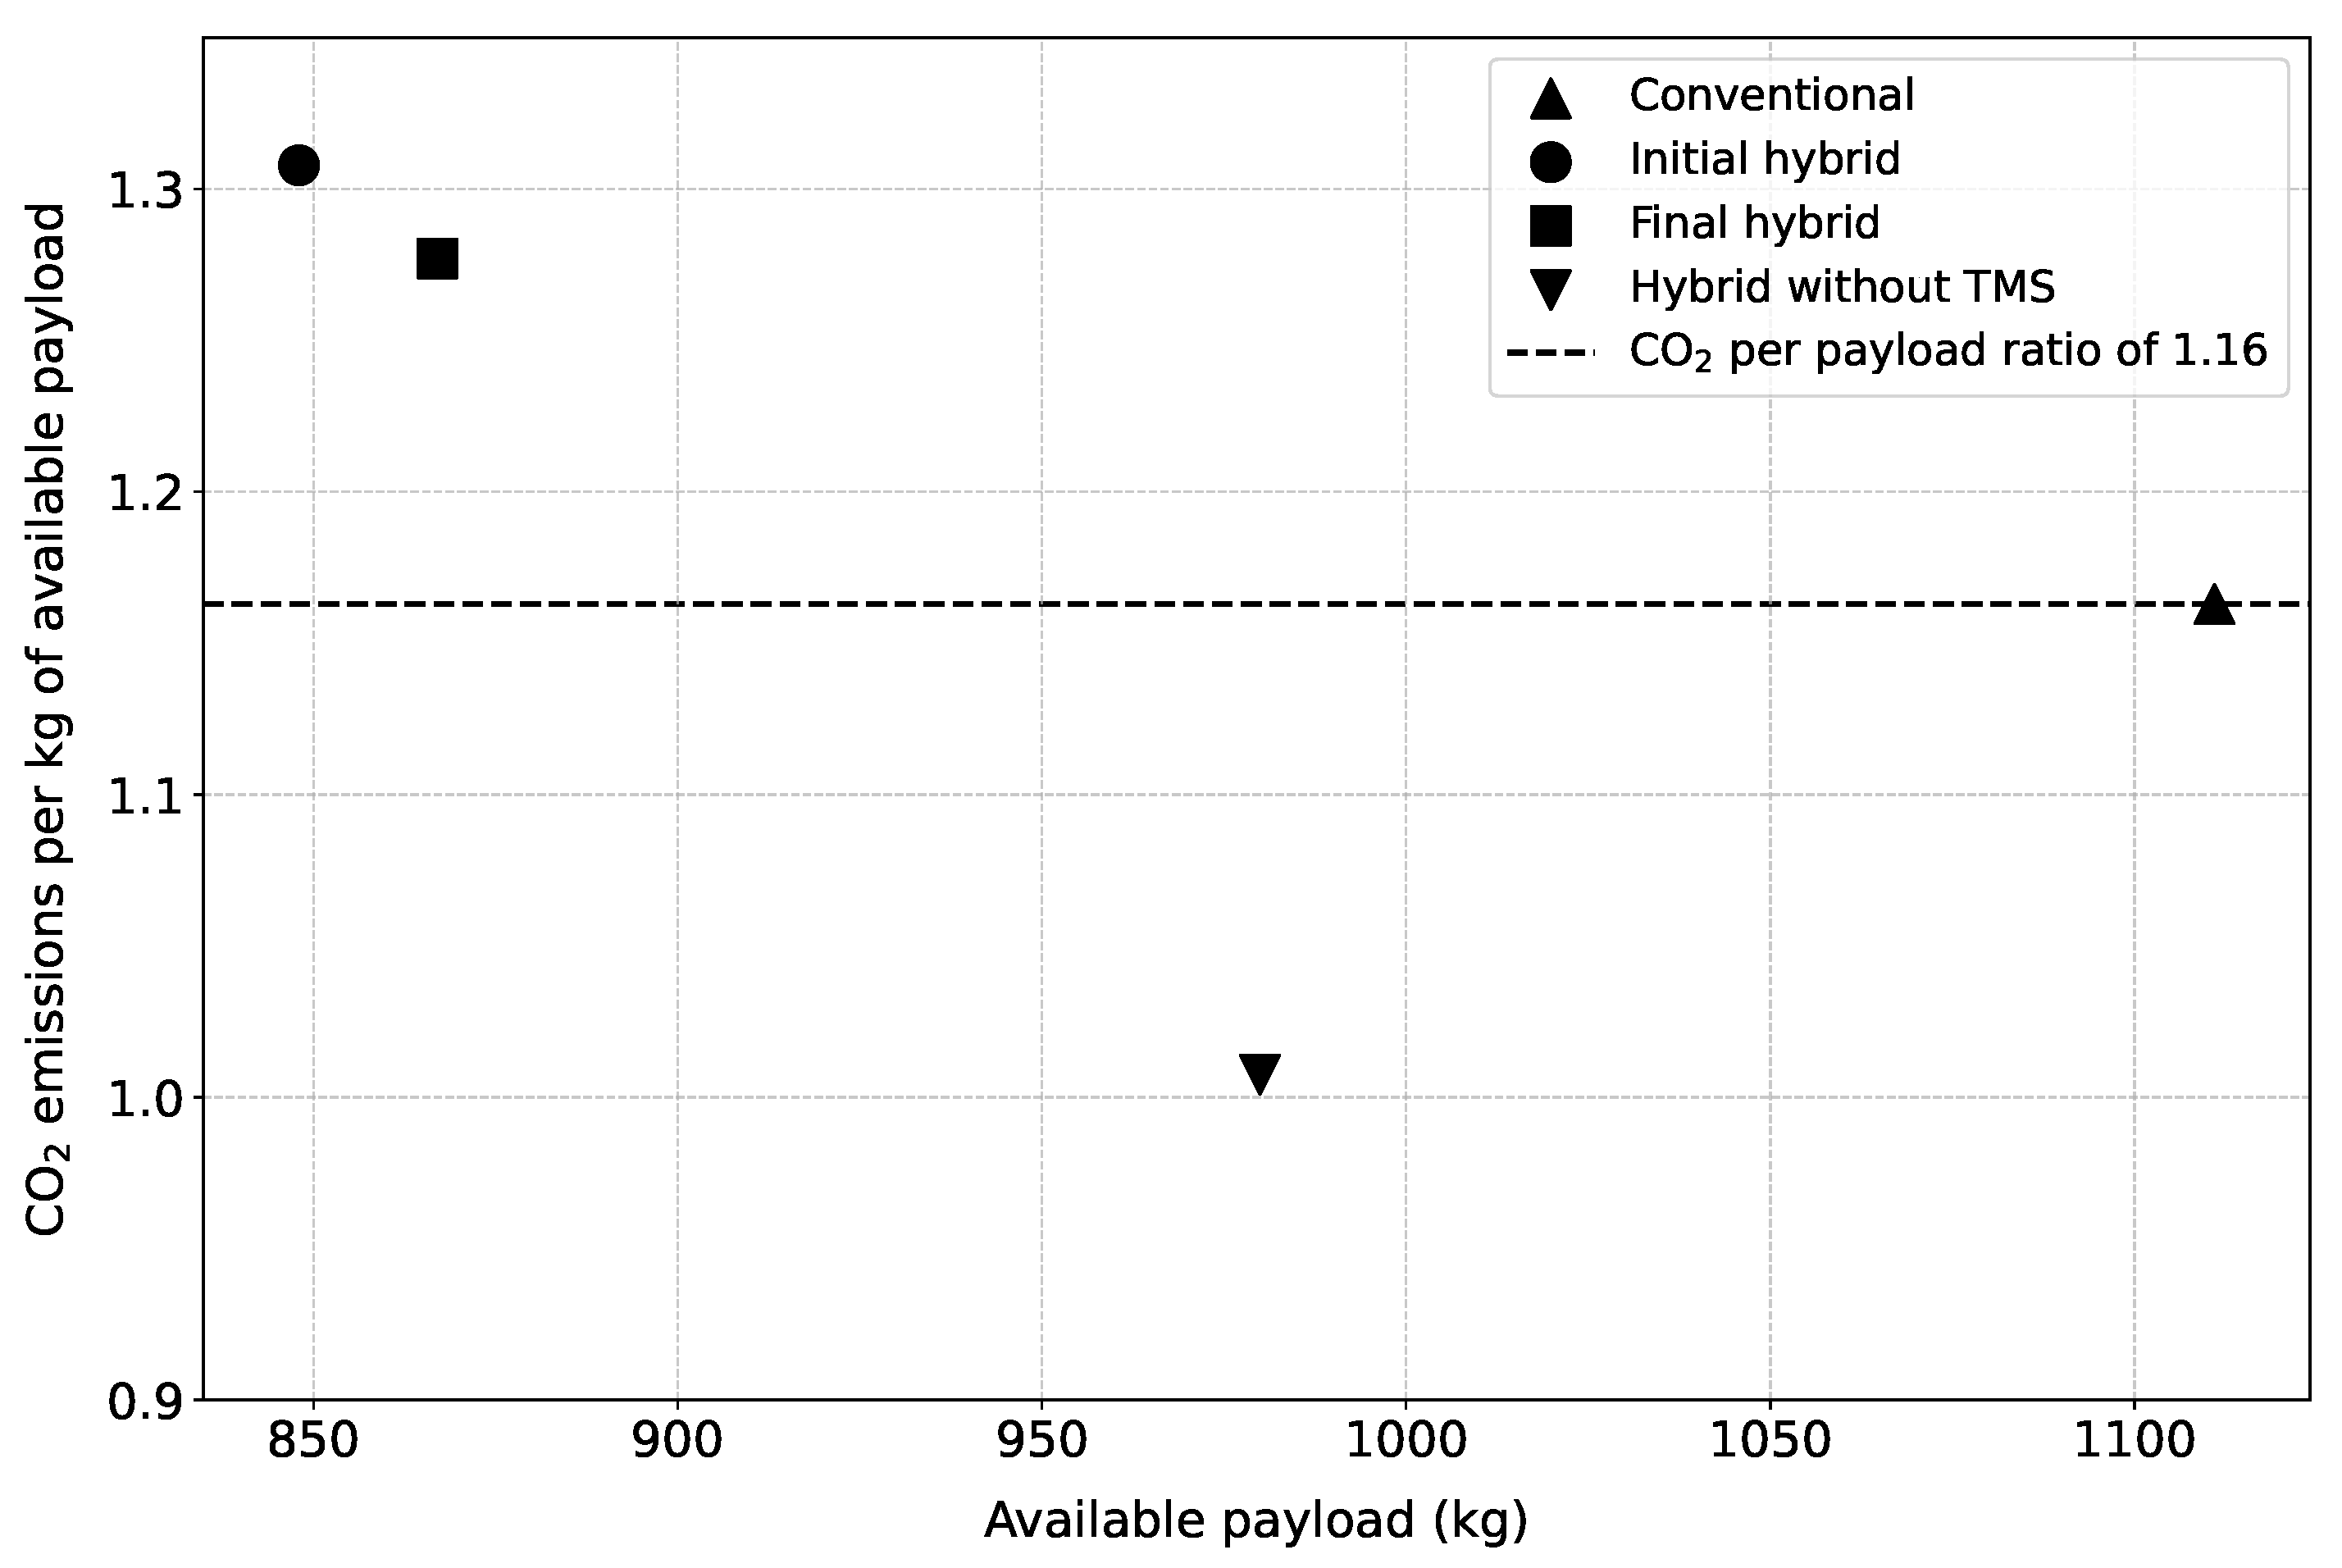
In addition, a last assessment was performed to show the importance of modeling the TMS. Although unrealistic in practice, the final study examines the hybrid aircraft with the TMS completely disabled. This includes ignoring the mass, drag, and power required by the components considered to be related to the TMS. The following components are removed from the hybrid aircraft: air inlet, diffuser, HEXs, coolant and tank, coolant pipes, pump, and valve. For example, all of these components represent a combined total mass of around 94 kg for the initial hybrid study and around 78 kg for the final study. Moreover, the air inlet and momentum drag are also ignored, along with the coolant pumping power. In the end, the initial and final hybrid studies yield the same results, as the difference in assumptions between the two directly affects the TMS; see Figure 21. In this case, neglecting the TMS components results in a noticeable improvement in the emissions-to-payload ratio, even when compared to the conventional aircraft. This highlights the importance of modeling the TMS to avoid flawed conclusions.
7. Conclusions
This study conducted a comprehensive sensitivity analysis at the aircraft, fuel cell system, and TMS component levels to evaluate the performance and tradeoffs associated with different design parameters in a hybrid fuel cell aircraft.
At the aircraft level, the analysis highlighted the substantial impact of cruise speed, fuel cell power, and ISA temperature on the available payload and emissions per kilogram of available payload. Lower cruise speeds, fuel cell powers, and temperatures lead to the minimum emissions per kilogram of available payload. At the fuel cell system level, the study revealed that stack temperature moderately influenced system performance, particularly affecting the drag. The choice of entry temperatures resulted in being the least influential parameter, with negligible effects. Lastly, the TMS component-level investigations explored the role of coolants and HEX geometries. Water emerged as the most effective cooling medium for LT-PEMFCs due to its superior thermal properties, but it may not be suitable for all applications. In addition, the HEX geometry with the highest surface density and fin surface area-to-total heat transfer area was most advantageous. Future work could aim to improve model accuracy by carrying out a detailed analysis of long-term effects on the fuel cell and TMS, such as material degradation and thermal fatigue; this is acknowledged as a limitation of the current study. Validation of the proposed models using experimental data and flight tests would also be an important step as the research moves from conceptual design toward practical implementation.
Furthermore, the systematic comparison with the reference conventional aircraft provided critical insights into the relative performance of the hybrid retrofitted aircraft. It highlighted that while hybrid aircraft are able to reduce global emissions, they exhibit a relatively high tradeoff in terms of payload. For example, when the retrofitted hybrid aircraft flies at the same cruising speed as its conventional counterpart, even with the most optimized parameters, it is not able to achieve as low a level of emissions per kg of payload. This result is, in part, due to consideration of the TMS, which represents a significant mass (almost the equivalent of a passenger) and drag. Overall, to come to a conclusion on the interest in hybrid fuel cell powertrain technology, it would be necessary to carry out a study on a completely redesigned aircraft, potentially releasing constraints on parameters such as the MTOM, for example. In addition, these limitations raise the question of whether alternative propulsion strategies could offer improved performance.
Author Contributions
Conceptualization, V.H., V.P.-B., I.H., J.J. and E.B.; methodology, V.H.; software, V.H.; validation, V.H.; formal analysis, V.H. and V.P.-B.; investigation, V.H.; writing—original draft preparation, V.H.; writing—review and editing, V.P.-B., I.H., J.J. and E.B.; visualization, V.H.; supervision, V.P.-B., I.H., J.J. and E.B.; project administration, V.P.-B. and I.H.; funding acquisition, V.P.-B. and I.H. All authors have read and agreed to the published version of the manuscript.
Funding
This research received no external funding.
Data Availability Statement
The original contributions presented in this study are included in the article. Further inquiries can be directed to the corresponding author.
Conflicts of Interest
The authors declare no conflicts of interest.
Abbreviations
The following abbreviations are used in this manuscript:
| Carbon dioxide | |
| EG | Ethylene Glycol |
| ICE | Internal combustion engine |
| ISA | International Standard Atmosphere |
| Hydrogen | |
| HEX | Heat exchanger |
| HT | High temperature |
| KFO | Potassium formate |
| LT | Low temperature |
| MTOM | Maximum take-off mass |
| OEM | Operating empty mass |
| PEMFC | Polymer electrolyte exchange membrane fuel cell |
| PG | Propylene glycol |
| TMS | Thermal management system |
Appendix A. Kodiak 900
The Kodiak 900 has an MTOM of around 3625 kg and an OEM of 2028 kg (with passenger seats), and it can accommodate up to two crew and eight passengers. In addition, it is powered by Pratt & Whitney’s PT6A-140 turboprop engine, which can distribute a shaft power of 900 shp (or equivalent power of 945 eshp). A specific fuel consumption of 0.591 lb/h/ehp is considered based on similar power rating engines. Aft of the cabin, a raised storage area provides a cargo volume of around 38 ft3, while the external cargo compartments in the belly of the aircraft are assumed to add an additional space of 71–88 ft3. Lastly, removing a row consisting of two passenger seats is estimated to increase cargo space by 57 ft3.
Appendix B. Fuel Cell and TMS Assumptions
The fuel cell operating conditions considered for the LT-PEMFC are given in Table A1. This includes the stack temperature, pressure, and air and hydrogen stoichiometric ratios. In addition, the coolant entering the fuel cell stack is assumed to have a 10 °C temperature gradient between its entry and exit. The initial air and hydrogen entry temperatures are also provided. These tolerances relate to the fuel cell stack temperature of 80 °C (353.15 K). Lastly, the fuel cell is assumed to have a heat exchange effectiveness of , indicating that the coolant exiting it will be nearly at the same temperature as the stack itself.
Table A1.
Operating conditions for the LT-PEMFC.
Table A1.
Operating conditions for the LT-PEMFC.
| Condition | Value |
|---|---|
| Cell voltage | 0.65 V |
| Stack temperature | 80 °C (353.15 K) |
| Stack pressure | 2 bar |
| Air stoichiometric ratio | 2 |
| Hydrogen stoichiometric ratio | 1 |
| Temperature gradient across fuel cell cooling fluid | 10 °C |
| Air entry temperature with respect to fuel cell | +10 °C |
| Hydrogen entry temperature with respect to fuel cell | °C |
Additional assumptions considered for the fuel cell balance of plants and, notably, the TMS are provided in Table A2.
Table A2.
Fuel cell system and component models assumptions.
Table A2.
Fuel cell system and component models assumptions.
| Condition | Value |
|---|---|
| Flush inlet | Ramp length: 1 m |
| Ramp angle: | |
| Aspect ratio: 4 | |
| Compressor and motor efficiency | , |
| Coolant | Ethylene Glycol solution |
| Coolant tank | Material: aluminium |
| Diffuser | Material: aluminium |
| HEX and evaporator | Material: aluminium |
| Plate thickness: 0.8 mm | |
| End plate thickness: 4.4 mm | |
| End bars thickness: 6.0 mm | |
| Liquid hydrogen tank | Gravimetric efficiency: 35% |
| Volumetric efficiency: 31–38% | |
| Motor / converter | 96% |
| Transport pipes | Coolant: 4.5 m |
| Hydrogen: 2.5 m (with 1.5 m insulated) | |
| Air: 7.5 m | |
| Pump and motor efficiency | , |
The required coolant mass flow rate can be derived using Equation (A1) by knowing the fuel cell heat and imposed temperature gradient .
Appendix C. Aircraft Integration of Fuel Cell System
Additional information regarding the integration of the fuel cell system in the reference aircraft is provided below:
- All component masses associated with the fuel cell system (see Table 2) are added to the OEM of the aircraft. The resulting payload is then deduced accordingly;
- The hydrogen mass is accounted for, along with the jet fuel, in the total fuel consumption of the aircraft;
- The drag added by the fuel cell system arises from two sources: the air inlet and the re-injection of cooling air to the atmosphere once it has passed through the primary HEX;
- The power required by the fuel cell system is assumed to be drawn from the fuel cell itself, thereby reducing its net contribution to the overall electric power output;
- The total volume of the fuel cell system is calculated, and the approximate placement of its components is considered. However, when assessing feasibility, only the gross volume available in the aircraft’s belly and cabin area is compared to the volume required by the fuel cell system.
Appendix D. HEX Geometry
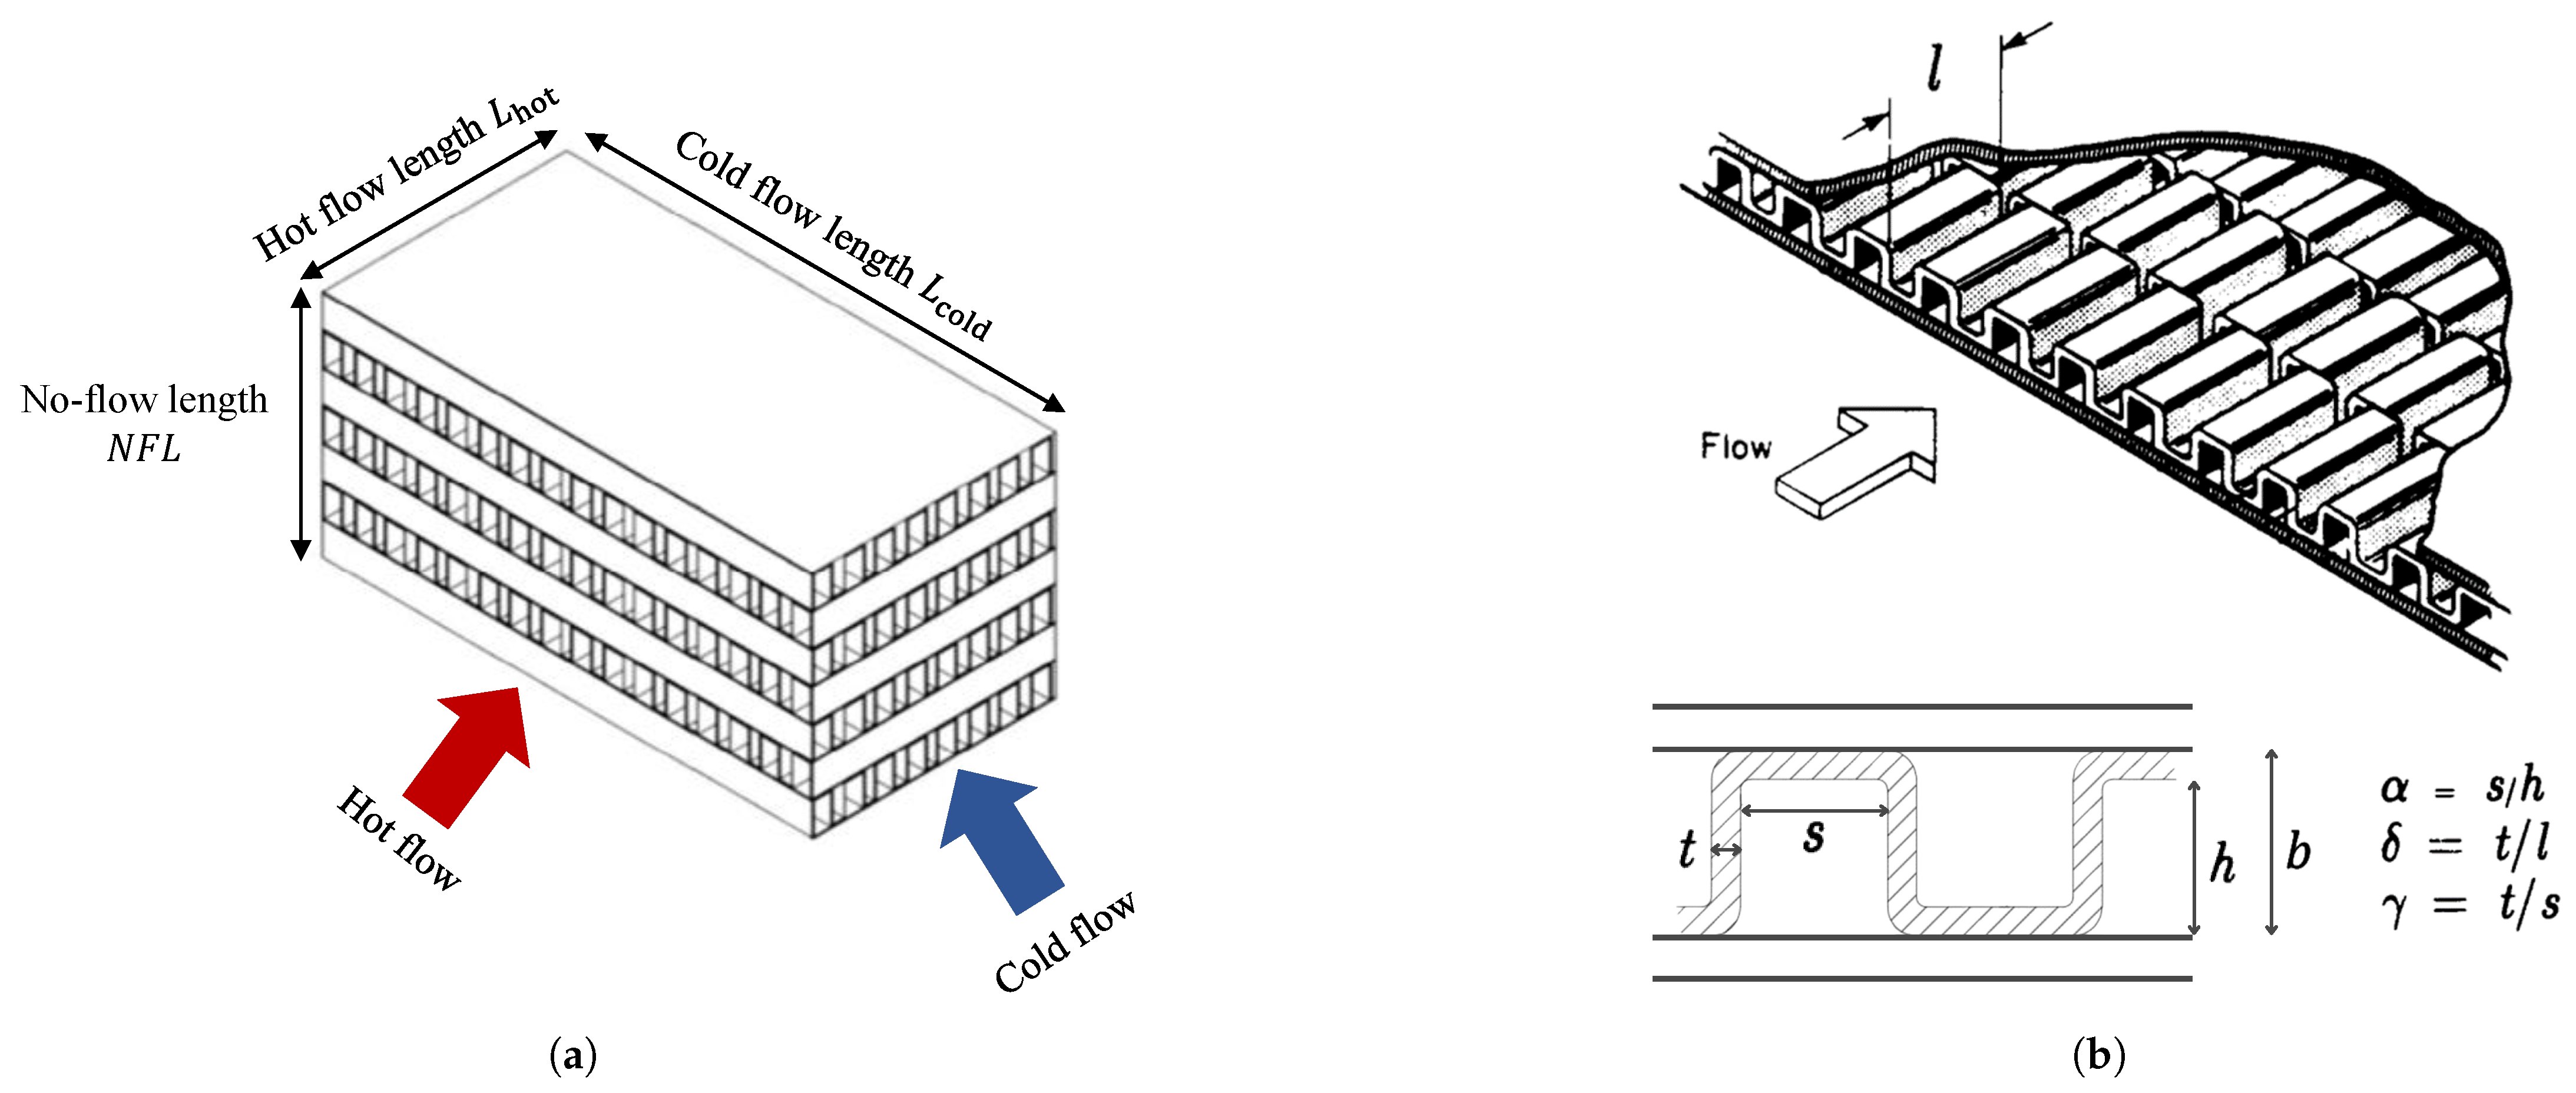
A plate-fin cross-flow HEX configuration was adopted, as illustrated in Figure A1a. In addition, the offset-strip fin design was selected based on findings from [32], which indicate that, for a given fin pitch, it offers two to three times higher heat transfer coefficients than plain fin configurations. The detailed core geometry is depicted in Figure A1b, and the geometrical parameters used to describe the HEX are described below.
- : Plate spacing;
- : Number of fins per unit length;
- : Hydraulic diameter;
- : Fin thickness;
- : Fin length;
- : Surface area density;
- : Fin surface area-to-total heat transfer surface area ratio.
The number of cold and hot layers is determined by the maximum allowable HEX height. The ambient air HEX is assumed to be stored in the aircraft’s belly and is constrained to have a maximum height of approximately 0.41 m, which represents of the total belly height. With the maximum HEX height, the number of layers is deduced based on the known plate spacing and assumed plate and end plate thicknesses.
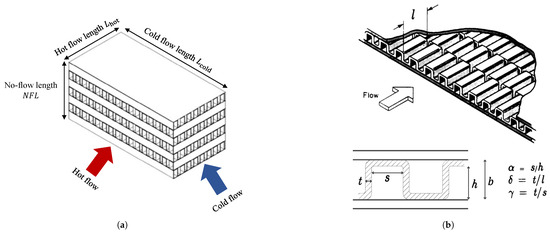
Figure A1.
(a) Cross-flow plate-fin heat exchanger. (b) Offset-strip fin geometry adapted from [33].
Figure A1.
(a) Cross-flow plate-fin heat exchanger. (b) Offset-strip fin geometry adapted from [33].
References
- Delbecq, S.; Fontane, J.; Gourdain, N.; Mugnier, H.; Planès, T.; Simatos, F. Aviation and Climate: The State-of-the-Art. In Proceedings of the 56th 3AF International Conference on Applied Aerodynamics, Toulouse, France, 28–30 March 2022; Association Aéronautique et Astronautique de France: Paris, France, 2022. [Google Scholar]
- Dicks, A.; Larminie, J. Fuel Cell Systems Explained, 2nd ed.; John Wiley & Sons: Hoboken, NJ, USA, 2003. [Google Scholar]
- Rischmüller, U.C.J.; Lessis, A.; Egerer, P.; Hornung, M. Conceptual design of a hydrogen-hybrid dual-fuel regional aircraft retrofit. Aerospace 2024, 11, 123. [Google Scholar] [CrossRef]
- Eissele, J.; Lafer, S.; Burbano, C.M.; Schließus, J.; Wiedmann, T.; Mangold, J.; Strohmayer, A. Hydrogen-powered aviation—Design of a hybrid-electric regional aircraft for entry into service in 2040. Aerospace 2023, 10, 277. [Google Scholar] [CrossRef]
- Habrard, V.; Pommier-Budinger, V.; Hazyuk, I.; Jézégo, J.; Benard, E. Thermal management system modeling for preliminary design of fuel cell-based aircraft. In Proceedings of the 2023 AIAA Aviation and Aeronautics Forum and Exposition (AIAA AVIATION Forum), San Diego, CA, USA, 12–16 June 2023; American Institute of Aeronautics and Astronautics: Reston, VA, USA, 2023. [Google Scholar]
- Adler, E.J.; Brelje, B.J.; Martins, J.R.R.A. Thermal Management System Optimization for a Parallel Hybrid Aircraft Considering Mission Fuel Burn. Aerospace 2022, 9, 243. [Google Scholar] [CrossRef]
- Gkoutzamanis, V.G.; Tsentis, S.E.; Mylonas, O.S.V.; Kalfas, A.I.; Kyprianidis, K.G.; Tsirikoglou, P.; Sielemann, M. Thermal Management System Considerations for a Hybrid-Electric Commuter Aircraft. J. Thermophys. Heat Transf. 2022, 36, 650–666. [Google Scholar] [CrossRef]
- Kodiak, D. Kodiak 900 Aircraft Brochure. 2022. Available online: https://kodiak.aero/wp-content/uploads/2022/07/2022-K900-12x12-072222_2.pdf (accessed on 30 January 2024).
- EUROCONTROL. A Place to Stand: Airport in the European Air Network. 2007. Available online: https://www.eurocontrol.int/sites/default/files/publication/files/tat3-airports-in-european-air-network.pdf (accessed on 30 January 2024).
- Palladino, V.; Jordan, A.; Bartoli, N.; Schmollgruber, P.; Pommier-Budinger, V.; Benard, E. Preliminary studies of a regional aircraft with hydrogen-based hybrid propulsion. In Proceedings of the AIAA AVIATION 2021 FORUM, Virtual Event, 2–6 August 2021; American Institute of Aeronautics and Astronautics: Reston, VA, USA, 2021. [Google Scholar]
- London, A.L.; Kays, W.M. Compact Heat Exchangers; Scientific International: Tamil Nadu, India, 2018; ISBN 978-93-87938-03-8. [Google Scholar]
- PowerCell Group. P-Stack V 222 Technical Specification. 2023. Available online: https://powercellgroup.com/wp-content/uploads/2023/10/p-stack-v-222.pdf (accessed on 10 August 2024).
- Horizon Fuel Cells. Horizon Automotive PEM Fuel Cells to Set 300 kW Benchmark. 2023. Available online: https://fuelcellsworks.com/news/horizon-automotive-pem-fuel-cells-to-set-300kw-benchmark (accessed on 10 November 2024).
- Ballard Power Systems. FCgen-HPS Fuel Cell Product Sheet. 2023. Available online: https://www.ballard.com/wp-content/uploads/2024/08/Ballard_FCgen_HPS_specs.pdf (accessed on 10 November 2024).
- U.S. Department of Energy. Automotive Fuel Cell Targets Status 2020. 2020. Available online: https://www.hydrogen.energy.gov/docs/hydrogenprogramlibraries/pdfs/20005-automotive-fuel-cell-targets-status.pdf?Status=Master (accessed on 10 November 2024).
- Air Liquide Advanced Technologies. Axane C-Stack260 Datasheet. 2024. Available online: https://advancedtech.airliquide.com/sites/alat/files/2024-02/axane_datasheet_c-stack260_en_09_23_sd.pdf (accessed on 10 November 2024).
- Safran Group. Safran Electrical & Power Successfully Completes First GENeUS 300 Ground Test Campaign. 2023. Available online: https://www.safran-group.com/news/safran-electrical-power-successfully-completes-first-geneus-300-ground-test-campaign-2023-12-13 (accessed on 10 October 2024).
- Vratny, P.C. Conceptual Design of Hybrid-Electric Transport Aircraft. Ph.D. Thesis, Technische Universität München, München, Germany, 2018. Available online: https://www.bauhaus-luftfahrt.net/fileadmin/user_upload/Publikationen/2018_TUM_Vratny_Dissertation_R.pdf (accessed on 10 December 2024).
- FUMATECH BWT GmbH. High Performance Membrane Humidifiers for Fuel Cells. 2024. Available online: https://www.bwt.com/en/-/media/bwt/fumatech/datasheets/new/ecomate/h100n.pdf?rev=aa0492709590434cb8fbf2f8e545a059 (accessed on 21 May 2024).
- Kolon Industries, Inc. Fuel Cell Membrane Humidifier Brochure. 2023. Available online: https://pub-mediabox-storage.rxweb-prd.com/exhibitor/products/exh-f3c9d3a5-fe68-44dc-87eb-fbd5efd03c6d/product-documents/pro-1cb3f8f2-2f93-4d27-b010-a0f128f9141e/22bd351f-a72c-4e91-a9ad-2d44b9d1cb69.pdf (accessed on 7 May 2024).
- Hefei Sinopower Technologies Co. Humidifier Hydrogen Fuel Cell. 2024. Available online: http://en.hfch.cn/Battery_detail/5.html (accessed on 5 July 2024).
- Parker. Library: Parker Th-1000-16FO-Catalogue 3800-MOB/UK-Thermal Bypass Valve. 2022. Available online: https://paro.nl/library/components/parker/th-1000-16fo (accessed on 1 December 2022).
- Watts Industries. Technical Data Sheet|2-Way and 3-Way Zone Valves VU02-VU3-VU4 Series. 2017. Available online: https://www.watts.eu/en/technical-support/data-sheet/radiator-valves/3448 (accessed on 1 December 2022).
- van Heerden, A.S.J.; Judt, D.M.; Jafari, S.; Lawson, C.P.; Nikolaidis, T.; Bosak, D. Aircraft thermal management: Practices, technology, system architectures, future challenges, and opportunities. Prog. Aerosp. Sci. 2022, 128, 100767. [Google Scholar] [CrossRef]
- Yan, Q.; Toghiani, H.; Causey, H. Steady State and Dynamic Performance of Proton Exchange Membrane Fuel Cells (PEMFCs) under Various Operating Conditions and Load Changes. J. Power Sources 2006, 161, 492–502. [Google Scholar] [CrossRef]
- Omrani, R.; Mohammadi, S.S.; Mafinejad, Y.; Paul, B.; Islam, R.; Shabani, B. PEMFC purging at low operating temperatures: An experimental approach. Int. J. Energy Res. 2019, 43, 7496–7507. [Google Scholar] [CrossRef]
- Penga, Z.; Radica, G.; Barbir, F.; Nižetić, S. Coolant induced variable temperature flow field for improved performance of proton exchange membrane fuel cells. Int. J. Hydrogen Energy 2019, 44, 10102–10119. [Google Scholar] [CrossRef]
- Ustinov, A.; Khayrullina, A.; Sveshnikova, A.; Abrosimov, K. Effect of Inlet Air Temperature and Relative Humidity on Performance of PEM Fuel Cell. In Proceedings of the 12th International Conference on Heat Transfer, Fluid Mechanics and Thermodynamics, Costa del Sol, Spain, 11–13 July 2016; Skolkovo Institute of Science and Technology: Moscow, Russia, 2016. [Google Scholar]
- Melinder, Å. Thermophysical Properties of Aqueous Solutions Used as Secondary Working Fluids; Division of Applied Thermodynamics and Refrigeration, Department of Energy Technology, School of Industrial Engineering and Management, Royal Institute of Technology, KTH: Stockholm, Sweden, 2007. [Google Scholar]
- NuGenTec. NuTherm HC-40: High-Performance Potassium Formate Water-Based Closed System Heat Transfer Fluid. 2024. Available online: https://nugentec.com/nutherm-hc-40-high-performance-potassium-formate-water-based-closed-system-heat-transfer-fluid-ideal-for-low-temperature-applications/?srsltid=AfmBOorP85CwRv91Y9SRvBaHqDy6ix12NiI3T-xh4FIudF5YWrYWRz4J. (accessed on 30 January 2024).
- Bell, I.H.; Wronski, J.; Quoilin, S.; Lemort, V. Pure and Pseudo-pure Fluid Thermophysical Property Evaluation and the Open-Source Thermophysical Property Library CoolProp. Ind. Eng. Chem. Res. 2014, 53, 2498–2508. Available online: https://pubs.acs.org/doi/abs/10.1021/ie4033999 (accessed on 30 January 2024). [CrossRef]
- Webb, R.L. Plate Fin Surface Geometries. In HEDH Multimedia; Begellhouse: Danbury, CT, USA, 2018. [Google Scholar] [CrossRef]
- Manglik, R.M.; Bergles, A.E. Heat Transfer and Pressure Drop Correlations for the Rectangular Offset Strip Fin Compact Heat Exchanger. Exp. Therm. Fluid Sci. 1995, 10, 171–180. [Google Scholar] [CrossRef]


Disclaimer/Publisher’s Note: The statements, opinions and data contained in all publications are solely those of the individual author(s) and contributor(s) and not of MDPI and/or the editor(s). MDPI and/or the editor(s) disclaim responsibility for any injury to people or property resulting from any ideas, methods, instructions or products referred to in the content. |
© 2025 by the authors. Licensee MDPI, Basel, Switzerland. This article is an open access article distributed under the terms and conditions of the Creative Commons Attribution (CC BY) license (https://creativecommons.org/licenses/by/4.0/).