The cascade analysed in this work is known as ARL-SL19 supersonic compressor cascade and derives from a rotor near-tip section of a transonic axial compressor described in [
13,
14]. As reported in [
12], it is the result of a design, fabrication, and testing process conducted at the Detroit Diesel Allison (DDA) Division of the General Motors Corp, which worked under the sponsorship of the Fluid Mechanics Research Laboratory of the Aerospace Research Laboratories (ARL) in Ohio in the 1970s. The experimental investigation carried out in the supersonic wind tunnel at DDA is widely reported in [
15]. The cascade has aroused an ever-growing interest because of the excellent performance data obtained from the tests at DDA. Numerous papers providing a quite vast series of experimental data for a large number of operating conditions are available in the literature. For instance, a detailed experimental investigation of the cascade behavior at various operating conditions, conducted in the supersonic cascade wind tunnel facility at the Deutsches Zentrum für Luft- und Raumfahrt e.V. (DLR) in Cologne, former Deutsche Forschungs- und Versuchsanstalt für Luft- und Raumfahrt (DFVLR), is presented in [
12]. In particular, the influence of static pressure ratio, inlet Mach number, and AVDR on the blade performance is described. An empirical correlation was used to separate the influence of static pressure ratio and AVDR on the exit variables and the results were collected in curves showing the variations in exit flow angle, exit Mach number, and total-pressure loss coefficient with static pressure ratio and with AVDR, for a fixed value of the AVDR and static pressure ratio, respectively. These curves can be useful for a qualitative comparison with other experimental results or with numerical results. The ARL-SL19 supersonic cascade was also tested in the supersonic wind tunnel facility at the Office National d’Etudes et de Recherches Aérospatiales (ONERA) as reported in [
16], with substantial differences in the examined operating conditions and in the testing arrangement compared to the tests carried out at the DFVLR. A summary of the cascade results obtained in the three different supersonic cascade wind tunnels at DFVLR, at DDA, and at ONERA can be found in [
17]. Detailed experimental and numerical results are presented in other papers. For example, the experimental results reported in [
12] have been used in [
6] for the validation of a one-dimensional analytical shock loss model for optimizing the shock structure in a supersonic cascade at various operating conditions.
2.1. Cascade Performance Parameters
The main parameters generally used to describe the performance of a cascade are the axial velocity-density ratio (AVDR), the total-pressure loss coefficient , and the isentropic Mach number .
The AVDR is a parameter used to check if a flow through a cascade is two-dimensional. It is defined as the ratio of the product of axial velocity and density at cascade exit to the product of axial velocity and density at cascade inlet
Generally speaking, the flow through a cascade is two-dimensional when the AVDR is unity. However, in reality, a cascade has a three-dimensional flow behavior because of the presence of secondary flows.
The total-pressure loss coefficient is defined as the ratio of the difference between the total pressure at cascade inlet and the total pressure at cascade exit to the difference between the total pressure and the static pressure at cascade inlet
It is an important performance parameter which gives the loss in total pressure in a non-isentropic flow. In a supersonic compressor cascade, the total pressure losses are due to viscous losses, resulting from the shock wave boundary layer interaction and the related separation of the boundary layer, and to shock losses, caused by the shocks inside the blade passage and the detached bow shock in front of the blade leading-edge.
The isentropic Mach number is often plotted for turbomachinery blades and it is defined as
where
is the inlet total pressure,
p is the local static pressure, and
is
.
2.2. Computational Domain and Mesh
The computational domain used for the simulations consisted of a 2D periodic domain around a single blade airfoil with periodicity equal to the pitch spacing. It extended from , where corresponds to the leading edge of the airfoil.
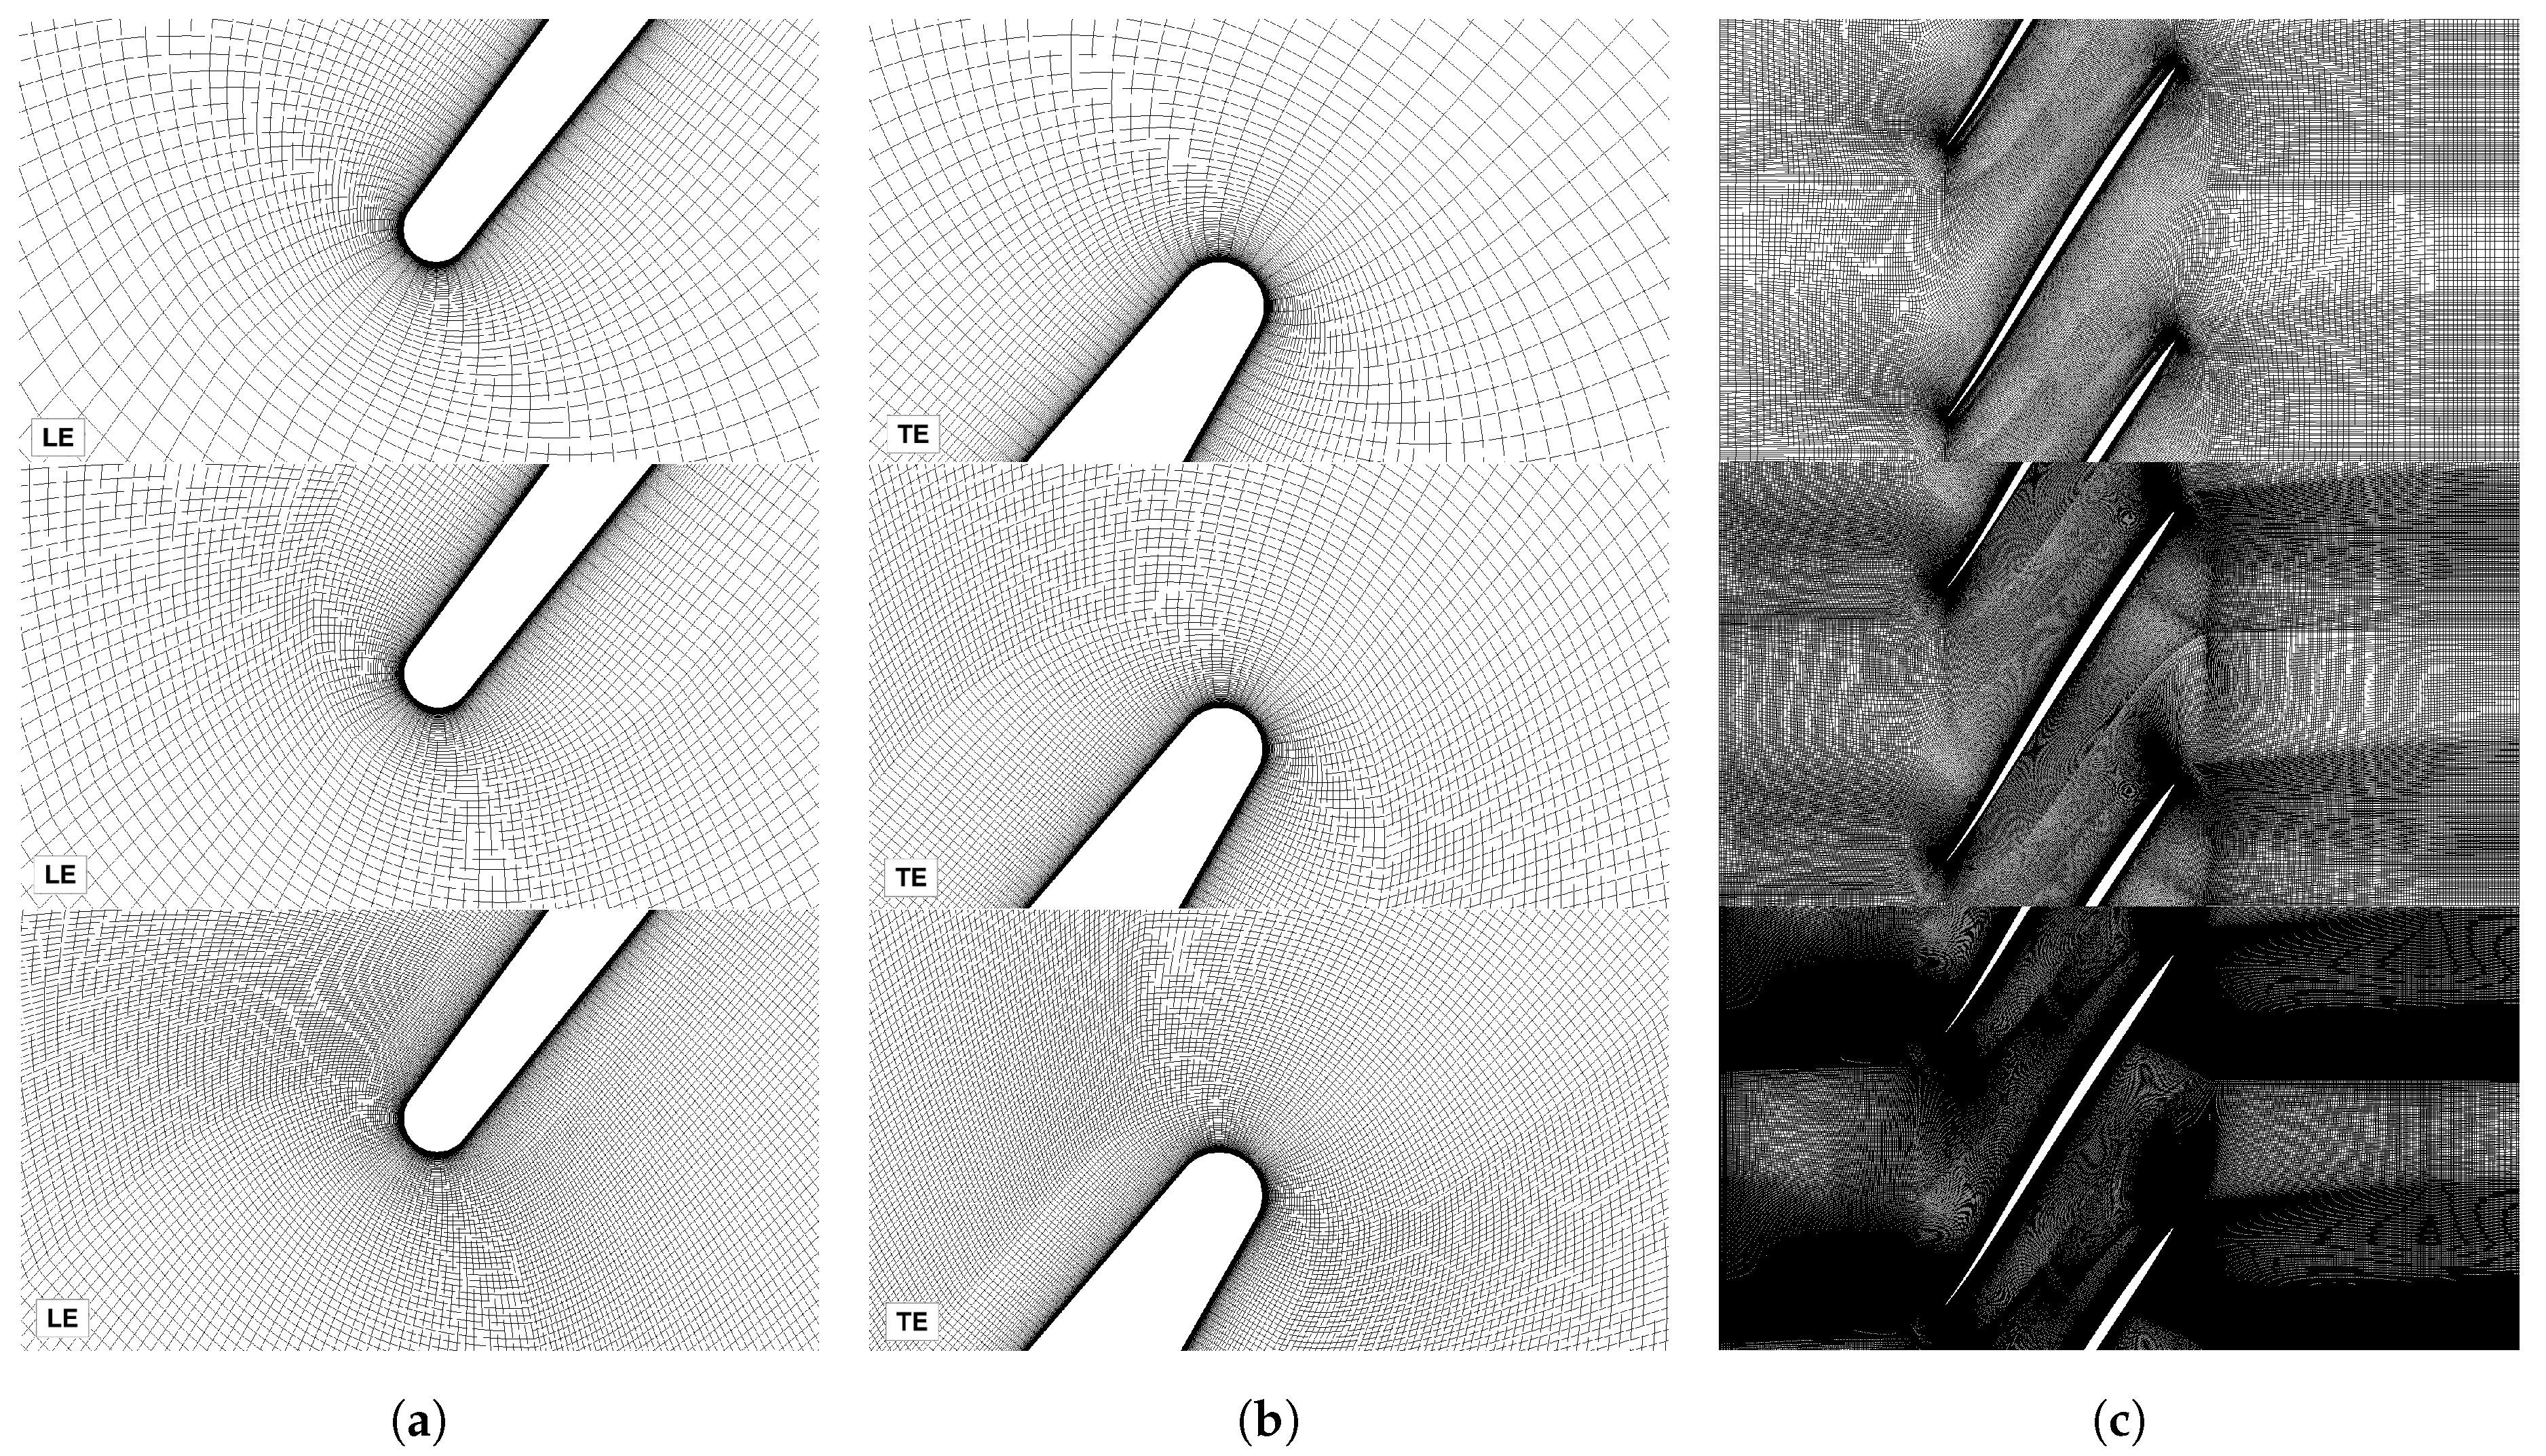
Three multi-block structured grids with quadrilateral elements and one O-grid around the airfoil were used for the validation study and the grid sensitivity analysis. A wall orthogonal extrusion layer around the airfoil was used to resolve the boundary layer using
. Enhanced Wall Treatment (EWT) formulation was used for the simulations performed with the
k-
models in order to ensure the applicability of the models. A coarse mesh of about 100k elements, a medium mesh of about 200k elements, and a fine mesh of about 500k elements were used. The three grids are showed in
Figure 1, with grid size increasing from top to bottom.
Grid quality parameters are summarized in
Table 1, proving good level of skewness and orthogonal quality, necessary to accurately reconstruct the flow variables during the simulation.
It is important to underline that the choice to simulate a single two-dimensional blade airfoil in a periodic domain does not accurately reflect the experimental set-up, because all the cascade tests were conducted with a three-dimensional geometry, a finite number of blades, and with sidewall boundary layer suction to avoid adverse effects. However, the periodic condition allows simulating the case of a real flow through a rotating axial compressor. Moreover, this conscious simplification makes it possible to simulate a flow not dependent on the AVDR, because the axial velocity-density ratio is always unity for a two-dimensional simulation. Lastly, the presence of secondary flows and non-periodicity effects is avoided. The validation study aimed at obtaining a reliable and accurate numerical model which can be successively used for the parametric analysis.
2.7. Results of Validation and Grid Sensitivity Analysis
The CFD results for the three test cases, compared with the experimental results, are listed in
Table 4. The turbulence models used for the simulations were the Spalart-Allmaras model (S-A) [
22], the
k-
model, in its three available formulations (STD
k-
[
23], RNG
k-
[
24], and Realizable
k-
[
25]), and the Shear-Stress Transport (SST)
k-
model [
26]. For brevity, only the outcomes obtained with the S-A model, the STD
k-
model, and the SST
k-
model are reported.
As it can be seen, the variations of cascade performance and exit flow variables as a function of mesh size are almost negligible. This could be due to the fact that the coarse mesh was sufficiently refined to reproduced the flow field through the cascade in a satisfactory manner. A subsequent refinement of the grid around the airfoil did not provide a significant improvement.
As regards the inlet flow angle, the difference between the calculated and the experimental values, whose prediction was overestimated regardless of grid size, was attributed to the turbulence model employed. In the first test case and in the second test case, the S-A and the STD k- had a similar positive error of about compared to the experimental value, with a mean difference of for the third test case. Overall, the STD k- seemed to overestimate the inlet flow angle slightly more.
The exit Mach number, instead, was well predicted regardless of the turbulence model employed and the grid size, in each of the two test cases for which the experimental results are available. Similarly, the prediction of total-pressure loss coefficient
was in very good agreement, with small non-uniform variations for the three test cases between S-A and
k-
. However, the latter model seemed slightly better, giving an error never greater than
. The relative percentage error as a function of the grid size for the three test cases is reported in
Figure 2, showing a moderate sensitivity to grid size.
The isentropic Mach number distributions calculated with the S-A model and the STD
k-
, employing the fine mesh for the three test cases, are plotted in
Figure 3,
Figure 4 and
Figure 5. The distribution was not affected by the grid size. However, the calculated isentropic Mach number on the suction side and on the pressure side of the airfoil, as visible in the figures, presented some differences in comparison with the experimental profiles, especially around the peaks representing the location of the shock waves on the blade surfaces. This discrepancy was shown to be dependent on the turbulence model, since even small modifications of boundary layer thickness determine a different wave pattern arising in the passage. Moreover, three-dimensional effects and disturbances, inevitably present during experimental measurements, were not taken into account in the model employed. In addition, the discrepancies between the calculated and the experimental isentropic Mach number distributions could be due to the experimental and measurement setup. In fact, the probes on the suction side and on the pressure side of the profile could not have been dense enough to accurately detect the shock waves on the airfoil surfaces. Finally, the adjustment of inlet flow variables to match unique incidence condition and experimental quantities could produce a slight modification of the wave pattern, but the aim of the validation in this work was to identify the turbulence model giving the results of better consistency with the experimental parameters for a given static pressure ratio and then evaluate the performance of the cascade for different operating conditions. The S-A model seemed to better reproduce the isentropic Mach number distribution on the pressure side and the suction side of the airfoil in all the analysed test cases.
The blade-to-blade wake losses for the second test case and the third test case, calculated with the S-A model and the STD
k-
model, are depicted in
Figure 6. The wake was well reproduced by the S-A model, with the local loss coefficient curves aligned on the peak and on the left concavity, representing viscous losses and shock losses, respectively. The not complete consistency with the experimental results was probably due to mixing phenomena downstream of the cascade, which are unsteady, and to the non-periodicity of the experimental cascade. This is easily visible in the non-periodic experimental blade-to-blade loss profile, because of the finite number of blades in the testing arrangement. The results of the validation were also in good agreement with the ones obtained in [
6] for the second test case and third test case.
As regards the numerical simulation of the cascade design operating condition, the S-A model gave the best results, outclassing the other turbulence models employed for the validation. The CFD results obtained at the cascade design operating condition, calculated using the S-A model, are reported in
Table 5 and compared with the experimental data.
As it can be seen, the numerical results obtained with the S-A at the cascade design operating condition are in quite total agreement with the experimental data. The calculated flow turning , is well predicted, as well as the total-pressure loss coefficient (the relative percentage error is of 1%). In comparison, the corresponding calculated by using the STD k- model was 0.154, which is clearly overpredicted. The flow field around the airfoil in terms of shock wave pattern was also well reproduced.
As regards the results calculated with the SST k- model in terms of cascade efficiency and exit flow variables, it can be seen that the total-pressure loss coefficient is deeply underestimated in all the test cases. Moreover, the isentropic Mach number distribution on the suction side of the blade showed a drop of the isentropic Mach number around the trailing-edge, due to an overestimation of the boundary layer separation on the blade suction side caused by the interaction with the shock waves, which affected the calculation of the isentropic Mach number and the total-pressure loss coefficient.
Overall, the CFD results obtained with the S-A model and the STD k- model seem to accurately predict the cascade performance, even considering the experimental uncertainties. The validation study and the grid sensitivity analysis suggested that for the purpose of this work the medium grid could be adopted, because it represented the best compromise between accuracy and computational time. In terms of turbulence model, the validation study showed that the S-A model gave more precise results in simulating the flow in the blade passage and across the wake and in reproducing the cascade design operating condition. Even if it slightly underestimated the total-pressure loss coefficient, it was chosen as the reference model for the subsequent simulations, taking into account the quite high experimental uncertainties and its more accurate reproduction of the cascade design operating condition, the wake total-pressure loss profile, and the isentropic Mach number distribution.
Although not reported here, as stated before, it is worth briefly discussing the results obtained with the other turbulence models tested in the validation study. As regards the total-pressure loss coefficient, the mean exit flow angle and the exit Mach number, they were correctly calculated by the Realizable k- model and the RNG k- model. However, the isentropic Mach number distribution and the blade-to-blade losses measured downstream of the cascade were not as well predicted. The isentropic Mach number distribution on the suction side was not accurately replicated by both the turbulence models, especially in the rearmost part near the trailing-edge, as well as the blade-to-blade total-pressure loss coefficient, which resulted deeply underestimated.


