
Multimodal Estimation of Sine Dwell Vibrational Responses from Aeroelastic Flutter Flight Tests


Abstract
:1. Introduction
- Frequency Sweeps are chirp excitations from low to high frequency (values around 2 Hz to 20 Hz) and usually require 30 s to 60 s time signals. This is a big drawback when close to the flutter point, considering that the pilot needs to keep the aircraft in straight and level flight for such amount of time. However, they provide very good information when trying to characterize the system. Figure 3 shows a real Frequency Sweep from the gathered data, where the upper plot of the figure shows the aileron excitation and the lower plot of the figure shows the reading of one of the sensors.
- Sine Dwells consist of several excitations at a given frequency close to the expected natural frequency. In the case of this paper’s datasets, the aircraft performs a battery of eight different excitations of 3 s each. For example, if the expected natural frequency lies at 4.5 Hz, the pilot will run eight different programs exciting the aircraft at 4.2 Hz, 4.3 Hz, etc. until 4.9 Hz, leaving approximately 3 s to 5 s relax time between each program to gather data. The main advantage of the Sine Dwell excitations is that the time on which the pilot flies under flutter conditions is very reduced, which considerably limits the risk associated to the tests. Figure 4 represents a Sine Dwell sample extracted from real Flutter Flight Test data. In this figure only two program runs are represented, while the full set consists of eight program runs. As in the case of the Frequency Sweep, the upper plot of the figure shows the aileron excitation and the lower plot the response of one of the sensors.


2. Aircraft Aeroelastic Flutter and Stores Integration Paradigm
3. Theoretical Characterization of the Frequency Response
3.1. Resonance Frequency of a Single Mode
3.2. Bandwidth of a Single Mode

4. Data Processing Paradigm, Optimization Algorithms and Fitting Functions
4.1. Matrix Pencil Algorithm
4.2. Wavelet Techniques
4.3. Peak-Amplitude Technique
4.4. Proposed Paradigm
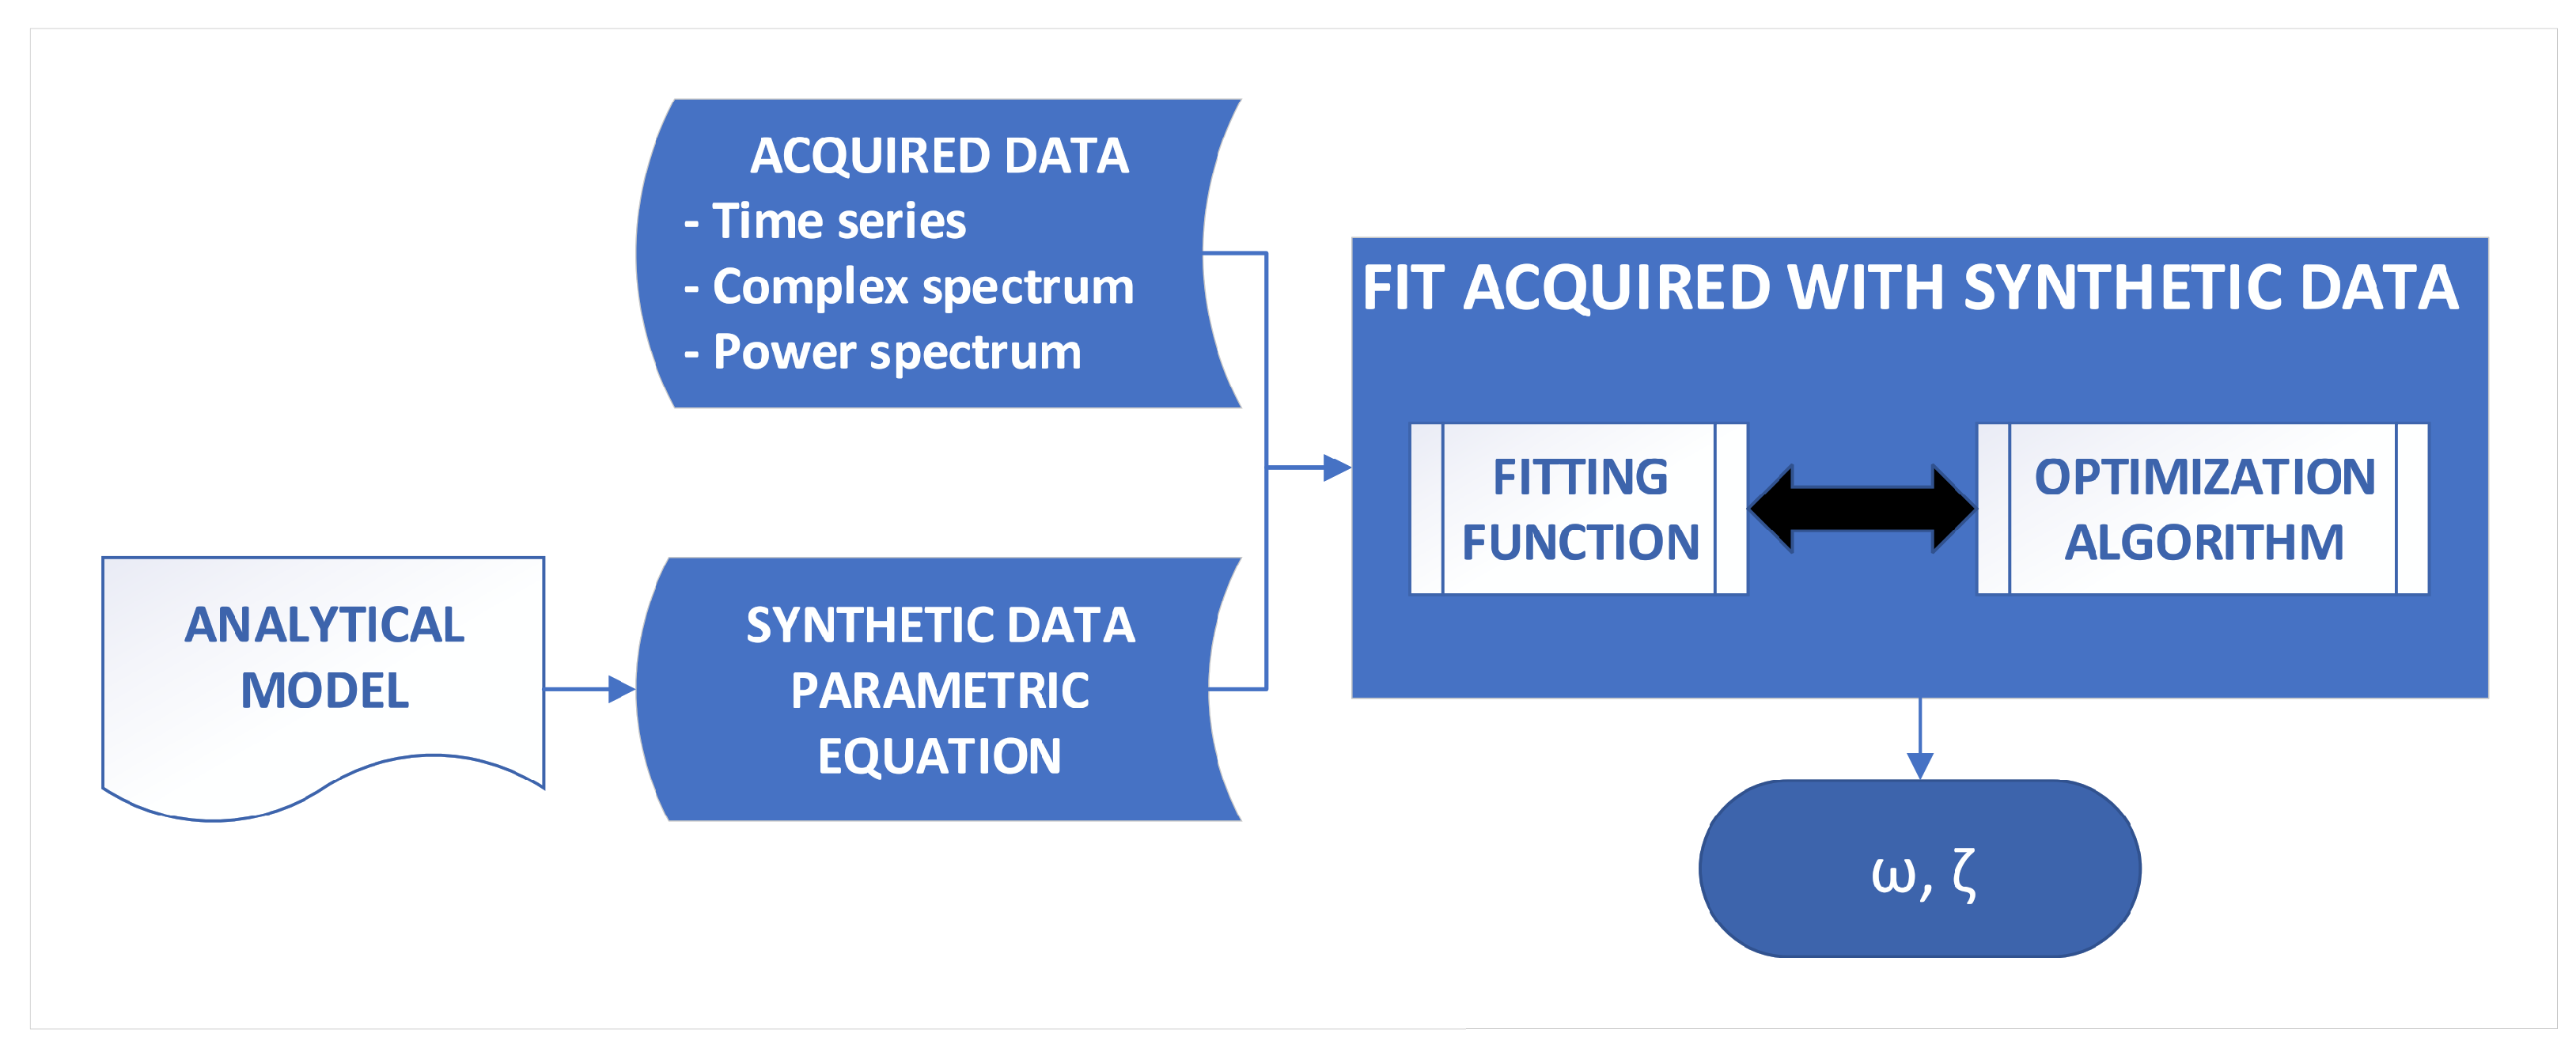
- Time domain fitness function. This is the most basic approximation. The basic parametric Equation (28) feeds the optimization algorithm, where it generates a synthetic time series. This synthetic time series, along with the sampled time series, feeds the fitting function and the cycle is repeated until the desired stop criterion is reached. So, in the time domain, the mean square error is defined as .The main disadvantage of this fitness function is that random seeds sometimes converge to local minima, so it is necessary to find an accurate estimator.
- Complex frequency domain fitness function. As an alternative approach one standard possibility is the use of a fitness function defined in the frequency domain. In this case, the parametric function passed to the optimization algorithm is also Equation (28). However, after reconstructing the synthetic time series it numerically calculates the complex spectrum and separates the real and imaginary parts. On the other hand, the sampled time series is transformed numerically into a frequency spectrum, also separating real and imaginary parts. The synthetic and sampled data are fed to the fitting function and the cycle is repeated until the stop criterion is reached. So, in this case the fitness function is defined as , where is the Fourier transform of the measured signal in the form stated above.
- Power spectrum based fitness function. The power spectrum approximation follows the same approach as the complex frequency approximation, but in this case the power spectrum is numerically calculated from the complex frequency, instead of having both real and imaginary parts separated. The fitting function to be optimized is evaluated from the power spectrum of the signals, . This choice tends to reduce the convergence problems, but the solutions achieved sometimes imply a loss in performance with respect to the two first fitness functions.In this case, as in the Complex Frequency domain estimation, it is possible to reduce the amount of frequency terms to be taken into consideration in order to reduce the computational cost of evaluating the fitness function without local minima problems, but the convergence tends to be very slow and requires multiple (usually more than six) runs to converge.
5. Proposed Combined Power Spectrum and Time Optimization
- The Time and Complex frequency domain fitness functions are very sensitive to local minima;
- The initial conditions make a difference in terms of convergence to local or global minimum;
- The power spectrum fitness function can reach the global minimum but after many iterations and is insensitive to initial conditions;
- The Time and Complex Frequency fitness functions quickly reach the minimum but are very sensitive to initial conditions and prone to reach local minima if the seeds are not adequate.
- Estimate the natural frequency seed as the peak frequency in the power spectrum;
- Estimate the damping factor, with the 3 dB bandwidth and the natural frequency known, solving from Equation (24). Notice that the usual range of damping factors in real applications is not very different from this estimation;
- Since the phase term and amplitude a are unknown at this point, they arerandomly initialized;
- Run the Time based estimation with the seeds obtained from the steps above.
6. Experimental Results
- First set of experiments processing synthetic data:
- −
- The primary objective is to measure the accuracy of the described methodologies, evaluating the errors in frequency and damping factors between the estimations and the ones used to generate the signals;
- −
- The secondary objective is to measure the computational cost of the different techniques.
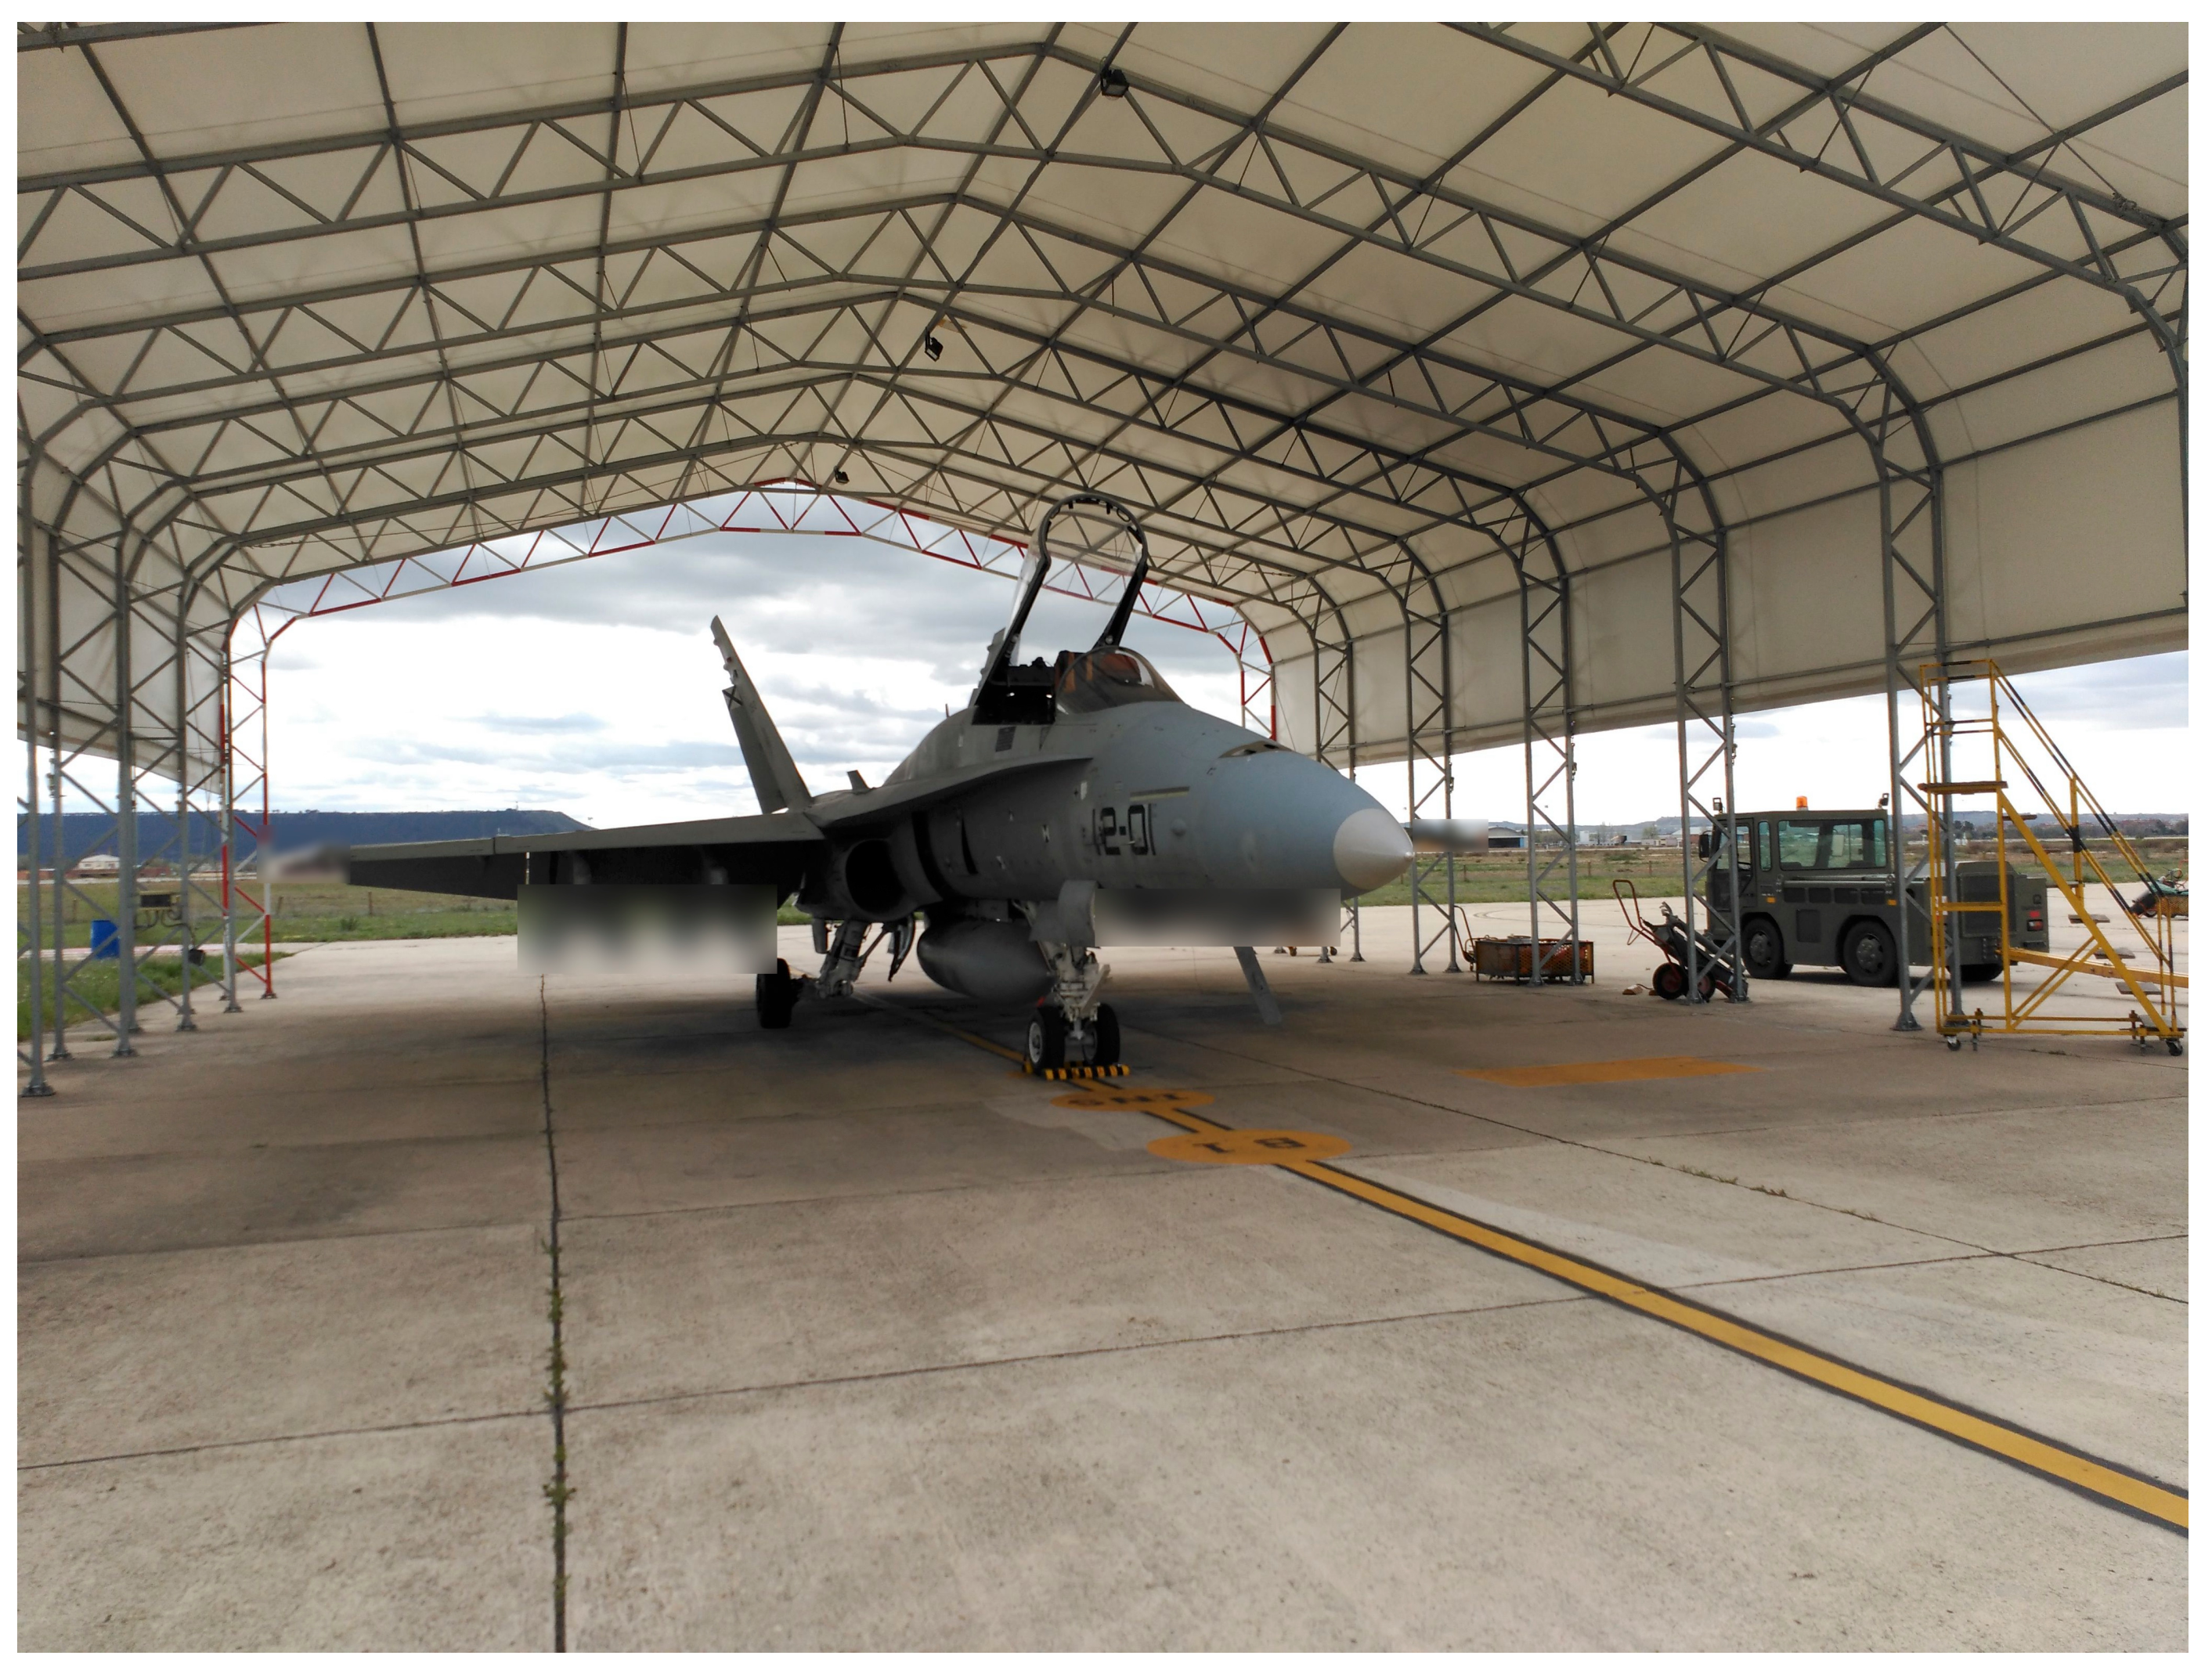
- Second set of experiments processing real Flight Test Data, obtained from Flutter Flight Tests performed on Spanish Air Force F-18:
- −
- The best two techniques obtained from the synthetic data experiments willbe employed;
- −
- The error will be assessed by performing a linear regression between the measured data and the reconstructed signal with the processed parameters and comparing the MSE of the normalized signals (normalized against the maximum amplitude of each real signal).
6.1. Multimodal Estimation of Simulated Data
6.1.1. Description of the Experiment Conditions
- Each signal lasts 5 s;
- The sampling frequency is 85 Hz;
- The parameters of each mode and signal were randomly selected from this range of parameters (notice the number of significant digits):
- −
- Natural frequency: 3.0 Hz 6.0 Hz;
- −
- Damping factor: 0.03 0.20;
- −
- Phase angle: ;
- −
- Amplitude: ;
- −
- White Gaussian noise SNR: 0 dB, 5 dB, 10 dB.
6.1.2. Analysis of Results


| Time Based Estim. | Complex Freq. Estim. | Power Spec. Estim. | Matrix Pencil Estim. | Peak Amplitude Estim. | Laplace Wavelet Estim. | PRESTO Mixed Estim. | |
|---|---|---|---|---|---|---|---|
| Num. of reps. | 6 | 6 | 10 | 1 | 1 | 1 | 2 |
| Time/est. | 4.1 s | 6.2 s | 25.6 s | 0.01 s | s | 0.06 s | 0.06 s |
| Avg. Err. SNR = 10 dB | 4.08% | 4.21% | 4.10% | 14.69% | 10.12% | 8.75% | 2.84% |
| Avg. Err. SNR = 5 dB | 6.41% | 6.78% | 6.16% | 14.69% | 10.17% | 8.78% | 4.37% |
| Avg. Err. SNR = 0 dB | 10.43% | 11.10% | 9.27% | 14.69% | 10.76% | 8.82% | 6.82% |
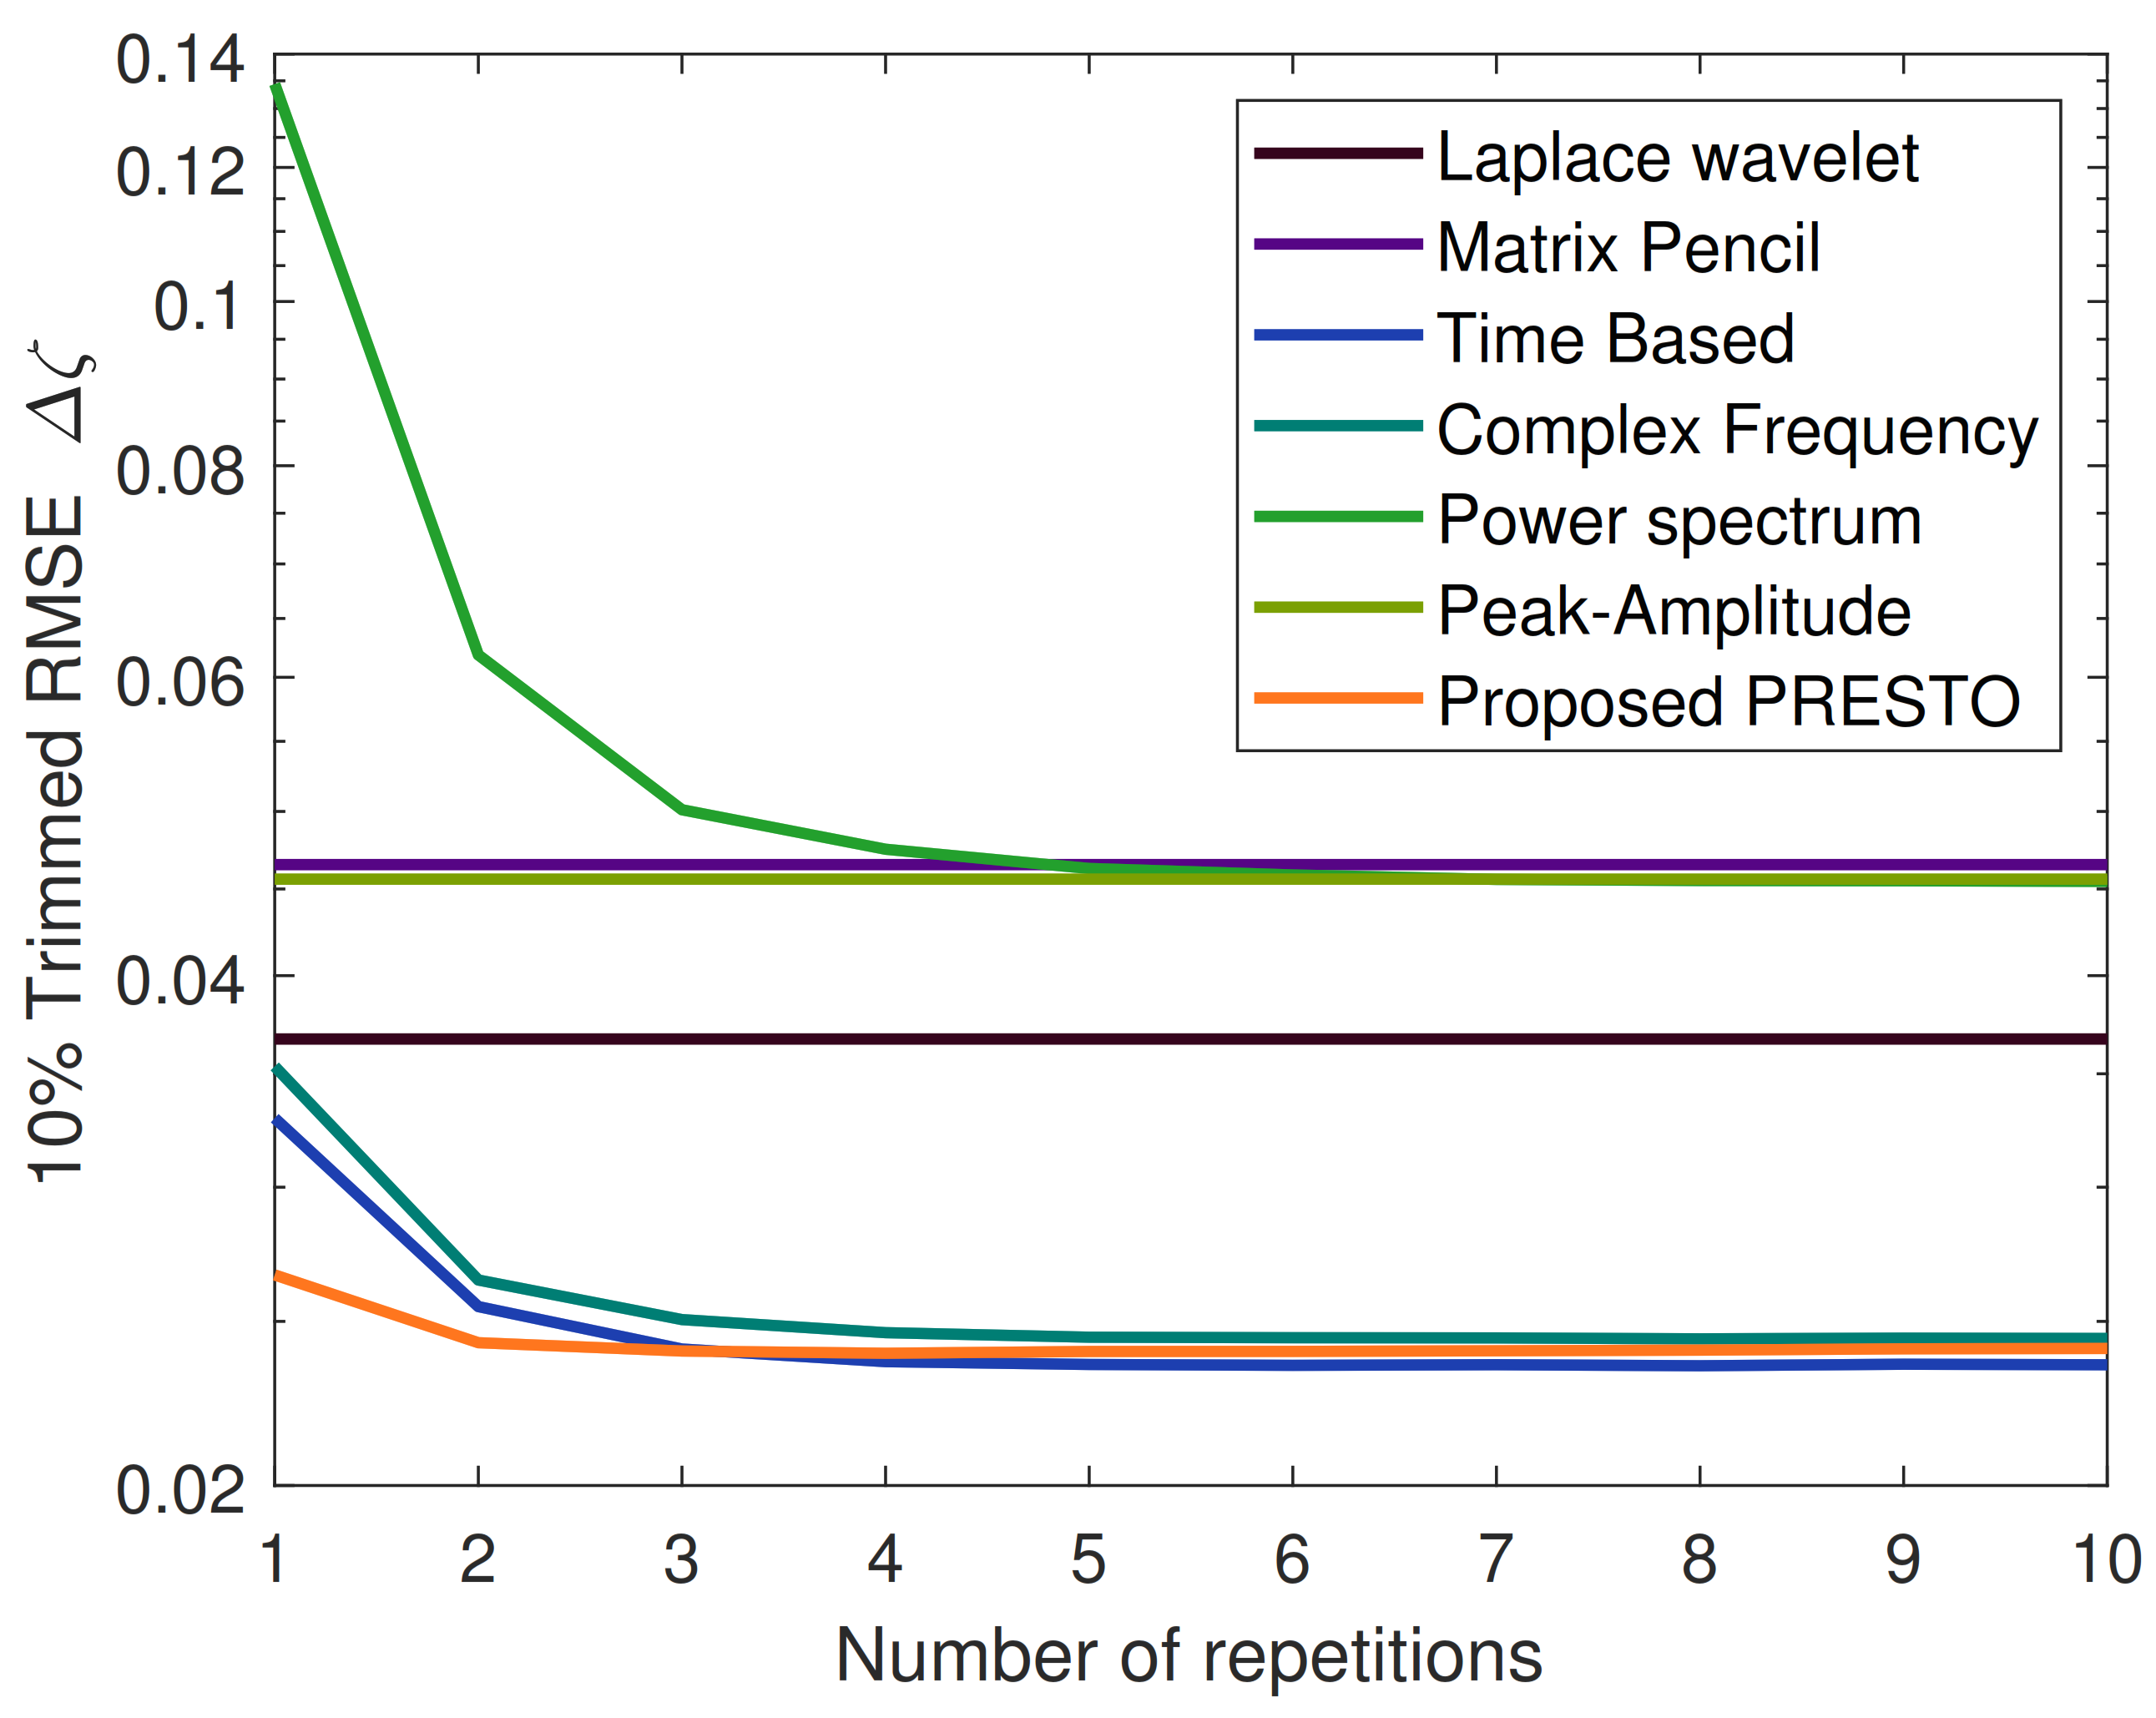
| RMSE SNR = 10 dB | 0.029 | 0.030 | 0.042 | 0.095 | 0.049 | 0.042 | 0.026 |
| RMSE SNR = 5 dB | 0.042 | 0.044 | 0.057 | 0.098 | 0.051 | 0.042 | 0.038 |
| RMSE SNR = 0 dB | 0.061 | 0.067 | 0.078 | 0.095 | 0.061 | 0.043 | 0.055 |
6.2. Multimodal Estimation of Real In-Flight Responses
6.2.1. Description of the Experiment Conditions
6.2.2. Analysis of Results


| Linear Regression Equation | |||
|---|---|---|---|
| Nominal value | Lower bound | Upper bound | |
| M | 0.8302 | 0.8264 | 0.8339 |
| N | −0.0007 | −0.0015 | 0.0001 |
| R-Squared coefficient | 0.716 | ||
| Linear Regression Equation | |||
|---|---|---|---|
| Nominal value | Lower bound | Upper bound | |
| M | 0.7856 | 0.7809 | 0.7903 |
| N | 0.0055 | 0.0045 | 0.0064 |
| R-Squared coefficient | 0.572 | ||
- Coupled plots (horizontally) represent the same original signal processed by the PRESTO technique (left) and Laplace Wavelet (right).
- The signals have been sorted by the MSE between the original and reconstructed signals, and obviously the MSE order is different for Laplace and PRESTO processing. Order 1 means the lowest MSE obtained during the reconstruction.


6.2.3. Comparison between PRESTO and Laplace Wavelet Techniques
7. Conclusions and Discussion
Author Contributions
Funding
Data Availability Statement
Acknowledgments
Conflicts of Interest
Appendix A. Support Figures

References
- Stoliker, F. Introduction to Flight Test Engineering (Introduction Aux Techniques des Essais en Vol); Technical Report; AGARD: Camarillo, CA, USA, 2005. [Google Scholar]
- Chajec, W.C. Methods of Modern Aircraft Aeroelastic Analyses in the Institute of Aviation. In Proceedings of the 44th International Scientific Congress on Powertrain and Transport Means, Czestochowa, Poland, 24–27 September 2018. [Google Scholar]
- Abou-kebeh LLano, S.; Vaquero Gomez, A. Flutter Testing at Spanish Air Force. In Proceedings of the 27th symposium of the Society of Flight Test Engineers, Nuremberg, Germany, 10–12 May 2016. [Google Scholar]
- MIL-STD-882. Standard Practice for System Safety; Technical Report; DoD: Dayton, OH, USA, 2000. [Google Scholar]
- EASA. CS-25. Certification Specifications and Acceptable Means of Compliance for Large Aeroplanes; Certification Standard; EASA: Cologne, Germany, 2019. [Google Scholar]
- MIL-A-8870C. Military Specification: Airplane Strength and Rigidity. Vibration, Flutter and Divergence; Technical Report; DoD: Dayton, OH, USA, 1993. [Google Scholar]
- JSSG-2006. Joint Service Specification Guide. Aircraft Structures; Technical Report; DoD: Dayton, OH, USA, 1998. [Google Scholar]
- MIL-HDBK-516C. Airworthiness Certification Criteria; Technical Report; DoD: Dayton, OH, USA, 2014. [Google Scholar]
- MSC. Software. MSC.Nastran Reference Manual; MSC Software GMBH: Munich, Germany, 2004. [Google Scholar]
- Zona Technology. ZAERO Engineers’ Toolkit for Aeroelastic Solutions; Theoretical Manual; Zona Technology: Scottsdale, AZ, USA, 2018. [Google Scholar]
- Peeters, B.; Hendricx, W.; Debille, J.; Climent, H. Modern Solutions for Ground Vibration Testing of Large Aircraft. Sound Vib. 2009, 43, 8. [Google Scholar] [CrossRef]
- Freudinger, L.C. Flutter Clearance of The F-18 High-Angle-of-Attack Research Vehicle with Experimental Wingtip Instrumentation Pods; Technical Report; NASA Dryden Flight Research Center: Edwards, CA, USA, 1989. [Google Scholar]
- Freudinger, L.C.; Lind, R.; Brenner, M.J. Correlation Filtering of Modal Dynamics using the Laplace Wavelet; Technical Report; NASA Dryden Flight Research Center: Edwards, CA, USA, 1997. [Google Scholar]
- Dimitriadis, G.; Cooper, J.E. A time-frequency technique for the stability analysis of impulse responses from nonlinear aeroelastic systems. J. Fluids Struct. 2003, 17, 1181–1201. [Google Scholar] [CrossRef]
- Kukreja, S.L. Nonlinear Aeroelastic System Identification with Application to Experimental Data; Technical Report; NASA Dryden Flight Research Center: Edwards, CA, USA, 2008. [Google Scholar] [CrossRef]
- Formenti, D.; Richardson, M. Paramenter Estimation from Frequency Response Measurements Using Rational Fraction Polynomials. In Proceedings of the 1st IMAC Conference, Orlando, FL, USA, 8–10 November 1982. [Google Scholar]
- Formenti, D.; Hill, M. Paramenter Estimation from Frequency Response Measurements Using Rational Fraction Polynomials (Twenty Years of Progress). In Proceedings of the 20th IMAC Conference, Los Angeles, CA, USA, 4–7 February 2002. [Google Scholar]
- Coll, F. JFlutter. Real Time Flutter Analysis in Flight Test; SFTE-EC; SFTE: Nuremberg, Germany, 2016. [Google Scholar]
- Kiviaho, J.F.; Jacobson, K.E.; Kennedy, G.J. Flutter boundary identification from time-domain simulations using the matrix pencil method. AIAA J. 2019, 57, 3639–3640. [Google Scholar] [CrossRef]
- Potts, D.; Tasche, M. Parameter estimation for exponential sums by approximate Prony method. Signal Process. 2010, 90, 1631–1642. [Google Scholar] [CrossRef] [Green Version]
- Almunif, A.; Fan, L.; Miao, Z. A tutorial on data-driven eigenvalue identification: Prony analysis, matrix pencil, and eigensystem realization algorithm. Int. Trans. Electr. Energy Syst. 2020, 30, 1–17. [Google Scholar] [CrossRef] [Green Version]
- Barros-Rodriguez, J.; Flores Le Roux, R.; Lopez-Diez, J.; Martinez-Val, R. Frequency and damping identification in flutter flight testing using singular value decomposition and QR factorization. Proc. Inst. Mech. Eng. Part J. Aerosp. Eng. 2015, 229, 323–332. [Google Scholar] [CrossRef] [Green Version]
- Dimitriadis, G.; Cooper, J.E. Flutter Prediction from Flight Flutter Test Data. J. Aircr. 2001, 38, 355–367. [Google Scholar] [CrossRef]
- Dimitriadis, G.; Cooper, J.E. Comment on “Flutter prediction from Flight Flutter Test Data”. J. Aircr. 2006, 43, 862–863. [Google Scholar] [CrossRef]
- Abbasi, A.A.; Cooper, J.E. Statistical Evaluation of Flutter Boundaries from flight flutter test data. Aeronaut. J. 2009, 113, 41–51. [Google Scholar] [CrossRef]
- Lind, R. Flight-Test Evaluation of Flutter Prediction Methods. J. Aircr. 2003, 40, 964–970. [Google Scholar] [CrossRef]
- Henshaw, M.J.C.; Badcock, K.J.; Vio, G.A.; Allen, C.B.; Chamberlain, J.; Kaynes, I.; Dimitriadis, G.; Cooper, J.E.; Woodgate, M.A.; Rampurawala, A.M.; et al. Non-linear aeroelastic prediction for aircraft applications. Prog. Aerosp. Sci. 2007, 43, 65–137. [Google Scholar] [CrossRef]
- Zimmerman, N.H.; Weissenburger, J.T. Prediction of flutter onset speed based on flight testing at subcritical speeds. J. Aircr. 1964, 1, 190–202. [Google Scholar] [CrossRef]
- Ewins, D.J. Modal Testing: Theory, Practice and Application, 2nd ed.; Research Studies Press: Baldock, Hertfordshire, UK, 2000. [Google Scholar]
- Hidalgo Martinez, M. Teoria de Vibraciones; Universidad de Cordoba: Cordoba, Spain, 2010. [Google Scholar]
- Bisplinghoff, R.L.; Ashley, H.; Halfman, R.L. Aeroelasticity; Dover Publications: Mineola, NY, USA, 1983. [Google Scholar]
- Fung, Y.C. An Introduction to the Theory of Aeroelasticity; Dover Publications: Mineola, NY, USA, 2008. [Google Scholar]
- Wright, J.R.; Cooper, J.E.E. Introduction to Aircraft Aeroelasticity and Loads; John Wiley & Sons: Hoboken, NJ, USA, 2008. [Google Scholar]
- Silva, W.A.; Langley, N.; Dunn, S. Higher-Order Spectral Analysis of F-18 Flight Flutter Data. In Proceedings of the 46th AIAA/ASME/ASCE/AHS/ASC Structures, Structural Dynamics & Materials Conference, Austin, TX, USA, 18–21 April 2005. [Google Scholar]
- Adhikari, S. Damping models for structural vibration. Eng. Dep. 2000, 228. [Google Scholar] [CrossRef]
- French, A.P. Vibrations and Waves; Nelson and Thornes: Cheltenham, UK, 1971. [Google Scholar]
- Shabana, A.A. Theory of Vibration; Mechanical Engineering Series; Springer: New York, NY, USA, 1996. [Google Scholar] [CrossRef]
- Meirovitch, L. Fundamentals of Vibrations, 1st ed.; McGraw-Hill: New York, NY, USA, 2000. [Google Scholar]
- Goodwin, M. Matching pursuit with damped sinusoids. In Proceedings of the 1997 IEEE International Conference on Acoustics, Speech, and Signal Processing, Munich, Germany, 21–24 April 1997; Volume 3, pp. 2037–2040. [Google Scholar] [CrossRef]
- Zhu, T.X. Detection and characterization of oscillatory transients using matching pursuits with a damped sinusoidal dictionary. IEEE Trans. Power Deliv. 2007, 22, 1093–1099. [Google Scholar] [CrossRef]
- Coleman, T.F.; Li, Y. An interior trust region approach for nonlinear minimization subject to bounds. SIAM J. Optim. 1996, 6, 418–445. [Google Scholar] [CrossRef] [Green Version]
- Yuan, Y.X. A Review of Trust Region Algorithms for Optimization. In Proceedings of the 4th International Congress on Industrial and Applied Mathematics (ICIAM), Edinburg, UK, 5–9 July 1999. [Google Scholar]
- Patel, V.S.; Bhil, S.K.; Kazi, F.S.; Wagh, S.R. Energy-sorted Prony analysis for identification of dominant low frequency oscillations. In Proceedings of the 3rd Australian Control Conference (AUCC), Perth, Australia, 4–5 November 2013; Volume 1, pp. 85–90. [Google Scholar] [CrossRef]
- Abou-Kebeh Llano, S. Aeroelastic Data Processing via Matching Pursuit Method; Universidad de Alcala: Alcala de Henares, Madrid, Spain, 2013. [Google Scholar]

Publisher’s Note: MDPI stays neutral with regard to jurisdictional claims in published maps and institutional affiliations. |
© 2021 by the authors. Licensee MDPI, Basel, Switzerland. This article is an open access article distributed under the terms and conditions of the Creative Commons Attribution (CC BY) license (https://creativecommons.org/licenses/by/4.0/).
Share and Cite
Abou-Kebeh, S.; Gil-Pita, R.; Rosa-Zurera, M. Multimodal Estimation of Sine Dwell Vibrational Responses from Aeroelastic Flutter Flight Tests. Aerospace 2021, 8, 325. https://doi.org/10.3390/aerospace8110325
Abou-Kebeh S, Gil-Pita R, Rosa-Zurera M. Multimodal Estimation of Sine Dwell Vibrational Responses from Aeroelastic Flutter Flight Tests. Aerospace. 2021; 8(11):325. https://doi.org/10.3390/aerospace8110325
Chicago/Turabian StyleAbou-Kebeh, Sami, Roberto Gil-Pita, and Manuel Rosa-Zurera. 2021. "Multimodal Estimation of Sine Dwell Vibrational Responses from Aeroelastic Flutter Flight Tests" Aerospace 8, no. 11: 325. https://doi.org/10.3390/aerospace8110325
APA StyleAbou-Kebeh, S., Gil-Pita, R., & Rosa-Zurera, M. (2021). Multimodal Estimation of Sine Dwell Vibrational Responses from Aeroelastic Flutter Flight Tests. Aerospace, 8(11), 325. https://doi.org/10.3390/aerospace8110325