Article

Strength Evaluation and Failure Analysis of the Vortex Reducer under Overspeed Condition

1
School of Energy and Power Engineering, Beihang University, Beijing 100083, China
2
Jiangxi Research Institute, Beihang University, Beijing 100191, China
3
Research and Development Center, AECC Commercial Aircraft Engine Co., Ltd., Shanghai 201108, China
*
Author to whom correspondence should be addressed.
Aerospace 2021, 8(12), 394; https://doi.org/10.3390/aerospace8120394
Submission received: 28 October 2021 / Revised: 30 November 2021 / Accepted: 7 December 2021 / Published: 13 December 2021
(This article belongs to the Section Aeronautics)

Abstract

:
Rotating parts of aeroengines need to have a high speed margin according to the civil aviation airworthiness regulations. Previous studies on burst speed are based on mechanical properties of standard specimens. In this paper, a new method for predicting burst speed by means of a tensile test of a simulative specimen is proposed, and the predicted results are compared with the traditional method. The results show that the stress gradient of the designed simulative specimen and the assessment location of vortex reducer are in good agreement, which indicates that they have similar stress characteristics. The burst speed predicted by the new method is greater than the traditional method. Both prediction methods can provide a reference for such a structure in the design stage. In addition, the overspeed test of a vortex reducer is carried out, and the results verify that it still has sufficient strength reserves at 120% relative speed.

1. Introduction

During the cooling process from the compressor to the turbine, the flow loss of the airflow in the rotating disk cavity is large. In order to achieve the expected cooling effect, it is necessary to increase the flow rate of the cold air, but it will lead to a decrease in the overall performance of the aeroengine. A vortex reducer is used to improve this adverse effect, which is the functional structure of the current high bypass-ratio turbofan engine, and has been applied in various types of engines [1].
A vortex reducer is usually installed on the disk of the last stage of a high-pressure compressor using a bolt connecting structure, which is mainly composed of a support ring and a series of air tubes, as shown in Figure 1 [2]. With the structure rotating at high speed, the pressure loss of the induced gas can be reduced [3]. This structure can be used in large commercial aeroengines to improve the cooling effect, but the burst speed of the rotor structure must be evaluated before engineering applications.
Nowadays, many studies have carried out theoretical analysis and numerical calculation of the burst speed of different structures, especially the disk of aeroengines, and also carried out burst tests [4]. Genta et al. [5] studied the stress distribution of an orthotropic rotary disk. Reddy et al. [6] and Guven [7] analyzed the stress distribution of elastic and elasto-plastic disks with different thicknesses and densities, respectively. Eraslan et al. [8] proposed the analytical solution of the elasto-plastic stress of variable thicknesses of disk based on the Tresca yield criterion. You et al. [9] proposed a unified numerical method to analyze the deformation and stress of elasto-plastic disks with arbitrary cross-sections, continuous thickness change and arbitrary density change made of a nonlinear strain hardening material. In addition, many studies have also calculated the stress and strain distribution of disks under different types of load [10,11,12]. Accurate calculation of stress distribution is the basis for predicting the burst speed. The failure types of the disk are generally divided into “rim peel” burst and “hoop mode” burst. The average hoop stress method and the local plastic strain method are commonly used in the engineering calculation of burst speed [13,14,15]. Hong et al. [16] presented a large deformation analytical method to calculate the burst speed, which is in good agreement with the experimental results. Squarcella [17] studied the numerical prediction method of the burst speed based on finite element (FE) simulation. Wan et al. [18] established the burst speed criterion related to material elongation, and carried out experimental verification. In addition, other prediction methods of burst speed are based on elasto-plastic FE analysis, and good prediction accuracy is obtained [19,20]. However, the burst speed test of an actual structure costs a lot, and the current studies on the prediction of burst speed are usually aimed at the disk of the engine. For the above reasons, a new method that can predict the burst speed of the vortex reducer with lower cost needs to be developed.
This paper is organized as follows: firstly, the FE analysis is used to obtain the stress of the vortex reducer assessment location under working conditions, which provides the basis for designing the overspeed test. Secondly, the connecting structure of the overspeed test is designed to make the stress under the test condition and the working condition basically consistent. Then, the overspeed test is carried out. Finally, the method based on the tensile test of a simulative specimen is used to predict the burst speed of the vortex reducer and is compared with the traditional method.

2. Stress Analysis of the Vortex Reducer

2.1. Structure of the Vortex Reducer

The structure of the vortex reducer studied in this paper is shown in Figure 2, which mainly includes two parts: the support ring and the air tubes. A total of 18 air tubes pass through the support ring holes and are fixed by the collar. The vortex reducer is located between the two-stage high-pressure compressors, and is fixed on the front-stage high-pressure compressor disk with a large nut. It rotates with the high-pressure rotor to extract the air.

2.2. FE Analysis under Working Condition

The 1/18 sector FE mesh is established according to the simplified cyclic symmetry structure as shown in Figure 3, which includes the vortex reducer and connected disks. The eight-node hexahedral elements are used in the calculation through the FE analysis software ABAQUS with a total of 108,394 elements and 137,820 nodes. The material of the structure is the high-strength GH4169 alloy (Grade in America: Inconel 718), and the mass percentage of components is shown in Table 1. The elastic stress distribution at 100% and 120% relative speed is calculated, respectively. The other load boundary conditions applied are as follows: (1) temperature field (as shown in Figure 4); (2) centrifugal force of the blades (by applying the equivalent pressure at groove of the disk); and (3) pressure in the disk cavity (as shown in Figure 5).
The stress distribution under two rotational speeds is consistent except for the absolute value, so only the results under 120% relative speed are extracted, as shown in Figure 6. The results show that there is a large stress concentration at the edge of the support ring hole. From the calculation results of hoop stress and equivalent stress, the position has entered plasticity.

3. Overspeed Test of the Vortex Reducer

3.1. Design of the Test

3.1.1. Design of the Connecting Structure

In order to carry out an overspeed test in laboratory conditions, it is necessary to design a connecting structure to install the vortex reducer on the rotating test bench, as shown in Figure 7.
Connecting structure part A: The part identified as A in Figure 7 is a circular structure. Its function is to simulate the connecting between the vortex reducer and the seven-stage disk (connected by a large nut). It is axially connected to part B through 18 bolts on the outer edge.
Connecting structure part B: The part identified as B in Figure 7 is used to connect part A and the shaft of the rotating test bench. It is axially connected to part A through 18 M6 bolts on the outer edge, and connected to the rotating shaft of the rotating test bench through 6 M8 bolts at the center of the part.
During installation, part A is connected to the vortex reducer through a large nut, and then part B is bolted on the rotating shaft of the rotating test bench. Finally, part A and part B are connected with bolts.
It should be noted that, according to the numerical simulation results of the previous work, the support ring of the vortex reducer will not come into contact with the rear disk when the speed increases. Therefore, the simulative structure of the rear disk is not added into the design of the connecting structure.

3.1.2. FE Analysis under Test Condition

The 1/6 sector finite element mesh is established as shown in Figure 8. The eight-node hexahedral elements are used in the calculation through the FE analysis software ABAQUS with a total of 242,726 elements and 290,220 nodes. The elastic stress distribution at 100% and 120% relative speed is calculated, respectively, the same as the working condition. The temperature field is uniform at 500 °C. The stress distributions of the support ring at 120% relative speed are shown in Figure 9.

3.1.3. Stress Comparison under Working Condition and Test Condition

The results of FE analysis show that the dangerous positions of the two models are at the edge of the supporting ring hole. The maximum hoop stress and equivalent stress are extracted, as shown in Table 2. It can be seen from Table 2 that the error of the two calculation conditions decreases with the increase in rotational speed, and is within 5% at 120% relative speed. Therefore, the designed test can evaluate the performance of the actual structure under overspeed condition.

3.2. The Process and Result of the Test

The 100% and 120% overspeed tests of the vortex reducer are carried out on a rotor high-speed rotating tester, as shown in Figure 10. The following work needs to be carried out before the test starts: the vacuum chamber needs to be vacuumed and the vacuum must be less than 500 Pa; dynamic balance and speed adjustment tests of the assembly are performed; and the chamber is heated up to the specified temperature (500 °C) for 30 min.
The test process is as follows: (1) the test is carried out under 100% relative speed test, and dwell loading for 5 min; (2) after the vortex reducer is qualified, the test is carried out under the 120% overspeed test, and dwell loading for 5 min, as shown in Figure 11. Fluorescence nondestructive examination (as shown in Figure 12) and radial dimension measurement are performed after each test to confirm whether the vortex reducer is damaged.
After the test, the surface of the support ring and air tubes is not damaged by visual inspection. Then, these components are subjected to fluorescence nondestructive examination, which shows that there are no cracks and other defects on the surface. In addition, the radial dimensions of the support ring remain constant. This indicates that the vortex reducer has a high strength margin.

4. Prediction of the Burst Speed

4.1. Failure Strength of the Edge of Support Ring Hole

The numerical calculation shows that the edge of the support ring hole is a dangerous position for the vortex reducer, and obtaining its failure strength is key to predicting the burst speed. The method used in this paper is designing a simulative specimen which has a similar stress gradient to the support ring hole. Then, a tensile failure test is carried out to obtain the failure strength. Schematic diagrams of the dangerous sections of the supporting ring and the simulative specimen are shown in Figure 13 and Figure 14, respectively.

4.1.1. Design of a Simulative Specimen

According to the geometrical characteristics of the hole in the support ring, the form of the simulative specimen is designed as shown in Figure 15. By adjusting the critical dimensions, the stress gradient of the hole edge of the simulative specimen and the support ring is consistent.
According to the size of the support ring, the size of the specimen is calculated as follows: r1 = 2.5 mm; d/2 = 2.2 mm; r2 = 9 mm; W = 12 mm; T = 2 mm. Then, it is important to check whether the stress gradient of the specimen is consistent with the structure. The established FE model and boundary conditions are shown in Figure 16.
The elastic stress distribution in normalized distance and normalized stress at the hole edge of the simulative specimen and the support ring is illustrated in Figure 17. In the figure, the abscissa is normalized by the notch radius (x is the distance from the root of the notch along the normal direction of the arc; r is the radius of the notch root arc) and the ordinate is normalized by the stress (σ is the stress from the root of the notch along the normal direction of the arc; σmax is the maximum stress at the root of the notch). The results show that the stress gradient of the simulative specimen is in good agreement with the support ring hole. Therefore, the specimen can be used for strength assessment of such structures.

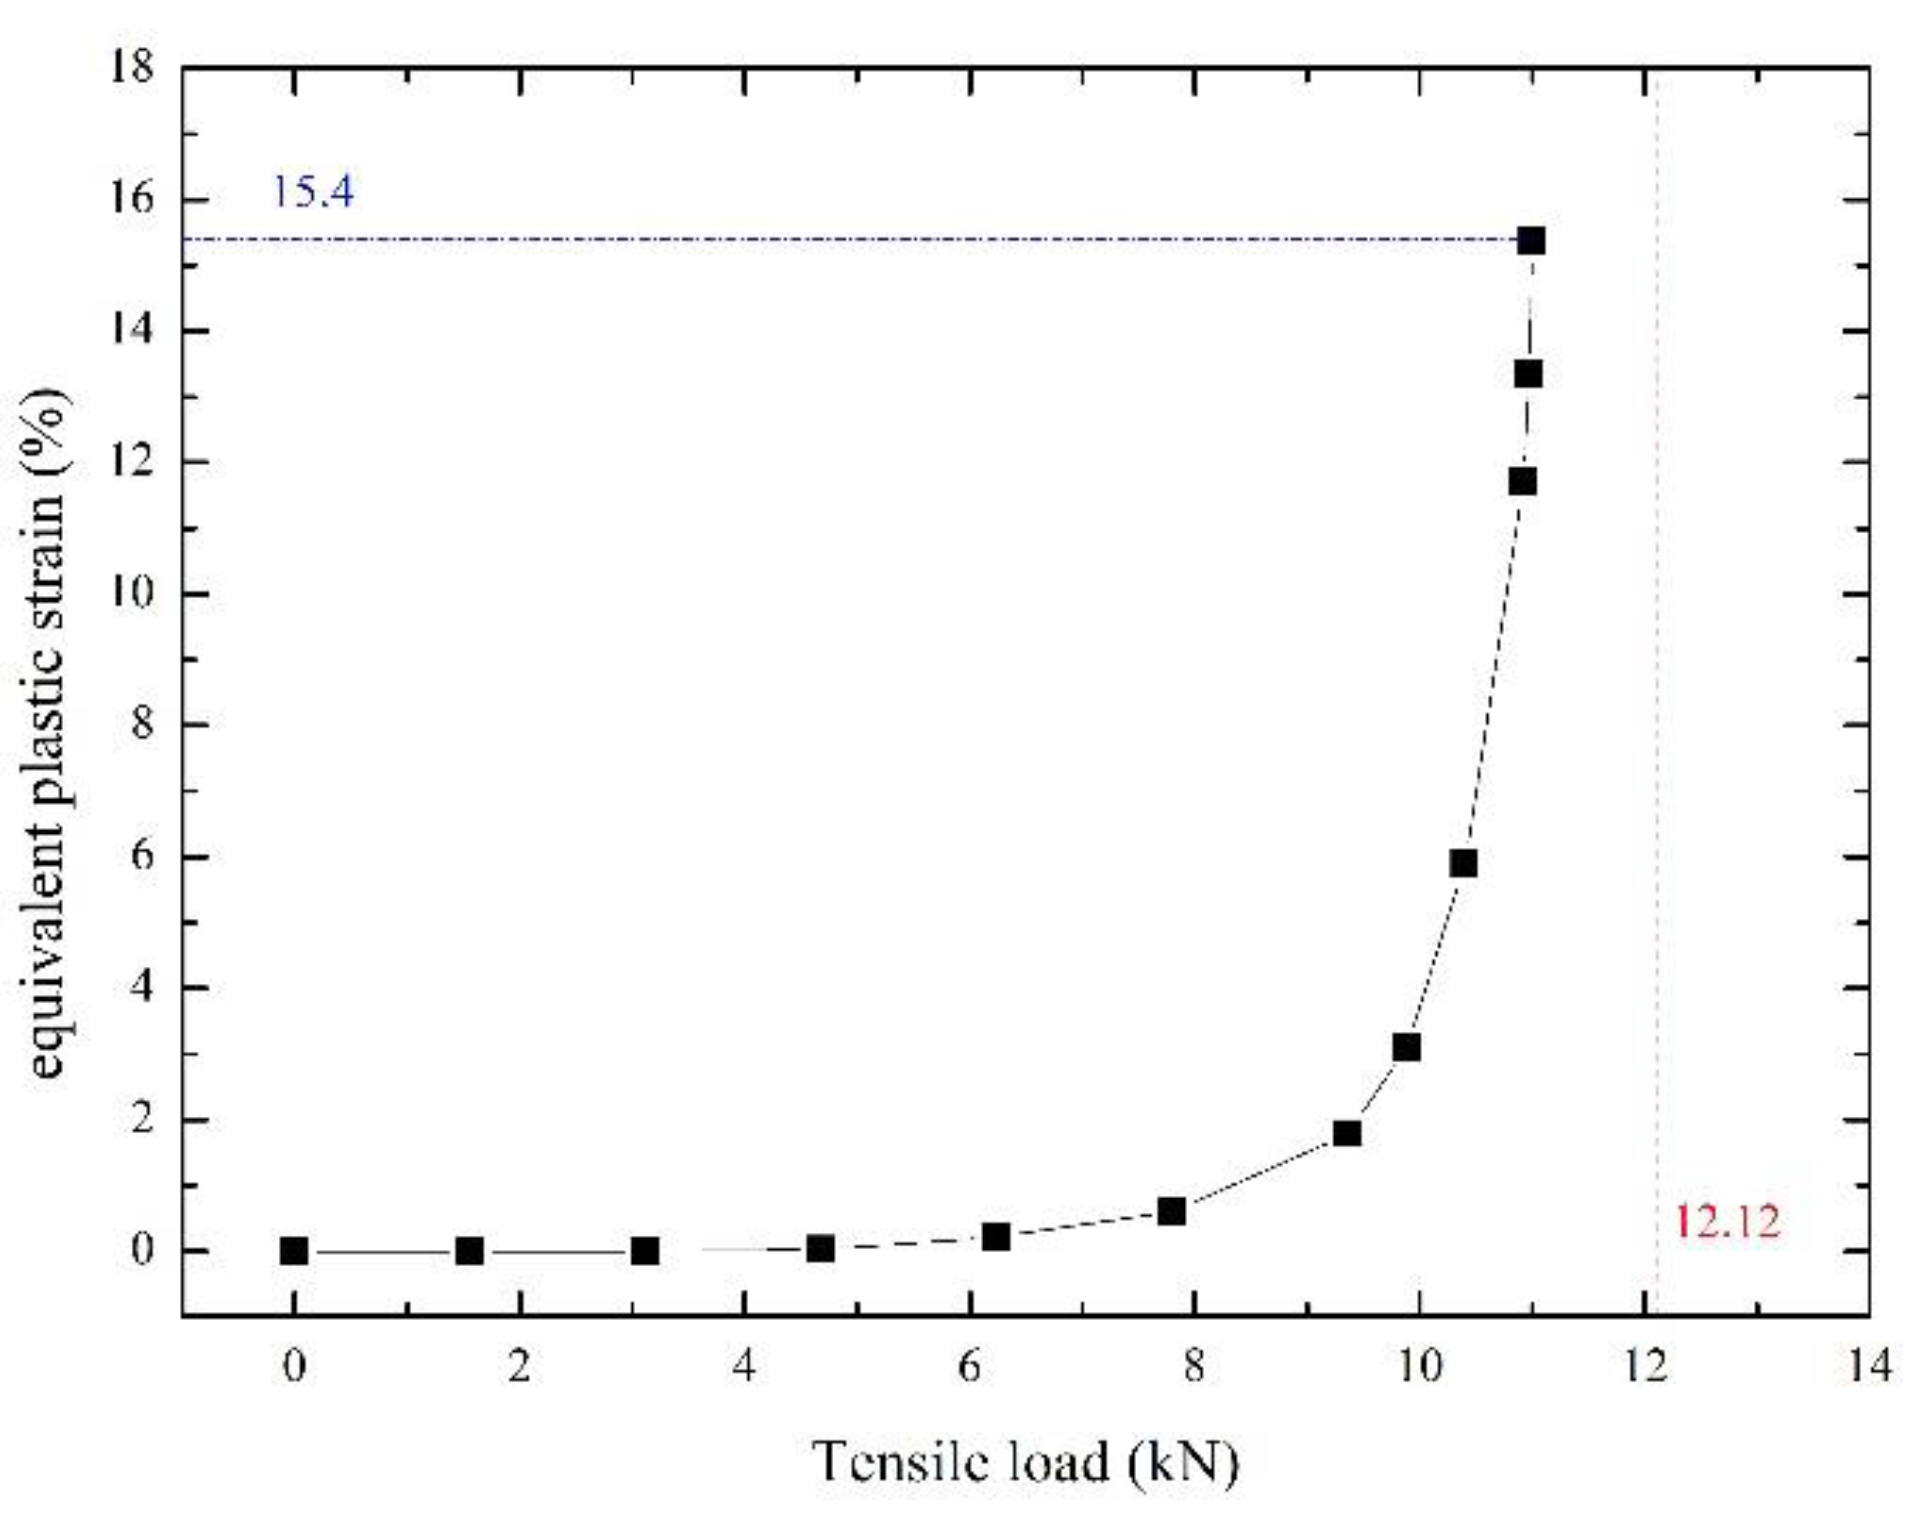
4.1.2. Tensile Test of Simulative Specimen

According to the size of Figure 15 and the fixture of the test equipment, two kinds of simulative specimen are designed and processed. The geometric dimensions of the middle working sections are completely identical, but one is clamped by pin holes and the other is clamped by hydraulic pressure, as shown in Figure 18.
The specimens are slowly stretched until fracturing at 500 °C. The available number of S1 specimens and S2 specimens is three and five, respectively. The test results are shown in Table 3. The maximum load error of the two kinds of specimens during the test is within 3%.
The fracture form of the specimen after the experiment is shown in Figure 19. It can be seen from Figure 19 that the fracture of both specimens occurs at the hole edge.

4.2. Calculation of Burst Speed

4.2.1. Based on Failure Strength of the Simulative Specimen

The monotonic tensile elastic-plastic FE analysis is carried out on the simulative specimen. The FE model is the same as Figure 16, except for the material properties. A true stress–strain curve is used in the calculation because of the large deformation, as shown in Figure 20.
The variation of maximum equivalent plastic strain, the average equivalent stress and the average tensile direction stress on the dangerous section with tensile load of the testing machine are obtained in the calculation process, as shown in Figure 21, Figure 22 and Figure 23. The red dotted line is the minimum tensile load in Table 3. It can be seen from the diagram that the FE analysis does not converge before reaching the tensile load of the test due to the large mesh deformation. The maximum equivalent plastic strain, the average equivalent stress and the average tensile stress on the dangerous section obtained when the calculation does not converge are used as the failure criteria of the specimen, as shown in Table 4. Meanwhile, they are also used as the failure criteria of the support ring of the vortex reducer. Because the failure criterion of the specimen is conservative compared with the test, the prediction results of the burst speed obtained by this method are also conservative.
Then, the elastic-plastic FE analysis of the vortex reducer is carried out, and the calculation speed is continuously increased until it does not converge. The maximum equivalent plastic strain, the average equivalent stress and the average hoop stress on the dangerous section are obtained in the calculation process. Figure 24, Figure 25 and Figure 26 shows the variation of maximum equivalent plastic strain, average equivalent stress and average hoop stress on the dangerous section with the increase in the speed. The horizontal red dotted line in the diagram is the failure criteria in Table 4, and the intersection of the two lines is the predicted value of the burst speed. The predicted burst speeds of different failure criteria are shown in Table 5.

4.2.2. Based on the Average Hoop Stress Method

For comparison with the results of the traditional burst speed prediction method, the average hoop stress method is used to calculate the burst speed of the structure. The method is as follows:
n b n max = η σ b σ AHS ,
where nb is the predicted burst speed; nmax is the maximum steady speed (100% speed); η is an empirical parameter; σb is the tensile strength of the smooth specimen; and σAHS is the average hoop stress of 100% speed. The values of each parameter and the predicted burst speed are shown in Table 6.

5. Conclusions

In this paper, the FE analysis of the vortex reducer under working condition is carried out. The overspeed test is designed, and no damage occurs after the 120% relative speed test. The test results show that the burst margin of the vortex reducer is high due to its small rotation radius.
Based on the method of predicting the burst speed of a disk, the method for predicting the burst speed of rotating thin-walled parts with stress concentration is developed in this paper. In this method, the tensile fracture test of a simulative specimen is used as the criterion of structural failure. The stress gradient of the simulative specimen designed in this paper is in good agreement with the structure, which can accurately describe the structural stress characteristics.
The results predicted by the new method which combines the tensile test of the simulative specimen and finite element analysis are slightly higher than those produced by the traditional method. This indicates that the developed method can provide a reference for such structures in the design stage.
There are still some shortcomings in this study, in that the burst test of the vortex reducer is not carried out due to financial constraints, the research cycle and other reasons, and so the test value of burst speed cannot be obtained. This work will be carried out in the future.

Author Contributions

Conceptualization, M.M. and D.W.; methodology, M.M. and D.W.; validation, M.M.; formal analysis, M.M.; investigation, M.M.; resources, M.M.; data curation, M.M.; writing—original draft preparation, M.M.; writing—review and editing, M.M. and D.W.; supervision, Y.W.; project administration, D.L. and H.Z.; funding acquisition, D.W. All authors have read and agreed to the published version of the manuscript.

Funding

This work is supported by the National Science and Technology Major Project No. J2019-IV-0012-0080.

Institutional Review Board Statement

Not applicable.

Informed Consent Statement

Not applicable.

Data Availability Statement

Not applicable.

Acknowledgments

We thank Hai-jun XUAN and his team at Zhejiang University for their help in performing the tests.

Conflicts of Interest

The authors declare no conflict of interest.

References

  1. Negulescu, D.; Pfitzner, M. Secondary air systems in aeroengines employing vortex reducers. In Proceedings of the ASME Turbo Expo: Power for Land, Sea, & Air, New Orleans, LA, USA, 4–7 June 2001. [Google Scholar]
  2. Pfitzner, M.; Waschka, W. Development of an aero engine secondary air system employing vortex reducers. In Proceedings of the 22nd ICAS Congress, Harogate, UK, 27 August–1 September 2000. [Google Scholar]
  3. Peitsch, D.; Stein, M.; Hein, S.; Niehuis, R.; Reinmöller, U. Numerical investigation of vortex reducer flows in the high pressure compressor of modern aeroengines. In Proceedings of the ASME Turbo Expo 2002: Power for Land, Sea, and Air, Amsterdam, The Netherlands, 3–6 June 2002. [Google Scholar]
  4. Percy, M.J.; Ball, K.; Mellor, P.B. An experimental study of the burst strength of rotating disks. Int. J. Mech. Sci. 1974, 16, 809–817. [Google Scholar] [CrossRef]
  5. Genta, G.; Gola, M. The stress distribution in orthotropic rotating discs. J. Appl. Mech. 1981, 48, 559–562. [Google Scholar] [CrossRef]
  6. Reddy, T.Y.; Srinath, H. Elastic stresses in a rotating anisotropic annular disk of variable thickness and variable density. Int. J. Mech. Sci. 1974, 16, 85–89. [Google Scholar] [CrossRef]
  7. Guven, U. Elastic plastic stress in a rotating annular disk of variable thickness and variable density. Int. J. Mech. Sci. 1992, 34, 133–138. [Google Scholar] [CrossRef]
  8. Eraslan, A.N.; Orcan, Y. On the rotating elastic -plastic solid disks of variable thickness having concave profiles. Int. J. Mech. Sci. 2002, 44, 1445–1466. [Google Scholar] [CrossRef]
  9. You, L.H.; Tang, Y.Y.; Zhang, J.J.; Zheng, C.Y. Numerical analysis of elasto-plastic rotating disks with arbitrary variable thickness and density. Int. J. Solids Struct. 2000, 37, 7809–7820. [Google Scholar] [CrossRef]
  10. Maruthi, B.H.; Venkatarama, R.; Channakeshavalu, K. Finite element formulation for prediction of overspeed and burst margin limits in Aero engine disc. Int. J. Soft Comput. Eng. 2012, 2, 172–176. [Google Scholar]
  11. Vullo, V.; Vivo, F. Elastic stress analysis of non-linear variable thickness rotating disks subjected to thermal load and having variable density along the radius. Int. J. Solids Struct. 2008, 45, 5337–5355. [Google Scholar] [CrossRef]
  12. Hassani, A.; Hojjati, M.H.; Farrahi, G.H.; Alashti, R.A. Semi-exact solution for thermomechanical analysis of functionally graded elastic–strain hardening rotating disks. Commun. Nonlinear Sci. Numer. Simul. 2012, 17, 3747–3762. [Google Scholar] [CrossRef]
  13. Kumar, R.; Ranjan, V.; Kumar, B. Finite element modelling and analysis of the burst margin of a gas turbine disc using an area weighted mean hoop stress method. Eng. Fail. Anal. 2018, 90, 425–433. [Google Scholar] [CrossRef]
  14. Maziere, M.; Besson, J.; Forest, S.; Tanguy, B.; Chalons, H.; Vogel, F. Overspeed burst of elastoviscoplastic rotating disks—Part I: Analytical and numerical stability analyses. Eur. J. Mech. Ser. A Solids 2009, 28, 36–44. [Google Scholar] [CrossRef]
  15. Maziere, M.; Besson, J.; Forest, S.; Tanguy, B.; Chalons, H.; Vogel, F. Overspeed burst of elasticviscoelastic rotating disks: Part II—Burst of a superalloy turbine disk. Eur. J. Mech. Ser. A Solids 2009, 28, 428–432. [Google Scholar] [CrossRef]
  16. Hong, Q.; Zheng, Q.; Wang, P.; Hou, G. A New Method for Calculating Burst Speed of Aeroengine Disks. J. Eng. Gas Turbines Power 1992, 114, 334–337. [Google Scholar]
  17. Squarcella, N.; Firrone, C.M.; Allara, M.; Gola, M. The importance of the material properties on the burst speed of turbine disks for aeronautical applications. Int. J. Mech. Sci. 2014, 84, 73–83. [Google Scholar] [CrossRef]
  18. Wan, J.Y.; Zhou, B.Z. Elastic-plastic Disc Burst Criteria Establishment and Variable Thickness Disk Burst Rotational Speed. Aeroengine 2011, 37, 4–6. (In Chinese) [Google Scholar]
  19. Feng, Y.L.; Wu, C.B.; Gao, P.; Chen, W. Analysis of power metallurgy superalloy turbine disc’s burst speed. J. Aerosp. Power 2013, 28, 501–506. (In Chinese) [Google Scholar]
  20. Li, H.; Wang, K.; Zhang, C.; Wang, W.; Chen, G. Prediction of Rotor Burst Using Strain-Based Fracture Criteria to Comply With the Engine Airworthiness Regulation. In Proceedings of the ASME Turbo Expo 2020: Turbomachinery Technical Conference and Exposition 2020, Online, 21–25 September 2020. [Google Scholar]
Figure 1. Schematic diagram of vortex reducer.
Aerospace 08 00394 g001
Figure 2. Vortex reducer and its installation position: (a) Three dimensional model; (b) Position diagram.
Aerospace 08 00394 g002
Figure 3. FE model of the vortex reducer and the disk (1/18 sector).
Aerospace 08 00394 g003
Figure 4. Temperature field (unit: °C, NT11 represents the node temperature).
Aerospace 08 00394 g004
Figure 5. Pressure in the disk cavity.
Aerospace 08 00394 g005
Figure 6. Stress distribution of support ring under working condition (120% relative speed, unit: MPa): (a) Hoop stress; (b) Equivalent stress.
Aerospace 08 00394 g006
Figure 7. Schematic diagram of the vortex reducer and its connecting structure.
Aerospace 08 00394 g007
Figure 8. FE model of the vortex reducer and connecting structure under the test condition (1/6 sector).
Aerospace 08 00394 g008
Figure 9. Stress distribution of support ring under test condition (120% relative speed, unit: MPa): (a) Hoop stress; (b) Equivalent stress.
Aerospace 08 00394 g009
Figure 10. Test equipment: (a) The rotor high-speed rotating tester; (b) Installation schematic.
Aerospace 08 00394 g010
Figure 11. Change in relative speed with time.
Aerospace 08 00394 g011
Figure 12. Fluorescence nondestructive examination: (a) The air tubes; (b) The support ring.
Aerospace 08 00394 g012
Figure 13. Diagram of dangerous section of the supporting ring.
Aerospace 08 00394 g013
Figure 14. Diagram of dangerous section of the simulative specimen.
Aerospace 08 00394 g014
Figure 15. Diagram of the simulative specimen.
Aerospace 08 00394 g015
Figure 16. FE model and boundary conditions of the simulative specimen.
Aerospace 08 00394 g016
Figure 17. Comparison of stress gradient between the structure and the simulative specimen: (a) path of stress gradient extracted from the structure; (b) path of stress gradient extracted from the simulative specimen; (c) results of the normalized stress gradient.
Aerospace 08 00394 g017
Figure 18. Simulative specimen with different clamping methods: (a) Clamped by pin holes; (b) Clamped by hydraulic pressure.
Aerospace 08 00394 g018
Figure 19. The fracture of the specimens after testing: (a) Clamped by pin holes; (b) Clamped by hydraulic pressure.
Aerospace 08 00394 g019
Figure 20. True stress–strain curve of the high-strength GH4169 alloy at 500 °C.
Aerospace 08 00394 g020
Figure 21. The variation of equivalent plastic strain with tensile load.
Aerospace 08 00394 g021
Figure 22. The variation of average equivalent stress with tensile load.
Aerospace 08 00394 g022
Figure 23. The variation of average tensile direction stress with tensile load.
Aerospace 08 00394 g023
Figure 24. The variation of equivalent plastic strain of the dangerous section of the vortex reducer with rotational speed.
Aerospace 08 00394 g024
Figure 25. The variation of average equivalent stress of the dangerous section of the vortex reducer with rotational speed.
Aerospace 08 00394 g025
Figure 26. The variation of average hoop stress of the dangerous section of vortex reducer with rotational speed.
Aerospace 08 00394 g026
Table 1. Chemical composition of high-strength GH4169 alloy.
ElementCCrMoNb + TaNiFeAlTi
Mass per cent (%)0.015~0.0817.0~21.02.80~3.304.75~5.5050.0~55.0the rest0.30~0.700.75~1.15
ElementSiMnCoCuPSB
Mass per cent (%)≤a.35≤a.35≤a.00≤a.30≤a.015≤a.015≤a.006
Table 2. Comparison of the maximum stress between the working condition and test condition.
Stress ComponentRelative SpeedWorking Condition/MPaTest Condition/MPaError
Maximum hoop stress100%8018212.5%
120%116411811.5%
Maximum equivalent stress100%9708957.7%
120%133412853.7%
Table 3. The test data.
Specimen IDMaximum Tensile Load/kNTensile Strength/MPa
S1-112.411409.86
S1-212.381407.24
S1-312.341402.59
S2-112.181384.09
S2-212.221388.64
S2-312.291396.59
S2-412.141379.55
S2-512.121377.27
Table 4. The failure criteria of the specimen.
Maximum Equivalent Plastic Strain/%Average Equivalent Stress/MPaAverage Tensile Direction Stress/MPa
Value of the different failure criteria15.41291.21364.4
Table 5. Burst speed predicted by different criteria.
Criteria of the Maximum Equivalent Plastic StrainCriteria of the Average Equivalent StressCriteria of the Average Hoop Stress
Predicted burst speed174%182%182%
Table 6. Prediction of burst speed based on the average hoop stress method.
n max η σ b / MPa σ AHS / MPa Predicted Burst Speed
100%0.91230440159%
Publisher’s Note: MDPI stays neutral with regard to jurisdictional claims in published maps and institutional affiliations.

