Article

Development of a Numerical Model to Simulate Laser-Shock Paint Stripping on Aluminum Substrates

1
Laboratory of Technology & Strength of Materials, Department of Mechanical Engineering & Aeronautics, University of Patras, 26500 Patras, Greece
2
PIMM, CNRS, CNAM, 151 bd de l’Hopital, 75013 Paris, France
*
Author to whom correspondence should be addressed.
Aerospace 2021, 8(9), 233; https://doi.org/10.3390/aerospace8090233
Submission received: 16 July 2021 / Revised: 5 August 2021 / Accepted: 16 August 2021 / Published: 24 August 2021

Abstract

:
An explicit 3D Finite Element (FE) model was developed in the LS-Dyna code to simulate the laser shock paint stripping on aircraft aluminum substrates. The main objective of the model is to explain the physical mechanisms of the laser shock stripping process in terms of shock wave propagation, stress and strain evolution and stripping shape and size and to evaluate the effects of laser and material parameters on the stripping pattern. To simulate the behavior of aluminum, the Johnson–Cook plasticity model and the Gruneisen equation of state were applied. To simulate stripping, the cohesive zone modeling method was applied. The FE model was compared successfully against experiments in terms of back-face velocity profiles. The parameters considered in the study are the aluminum thickness, the epoxy paint thickness, the laser spot diameter, the fracture toughness of the aluminum/epoxy interface and the maximum applied pressure. In all cases, a circular solid or hollow stripping pattern was predicted, which agrees with the experimental findings. All parameters were found to affect the stripping pattern. The numerical results could be used for the design of selective laser shock stripping tests.

1. Introduction

In recent years, laser–induced shock waves were used in a wide range of engineering and materials science applications including the enhancement of fatigue strength [1] of metallic materials (laser peening) [2,3,4,5], the evaluation of adhesion strength (laser shock adhesion test) in adhesive joints [6,7,8] and the selective stripping of external coatings [9] in aerospace structures. Specifically, selective stripping is not a new process in aeronautical engineering, and it has a crucial role in the maintenance and restoration of aircraft during their lifetimes [9]. Usually, applied is a hazardous chemical stripping process with an important environmental impact followed by a plastic media or the eco-friendly walnut shell blasting, which damages the substrate material’s surface. The main challenges in the selective laser stripping method are the high cost of the experimental set-up and the lack of standard experimental and numerical frameworks. This brings the need for the development of numerical tools to design process windows.
The laser shock selective stripping process can be proved to be a very useful eco-friendly tool, in comparison to media blasting and chemical stripping, that can be applied for the stripping of exterior primer coatings (top-coats) and for the stripping of structural primer coatings. Using this method, some parts of the aircraft that were stripped, without being damaged, can be recyclable and be used, after some proper post treatment, for any other application. At present, research on the laser shock selective stripping method aims to observe, understand and explain the physical phenomena that take place and upscale the method to an industrial level.
The development of an industrial laser stripping method aims to be a cost effective, eco-friendly method that restricts the damage in the coating area exclusively, through the optimization of the laser parameters. Because of the complicated physical phenomena that take place, any change in the laser parameters or material properties, such as in-service aging, affects the stripping result and thus, a comprehensive optimization of the method is needed. There are two ways to perform such an optimization: experimentally and numerically. Both can provide significant results through parametric studies, but in combination, they can provide a more detailed and complete description of the process. Using experimental tests, various stripping patterns can be obtained for different laser parameters and materials. Experiments can also provide important information that can be used for validation purposes by the numerical models. Using validated models, a detailed stress field in the material and the damage propagation for each timestep can be simulated. Numerical simulations have the potential to reduce the required number of tests for optimization but require appropriate input parameters that are sometimes difficult to be obtained.
Only a few works on the numerical simulation of the laser shock process were reported in the literature. Ivetic [2] numerically evaluated the effect of laser shock peening on thin sheets using a 3D explicit FE code developed in the Abaqus commercial software. Le Bras et al. [3] made an accurate pressure determination in the polymer confinement regime by coupling finite element simulations and experimental measurements. Peyre et al. [4], by finite element simulations, correctly reproduced the evolution of shock wave attenuation and elastic precursor amplitude and computed surface deformations induced by local impacts in Al-Cu-Li alloys. Ocana et al. [5] used the SHOCKLAS code to compute the through-the-thickness stresses in thin aluminum plates due to the laser shock processing treatment. Morales et al. [10] developed a simulation model (SHOCKLAS), dealing with the main aspects of laser shock processing in a coupled way. Using models, the authors simulated the hydrodynamic behavior of plasma expansion between the confinement layer and the material, using HELIOS (1D radiation-hydrodynamics Lagrangian fluid dynamic code). With this code, the plasma dynamics and the influence of the confining layer on the plasma pressure were studied. Bardy et al. [11] and Scius-Bertrand et al. [12], using ESTHER numerical code, describe the laser–matter interaction and thus predict the ablation pressure. Ecault et al. [13] developed a 3D FE model using the LS-DYNA FE code to study the laser shock and shear wave propagation induced by femtosecond laser irradiation in epoxy resins. The model was validated by experiments and used to understand the shock wave phenomenon. Bolis et al. [14], using HUGO and SHYLAC numerical codes, formed a comprehensive approach for the determination of mechanisms that take place in coating debonding and a quantitative evaluation of its fracture strength. Ecault et al. [6], in the first systematic effort, developed a reliable numerical model to be used for the simulation of the laser shock wave adhesion test of bonded composites. A calibration method was applied to set the model input parameters. The dynamic material parameters were identified from experimental results and validated through a complete campaign of laser shocks on various carbon fiber reinforced plastic (CFRP) materials (monolithic and bonded). The numerical results enabled the authors to understand the stress distribution within the composite assembly during wave propagation. Finally, Ecault et al. [6,7,13] used the models developed in [7] to perform an optimization of tunable pulse duration, double pulses and symmetrical laser shocks for adhesive bonding assessment. From the above literature overview, it becomes clear that there are no reported works on the simulation of laser shock stripping.
The aim of the present work is to develop a detailed 3D numerical model for the simulation of laser shock paint stripping on aluminum substrates. After being validated, it will be used to understand the basic physical mechanisms that take place between the aluminum and the epoxy materials during stripping, with thickness in the range of a few μm. Finally, a parametric study on the effects of laser and material parameters on the stripping pattern will be performed.

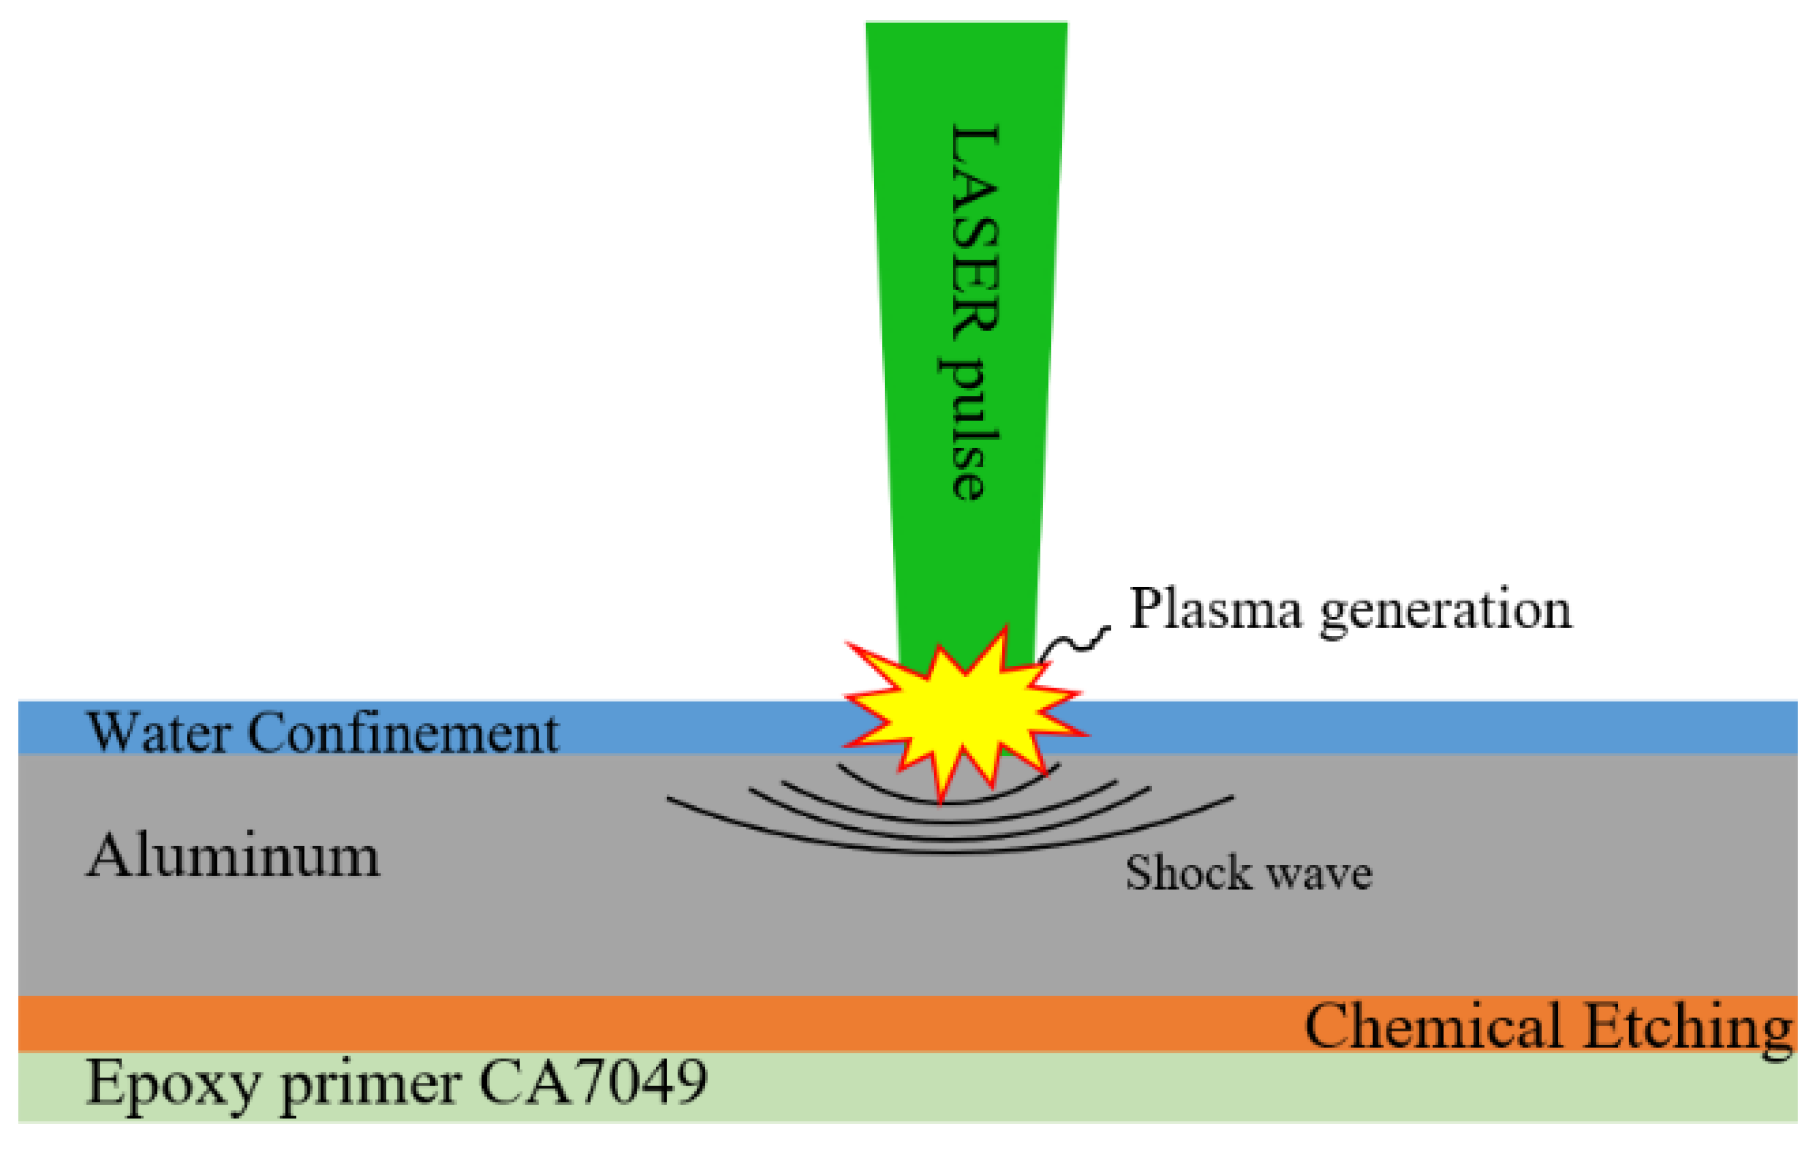
2. The Laser Shock Stripping Process

The laser shock stripping process is schematically described in 6 1. By focusing the high-power laser (1 J, 10 ns) onto a target, plasma creation occurs. With the help of plasma confinement (with water or solid), its duration becomes two times longer and four times higher [15]. The whole process can be distinguished into three parts. First, energy deposition from the laser pulse to the surface of the aluminum takes place and the creation of plasma through evaporation, ionization and expansion, begins.
The Gaia HP laser from THALES company (France) at Hephaistos, PIMM Lab, Paris, is used during the experiments. The Gaia HP laser is a Nd:YAG laser with 7.2 ns pulse duration, 14 Joules of energy (Gaussian pulse) and 2 Hz of repetition rate at 532 nm wavelength. Single beam is used, and energy calibration is done via a calorimeter (QE50LP-H-MB-QED, Gentec, Quebec, QC, Canada) before starting every experiment. For the conducted experiments, the spot size is kept constant as 4 mm through a lens with focal length of 198 mm. In addition, diffractive optical element (DOE) is used to obtain a top-hat shaped beam with an equal beam distribution along the spot size [16].
This high-pressure plasma-surface interaction initiates a shock wave that propagates to each material, according to its acoustic impedance, which is a function of density and the Hugoniot dimensionless coefficient S. The shock wave can be imagined as a propagating surface at which the displacement is continuous, and the mass density, temperature, stress and other variables are discontinuous. Interactions of the waves and reflections develop a complicated stress field composed of tensile and compressive stress faces that propagate inside the material. Stripping occurs due to the development of tensile stresses at the aluminum/epoxy interface (Figure 1).
The shock wave propagation into the aluminum/epoxy system is described in the sketch in Figure 2. When the pressure from plasma is applied to the material, an elastic precursor shock (i) followed by an elastic-plastic compression shock (ii), are formed and propagate into the material [17]. The plastic-decompression shock (iii) and elastic-plastic decompression wave (iv) begin to propagate into the material after the pressure is removed. The desired interaction takes place between the elastic precursor (i) and the plastic decompression shock (iii). Usually in the literature, the precursor and the compression shock are referred as the “compression shock wave” and the decompression shock wave as the “release wave”.
In most cases of strong shocks, the reflections from the back free surface are irregular [18]. A schematic example of a regular reflection and a simple irregular reflection (Mach reflection) are presented in Figure 3. This small irregular area between reflected shock and reflection surface is called Mach stem and is characterized by high compression stress fields. As will be shown later in this paper, the Mach stem plays a significant role on the pattern of the developed stress field in the materials during the laser shock wave propagation.

3. Specimen and Materials

The target specimen modeled consists of an aluminum AA 2024-T3 substrate, whose surface was treated by chemical etching, and a structural primer made from the epoxy CA7049 material by RESCOLL, Pessac, France. The primer’s role is the adherence conservation between the substrate and the top-coat layers. A schematic of the specimen is given in Figure 1. The dimensions of the specimen are 80 mm × 125 mm. The thickness of the aluminum substrate is 0.97 mm and that of the epoxy primer is 0.025 mm.

4. Theoretical Models and Numerical Modeling

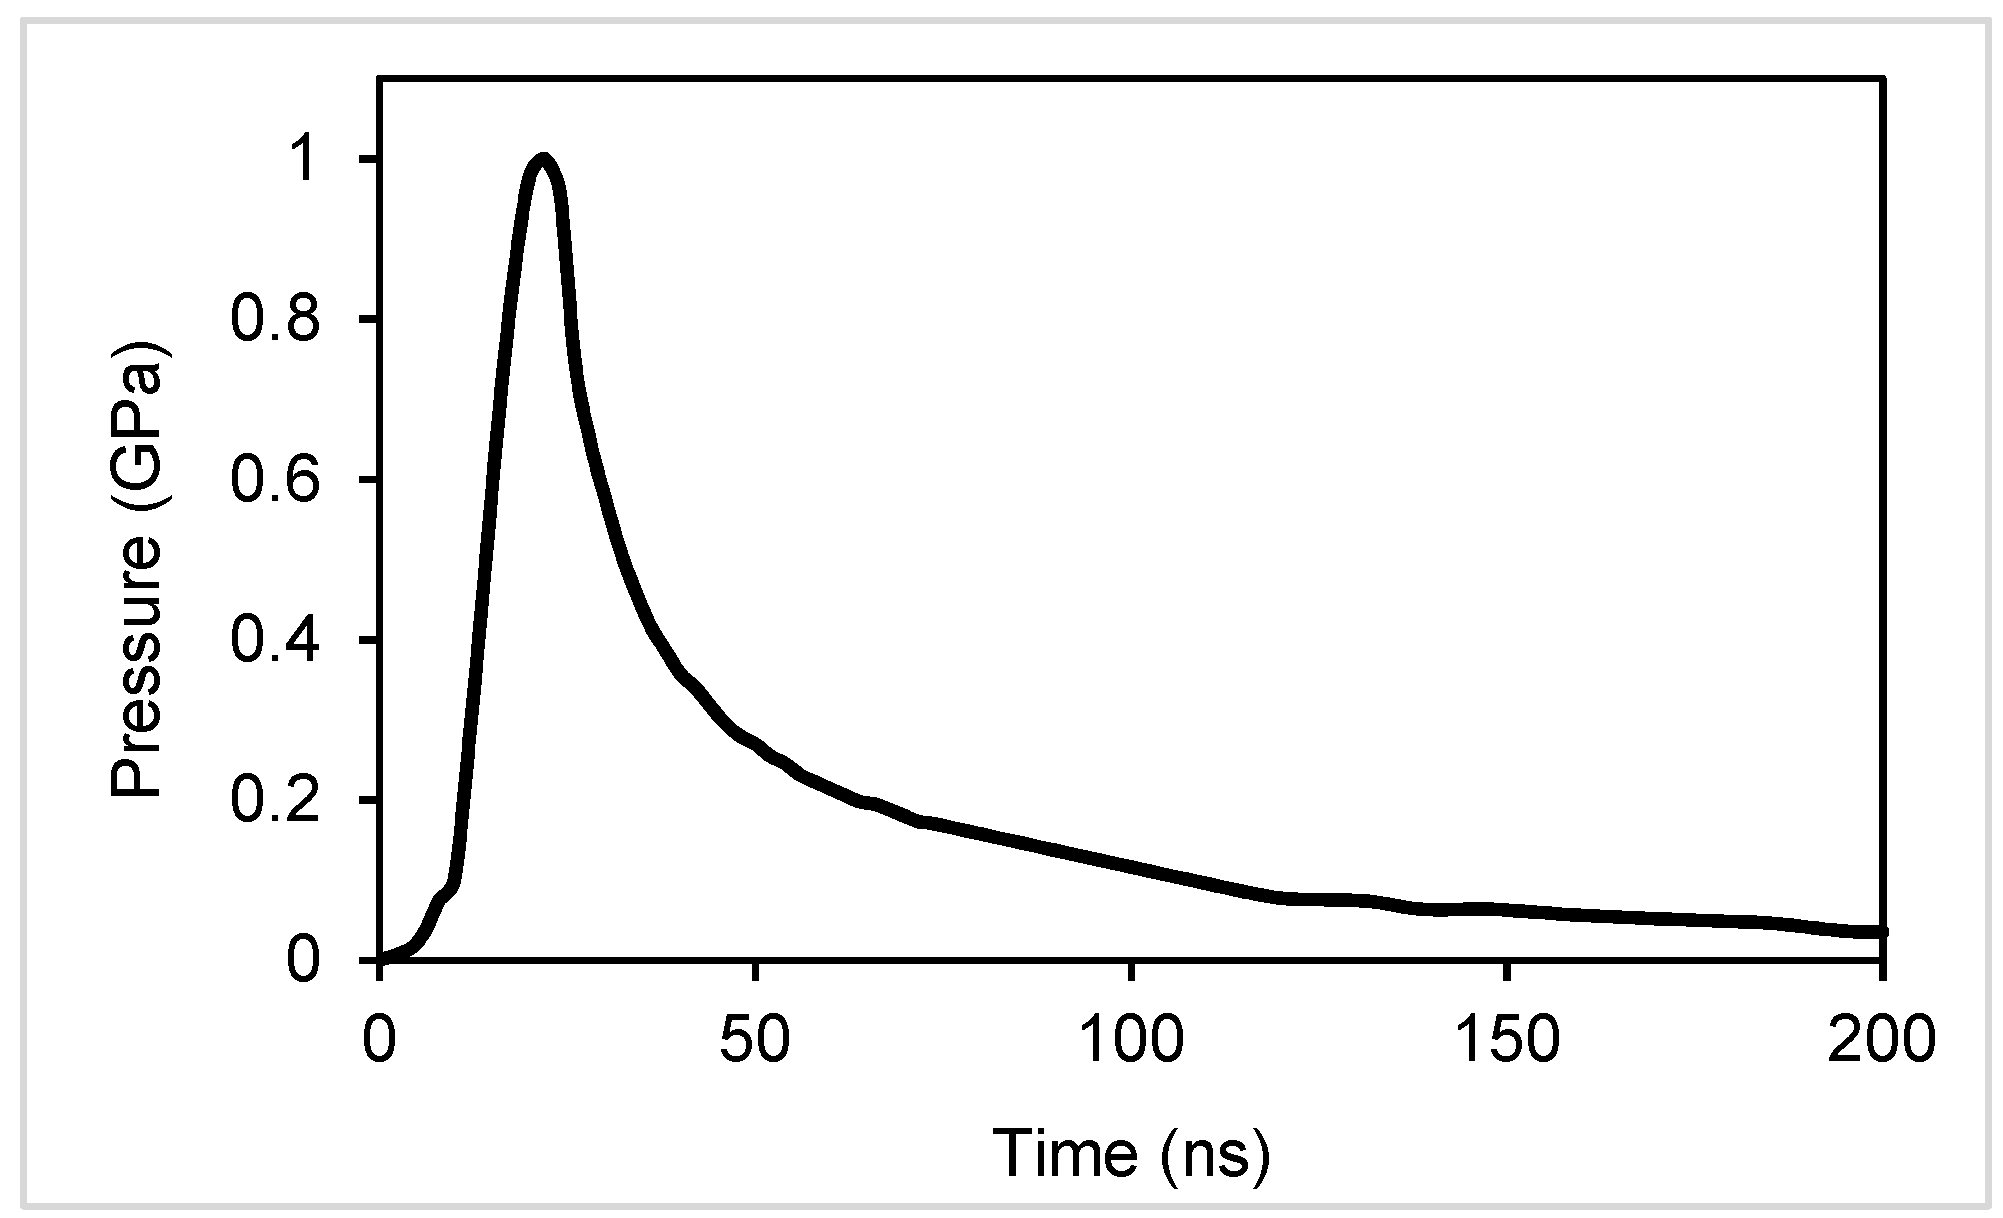
4.1. Calculation of Pressure’s Profile

The pressure profile that was modeled is shown in Figure 4 [9]. The maximum pressure value Pmax (GPa) in the profile was calculated by [19,20]
P max = 0.01 a 2 a + 3 Z I 0
Z = 2 Z 1 × Z 2 Z 1 + Z 2
Z i = ρ i D i
D i = C 0 + S × u
where, I0 (GW/cm3) is the laser’s intensity, α is the part of the energy being used for the gas ionization, Z (g cm−2/s−1) is the material’s acoustic impedance, C0 is the sound speed inside the material and u material’s velocity.

4.2. Constitutive Material Models

To simulate the high strain rate behavior of the aluminum due to the shock wave loading, the Johnson–Cook plasticity model [21] and the Gruneisen equation of state [21] were used. Thermal effects have not been simulated. The flow-stress expression of the material model is
σ y = ( A + B ε ¯ p n ) ( 1 + c ln ε ˙ * ) ( 1 T * m )
where ε ¯ p is the effective plastic strain, ε ˙ * the normalized effective total strain-rate (VP.EQ.0), m the thermal softening and T* is the homologous temperature given by
T * = T T r o o m T m e l t T r o o m
where
T T r o o m = internal   energy C p ρ V 0
where Cp is aluminum’s specific heat and V0 is the initial volume. Strain at fracture is calculated by
ε f = ( D 1 + D 2 e D 3 σ * ) ( 1 + D 4 ln ε ˙ * ) ( 1 + D 5 T * )
where σ* is the ratio of pressure divided by the effective stress.
The values of the parameters appearing in the above equations are listed in Table 1.

4.3. Stripping Simulation by Cohesive Zone Modeling

Failure of the materials’ interface (stripping) was simulated using the cohesive zone modeling (CZM) method. The CZM method does not model any material but only the relation between the traction and separation forces and the critical energy release rates by the following equations
G I C = T × U N D 2 G I I C = S × U T D 2
where GIC is the critical energy release rate for mode I load, GIIC is the critical energy release rate for mode II load, T the peak traction force in the normal direction, S the peak traction force in the tangential direction, UND the ultimate displacement in the normal direction and UTD is the ultimate displacement in the tangential direction.
The relation between traction and displacement (separation) was modeled using a bi-linear mixed-mode I + II traction-separation law schematically described in Figure 5. According to the law, the interface follows an elastic behavior until a specific stress value and after that there is a degradation of stiffness until final failure (complete debonding).
Due to the lack of data for the fracture toughness properties of the aluminum/epoxy interface, for which specific double-cantilever beam and end-notch flexure tests are required, properties for a CFRP/adhesive interface [23] were used. These properties are: GIC = 1018.52 J/m2 and GIIC = 783.41 J/m2.

5. Finite Element Modeling

A 3D FE model of the aluminum/epoxy specimen was developed using the explicit FE software LS-DYNA. A mapped FE mesh consisting of different areas was applied. In the center of the specimen, a 4 mm diameter circular area, representing the laser spot, was meshed using elements with a size of 0.027 mm. Away from that area, elements with a size of 0.042 mm were used. The thickness of all elements is 0.005 mm. For the aluminum and epoxy part of the specimen, 3D solid elements with one integration point (ELFORM = 1) were used. The aluminum/epoxy interface (cohesive area) was simulated using zero thickness 8-noded, 4-point cohesive elements (ELFORM = 19). The FE meshes of the complete specimen and the individual parts are shown in Figure 6.
Implementation of the Johnson–Cook plasticity model for the aluminum in the LS-Dyna was done through the *MAT15_JOHNSON_COOK material model. The epoxy’s hydrodynamic behavior was modeled using the *MAT_10_ELASTIC_PLASTIC_HYDRO material model coupled with the Gruneisen equation of state. The epoxy’s material properties are listed in Table 2. The material model through which the CZM method were implemented in the LS-Dyna is the *MAT_138_COHESIVE_MIXED_MODE.
Using the FE model, second order objective stresses are computed and updated at every time-step. The timestep was set equal to 1 ns and the total analysis time was 2 μs. For the energy balance computation, the rigid-wall (or stone-wall) energy, the sliding interface energy and the Rayleigh (or damping) energy dissipation were included. Furthermore, the hourglass energy, which refers to nonphysical distortions of the elements, is computed at the energy balance [21].

6. Parametric Study

The aim of the parametric study is to understand the influence on the stripping pattern (shape and size) of the aluminum thickness, the epoxy thickness, the spot diameter, the critical energy release rate values and the maximum applied pressure for a given laser intensity. Table 3 lists the variation range of each parameter. The thickness of the materials is a manufacturing parameter and can be modified. The laser spot diameter is a process parameter, which can be easily modified. The study of the deviation of GIC and GIIC is of increased importance due to fact that the actual values for the aluminum/epoxy interface are not available yet. Finally, the uncertainty in Pmax emanates from the methodology used to calculate Pmax from the laser intensity. The reference parameters used in the parametric study are listed in Table 3. Unless otherwise stated, the results presented hereafter will refer to the parameters of Table 3.

7. Numerical Results

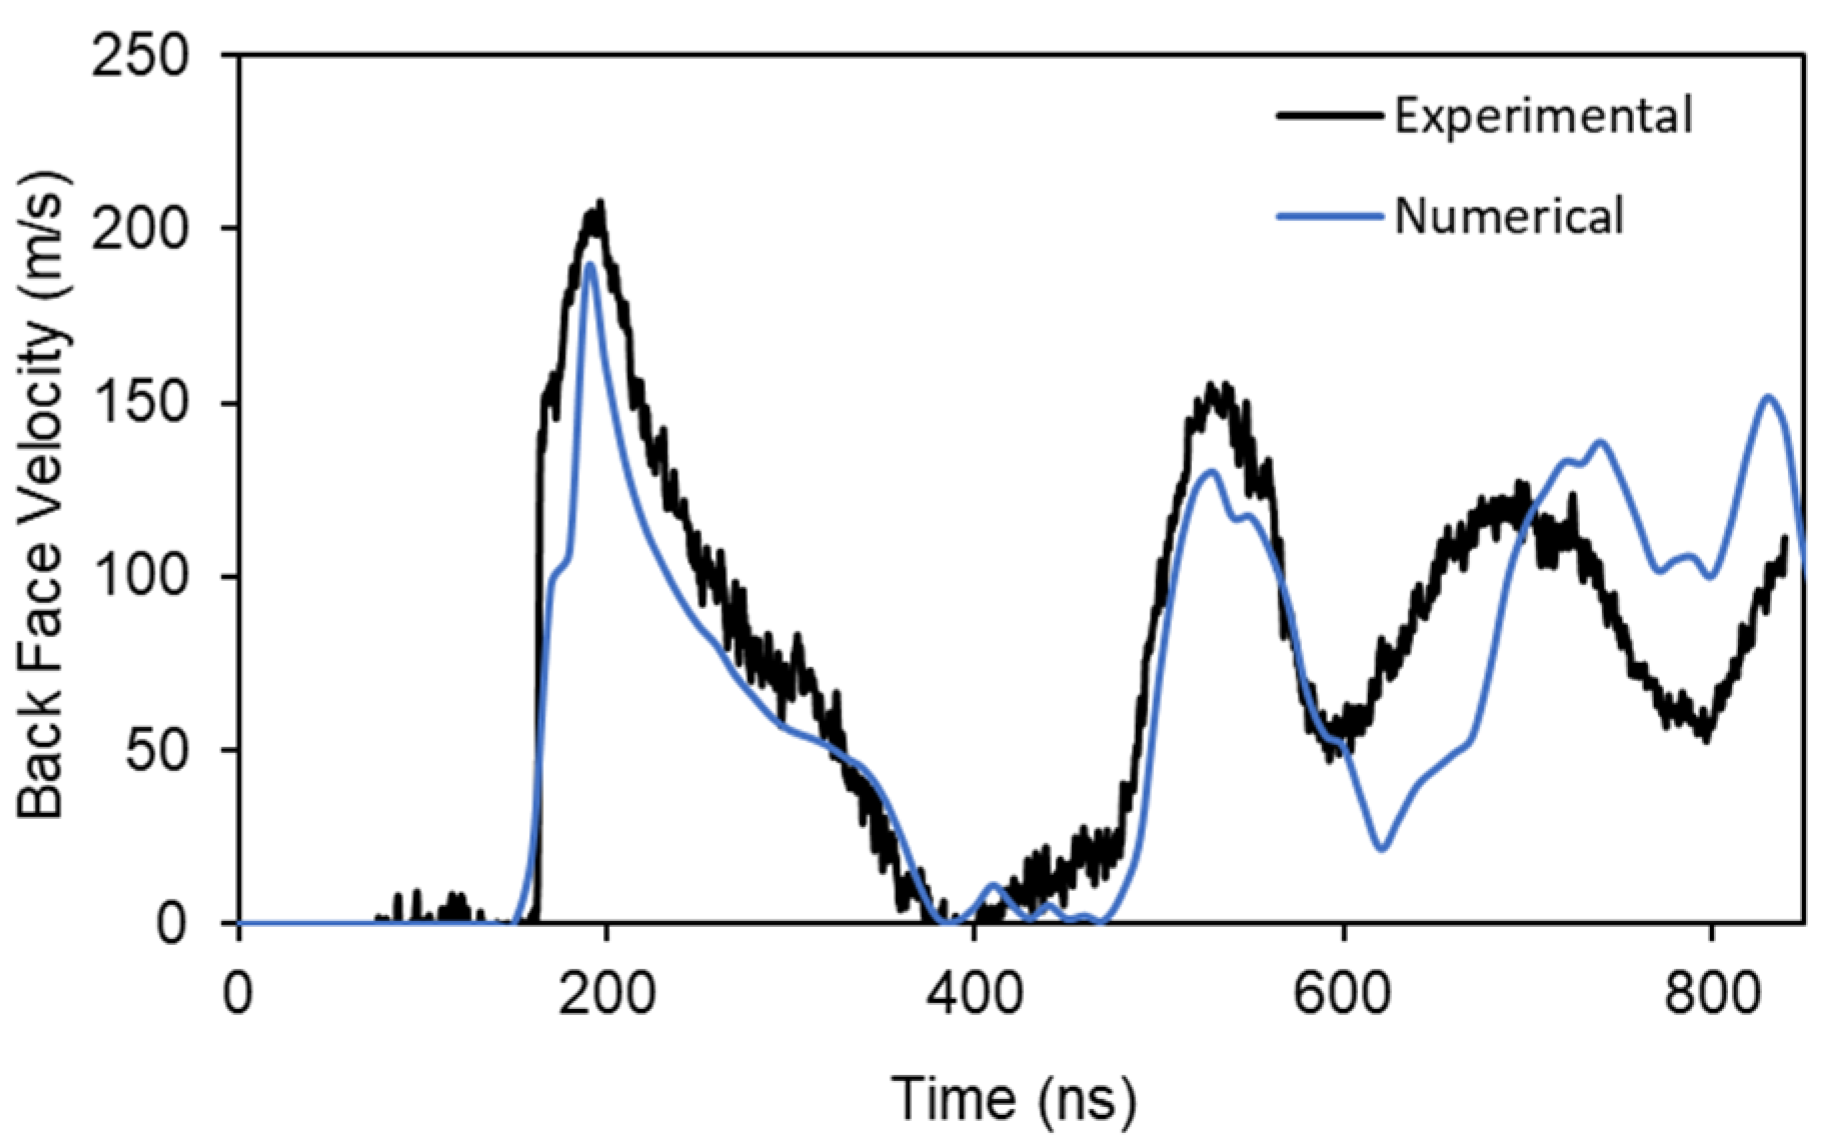
7.1. Model Validation

The numerical model was validated through the comparison of the computed back-face velocity profiles (back face velocity vs. time) with experimental results obtained from [9]. In order to obtain material properties, velocity interferometer system for any reflector (VISAR) diagnostic is used which is based on the Michelson interferometer [25]. Since the target accelerates with effect of the applied shock wave, the Doppler shift occurs. Basically, with the VISAR diagnostic, change in Doppler shift of light which was reflected from the moving surface is measured. Moreover, the velocity of the target can be calculated, which can be linked to other material parameters [25]. In the frame of validation, a convergence study of the mesh density, especially through the thickness of the specimen, and the time-step was also performed. First, a comparison between experimental and numerical back face velocity graphs of pure aluminum 2024 for I = 3.09 GW/cm2, shown in Figure 7, were made. A good agreement between the first and second peak is observed. As it can be observed, there is a difference at the Hugoniot elastic limit (HEL) value between the two graphs. The numerical model underestimates this value, that is almost 100 m/s in comparison with the experimental, which is 150 m/s. This difference may occur due to the mechanical and thermodynamic properties of the aluminum, taken from previous works [2,22].
Figure 8 compares the predicted and experimental back face velocity profiles for three different laser intensities, namely, 2.32 GW/cm2 (3072 MPa), 4.96 GW/cm2 (3986 MPa) and 6.81 GW/cm2 (4553 MPa). The experimental curves were created using VISAR measurements while the numerical curves were created by using the velocity values at the center node of the back free surface of the specimen, at the epoxy. In the analyses of Figure 8, stripping has not been simulated for the aluminum/epoxy specimen. As can be seen, there is a good agreement between the model and the tests in the sense that the numerical curve follows the experimental curve and there is a good convergence regarding the position and size of the velocity peaks. For all cases, unlike Figure 7, the HEL value is overestimated by the numerical models and is 200 m/s, while the experimental value is 150 m/s. This difference occurs due to lack of the exact mechanical properties of the epoxy primer and the interface between aluminum/epoxy. For the case of I = 2.32 GW/cm2 (Figure 8a), the model predicts all velocity peaks but with an overestimation. For the cases of I = 4.96 GW/cm2 (Figure 8b) and I = 6.81 GW/cm2 (Figure 8c), the model underestimates the initial secondary peak, predicts the first main peak very well and then it overestimates the forthcoming peaks. The three smaller peaks in Figure 8a–c are due to the main elastic-plastic shock, the elastic-plastic decompression shock and their reflections by the interface of aluminum/epoxy material. In Figure 8c, the small peak (5c) observed at the start of the experimental curve is a parasite signal of the laser pulse. Overall, it can be concluded that the model is capable of simulating the shock wave propagation inside the aluminum/epoxy specimen.

7.2. Stripping Simulation

For all cases, the predicted stripping pattern is circular, either solid or hollow, obviously due to the shape of the laser spot. This finding is in line with the experimental observations from [9]. Figure 9 depicts the predicted stripping pattern (gray-brown color) for the case of I = 1.75 GW/cm2 and Pmax = 2400 MPa as well as the experimentally obtained stripping pattern. Both the tests and the preliminary numerical simulations have shown that the thickness of the ring in the stripping pattern and the transition from a hollow to a solid pattern and vice versa depend on the material and process parameters that are studied in the present work.
Aiming to understand the stripping process, a detailed stress analysis was performed [9]. The analysis was focused on the normal σz stresses, which are responsible for the stripping. As the wave propagates, the compressive stress field tends to concentrate at the center, thus forming an outer ring of weaker compressive stresses. Next the compressive stress field at the outer ring turns into tensile, while at the center of the area the stresses remain compressive due to the development of a Mach stem by the irregular reflection of the shock front at the back free surface. When the Mach stem becomes weaker, a ring of tensile stress is developed at the center of the specimen. This stress propagation pattern at the surface of epoxy continues for as long as the shock propagates.
Figure 10 plots the evolution of σz stress in the cohesive area for P max = 2400 MPa. In the plots, the stripped area is also shown with the gray-brown color (deleted elements). As shown, initially, the stripping has a four point axisymmetric shape (Figure 10a) and as it propagates the values of tensile stresses are decreasing (Figure 10b,c). As the stripping process approaches the end the compressive stress field covers the area around the stripped area and the tensile stresses increase (Figure 10d). A general observation is that the compressive stresses are acting as a stopping mechanism of the stripping.

7.3. Parametric Study

7.3.1. Effect of Aluminum Thickness

With increasing aluminum thickness, a transition from the annular to the uniform stripping pattern takes place, as illustrated in Figure 11. This is due to the different shock propagation mechanism and the different distribution of the shock through the thickness stresses in the aluminum. The shock wave in a thinner specimen evolves faster and the Mach stem area dissolves quickly. Furthermore, the compressive field has lower values. Besides that, the highest tensile stress is closer to the epoxy and the tensile stress values are lower. On the other hand, in a thicker specimen, the tensile stress field that develops after the Mach stem dissolution has a more uniform distribution, thus leading to more uniform stripping area. The differences of the shock wave propagation and the evolution of normal stresses between a thin and a thick aluminum substrate are schematically described by means of the comparison of the normal stress contours for the cases of tal = 0.7 mm and tal = 1.2 mm shown in Figure 12.

7.3.2. Effect of Epoxy Thickness

With increasing epoxy thickness, a transition from a solid circular to an annular stripping pattern takes place (Figure 13). For tep = 0.1 mm, a four-point axisymmetric damage area is predicted. This transformation of the stripping area is the opposite of the one that takes place with the increase of the aluminum thickness. For tep = 125 μm and tep = 150 μm, no stripping was predicted. This is attributed to the increased shock wave damping offered by the thicker epoxy and the lower effect of the Mach stem. For the latter values of tep, an incomplete stripping is predicted.

7.3.3. Effect of Spot’s Diameter

Figure 14 shows the simulated evolution of stripping for six different spot diameters dsp. For dsp = 2.5 mm and dsp = 3.0 mm, the stripping initiates as a solid circle and propagates with the same shape. This is due to the more uniform distribution of the laser’s intensity. For dsp = 3.5 mm, the stripping initiates annularly, afterwards it also initiates at the center of the spot and ends as a solid circle. The same stands for dsp = 4.0 mm but with a different propagation rate. Finally, for dsp = 4.5 mm and dsp = 5.0 mm, the stripping initiates and propagates annularly; for these two cases, the stripping is incomplete.

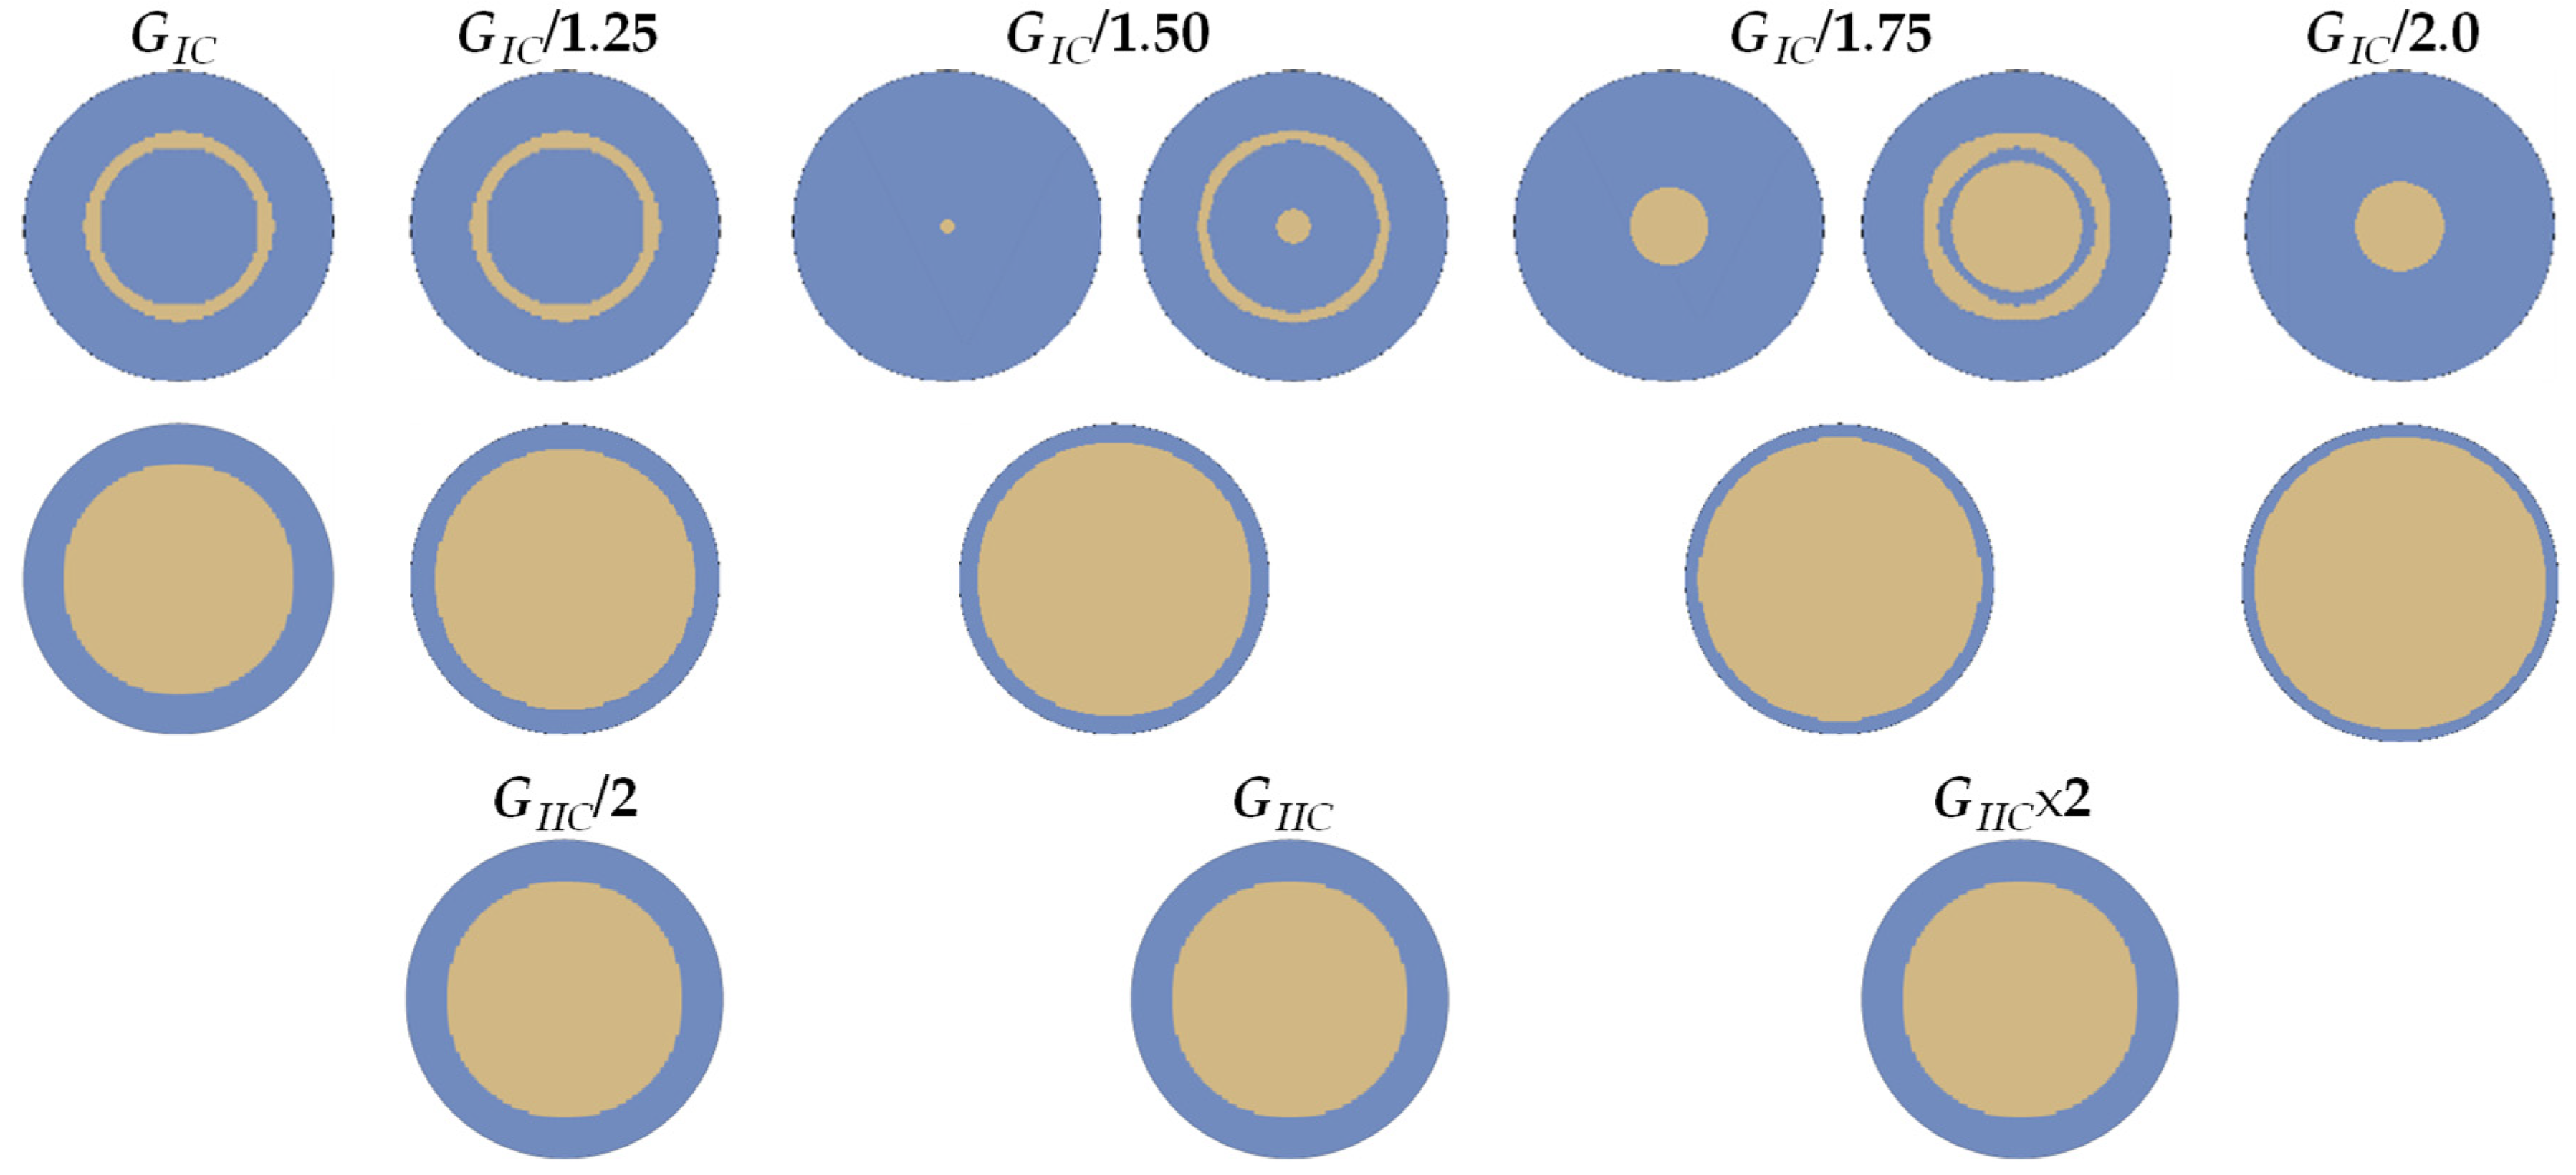
7.3.4. Effect of G1C

Figure 15 shows the stripping evolution and the final stripping patterns for the analyses with the different GIC and GIIC values described in Table 3. For the initial GIC, the stripping pattern starts as annular and turns into a solid. For GIC/1.25, a similar stripping process was predicted but with a larger final stripping area. For GIC/1.25, the stripping starts at the center of the loading spot, then annular stripping also starts, and both evolve into a final solid stripping area. The same stands for GIC/1.25 but with a higher evolution rate. For GIC/2.0, the stripping starts and evolves as a solid circle. The variation of the GIIC does not affect the stripping evolution and the final pattern as the stripping mechanism is mode-I dominated. Therefore, for the three cases with the different GIIC (bottom of Figure 15), the same stripping evolution as with the reference case was predicted.

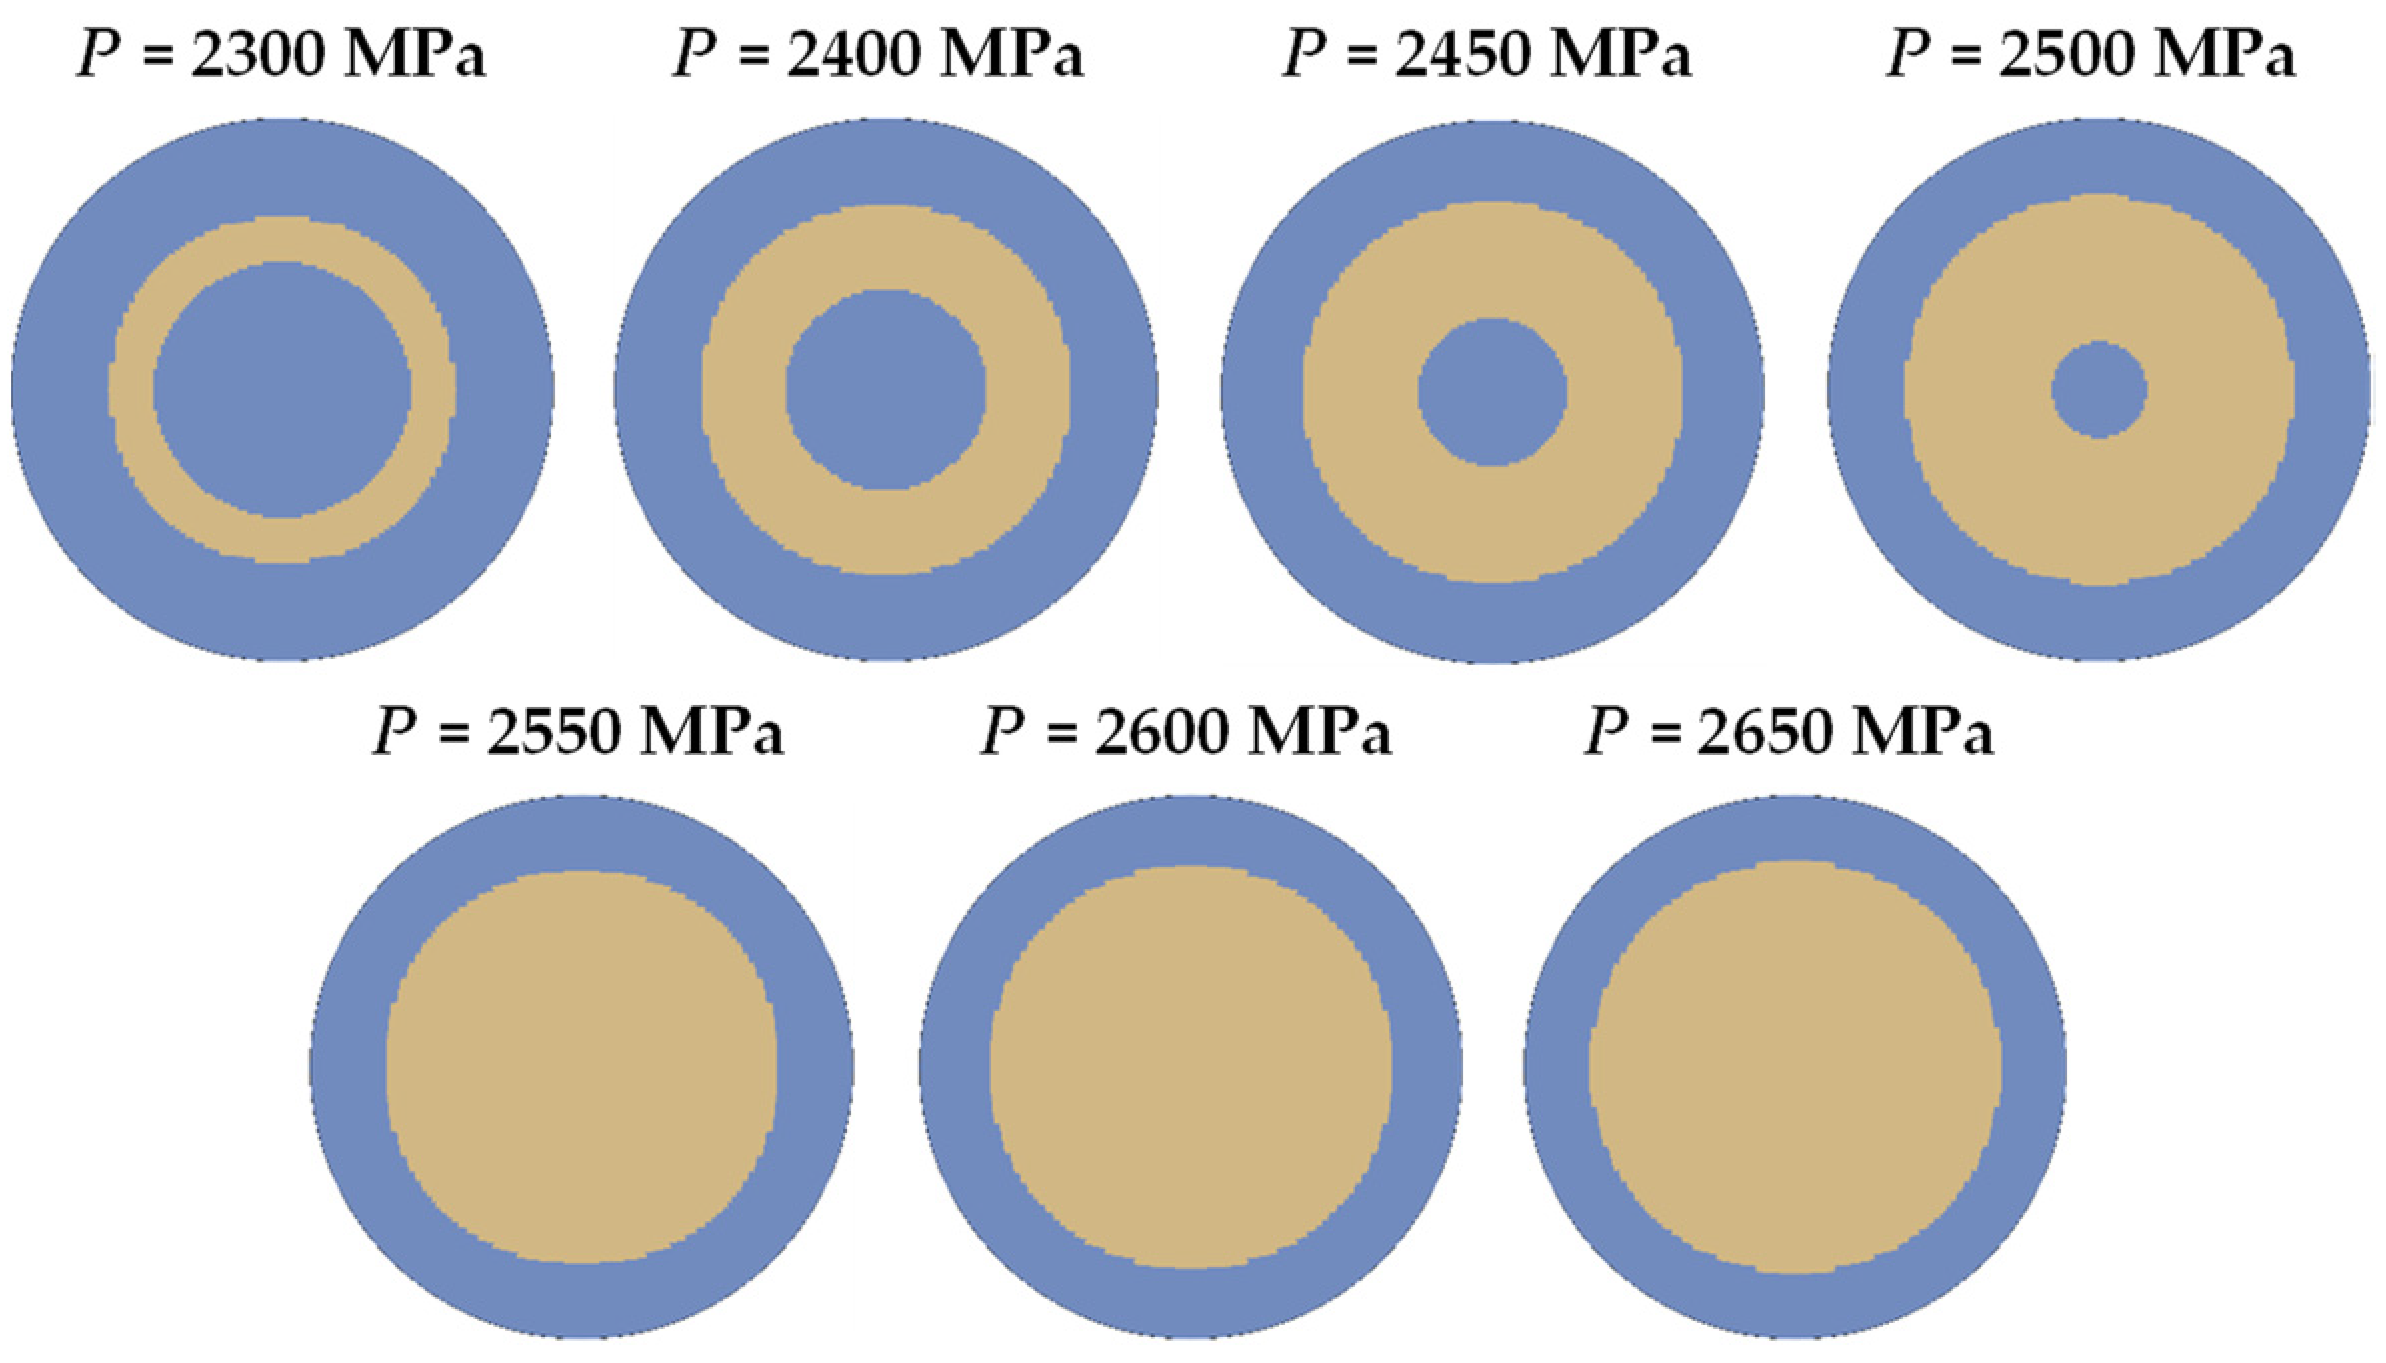
7.3.5. Effect of Maximum Applied Pressure

As there is an uncertainty in the correlation between the maximum applied pressure and the laser’s intensity that applies in Equation (1), the effect of the peak pressure values on the stripping process were examined. Figure 16 depicts the final stripping patterns predicted for the different P values. As shown, by increasing P, the stripping pattern transforms from annular to solid and the stripping accumulates much quicker.

8. Conclusions

In the present paper, a numerical model was developed to simulate the laser shock paint stripping on aluminum substrates. The main objectives of the model were to explain the physical mechanisms of the laser shock stripping process in terms of shock wave propagation, stress and strain evolution and stripping shape and size and to evaluate the effects of laser and material parameters on the stripping pattern.
The main findings of the study are summarized as follows:
  • The model is capable of efficiently simulating the laser shock stripping process as indicated by the comparison of numerical and experimental results.
  • By increasing the aluminum thickness, a transition from the annular to the solid stripping pattern takes place. For values of aluminum thickness smaller than 1 mm, an incomplete stripping is predicted.
  • By increasing the epoxy thickness, a transition from a solid circular to an annular stripping pattern takes place. For 0.075 mm and 0.1 mm epoxy thickness, an incomplete stripping is predicted.
  • The laser spot’s diameter significantly affects the stripping propagation and the final stripping pattern. For values of dsp larger than 4.0 mm, an incomplete stripping is predicted.
  • GIC affects the first stages of stripping evolution, while GIIC does not affect stripping evolution.
  • With increasing the maximum applied pressure, a transition from the annular to the solid stripping pattern takes place. For values smaller than 2500 MPa, an incomplete stripping (annular) is predicted.
From the above conclusions it is obvious that for certain combinations of the process and material parameters an incomplete stripping is predicted. If we try to give an initial rough guideline for the design of the tests, for the process parameters, we can say that the laser spot should be kept between 2.5 and 3.5 mm and the maximum applied pressure above 2550 MPa. Regarding the material parameters, the low thickness of the aluminum substrate and the epoxy paint makes stripping difficult and, in some cases, it leads to incomplete stripping. On the other hand, as expected, the lower the fracture toughness of the aluminum/epoxy interface the easier the stripping.
The next step of the work is to design proper tests to characterize the fracture toughness of the aluminum/epoxy interface and after further experimental verification and validation to enable a realistic virtual testing of the stripping process.

Author Contributions

Data curation, K.P.; Formal analysis, K.P.; Investigation, K.T., K.P., S.U. and L.B.; Methodology, K.T., K.P., S.U. and L.B.; Project administration, L.B.; Software, K.P.; Supervision, K.T.; Validation, K.T., S.U. and L.B.; Writing–original draft, K.T., K.P. and S.U.; Writing–review & editing, K.T. and L.B. All authors have read and agreed to the published version of the manuscript.

Funding

This research received no external funding.

Institutional Review Board Statement

Not applicable.

Informed Consent Statement

Informed consent was obtained from all subjects involved in the study.

Data Availability Statement

Not applicable.

Conflicts of Interest

The authors declare no conflict of interest.

References

  1. Peyre, P.; Fabbro, R.; Merrien, P.; Lieurade, H.P. Laser shock processing of aluminium alloys. Application to high cycle fatigue behaviour. Mater. Sci. Eng. A 1996, 210, 102–113. [Google Scholar] [CrossRef]
  2. Ivetic, G. Three-dimensional FEM analysis of laser shock peening of aluminium alloy 2024-T351 thin sheets. Surf. Eng. 2011, 27, 445–453. [Google Scholar] [CrossRef]
  3. Le Bras, C.; Rondepierre, A.; Seddik, R.; Scius-Bertrand, M.; Rouchausse, Y.; Videau, L.; Fayolle, B.; Gervais, M.; Morin, L.; Valadon, S.; et al. Laser Shock Peening: Toward the Use of Pliable Solid Polymers for Confinement. Metals 2019, 9, 793. [Google Scholar] [CrossRef] [Green Version]
  4. Peyre, P.; Berthe, L.; Vignal, V.; Popa, I.; Baudin, T. Analysis of laser shock waves and resulting surface deformations in an Al-Cu-Li aluminum alloy. J. Phys. D Appl. Phys. 2012, 45, 1–9. [Google Scholar] [CrossRef] [Green Version]
  5. Ocana, J.L.; Correa, C.; García-Beltrán, A.; Porro, J.A.; Díaz, M.; Ruiz-de-Lara, L.; Peral, D. Laser Shock Processing of thin Al2024-T351 plates for induction of through-thickness compressive residual stresses fields. J. Mater. Process. Technol. 2015, 223, 8–15. [Google Scholar] [CrossRef]
  6. Ecault, R.; Touchard, F.; Boustie, M.; Berthe, L.; Dominguez, N. Numerical modeling of laser-induced shock experiments for the development of the adhesion test for bonded composite materials. Compos. Struct. 2016, 152, 382–394. [Google Scholar] [CrossRef] [Green Version]
  7. Ecault, R.; Touchard, F.; Berthe, L.; Boustie, M. Laser shock adhesion test numerical optimization for composite bonding assessment. Compos. Struct. 2020, 247, 112441. [Google Scholar] [CrossRef]
  8. Courapied, D.; Berthe, L.; Peyre, P.; Coste, F.; Zou, J.-P.; Sautivet, A.-M. Laser-delayed double shock-wave generation in water-confinement regime. J. Laser Appl. 2015, 27, S29101. [Google Scholar] [CrossRef]
  9. Unaldi, S.; Papadopoulos, K.; Rondepierre, A.; Rouchausse, Y.; Karanika, A.; Deliane, F.; Tserpes, K.; Floros, G.; Richaud, E.; Berthe, L. Towards selective Laser paint stripping using shock waves produced by Laser—Plasma interaction for aeronautical applications on AA 2024 Based Substrates. Opt. Laser Technol. 2021, 141, 107095. [Google Scholar] [CrossRef]
  10. Morales, M.; Porro, J.A.; Blasco, M.; Molpeceres, C.; Ocana, J.L. Numerical simulation of plasma dynamics in laser shock processing experiments. J. Appl. Surf. Sci. 2009, 255, 5181–5185. [Google Scholar] [CrossRef]
  11. Bardy, S.; Aubert, B.; Bergarac, T.; Berthe, L.; Combis, P.; Hébertb, D.; Lescoute, E.; Rouchausse, Y.; Videau, L. Development of a numerical code for laser-induced shock waves applications. J. Opt. Laser Technol. 2020, 124, 105983. [Google Scholar] [CrossRef]
  12. Scius-Bertrand, M.; Videau, L.; Rondepierre, A.; Lescoute, E.; Rouchausse, Y.; Kaufman, J.; Rostohar, D.; Brajer, J.; Berthe, L. Laser induced plasma characterization in direct and water confined regimes: New advances in experimental studies and numerical modelling. J. Phys. D Appl. Phys. 2021, 54, 14. [Google Scholar] [CrossRef]
  13. Ecault, R.; Berthe, L.; Touchard, F.; Boustié, M.; Lescoute, E. Experimental and numerical investigations of shock and shear wave propagation induced by femtosecond laser irradiation in epoxy resins. J. Phys. D Appl. Phys. 2015, 48, 9. [Google Scholar] [CrossRef]
  14. Bolis, C.; Berthe, L.; Boustie, M.; Arrigoni, M.; Barradas, S.; Jeandin, M. Physical approach to adhesion testing using laser-driven shock waves. J. Phys. D Appl. Phys. 2007, 40, 3155–3163. [Google Scholar] [CrossRef]
  15. Fox, J.A. Effect of water and paint coatings on laser irradiated targets. Appl. Phys. Lett. 1974, 24, 461–464. [Google Scholar] [CrossRef]
  16. Sagnard, M.; Berthe, L.; Ecault, R.; Touchard, F.; Boustie, M. Development of the symmetrical laser shock test for weak bond inspection. Opt. Laser Technol. 2019, 111, 644–652. [Google Scholar] [CrossRef] [Green Version]
  17. Davison, L. Fundamentals of Shock Wave Propagation in Solids; Springer: Berlin/Heidelberg, Germany, 2008. [Google Scholar]
  18. Ben-Dor, G. Shock Wave Reflection Phenomena, 2nd ed.; Springer: Berlin/Heidelberg, Germany, 2007. [Google Scholar]
  19. Fabbro, R.; Peyre, P.; Berthe, L.; Scherpereel, X. Physics and applications of laser-shock processing. J. Laser Appl. 1998, 10, 265–279. [Google Scholar] [CrossRef]
  20. Berthe, L.; Fabbro, R.; Peyre, P.; Tollier, L.; Bartnicki, E. Shock waves from a water-confined laser-generated plasma. J. Appl. Phys. 1997, 82, 2826–2832. [Google Scholar] [CrossRef]
  21. LS-DYNA Keyword User’s Manual; Livermore Software Technology Corporation: Livermore, CA, USA, 2018; Volumes I–III.
  22. Buyuk, M.; Kan, S.; Loikkanen, M. Explicit Finite-Element Analysis of 2024-T3/T351 Aluminum Material under 459 Impact Loading for Airplane Engine Containment and Fragment Shielding. J. Aerosp. Eng. 2009, 22, 287–295. [Google Scholar] [CrossRef]
  23. Floros, I.; Tserpes, K.; Lobel, T. Mode-I, mode-II and mixed-mode I-II fracture behavior of composite bonded joints: Experimental characterization and numerical simulation. Compos. Part B 2015, 78, 459–468. [Google Scholar] [CrossRef]
  24. Ecault, R. Etude Expérimentale et Numérique du Comportement Dynamique de Composites Aéronautiques Sous Choc Laser. Optimisation du Test D’adhérence par ondes de Choc sur les Assemblages Composites Collés; Ecole Nationale Supérieure de Mécanique et d’Aérotechique-Poitiers: Paris, France, 2013. [Google Scholar]
  25. Barker, L.; Hollenbach, R. Laser interferometer for measuring high velocities of any reflecting surface. J. Appl. Phys. 1972, 43, 4669–4675. [Google Scholar] [CrossRef]
Figure 1. Schematic illustration of the laser shock stripping process adapted from [9].
Aerospace 08 00233 g001
Figure 2. Schematic illustration of the shock wave propagation into the aluminum/epoxy system. (i) Elastic precursor, (ii) plastic shock, (iii) elastic decompression shock and (iv) plastic decompression shock.
Aerospace 08 00233 g002
Figure 3. Regular and irregular (Mach) wave reflection.
Aerospace 08 00233 g003
Figure 4. The applied pressure profile adapted from [9].
Aerospace 08 00233 g004
Figure 5. The bi-linear mixed-mode I + II traction-separation law [21].
Aerospace 08 00233 g005
Figure 6. (a) FE mesh of the specimen, (b) FE mesh of the central square area and (c) FE mesh of the circular area under the laser spot [9].
Aerospace 08 00233 g006
Figure 7. Comparison between the predicted and experimental back face velocity profiles for aluminum 2024.
Aerospace 08 00233 g007
Figure 8. Comparison between the predicted and experimental back face velocity profiles for aluminum 2024/epoxy substrates for three different laser intensities: (a) 2.32 GW/cm2, (b) 4.96 GW/cm2 and (c) 6.81 GW/cm2.
Aerospace 08 00233 g008aAerospace 08 00233 g008b
Figure 9. (a) A common stripping pattern predicted the model, (b) the experimental stripping pattern adapted from [9].
Aerospace 08 00233 g009
Figure 10. Predicted evolution of σz stresses at the interface (cohesive area).
Aerospace 08 00233 g010
Figure 11. Predicted stripping patterns for different values of aluminum thickness. Epoxy’s thickness is 25 μm, spot diameter is 4 mm and Pmax = 2639 MPa.
Aerospace 08 00233 g011
Figure 12. Evolution of σz stresses in the aluminum substrate for tal = 0.7 mm (ac), and for tal = 1.2 mm (df).
Aerospace 08 00233 g012aAerospace 08 00233 g012b
Figure 13. Predicted stripping pattern for different values of epoxy thickness. Aluminum’s thickness is 0.97 mm, spot diameter is 4 mm and Pmax = 2639 MPa.
Aerospace 08 00233 g013
Figure 14. Predicted stripping evolution for different laser spot diameters. Aluminum’s thickness is 0.97 mm, epoxy’s thickness is 25 μm and Pmax = 2639 MPa.
Aerospace 08 00233 g014
Figure 15. Predicted stripping evolution and final stripping pattern for different GIC and GIIC values. Aluminum’s thickness is 0.97 mm, epoxy’s thickness is 25 μm, spot diameter is 4 mm and Pmax = 2639 MPa.
Aerospace 08 00233 g015
Figure 16. Predicted stripping patterns for different values of maximum applied pressure. Aluminum’s thickness is 0.97 mm, epoxy’s thickness is 25 μm and spot diameter is 4 mm.
Aerospace 08 00233 g016
Table 1. Values of the parameters of Equations (2)–(5) [2,22].
Input ParameterValue
Johnson–Cook—Gruneisen
Young’s modulus, Ε73,084 MPa
Poisson’s ration, ν0.33
Strain yield limit, A352 MPa
Strain hardening modulus, Β440 MPa
Strain hardening exponent, n0.42
Strain rate coefficient, C0.0083
Density, ρ2770 kg/m3
Speed of the wave, C05328 m/s
Linear Hugoniot slope coefficient, S1.338
Gruneisen constant, Γ2
Input Damage Parameters
D10.13
D20.13
D3−1.5
D40.011
D50
Table 2. Material properties of the CA7049 epoxy [24].
Elastic Plastic Hydrodynamic—Gruneisen
Density1700 kg/m3
Shear modulus1600 MPa
Speed of the wave2000 m/s
Linear Hugoniot slope coefficient1.493
Gruneisen constant1.13
Table 3. Parameter’s range of the parametric study and reference parameters.
ParameterRangeReference
Aluminum thickness0.7–1.2 mm0.97 mm
Epoxy thickness25–150 μm25 μm
Laser spot diameter2.5–5 mm4 mm
GIC and GIICDivision factor: 1.25, 1.50, 1.75, 2.01018.52 J/m2 and 783.41 J/m2
Pmax for 1.75 GW/cm22300–2650 MPa2639 MPa
Publisher’s Note: MDPI stays neutral with regard to jurisdictional claims in published maps and institutional affiliations.

