Article

Low-Noise Design of Medium-Range Aircraft for Energy Efficient Aviation

1
German Aerospace Center (DLR), Institute of Aerodynamics and Flow Technology, Bunsenstraße 10, 37073 Göttingen, Germany
2
Exzellenzcluster SE2A—Sustainable and Energy-Efficient Aviation, Hermann-Blenk-Str. 42, 38108 Braunschweig, Germany
3
German Aerospace Center (DLR), Institute of Propulsion Technology, Engine, 51147 Köln, Germany
4
Institute of Aerospace Systems (ILR), RWTH Aachen University, Wuellnerstr. 7, 52062 Aachen, Germany
5
Gas Turbine Laboratory (GTL), Massachusetts Institute of Technology, 70 Vassar Street, Cambridge, MA 02139, USA
*
Author to whom correspondence should be addressed.
These authors contributed equally to this work.
Aerospace 2022, 9(1), 3; https://doi.org/10.3390/aerospace9010003
Submission received: 26 October 2021 / Revised: 7 December 2021 / Accepted: 10 December 2021 / Published: 22 December 2021
(This article belongs to the Special Issue Aircraft Noise)

Abstract

:
Promising low-noise aircraft architectures have been identified over the last few years at DLR. A set of DLR aircraft concepts was selected for further assessment in the context of sustainable and energy-efficient aviation and was established at the TU Braunschweig in 2019, the Cluster of Excellence for Sustainable and Energy-Efficient Aviation (SE2A). Specific Top-Level aircraft requirements were defined by the cluster and the selected DLR aircraft designs were improved with focus on aircraft noise, emissions, and contrail generation. The presented paper specifically addresses the reduction of aviation noise with focus on noise shielding and modifications to the flight performance. This article presents the state of the art of the simulation process at DLR and demonstrates that the novel aircraft concepts can reduce the noise impact by up to 50% in terms of sound exposure level isocontour area while reducing the fuel burn by 6%, respective to a conventional aircraft for the same mission. The study shows that a tube-wing architecture with a top-mounted, forward-swept wing and low fan pressure ratio propulsors installed above the fuselage at the wing junction can yield significant noise shielding at improved low-speed performance and reduce critical fuel burn and emissions.

Graphical Abstract

1. Introduction

In order to fulfill the goals of the Flight Path 2050 initiative by the European Union, it is necessary to reduce both the emissions and noise of future aircraft [1]. In this context, the Cluster of Excellence for Sustainable and Energy-Efficient Aviation (SE2A) was established at the TU Braunschweig in 2019. The overall goals of the SE2A focus on “the challenge to the structure of modern society, as transportation consumes high amounts of energy, produces high amounts of pollutants and noise, and thereby threatens our resource base, environment, and climate” [2]. To address these challenges, different aircraft architectures and technologies are under consideration with the intention of meeting the requirements for short, mid, and long-range applications. New technologies will be developed with a focus on electrification or alternative fuel concepts to assess their overall impact on the sustainability and energy efficiency of the entire air transport system.
Any new technology as introduced into the market will be assessed for its impact on overall aircraft noise. Currently, only the impact on noise certification levels according to ICAO’s Annex 16 [3] is evaluated. In the near future, the reduction of community noise will remain a key issue. At this point, DLR Göttingen is contributing to SE2A by tackling the noise challenge based on its long-time expertise and available simulation capabilities [4]. Especially since the growth of air transport, noise reduction technologies and their environmental impact are of great importance. Various authors have already shown that worldwide air traffic plays an important role in environmental pollution [5,6,7]. The aviation sector’s CO2 contribution is estimated at 2.5% of the anthropogenic CO2 emission worldwide [8]. Furthermore, the contributions of nitrogen oxide (NOx) emissions and contrails to global warming have become the focus of investigations in recent years. The climate impact of contrails could exceed the impact of CO2 by a factor of three or more in terms of radiative forcing (RF) [9].
As part of the activities in the cluster, this study scrutinizes the impact of low atmospheric emission technologies on the noise impact on the ground of mid-range aircraft. As low emission technologies, a geared turbofan (GTF) with an ultra-high bypass ratio (BPR = 12) in combination with a forward-swept wing (FSW) were chosen. For this study, carbon dioxide, nitrogen oxide, and nvPM (non-volatile Particulate Matter) emissions are evaluated along with the sound exposure level (SEL) noise contours and 1000 m sideline levels. Additional low noise technologies such as landing gear fairings are not assessed in this study.
It can be demonstrated that the FSW in combination with a GTF and an over the wing shielding architecture reduces the fuel burn of a tube-wing mid-range aircraft by 6% while also reducing the noise impact in terms of SEL area by up to 50%.

2. Environmental Considerations

2.1. Aircraft Noise

During departure, when engines operate near or at maximum thrust, engine noise dominates. For aircraft with turbofan engines, one can further divide the engine noise sources into dominating contributors, i.e., tonal and broadband fan noise and broadband jet noise. The noise contribution of other engine components, e.g., the combustion noise contribution, can be neglected within this study since their contribution to the standard noise descriptors is not significant for the conventional turbofan engines under consideration [10]. The tonal fan noise depends on the actual blade loading, the rotational speed, and the geometry of the rotor (including stator design). At takeoff, the fan tip can be exposed to supersonic velocities, resulting in significant additional noise, i.e., a shock system at the fan blade tips can yield so-called buzz-saw noise or multiple pure tone noise (MPT). Broadband contribution is mainly dependent on the specific fan blade geometry. Jet noise is caused by the mixing of the two exhaust streams (core and bypass) with one another and the free stream. In these mixing regions, the temperature and velocity gradients are large and strong shear layers develop with strong turbulent fluctuations. Broadband jet noise is emitted and depends mainly on the jet velocities but also on the mixing characteristics of the different flow regimes [11]. The relevance of fan and jet noise can vary along the flight path with segments dominated by fan or jet noise, respectively.
During approach, the most significant noise contribution can be attributed to the airframe, because the engines operate at reduced thrust settings or in high idle [12]. In particular, the high lift devices and the landing gear are the major noise contributors. With retracted landing gear and high lift devices, the wing and tailplane trailing edge noise dominates the aircraft noise. Deploying the landing gear causes a strong turbulent wake system, impinging on deployed high-lift elements downstream of the gear. In certain flight conditions, this can cause significant additional noise that is referred to as installation noise [13]. In general, installation noise describes source mechanisms caused by the effect of other aircraft parts upstream of the flow, altering the flow condition at the noise source. Moreover, the overall aircraft noise can be significantly increased if so-called parasitic noise sources are present. For example, wing fuel overpressure vents can act as cavities and emit tone noise [14].

2.2. Atmospheric Emissions

The aircraft’s environmental impact strongly depends on its emissions. During the combustion process in jet engines, those emissions are generated and emitted into the atmosphere as exhaust gas. They can either be the natural outcome of the combustion process (CO2, H2O) or the result of an incomplete combustion process (CO, UHC, SOx, NOx, nvPM). CO2 and H2O are well known as greenhouse gases (GHG). They influence the natural heat exchange of the earth by preventing low-frequency infrared radiation, emitted by the earth’s surface, from escaping the atmosphere while letting higher frequent solar radiation from the sun passing. Thus, the equilibrium temperature of the atmosphere is pushed to higher temperatures, proportional to the amount of GHG in the atmosphere.
NOx obtains its global warming potential from its effect on the ozone cycle. The emission in the lower atmosphere leads to an increased formation of ozone, where it affects the air quality due to its highly oxidizing nature and therefore the hazardous effect on the human body. When emitting ozone into the upper atmosphere, an opposing effect takes place. Because of the additional presence of high-energy radiation ozone is split irreversibly into oxygen. This leads to a depletion of the ozone layer, which protects the earth against high energetic radiation [15].

2.3. Contrails

Contrails can contribute similarly to global warming as GHG. They block long-wave radiation from the earth’s surface from being emitted back to space and trapping it into the atmosphere while being relatively transparent for short-wave solar radiation coming from the sun [9]. The formation takes place within the exhaust plume of the engine. Small particles act as condensation nuclei forcing the water vapor emitted by the engine to condensate. Therefore the amount of emitted nvPM and H2O is an important indicator for the tendency to form contrails [16].

3. SE2A Mid-Range Aircraft Applications

Future long-range aircraft might use the Blended Wing Body (BWB) architecture, leaving the tube and wing architecture of special interest for the short- and mid-range designs. Furthermore, market forecasts for the upcoming decades foresee a significant increase in demand for short- and mid-range aircraft [17,18,19]. Therefore, this work will focus on the mid-range aircraft with a conventional tube and wing architecture. The TLAR’s are based on the performance characteristics of an Airbus A320 aircraft, as one of two market leading options in this segment.
In addition to the mission requirements provided in Table 1, various technologies are proposed for mid-range vehicles, i.e., hybrid-electric propulsion (HEP) and boundary layer ingestion (BLI) concepts. Electric propulsion is among the considered technologies because of the latest improvements in battery technology. They enable the application of electric drives at some point to at least partially replace conventional gas turbine engines in flight operation. The significant increase in design space for such aircraft can also reduce local emissions. The fact that energy storage, generation, and propulsion units can be spatially separated opens up an extensive solution space for novel ideas. The separation and distribution of subsystems allow for a tailored arrangement of propulsion units maximizing aerodynamic performance. Furthermore, propulsors could be installed in a way that potential noise shielding effects can be exploited. The weight of electric motors scales differently than conventional gas turbines. One way to exploit this is to use multiple small propulsors operating at high rotational speeds instead of having a few large engines that operate at low rotational speeds [20]. A potential weight reduction with HEP can have beneficial effects on both cruise performance and noise generation throughout departure and landing. The boundary layer ingestion promises a significant reduction in overall aircraft drag and hence can yield significant fuel savings [21]. As recent publications showed, however, a mid-range application of battery-based technologies in near future is unlikely [22,23].
Simulation capabilities to assess the noise reductions with these technologies are far from mature and need more fundamental research. For example, BLI might lead to significant excess noise that would counteract any other noise reduction measure and increase ground noise levels [24]. The noise generation mechanics for these technologies are still not well understood and addressed through efforts led by SE2A.
Additional concepts and ideas toward mitigation of the emissions and the contrail generation are addressed in the following section. These mitigation strategies are not applied within this study but could be considered for future research activities to ultimately address all three SE2A challenges. Some proposed measures will have advantageous effects on all three challenges, i.e., simultaneously reducing noise, emissions, and contrail generation.

3. Noise and Emission Mitigation Strategies

To reduce environmental pollutants, the overall fuel consumption must be decreased. A reduction in fuel burn can be achieved either by reducing the thrust needed, which is equivalent to reducing the overall drag, and/or by improving the efficiency of the propulsion system. Furthermore, advanced thermodynamic engine cycle choices can also reduce emissions. Promising technologies are the lean premixed pre-vaporized (LPP) combustor, the staged combustor, and the rich burn quick lean (RQL) combustor which could play a role in future concepts [25]. Furthermore, previous DLR studies pointed out further reductions in the environmental impact of emissions from changes in aircraft operations [25]. In particular, the effects of ozone (O3) and water vapor of contrails on the RF are sensitive to flight operation, i.e., region and altitude of the actual flight path. Avoiding certain flight altitudes and regions is estimated to reduce the climate impact by 30–60% while resulting in about 8–30% increased direct operating costs [26,27,28]. In this context, Koch et al. [25] and Grewe et al. [29] proposed a set of design rules. In order to avoid excessive pollution in higher altitudes, it is necessary to design the aircraft for a cruise flight at lower altitudes. This also leads to a lower optimal cruise Mach number due to the higher air density, which possibly results in a reduced wing sweep, a higher aspect ratio, and an increased wing thickness [25]. According to [9] sustainable aviation fuels (SAF) can yield short-term mitigation of CO2 and contain smaller amounts of sulfur and aromatic species, which can reduce ice and nvPM formation. However, the use of SAF is currently constrained by safety regulations which will not allow the usage of SAF blends larger than 50% [30].
More design rules and mitigation concepts are described by Farokhi [15], who proposes to focus on aerodynamic efficiency, the reduction of fuel consumption, and the reduction of harmful emissions. To improve the aerodynamic efficiency, several technologies including laminar flow control, exploitation of lifting surfaces (lifting fuselage), high aspect ratio wings (folding wings), tailless configurations, application of boundary layer ingestion, and sophisticated propulsion system integration are proposed. To reduce the fuel burn, suggested technologies include ultra-high bypass ratio engines, hybrid-electric propulsion, extensive use of lightweight materials, and fully electric operation at the gate and during taxi. With respect to harmful emissions, alternative biofuels with lower life-cycle emissions, staged combustion designs, and (fully) electric propulsion concepts are proposed. These mitigation strategies support the goals of the SE2A efforts and should be introduced as early as within the conceptual design of new SE2A vehicles.

4. DLR Simulation Process

More than a decade ago, DLR and TU Braunschweig launched a joint research effort to reduce exterior aircraft noise by assessing promising reduction measures [4]. An automated simulation process for the conceptual design of such low-noise aircraft was established, i.e., see Ref. [31], and is ready to be used by SE2A. The latest version of the simulation process, as described in Ref. [32], is comprised of the aircraft design synthesis tool PrADO [33,34] (TU Braunschweig), the noise shielding simulation tool SHADOW [35] (DLR), the flight simulation tool FLIPNA [11], and the aircraft system noise prediction tool PANAM [31,32]. Dedicated interfaces allow direct processing of external data from measurements or high-fidelity simulation. For example, measured weights, aerodynamic information, and delta noise levels of novel high-lift concepts can be processed and influence the final results [32].
Certain early design choices within the conceptual design phase can have an extensive impact on the acoustic performance of the vehicle. These are depicted in Figure 1. The most relevant effects must be captured adequately by any reliable simulation process. As shown in Figure 1, the sound intensity I x from most of the source mechanisms scale with the local flow velocity v x , i.e., airframe noise scales approximately with the power of six with the flow velocity. The only exception, in this case is, the effect of altitude, which scales by distance squared. At the subsequent design stages, these parameter choices are fixed and cannot be modified without major implications that require a revisit to the conceptual design stage. Based on findings from previous studies, simple guidelines for low-noise aircraft design can be deduced and are summarized in Refs. [4,32]. According to these rules, interaction noise sources should be avoided, e.g., jet-flap interaction noise can be avoided by selecting an over-wing engine position. Gear wake impingement on the extracted flaps is avoided by fuselage-mounted landing gears. Noise shielding shall be exploited, e.g., over-the-wing engine positioning can result in advantageous noise shielding of the forward fan noise emission. If available, low-noise technology shall be applied to selected components, e.g., the application of acoustic lining to the engine inlet and exhaust ducts [36]. The overall aircraft design shall be adapted as early as within the conceptual phase. Only then can advantageous propulsion integration concepts or low-noise flight performance be achieved, e.g., the latter can be influenced by modifications to the wing planform and thereby reduction in the minimum approach speed of the aircraft. Finally, the approach and departure trajectories should be adapted and tailored to the individual aircraft design under consideration [11].

4.1. Aircraft and Engine Design Tools

The initial workflow of the SE2A noise assessment simulation process is depicted in Figure 2. The toolchain is integrated into DLR’s RCE [37] framework to make these tools available in a more convenient way with the ability of distributed simulation.
All vehicles in this study were designed with TU Braunschweig’s PrADO [33] tool. PrADO is comprised of individual modules each dedicated to individual tasks in the conceptual design process of an aircraft; additional information about PrADO funcionality can also be found in Ref. [34]. For example, specific modules evaluate the weights of the fuselage, wing, and propulsion system. These weights are then subsequently processed by another module to determine the flight performance of the aircraft. Hereby, modules of different fidelity are available for certain tasks, i.e., ranging from fully empirical to analytical models. Furthermore, dedicated interfaces allow processing external data from experiments or numerical investigations by replacing the corresponding simulation module with external data [32].
PrADO is run iteratively until certain predefined parameters converge. Each design modification or alternative engine option impacts the components and thus the overall system yielding snow-ball effects. The result of the overall PrADO simulation process is a physics-based aircraft design [33]. The final vehicle resulting from the PrADO design process is then simulated along departure and approach trajectories to provide all required input data for the subsequent simulation of the ground noise impact. PrADO has the option to run internal flight simulation modules [31] or as selected within this study to process external data, e.g., from DLR’s FLIPNA tool [11].

4.2. Engine Model

For this study, the PrADO internal engine modules are replaced by external high-fidelity simulation results of the DLR Institute of Propulsion Technology’s GTlab tool [38]. It is a component-based engine design platform, which allows the virtual design and optimization of aircraft engines and stationary gas turbines. The performance calculations include the thermodynamic cycle design and off design simulations, both for ate and transient conditions.
The emission indices for CO2 and H2O were calculated under the assumption of complete combustion of the jet fuel, due to the high burn-out rates of modern aircraft engine combustors. For an average Kerosene sum formula of C12H23, this gives EI CO2 = 3157.3 g/kg and EI H2O = 1237.2 g/kg for all operating conditions [39].
Emissions of NOx and Particulates are more dependent on the engine operating condition. Sea level static (SLS) emission indices for all commercial engines currently in service with a rated thrust greater than 26.7 kN are provided in the ICAO Engine Exhaust Emissions Databank [40]. To calculate altitude emissions based on these data, the Boeing Fuel Flow Method 2 [41] was recommended by ICAO. A similar fuel flow correlation method for NOx emissions has also been published by DLR [42]. For calculating cruise nvPM emission indices, DLR has developed the so-called DLR Soot Correlation [43] which was applied here. For the advanced engine model, no emissions data were available in the ICAO Databank. Therefore, SLS emission indices of a similar, modern engine (the PW1100G) were used as the basis for the emissions model. These data have been corrected for the different thermodynamic engine conditions of the advanced engine, compared to a generic model of the PW1100G model. This correction was performed with the P3T3 method for NOx [41,44] and the DLR Soot Correlation (s.o., [43]) for nvPM. The P3T3 method usually assumes a fuel air ratio (FAR) exponent of 0, because in a rich–quench–lean (RQL) combustor, which is currently the most frequent combustion technology in aircraft engines, there is always a region with stoichiometric conditions which dominates the NOx production. However, in this case the combustor overall design FAR was different for the reference and the advanced engine model. Therefore, an FAR exponent of 0.55 was used to account for this difference (taken from an earlier investigation in [45]). The DLR soot correlation already includes an FAR correction term. Both the standard NOx and nvPM correlation methods have then been applied with these corrected SLS reference emission indices.

4.3. Noise Shielding

Depending on engine airframe integration, acoustic interaction or installation effects can influence the resulting ground noise impact of the aircraft [31]. A dedicated DLR tool to assess these acoustic interaction effects can directly be applied to the PrADO aircraft model. The ray-tracing tool SHADOW [35] provides level differences that can directly be processed when the overall ground noise impact is assessed. In Figure 3, a representation of the data provided by SHADOW is shown. The tool delivers delta levels (AttnM-dB) on a sphere around the aircraft for the third octave bands. The effect of noise shielding clearly becomes visible below the aircraft in the green–blue area of the sphere. The pink dot represents the source position, in this case the position of the right engine, which is modeled as a monopol.

4.4. Flight Simulation

FLIPNA [11] is applied to simulate the individual flight tracks of each design variant. PrADO’s internal simulation modules for flight simulation are bypassed and the data from FLIPNA is processed. Essential for any meaningful flight simulation is a detailed definition of the high-lift system and the corresponding aerodynamic performance. Throughout an approach trajectory, the overall ground noise impact is directly dependent on the configuration setting, i.e., the deployment of the high-lift system and the landing gear. During the departure trajectory, the flight performance and thus the noise impact can be influenced by the high-lift system. PrADO provides these data for the simulation with FLIPNA, which implements the ECAC.CEAC DOC 29 Volume 2, App. B regulations, but uses the engine and flight performance data provided by PrADO instead of performance coefficients. It allows the calculation of NADP-1/2 departure trajectories and LDLP/CDA approach trajectories. The mission analysis is carried out by PrADO internal flight simulation.

4.5. Overall Aircraft Noise Simulation

The overall aircraft noise is assessed with DLR’s tool PANAM [31]. A brief description of PANAM can also be found in Ref. [46]. The final aircraft and engine design and performance parameters (including acoustic installation effects from SHADOW) are used as inputs. Specific noise source models from DLR and open literature are applied to simulated individual noise sources of the vehicle [31], references to the specific models are listed in Table 2.
The noise sources can vary during the flight path (including acoustic installation effects) and are accounted for and summed up to yield the overall aircraft noise emission. The emission from each aircraft position is then propagated through the atmosphere to finally yield the ground noise impact. Standard noise metrics, e.g., SEL, L A , m a x , and effective perceived noise level (EPNL), are evaluated and different observer locations are considered. Other metrics to assess sound quality are part of ongoing research activities within SE2A and can be applied via an external tool by TU Braunschweig [57], which is based on psychoacoustic metrics (loudness, sharpness and tonality) and delivers a combined metric PAmod,5%, based on the work of More [58].

4.6. Verification of Simulated Noise Levels

Feasibility and validity of the simulated noise levels are confirmed by previous and ongoing investigations not in the scope of the presented SE2A activities. Predicted noise levels are compared to measured noise levels for certain existing aircraft in dedicated flyover campaigns orchestrated by DLR, e.g., B737-700 [59] or A319 [31]. The flight campaign with the A319 was comprised of multiple approach and departure flights. Thereby, the aircraft was flown and later simulated under various typical operating conditions along both approach and departure flights. Comparison of simulation and measurement shows good agreement for all considered operating conditions and observer locations [31]. A study with a VFW614 aircraft confirmed PANAM’s simulation capabilities even along unconventional and novel approach trajectories [60]. More recently, the implemented noise models and the overall simulation process are carefully assessed for inherent simulation uncertainties, i.e., input, modeling, and propagation uncertainty [61]. The level of uncertainty that can be associated with the simulated noise levels are suitable for the comparative assessment presented in this work [61]. Last but not least, the noise simulation tool PANAM has been validated against simulation tools from ONERA and NASA [46]. The comparison is based on almost identical input data in order to clearly work out the differences due to the inherent models. This comparison indicates that the PANAM simulation results for tube-and-wing aircraft with turbofan engines are plausible and feasible if compared to other simulation tools [46]. In conclusion, previous and ongoing investigations are understood as a confirmation of the overall simulation result, i.e., the outcome of aircraft and engine design, flight simulation, and noise prediction.

4.7. Advanced Aircraft Concepts

Based on a previous DLR report [62] and dedicated low-noise design studies by DLR [4,31], a promising aircraft architecture with an alternative engine option is selected for the mid-range vehicle concepts. A tube-and-wing architecture with the engines mounted above the fuselage–wing junction is most promising for shielding engine noise. This configuration yields approx. 11 dB lower max. A-weighted sound pressure level ( L A , m a x ) during approach and, about 3 dB lower L A , m a x during departure [31,32]. Two variants of this architecture are selected for further assessment, i.e., one concept with backward-swept wings (concept V-2 adapted from Ref. [31]) and one vehicle with forward-swept wings adapted [62]. A previous study demonstrated significant advantages for a new engine option, i.e., a geared turbofan engine with a bypass ratio of 12, even for aircraft with shielded fan noise [32]. Furthermore, a significant reduction in fuel burn was demonstrated for this engine [32].
The investigated concept vehicles are derived from available PrADO aircraft designs [31,32] and are modified to meet the requirements for a mid-range mission, in terms of number of passengers, fuselage length, design range cruise altitude, and Mach number. The evolution of the design concept is shown in Figure 4. It started with a simple engine replacement as a first modification for reduced noise. Next, more advanced design changes such as a high-mounted, forward-swept wing, based on [62], were incorporated. To further improve system performance, additional technologies will be included.
As a reference vehicle, a standard configuration based on the Airbus A319 was chosen, representing the current state of the art. The low noise configuration V-2 has a shoulder-mounted wing to avoid possible installation effects of the gear and the high-lift system. In addition, the aspect ratio of the wing was reduced to increase the shielding area in front of the engine by increasing the chord length at the wing root [31]. The FSW wing design concept, V-3, adopts the shoulder-mounted wing concept as well as the shoulder-mounted engines but uses a forward-swept high aspect ratio wing design to increase aerodynamic efficiency and to reduce emissions [62].
As Redeker et al. [63] have shown, a laminar wing is a promising solution to reduce the airfoil drag in the transonic regime by delaying the laminar–turbulent transition of the boundary layer flow. While for lower Mach numbers laminar wings are already common, e.g., sailplanes, the boundary layer becomes increasingly unstable for higher Mach numbers. This is particularly true for swept wings which suffer from attachment–line transition (ALT) and cross-flow instability (CFI) besides the Tollmien–Schlichting instabilities (TSI). These also occur on a non swept wing [64]. In contrast to a backward swept wing, where the leading edge sweep angle increases compared to the effective sweep angle, the opposite applies to forward-swept wings. Thus, ALT and CFI, which both are sensitive to the leading edge sweep angle [63], are suppressed. Effective measures to delay transition are also explained in an earlier work by Seitz et al. [65]. The specific design of the forward-swept wing is directly derived from previous results obtained in dedicated DLR studies, i.e., projects LamAiR [66] and TuLam [67]. Seitz et al. [66,67] demonstrated promising benefits in terms of fuel-saving but at the cost of additional weight and adding complexity in the structural design of the wing and the design of the high lift devices. A lower fuel consumption also means lower emissions but might come at the cost of higher aircraft weight and reduced takeoff and landing performance increasing noise.
For a fair comparison, all aircraft have a conventional aluminum fuselage, a carbon fiber composite wing, and empennage. The wing-span is limited by size to a maximum width of 36 m, meeting the ICAO Aerodrome Reference Code element 2 ’C’ or ADG Group III requirements. Considering the available two engine options, a total of six PrADO aircraft were selected for this study, see Table 3. The aircraft equipped with the conventional BPR-6 turbofan are referenced as ceo (current engine option), whereas the aircraft equipped with the BPR 12 GTF are referenced as neo (new engine option). The design details are provided in Table 4. All six vehicles were simulated throughout the design mission considered in SE2A.
The emissions from these flights can be summed up and are used for an initial environmental assessment. Furthermore, individual flight trajectories for approach and departure are computed for each vehicle so that a full noise assessment can be conducted. The aircraft noise impacts along the entirety of the approach and departure flights are then predicted and compared. The reference vehicle is referred to as V-R (Figure 5a), the modified low-noise design from [31,32] as V-2 (Figure 5b), and the new PrADO design of a forward-swept vehicle as V-3 (Figure 5c); the vehicles with the new engine option are labeled with the addition ’-g’.
It is important to note that no additional low-noise technologies were applied to the vehicles at this point. Only the effect of noise shielding and the flight performance on the aircraft noise are assessed in detail here.

5. Results

In Section 5.2 the fuel consumption and emission of CO2, H2O, NOx, and nvPM (Table 5 and Table 6) emitted over the design mission are presented, both separately for departure, cruise, and approach. The mission profile is depicted in Figure 6, including a departure, cruise and approach phase. Additional diversion and loiter time are also considered, as required by FAA regulations.
Then the aircraft noise is assessed by evaluating the contour areas of predefined SEL levels (Table 7 and Table 8), which was chosen because of its easy translation into L A , e q levels, which are the foundation of noise prediction zones in Germany. For a more detailed evaluation, the contour plots (Figure A1 and Figure A2) are also presented together with the corresponding flight trajectories (Figure 7, Figure 8, Figure 9 and Figure 10) and the A-weighted sound pressure level of a sideline observer track, 1000 m lateral to the groundtrack (Figure 11, Figure 12, Figure 13 and Figure 14). The lateral displacement of 1000 m was chosen because the advanced shielding of the V-2 and V-3 designs is most effective directly beneath the flight path but loses its efficiency quickly in the lateral direction. Typically, air traffic routing is adapted to an airport’s surroundings to avoid direct flyover events of highly populated areas. So, the selected observer locations are more representative compared to observers aligned directly under the flight path. Moreover, the unshielded levels are plotted for departure, where engine noise dominates, in order to give a better noise understanding of the effectiveness of the shielding architecture.

5.1. Aircraft Design

The most important parameters of the six aircraft designs are listed in Table 3. The geared turbofan was designed with a slightly higher static thrust at sea level (121 vs. 117 kN) to avoid implications caused by the higher thrust lapse of the GTF. Because of the higher bypass ratio, these engines are more sensitive to the decreasing air density with increasing altitude, resulting in a higher thrust loss. The modern GTF design can sustain higher temperatures at turbine entry (TET) and achieves a higher overall pressure ratio (OPR), leading to a higher efficiency, e.g., less thrust specific fuel consumption (TSFC). It also has a larger fan diameter and therefore a smaller fan pressure ratio (FPR).
The integration of the GTF also results in an overall heavier aircraft, caused by the heavier propulsion system. It is noticeable that the V-2 design has a lighter wing than the V-R and V-3, which is the result of the smaller wing span. The heavier wing of the V-3 is the result of the forward sweep and larger wing span, requiring the wing to sustain higher bending moments [66]. The fuselage of the V-2 and V-3 are longer than the V-R’s (39.90 m/40.25 m vs. 37.70 m) in order to reduce the empennage size and reduce trim drag, again leading to a heavier fuselage compared to the V-R. Due to the slightly different engine position, the vertical tail size of V-3 is smaller and lighter than the V-2’s tail. The V-3 also uses a different engine pylon, resulting in a slightly heavier weight of the propulsion system for the V-3 than for the V-2. Although the GTF designs are heavier than their counterparts, their landing gear weight is lower. This is caused by less necessary landing weight. Because the GTF burns less fuel, the required reserve fuel is lower, which outweighs the increase in OEW.
In terms of aircraft performance, the V-3 design shows the advantage of the FSW. While cruises CL are on a comparable level, the L/D of the V-3 is higher compared to those of V-R and V-2, which is the result of the lower drag of the extended laminar flow. The maximum CL in landing configuration shows opposing trends for the high and low engine position. Because the shown value is calculated in the trimmed condition, the overall weight and center of gravity position influences the maximum lift due to different deflection angles of the elevator. In the case of the top mounted engine, the neo designs require a higher deflection angle compared to their ceo counterparts. For the low mounted engines of the V-R, the effect is the opposite and therefore also the influences the maximum lift coefficient.

5.2. Emissions and Fuel Burn along Design Mission

Each vehicle was simulated with the defined design mission. Emission indices were multiplied by the actual fuel consumption for each flight segment and integrated along the entire trajectory in order to yield the overall emission. For the six vehicles, the estimated fuel consumption and emission values are listed in Table 5 and Table 6. Additionally, the difference to the reference design V-R is also shown in Table 6.
The fuel consumption shows significant advantages of the FSW design over the conventional wing designs, for both the current engine option and the new engine option, as a result of the lower cruise L/D. The fuel consumption of the V-2(-g) configuration increases compared to the V-R(-g) by 6.8% for the current engine option and 6.2% for the new engine option. It decreases by 6.3% and 6.5%, respectively, for the V-3(-g) compared to the V-R(-g). This trend is mostly due to the change in cruise L/D, which increases by 5.6% (ceo) and 5.3% (neo) for the V-2 and decreases for the V-3 by 8.6% and 8.9%, respectively. Using the BPR 12 GTF engine reduces fuel consumption by approximately 20% for all designs, compared to their ceo counterparts.
The improved fuel consumption directly translates to a lower CO2 and H2O emissions, which are calculated for stoichiometric combustion [39]. The emissions of NOx and nvPM are calculated from the engine map based on thrust, airspeed, and altitude based on the trajectory of the design mission. The total NOx and nvPM emissions for the conventional wing design V-2 exceed those of the reference design (V-R) by 8.2% (NOx) and by 8.5% (nvPM). For the new engine option V-2-g the emissions in comparison to the reference V-R-g decrease as well by 8.3% and 14.6%, respectively. The FSW design(V-3) with the current engine option V-3 achieves savings of 8.3% in terms of NOx emissions and 14.6% in terms of nvPM emissions. The new engine option achieves even greater savings in comparison to the reference V-R-g, 10.8% and 26.4%, respectively. When comparing the nvPM emissions of the ceo and neo designs, it is noticeable that all neo designs have a significantly higher nvPM emission. This is a result of the combustor design choice used for this version of the GTF engine, which is not optimized for low nvPM emissions. In future revisions of the engine design, the combustor design will be updated and nvPM emissions are expected to decrease below ceo levels.

5.3. Aircraft Noise Assessment along Approach and Departure

The noise assessment methods used for this study are listed in Table 2. Each vehicle is simulated for its individual approach and departure trajectory, i.e., the resulting operating conditions along the simulated flight are defined by the individual flight performance of each aircraft. At this point, no modification or low-noise optimization to the flight procedures is investigated. The vehicles are simulated according to fixed procedure definitions, i.e., a low-drag–low-power approach and a standardized NADP-1 departure. Noise footprints or isocontour areas are evaluated and compared for the different vehicles under consideration along their individual flight trajectories. The flight trajectories show visible differences mainly in velocity and thrust profile due to changes in flight performance of each individual aircraft. The resulting approach and departure trajectory of the three vehicles with the current engine option are depicted in Figure 7 and Figure 8, respectively. Results for the new engine option are depicted in Figure 9 and Figure 10. Depicted are the three most relevant parameters for the noise contribution on ground, altitude, thrust, and true air speed (TAS).

5.3.1. Current Engine Option (BPR = 6)

Approach: The approach trajectories are depicted in Figure 7. The V-3 vehicle is specifically designed for reduced flight velocities along with the final approach segments. As a consequence, a longer distance is required for decelerating the aircraft to its final approach speed. The reduced flight velocity is clearly visible in the velocity profiles for the V-3 aircraft compared to the other two vehicles.
These effects have direct implications on the predicted noise contours shown in Figure A1. Noise contours are shown for the final segment of the approach procedure. For x = 25 km all aircraft are already in the horizontal flight segment but prior to high-lift deployment. The corresponding changes in noise contour areas are shown in Table 7. Significantly reduced areas are predicted for the V-2 and V-3 vehicle compared to the other vehicles due to the noise shielding (V-2 and V-3) and reduced flight velocity along the trajectory (V-3).
Data are extracted from the noise contour plots to evaluate the effects in more detail. Noise levels along the 1000 m sideline are depicted in Figure 11 and highlight the influence of the flight speed, comparing V-2 and V-3.
The effects of the initial high-lift deployment at around 20 km prior to the runway threshold are clearly visible and lead to an increase of up to 10 dB along the sideline, depending on the design. It is also visible that the V-2 designs allow a comparably late high-lift deployment, resulting in a local difference of up to 9 dB. At approximately 9.5 km before touchdown, a double peak of 2–3 dB in the sideline levels is visible, caused by the final high-lift and landing gear deployment. Finally at around 6–7 km before touchdown the increase in thrust to maintain the approach velocity results in the third rise in sideline levels of 2–3 dB, depending on the design.
In conclusion, the noise shielding architecture of the V-2 and V-3 show the strongest effect whenever the engine noise is dominant, i.e., visible in the 80 dB and 85 dB contours along the very final flight segment of the approach. This was also expected because at this point in the approach the engine operates at the highest thrust setting in the final approach segment—even if still significantly lower than during takeoff. This is also the reason why shielding is not very effective here. The V-2 vehicle profits the most from its reduced landing gear noise, which becomes noticeable from 10 km before touchdown, but is mostly overshadowed by the increased engine noise because of the higher thrust setting. Significantly more advantageous is the effect of the lower approach speed of the V-3 vehicle. Noise levels are reduced throughout the entire approach trajectory, compared to the V-R and the V-2 vehicles, resulting in a reduction in the SEL isocontour areas of up to 46% for V-3. In comparison, the V-2 vehicle only achieves a reduction of up to 39%. In particular, the areas further away from the airport benefit more. This confirms the hypothesis that modifications of the flight performance can enable quieter flight operation.
Departure: The departure trajectories of the ceo designs are shown in Figure 8. The NADP-1 procedure provides a thrust cutback at 1500 ft altitude (approx. 2.5 km after take-off), which was chosen to be 6% below takeoff thrust. At 3000 ft the aircraft enters an acceleration profile, where the climb rate is reduced and the available thrust is mostly converted into speed. After reaching 250 kts (129 m/s) indicated airspeed (IAS)–TAS, as depicted in Figure 8 is higher—the aircraft continues the climb with constant N1 as steep as possible. Significant noise reduction for the low-noise vehicles is achieved along the entire observer sideline, as depicted in Figure 12. Comparing Figure 12a,b, the influence of the shielding architecture becomes obvious. During departure, both low-noise designs reach reductions of 2–3 dB of the sideline levels, which would not be possible without the dedicated shielding design of the vehicles. The differences along the sideline between the V-2 and V-3 can mostly be attributed to the different points in time, where the flaps are retracted, and to the 3.5 m/s lower flight speed of the V-3 design, compared to the V-2. The 3 dB drop of the sideline levels 2 km after takeoff, observable for all designs, is caused by the thrust cutback which is defined in the NADP-1 departure procedure, while the steep rise before is the result of the diminishing influence of the ground effect due to the increasing altitude.
The SEL isocontour area in Figure A1 shows the differences for the three vehicles for their individual flights. Compared to the V-R, both low-noise vehicles show significantly lower noise levels, i.e., especially close to the flight ground track, due to maximum fan noise shielding into this area because of the fuselage–wing engine installation. This engine arrangement results in excessive noise shielding toward observers directly below the aircraft, where a reduction of 10–12 dB in the L A , m a x can be achieved. This effect becomes especially noticeable from the dovetail shape in the contour area directly under the flight path (y = 0 km), as seen in Figure A1b,c. This is mainly due to extensive directivity characteristics of the noise emission because of shielding. This advantage is reduced with increasing distance to the flight ground track which is clearly visible in the lobe-shaped contours.
In conclusion, the effect of the selected noise shielding architecture results in significant noise reduction during departure. The SEL isocontour areas can be reduced by around 20–25% for the V-2 and around 23–25% for the V-3. Both vehicles, i.e., V-2 and V-3, show excessive reduction close to the flight ground track. The advantage is diminished with increasing distance to the flight ground track. After all, the advantageous flight performance of the V-3, i.e, the higher L/D and higher CL,max, does not result in significant advantages in terms of noise emission because of its higher takeoff mass.

5.3.2. New Engine Option (BPR = 12 GTF)

Approach: During approach, the new engine option is not expected to make a relevant difference. The engine operates at low power settings and the dominant noise source is the airframe, most sensitive to approach speed.
Comparing the flight trajectories of the designs with BPR 12 GTF engines (Figure 9) and the trajectories of the BPR 6 designs (Figure 7), the BPR 12 designs can achieve a roughly 5 m/s lower approach velocity than their BPR 6 counterparts at the same distance to the runway (compared 19 km before touchdown, after the first flaps are set). This is an effect of the higher minimum thrust setting of the neo engines, which leads to a longer and therefore earlier deceleration segment (not visible in the depicted altitude profile).
The lower approach speed results in lower airframe noise levels. The SEL contour areas can be reduced by about 30–50% each (see Table 7 and Table 8). Evaluating the levels of the sideline observers support these findings, the new engine option results in an approximately 2 dB lower L A , m a x level during most of the approach phase.
Comparing the BPR 12 designs among themselves in terms of contour size yields results similar to those of the BPR 6 designs. The reference design leads to the largest contour areas, while the V-2-g design as well as the V-3-g design are able to reduce the contour areas significantly by 20–40% compared to the reference V-R-g. Compared to their lower bypass ratio counterparts, which reduce the contribution of the engine to the overall noise impact on the ground, the difference is smaller and can even lead to larger contour areas for SEL levels above 90 dB (Table 7 and Table 8).
Departure: During departure, the geared turbofan engines with ultra-high bypass ratios operate at high thrust and the airspeed is lower than during approach, hence the engine is the most dominant noise source.
In comparison to the ceo variants, the evaluation of the sideline observers demonstrates a strong reduction in noise levels of more than 10 dB at peak levels for the reference design as well as the low noise variants. Both of the low noise designs V-2-g and V-3-g yield significantly reduced contour sizes compared to the reference V-R-g. The heavier FSW design leads to slightly larger 75 dB SEL contours than the V-2-g design due to its earlier acceleration segment. The contour also shows the influence of the engine noise shielding close to the flight ground track, which is still relevant even for the quieter neo design. In Figure A2c a ‘hole’ with reduced noise levels is visible in the SEL 75 contour just before the flaps are retracted 4–9 km after takeoff. In contrast to the V-2-g the 75 dB contour of the V-3-g closes again at around 10 km after takeoff. The effect occurs directly below the flight path due to the extensive shielding of the engine noise and the broader directivity pattern of the V-2 design compared to the V-3.
While the neo designs yield overall reduced engine noise, the shielding effectiveness starts to decrease, noticeably at the end of the acceleration segment. On the one hand, as depicted in Figure 14, the shielded L A , m a x levels experienced by the sideline observers (Figure 14a) exceed the reference aircraft for the V-3. Due to the comparable late flap retraction, airframe noise becomes partially relevant in this area. On the other hand, the difference to the unshielded values (Figure 14b) during the acceleration segment is within 2 dB of the ceo levels.

6. Discussion

For an initial assessment of the designs, certain parameters were chosen and evaluated, describing aircraft performance, noise impact, and atmospheric emissions. In Figure 15 those parameters are shown for the ceo engine and in Figure 16 for the neo designs, each compared to the reference design V-R or V-R-g, respectively. Evidently, the fuel consumption of the V-2 designs increases compared with the respective reference designs, which is consistent with the findings in [31,32] and the overall fuel-savings for the new engine option of 20% does as well. Nevertheless, an 6.8 % increase in fuel burn for the V-2 (Figure 15) appears comparatively high but can be attributed to the lower installed engine thrust and the higher cruise speed of the current designs. This also applies for the cruise L/D, which decreases for both, the V-2 and V-2-g, by 5–6%. Ultimately the reason for this is the increased design Mach number, compared to the original design [31]. Since the foremost purpose of this design was a significant system noise reduction, this shortcoming was accepted. The maximum CL in landing configuration increases along with the drag, mainly because of the reduced wing sweep. The operating empty weight remains almost the same for the V-2 but slightly decreases for the neo design, resulting from the lower wing weight due to design and lower fuel weight and therefore lower structural load.
For the V-3 and V-3-g, the fuel consumption was reduced significantly by the higher cruise lift-to-drag ratio [66,67], which in turn is mostly the result of significantly reduced drag. For the V-2 designs, the maximum CL also increases due to the reduced wing sweep. In this case, the increase in the total drag is avoided by the extended laminar flow over the wing. The operating empty weight of both FSW designs increases due to additional wing weight. However, the results of Seitz et al. [67] indicate that even a reduction in the OEW could be achieved in further design optimization loops that have not been in the scope of this study.
Both novel designs reduce the noise impact significantly during approach and departure compared to the reference, e.g., as demonstrated for the 80 dB SEL contour area. Looking at all contour areas, it is noticeable that the 80 dB SEL area is particularly sensitive to noise shielding. This area has been specifically selected as a design objective because it is the largest closed contour area available for a comparison between ceo and neo designs. Evaluating the effect of the shielding architecture, the findings correspond well with the results in [12,31], where a reduction of up to 11 dB for departure and up to 3 dB for approach were found, similar to the results of the present study. The 80 dB SEL isocontour area shows, accordingly, significant reductions, compared to the respective reference aircraft. They show a reduction of 26% for the V-2 and 49% for the V-3 design during the approach. For departure, the area was reduced by 25% and 28%, respectively. The neo designs, equipped with GTF, achieve even greater reductions of 26% (V-2-g) and 26% (V-3-g) for approach, where especially the V-2(-g) design profits from the reduced engine noise. In case of the V-3(-g) design the engine noise contribution is already on such a low level, that further reductions in the source emissions are not noticeable. For departure both, designs benefit the most from the reduced source emissions of the GTF, hence the isocontour areas can be more than halved by 52% (V-2-g) and 54% (V-3-g).
Figure 15 and Figure 16 only show CO2, H2O, and NOx emissions. Since CO2 and H2O are calculated for a stoichiometric combustion, both directly scale with fuel consumption. The NOx and nvPM emissions also change proportional with fuel consumption, except for the V-3-g design, which achieves lower NOx and nvPM emissions, compared to the V-R-g and V-2-g, because of the different operating condition of the engines.

7. Summary

The overall goal behind the presented activities is a novel low-noise aircraft-design with reduced environmental impact. The idea behind the V-3 concept, i.e., a tube-and-wing design with a high-mounted FSW and above the wing-mounted engines, is to tailor the overall flight performance to improve its resulting low-noise characteristics. It is designed for a low approach speed and achieves a significant reduction in fuel consumption for improved sustainability and energy efficiency. Furthermore, two different engine options (ceo and neo), of which neo is a geared turbofan with BPR of 12, were investigated. To evaluate the impact of these technologies, the V-3(-g) design is compared to a conventional reference aircraft design V-R(-g) and a dedicated low-noise design V-2(-g), i.e., both equipped with the same engine.
The evaluation shows significant improvements due to shielding, provided by V-2(-g) and V-3(-g) designs, yielding a reduction in the SEL isocontour area of 25–50% relative to the reference aircraft. While the V-2(-g) designs can achieve this only at some cost in terms of their environmental impact, the results of this study show that a FSW design can yield similar or better noise reduction while simultaneously reducing the environmental impact of the aircraft by 5–25%. Furthermore, this study highlights the importance of engine technology on both noise and environmental impact.
In conclusion, this work supports the hypothesis that a low-noise architecture can be combined with fuel-saving technologies for a mid-range tube and wing aircraft, without compromising the direct impact of the selected technologies. An assessment of the general applicability to short and long-range designs is yet to be conducted. It was also found that a truly multidisciplinary and holistic approach is required using methodologies and design systems which simultaneously addresses all of the meanings and modeling requirements in order to achieve a step change in noise and environmental impact.
Future research activities will focus on the modeling and assessment of additional technologies to improve the environmental performance, as described in Section 3.1. Furthermore, the application of novel technologies to reduce airframe noise sources will be investigated in more detail. At the same time, novel SE2A technologies and aircraft concepts will be developed. Consequently, the presented DLR simulation framework will be upgraded with new models and interfaces to process external data and high-fidelity simulation data as they become available within the SE2A. Ultimately, the DLR simulation framework will support a decision-making process within the SE2A in order to identify the most promising technologies and aircraft concepts toward a sustainable and energy-efficient aviation.

Author Contributions

Conceptualization, V.D. and L.B.; methodology, V.D. and L.B.; software, V.D., L.B. and M.P.; validation, V.D., L.B., M.P., E.S. and Z.S.S.; formal analysis, V.D.; investigation, V.D. and L.B.; resources, V.D. and L.B.; data curation, V.D. and L.B.; writing—original draft preparation, V.D. and L.B.; writing—review and editing, V.D. and M.P. and Z.S.S.; visualization, V.D. and L.B.; supervision, L.B., E.S. and Z.S.S.; project administration, L.B.; funding acquisition, L.B. All authors have read and agreed to the published version of the manuscript.

Funding

We would like to acknowledge the funding by the Deutsche Forschungsgemeinschaft (DFG, German Research Foundation) under Germany´s Excellence Strategy—EXC 2163/1- Sustainable and Energy Efficient Aviation—Project-ID 390881007.

Acknowledgments

The authors acknowledge the support of Jason Blinstrub with respect to the flight simulation of the novel vehicles. Furthermore, the authors thank Wolfgang Heinze for his expertise and advice with respect to aircraft design and the support with respect to PrADO.

Conflicts of Interest

The authors declare no conflict of interest.

Abbreviations

The following abbreviations are used in this manuscript:
ALTAttachment-line transition
BLIBoundary layer ingestion
CFICross-flow instability
COCarbon monoxide
CO2Carbon dioxide
FARFuel to air ratio
FLIPNAFlight simulation code, DLR
FPRFan pressure ratio
FSWForward swept wing
GHGGreen house gases
GTFGeared turbofan engine
H2OWater
HEPHybrid electric propulsion
IASIndicated air speed
ICAOInternational Civil Aviation Organization
LPPLean premixed pre-vaporized
MPTMultiple pure tone noise
NOxNitrogen oxides
nvPMnon-volatile Particulate Matter
O3Ozone
OPROverall pressure ratio
PANAMOverall aircraft noise prediction code, DLR
PrADOAircraft design synthesis code, TU BS
RFRadiative forcing
RQLRich quench lean
SAFSustainable aviation fuel
SE2ASustainable and energy-efficient aviation
SHADOWNoise shielding prediction code, DLR
SLSSea level static
SOxSulfur oxides
TASTrue air speed
TETTurbine entry temperature
TLARTop-Level Aircraft Requirements
TSITollmien–Schlichting instability
UHCUnburned hydrocarbons
SKMSeat kilometer
Noise metrics
EPNLEffective perceived noise level, [EPNdB]
ISound intensity, [W/m2]
LAA-weighted sound pressure level, [dB]
LA,eqequivalent continuous sound pressure level, [dB]
SELSound exposure level, [dB]
Nomenclature
L/DLift to drag ratio
CLLift coefficient

Appendix A. Contour Plots

Figure A1. SEL contour of the ceo designs.
Aerospace 09 00003 g0a1
Figure A2. SEL contour of the neo designs.
Aerospace 09 00003 g0a2

References

  1. High Level Group on Aviation Research. Flightpath 2050—Europe’s Vision for Aviation; Technical Report; European Commission: Brussels, Belgium, 2011. [Google Scholar] [CrossRef]
  2. Friedrichs, J. SE2A—Sustainable and Energy-Efficient Aviation, Cluster of Excellence, Full Proposal; Technical Report; TU Braunschweig: Braunschweig, Germany, 2018. [Google Scholar]
  3. International Civil Aviation Organization. Annex 16 to the Convention on International Civil Aviation: Environmental Protection: Volume I—Aircraft Noise, 5th ed.; AN 16-1, International Civil Aviation Organization (ICAO): Montreal, QC, Canada, 2008. [Google Scholar]
  4. Bertsch, L.; Heinze, W.; Guerin, S.; Lummer, M.; Delfs, J. 10 years of joint research at DLR and TU Braunschweig toward low-noise aircraft design–what did we achieve? Aeronaut. Aerosp. Open Access J. 2019, 3, 89–105. [Google Scholar] [CrossRef] [Green Version]
  5. Lee, D.S.; Fahey, D.W.; Forster, P.M.; Newton, P.J.; Wit, R.C.N.; Lim, L.L.; Owen, B.; Sausen, R. Aviation and global climate change in the 21st century. Atmos. Environ. 2009, 43, 3520–3537. [Google Scholar] [CrossRef] [PubMed] [Green Version]
  6. International Civil Aviation Organization (ICAO). ICAO Global Environmental Trends–Present and Future Aircraft Noise and Emissions; Technical Report; International Civil Aviation Organization (ICAO): Montreal, QC, Canada, 2019. [Google Scholar]
  7. Graver, B.; Rutherford, D.; Zheng, Z. CO2 Emissions from Commercial Aviation: 2013, 2018, and 2019; Technical Report; International Council on Clean Transportation (ICCT): Washington, DC, USA, 2020. [Google Scholar]
  8. Graver, B.; Zhang, K.; Rutherford, D. CO2 Emissions from Commercial Aviation, 2018; Technical Report 16; International Council on Clean Transportation (ICCT): Washington, DC, USA, 2019. [Google Scholar]
  9. Kärcher, B. Formation and radiative forcing of contrail cirrus. Nat. Commun. 2018, 9, 1824. [Google Scholar] [CrossRef] [PubMed]
  10. Isermann, U.; Bertsch, L. Aircraft Noise Immission Modeling. CEAS Aeronaut. J. 2019, 10, 287–311. [Google Scholar] [CrossRef]
  11. Blinstrub, J. Immission-Based Noise Reduction within Conceptual Aircraft Design; Technical Report DLR-FB-2019-12; DLR: Göttingen, Germany, 2019. [Google Scholar]
  12. Bertsch, L.; Clark, I.; Thomas, R.; Sanders, L.; LeGriffon, I. The Aircraft Noise Simulation Working Group (ANSWr)–Tool Benchmark and Reference Aircraft Results. In 25th AIAA/CEAS Aeroacoustics Conference; AIAA: Delft, The Netherlands, 2019. [Google Scholar] [CrossRef] [Green Version]
  13. Dobrzynski, W. Almost 40 Years of Airframe Noise Research: What Did We Achieve? J. Aircr. 2010, 47, 353–367. [Google Scholar] [CrossRef]
  14. Pieren, R.; Bertsch, L.; Lauper, D.; Schäffer, B. Improving future low-noise aircraft technologies using experimental perception-based evaluation of synthetic flyovers. Sci. Total. Environ. 2019, 692, 68–81. [Google Scholar] [CrossRef] [PubMed] [Green Version]
  15. Farokhi, S. Future Propulsion Systems and Energy Sources in Sustainable Aviation; John Wiley & Sons, Inc.: Hoboken, NJ, USA, 2020. [Google Scholar]
  16. Burkhardt, U.; Kärcher, B.; Schumann, U. Global Modeling of the Contrail and Contrail Cirrus Climate Impact. Bull. Am. Meteorol. Soc. 2010, 91, 479–484. [Google Scholar] [CrossRef] [Green Version]
  17. Airbus, Global Market Forecast 2021–2040. Available online: https://www.airbus.com/en/products-services/commercial-aircraft/market/global-market-forecast (accessed on 17 November 2021).
  18. Boeing, Commercial Market Outlook 2021–2040. Available online: https://www.boeing.com/commercial/market/commercial-market-outlook/ (accessed on 17 November 2021).
  19. Federal Aviation Administration. FAA Aerospace Forecast Fiscal Years 2021–2041; Technical Report; Federal Aviation Administration: Washington, DC, USA, 2021.
  20. Raymer, D.P. Aircraft Design: A Conceptual Approach, 6th ed.; AIAA Education Series; American Institute of Aeronautics and Astronautics Inc.: Reston, VA, USA, 2018. [Google Scholar]
  21. Habermann, A.L.; Bijewitz, J.; Seitz, A.; Hornung, M. Performance bookkeeping for aircraft configurations with fuselage wake-filling propulsion integration. CEAS Aeronaut. J. 2020, 11, 529–551. [Google Scholar] [CrossRef] [Green Version]
  22. Aigner, B.; Nollmann, M.; Stumpf, E. Design of a Hybrid Electric Propulsion System within a Preliminary Aircraft Design Software Environment. In Proceedings of the Luft- und Raumfahrt—Digitalisierung und Vernetzung: Deutscher Luft- und Raumfahrtkongress 2018, Bonn, Germany, 4–6 September 2018. [Google Scholar] [CrossRef]
  23. Karpuk, S.; Elham, A. Influence of Novel Airframe Technologies on the Feasibility of Fully-Electric Regional Aviation. Aerospace 2021, 8, 163. [Google Scholar] [CrossRef]
  24. Staggat, M.; Moreau, A.; Guérin, S. Analytical prediction of boundary layer ingestion noise for an integrated turbofan. In Proceedings of the 26th International Congress on Sound and Vibration (ICSV), International Institute of Acoustics and Vibration, Montreal, QC, Canada, 7–11 July 2019; Volume 26, pp. 1304–1311. [Google Scholar]
  25. Koch, A.; Nagel, B.; Grewe, V.; Dahlmann, K.; Schumann, U.; Gollnick, V.; Kärcher, B. Integrated Analysis and Design Environment for a Climate Compatible Air Transport System. In Proceedings of the 9th AIAA Aviation Technology, Integration, and Operations Conference (ATIO), American Institute of Aeronautics and Astronautics, Reston, VA, USA, 21–23 September 2009. [Google Scholar] [CrossRef]
  26. Dahlmann, K. Eine Methode zur Effizienten Bewertung von Maßnahmen zur Klimaoptimierung des Luftverkehrs. Ph.D. Thesis, Ludwig–Maximilians–Universität München, München, Germany, 2011. [Google Scholar] [CrossRef]
  27. Koch, A. Climate Impact Mitigation Potential Given by Flight Profile and Aircraft Optimization. Ph.D. Thesis, Technischen Universität Hamburg-Harburg, Hamburg, Germany, 2013. [Google Scholar] [CrossRef]
  28. Husemann, M.; Schäfer, K.; Schültke, F.; Aigner, B.; Stumpf, E. A Summary of the Climate Change Mitigation Potential through Climate-Optimized Aircraft Design; Technical Report; Institut für Luft- und Raumfahrtsysteme (ILR), RWTH Aachen University: Aachen, Germany, 2017. [Google Scholar] [CrossRef]
  29. Grewe, V.; Linke, F. Eco-efficiency in aviation. Meteorol. Z. 2017, 26, 689–696. [Google Scholar] [CrossRef]
  30. D02 Committee. ASTM D7566-16: Specification for Aviation Turbine Fuel Containing Synthesized Hydrocarbons. Available online: https://www.astm.org/d7566-09.html (accessed on 17 November 2021).
  31. Bertsch, L. Noise Prediction Within Conceptual Aircraft Design; Technical Report DLR-FB-2013-20; DLR, Deutsches Zentrum für Luft- und Raumfahrt (DLR): Göttingen, Germany, 2013. [Google Scholar] [CrossRef]
  32. Bertsch, L.; Wolters, F.; Heinze, W.; Pott-Pollenske, M.; Blinstrub, J. System Noise Assessment of a Tube-and-Wing Aircraft with Geared Turbofan Engines. J. Aircr. 2019, 56, 1577–1596. [Google Scholar] [CrossRef]
  33. Heinze, W. Ein Beitrag zur quantitativen Analyse der technischen und wirtschaftlichen Auslegungsgrenzen verschiedener Flugzeugkonzepte für den Transport grosser Nutzlasten. Technische Universität Braunschweig. In Zentrum für Luft- und Raumfahrttechnik; Inst. f. Flugzeugbau u. Leichtbau d. TU: Braunschweig, Germany, 1994. [Google Scholar]
  34. Werner-Spatz, C.; Heinze, W.; Horst, P. Improved Representation of High-Lift Devices for a Multidisciplinary Conceptual Aircraft Design Process. J. Aircr. 2009, 46, 1984–1994. [Google Scholar] [CrossRef]
  35. Lummer, M. Maggi-Rubinowicz Diffraction Correction for Ray-Tracing Calculations of Engine Noise Shielding. In 14th AIAA/CEAS Aeroacoustics Conference; AIAA: Vancouver, BC, Canada, 2008. [Google Scholar] [CrossRef]
  36. Koch, M.; Bertsch, L. Engine Noise Source Placement for Shielding Calculation; Inter Noise; Spanish Acoustical Society—SEA: Madrid, Spain, 2019. [Google Scholar]
  37. Seider, D.; Litz, M.; Schreiber, A.; Fischer, P.M.; Gerndt, A. Open source software framework for applications in aeronautics and space. In Proceedings of the 2012 IEEE Aerospace Conference, Big Sky, MT, USA, 3–10 March 2012; IEEE: Piscataway, NJ, USA, 2012; pp. 1–11. [Google Scholar] [CrossRef] [Green Version]
  38. Reitenbach, S.; Vieweg, M.; Becker, R.; Hollmann, C.; Wolters, F.; Schmeink, J.; Otten, T.; Siggel, M. Collaborative Aircraft Engine Preliminary Design using a Virtual Engine Platform, Part A: Architecture and Methodology. In AIAA Scitech 2020 Forum; American Institute of Aeronautics and Astronautics: Reston, VA, USA, 2020. [Google Scholar] [CrossRef] [Green Version]
  39. Rachner, M. Die Stoffeigenschaften von Kerosin Jet A-1. Technical Report. 1998. Available online: https://elib.dlr.de/3185/ (accessed on 17 November 2021).
  40. EASA. ICAO Engine Exhaust Emissions Databank. Available online: http://easa.europa.eu/document-library/icao-aircraft-engine-emissions-databank (accessed on 17 November 2021).
  41. DuBois, D.; Paynter, G.C. “Fuel Flow Method2” for Estimating Aircraft Emissions; SAE Technical Paper Series; SAE International: Warrendale, PA, USA, 2006. [Google Scholar] [CrossRef]
  42. Döpelheuer, A.; Lecht, M. Influence of Engine Performance on Emission Characteristics. In Gas Turbine Engine Combustion, Emissions and Alternative Fuels; NATO, Ed.; AC/323(AVT)TP; NATO Research and Technology Organization: Neuilly-sur-Seine, France, 1999. [Google Scholar]
  43. Döpelheuer, A. Anwendungsorientierte Verfahren zur Bestimmung von CO, HC und Ruß aus Luftfahrttriebwerken; Technical Report FB-2002-10; Institut für Antriebstechnik: Köln, Germany, 2002. [Google Scholar]
  44. Madden, P.; Park, K. Methodology for Predicting NOx Emissions at Altitude Conditions from Ground Level Engine Emissions and Performance Test Information; Technical Report DNS 90713; Rolls-Royce: Westhampnett, UK, 2003. [Google Scholar]
  45. Plohr, M.; von der Bank, R.; Schilling, T. Vergleich des Emissionsverhaltens effizienter Hochbypasstriebwerke mittlerer Schubgröße für den ICAO LTO-Zyklus und Flugmissionen. In Proceedings of the Deutscher Luft- und Raumfahrtkongress, München, Germany, 17–20 November 2003. [Google Scholar]
  46. Bertsch, L.; Sanders, L.; Thomas, R.H.; LeGriffon, I.; June, J.C.; Clark, I.A.; Lorteau, M. Comparative Assessment of Aircraft System Noise Simulation Tools. J. Aircr. 2021, 58, 867–884. [Google Scholar] [CrossRef]
  47. Dobrzynski, W.; Pott-Pollenske, M. Slat Noise Source Studies for Farfield Noise Prediction. In 7th AIAA/CEAS Aeroacoustics Conference; AIAA: Maastricht, The Netherlands, 2001. [Google Scholar] [CrossRef]
  48. Pott-Pollenske, M.; Dobrzynski, W.; Buchholz, H.; Gehlhar, B.; Walle, F. Validation of Semiempirical Airframe Noise prediction Method through Dedicated A319 Flyover Noise Measurements. In 8th AIAA/CEAS Aeroacoustics Conference; AIAA: Breckenridge, CO, USA, 2002. [Google Scholar] [CrossRef]
  49. Rossignol, K.S. Development of an empirical prediction model for flap side-edge noise. In 16th AIAA/CEAS Aeroacoustics Conference; AIAA: Stockholm, Sweden, 2010. [Google Scholar] [CrossRef]
  50. Rossignol, K.S. Empirical Prediction of Airfoil Tip Noise. In 17th AIAA/CEAS Aeroacoustics Conference; AIAA: Portland, ON, USA, 2011. [Google Scholar] [CrossRef] [Green Version]
  51. Dobrzynski, W.; Chow, L.; Guion, P.; Shiells, D. A European Study on Landing Gear Airframe Noise Sources. In 6th AIAA/CEAS Aeroacoustics Conference; AIAA: Lahaina, HI, USA, 2000. [Google Scholar] [CrossRef]
  52. Heidmann, M.F. Interim Prediction Method for Fan and Compressor Source Noise; Technical Report NASA TMX-71763; NASA Lewis Research Center: Cleveland, OH, USA, 1979.
  53. Stone, J.; Groesbeck, D.; Zola, C. Conventional profile coaxial jet noise prediction. AIAA J. 1983, 21, 336–342. [Google Scholar] [CrossRef]
  54. Lummer, M.; Hepperle, M.; Delfs, J. Towards a Tool for the Noise Assessment of Aircraft Configurations. In Proceedings of the 8th ASC-CEAS Workshop, Aeroacoustics of New Aircraft and Engine Configurations, Budapest, Hungry, 11–12 November 2004. [Google Scholar]
  55. A-21 Aircraft Noise Measurement Aviation Emission Modeling. Standard Values of Atmospheric Absorption as a Function of Temperature and Humidity; Technical Report; SAE International: Warrendale, PA, USA, 1975. [Google Scholar] [CrossRef]
  56. A-21 Aircraft Noise Measurement Aviation Emission Modeling. Prediction Method for Lateral Attenuation of Airplane Noise during Takeoff and Landing; Technical Report Aerospace Information Report, AIR 1751; SAE International: Warrendale, PA, USA, 1991. [Google Scholar] [CrossRef]
  57. Felix Greco, G.; Bertsch, L.; Ring, T.P.; Langer, S.C. Sound quality assessment of a medium-range aircraft with enhanced fan-noise shielding design. CEAS Aeronaut. J. 2021, 12, 481–493. [Google Scholar] [CrossRef]
  58. More, S.R. Aircraft Noise Characteristics and Metrics. Ph.D. Thesis, Purdue University, West Lafayette, IN, USA, 2011. [Google Scholar]
  59. Bertsch, L.; Guerin, S.; Looye, G.; Pott-Pollenske, M. The Parametric Aircraft Noise Analysis Module-status overview and recent applications. In 17th AIAA/CEAS Aeroacoustics Conference (32nd AIAA Aeroacoustics Conference); American Institute of Aeronautics and Astronautics: Reston, VA, USA, 2011. [Google Scholar] [CrossRef] [Green Version]
  60. Bertsch, L.; Looye, G.; Anton, E.; Schwanke, S. Flyover Noise Measurements of a Spiraling Noise Abatement Approach Procedure. J. Aircr. 2011, 48, 436–448. [Google Scholar] [CrossRef] [Green Version]
  61. Bertsch, L.; Schäffer, B.; Guérin, S. Uncertainty Analysis for Parametric Aircraft System Noise Prediction. J. Aircr. 2019, 56, 529–544. [Google Scholar] [CrossRef]
  62. Hepperle, M. Environmental Friendly Transport Aircraft. Notes Numer. Fluid Mech. Multidiscip. Des. 2004, 87, 26–33. [Google Scholar] [CrossRef]
  63. Redeker, G.; Wichmann, G. Forward sweep—A favorable concept for a laminar flow wing. J. Aircr. 1991, 28, 97–103. [Google Scholar] [CrossRef]
  64. Risse, K. Preliminary Overall Aircraft Design with Hybrid Laminar Flow Control. Ph.D. Thesis, RWTH Aachen, Aachen, Germany, 2016. [Google Scholar]
  65. Seitz, A.; Horstmann, K.H. Design Studies on NLF and HLFC Applications at DLR. In ICAS 2010; Grant, I., Ed.; International Council of the Aeronautical Sciences: Nizza, France, 2010; Volume 27. [Google Scholar]
  66. Seitz, A.; Kruse, M.; Wunderlich, T.; Bold, J.; Heinrich, L. The DLR Project LamAiR: Design of a NLF Forward Swept Wing for Short and Medium Range Transport Application. In 29th AIAA Applied Aerodynamics Conference; American Institute of Aeronautics and Astronautics: Reston, VA, USA, 2011. [Google Scholar] [CrossRef] [Green Version]
  67. Seitz, A.; Hübner, A.; Risse, K. The DLR TuLam project: Design of a short and medium range transport aircraft with forward swept NLF wing. CEAS Aeronaut. J. 2019, 11, 449–459. [Google Scholar] [CrossRef]
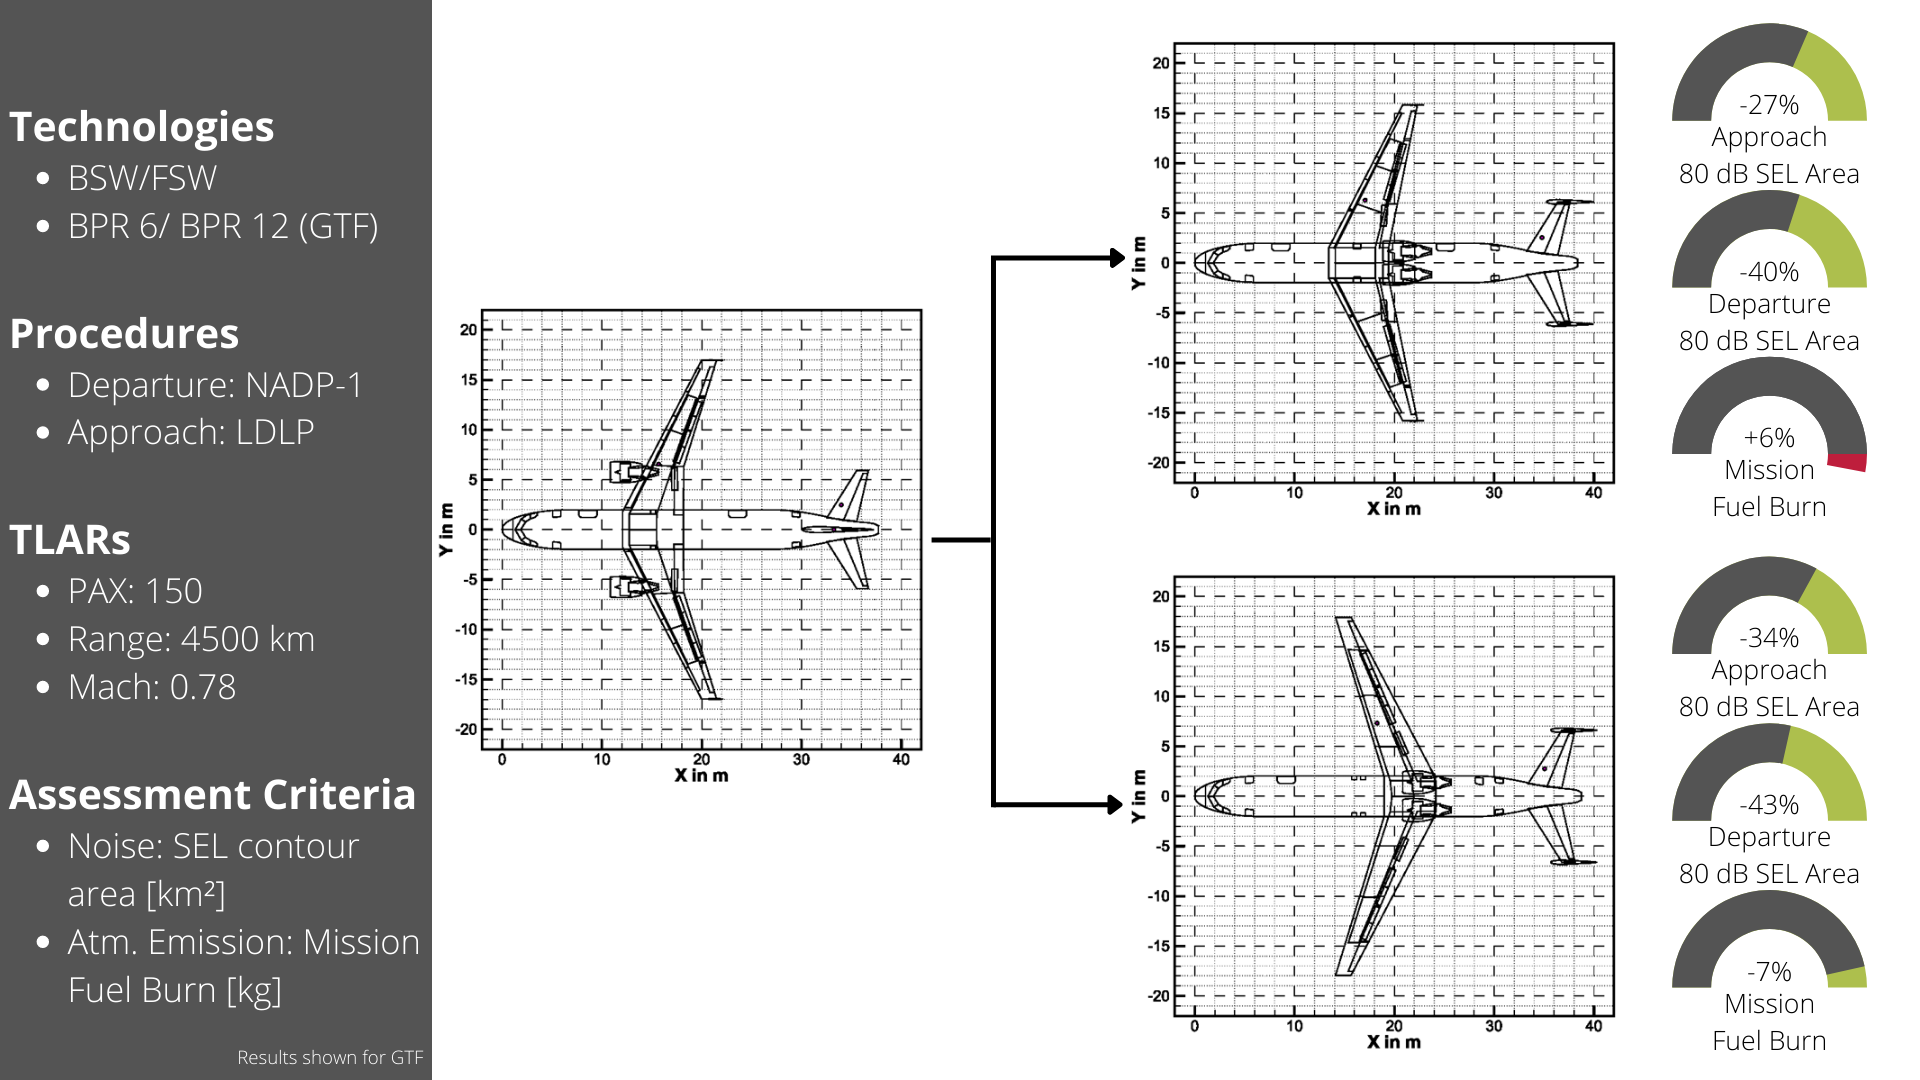
 [Green Version]
Figure 1. Influence of design options on acoustic performance of resulting vehicle (changed, originally from Ref. [4]).
Aerospace 09 00003 g001
Figure 2. RCE toolchain.
Aerospace 09 00003 g002
Figure 3. Representation of the delta levels (Attn–dB) provided by SHADOW, on sphere with a radius of 50 m for a frequency of 1000 Hz. The pink dot represents the simulated source position.
Aerospace 09 00003 g003
Figure 4. Evolution of low noise aircraft design at DLR.
Aerospace 09 00003 g004
Figure 5. Aircraft designs from PrADO.
Aerospace 09 00003 g005
Figure 6. Mission profile for the design mission, including: departure (1), cruise (2), approach (3), diversion (4), loiter (5).
Aerospace 09 00003 g006
Figure 7. Approach trajectories: current engine option (BPR = 6).
Aerospace 09 00003 g007
Figure 8. Departure trajectories: current engine option (BPR = 6).
Aerospace 09 00003 g008
Figure 9. Approach trajectories: new engine option (BPR = 12).
Aerospace 09 00003 g009
Figure 10. Departure trajectories: new engine option (BPR = 12).
Aerospace 09 00003 g010
Figure 11. L A , m a x level 1000 m sideline during approach (ceo).
Aerospace 09 00003 g011
Figure 12. L A , m a x level 1000 m sideline during departure (ceo) with and without applied shielding.
Aerospace 09 00003 g012
Figure 13. L A , m a x level 1000 m sideline during approach (neo).
Aerospace 09 00003 g013
Figure 14. L A , m a x level 1000 m sideline during departure (neo) with and without applied shielding.
Aerospace 09 00003 g014
Figure 15. Difference of V-2 and V-3 to the reference design V-R (ceo).
Aerospace 09 00003 g015
Figure 16. Difference of V-2-g and V-3-g to the reference design V-R-g (neo).
Aerospace 09 00003 g016
Table 1. Top-Level Aircraft Requirements (TLAR) for SE2A mid-range aircraft.
ParameterRequirement
No. of PAX150
Range4500 km
Cruise Mach0.78
Initial cruise alt.11,000 m
Table 2. Applied simulation methods for noise assessment.
Source/MechanismReferences
trailing edge noiseDLR model [31,47,48,49,50,51]
leading edge noiseDLR model [31,47,48,51]
landing gear noiseDLR model [31,47,48,51]
fan noisemodified Heidmann model [52]
jet noisemodified Stone model [53]
noise shieldingDLR tool SHADOW [35,54]
atmospheric propagationSAE standard 886A [55]
ground attenuationSAE standard AIR1751 [56]
Table 3. Aircraft designs considered in study.
a/c DesignArchitectureEngine OptionBPR
V-Rreferenceceo6
V-R-greferenceneo12
V-2noise-shieldingceo6
V-2-gnoise-shieldingneo12
V-3noise-shielding, foward-swept wingceo6
V-3-gnoise-shielding, foward-swept wingneo12
Table 4. Aircraft design and performance parameters.
ParameterV-RV-R-gV-2V-2-gV-3V-3-g
Propulsion
Engine BPR612612612
Static thrust in kN116.56121.39116.56121.39116.56121.39
TET in K1803.661883.141803.661883.1401803.661883.14
OPR29.034.629.034.629.034.6
FPR1.801.511.801.511.801.51
TSFC in g/kN/s11.517.6811.517.6811.517.68
Fan diameter in m1.371.651.371.651.371.65
Rel. pos. X in %28.7528.7547.2647.2651.7551.75
Rel. pos. Y in %33.8833.887.397.397.747.74
Total weights
OEW in kg38,72139,90738,31739,49441,25642,512
Max. takeoff in kg68,34166,41667,78265,62768,90167,140
Max. landing in kg63,77963,19262,82062,09857,51258,143
Component weights
Fuselage in kg9221921410,21810,22894269425
Wing in kg723173015689574488638968
HTP in kg504504576576691691
VTP in kg420420396396378378
Propulsion sys. in kg687380536873805369858165
Landing gear in kg218321671937191220082022
Fuselage
Length in m37.7037.7039.9039.9040.2540.25
Wing
Span width in m33.9633.9631.6431.6435.8635.86
Reference area in m2122.60122.60125.00125.00126.00126.00
Aspect ratio9.409.408.008.0010.2010.20
c/4 sweep angle in deg23.9823.9823.2923.29−19.32−19.32
l. e. sweep in deg27.4827.4826.9126.91−16.47−16.47
Horizontal tailplane
Span width in m11.8311.8312.2512.2513.2313.23
Reference area in m228.0028.0030.0030.0035.0035.00
Vertical tailplane
Span width in m5.875.874.424.424.334.33
Reference area in m221.5021.5013.0013.0012.5012.50
Landing gear length
Front gear in m2.272.271.341.341.901.90
Main gear in m2.752.751.781.782.092.09
Performance along design mission
Max. CL (land.)3.093.083.243.263.263.28
Cruise L/D17.6117.4816.6216.5519.1319.04
Cruise CL0.550.540.530.520.540.53
Cruise Mach0.780.780.780.780.780.78
Block time in h5.685.695.645.655.685.68
Fuel in kg/100 km/seat1.801.431.911.521.691.33
Max. field length in m193219171545144914561399
DOCs in Ct/SKM2.692.602.712.592.732.62
Table 5. Fuel consumption and emissions along the design mission (ceo). Advantageous change: green, disadvantageous change: red.
VehicleComponentDepartureCruiseApproachTotal%
V-RFuel in kg145010,09649012,036(–)
CO2 in kg457731,876154938,001(–)
H2O in kg1793.512,490.5606.814,890.9(–)
NOx in kg35.1109.63.2147.9(–)
nvPM in g67.361.00.5128.8(–)
V-2Fuel in kg14681086152712,855+6.8
CO2 in kg4634.234,290.11662.840,587.0+6.8
H2O in kg1815.913,436.7651.615,904.2+6.8
NOx in kg34.6121.53.9160.1+8.2
nvPM in g65.573.80.5139.8+8.5
V-3Fuel in kg1423938646811,277−6.3
CO2 in kg4492.929,634.11477.635,605.0−6.3
H2O in kg1760.611,612.2579.013,951.8−6.3
NOx in kg34.997.63.0135.6−8.3
nvPM in g67.242.30.5110.0−14.6
Table 6. Fuel consumption and emissions along the design mission (neo) and difference to the reference. Advantageous change: green, disadvantageous change: red.
VehicleComponentDepartureCruiseApproachTotal%% V-R
V-R-gFuel in kg128279973739652(−)−11.6
CO2 in kg4046.225,249.31178.330,474.0(−)−11.6
H2O in kg1585.59894.0461.711,941.3(−)−11.6
NOx in kg28.5100.53.2132.2(−)−18.8
nvPM in g99.7146.13.4249.2(−)48.1
V-2-gFuel in kg13638482410102556.3−7.2
CO2 in kg4304.326,778.71295.932,379.06.3−7.2
H2O in kg1686.710,493.3507.812,687.86.3−7.2
NOx in kg29.3109.43.7142.47.7−15.3
nvPM in g99.7166.63.6269.98.352.2
V-3-gFuel in kg121974503579027−6.5−14.3
CO2 in kg3849.723,521.21128.528,499.0−6.5−14.3
H2O in kg1508.59216.9442.211,167.6−6.5−14.3
NOx in kg27.687.23.0117.9−10.8−20.9
nvPM in g98.282.03.3183.5−26.446.1
Table 7. Sizes of iso-contour areas in km2, ceo.
SEL Level in dBV-RV-2V-3
approach
7512.1810.977.45
804.573.752.57
851.871.171.00
900.180.110.12
departure
75113.52
8066.6053.1551.17
8528.6722.9021.93
9011.348.328.27
Table 8. Sizes of isocontour areas in km2, neo. Relative difference to ceo counterparts in brackets (advantageous change: green, disadvantageous change: red).
SEL Level in dBV-R-gV-2-gV-3-g
approach
7510.21 (−16.2)8.57 (−21.9)6.81 (−8.6)
803.26 (−28.7)2.38 (−36.5)2.14 (−16.7)
851.57 (−16.0)0.84 (−28.2)0.72 (−28.0)
900.27 (50.0)0.14 (27.3)0.19 (58.3)
departure
7530.34 (–)21.43 (–)21.88 (−80.7)
8011.76 (−82.3)7.01 (−86.8)6.69 (−86.9)
854.76 (−83.4)3.18 (−86.1)3.02 (−86.2)
902.11 (−81.4)1.46 (−82.5)1.33 (−83.9)
Publisher’s Note: MDPI stays neutral with regard to jurisdictional claims in published maps and institutional affiliations.

