Article

Numerical Study on the Rebound of Low-Velocity Impact-Induced Indentation in Composite Laminate

Department of Engineering Mechanics, College of Aerospace Engineering, Nanjing University of Aeronautics and Astronautics, Nanjing 210016, China
*
Author to whom correspondence should be addressed.
Aerospace 2022, 9(11), 651; https://doi.org/10.3390/aerospace9110651
Submission received: 29 September 2022 / Revised: 19 October 2022 / Accepted: 20 October 2022 / Published: 26 October 2022

Abstract

:
Indentation is an effective indication of LVI damage in PMCs. However, indentation can rebound partly with time. Thus, a good understanding of the rebound behavior of the impacted pit is helpful in damage assessment for composites. In this paper, a transverse isotropic viscoelastic model and a viscoelastic cohesive interface model are proposed to represent the viscoelastic properties of ply and the interface between adjacent plies, respectively. In these models, we implement the in-plane 3D Hashin failure criterion to simulate ply level failures and the stress-based quadratic failure criterion and linear softening mixed-mode BK law to simulate cohesive interface failure initiation and propagation, respectively. LVI testing was performed on specimens at different impact energies (30 J, 40 J, and 50 J). Dents induced by impact will eventually rebound due to the viscoelastic behavior of plies and cohesive interfaces. This results in a decrease in depth with time. This indentation and its rebound phenomenon were simulated in ABAQUS by considering viscoelasticity with user-defined material subroutines. The simulation results show good agreement with the experimental observations and are validated accurately in terms of the indentation’s initial depth upon impact and its final rebound with time. From experiments, it was observed that the decrease in the original depth of indentation initially becomes faster with time after impact; then, it slows down with time and eventually stops due to viscoelasticity. While this decrease in the original depth of indentation remains invariable with time in simulation, it has a different rebound path.

1. Introduction

Polymer matrix composites (PMCs), especially carbon fiber-reinforced plastic (CFRP), have the great advantage of having a low specific weight with excellent mechanical properties. Due to this, use of CFRP has increased widely in many industries, such as the aerospace and automobile sectors. However, CFRP has one big disadvantage: it has poor properties in the through-thickness direction, which makes it vulnerable to low-velocity impact.
When impacted by a low-velocity object (e.g., any falling tool or impactor such as a hail stone), composite laminates behave in a relatively brittle manner and sustain surface and/or internal damage depending upon how they absorb impact energy. Damage may be in the form of delamination (interlaminar damage), matrix/resin cracking or dents, fiber fracture, or matrix/fiber debonding (intralaminar damage).
Mechanisms of damage for composite laminates usually include intralaminar (matrix cracking, fiber breakage) and interlaminar (delamination). A dent is a surface trace of an impact event that could relate to all kinds of damage modes.
To predict these interlaminar and intralaminar damages induced by low-velocity impacts, several methodologies are available in the literature. These include strength-based failure methodologies [1,2,3,4], fracture mechanics-based methodologies using the VCCT technique [5,6] or CZM technique by modeling cohesive (surface-based or element-based) [7,8,9] or spring elements [10] at the interface between two adjacent plies, and CDM-based methodologies [11,12,13,14].
By briefly summarizing some of these methodologies, Zubillaga presented that matrix cracks are responsible for delamination and, by considering fracture toughness and energy release rate of the interface, proposed a failure criterion [15]. F. Aymerich, F. Dore, and P. Priolo presented a model to predict delamination induced by low-velocity impact in cross-ply graphite/epoxy laminated plates using a cohesive interface [7]. C. Bouvet and S. Rivallant [16] also reported that matrix cracking is conventionally the first damage to appear upon impact, followed by delamination, which quickly occurs as damage starts to grow.
For further discussion about indentation, Karakuzu et al. [17] presented an empirical method to simulate permanent indentation in a numerical study of a glass/epoxy composite plate, which showed good agreement with the experimental results. Another empirical approach study related to indentation and penetration on CFRP laminates was carried out by Caprino et al. [18], in which it was proposed that indentation is an empirical function of impacted energy. He et al. [19] adopted an anisotropic elastic–plastic theory while considering delamination damage and damping effects for modelling LVI-induced permanent indentation marks on laminated composites.
CFRP laminates exhibit similar contact force and damage magnitudes under transverse quasi-static and LVI loading [20,21,22,23]. Therefore, dynamic impact loading can also be equivalently applied as quasi-static indentation loading.
Surface dents are the most direct damage characterization observed during visual checks of the impacted site, as the depths of these dents may relate to the degree of internal damage quantitatively. These dents may also rebound depending upon the viscoelastic behavior of the composite and the hygrothermal environment during the service span. This might lead to inaccurate estimations of absorbed impact energy as well as the degree of damage during impact. Therefore, it is necessary to develop a method for simulation and prediction of LVI damage in terms of dent depth and the rebound of dents with time, whilst also considering environmental conditions. Junjie Zhou, Bin Liu, et al. [24] numerically investigated the impact response and damage mechanism of composite laminates under single and repeated LVI by considering the thickness effect. Lin Xiao, Guanhui Wang, et al. presented an experimental study related to CFRP subjected to LVI and observed its viscoelastic behavior through the rebound of indentation dents in terms of depth in post-impact measurements [25].
One of the important properties of PMCs is viscoelasticity, which is mainly because of the polymer matrix/resin. This means that the dent depth at the impact site is prone to change with time immediately after impact. There are two parts: a recoverable part due to viscoelastic behavior and an unrecoverable part due to impact damage [26]. Unfortunately, this effect is usually not considered in LVI scenarios.
Viscoelastic relations may be expressed in both integral and differential forms, as explained in many published research works. Nima Zobeiry et al. [27] presented a method for FE modelling of isotropic and transversally isotropic viscoelastic materials. Laminae, in a homogenized way, is modelled as a transversally isotropic viscoelastic material.
Whilst indentation is an effective indication of LVI damage in PMCs, these dents can rebound partly with time. This might lead to inaccurate estimations of absorbed impact energy as well as the degree of damage during impact. Thus, a good understanding of the rebound behavior of the impacted dent is helpful in damage assessment for composites and needs to be thoroughly investigated. In this paper, the viscoelastic behavior of composite materials is modeled to investigate the rebound phenomenon. LVI testing was performed on specimens at different impact energies (30 J, 40 J, and 50 J). Dents induced by impact will eventually rebound due to the viscoelastic behavior of plies and cohesive interfaces. This results in a decrease in depth with time. Simulations were run in ABAQUS considering viscoelasticity with user-defined material subroutines. The simulation results show good agreement with the experimental observations and are validated accurately in terms of the indentation’s initial depth upon impact and its final rebound with time.

2. Materials and Methodology

In this section, materials and the overall research methodology are discussed. The schematic of the overall methodology or research flow is shown in Figure 1.

2.1. Viscoelastic Constitutive Equations for a UD Laminae Ply

The initial idea was taken from the work carried out by Kaliske and Rothert [28]. The Generalized Maxwell Rheological Model (Figure 2) can be used for the derivation and formulation of viscoelastic constitutive equations.
For this generalized Maxwell model, the stress of the material is written as
σ t = μ 0 ε 0 + i = 1 N μ i   e x p t τ i   ε 0 = Γ t   ε 0
where τ i = η μ is defined as the relaxation time for each Maxwell element chain.
σ t = σ 0 t + i = 1 N h i t
where σ 0 t is the stress in the elastic/Hookean spring element, and h i t expresses the stresses inside the Maxwell element chains:
h i t = 0 t γ i   e x p t s τ i   σ 0 s s d s
where γ i = μ i μ 0 .
In order to obtain a numerical solution for Equation (3), a time-discretized approximation of 2nd order can be implemented:
h i n + 1 = e x p Δ t τ i h i n + γ i 1 e x p Δ t τ i Δ t τ i σ 0 n + 1 σ 0 n
This indicates a very important result: all the values for h i t are only dependent on the previous values of h i . If these values are known, antecedent values for any given time step can be obtained with the help of the iterative formulation shown in Equation (4). Utilizing the iterative formulation, Equation (2) becomes
σ n + 1 = σ 0 n + 1 + i = 1 N h i n + 1
In order to derive constitutive equations/formulations for viscoelastic UD laminae ply, let us introduce a 3D formulation (with tensor notation) into Equation (5) and see Appendix A.
σ i j n + 1 = σ 0 i j n + 1 + i j k m p = 1 N h i j k m p n + 1
where the elastic stress is defined as
σ 0 i j n + 1 = C i j k m e ε k m n + 1
The superscript e in C i j k m e denotes that this tensor describes an elastic relationship between stress and strain as per the 3D generalized Hook’s Law for elastic materials. This is a 4th-order tensor C i j k m . To further simplify the tensor and formulation, the following assumptions are considered: the stiffness of the material remains constant, i.e., the material’s nature is linear; Boltzmann superposition and Hookean and Newtonian principles for linearity apply to the deformation as it is also linear; the material is transversally isotropic and in homogeneous form. Boltzmann superposition principle states that for all linear systems, if inputs a 1 and a 2 to a function g produce response of   A 1 and A 2 respectively, then input ( a 1 + a 2 ) produces response ( A 1 + A 2 ) , i.e.,
A 1 + A 2 = g a 1 + a 2 = g a 1 + g a 2
While Hooke’s law states that a linearly elastic material has a linear relationship between stress and strain or stress is directly proportional to strain, and Newtonian principle states that for a material having a constant viscosity over time, the relationship between stress against the rate of deformation is linear. Now consider Voigt notations [29], as they are easier to use, are introduced here and the above equations lead to
σ 0 M n + 1 = C M K e ε K n + 1
here the Cauchy stress tensor is defined as
σ M = σ 1 σ 2 σ 3 σ 4 σ 5 σ 6
with σ 11 = σ 1 , σ 22 = σ 2 , σ 33 = σ 3 , σ 12 = σ 21 = σ 4 , σ 13 = σ 31 = σ 5 , σ 23 = σ 32 = σ 6 . the strain tensor with Voigt notation can also be written in the same way as
ε K = ε 1 ε 2 ε 3 ε 4 ε 5 ε 6
The stiffness tensor is expressed as C M K e . It defines an elastic relationship between stress and strain. This stiffness tensor is for the transversally isotropic material as
C M K e = C 11 C 12 C 13 0 0 0 C 21 C 22 C 23 0 0 0 C 31 C 32 C 33 0 0 0 0 0 0 C 44 0 0 0 0 0 0 C 55 0 0 0 0 0 0 C 66 = E 1 + 4 K T υ 12 2 2 K T υ 12 2 K T υ 12 0 0 0 2 K T υ 12 K T + G T K T G T 0 0 0 2 K T υ 12 K T G T K T + G T 0 0 0 0 0 0 G 12 0 0 0 0 0 0 G 12 0 0 0 0 0 0 G T
where K T = 1 / ( 2 1 υ 23 E 2 4 v 12 2 E 1 and G T = E 2 2 1 + υ 23 are plane strain bulk modulus and transverse shear modulus respectively [28]. Therefore, the internal stress variables of Equation (4) can be rewritten as
h M K p n + 1 = e x p Δ t τ M K p h M K p n + γ M K p 1 e x p Δ t τ M K p Δ t τ M K p C M K e ε K n + 1 C M K e ε K n
Now after expanding Equation (6), the Cauchy stress in incremental formulation type is written as
σ M n + 1 = C M K e ε K n + 1 + M K p = 1 N exp Δ t τ M K p h M K p n + γ M K p τ M K p 1 exp Δ t τ M K p Δ t C M K e ε K n + 1 C M K e ε K n
This is (Equation (14)) an iterative formulation for the stress in viscoelastic material. This formulation is used in the UMAT subroutine to calculate the viscoelastic behavior of UD Laminae Ply.
In this paper, the viscoelastic UD Laminae Ply is simulated by considering only two Maxwell element chains in parallel with the Hookean springs of all the members of the stiffness tensor of transversally isotropic material. In other words, the Generalized Maxwell rheological model is used to simulate the viscoelastic behavior of lamina ply by considering two Maxwell chains with each value of the stiffness tensor [6 × 6] of transversally isotropic material. Therefore, the constitutive Equation (14) takes the shape as
σ M n + 1 = C M K e ε K n + 1 + exp Δ t τ M K 1 h M K 1 n + exp Δ t τ M K 2 h M K 2 n + { 1 + γ M K 1 τ M K 1 1 exp Δ t τ M K 1 Δ t + γ M K 2 τ M K 2 1 exp Δ t τ M K 2 Δ t } C M K e Δ ε K
where
Δ ε K = ε K n + 1 ε K n
A state variable approach is used to develop this generalized formulation. It is very important to note that by doing so, the relaxation function has been replaced with an exponential series/function of equal approximated values. These internal stresses in the Maxwell element chains are given by the function h M K p n + 1 . These are defined as state variables in the UMAT, which will be updated by using the relationship defined by Equation (13) in each iteration.
Constitutive Equation (15) is further used to calculate the tangent modulus/Jacobian matrix, which is the slope for the stress-strain curve
M K n + 1 = Δ σ Δ ε = 1 + M K p = 1 2 γ M K p 1 e x p Δ t τ M K p Δ t τ M K p C M K e   n + 1
where C M K e is the stiffness matrix defined in Equation (12).

2.2. Failure Law of UD Laminae Ply

In-plane 3D Hashin Failure Criterion was used to simulate lamina ply level failures, i.e., matrix failure and fiber failure (Table 1) to simulate impact damage during LVI testing.
Unidirectional (UD) Laminae Ply has transversally isotropic material behavior. Material properties of UD lamina ply are given in Table 2.
The elasticities and strengths of the specimen given in Table 2 were offered by the supplier “Xie Chuang Composite Material Co., Limited, Dongguan, China”.

2.3. Viscoelastic Constitutive Equations for Cohesive Interface

A similar approach has been extended to formulate constitutive equations for the viscoelastic cohesive interface. A traction separation model coupled with cohesive interface viscoelastic constitutive equations is used for the initiation, evolution, and rebound of damage in an impacted laminate. To derive constitutive equations/formulations for the viscoelastic cohesive interface, let us introduce a 3D formulation, vector notation adaptation in Equation (5) and see Appendix B.
t i j n + 1 = t 0 i j n + 1 + i j k m p = 1 N h i j k m p n + 1
here the elastic stress is defined as
t 0 i j n + 1 = E i j k m e ε k m n + 1
The superscript e in E i j k m e prevails that this vector is explaining an initial linear elastic relationship between stress and strain. Hence, it is the elasticity vector. To further simplify the vector and formulation, the following assumptions are considered: the stiffness of material remains constant, i.e., the material’s nature is linear; Boltzmann superposition, Hookean and Newtonian principles for linearity apply/hold to the deformation as it is also linear; the material is isotropic and in homogeneous form. Now, being easier to use, Voigt notations [29] are introduced here and the above equation becomes
t 0 M n + 1 = E M K e ε K n + 1
where the traction stress vector is defined as
t M = t 1 t 2 t 3
with t n = t 1 , t s = t 2 , t n = t 3 . The nominal strain vector with Voigt notation can also be written in the same way as
ε K = ε 1 ε 2 ε 3
The elasticity vector is expressed as E M K e . It defines an elastic relationship between stress and strain. The elasticity matrix for the isotropic material is
E M K e = E 11 E 12 E 13 E 21 E 22 E 23 E 31 E 32 E 33 = K N 1 d 0 0 0 K S 1 d 0 0 0 K T 1 d
where E 11 = E n n , E 22 = E s s ,   E 33 = E t t , E 12 = E 21 = E n s , E 13 = E 31 = E n t , E 23 = E 32 = E s t   ; K N , K S ,   K T are elastic stiffness values in normal and two shear directions, respectively; and d is a damage variable. Therefore, the internal stress variables of Equation (4) can be rewritten as
h M K p n + 1 = e x p Δ t τ M K p h M K p n + γ M K p 1 e x p Δ t τ M K p Δ t τ M K p E M K e ε K n + 1 E M K e ε K n
Now, after expanding Equation (6), the traction stress vector in incremental formulation type can be written as
t M n + 1 = E M K e ε K n + 1 + M K p = 1 N exp Δ t τ M K p h M K p n + γ M K p τ M K p 1 exp Δ t τ M K p Δ t E M K e ε K n + 1 E M K e ε K n
Equation (25) is an iterative formulation for the stress in a viscoelastic interface material. This formulation can be used in the UMAT subroutine to calculate the viscoelastic behavior of a cohesive interface.
In this paper, the viscoelastic cohesive interface is simulated by considering only two Maxwell element chains in parallel with the Hookean springs of all the members of the elasticity vector of an isotropic interface material. In other words, the Maxwell generalized viscoelastic model is used again to simulate the viscoelastic behavior of a cohesive interface by considering two Maxwell chains with normal and shear values of the elasticity vector [3 × 3] of an isotropic material. Multiple values of bulk modulus (55.2 GPa/mm) are applied in the normal direction while multiple values of shear modulus (9.33 GPa/mm) are applied in the shear direction of the cohesive interface. Therefore, the constitutive Equation (25) takes the form of
t M n + 1 = E M K e ε K n + 1 + exp Δ t τ M K 1 h M K 1 n + exp Δ t τ M K 2 h M K 2 n + { 1 + γ M K 1 τ M K 1 1 exp Δ t τ M K 1 Δ t + γ M K 2 τ M K 2 1 exp Δ t τ M K 2 Δ t } E M K e Δ ε K
where
Δ ε K = ε K n + 1 ε K n
A state variable approach is used to develop this generalized formulation. It is very important to note that by doing so, the relaxation function is replaced with an exponential series/function of equal approximated values. These internal stresses in the Maxwell element chains are given by the function h M K p n + 1 . These are defined as state variables in the UMAT, which will be updated by using the relationship defined by Equation (24) in each iteration.
The constitutive Equation (26) is further used to calculate the tangent modulus/Jacobian matrix, which is the slope for the stress–strain curve:
E M K n + 1 = Δ t Δ ε = 1 + M K p = 1 2 γ M K p 1 e x p Δ t τ M K p Δ t τ M K p E M K e   n + 1
where E M K e is the stiffness matrix defined in Equation (23).

2.4. Damage Law of Cohesive Interface

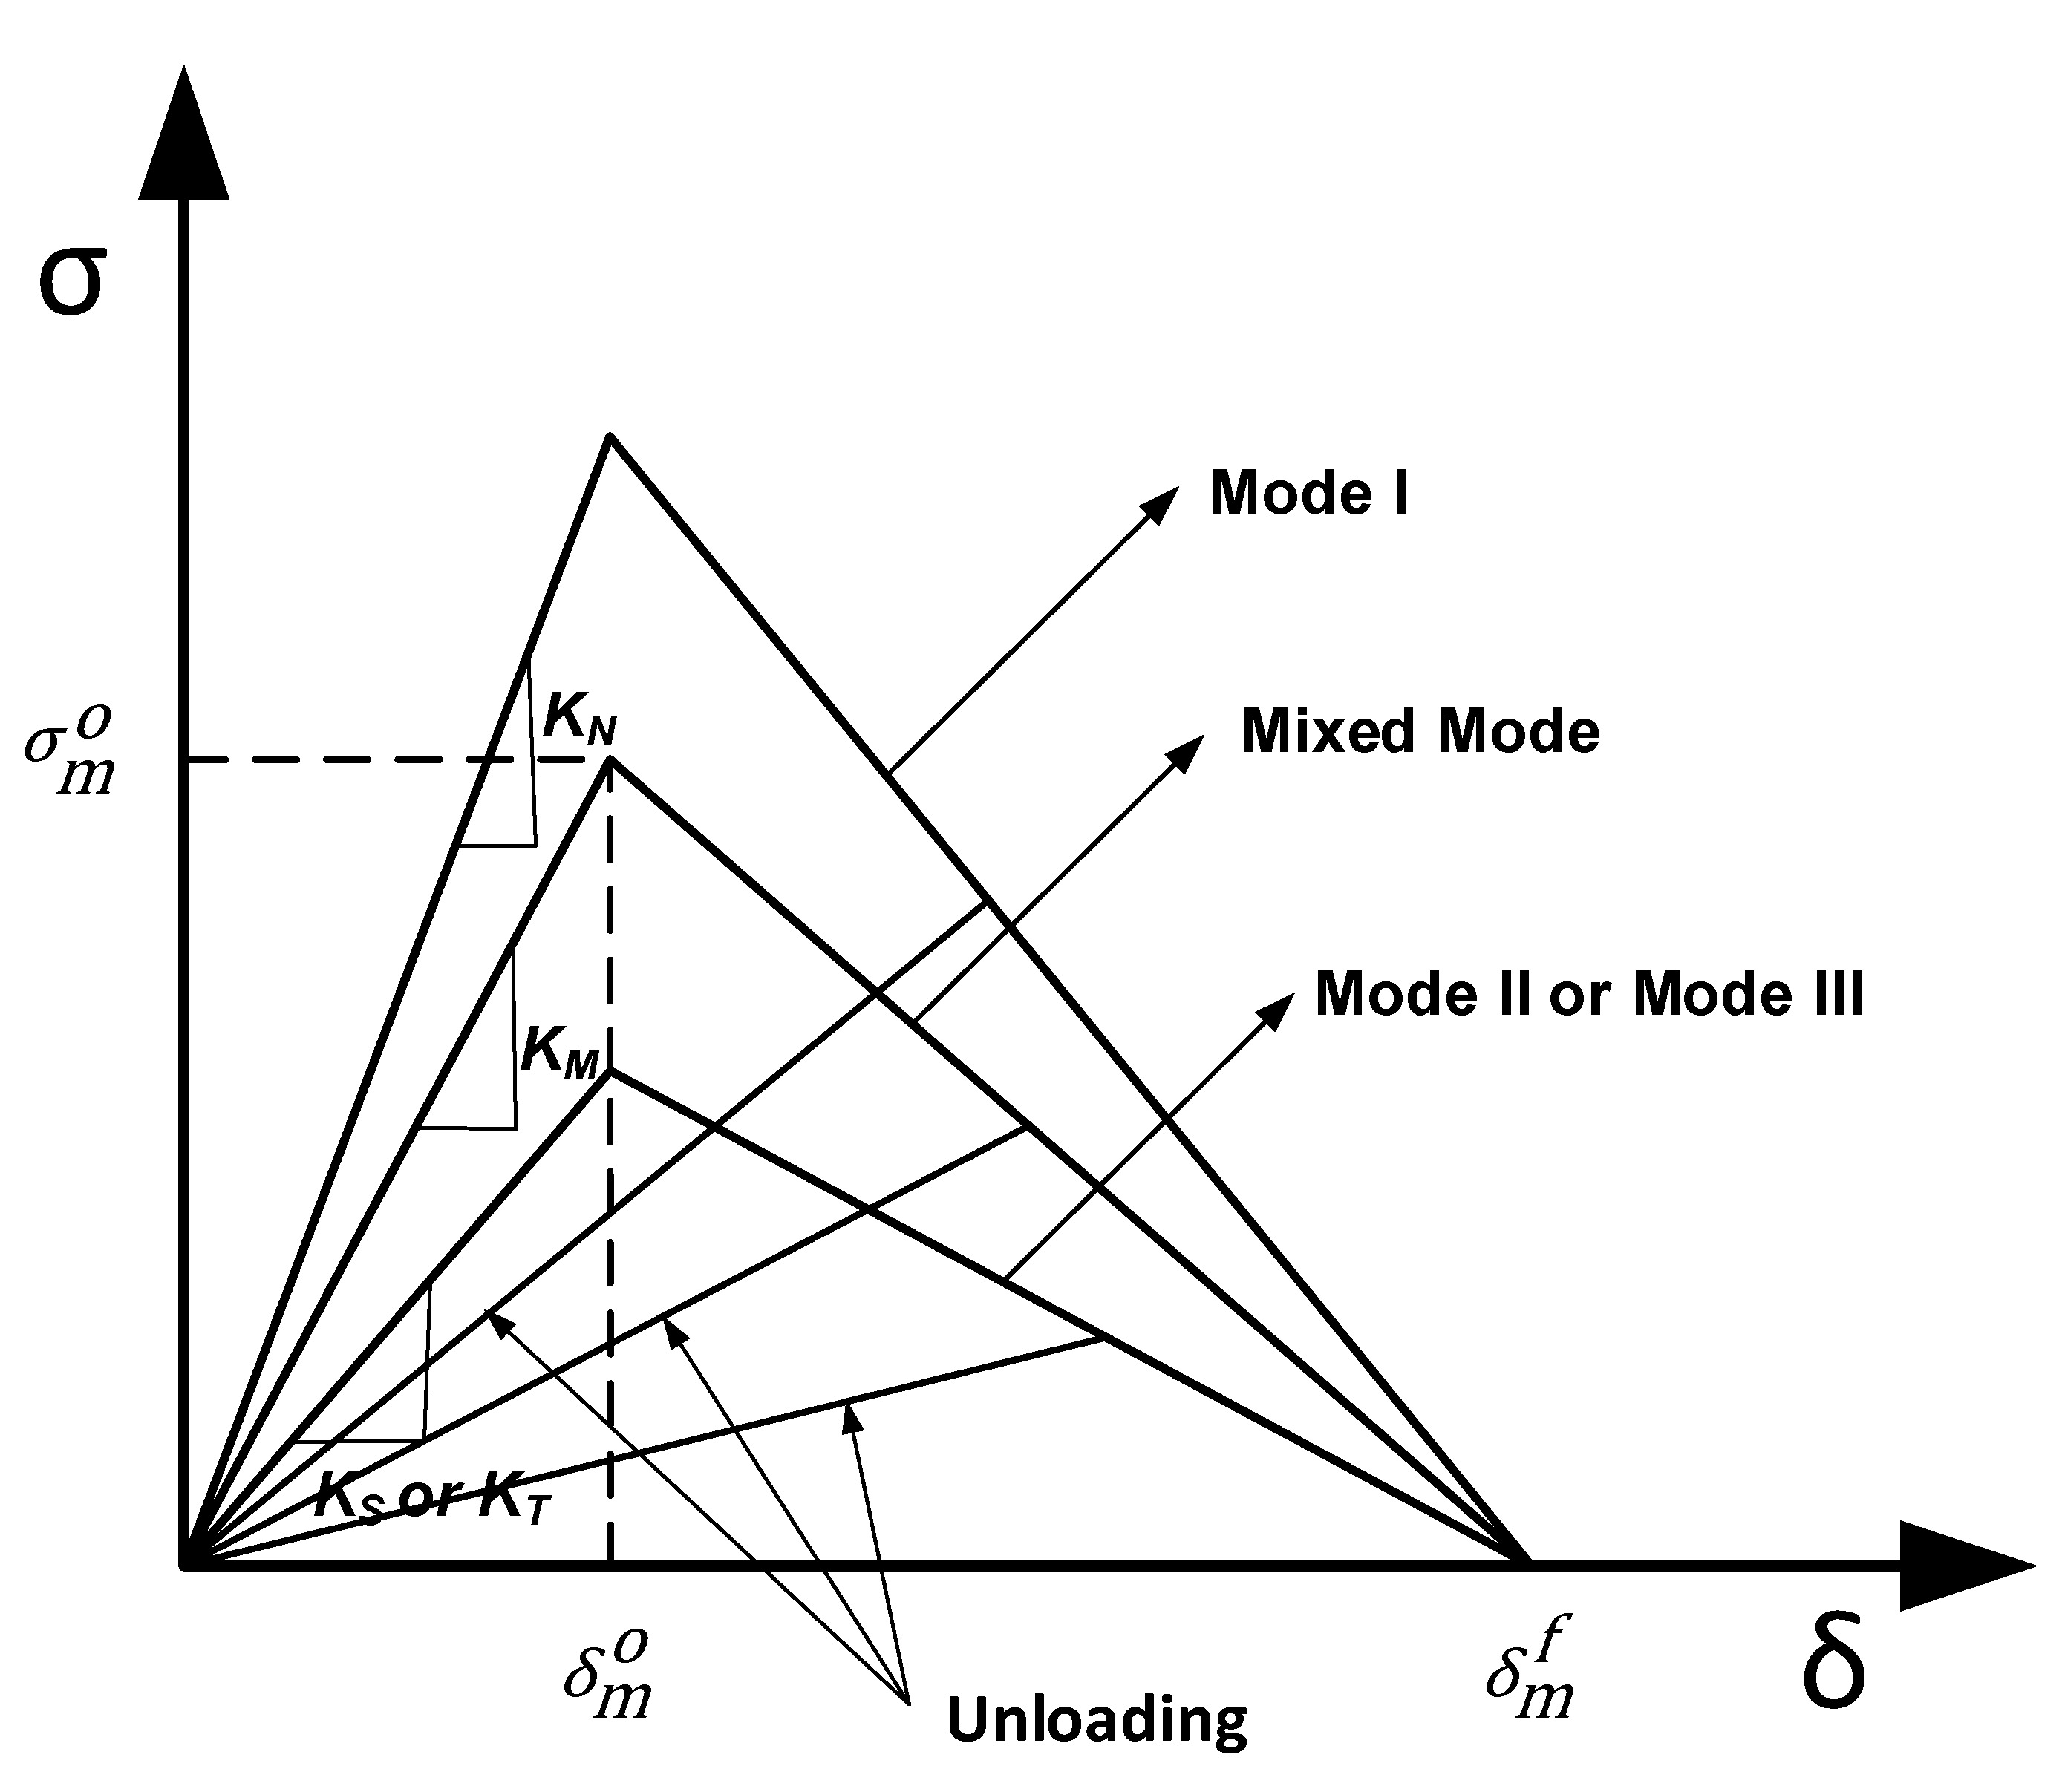
Now, stress-based quadratic traction–separation failure criterion and linear softening mixed-mode BK law are used to simulate cohesive interface failure initiation and propagation, respectively (Table 3 and Figure 3), to simulate impact damage during LVI testing.
Here, t n , t s , and t t are interface stresses in normal and two shear directions, respectively. T n f is the interface strength in the normal direction and T i f is the interface strength in two shear directions. δ n   or   δ 3 , δ s ,   δ t are pure-mode displacement values in normal and two shear directions, respectively. For mixed mode, δ m , δ m 0 , δ m f are effective displacement values, effective displacement for propagation onset, and effective displacement for total failure, respectively. d and α are variables for damage evolution in terms of delamination and maximum displacement reached in history (a state variable), respectively. K M is the mixed-mode elastic stiffness value.
Material properties of cohesive interface are given in Table 4.
The elasticities and strengths of the specimen given in Table 4 were provided by Xie Chuang Composite Material Co., Limited, Dongguan, China.

3. Experiment and FEM Simulation

3.1. Experimental Methodology

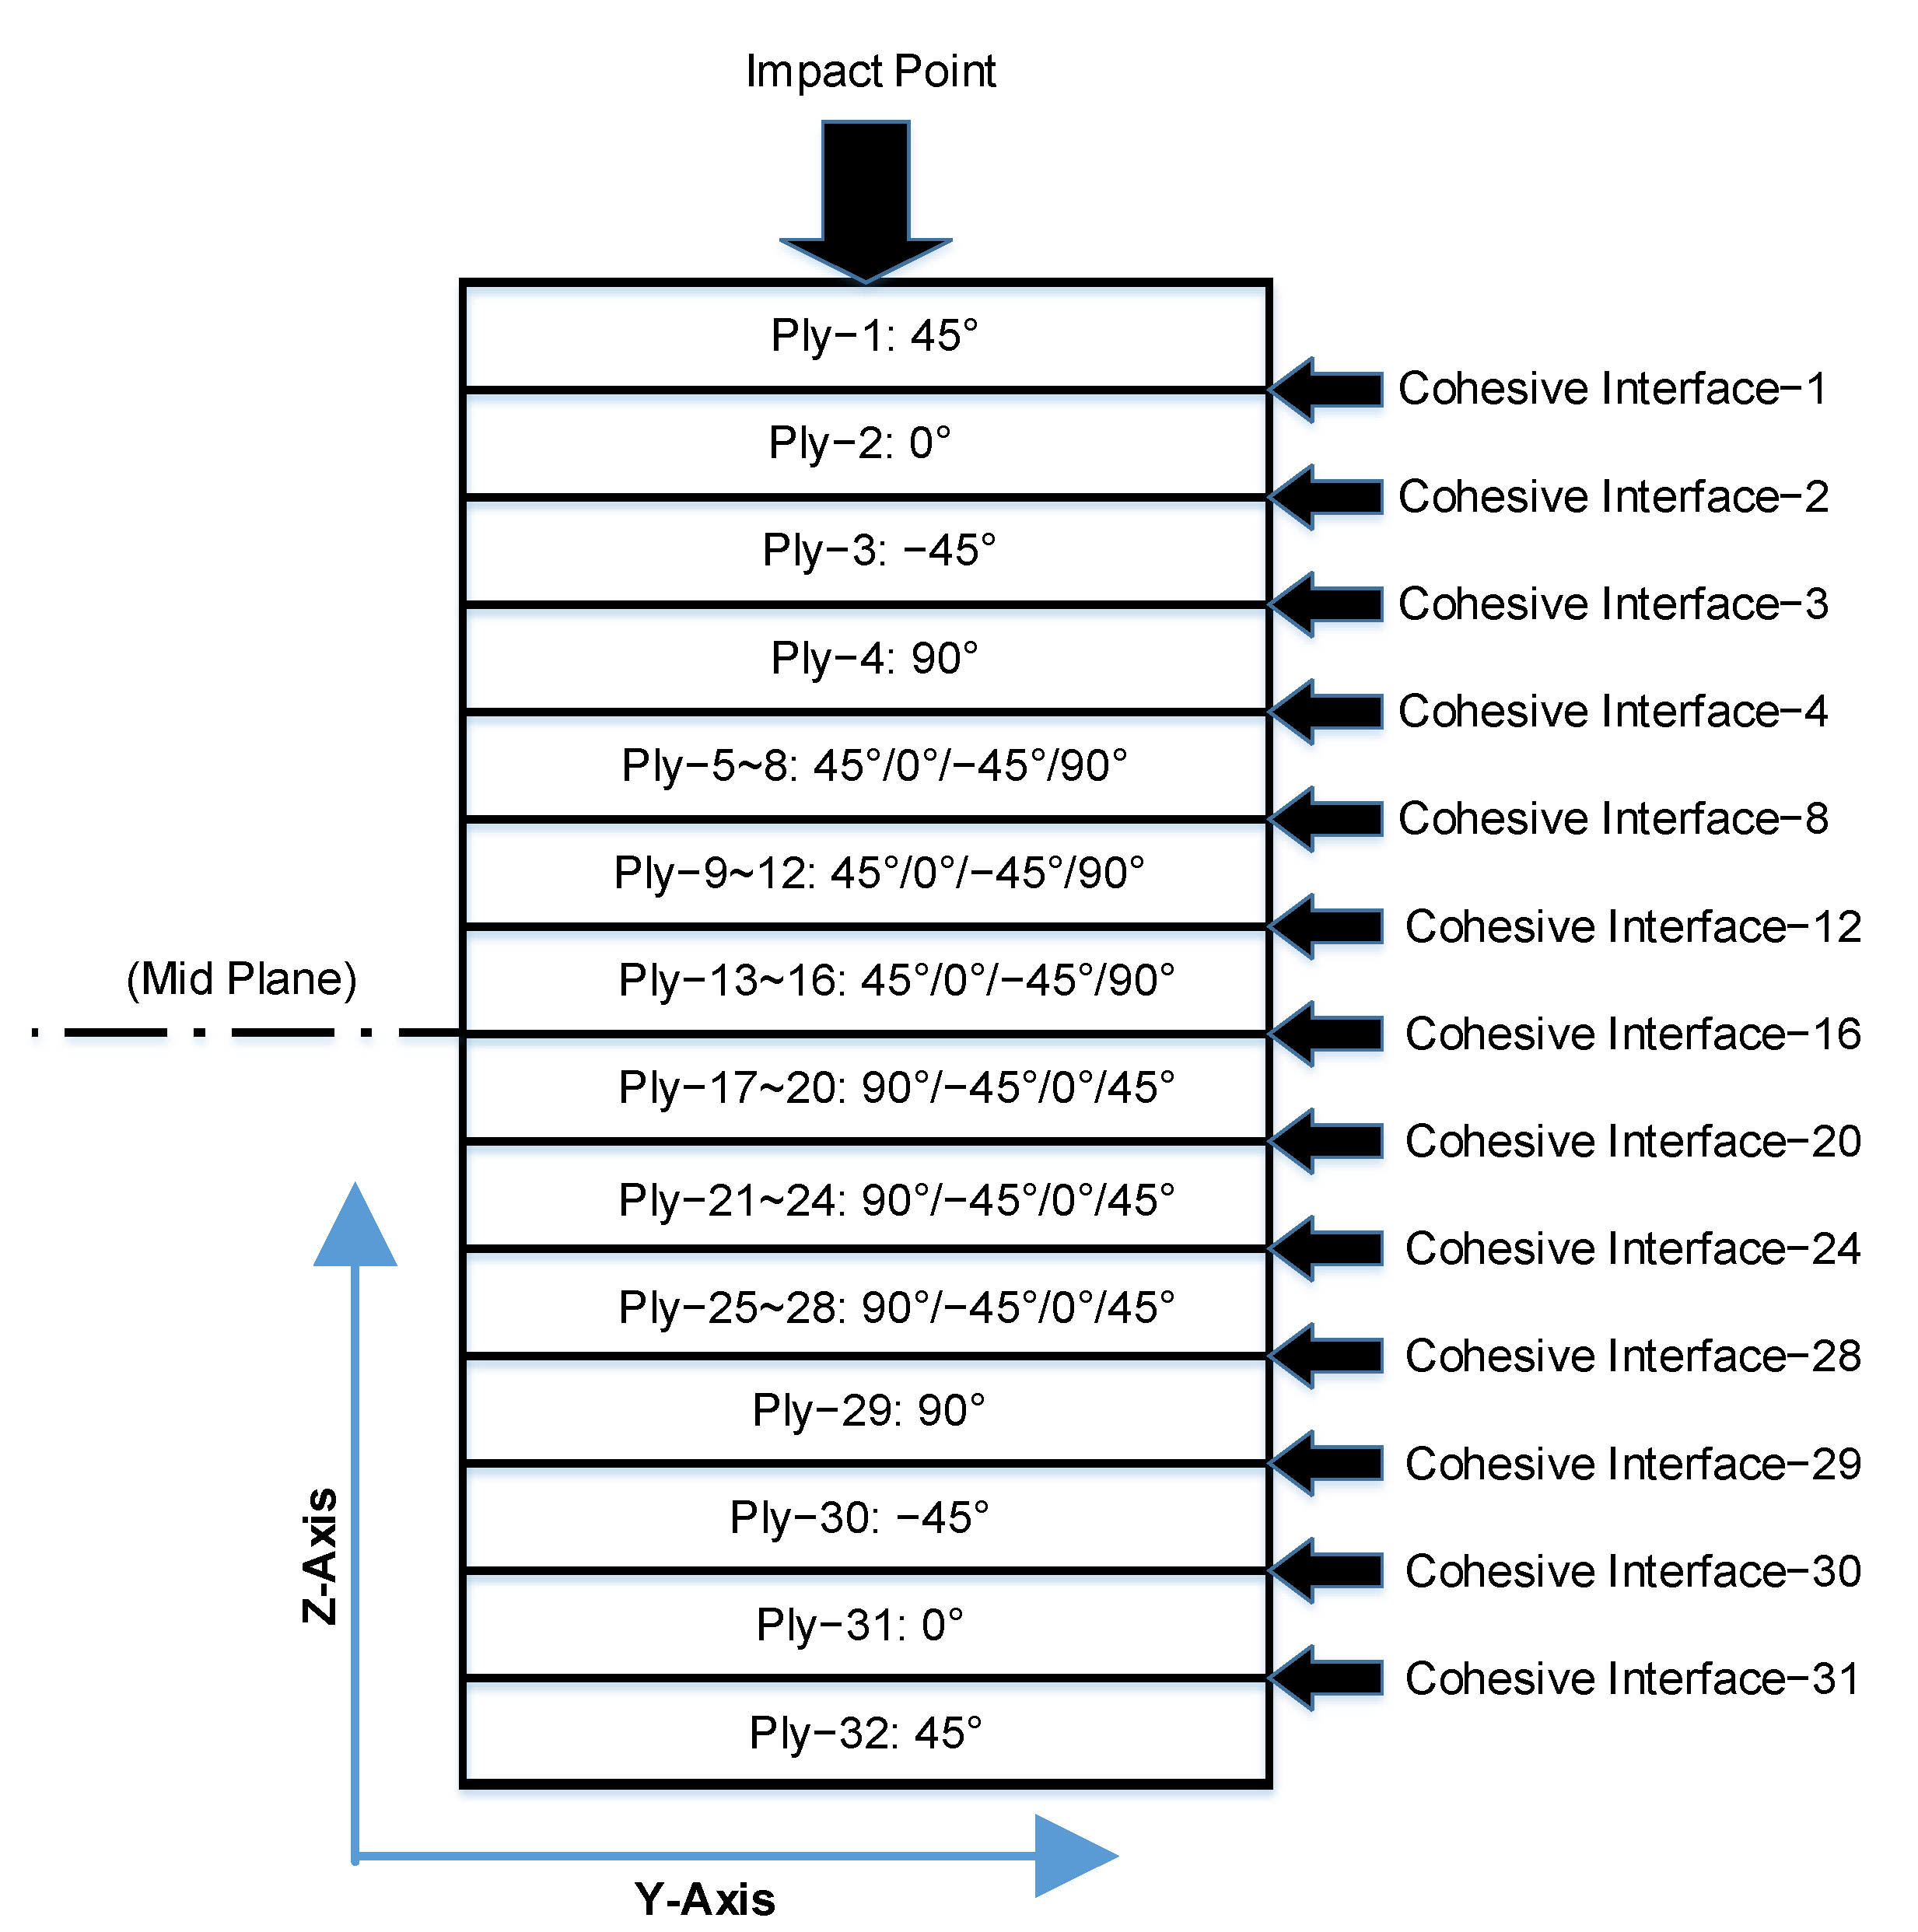
Low-velocity impact (LVI) testing was conducted on specimens of T700/QY9510 composite laminate with dimensions of 150 mm × 100 mm × 4.97 mm (thickness of single ply is approximately 0.155 mm) and a ply-pattern of 45 / 0 / 45 / 90 4 S , as shown in Figure 4. LVI testing was carried out using an impact machine following the ASTM D7136M-15 standard [33].
The impactor is made of steel and is hemispherical with a mass of 5 kg and a diameter of 16 mm.
A total of fifteen such specimens were used. Five specimens each were used in 30 J, 40 J, and 50 J impact energy cases. Then, averaged values were used to calculate initial indentation depths and their recovery/rebound within a stipulated period. Depth was measured with a depth screw gauge/micrometer. The experiments were performed at a temperature of 25 °C.
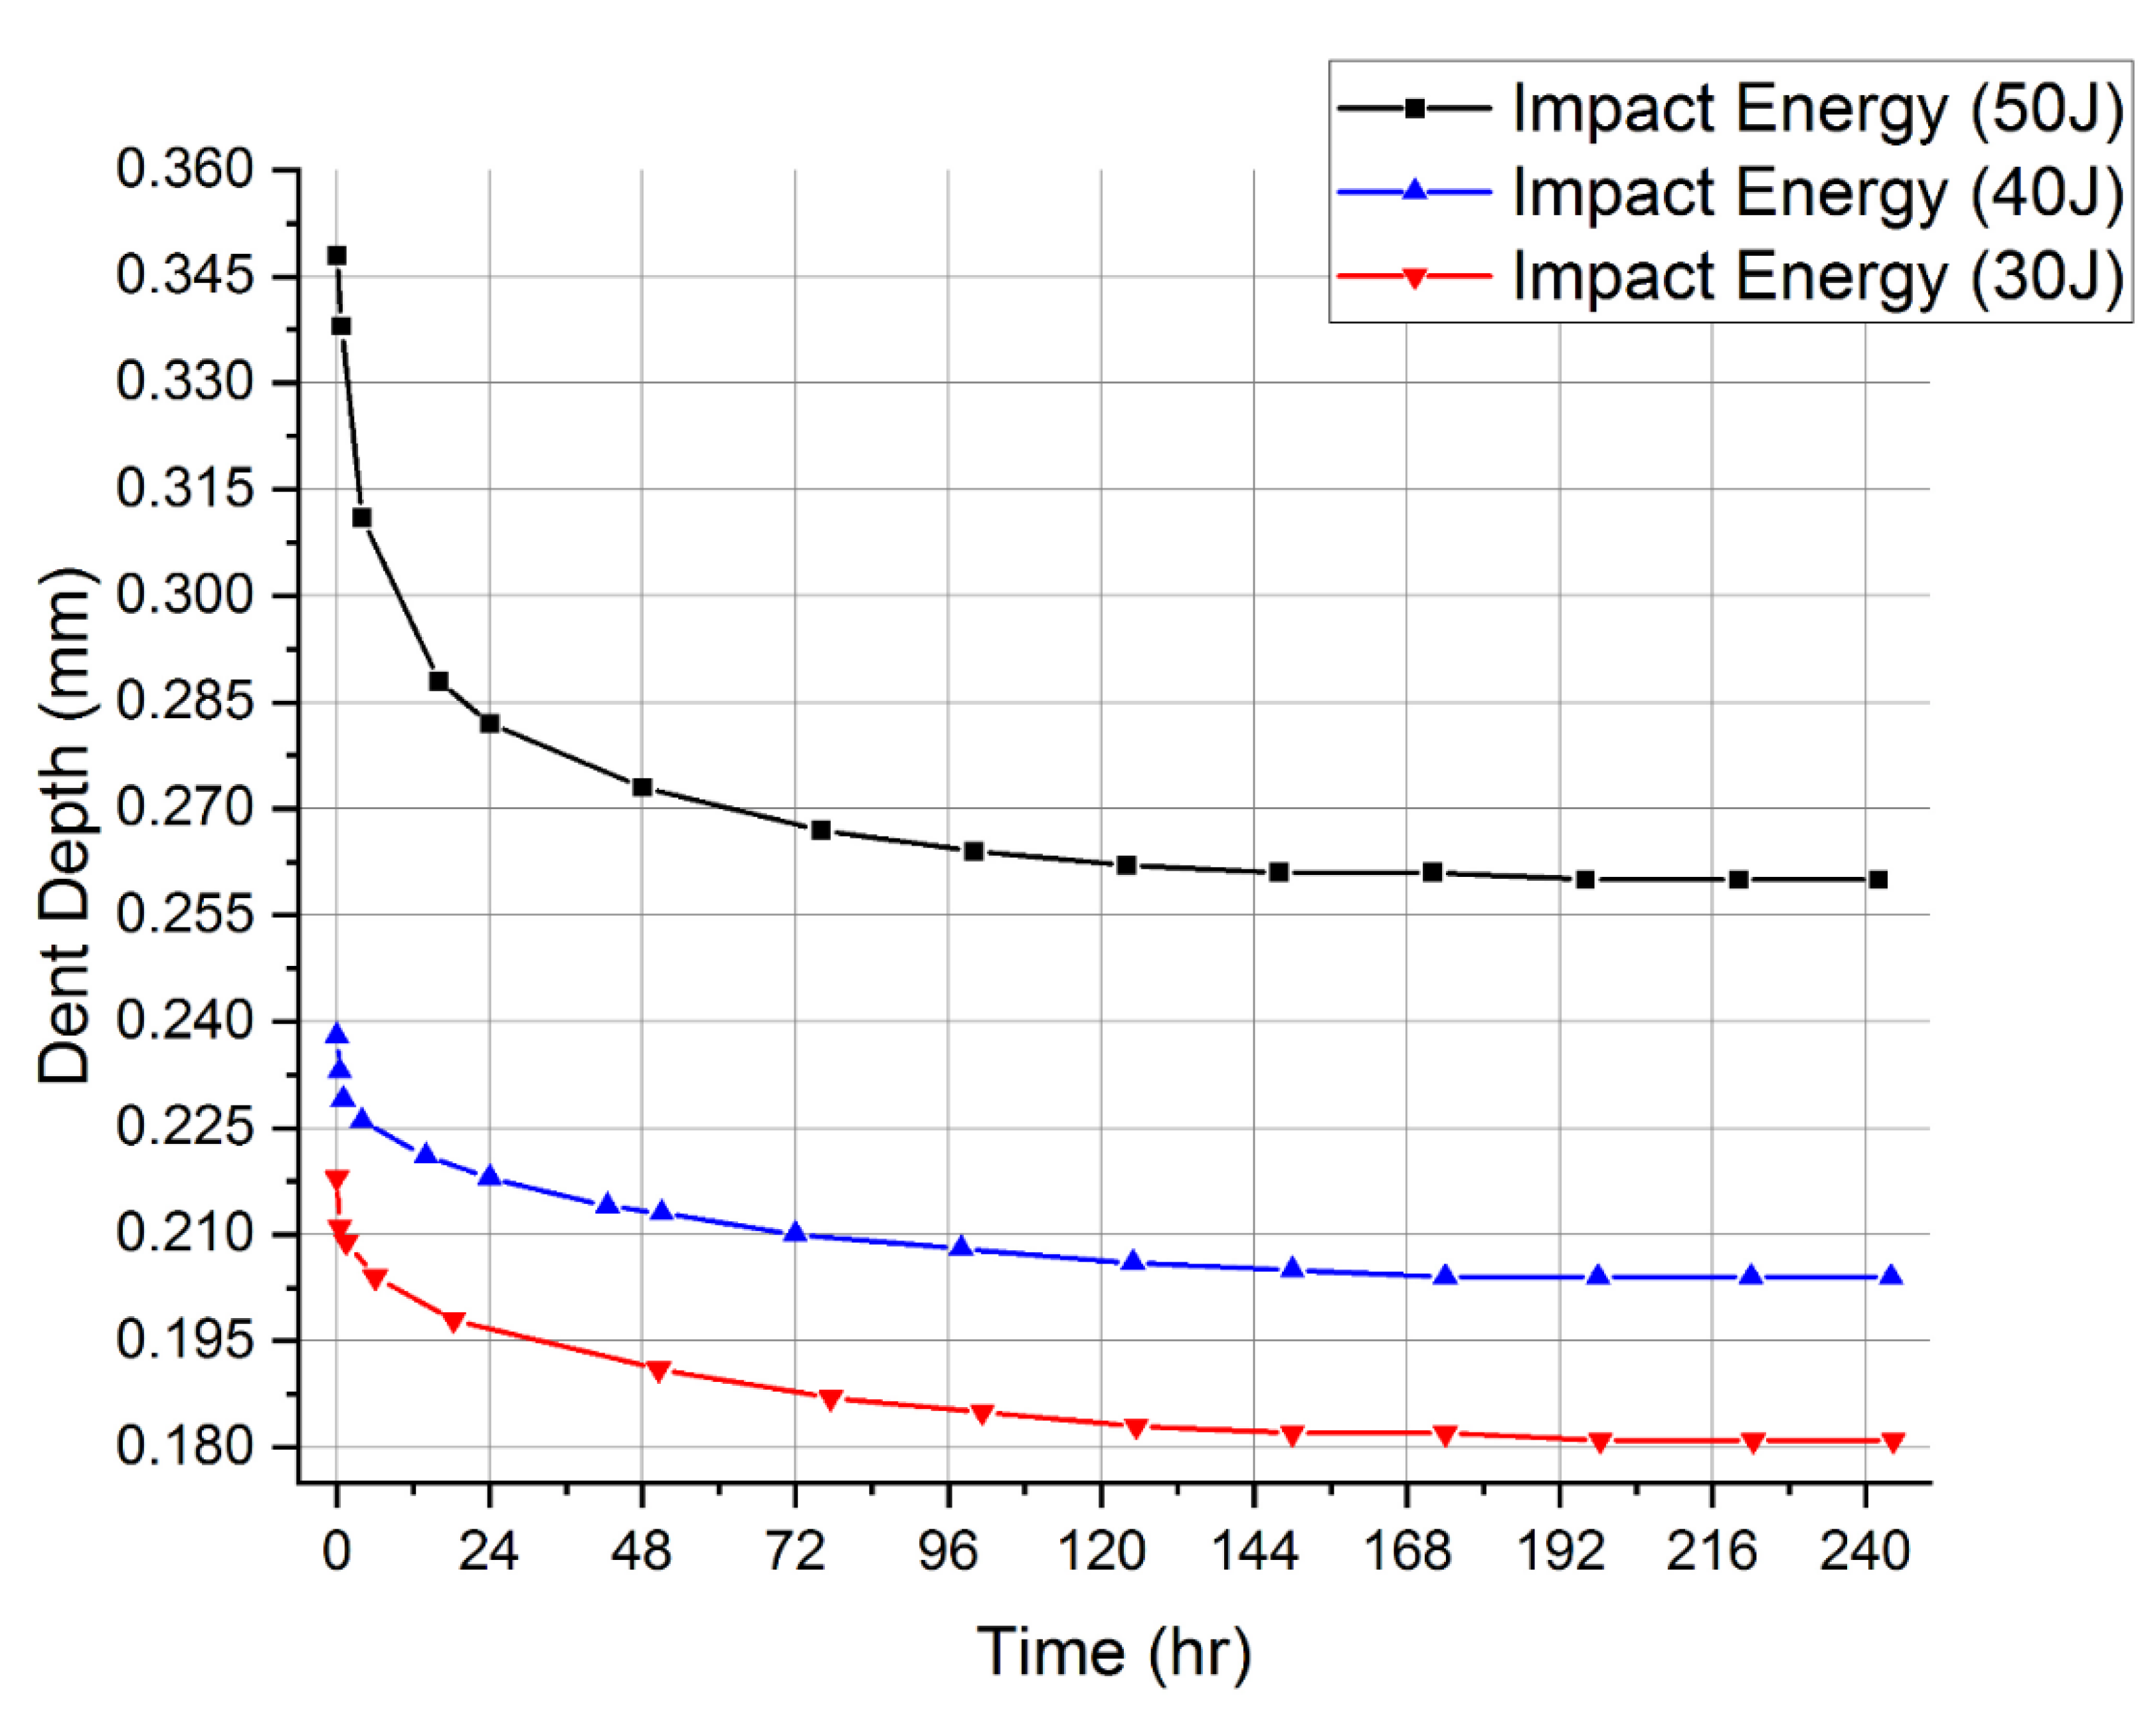
Table 5 shows dent depth rebound data with time calculated against each impact energy case.
Figure 5 shows a graphical representation of dent depth rebound data with time.
Figure 6 shows a 40 J impacted specimen from the impacted side and the back side. The back side surface of the specimen remains undamaged.
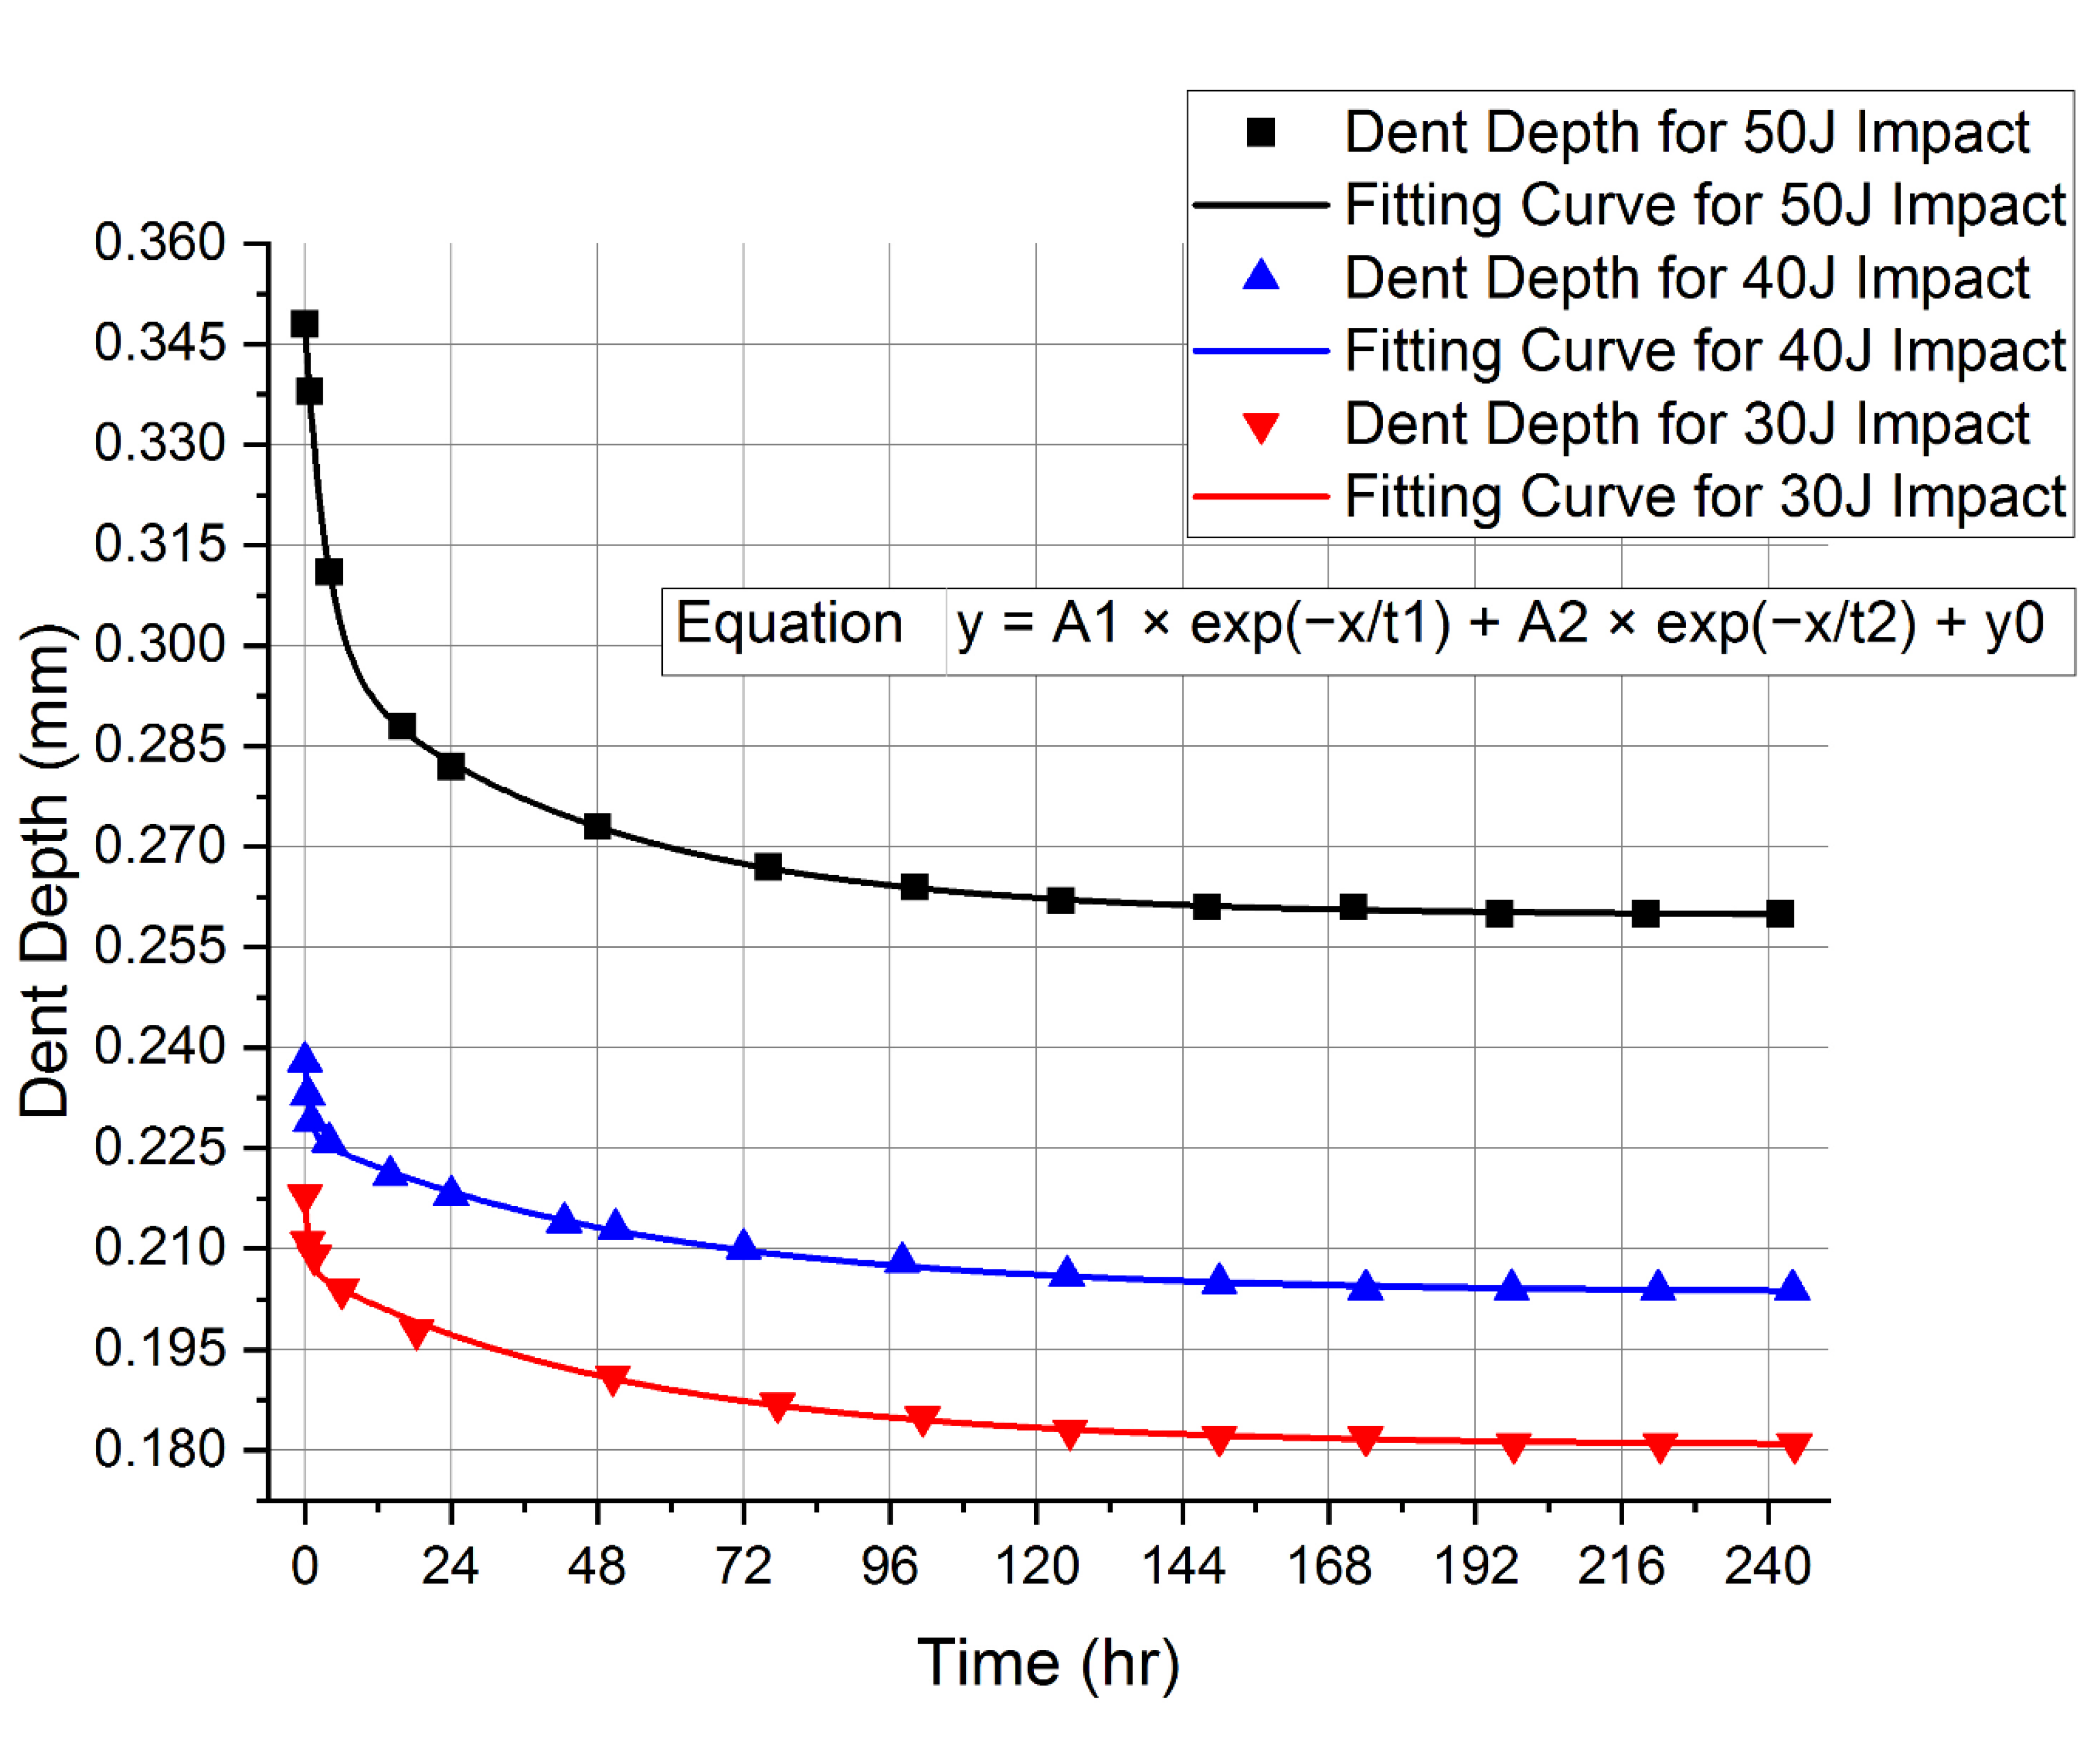
By taking the data points of dent depths for the 50 J, 40 J, and 30 J impact cases, the following two-exponential-decay type equation (Equation (29)) is used with a curve fitting technique, which will help with dent depth calculation (in mm) for a given time (in h) (Figure 7).
y = A 1 × e x p x t 1 + A 2 × e x p x t 2 + y 0
The values for variables used in Equation (29) for each impact energy case are given in Table 6.
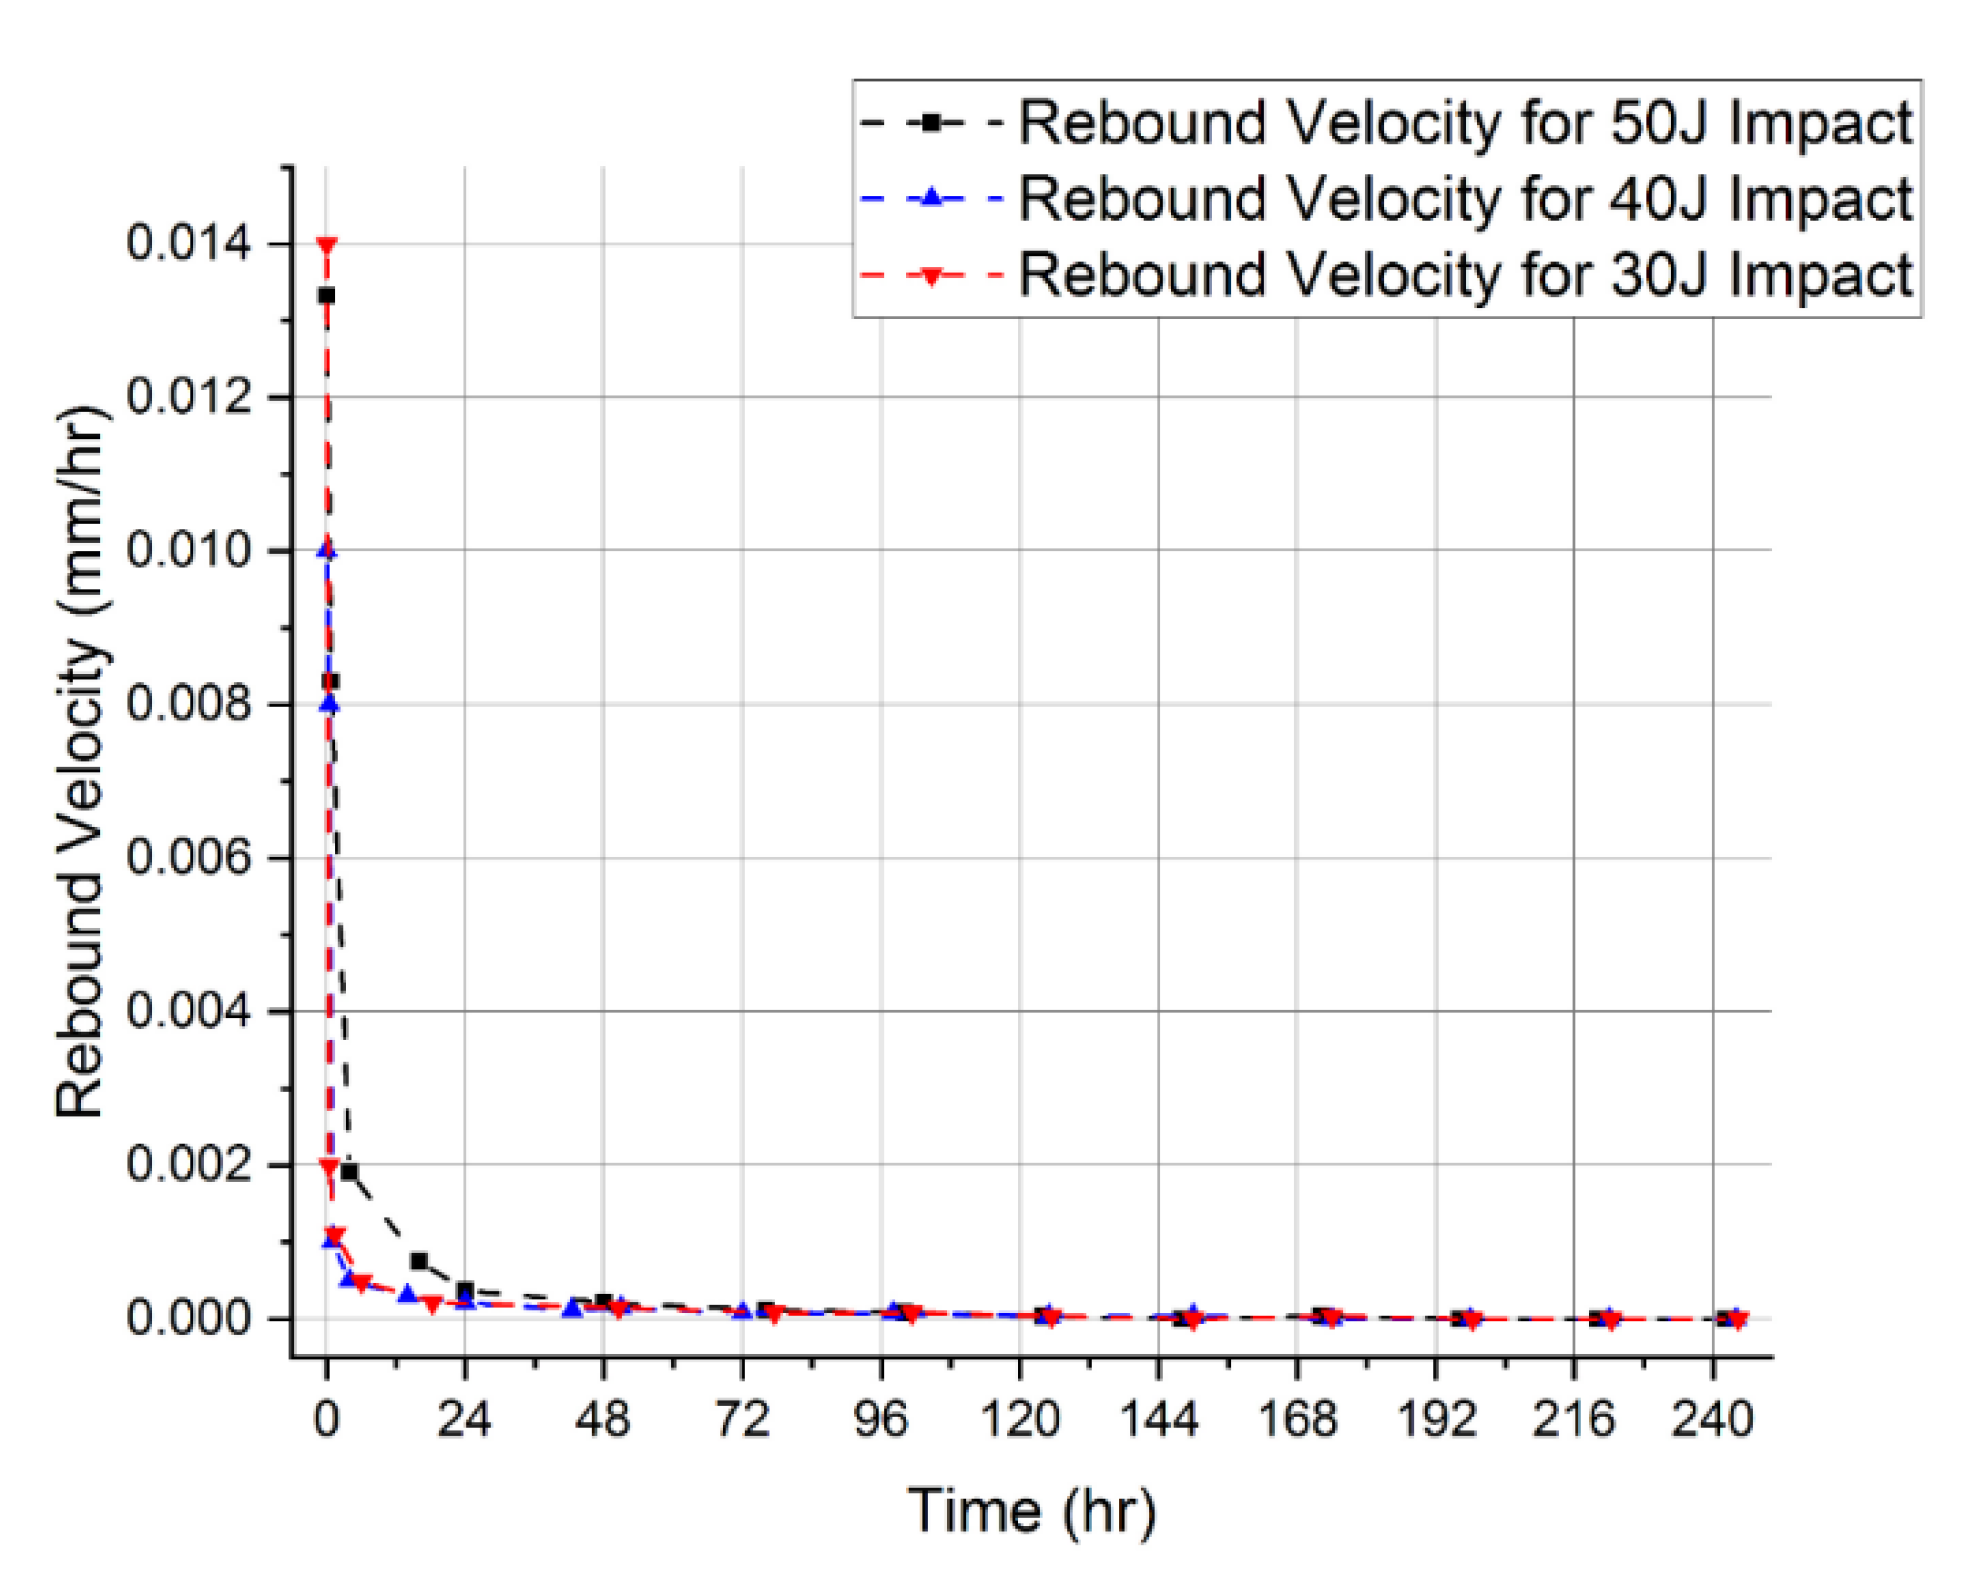
Graphical representations of rebound velocities for each impact case are shown in Figure 8.
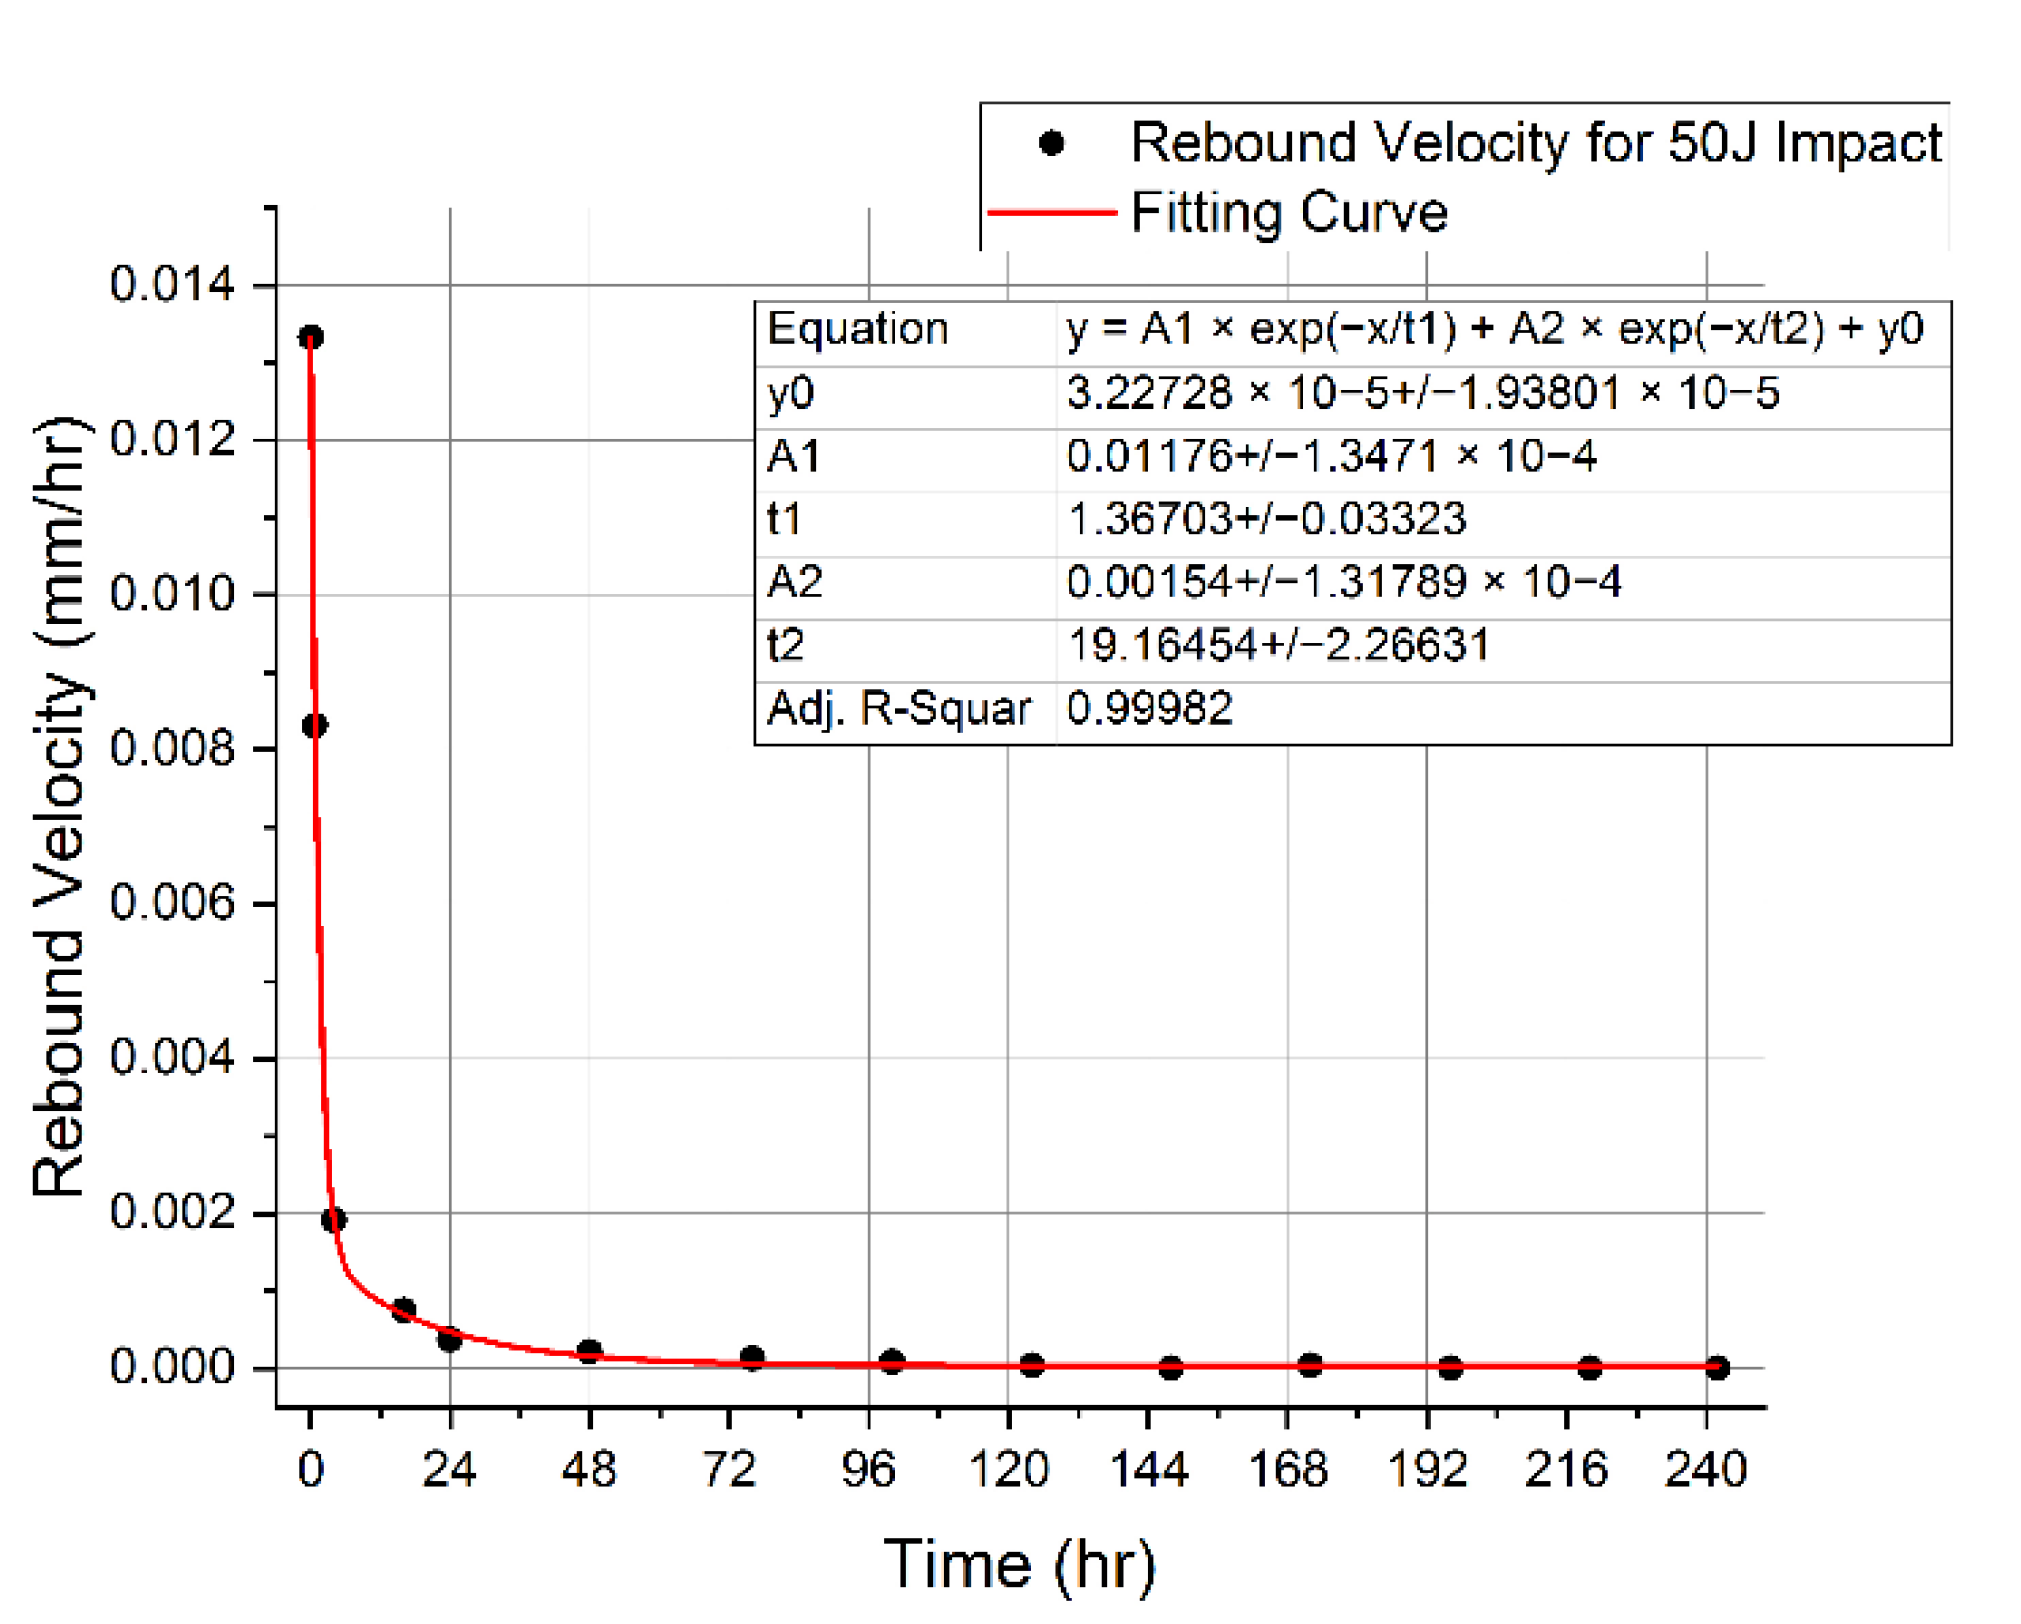
By taking the data points of rebound velocity for the 50 J impact case only, the following two-exponential-decay type equation (Equation (30)) is acquired via a curve fitting technique, which will help in rebound velocity calculation (in mm/h) (Figure 9). Similarly, such equations can also be derived for the 40 J and 30 J impact cases.
v e l o c i t y 50 J   I m p a c t = 0.01176 × e x p x 1.36703 + 0.0015 × e x p x 19.16454 + 3.22728 × 10 5

3.2. Simulation Methodology

To simulate the indentation depth rebound phenomenon in the composite plate, the following methodology was adopted.
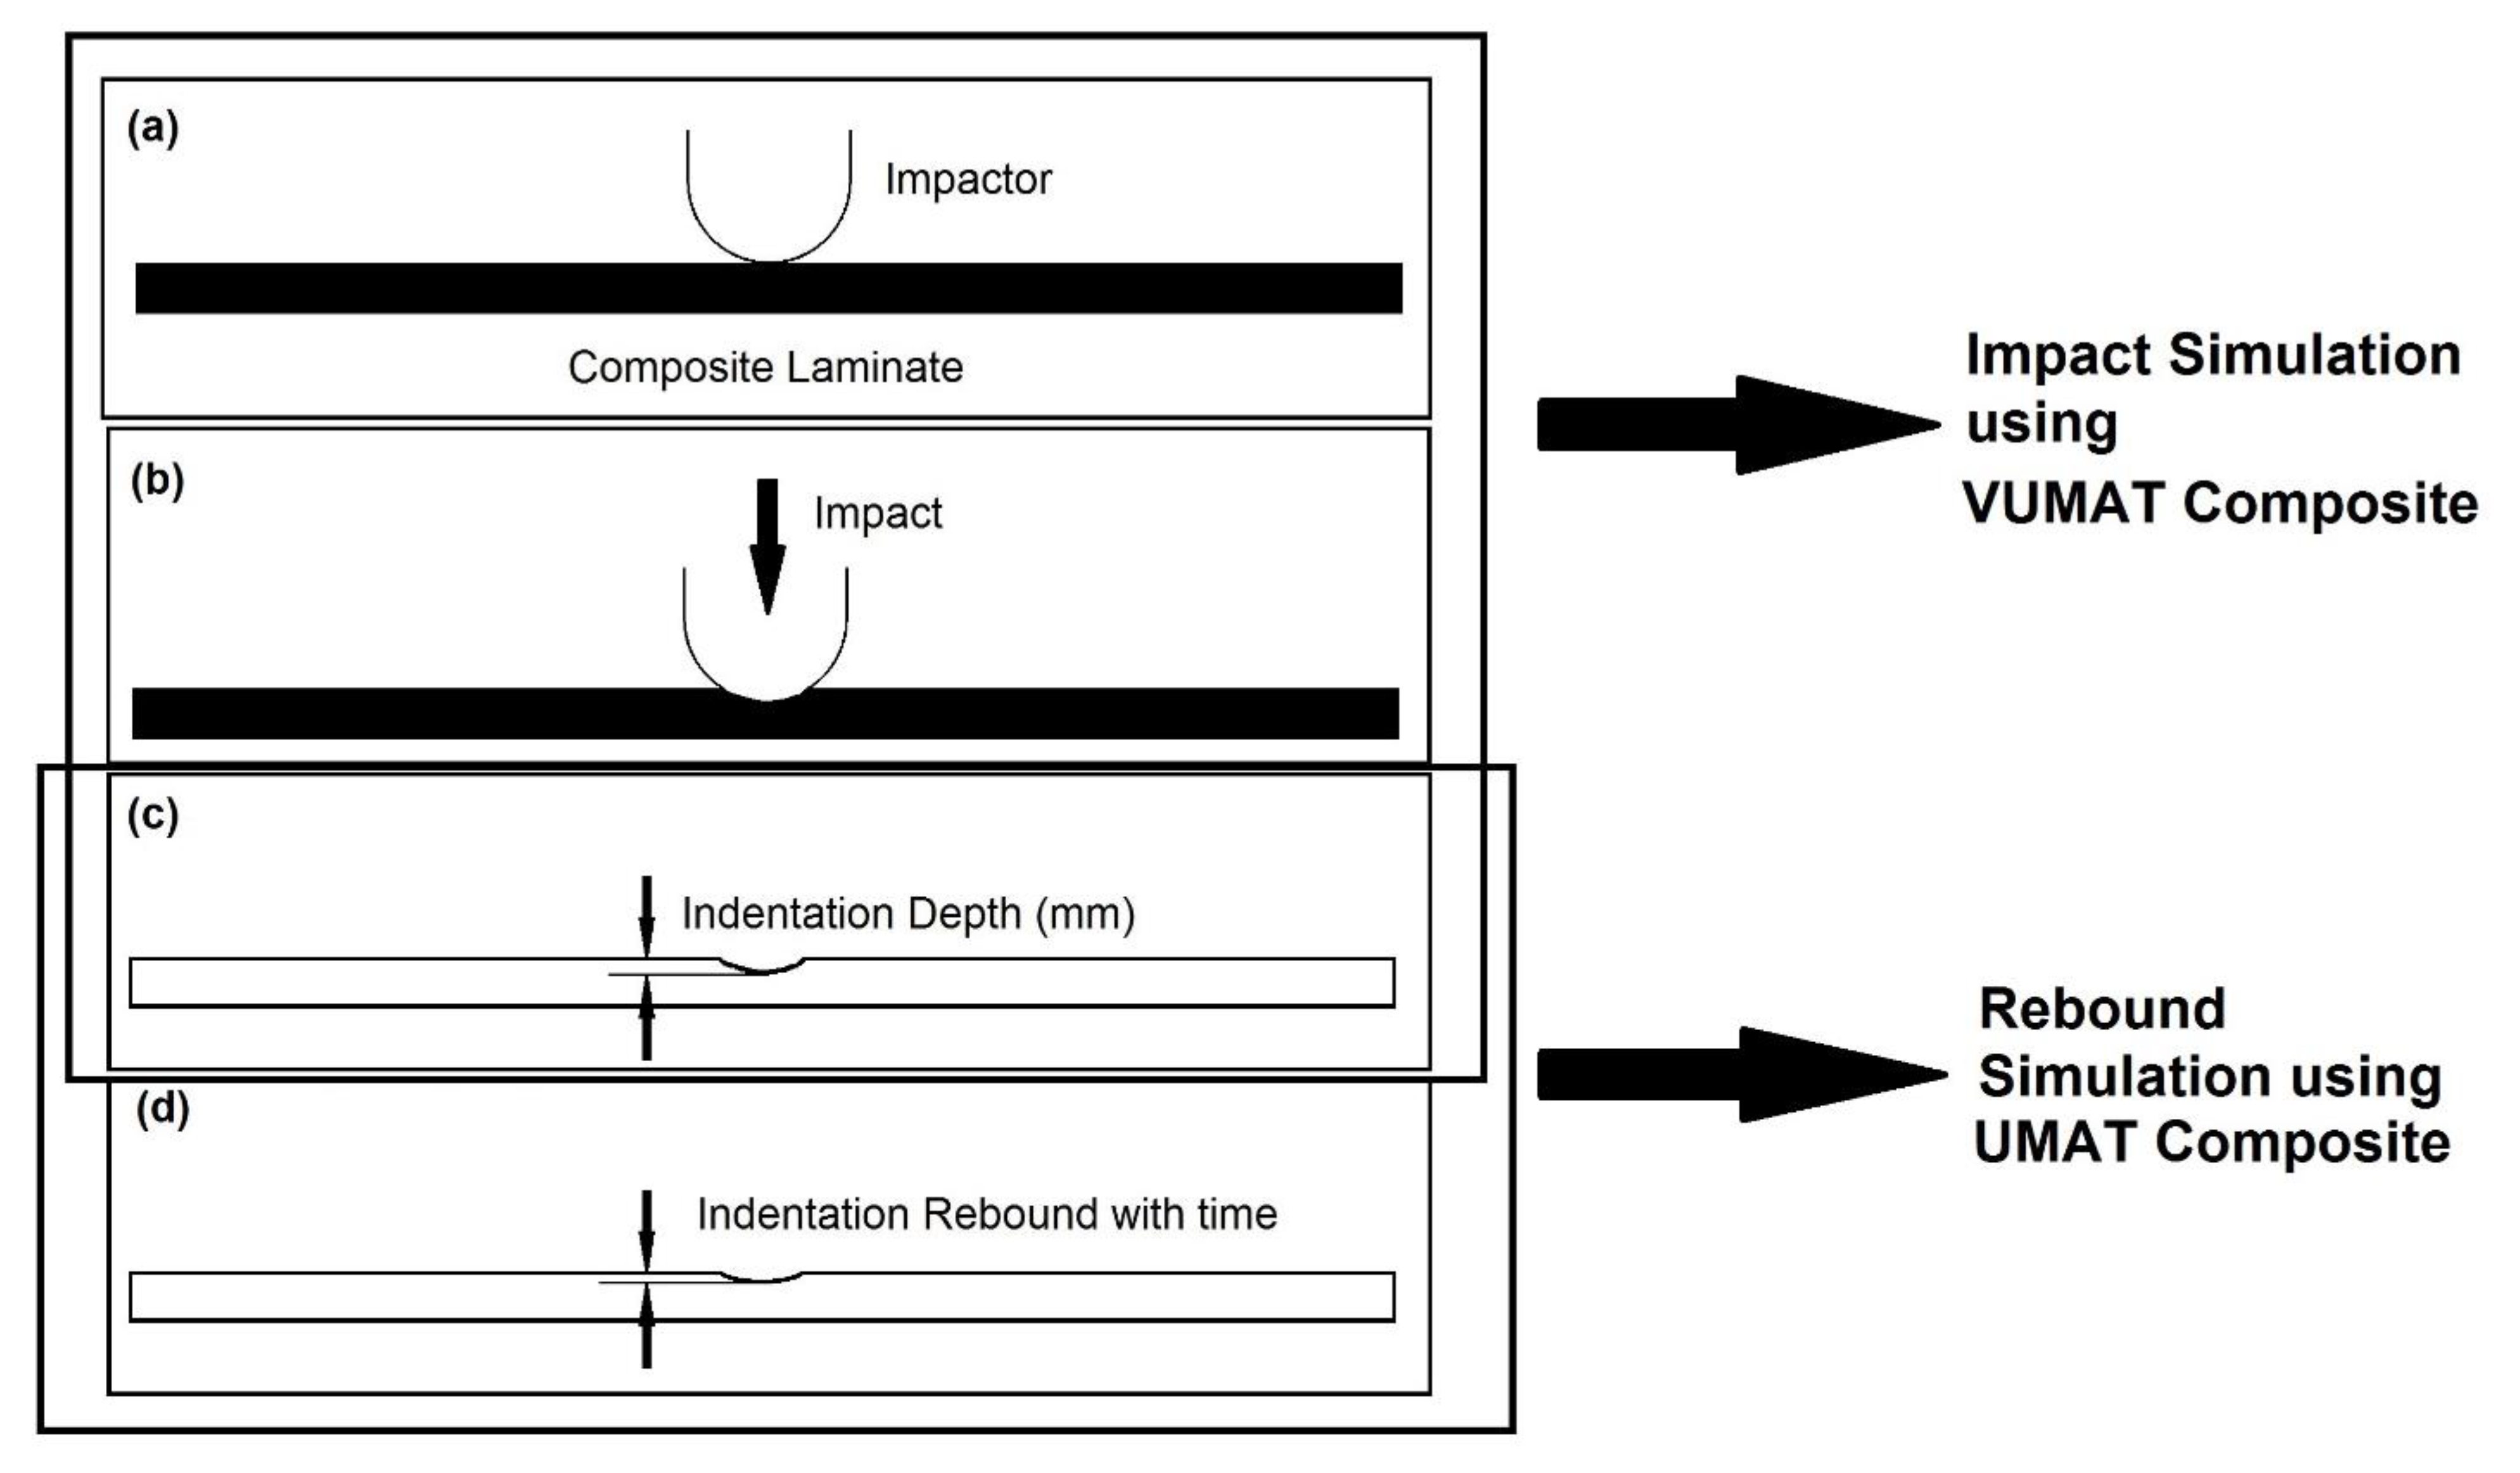
The simulation was divided into two parts, as shown in Figure 10.
Firstly, impacts at different energy levels (30 J, 40 J, and 50 J) were simulated in ABAQUS Explicit as dynamic modeling cases. User subroutines (VUMAT for laminae and VUMAT for cohesive interface) were used to simulate the damage (in terms of indentation depth).
Secondly, the same damages for all three cases were simulated in ABAQUS Standard as static modeling cases. Viscoelastic user subroutines (UMAT for laminae and UMAT for cohesive interface) were used to simulate the same damage and its rebound with time (in terms of indentation depth rebound).

3.2.1. Simulation for Impact Case

Indentation depth was simulated against each energy level impact.
To simulate impact damage in ABAQUS Explicit, we used the following:
VUMAT   Composite = VUMAT   for   Unidirectional   Lamina for   intra - laminar   damage + VUMAT   for   Cohesive   Layer for   inter - laminar   damage
There is a much smaller deformation in the impactor relative to that in the composite laminate; hence, it is negligible. Therefore, the impactor was modelled as a rigid body during simulation.
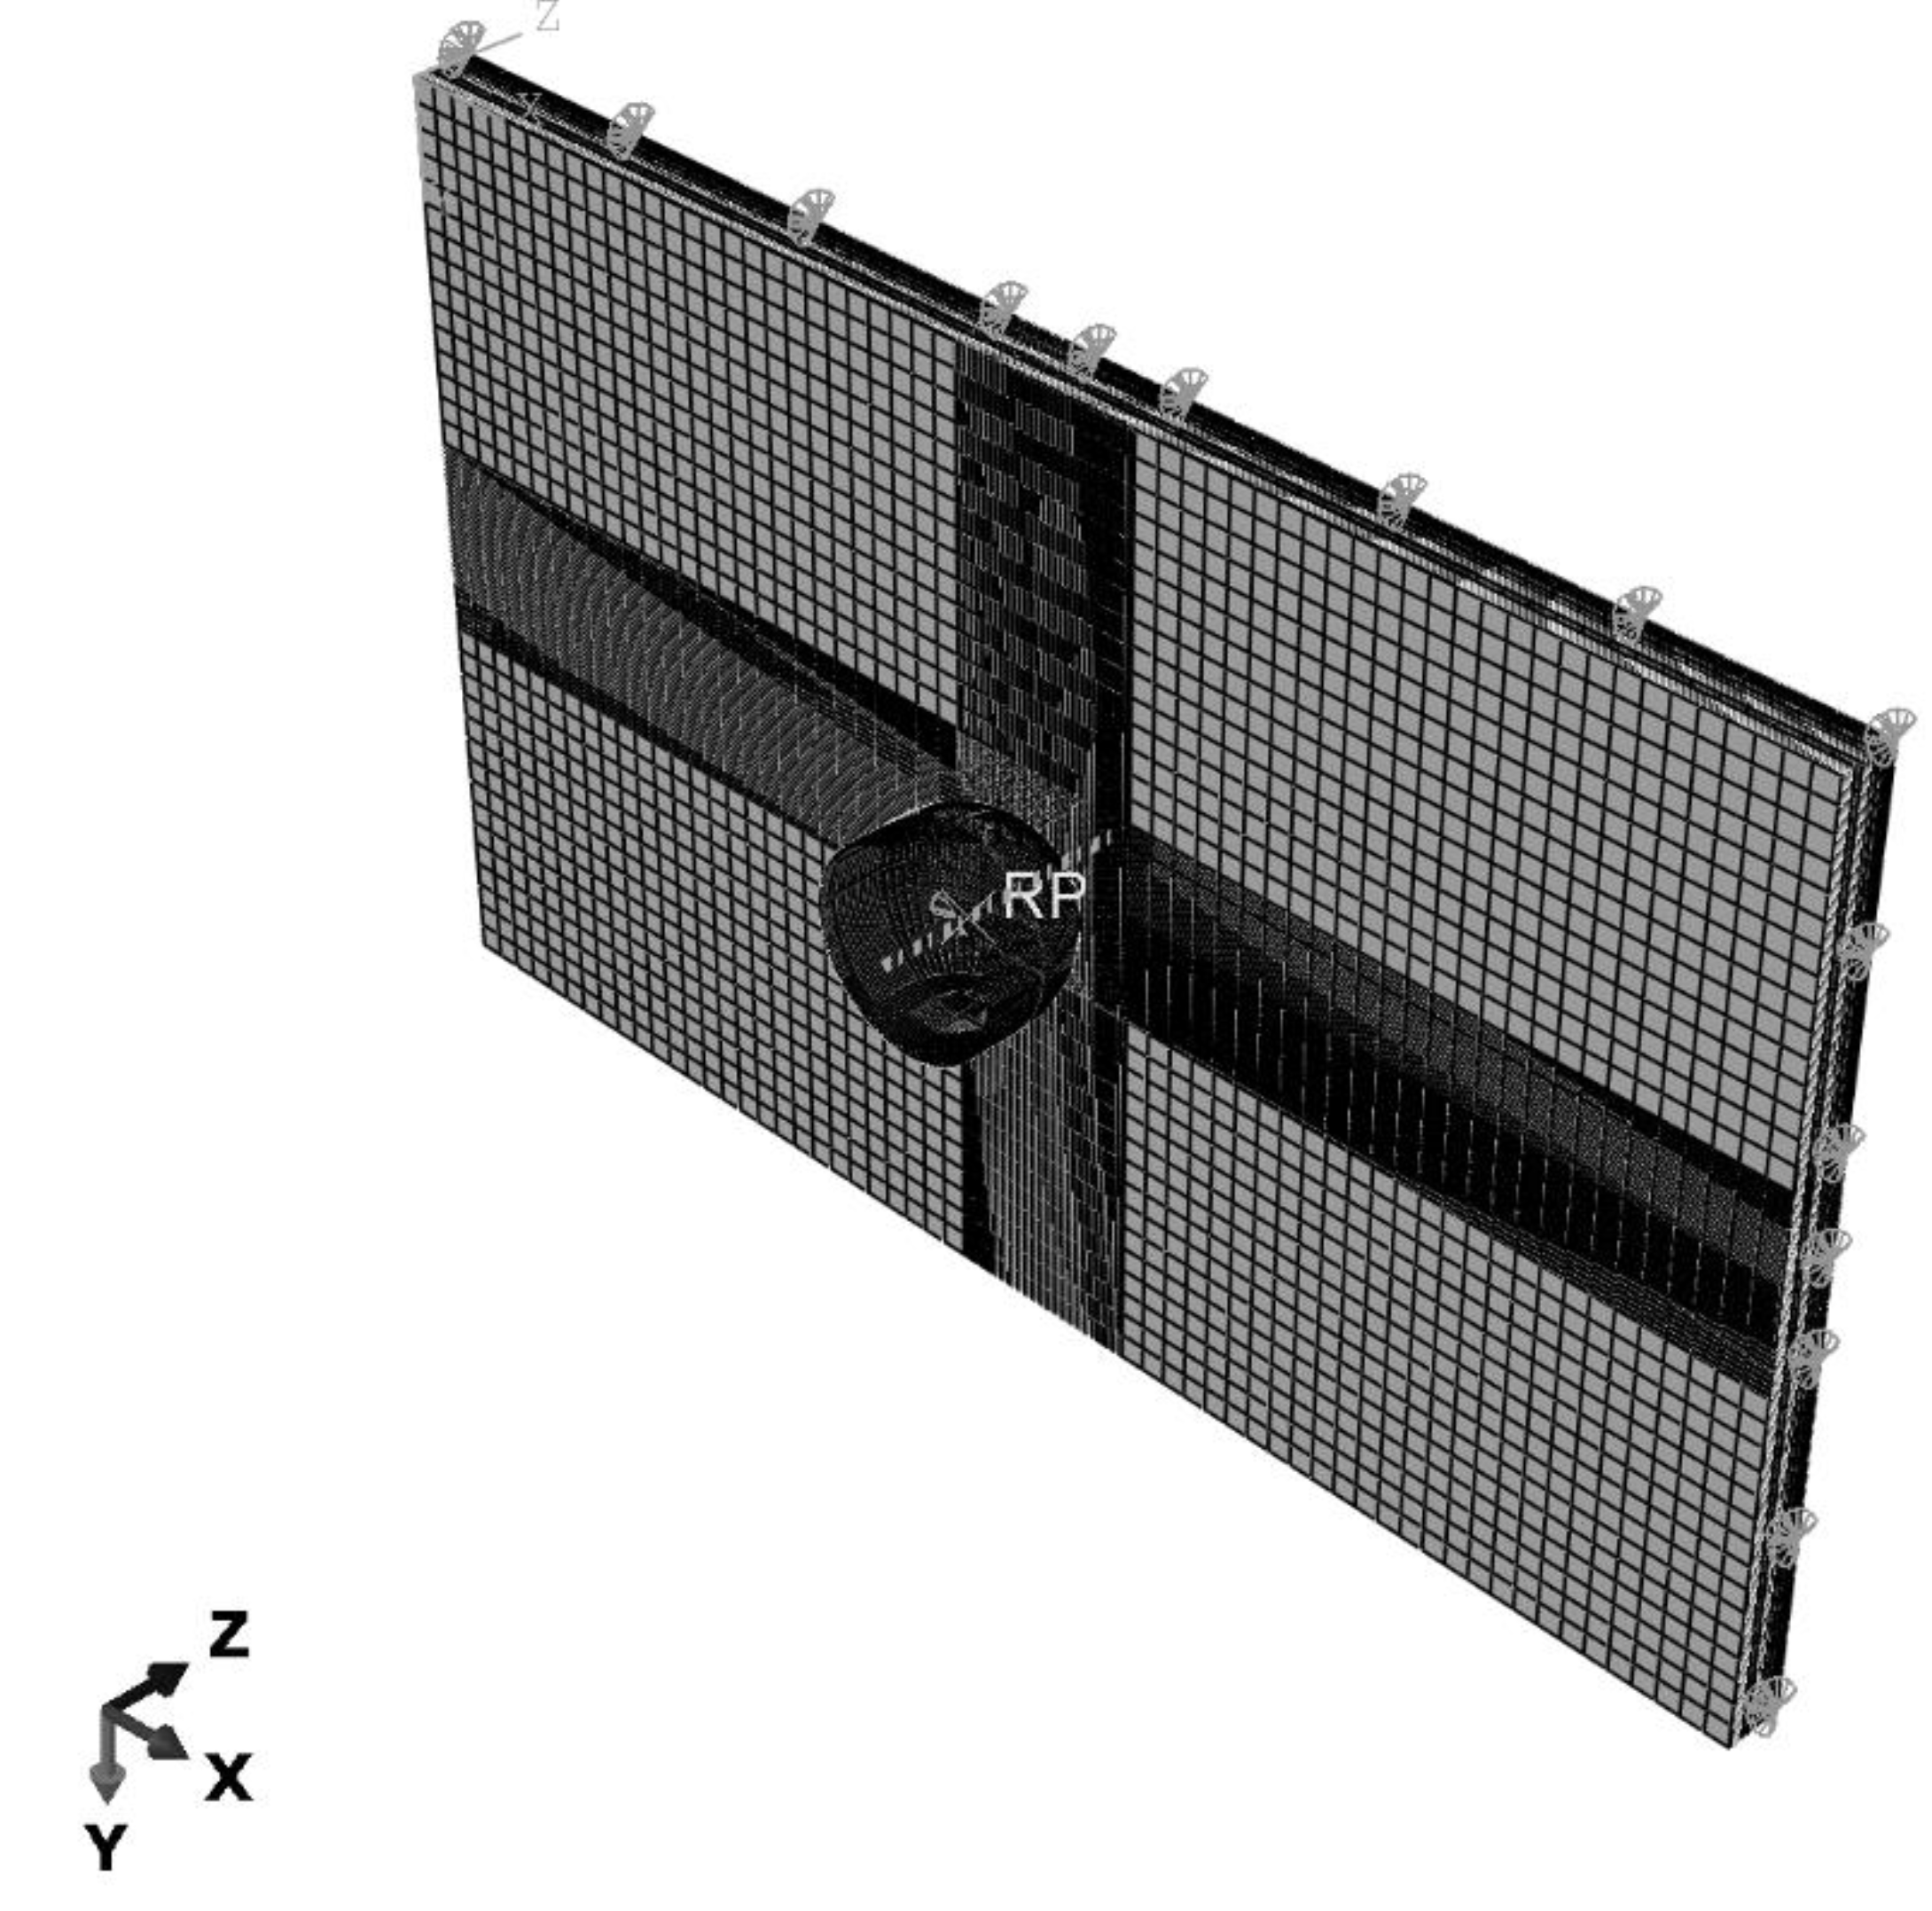
The FEM Model depicting boundary conditions and meshing is shown in Figure 11.
Impact energies of 30 J, 40 J, and 50 J were obtained by simulating the impact with the following impactor velocities (Table 7).
Each laminae ply was modeled as a continuum of solid elements (designated as C3D8 in ABAQUS), while the cohesive interface was modeled using element-based cohesive 3D elements (designated as COH3D8 in ABAQUS) with a very small thickness value of 2 × 10⁻⁶. This increases the overall thickness of the model from 4.96 mm (its original thickness) to 5.022 mm. However, this has negligible effects on simulation results as damage from all different impact energies only involves a maximum of two cohesive interfaces. For LVI testing, a specimen with dimensions 150 mm × 100 mm was placed at the fixture base over a hollow slot of dimensions 125 mm × 75 mm and secured by four toggle clamps in the impact testing machine [33]. The fixture base has guiding pins to restrict displacement in x and y directions. In order to simulate the LVI testing, a specimen with dimensions 125 mm × 75 mm was modelled only in FEM with pinned boundary conditions (U1 = U2 = U3 = 0) at the edges. By using pinned boundary conditions at the edges, 12.5 mm from each side along the length and width can be simply omitted from FEM, thereby simulating the specimen which lies exactly over the hollow slot. The interaction between the plate and the impactor was simulated by the general contact (explicit) regime. The smallest element size in the impact zone is 0.20 mm × 0.20 mm. A penalty friction model was included in the contact property definition, and a friction coefficient of 0.3 was used. Semi-automatic mass scaling of 1 × 10⁻⁶ target time increment was used to reduce computational time, and an element deletion option was imposed.
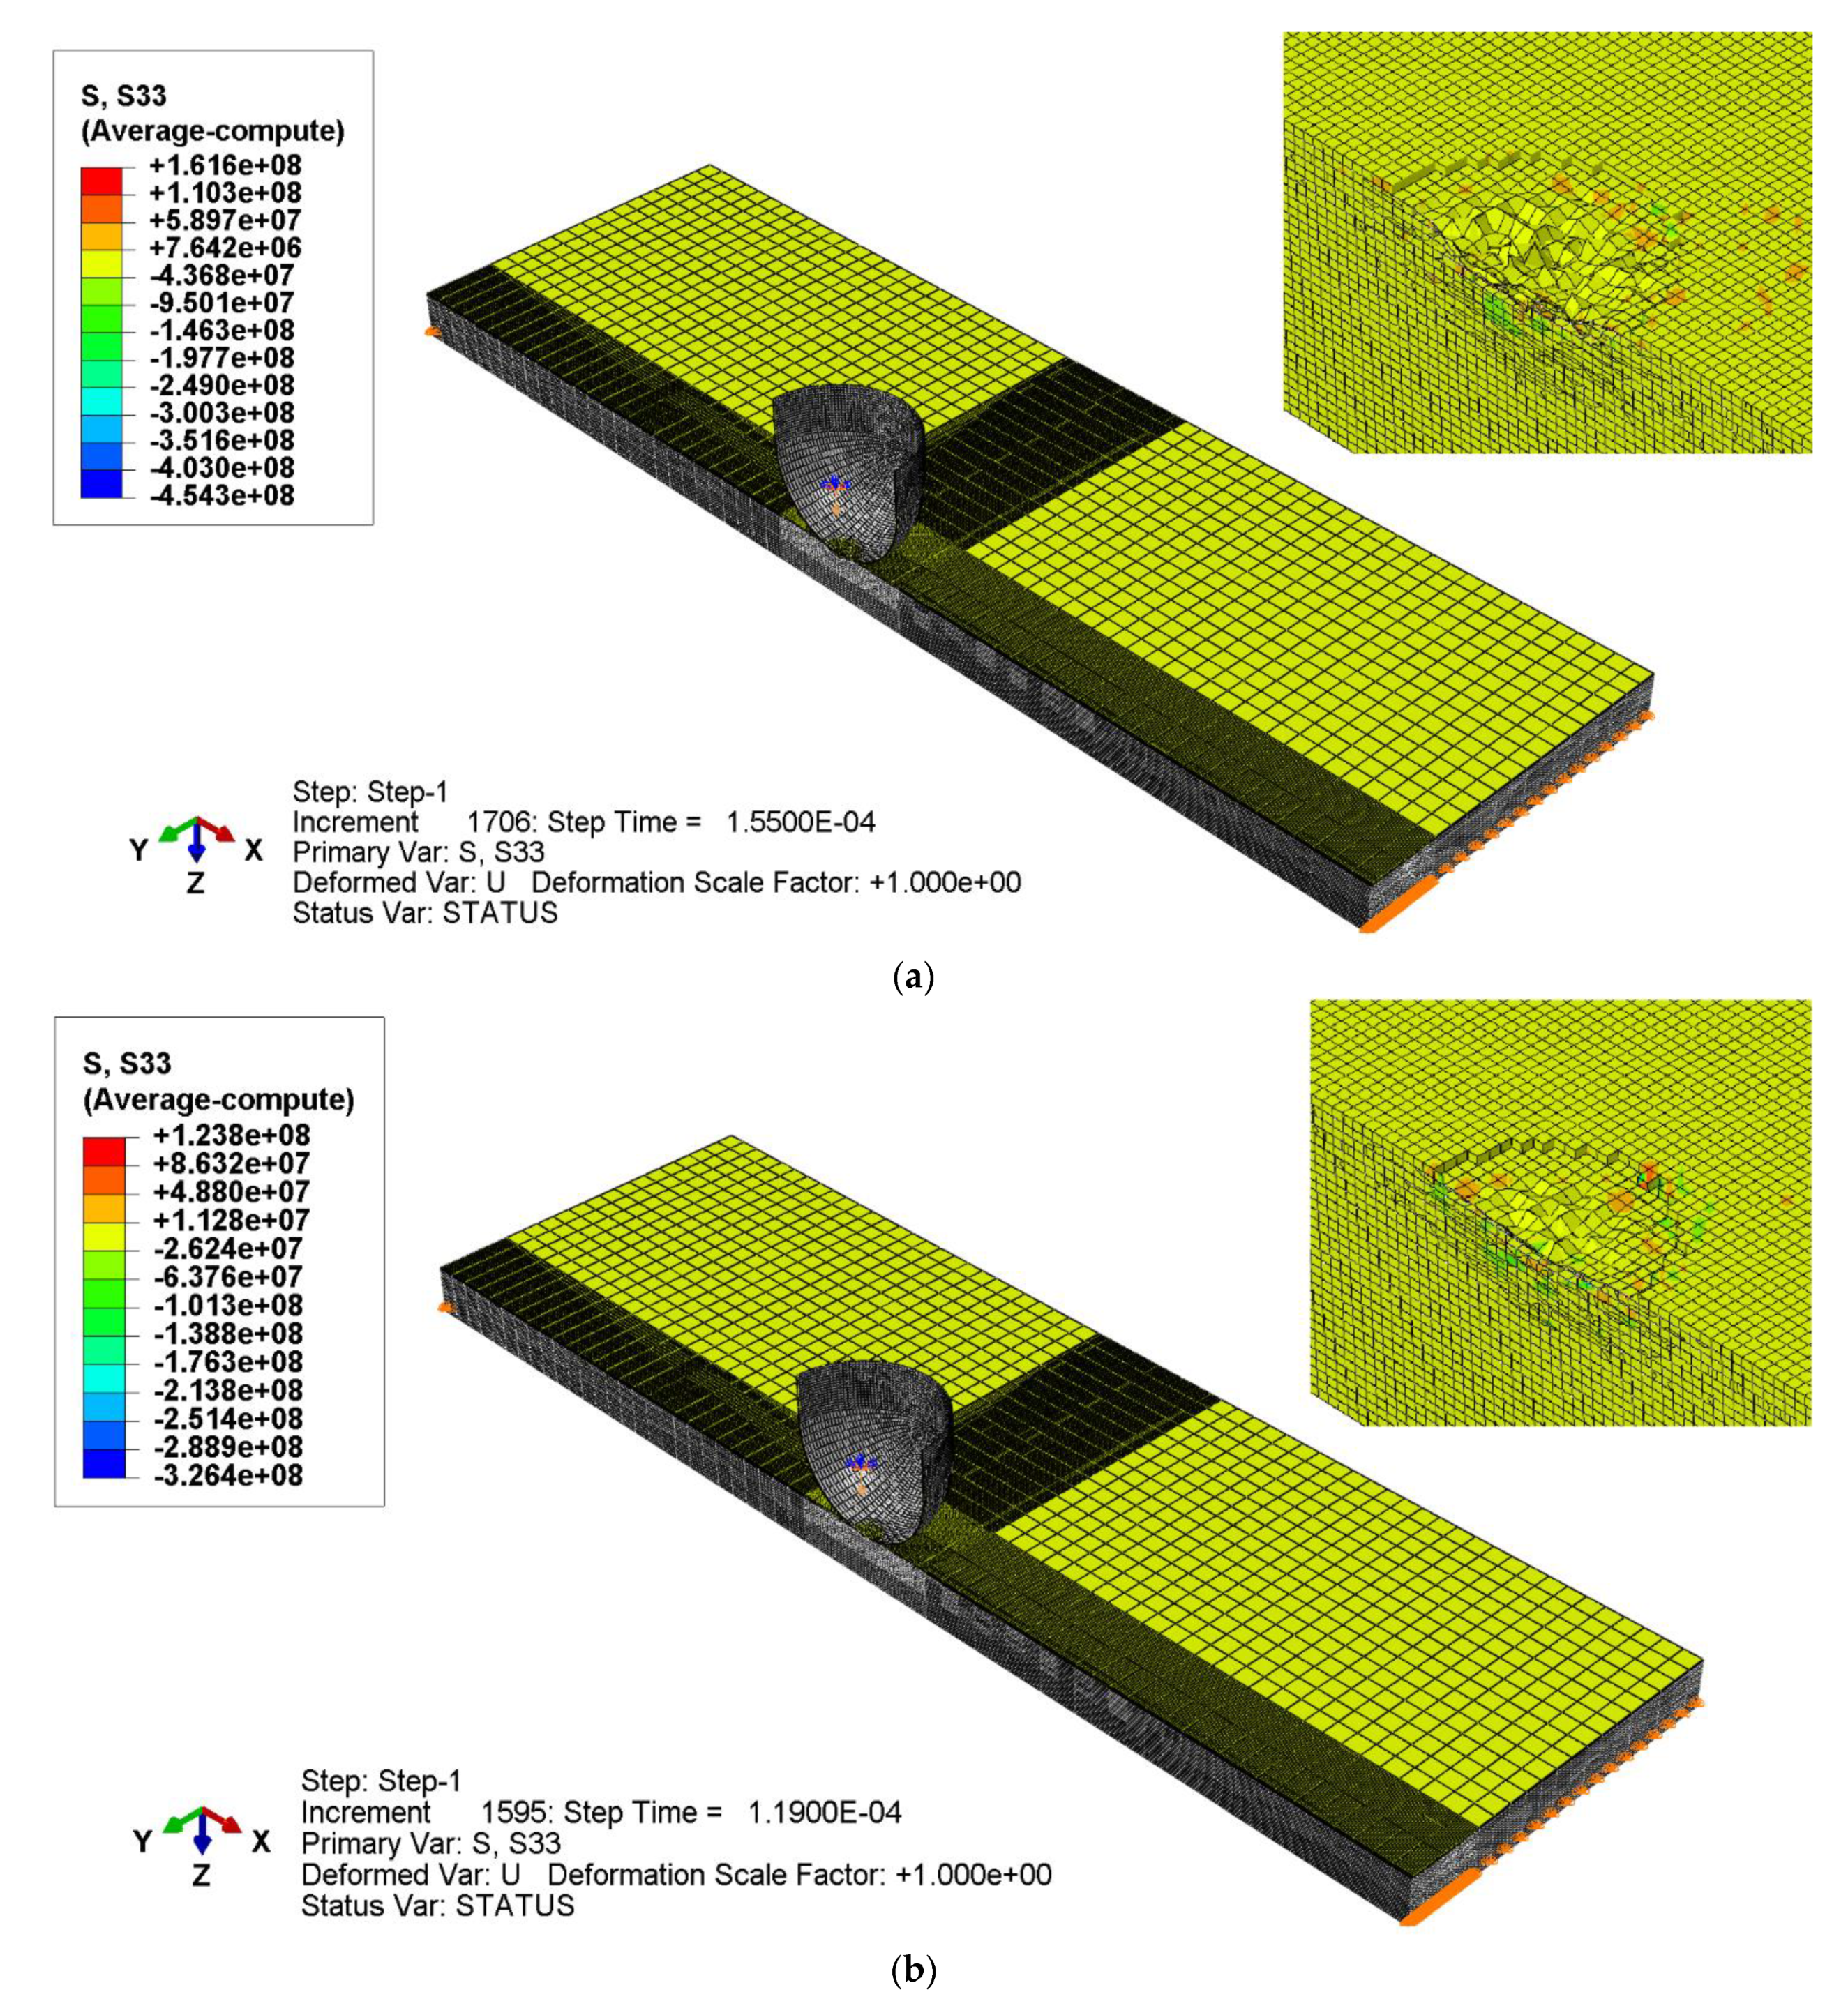
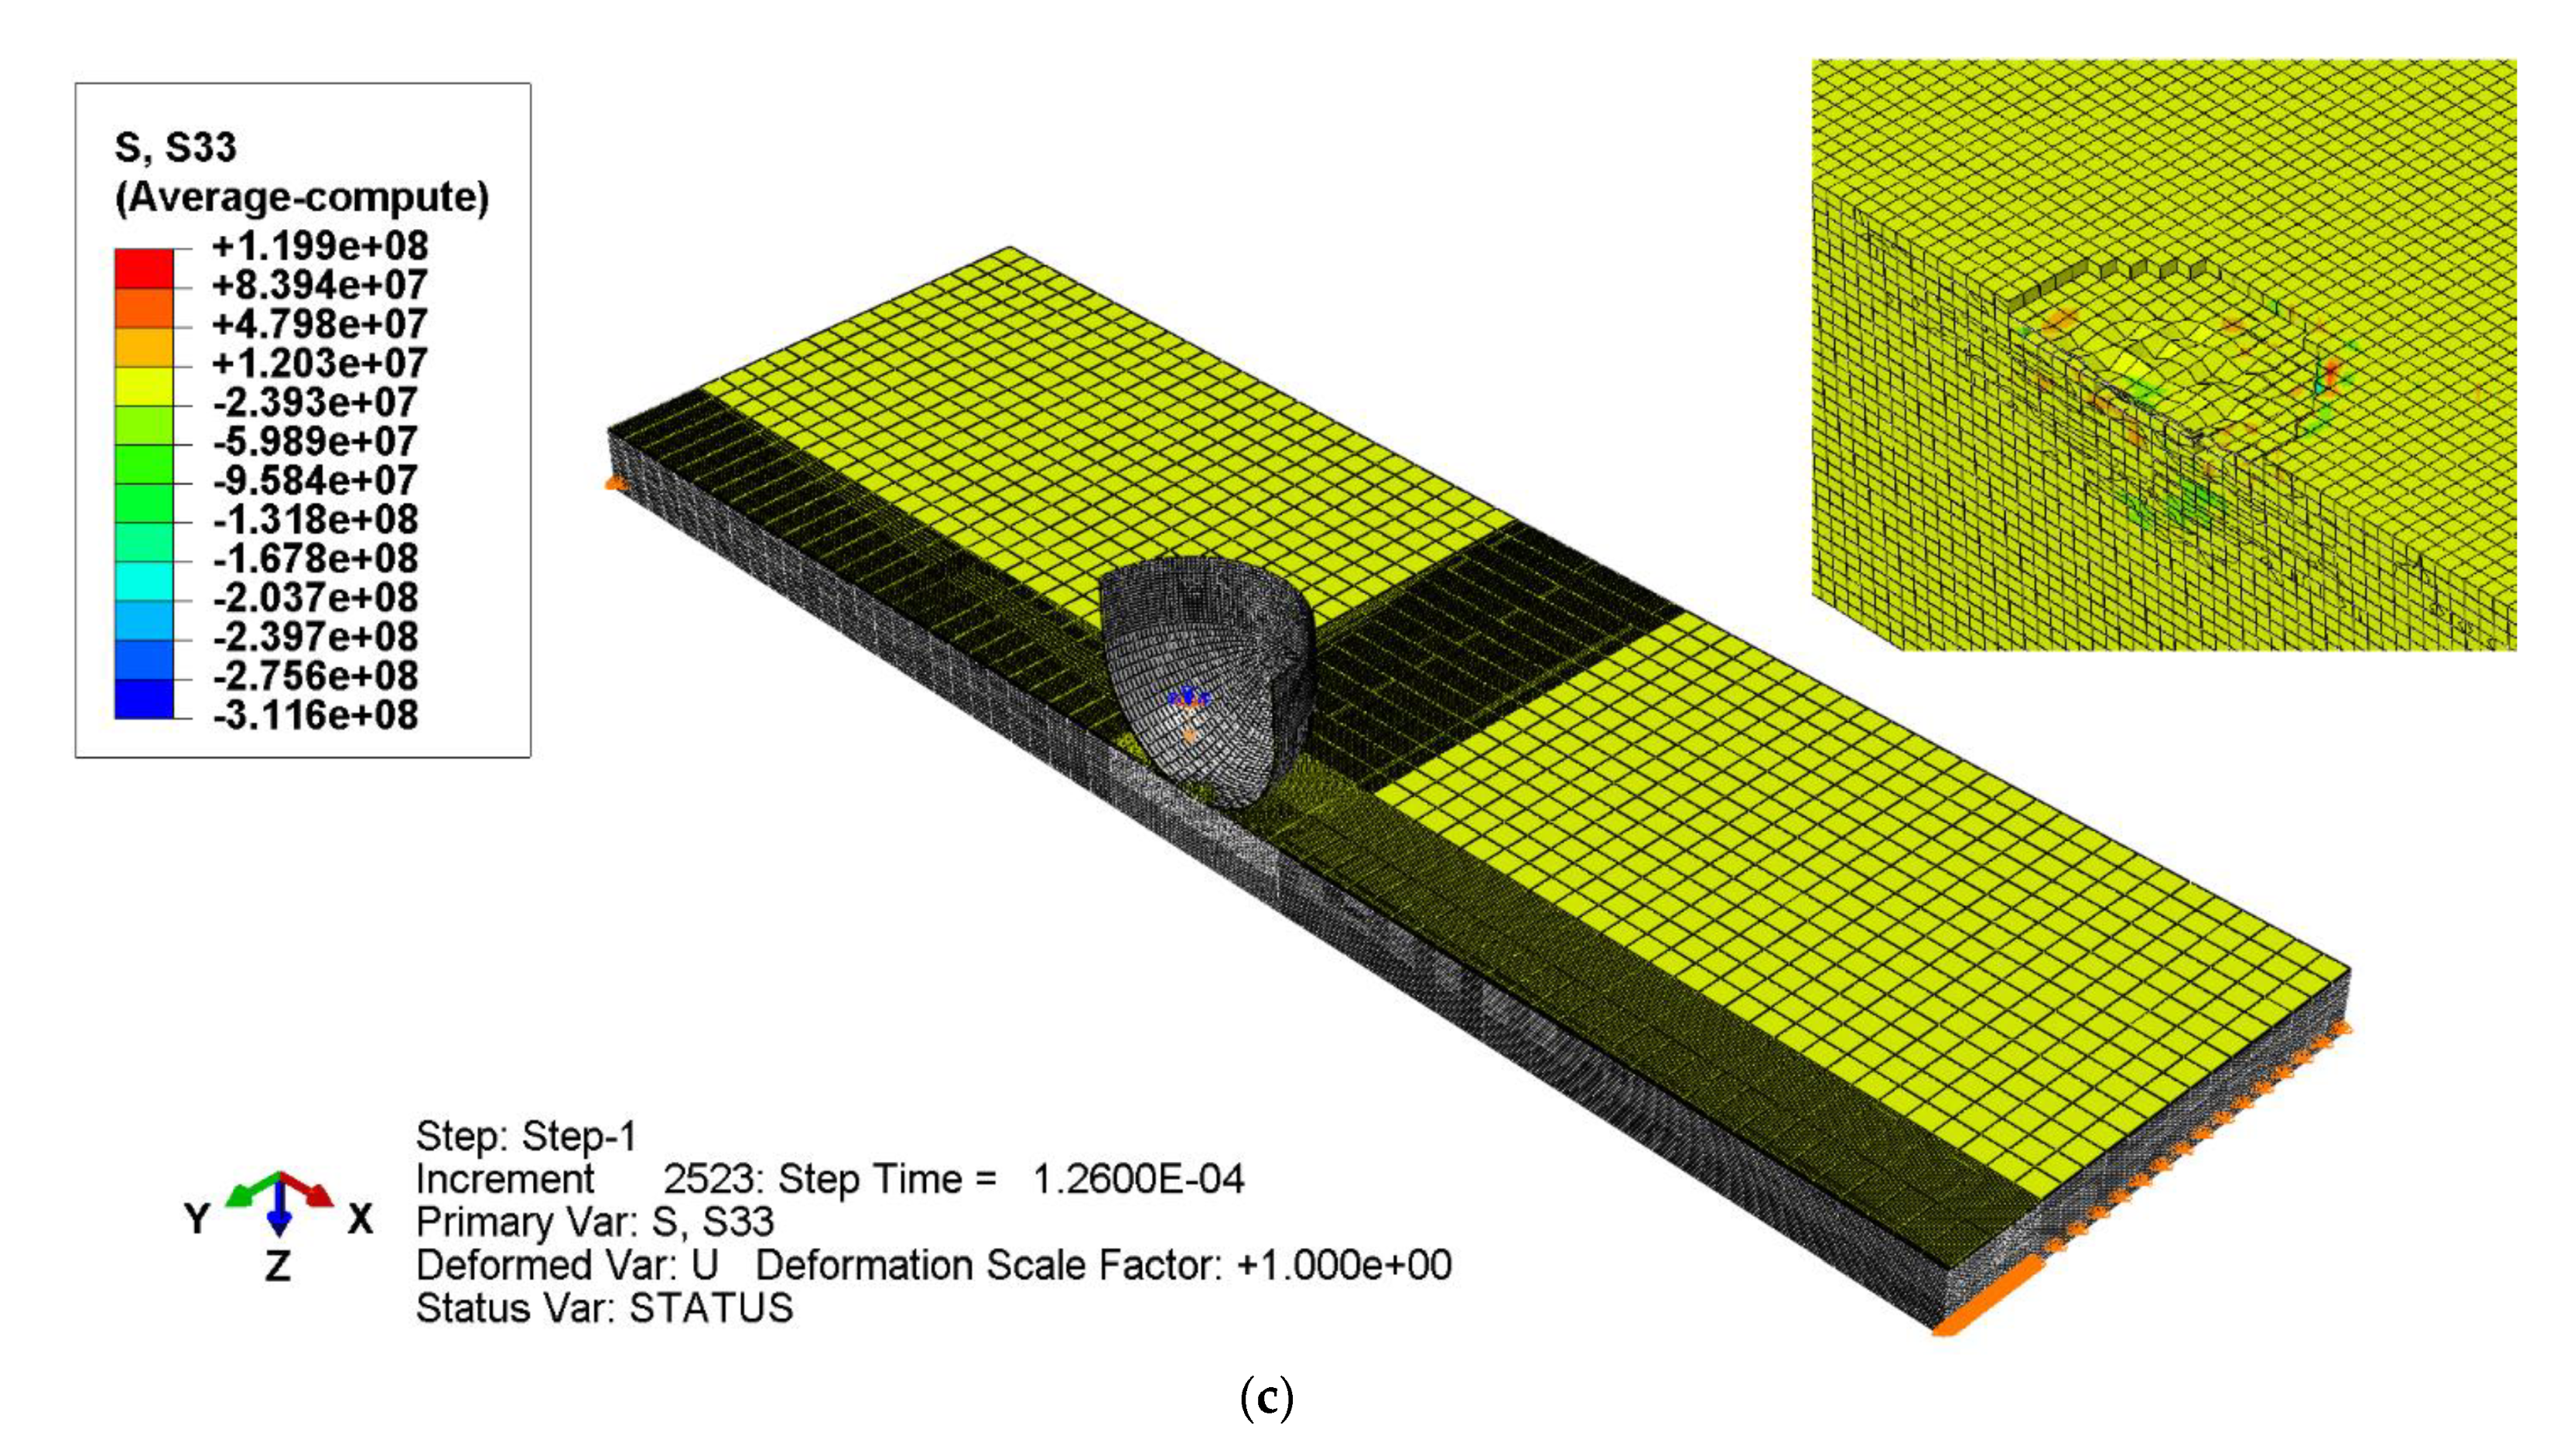
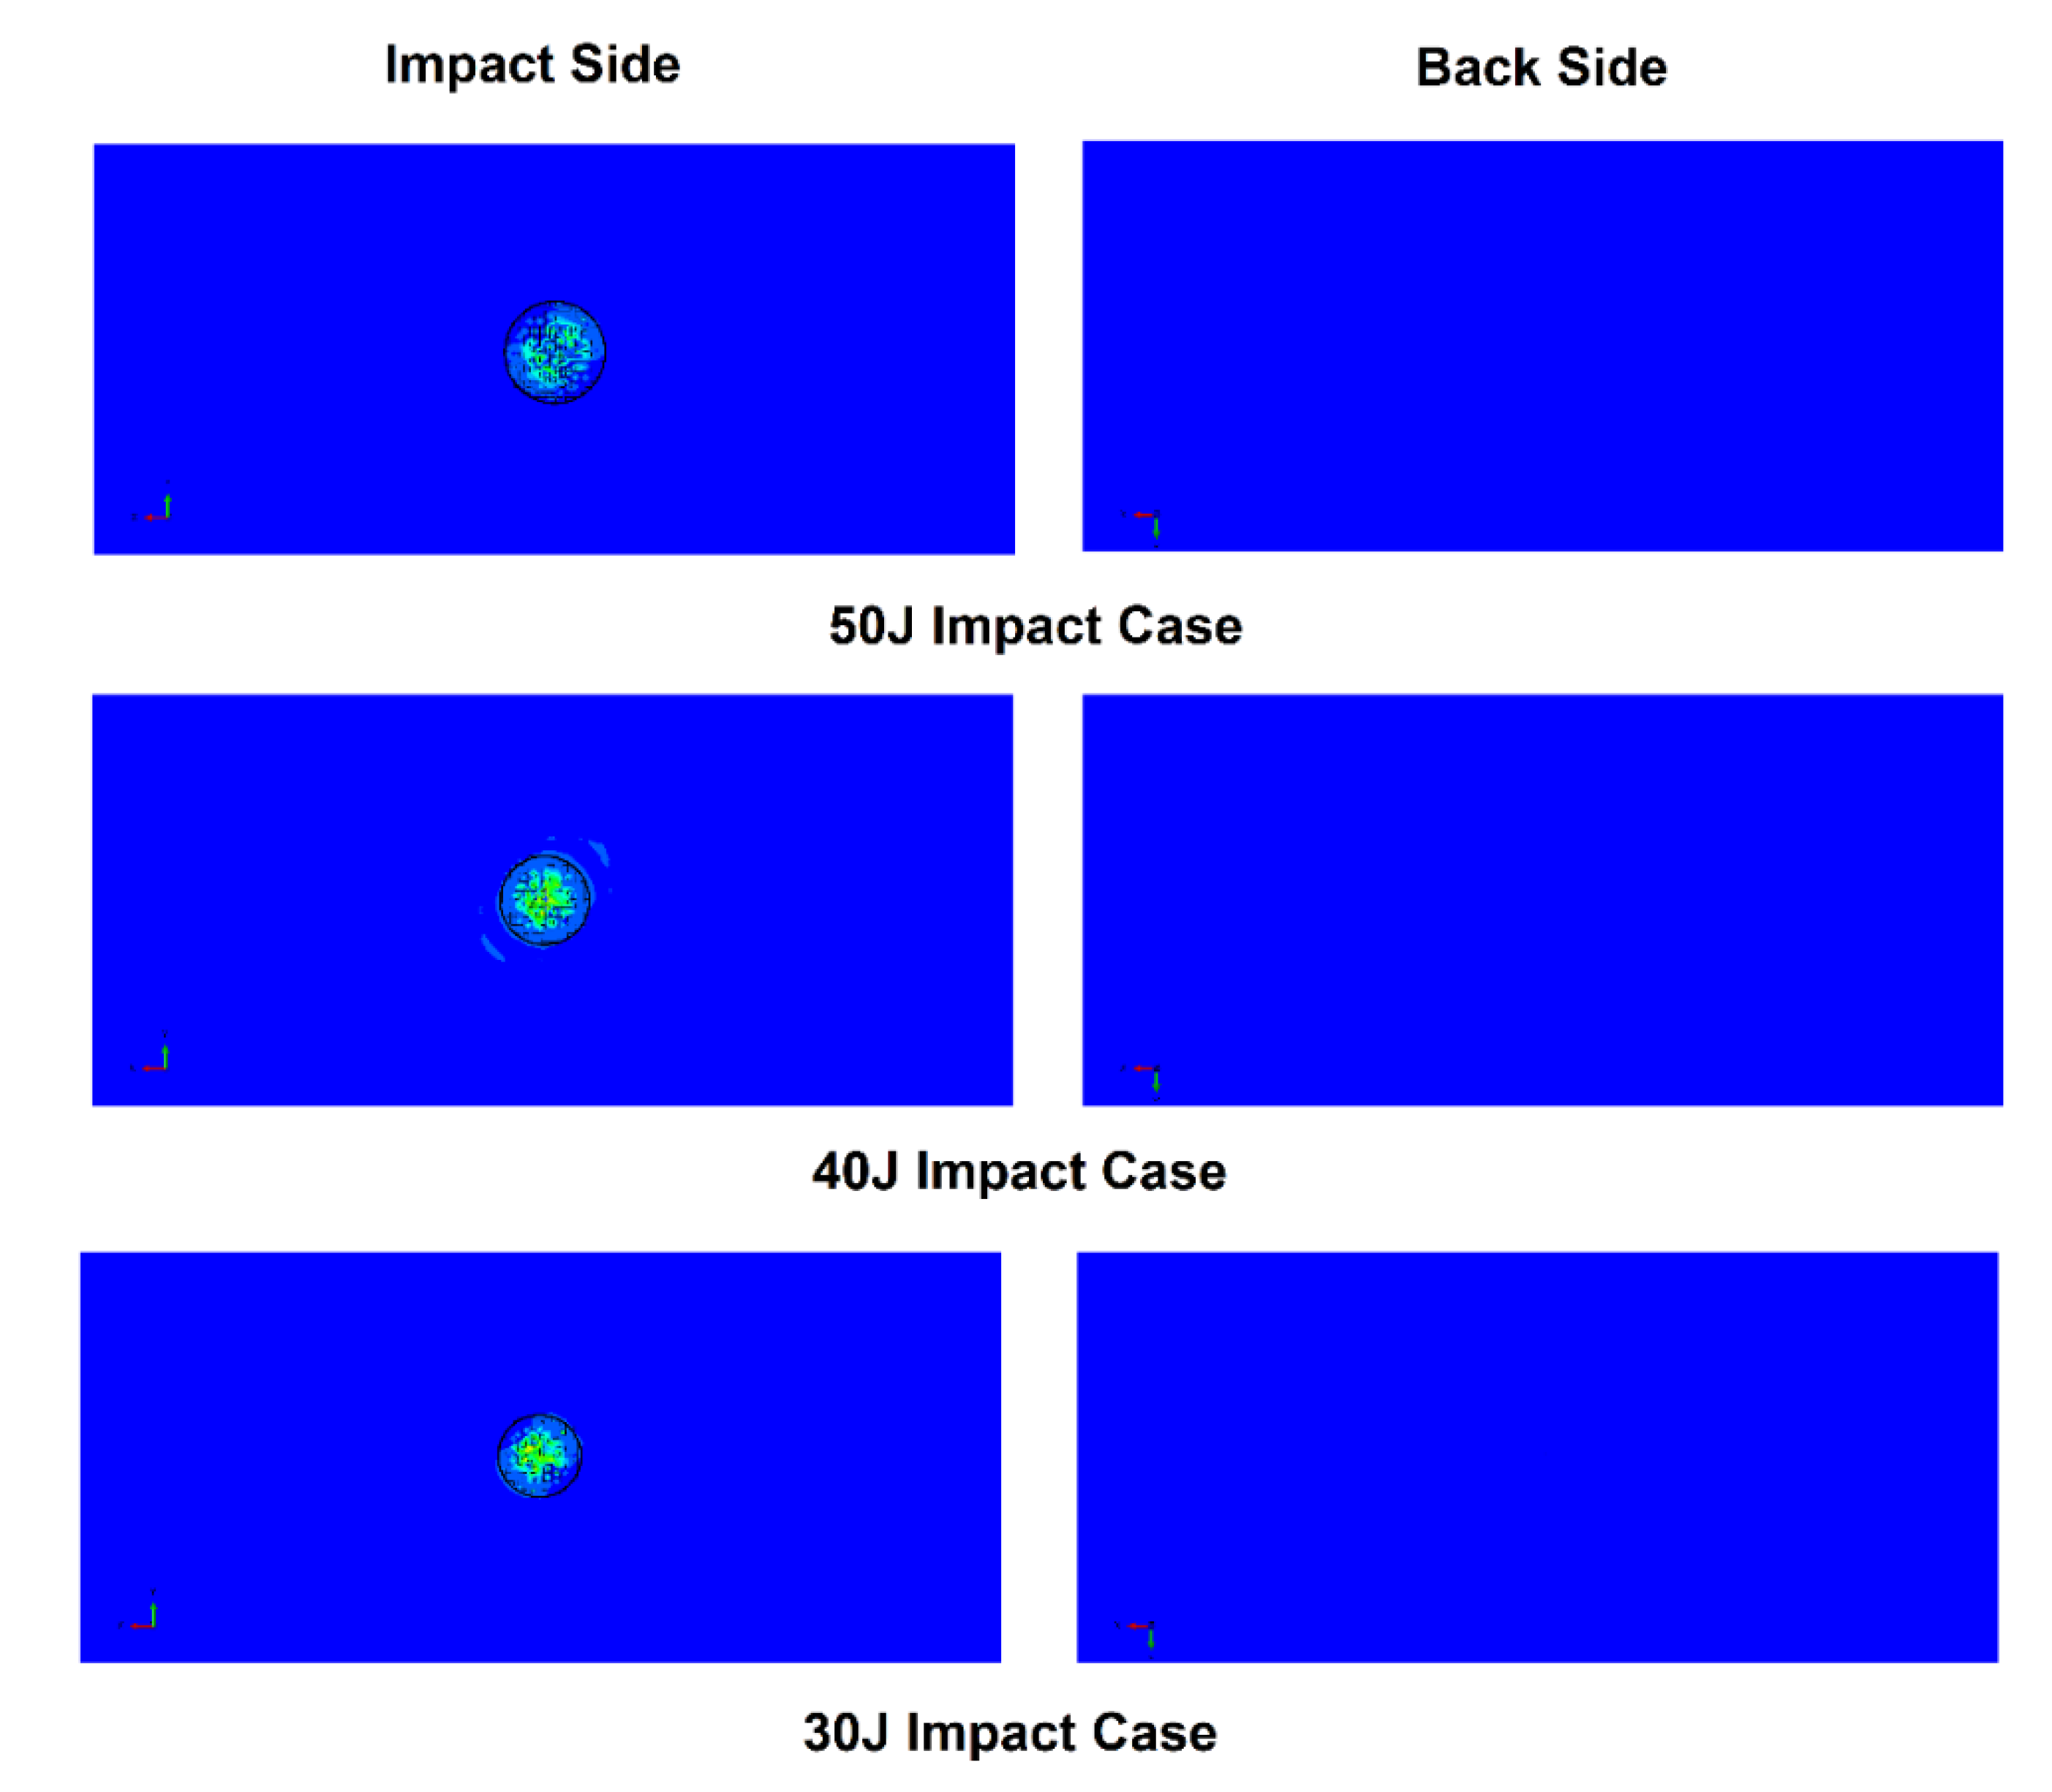
σ 33 (stress distribution in z-direction) for three impact energy cases is shown in Figure 12. Damage distribution in terms of local dent morphology for the three impact energy cases is shown in Figure 13.
From Figure 13, it is obvious that the shape/size of the dent is in direct proportion to the increase in impact energy. The shape and size of the dent also correspond to the shape of the total surface area of the impactor under contact. The back side surfaces of these specimens for each impact energy case remain undamaged, which shows good agreement with the experimental observations.

3.2.2. Simulation for Rebound Case

In the second part of the simulation, the indentation depth (calculated in the dynamic analysis) was obtained in ABAQUS Standard by static general analysis. For this, the maximum pressure obtained during dynamic analysis was applied (for a certain period) to obtain the same indentation depth; then, we allowed the damage (indentation depth) to evolve/rebound with time due to the viscoelastic behavior of the composite (Table 8).
To simulate indentation rebound by considering viscoelasticity in ABAQUS Standard, we used the following:
UMAT   Composite = UMAT   for   Unidirectional   Lamina + UMAT   for   Cohesive   Layer  
During each impact case, the specimen absorbs corresponding energies. The absorbed energy is different in each case; hence, the rebound will be different in each case too. This results in different viscoelastic material behavior of specimens for each impact case. Therefore, it is deemed necessary to calibrate the viscoelastic material properties of specimens for each impact case separately. Table 9 shows the calibrated viscoelastic material properties for each impact case for both UD ply and cohesive interface materials. In the 1st Maxwell chain, elements with relatively smaller elastic stiffness values are chosen over a large period for both material types (UD laminae ply and cohesive interface). However, in the 2nd Maxwell chain, elements with very large elastic stiffness values are chosen over a relatively smaller period for both material types. Table 9 shows that we only need to slightly adjust the 2nd Maxwell chain for both material types as the absorbed energy in each impact case is different, which results in a corresponding initial dent depth and its rebound over a period. Hence, total dent depth Δ d is different for different impact energies.
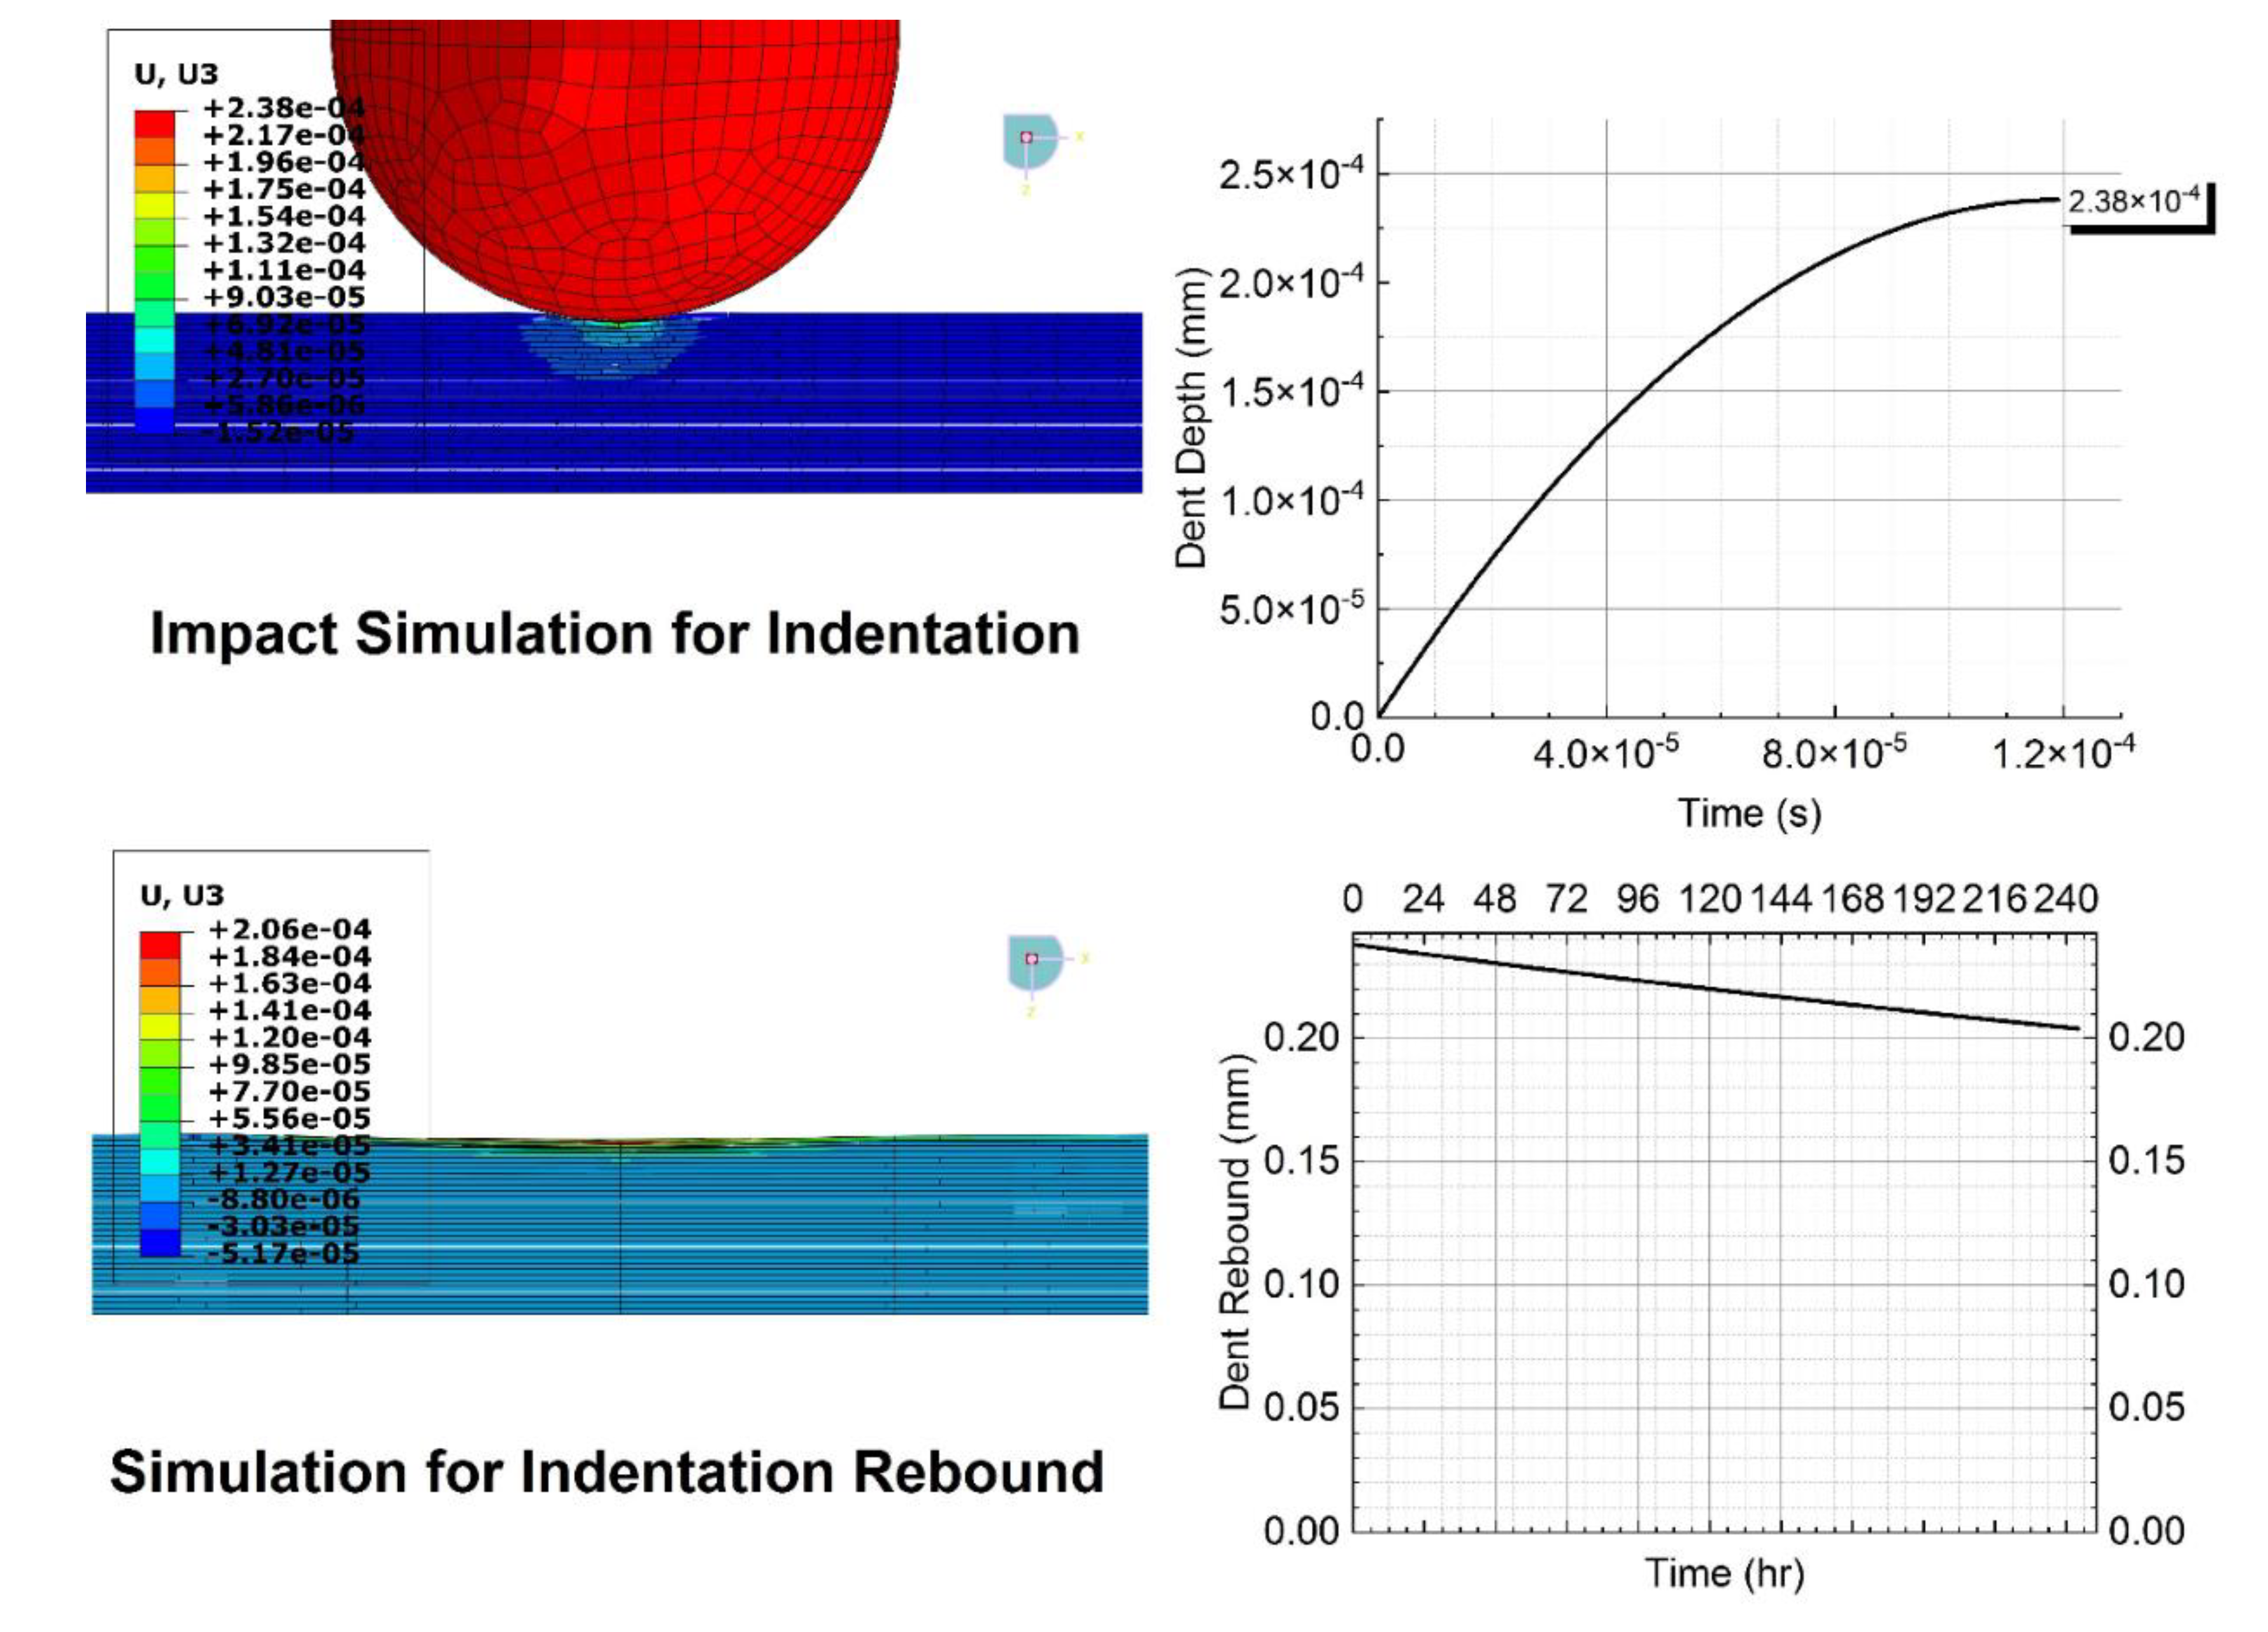
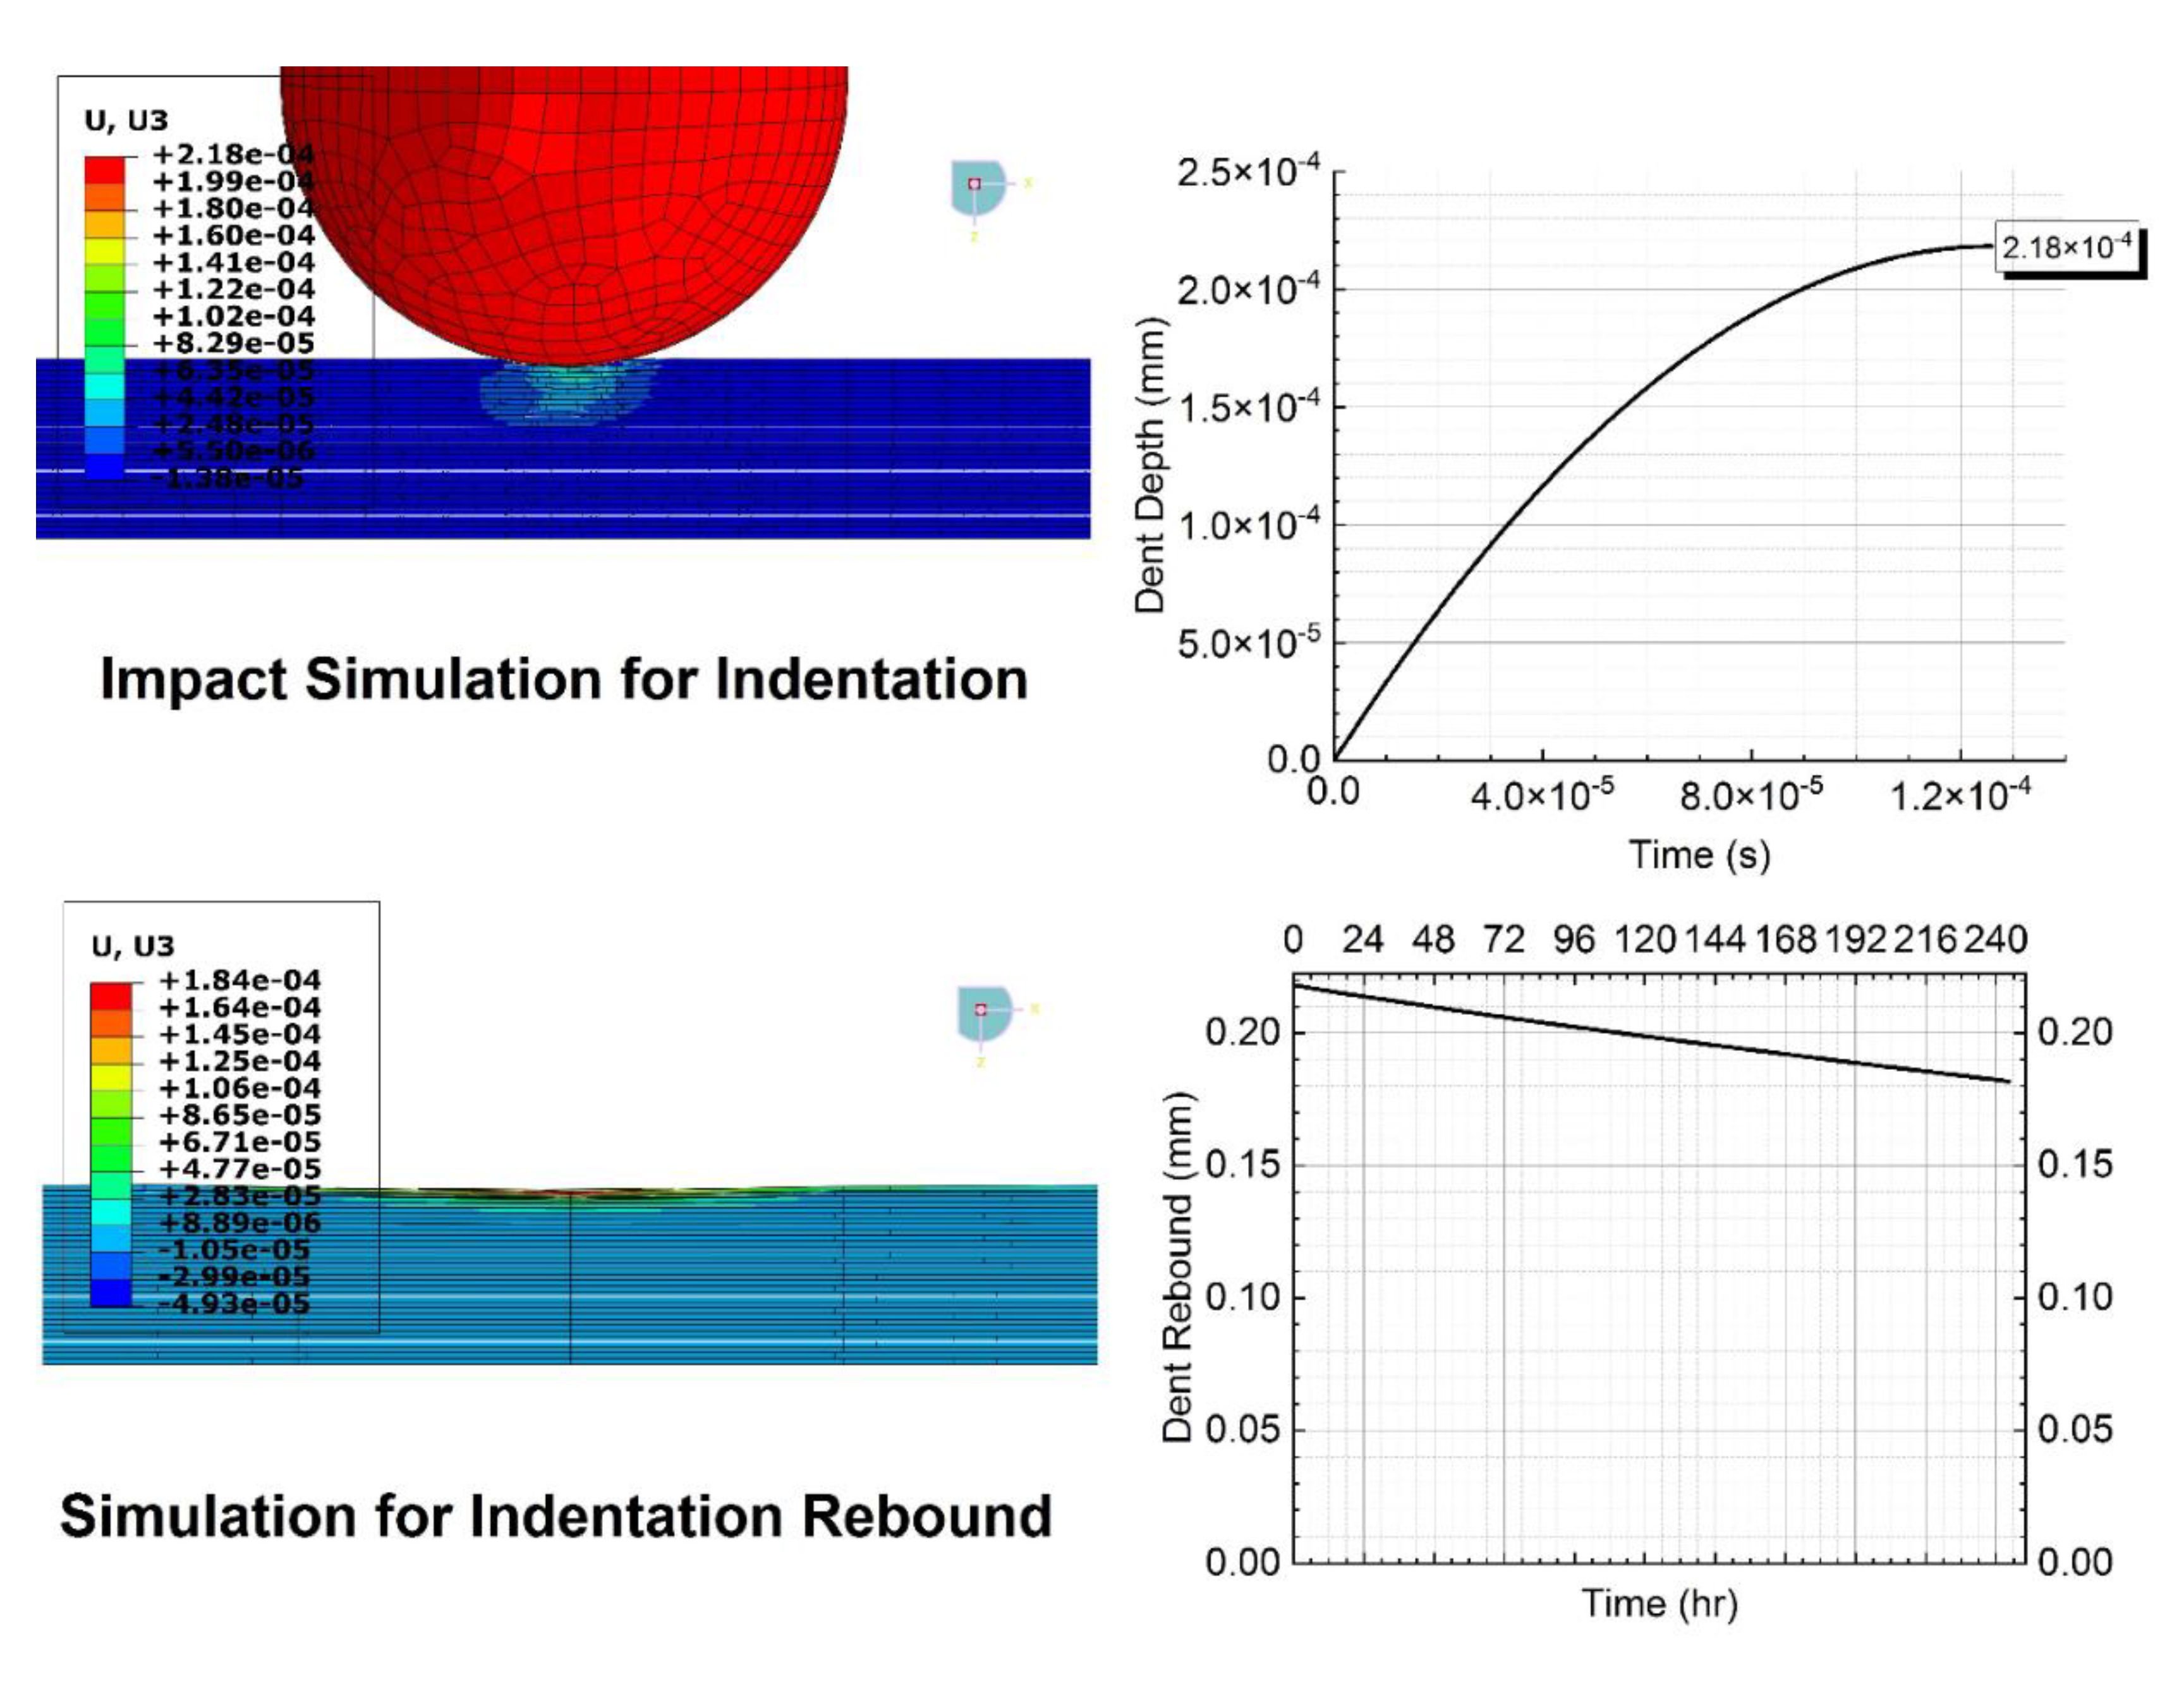
Results for both types of simulations are shown in Figure 14, Figure 15 and Figure 16.
Figure 14, Figure 15 and Figure 16 explain simulation results obtained from impact and rebound simulations in terms of initial indentation depth upon impact and its final indentation depth after rebound over time. The graphs show the dent evolution and rebound with time.

4. Results and Discussion

The simulation results show good agreement with the experimental observations in terms of damage (indentation) depth (initial and final), shape, and size. However, the simulation results deviate from experimental results for the cases of dent rebound velocity and dent rebound path (with a max error of 19.35%). This decrease in the original depth of indentation is faster with time initially after impact, after which it slows down with time and eventually stops. In Figure 17, the predicted dent rebound paths, despite being curved, look almost linear due to the longer rebound time with a very small Δ d (total dent rebound; in the range of 0.034 to 0.088 mm). However, the experimental curves are characterized as having a rapid rebound in the early period and then approaching invariability. This phenomenon is more obvious in the 50 J impact energy case. While the decrease in the original depth of indentation remains invariable with time, the rebound path curve obtained via simulation decays at a slower rate compared to the experimental rebound path curve, which is related to the assumptions considered for the viscoelastic constitution of the composite.
A graphical representation of indentation rebound obtained through experimental data and simulations is shown in Figure 17.
The rebound in dent depth is mainly because of the viscoelastic behavior of resin/matrix material in UD laminae plies, as well as the viscoelastic behavior of cohesive interface material.
While the simulation results accurately predict initial and final dent depths when compared with experimental results given in Table 10, the deviation of rebound path between these two results should be discussed.
Comparable experimental findings to those discussed in this section were previously reported by Lin Xiao, Guanhui Wang, et al. [25] during their experimental study related to CFRP subjected to LVI, in which they explained that the rebound of indentation dents is due to viscoelastic behavior. Taoye Lu, Xiuhua Chen, et al. [34] measured dent depths immediately and 30 days after impact in thermoplastic (TP) and thermoset (TS) composites and reported a change in dent depth with time.

5. Conclusions

In this study, experimental data was acquired to understand the damage recovery (rebound of indentation depth with time) of CFRPs subjected to low-velocity impacts of different impact energies with values greater than the damage threshold value, and then finite element models of the same impacts were simulated. From this, the following conclusions are drawn.
Indentation depth is prone to change with time, along with the shape and size of the indentation. The indentation depth starts to decrease immediately after impact. The decrease in the original depth of the indentation is faster with time initially after impact, after which it slows down with time and eventually stops. This rebound in dent depth is mainly because of the viscoelastic behavior of resin/matrix material in UD laminae plies, as well as the viscoelastic behavior of cohesive interface material.
The indentation rebound is proportional to the initial indentation depth. The deeper the initial indentation depth is, the greater the indentation rebound will be. Furthermore, in general, the initial indentation depth is proportional to impact energy. The greater the impact energy, the deeper the initial indentation depth.
Our simulation results accurately predict the initial and final dent depths for each impact case. While the decrease in the original depth of indentation remains invariable with time, the rebound path curve obtained via simulation decays at a slower rate compared to the experimental rebound path curve, which is related to the assumptions considered for the viscoelastic constitution of the composite. This adds error to the prediction of the rebound path (predicted with a max of 19.35% error). This prediction error will increase with the increase in total dent rebound, which corresponds to an increase in impact energy.
The value of Δ d (total dent rebound) is very small and different for each impact case. In other words, dent depth will rebound uniquely for each impact case. Therefore, for each case, viscoelastic properties need to be slightly adjusted accordingly for the 2nd Maxwell chain only.

Author Contributions

Conceptualization, M.Y.; methodology, M.Y.; software, M.Y.; validation, M.Y.; formal analysis, M.Y.; investigation, M.Y.; resources, C.Z.; data curation, M.Y.; writing—original draft preparation, M.Y.; writing—review and editing, C.Z.; visualization, M.Y.; supervision, C.Z.; project administration, C.Z.; funding acquisition, C.Z. All authors have read and agreed to the published version of the manuscript.

Funding

This work was supported by the National Natural Science Foundation of China (11872205), the State Key Laboratory of Mechanics and Control of Mechanical Structures (Nanjing University of Aeronautics and Astronautics, MCMS-E-0221Y02), and the Priority Academic Program Development of Jiangsu Higher Education Institutions.

Institutional Review Board Statement

Not applicable.

Informed Consent Statement

Not applicable.

Data Availability Statement

Not applicable.

Conflicts of Interest

The authors declare no conflict of interest.

Abbreviations

LVILow-Velocity Impact
PMCPolymer Matrix Composite
BKBenzeggagh–Kenane
UMATUser Material Subroutine for ABAQUS Standard
VUMATUser Material Subroutine for ABAQUS Explicit
CFRPCarbon Fiber-Reinforced Polymer
CZMCohesive Zone Modelling
VCCTVirtual Crack Closure Technique
CDMContinuum Damage Mechanics
UDUnidirectional

Appendix A [35]

UD Lamina Ply:
Solving Maxwell Model
Viscoelastic Constitutive Equations
σ M n + 1 = C M K e ε K n + 1 + M K p = 1 N h M K p n + 1
σ 1 σ 2 σ 3 σ 4 σ 5 σ 6 = E 1 + 4 K T υ 12 2 2 K T υ 12 2 K T υ 12 0 0 0 2 K T υ 12 K T + G T K T G T 0 0 0 2 K T υ 12 K T G T K T + G T 0 0 0 0 0 0 G 12 0 0 0 0 0 0 G 12 0 0 0 0 0 0 G T ε 1 ε 2 ε 3 ε 4 ε 5 ε 6 + p = 1 N h 11 p n + 1 h 12 p n + 1 h 13 p n + 1 0 0 0 h 21 p n + 1 h 22 p n + 1 h 23 p n + 1 0 0 0 h 31 p n + 1 h 32 p n + 1 h 33 p n + 1 0 0 0 0 0 0 h 44 p n + 1 0 0 0 0 0 0 h 55 p n + 1 0 0 0 0 0 0 h 66 p n + 1 E 1 + 4 K T υ 12 2 2 K T υ 12 2 K T υ 12 0 0 0 2 K T υ 12 K T + G T K T G T 0 0 0 2 K T υ 12 K T G T K T + G T 0 0 0 0 0 0 G 12 0 0 0 0 0 0 G 12 0 0 0 0 0 0 G T Δ ε 1 Δ ε 2 Δ ε 3 Δ ε 4 Δ ε 5 Δ ε 6
where p is the number of Maxwell chains.
M K p = 1 N h M K p n + 1 = M K p = 1 N e x p Δ t τ M K p h M K p n + γ M K p 1 e x p Δ t τ M K p Δ t τ M K p C M K e ε K n + 1 C M K e ε K n
K T = 1 / ( 2 1 υ 23 E 2 4 v 12 2 E 1
G T = E 2 2 1 + υ 23
τ M K p = η p μ p
γ M K p = μ p μ 0
Δ ε K = ε K n + 1 ε K n

Appendix B [35]

Cohesive Interface:
Solving Maxwell Model
Viscoelastic Constitutive Equations
t M n + 1 = E M K e ε K n + 1 + M K p = 1 N h M K p n + 1
t 1 t 2 t 3 = K N 1 d 0 0 0 K S 1 d 0 0 0 K T 1 d ε 1 ε 2 ε 3 + p = 1 N h 11 p n + 1 0 0 0 h 22 p n + 1 0 0 0 h 33 p n + 1 K N 1 d 0 0 0 K S 1 d 0 0 0 K T 1 d Δ ε 1 Δ ε 2 Δ ε 3
where p is the number of Maxwell chains.
M K p = 1 N h M K p n + 1 = M K p = 1 N e x p Δ t τ M K p h M K p n + γ M K p 1 e x p Δ t τ M K p Δ t τ M K p E M K e ε K n + 1 E M K e ε K n
τ M K p = η p μ p
γ M K p = μ p μ 0
Δ ε K = ε K n + 1 ε K n

References

  1. Choi, H.Y.; Chang, F.K. A model for predicting damage in graphite/epoxy laminated composites resulting from low-velocity point impact. J. Compos. Mater. 1992, 26, 2134–2169. [Google Scholar] [CrossRef]
  2. Brewer, J.C.; Lagace, P.A. Quadratic stress criterion for initiation of delamination. J. Compos. Mater. 1988, 22, 1141–1155. [Google Scholar] [CrossRef]
  3. Tita, V.; Carvalho, J.; Vandepitte, D. Failure analysis of low velocity impact on thin composite laminates: Experimental and numerical approaches. Compos. Struct. 2008, 83, 413–428. [Google Scholar] [CrossRef]
  4. Farooq, U.; Myler, P. Efficient computational modelling of carbon fibre reinforced laminated composite panels subjected to low velocity drop-weight impact. Mater. Des. 2014, 54, 43–56. [Google Scholar] [CrossRef]
  5. Fleming, D.C. Delamination Modeling of Composites for Improved Crash Analysis; NASA/CR-1999-209725; National Aeronautics and Space Administration, Langley Research Center: Hampton, VA, USA, 1999. [Google Scholar]
  6. Ronald, K. Virtual crack closure technique: History, approach, and applications. Appl. Mech. Rev. 2004, 57, 109–143. [Google Scholar]
  7. Aymerich, F.; Dore, F.; Priolo, P. Prediction of impact-induced delamination in cross-ply composite laminates using cohesive interface elements. Compos. Sci. Technol. 2008, 68, 2383–2390. [Google Scholar] [CrossRef] [Green Version]
  8. Shi, Y.; Soutis, C. A finite element analysis of impact damage in composite laminates. Aeronaut. J. 2012, 116, 1131–1147. [Google Scholar] [CrossRef]
  9. Caputo, F.; De Luca, A.; Lamanna, G.; Borrelli, R.; Mercurio, U. Numerical study for the structural analysis of composite laminates subjected to low velocity impact. Compos. Part B 2014, 67, 296–302. [Google Scholar] [CrossRef]
  10. Bouvet, C.; Castanié, B.; Bizeul, M.; Barrau, J.J. Low velocity impact modelling in laminate composite panels with discrete interface elements. Int. J. Solids Struct. 2009, 46, 2809–2821. [Google Scholar] [CrossRef] [Green Version]
  11. Donadon, M.; Iannucci, L.; Falzon, B.; Hodgkinson, J.; Almeida, S. A progressive failure model for composite laminates subjected to low velocity impact damage. Comput. Struct. 2008, 86, 1232–1252. [Google Scholar] [CrossRef]
  12. Kim, E.H.; Rim, M.S.; Lee, I.; Hwang, T.-K. Composite damage model based on continuum damage mechanics and low velocity impact analysis of composite plates. Compos. Struct. 2013, 95, 123–134. [Google Scholar] [CrossRef]
  13. Riccio, A.; De Luca, A.; Di Felice, G.; Caputo, F. Modelling the simulation of impact induced damage onset and evolution in composites. Compos. Part B 2014, 66, 340–347. [Google Scholar] [CrossRef]
  14. Batra, R.C.; Gopinath, G.; Zheng, J.Q. Damage and failure in low energy impact of fiber-reinforced polymeric composite laminates. Compos. Struct. 2012, 94, 540–547. [Google Scholar] [CrossRef]
  15. Zubillaga, L.; Turon, A.; Maimi, P.; Costa, J.; Mahdi, S.; Linde, P. An energy based failure criterion for matrix crack induced delamination in laminated composite structures. J. Compos. Struct. 2014, 112, 339–344. [Google Scholar] [CrossRef]
  16. Bouvet, C.; Rivallant, S. Damage tolerance of composite structures under low-velocity impact. In Dynamic Deformation, Damage and Fracture in Composite Materials and Structures; Woodhead Publishing: Sawston, UK, 2016. [Google Scholar] [CrossRef]
  17. Karakuzu, R.; Erbil, E.; Aktas, M. Impact characterization of glass/epoxy composite plates: An experimental and numerical study. Compos. Part B 2010, 41, 388–395. [Google Scholar] [CrossRef]
  18. Caprino, G.; Langella, A.; Lopresto, A. Indentation and penetration of carbon fibre reinforced plastic laminates. Compos. Part B 2003, 34, 319–325. [Google Scholar] [CrossRef]
  19. He, W.; Guan, Z.; Li, X.; Liu, D. Prediction of permanent indentation due to impact on laminated composites based on an elasto-plastic model incorporating fiber failure. Compos. Struct. 2013, 96, 232–242. [Google Scholar] [CrossRef]
  20. Luo, G.M.; Lee, Y.J. Quasi-static simulation of constrained layered damped laminated curvature shells subjected to low-velocity impact. Compos. Part B 2011, 42, 1233–1243. [Google Scholar] [CrossRef]
  21. Sutherland, L.S.; Guedes Soares, C. The use of quasi-static testing to obtain the low-velocity impact damage resistance of marine GRP laminates. Compos. Part B 2012, 43, 1459–1467. [Google Scholar] [CrossRef]
  22. Yokozeki, T.; Kuroda, A.; Yoshimura, A.; Ogasawara, T.; Aoki, T. Damage characterization in thin-ply composite laminates under out-of-plane transverse loadings. Compos. Struct. 2010, 93, 49–57. [Google Scholar] [CrossRef]
  23. Brindle, A.R.; Zhang, X. Predicting the compression-after-impact performance of carbon fibre composites based on impact response. In Proceedings of the 17th International Conference on Composite Materials (ICCM17), Edinburgh, UK, 27–31 July 2009. [Google Scholar]
  24. Zhou, J.; Liu, B.; Wang, S. Finite element analysis on impact response and damage mechanism of composite laminates under single and repeated low-velocity impact. Aerosp. Sci. Technol. 2022, 129, 107810. [Google Scholar] [CrossRef]
  25. Xiao, L.; Wang, G.; Qiu, S.; Han, Z.; Lia, X.; Zhang, D. Exploration of energy absorption and viscoelastic behavior of CFRPs subjected to low velocity impact. Compos. Part B Eng. 2018, 165, 247–254. [Google Scholar] [CrossRef]
  26. Fazal, A.; Fancey, K.S. Viscoelastically prestressed polymeric matrix composites—Effects of test span and fiber volume fraction on Charpy impact characteristics. Compos. Part B 2013, 44, 4729. [Google Scholar] [CrossRef] [Green Version]
  27. Zobeiry, N.; Malek, S.; Vaziri, R.; Poursartip, A. A differential approach to finite element modelling of isotropic and transversely isotropic viscoelastic materials. Mech. Mater. 2016, 97, 76–91. [Google Scholar] [CrossRef]
  28. Kaliske, M.; Rothert, H. Formulation and implementation of three-dimensional viscoelasticity at small and finite strains. Comput. Mech. 1997, 19, 228–239. [Google Scholar] [CrossRef]
  29. Giurgiutiu, V. Table 1, Conversion from tensor to matrix indices for the Voigt notation, Page 30, Chapter 2, Fundamentals of Aerospace Composite Materials. In Structural Health Monitoring of Aerospace Composites; Academic Press: Cambridge, MA, USA, 2015. [Google Scholar] [CrossRef]
  30. Zhang, J.; Zhang, X. An efficient approach for predicting low-velocity impact force and damage in composite laminates. Compos. Struct. 2015, 130, 85–94. [Google Scholar] [CrossRef]
  31. Benzeggagh, M.L.; Kenane, M. Measurement of mixed-mode delamination fracture toughness of unidirectional glass/epoxy composites with mixed-mode bending apparatus. J. Compos. Sci. Technol. 2003, 56, 439–449. [Google Scholar] [CrossRef]
  32. Camanho, P.P.; D_avila, C.G.; de Moura, M.F. Numerical simulation of mixed-mode progressive delamination in composite materials. J. Compos. Mater. 2003, 37, 1415–1438. [Google Scholar] [CrossRef]
  33. ASTM D7136; Standard Test Method for Measuring the Damage Resistance of a Fiber Reinforced Polymer Matrix Composite to a Drop-Weight Impact Event. ASTM International: West Conshohocken, PA, USA, 2015; pp. 1–16.
  34. Lu, T.; Chen, X.; Wang, H.; Zhang, L.; Zhou, Y. Comparison of low-velocity impact damage in thermoplastic and thermoset composites by non-destructive three-dimensional X-ray microscope. Polym. Test. 2020, 91, 106730. [Google Scholar] [CrossRef]
  35. Sirimontree, S.; Thongchom, C.; Saffari, P.R.; Refahati, N.; Jearsiripongkul, T.; Keawsawasvong, S. Effects of thermal environment and external mean flow on sound transmission loss of sandwich functionally graded magneto-electro-elastic cylindrical nanoshell. Eur. J. Mech.-A/Solids 2023, 97, 104774. [Google Scholar] [CrossRef]
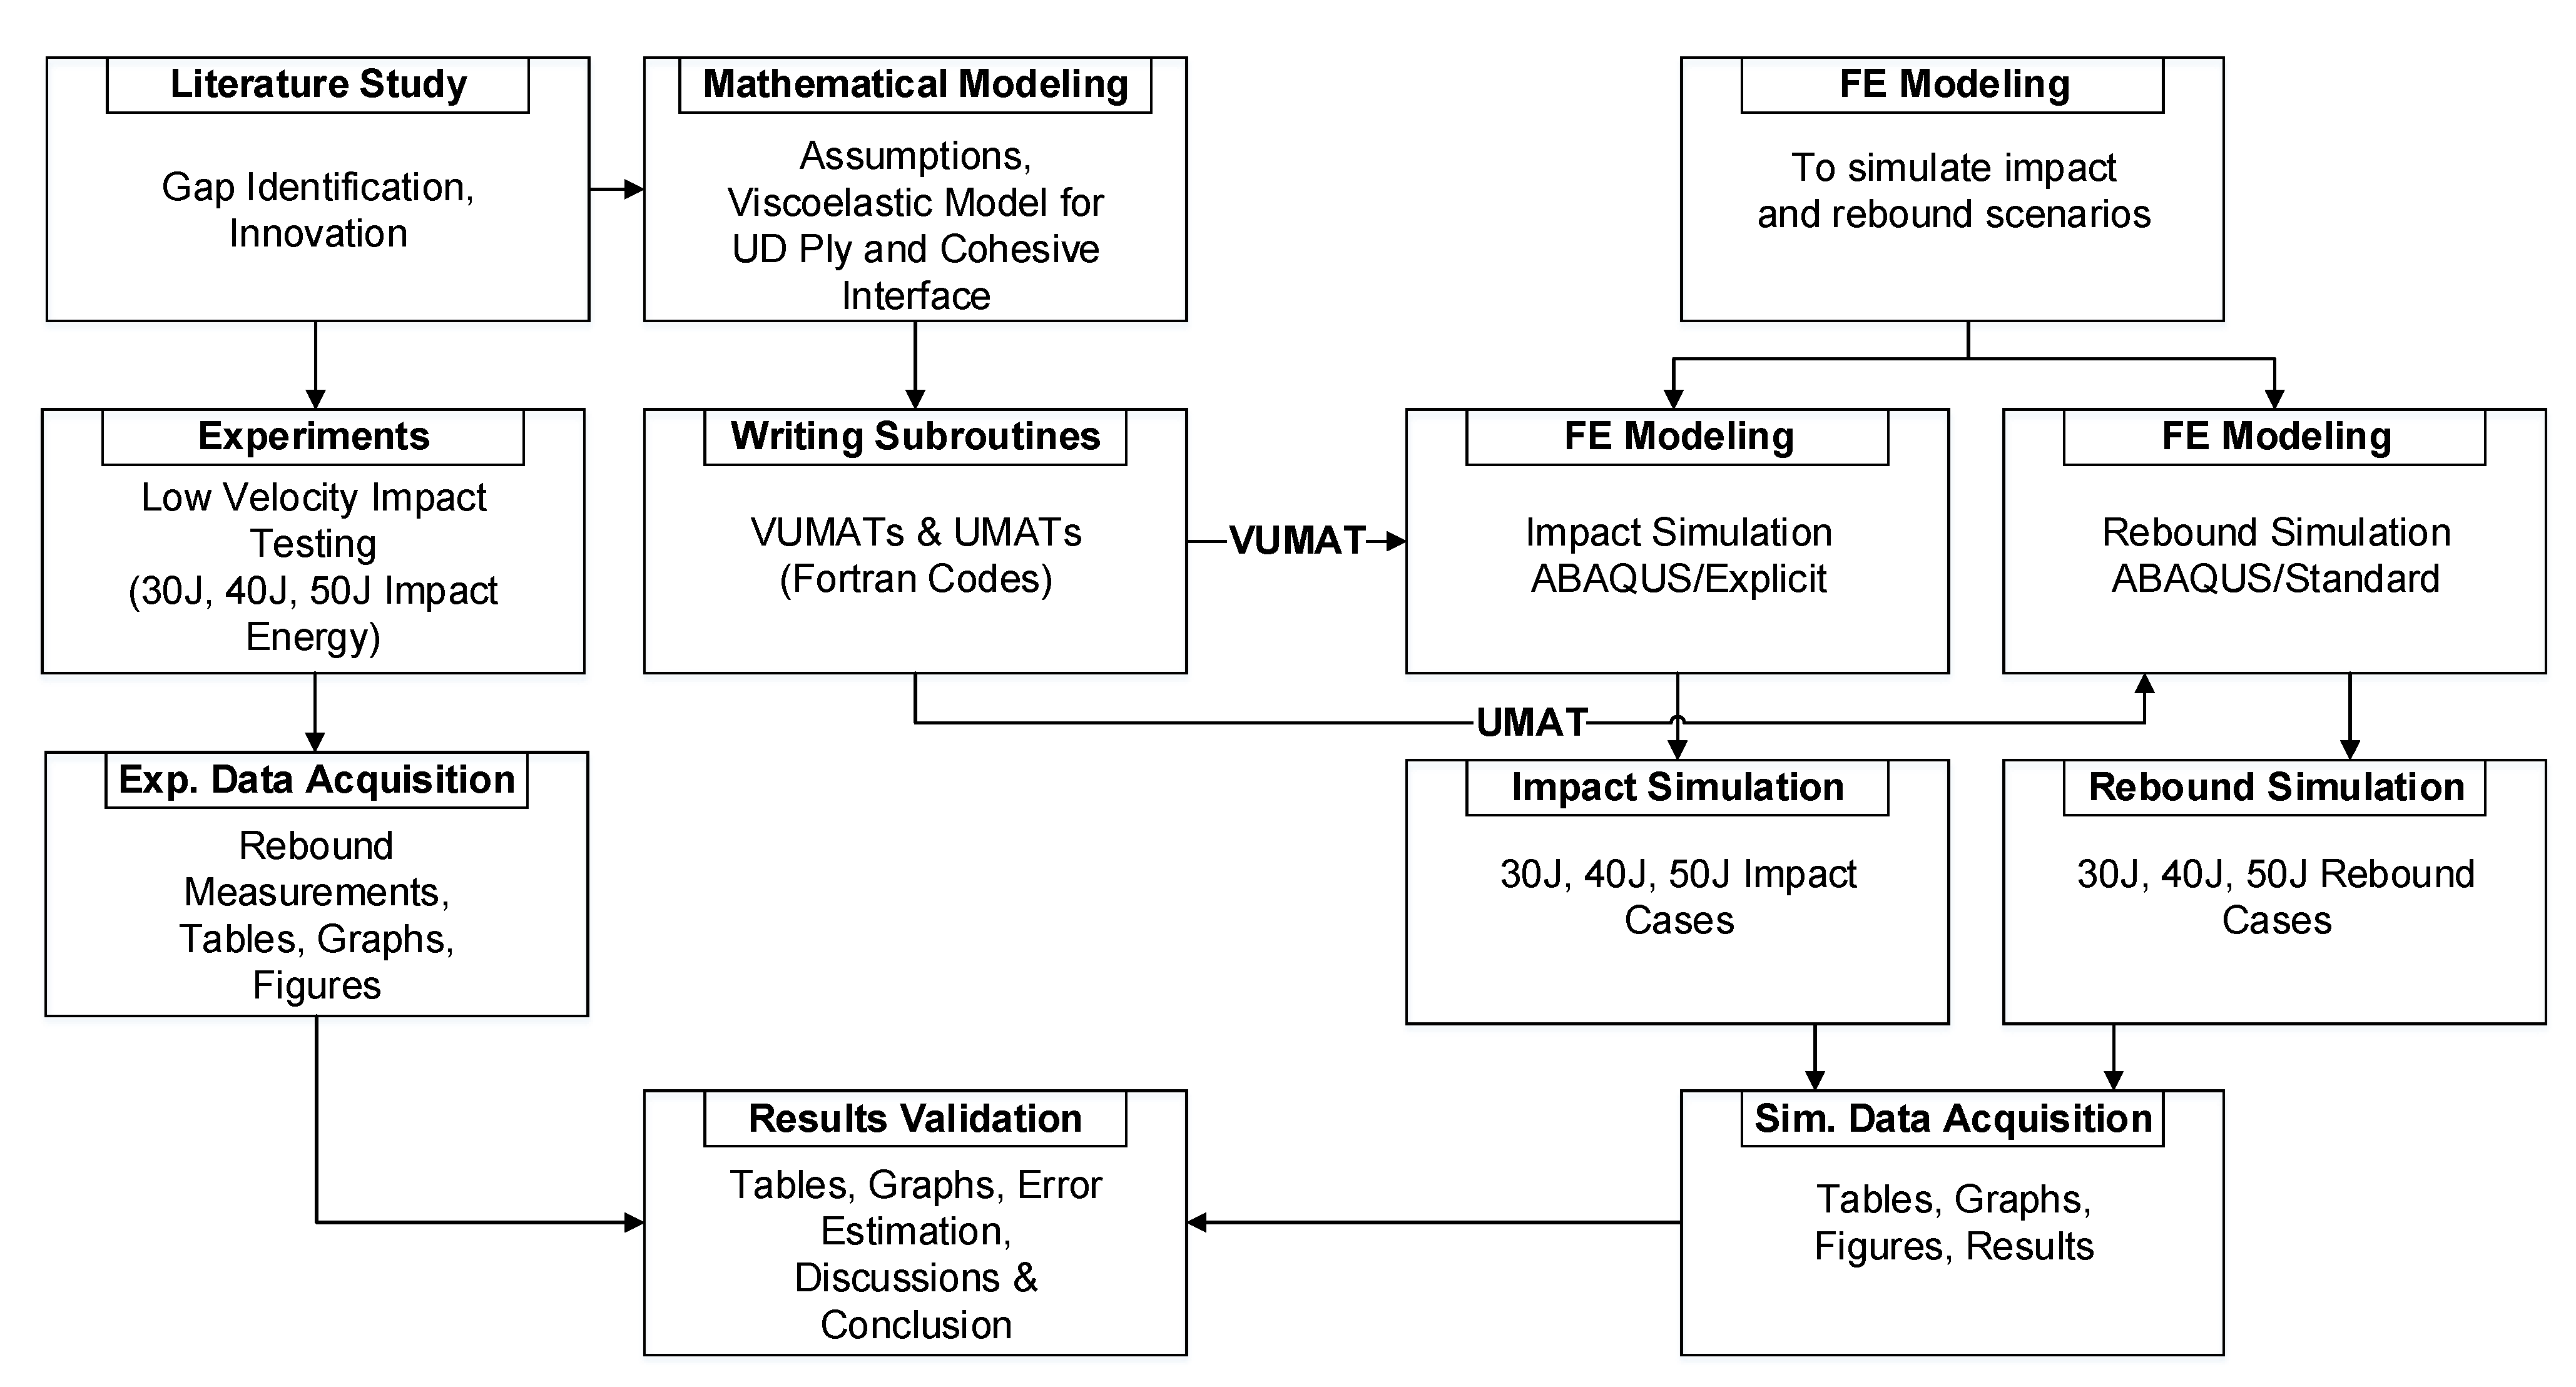
Figure 1. Schematic of the Overall Methodology or Research Flow.
Aerospace 09 00651 g001
Figure 2. Generalized Maxwell rheological model with N Maxwell element chains.
Aerospace 09 00651 g002
Figure 3. Schematic diagram of cohesive interface linear softening model [31,32].
Aerospace 09 00651 g003
Figure 4. Laminate stacking and cohesive interface sequence diagram.
Aerospace 09 00651 g004
Figure 5. Indentation rebound: depth vs. time graph.
Aerospace 09 00651 g005
Figure 6. Pictures of 40 J impact case specimen: (a) view from impact side; (b) view from back side.
Aerospace 09 00651 g006
Figure 7. Fitting curves for 30 J, 40 J, and 50 J impact cases: dent depth vs. time graph.
Aerospace 09 00651 g007
Figure 8. Rebound velocity vs. time graph.
Aerospace 09 00651 g008
Figure 9. Fitting curve for 50 J impact case: rebound velocity vs. time graph.
Aerospace 09 00651 g009
Figure 10. Simulation methodology: LVI with initial indentation depth and its rebound with time: (a) before impact; (b) impact dent; (c) initial dent depth; (d) final dent depth.
Aerospace 09 00651 g010
Figure 11. Finite element model.
Aerospace 09 00651 g011
Figure 12. σ 33 (stress distribution in z-direction) for three impact energy cases: (a) σ 33 for 50 J impact case; (b) σ 33 for 40 J impact case; (c) σ 33 for 30 J impact case.
Aerospace 09 00651 g012aAerospace 09 00651 g012b
Figure 13. Local dent morphology for three impact energy cases.
Aerospace 09 00651 g013
Figure 14. Case I: 50 J.
Aerospace 09 00651 g014
Figure 15. Case II: 40 J.
Aerospace 09 00651 g015
Figure 16. Case III: 30 J.
Aerospace 09 00651 g016
Figure 17. Comparison graph for experimental and simulated indentation rebound results.
Aerospace 09 00651 g017
Table 1. Damage Criterion for UD Laminae [30].
Damage TypeFailure ModeDamage Initiation
Lamina Ply LevelMatrixTension Cracking σ y y Y T 2 + τ x y S x y 2 + τ y z S y z 2 1
Compression Cracking σ y y Y C 2 + τ x y S x y 2 + τ y z S y z 2 1
FiberTension Failure σ x x X T 2 + τ x y S x y 2 + τ y z S y z 2 1
Compression Failure σ x x X C 2 1
where, σ x x and σ y y are in plane stresses in fiber and transverse directions. τ xy and τ yz are shear stresses. X T and X C are fiber tension and compression strength. Y T and Y C are matrix tension and compression strength. While S x y and S y z are shear strength, respectively.
Table 2. Material Properties of a single Unidirectional (UD) Ply.
Elastic Constants of a Single UD PlyStrength of a Single UD Ply
E1 = 144.62 GPa X T = 2612.24 MPa
E2 = 9.76 GPa X C = 1583.47 MPa
G12 = 5.44 GPa Y T = 58.25 MPa
G23 = 3.92 GPa Y C = 161.76 MPa
v12 = 0.31 S 12 = 126.79 MPa
v23 = 0.46 S 23 = 91.84 MPa
Table 3. Damage criterion for cohesive interface [31,32].
Damage TypeDamage InitiationDamage Propagation
Cohesive Layer Interface t n T n f 2 + t s T i f 2 + t t T i f 2 1
δ m = δ n 2 + δ s 2 + δ t 2
d = δ m f α δ m 0 α δ m f δ m 0
Linear Softening Mixed-Mode BK Law
σ = D . δ
D i j = K M δ ¯ i j ,     α δ m 0 δ ¯ i j [ 1 d K M + d K M δ 3 δ 3 δ ¯ i 3 ] ,   δ m 0 < α < δ m f δ ¯ i 3 δ ¯ 3 j δ 3 δ 3 K M ,     α δ m f
Table 4. Material properties of cohesive interface between plies.
K n
(GPa/mm)
K i
(GPa/mm)
T n f
(MPa)
T i f
(MPa)
δ n f
(mm)
δ n f
(mm)
E n b
(GPa/mm)
δ n r
(mm)
1390.0510.065.595.50.0140.02526.50.043
Table 5. Experimental results of indentation depth rebound with time.
Case I: 50 JCase II: 40 JCase III: 30 J
Time
(Hour)
Depth
(mm)
Time
(Hour)
Depth
(mm)
Time
(Hour)
Depth
(mm)
00.34800.23800.218 d i , Initial Indentation Depth
0.750.3380.50.2330.50.211
40.31110.2291.50.209
160.28840.22660.204
240.282140.22118.330.198
480.273240.21850.50.191
760.26742.50.21477.50.187
1000.264510.213101.330.185
1240.262720.21125.50.183
1480.261980.2081500.182
1720.2611250.2061740.182
1960.261500.205198.330.181
1740.204
2200.261980.204222.330.181
2220.204
2420.262440.204244.330.181 d f , Final Indentation Depth
Table 6. Variable values of fitting curve equation for 30 J, 40 J, and 50 J impact cases.
Impact EnergyA1t1A2t2y0Adj.
R-Squared
50 J Case0.049183.483850.0391044.228150.259790.99989
40 J Case0.011350.784060.0232054.841340.203550.99823
30 J Case0.010740.744170.0261452.477420.180740.99644
Table 7. Impactor velocities for different impact energies.
Impact Energy (J)
504030
Velocity
(m/s)
4.4721359554.003.464101615
Table 8. Summary of both types of simulation for each impact case.
Impact CaseABAQUS Explicit AnalysisABAQUS Standard Analysis
Loading Step Time
(ms)
Max Pressure
(Pa)
Initial Indentation Depth
(mm)
Rebound Step Time
(h)
Final Indentation Depth
(mm)
Case I: 50 J0.1554.8 × 1080.3482420.260
Case II: 40 J0.1194.4 × 1080.2382440.204
Case III: 30 J0.1264.1 × 1080.218244.330.181
Table 9. Viscoelastic material properties for each impact case.
Impact CaseMaterial Type1st Maxwell Chain2nd Maxwell Chain
Time 1
(h)
Value 1
(GPa)
Time 2
(h)
Value 2
(GPa)
Case I: 50 JUD Laminae Ply240100142 × 107
Cohesive Interface240 K Value 1 G Value 114 K Value 2 G Value 2
55.2089.3311.68 × 1082.85 × 107
Case II: 40 JUD Laminae Ply240100212 × 107
Cohesive Interface24055.2089.331211.93 × 1083.27 × 107
Case III: 30 JUD Laminae Ply240100162 × 107
Cohesive Interface24055.2089.331162.15 × 1083.64 × 107
Table 10. Comparison between experimental and simulation results.
Impact Energy CaseTotal Dent
Rebound
Δ d   =   ( d i d f )
(mm)
Way OutExperimental
Result
Simulation
Result
Prediction
Accuracy
Case I: 50 J0.088Initial and Final Dent DepthsMatchedMatchedAccurately predicted
Dent Rebound PathThe curve decays at a faster rate and soon stops decaying before the final pointThe curve decays at a slower rate and never stops decaying until the final pointPoor prediction
Max error: 19.35%
Case II: 40 J0.034Initial and Final Dent DepthsMatchedMatchedAccurately predicted
Dent Rebound PathThe curve decays at a faster rate and soon stops decaying before the final pointThe curve decays at a slower rate and never stops decaying until the final pointFairly Iinaccurate Prediction
Max error: 7.97%
Case III: 30 J0.037Initial and Final Dent DepthsMatchedMatchedAccurately predicted
Dent Rebound PathThe curve decays at a faster rate and soon stops decaying before the final pointThe curve decays at a slower rate and never stops decaying until the final pointFairly inaccurate prediction
Max error: 9.88%
Publisher’s Note: MDPI stays neutral with regard to jurisdictional claims in published maps and institutional affiliations.