
Stealthy Configuration Optimization Design and RCS Characteristics Study of Microsatellite


Abstract
1. Introduction
2. Theoretical Basis
2.1. RCS Numerical Calculation Method
2.2. Anechoic Chamber RCS Measurement Method
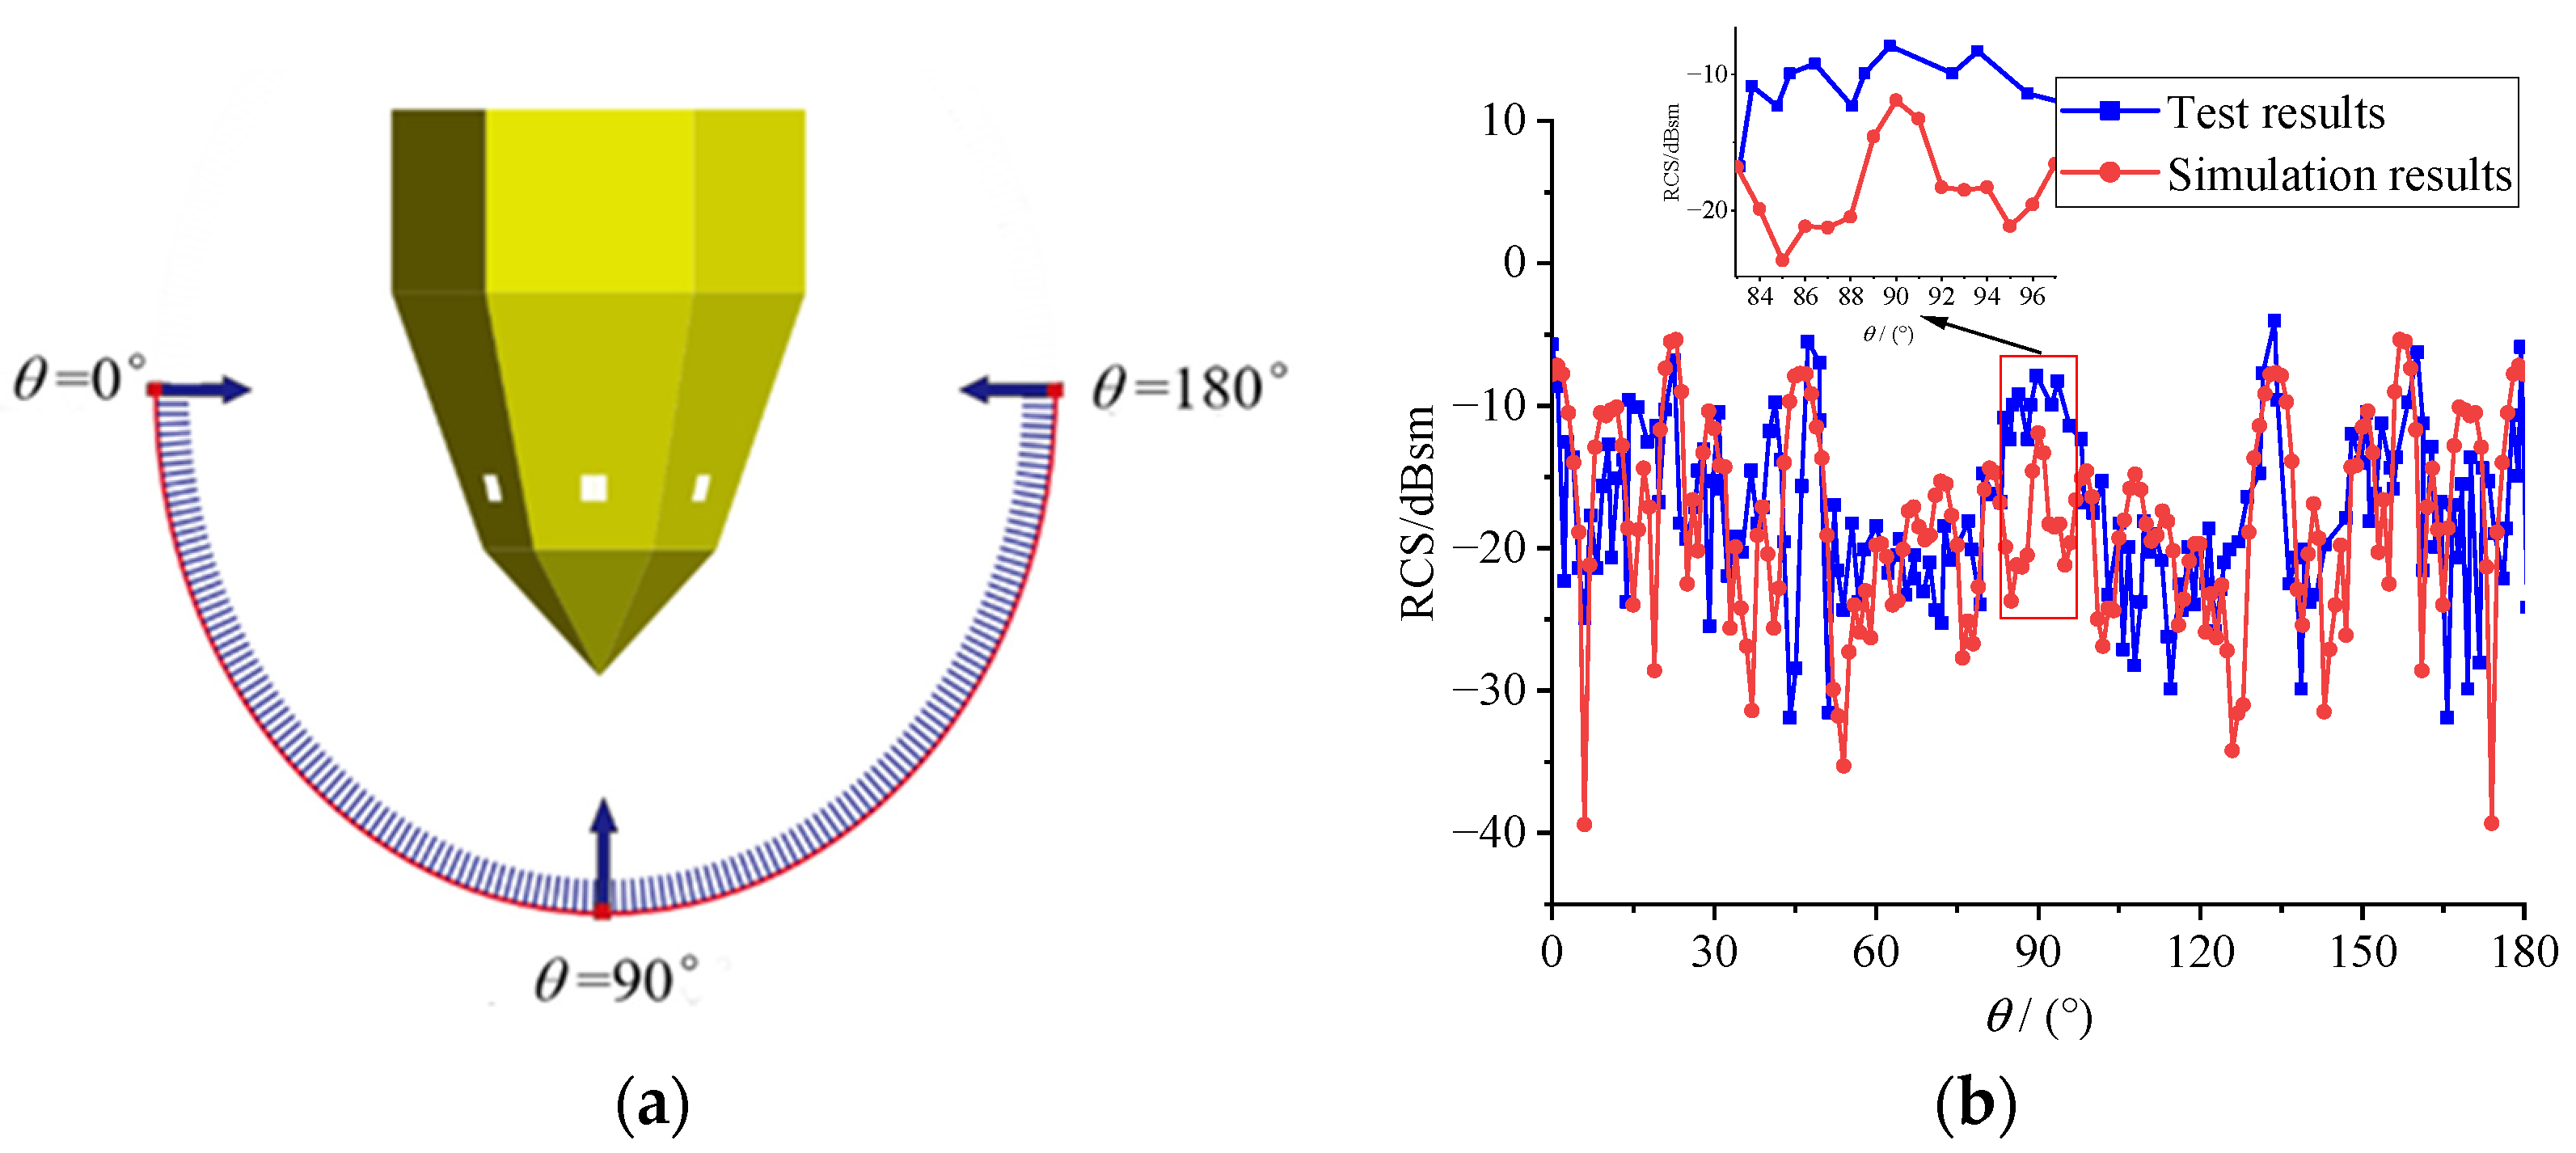
3. Stealthy Satellite Anechoic Chamber Test Verification
4. Stealthy Configuration Optimization Design of TX-1
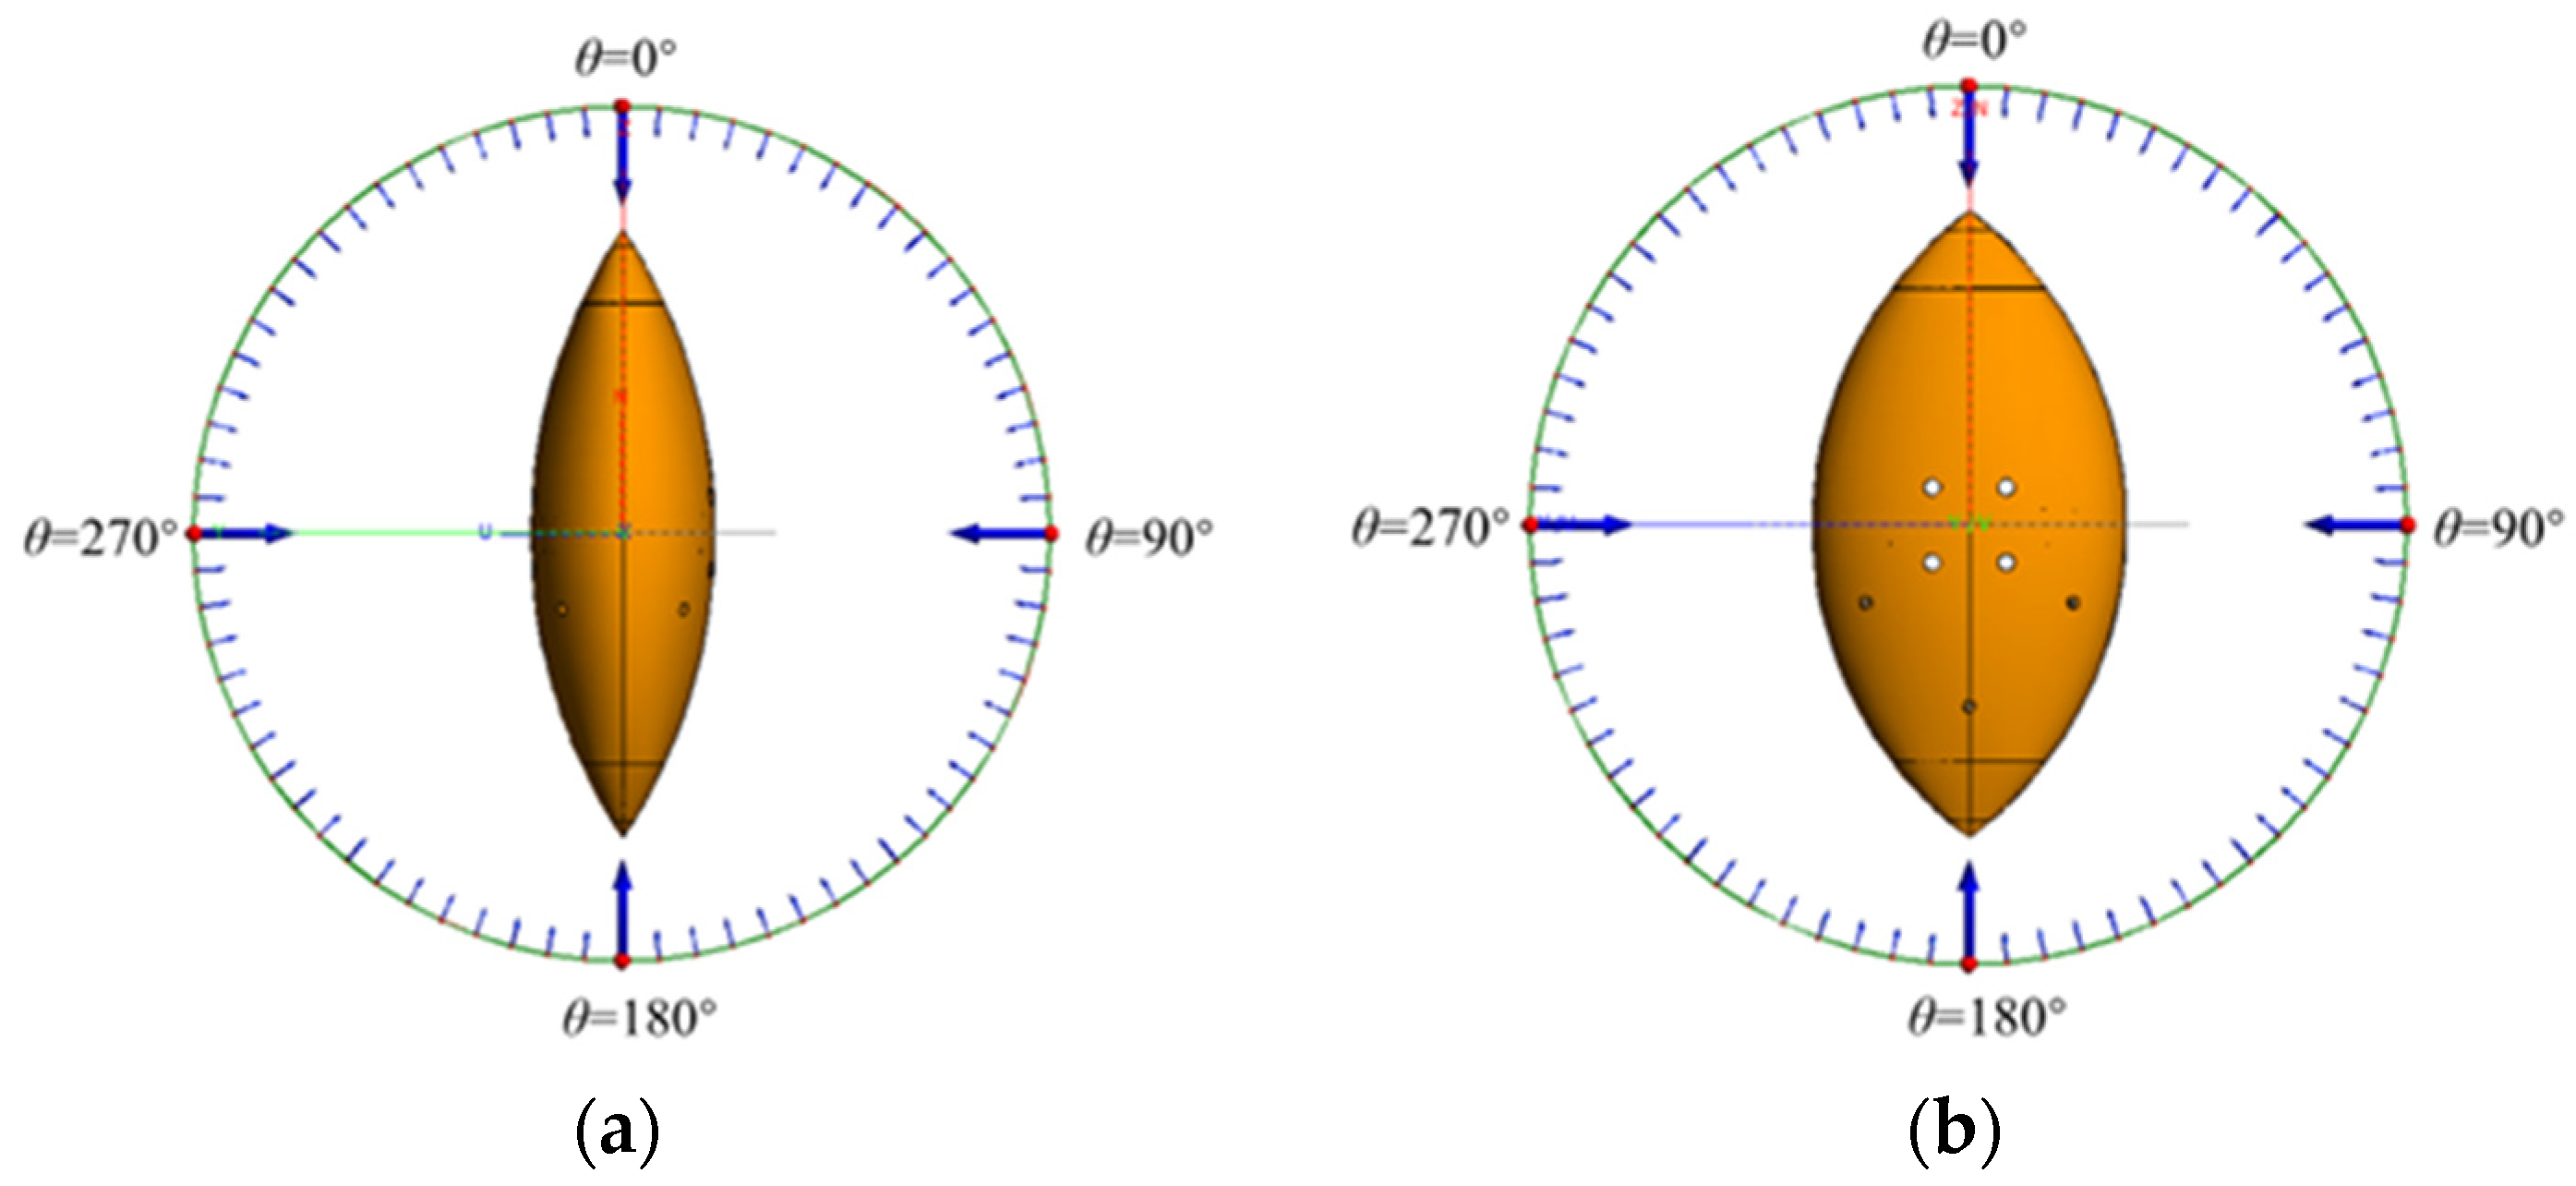
4.1. Optimal Design of Satellite Body
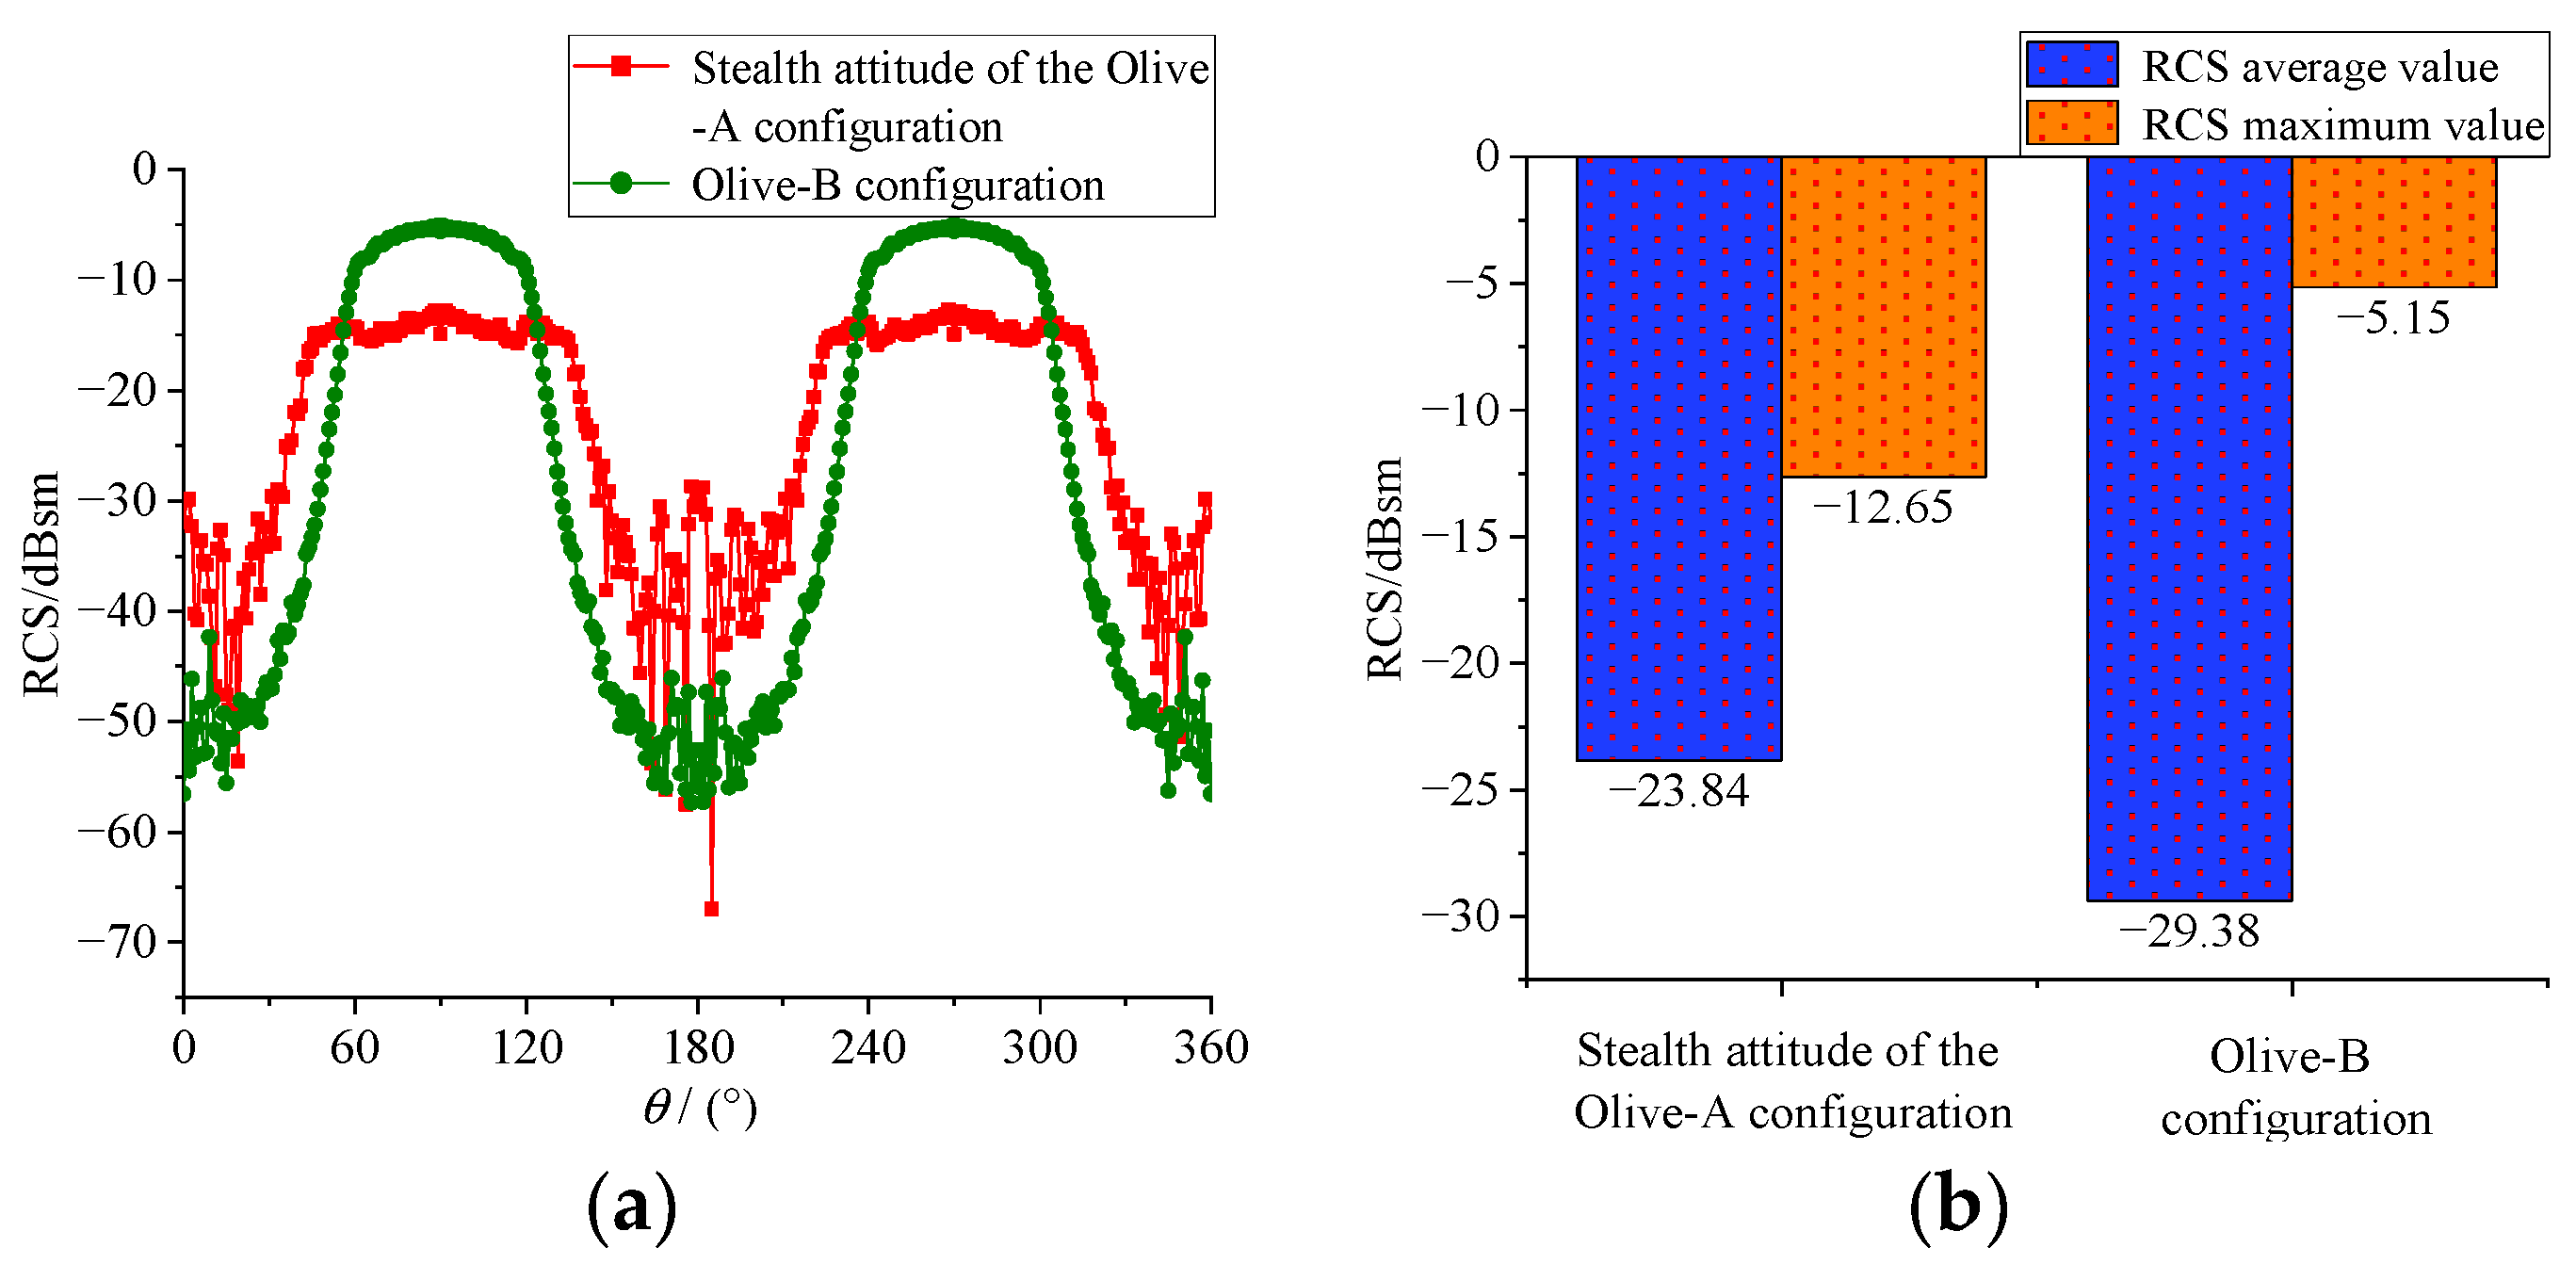
4.2. Olive-B Configuration Satellite Anechoic Chamber Test Verification
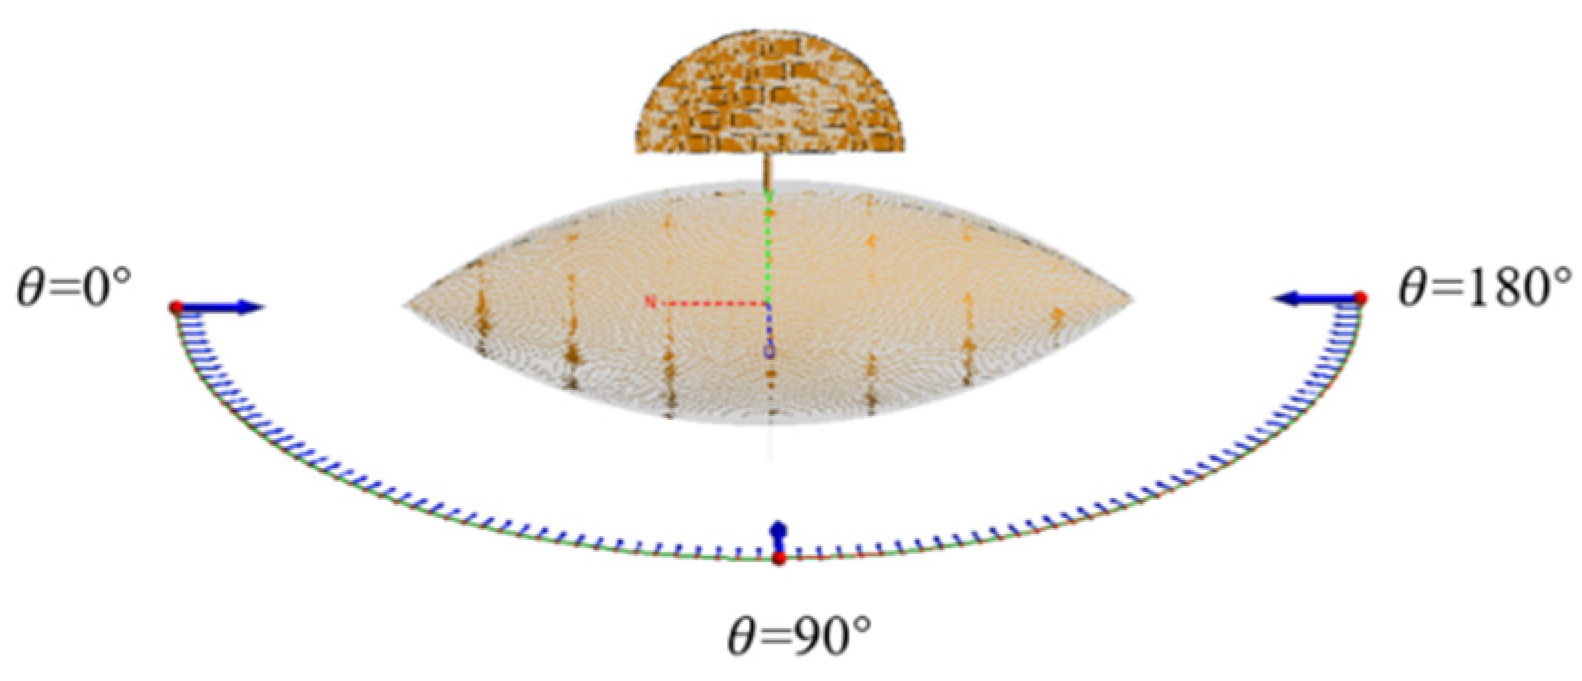
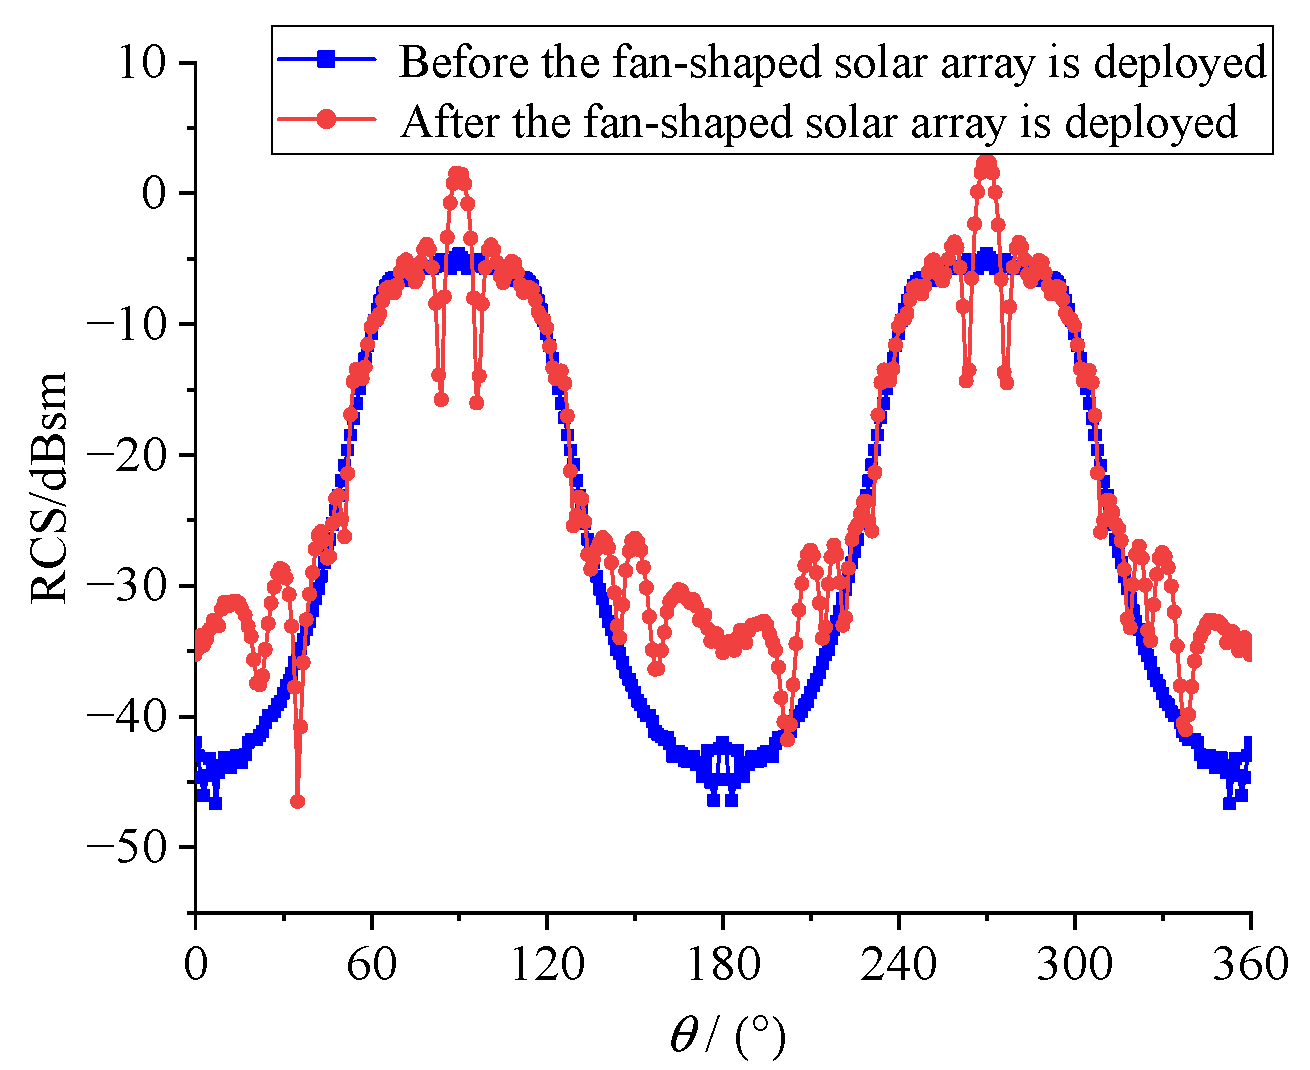
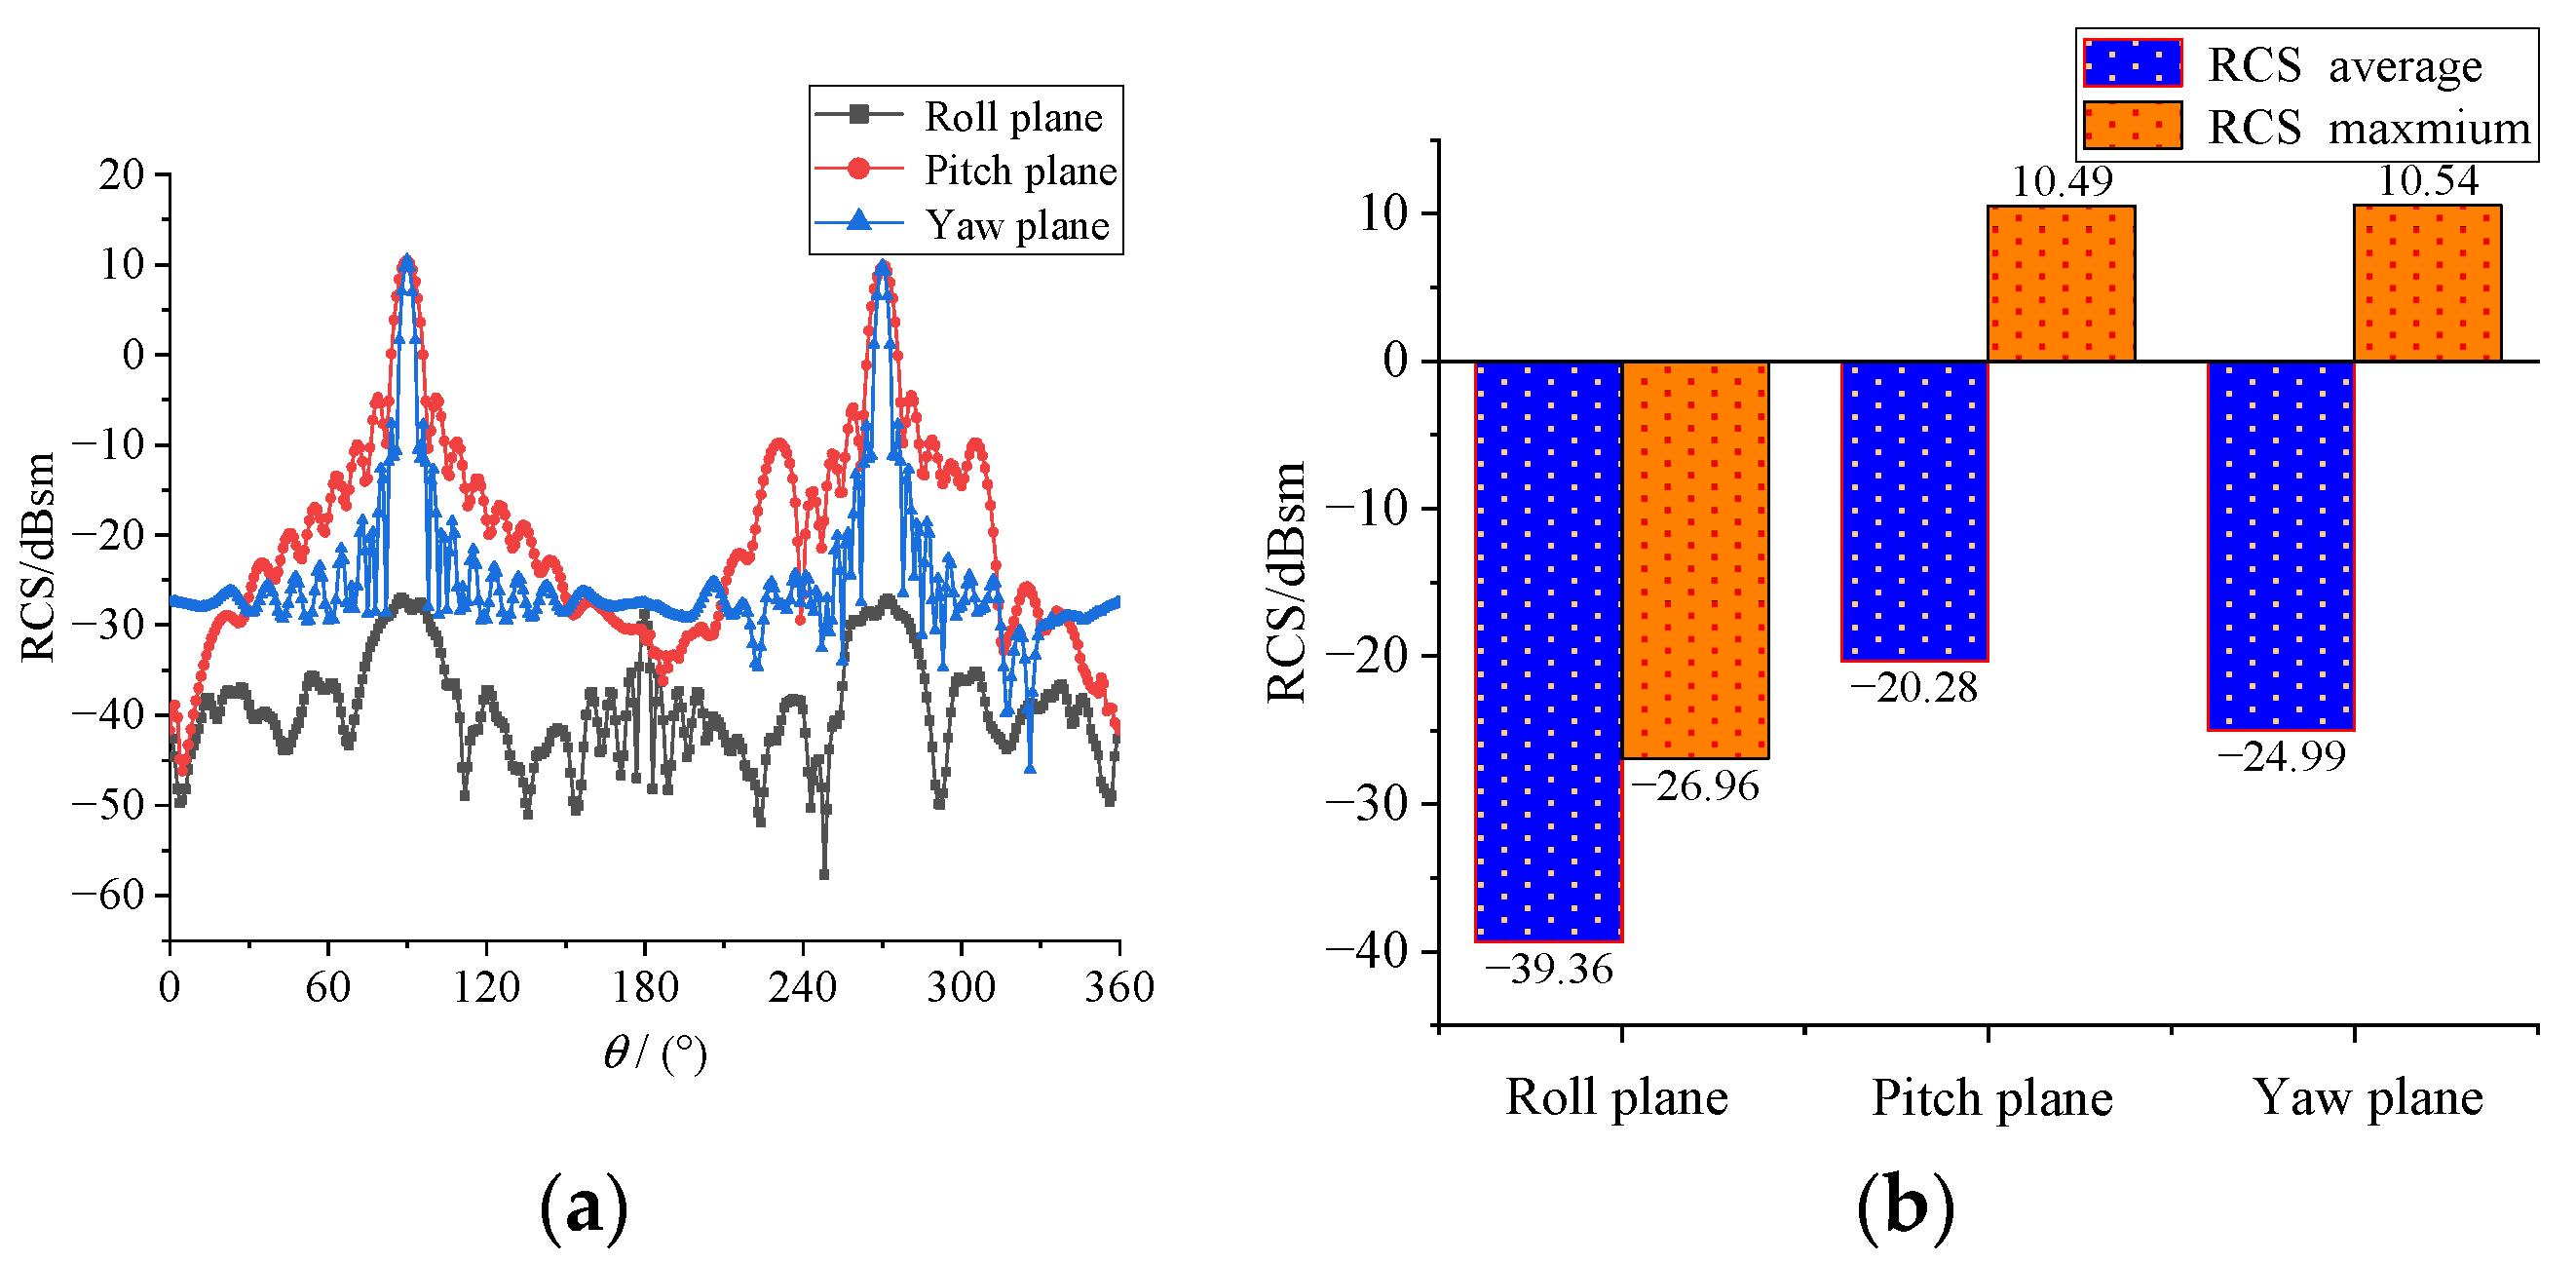
4.3. Stealth Design of Satellite Solar Array
4.4. Radar Maximum Detection Distance Analysis
- (1)
- The probabilities of the three stealth satellites being detected by enemy radars at different frequencies are also quite different. Among them, the L-band has the highest probability of being detected by the radar, and the C, X, and Ku-bands have a higher probability of being detected by the radar.
- (2)
- The probability of different satellite stealth configurations being detected by radar is affected differently by the frequency. The probability of the multi-faceted stealth configuration (TX-1) being detected by radar will change significantly with the increase in frequency, while the two Olive configurations are less affected by frequency, especially the Olive-B configuration.
- (3)
- Under the irradiation of a certain pulse Doppler radar of six frequencies with a probability of finding a target of 10%, the radar maximum detection distance of TX-1 reaches a maximum of 61.91 km at 1 GHz (L-band), and at 10 GHz (X-band) the minimum value is 13.52 km. The radar maximum detection distance of the Olive-A configuration non-stealth attitude reaches a maximum value of 48.10 km at 1 GHz (L-band) and a minimum value of 9.28 km at 16 GHz (Ku-band). The radar maximum detection distance in the stealth attitude of Olive-A configuration reaches a maximum value of 40.95 km at 1 GHz (L-band) and a minimum value of 8.14 km at 13 GHz (Ku-band). The radar maximum detection range of the Olive-B configuration reaches a maximum of 24.80 km at 1 GHz (L-band) and a minimum of 6.27 km at 16 GHz (Ku-band). The radar maximum detection distance of the Olive-B obtained by configuration optimization is smaller than that of the other two stealth configurations in each frequency band, and it generally shows a downward trend with the increase in the incident wave frequency. To sum up, the stealth performance of satellites at high frequencies is better than that at low frequencies, which also shows that how to deal with threats from low-frequency and long-range early warning radars is the key to improving the in-orbit survivability of olive stealth satellites.
5. Conclusions
- (1)
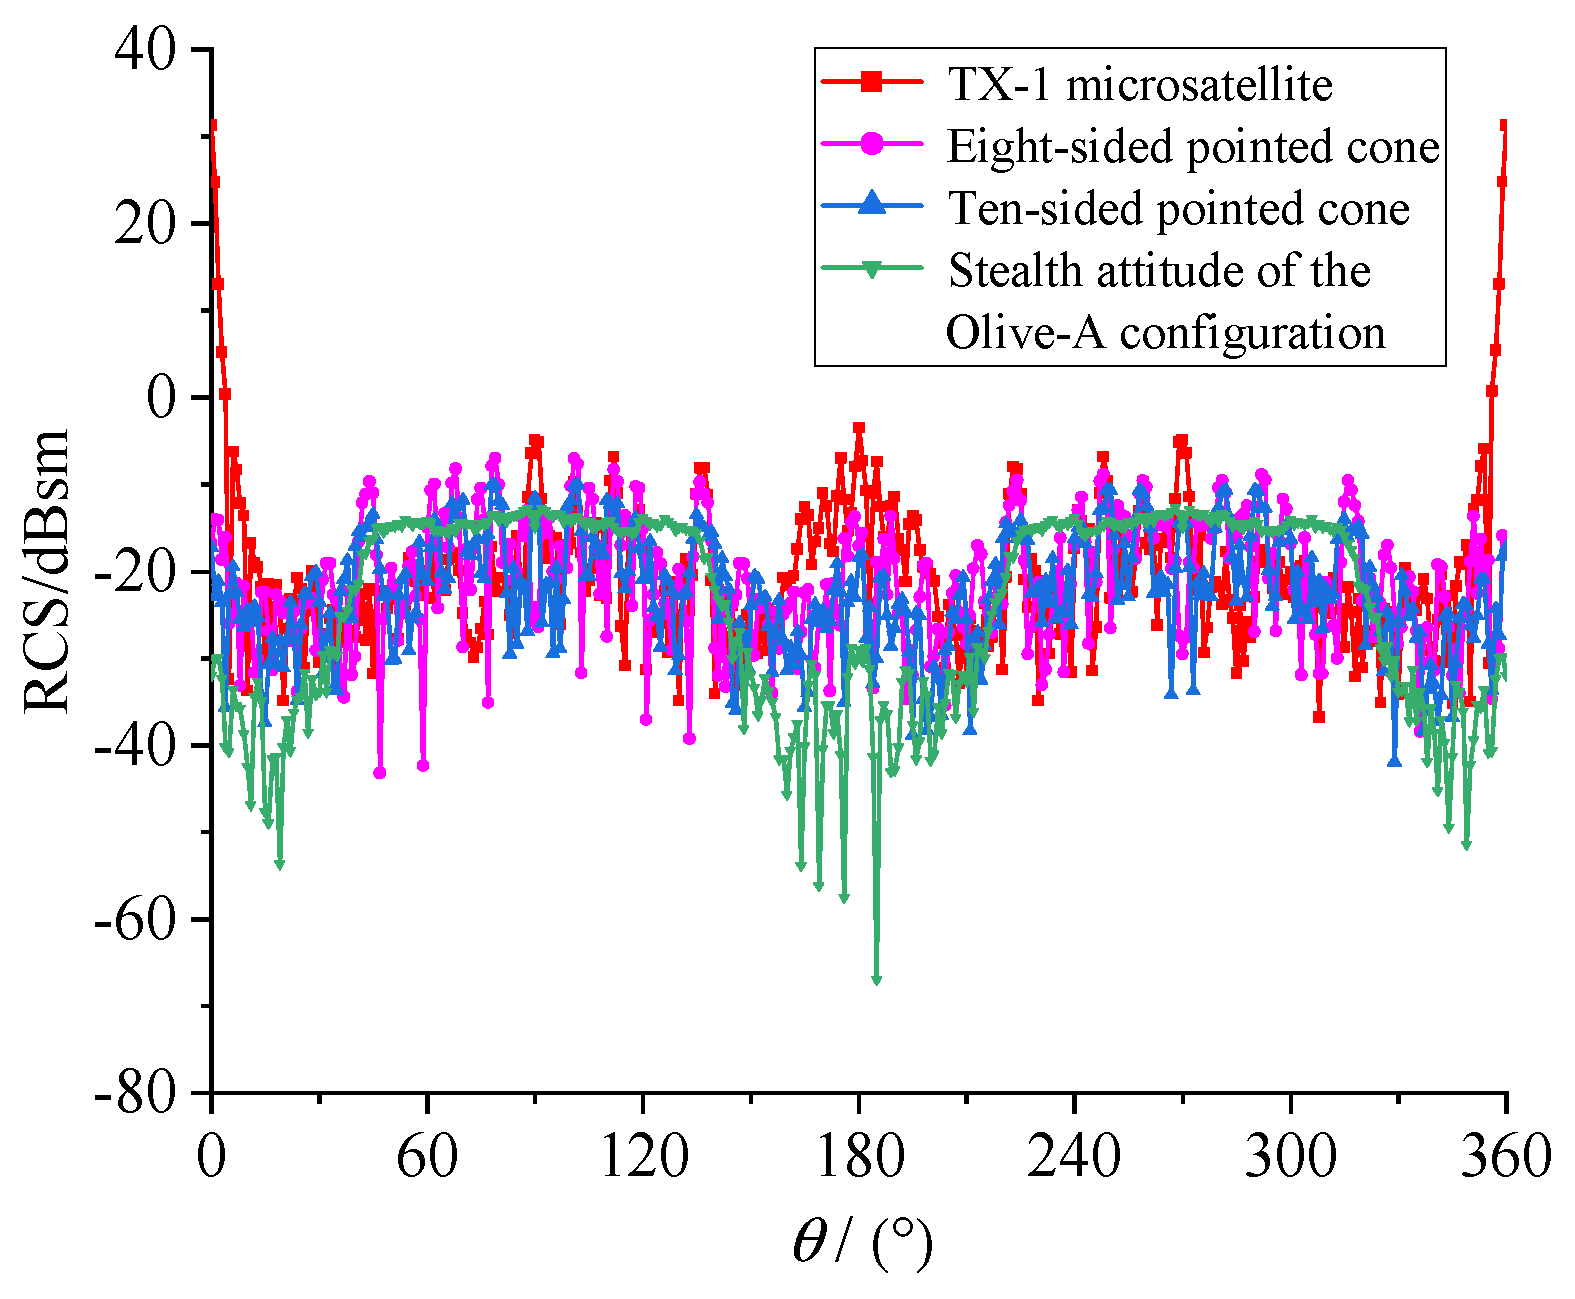
- Under the same electrical size, the average RCS of the Olive configuration is significantly lower than that of the multifaceted stealth configuration, the number of scattering peaks is also lower, and the overall stealth performance is more prominent.
- (2)
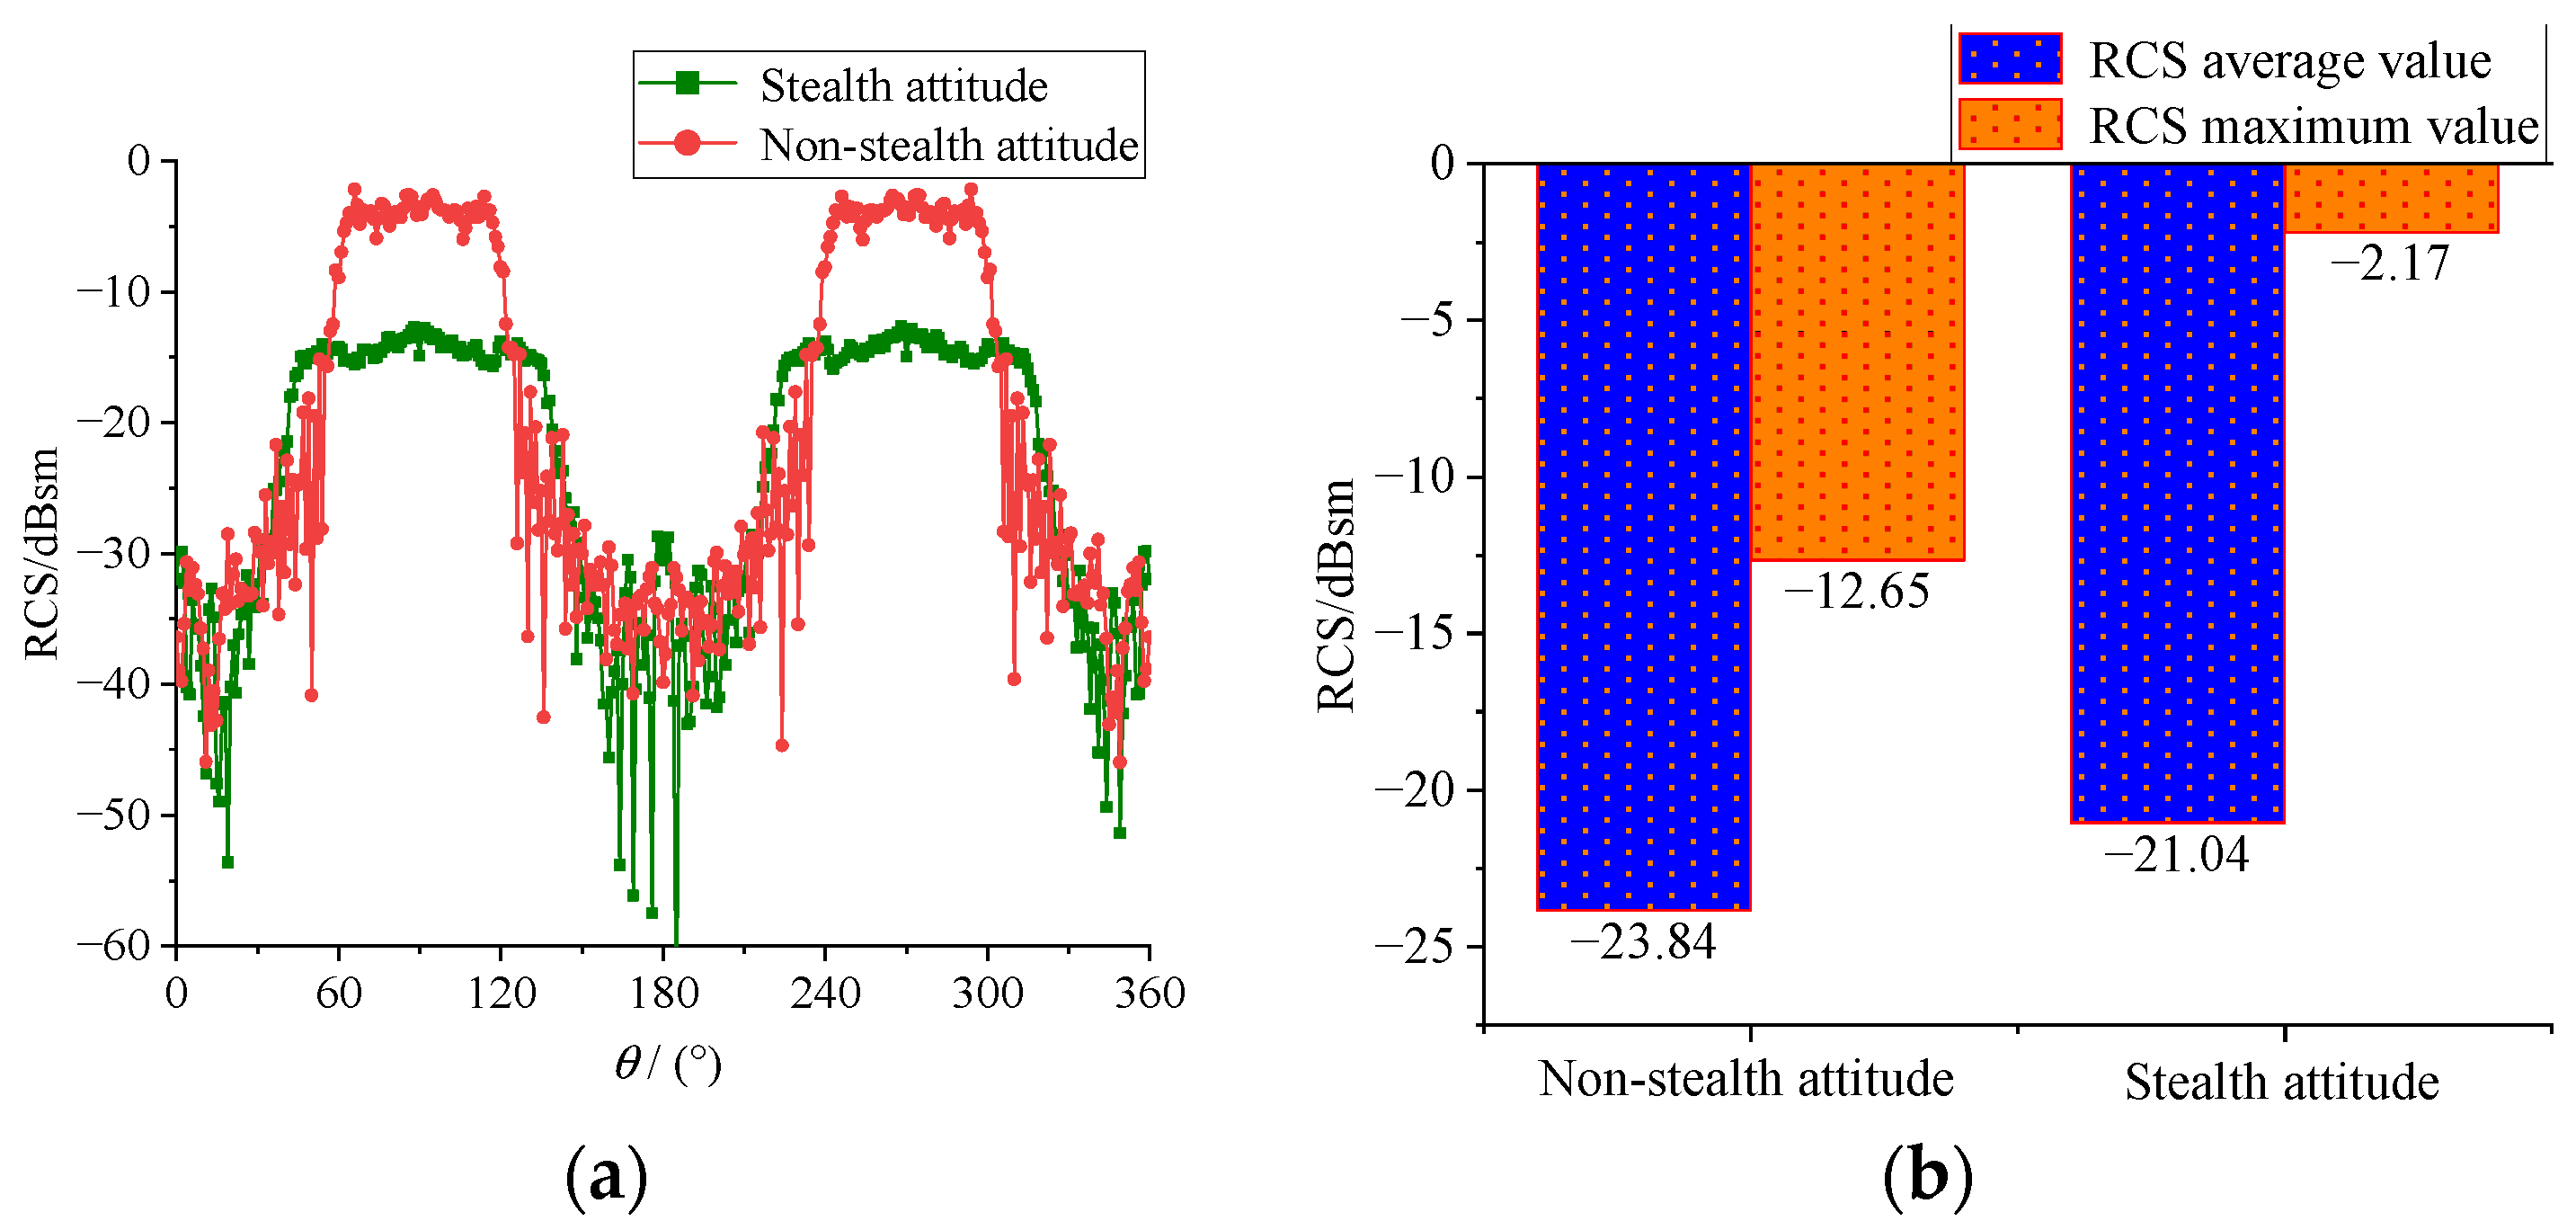
- After the fan-shaped solar array is deployed, the RCS of the olivine satellite only increases to a certain extent in a few angular domains, and the RCS changes very little in most angular domains, which has little impact on the stealth performance of the satellite. When the rotation angle of the fan-shaped solar array is 0°, the mean and maximum value of satellite RCS reach the minimum.
- (3)
- The maximum radar detection distance of Olive-B configuration in each band is smaller than that of Olive-A and TX-1, and it generally declines with the increase in the incident frequencies. In terms of radar stealth performance, Olive-B is the best, followed by Olive-A, and TX-1 is the worst.
Author Contributions
Funding
Data Availability Statement
Conflicts of Interest
References
- Huang, H. Concept study on satellite stealth. Aerosp. Electron. Warf. 2010, 6, 009. [Google Scholar]
- Wang, C.; Liao, W. Current status of stealth satellites and their applications in space offense and defense. Space Electron. Countermeas. 2011, 27, 17–19. [Google Scholar]
- Hu, H.; Zhang, X.; Liao, W.; Kong, X. Research progress and development trend of satellite stealth technology. J. Natl. Univ. Def. Technol. 2021, 43, 107–127. [Google Scholar]
- Zheng, K. Research on the Key Technology of Stealthy Microsatellite Structure Design; Nanjing University of Aeronautics and Astronautics: Nanjing, China, 2011. [Google Scholar]
- Sang, J. Stealth Technology of Flying Vehicles; Aviation Industry Press: Beijing, China, 2013. [Google Scholar]
- Morton, E.; Karl, H.; Richard, H. Satellite Signature Suppression Shield. U.S. Patent US5345238, 6 September 1994. [Google Scholar]
- Chung, S.; Chuang, Y. Simulation on change of generic satellite radar cross section via artificially created plasma sprays. Plasma Sources Sci. Technol. 2016, 25, 35–50. [Google Scholar] [CrossRef]
- Zhu, D.; Zhang, Z.; Zhao, C.; Liu, Y. A satellite configuration design to achieve optical stealth. Space Control Technol. Appl. 2017, 43, 61–66. [Google Scholar]
- Gong, J.; Ding, F. Study on the extraction of scattering characteristics of optical/infrared reconnaissance satellite targets. Infrared Laser Eng. 2017, 46, 193–198. [Google Scholar]
- Zhou, Z.; Huang, J.; Yi, M. Comprehensive optimization of aerodynamic noise and radar stealth for helicopter rotor based on pareto solution. Aerosp. Sci. Technol. 2018, 82–83, 607–619. [Google Scholar] [CrossRef]
- Xiao, H.; Liu, L.; Lv, M. Simulation of stealth characteristics of X-tail airship near space. J. Beijing Univ. Aeronaut. Astronaut. 2015, 41, 181–186. [Google Scholar]
- Qin, Y.; Sun, H.; Yue, X. Effect of coated radar absorbing materials on electromagnetic stealth performance of warplanes. J. Microwave J. 2021, 37, 249–252. [Google Scholar]
- Yue, K.; Liu, W.; Li, G. Numerical simulation of RCS for carrier electronic warfare airplanes. Chin. J. Aeronaut. 2015, 28, 545–555. [Google Scholar] [CrossRef]
- Zhou, Z.; Huang, J. Study of RCS characteristics of tilt-rotor aircraft based on dynamic calculation approach. Chin. J. Aeronaut. 2022, 35, 426–437. [Google Scholar]
- Zhou, Z.; Huang, J.; Wu, N. Acoustic and radar integrated stealth design for ducted tail rotor based on comprehensive optimization method. Aerosp. Sci. Technol. 2019, 92, 244–257. [Google Scholar] [CrossRef]
- Wu, A.; Wu, Y.; Yang, Y.; Zhang, N. The method of moments physical optics hybrid algorithm to calculate the electromagnetic scattering field of multiscale compound targets. Chin. J. Radio Sci. 2019, 34, 83–90. [Google Scholar]
- Zhao, W.; Li, J.; Hu, L. Efficient current-based hybrid analysis of wire antennas mounted on a large realistic aircraft. IEEE Trans. Antennas Propag. 2010, 58, 2666–2672. [Google Scholar] [CrossRef]
- Qin, Y.; Sun, H.; Yue, X. Stealthy configuration design and optimization analysis of microsatellite. J. Beijing Univ. Aeronaut. Astronaut. 2022, 48, 2102–2110. [Google Scholar]
- Yue, K. Static and Dynamic RCS Characteristics of Combat Aircraft; Beihang University Press: Beijing, China, 2016. [Google Scholar]
- Jiang, X. Integrated Optimization Design and Application of Helicopter Aerodynamic/Radar Stealth Characteristics; Nanjing University of Aeronautics and Astronautics: Nanjing, China, 2016. [Google Scholar]


| Parameter Items | Length/m | Width/m | Height/m | In-Orbit Quality/kg | Altitude of the Orbit/km | Type of Launch Rockets | Location of the Launch |
|---|---|---|---|---|---|---|---|
| Parameter Value | 0.694 | 0.608 | 0.995 | 61 | 495 | CZ-4B | Taiyuan Satellite Launch Center |
| Satellite Configurations | RCS Mean Values /dBsm | RCS Maximum Values /dBsm |
|---|---|---|
| TX-1 | −20.19 | 31.32 |
| Eight-sided pointed cone | −21.05 | −7.01 |
| Ten-sided pointed cone | −22.30 | −10.06 |
| Olive-A | −23.84 | −12.65 |
| Parameter Items | Length/m | Width/m | Height/m | Distance between Antenna and Target/m | Antenna Gain/dB | Antenna Flap Width/° | Antenna Aperture/m |
|---|---|---|---|---|---|---|---|
| Parameter Value | 0.82 | 0.30 | 0.30 | 3.5 | 12.9 | 38.25° | 0.12 |
| Parameter Item | Parameter Value |
|---|---|
| (°) | 7 |
| 300 | |
| (°/s) | 30 |
| (MW) | 1 |
| (dB) | 36 |
| 900 | |
| (MHz) | 0.077 |
| (dB) | 55 |
| (dB) | 20 |
| f/GHz | Radar Maximum Detection Distance /km | |||
|---|---|---|---|---|
| TX-1 | Non-Stealthy Attitude of the Olive-A | Stealthy Attitude of the Olive-A | Olive-B | |
| 1 GHz | 61.91 | 48.10 | 40.95 | 24.80 |
| 4 GHz | 22.91 | 26.31 | 23.98 | 19.51 |
| 7 GHz | 15.43 | 14.07 | 11.31 | 9.94 |
| 10 GHz | 13.52 | 12.95 | 11.15 | 7.91 |
| 13 GHz | 14.15 | 10.23 | 8.14 | 7.15 |
| 16 GHz | 17.83 | 9.28 | 8.93 | 6.27 |
Publisher’s Note: MDPI stays neutral with regard to jurisdictional claims in published maps and institutional affiliations. |
© 2022 by the authors. Licensee MDPI, Basel, Switzerland. This article is an open access article distributed under the terms and conditions of the Creative Commons Attribution (CC BY) license (https://creativecommons.org/licenses/by/4.0/).
Share and Cite
Sun, H.; Qin, Y. Stealthy Configuration Optimization Design and RCS Characteristics Study of Microsatellite. Aerospace 2022, 9, 815. https://doi.org/10.3390/aerospace9120815
Sun H, Qin Y. Stealthy Configuration Optimization Design and RCS Characteristics Study of Microsatellite. Aerospace. 2022; 9(12):815. https://doi.org/10.3390/aerospace9120815
Chicago/Turabian StyleSun, Hanqing, and Yuantian Qin. 2022. "Stealthy Configuration Optimization Design and RCS Characteristics Study of Microsatellite" Aerospace 9, no. 12: 815. https://doi.org/10.3390/aerospace9120815
APA StyleSun, H., & Qin, Y. (2022). Stealthy Configuration Optimization Design and RCS Characteristics Study of Microsatellite. Aerospace, 9(12), 815. https://doi.org/10.3390/aerospace9120815