Article

Development of Impact Test Device for Pyroshock Simulation Using Impact Analysis

Department of Aerospace Engineering, University of Ulsan, Ulsan 44610, Korea
*
Author to whom correspondence should be addressed.
Aerospace 2022, 9(8), 407; https://doi.org/10.3390/aerospace9080407
Submission received: 18 June 2022 / Revised: 24 July 2022 / Accepted: 26 July 2022 / Published: 28 July 2022
(This article belongs to the Section Astronautics & Space Science)

Abstract

:
Pyrotechnic-separation devices are widely used in the separation mission of satellites and projectiles. The pyroshock generated by the pyrotechnic-separation device can cause serious damage to surrounding electronic equipment owing to its high-frequency characteristics, which leads to mission failure. Therefore, solving the pyroshock problem is necessary. Typically, attenuation of the pyroshock propagation based on the understanding of the shock-propagation characteristics of a structure is possible. However, as pyrotechnics (or explosives) cannot be used for every pyroshock-propagation experiment due to the high cost and risk, a device for simulating a pyroshock environment that does not use pyrotechnics is required. In this study, a pyroshock simulator was developed, which could generate the desired shock environment by controlling shock environment-generation variables and be tested for any test structure. For this purpose, a resonator attached to the test structure and a pneumatic launch device was designed and fabricated. A resonator that generates a desired shock environment was designed by predicting the shock generation through impact analysis. A pyroshock simulator that generates a shock like an actual pyroshock was developed through comparison with the shock-response spectrum of a pyrotechnic initiator. The repeatability was verified, and the frequency and magnitude of the shock generated by the pyroshock simulator could be controlled by adjusting the collision velocity of the steel ball and the thickness of the resonator disk.

1. Introduction

Pyrotechnic-separation devices have been widely used to perform separation by detonating explosives inside a device for the separation mission of satellites or projectiles [1,2]. The explosion of the pyrotechnic-separation devices instantaneously generates a pyroshock of wide frequency and high acceleration in the surrounding structure. The pyroshock is classified as near-, mid-, and far-field according to the distance from the source, the magnitude of the shock, and the frequency of the shock [3]. Further, the pyroshock has a small displacement; therefore, damage to the surrounding structure itself rarely occurs. However, a high-frequency shock may cause critical damage to surrounding electronic equipment [4]. To solve the pyroshock problem, many studies have been conducted on pyroshock generation using pyrotechnic devices. For example, the pyroshock generated by explosive bolts [5] and separation nuts [6] was numerically predicted and experimentally measured. Furthermore, the generated pyroshock was reduced by optimizing the quantity of explosives [7]. However, as eliminating the pyroshock is impossible, evaluating the survivability of electronic equipment against pyroshock is essential. Moreover, owing to the low repeatability, high risk, and high cost of pyrotechnic devices, developing a pyroshock simulator that does not use explosives is necessary.
Commonly used pyroshock simulation methods include drop test, electromagnetic exciter, and the mechanical-impact technique [8]. A drop test-based simulator creates a shock through the free fall of a striking body. This generates a low-frequency shock; therefore, it is unsuitable for simulating a high-frequency pyroshock. An electromagnetic exciter is suitable for repeated testing, but it also has a disadvantage in that high-frequency excitation is difficult. The mechanical-impact technique is a method that uses a launch device or a pendulum to create a collision between metal and metal, thereby simulating a pyroshock. The shock generated using this method is similar to the mid-field pyroshock, with a frequency of 3–10 kHz and an acceleration amplitude of 1000 g to 10,000 g; moreover, it is in a frequency band that mainly damages electronic equipment [9,10]. Therefore, in this study, a mechanical-impact method that could create a critical mid-field pyroshock environment was adopted. As shown in Figure 1, a device that generates a shock by pneumatically firing a projectile (or steel ball) and striking a resonator was designed. In this device, a desired shock environment can be generated by using various shock environment-generation variables.
The common pyroshock simulator is a device developed for certification testing of electronic equipment. It is a very large device and unsuitable for the excitation of a specific location on the test structure. Therefore, Bateman et al. [8] devised a method of excitation with small circular structures for pyroshock-propagation experiments, as shown in Figure 2a, which facilitated shock-propagation testing in any test structure. However, the resonator shown in Figure 2a cannot generate a point-source shock, and the region inside the resonator is not suitable for the shock test because of the interference of the stress wave. Therefore, shock-propagation test devices capable of generating a point-source shock have recently been developed. For example, if a rod-shaped resonator is used, a point-source shock-propagation test device having a simple shape as shown in Figure 2b can be designed [11]. However, because the resonator is long, vibration occurs in the bending as well as longitudinal mode. Accordingly, shock from undesired directions and of unwanted frequencies may occur. The breech method uses a shock-test device in which the launch device and resonator are integrated [12]. As shown in Figure 2c, the diaphragm blocks the inlet of the chamber, the chamber is filled with air, and the striking body is fired at the pressure at which the diaphragm bursts to collide with the resonator. This method has poor repeatability because the diaphragm does not always burst at the same pressure and does not rupture uniformly depending on its condition. In addition, owing to the integrated structure, unnecessary vibration modes may be measured, and the diaphragm must be replaced for every trial. To overcome this limitation, a shock-test device in which the launch device and resonator are separated, as shown in Figure 2d, was developed [13]. In this case, only vibration modes of the resonator and test structure exist, and unnecessary vibration modes do not occur. By changing the thickness of the resonator disk and the number of bridges as design variables, the natural frequency of the resonator and the frequency characteristics of the shock are adjusted. However, designing and manufacturing a disk having a desired natural frequency are difficult because of its complex shape and nonlinearity. In addition, to generate a natural frequency of 3 kHz or less with the resonator, its thickness should be less than 1.5 mm. Consequently, there is a possibility of damage to the resonator. Moreover, as the launch device fires steel balls by compressing air through manual power, repeating the shock test is difficult.
If near-field pyroshock experiments are needed, actual pyrotechnic devices should be used [8]. If the desired result can be obtained by testing only a part of the structure or the payload, scaled tests using a small quantity of explosives can be performed. If an experiment on the entire structure is required, full-scale tests using the actual structure and the pyrotechnic device should be performed. These tests are often performed at the final stage of system development because the structure is damaged, and a lot of expenditure is required.
In this study, the configuration of the resonator is improved and a pneumatic launch device is developed to compensate for the shortcomings of the preceding devices. Accordingly, a shock-propagation test device capable of generating various shock environments in an arbitrary test structure is developed. The shock-propagation test device (or pyroshock simulator) is developed to simulate the shock environment of a pyrotechnic initiator. The shock is generated by colliding a steel ball with the resonator attached to the test structure, and a resonator having the same natural frequency as the knee frequency of the shock-response spectrum of the pyrotechnic initiator is designed. By performing an impact analysis in which the steel ball collides with the resonator attached to an aluminum plate, the generation of a desired shock environment is predicted. Based on this prediction, it is verified that a shock environment like that of the pyrotechnic initiator is generated by fabricating the shock-propagation test device and performing an impact test. Finally, it is shown that various shock environments can be created by adjusting the magnitude of the shock level and the knee frequency of the shock-response spectrum by changing the collision velocity of the steel ball and the thickness of the resonator.

2. Development of Pyroshock Simulator

2.1. Shock Environment Variables

The quantification standard mainly used to evaluate pyroshock is the shock-response spectrum (SRS). SRS is a graph that calculates the response of numerous single-degree-of-freedom (SDOF) systems when a shock is applied, as shown in Figure 3. Maximax SRS uses the absolute value of the peak response of an SDOF system and is mainly used to evaluate pyroshock. The SRS of a typical pyroshock is shown in Figure 4. The main features of SRS include octave slope, knee frequency, and plateau. This study proposes a method to change these features of the SRS of a pyroshock simulator as desired. First, by changing the energy scale, the acceleration magnitude of SRS can be changed, as given by Equation (1) [14]. In this study, the energy scale could be changed by adjusting the collision velocity of the steel ball.
S R S n ( d ) = S R S r ( d ) E n E r = S R S r ( d ) v n v r ,
where d is the distance between the point of impact and the measurement point. If the measurement point of SRS is fixed and the collision velocity of the steel ball is changed, the graph of SRS moves up and down in parallel, and the overall magnitude of acceleration changes. This variable is used to simulate the change in the shock magnitude due to the change in the quantity of explosive in the initiator.
Second, the desired shock can be generated only when the knee frequency of SRS is variable. The knee frequency of the shock generated by the mechanical-impact technique is equal to the natural frequency of the resonator. Therefore, if the natural frequency of the resonator can be adjusted, the knee frequency of the SRS can be adjusted, as shown in Figure 5. The knee frequency varies according to the characteristics of the pyrotechnic device and the distance from the pyrotechnic device. In addition, because each mounted electronic device has a different natural frequency, testing in a different shock environment is sometimes necessary. Therefore, optimal shock excitation is possible only when the knee frequency is variable.
In this study, the magnitude and knee frequency of SRS were appropriately adjusted by changing the collision velocity of the steel ball and the natural frequency of the resonator; further, based on this adjustment, a pyroshock simulator capable of simulating the desired shock environment was designed and fabricated. The performance of the pyroshock simulator was verified by simulating the shock environment of the pyrotechnic initiator (PC-800) [4]. This initiator is manufactured by Hanwha Corporation and generates 800 psi pressure for 10 cm3 volume using 210 mg of zirconium potassium perchlorate (ZPP). Figure 6 shows the average SRS of the pyrotechnic initiator measured three times using shock accelerometers (PCB 350B04). The knee frequency is approximately 7 kHz, and the peak acceleration varies depending on the measurement point, being approximately 4000 g at the 30 mm position.
The dotted line shown in Figure 7 denotes the test tolerance of NASA’s pyroshock environment based on the pyroshock test criteria (red line) [14]. It has a tolerance of ±6 dB in a shock environment below 3 kHz and +9/−6 dB above 3 kHz from the test criteria. The shock environment of the pyroshock simulator developed in this study was configured to satisfy these criteria.

2.2. Design of Resonator

A resonator with a natural frequency of 7 kHz was designed to simulate the SRS (shown in Figure 6) of the pyrotechnic initiator. To obtain a natural frequency of 7 kHz with a rod-shaped resonator [11], a resonator with a length of 350 mm is required according to Equation (2):
f n = E / ρ 2 L ,
where E is the modulus of elasticity, ρ is the density, and L is the length of the rod-shaped resonator. If the length is large, an unwanted vibration mode may occur; therefore, a disk-shaped resonator was designed. As the collision direction of the steel ball is the vertical direction of the disk, the primary mode shape of the test structure is excited. The natural frequency of a disk, simply supported around the circumference, is given by Equation (3) [15]:
f n = B 2 π E t 2 / ρ a 4 ( 1 ν 2 ) ,
where a is the disk diameter, t is the disk thickness, ν is the Poisson ratio, and B is the mode shape factor. The main factors affecting the natural frequency are the thickness and diameter of the disk. Adjusting the diameter changes the natural frequency; however, there is a limit to reducing or increasing the diameter. Therefore, the natural frequency was adjusted by fixing the diameter and changing only the thickness. For example, if the total diameter of the disk is 124 mm and the cover fixes the edge of the disk by 12 mm, the diameter of the unfixed part is 100 mm. When the diameter is 100 mm, the thicknesses of the disk generating the natural frequencies of 7 and 5 kHz are 7 and 5 mm, respectively.
As shown in Figure 8, the resonator is designed in a conical shape that reduces from the part where the disk is fixed to the part where the test structure is fixed to apply the point-source shock. The disk was fixed with 16 M4 bolts. The part fixed to the test structure had a diameter of 20 mm and was fixed with an M12 bolt.
Modal analysis was performed using ANSYS to confirm that the thickness designed using Equation (3) provided the desired natural frequency. The disk and cover of the resonator used hexahedron elements, bolts and lower fixing parts used tetrahedron elements, and the element size was set to 2 mm. It was analyzed using a free boundary condition. The shapes and natural frequencies of the first mode except for rigid-body modes are summarized in Figure 9. When the disk thickness is 5 and 7 mm, the natural frequencies are 4443.9 and 5743.5 Hz, respectively, which is different from the results of Equation (3). This is because, unlike Equation (3), which considers only the nonfixed portion of the disk (diameter of 100 mm), the cover and fixed disk portion cause an increase in the diameter. Therefore, the target natural frequency can be obtained by increasing the thickness of the disk. The final design value was determined through modal analysis. If the disk thickness is 6.0 and 9.8 mm, the resonators have natural frequencies of 5743 and 6982 Hz, respectively.

2.3. Impact Analysis Modeling

In this study, it was predicted whether the desired shock environment could be created by performing impact analyses prior to fabricating the pyroshock simulator. In addition, an attempt was made to determine design variables that provide a shock environment similar to that of the pyrotechnic initiator before device fabrication. For impact analysis, modeling was performed in ANSYS Explicit Dynamics suite and analysis was performed in AUTODYN. The shape of the 3D model is shown in Figure 10, and the numerical model comprises a projectile (a steel ball), a resonator, an aluminum plate (AL 6061-T6 1 m × 1 m × 5 mm), bolts, and nuts. The boundary condition of the aluminum plate was not given; hence, it was analyzed under a free boundary condition. To reduce the numerical analysis time, symmetric conditions were employed and only 1/4 of the entire structure was modeled and analyzed. The contact conditions between structures, except for the steel ball, were set to bonded, and the penalty method was used for the contact between the steel ball and resonator. In the penalty method, when two objects are in contact, penetration between objects is allowed in the numerical analysis. A local penalty force is calculated to separate the infiltrated nodes by pushing them apart. Accordingly, the reaction force between the two surfaces in mutual contact is calculated.
In this study, the shock equation of state (EOS) and Steinberg–Guinan strength model were used to analyze the propagation of shock waves generated by metal-to-metal collision. Shock EOS is a Mie–Gruneisen-type EOS with shock Hugoniot (subscript H) as a reference point, as in Equation (4), and is given by the relationship between density ( ρ ), pressure ( P ), and internal energy ( e ) [16,17]:
P P H = γ ρ ( e e H ) ,
where γ is the Gruneisen coefficient of the material. Shock Hugoniot shows a linear relationship between shock velocity ( U ) and particle velocity ( u ) of metallic materials, as given by Equation (5), where C 0 and s are empirical parameters:
U = C 0 + s u .
Analyzing the change in the state of a metallic material when a shock wave passes through it is possible. Therefore, it is suitable for the case where a shock wave is generated and propagated owing to a collision between metals, as in the present case. In addition, the Steinberg–Guinan strength model defines the yield stress and shear modulus as a function of effective strain, pressure, and internal energy (temperature) to increase analysis accuracy for high-speed behavior such as high-speed collisions. In the case of the pyroshock simulator in this study, there is no need to apply the failure and erosion models because the structure is not damaged or destroyed. Table 1 summarizes the material properties used for the numerical analysis.
For accurate shock-propagation analysis, the element size should be smaller than 1/10 of the stress wave wavelength [11]. In a thin plate, the stress wave propagates in the form of a Lamb wave [18]. The wavelength of the Lamb wave on an aluminum plate with a thickness of 5 mm varies according to frequency and has a value of approximately 82.3 mm for a 7 kHz vibration. Therefore, an element size of 8 mm or less is required. However, as the thickness of the plate was 5 mm, it was divided into four equal parts to make the element size 1.25 mm. Incidentally, when the mesh-convergence test is performed for stress-propagation analysis, the converged analysis result is obtained when the thickness is cut into quarters or more.
Static damping was used to model the damping in the shock-propagation process. It implements damping by penalizing the velocity at each time step as given by Equation (6).
x ˙ n + 1 / 2 = ( 1 2 π R d ) x ˙ n 1 / 2 + ( 1 π R d ) x ¨ n Δ t n
Therefore, the static damping coefficient R d should be determined considering the time step Δ t of the numerical analysis. R d is determined using Equation (7). Further, it is known that in the case of an aluminum plate with a thickness of 5 mm, if f is taken as 20 Hz, an appropriate level of damping is realized in the shock-propagation analysis [4].
R d = 2 Δ t f

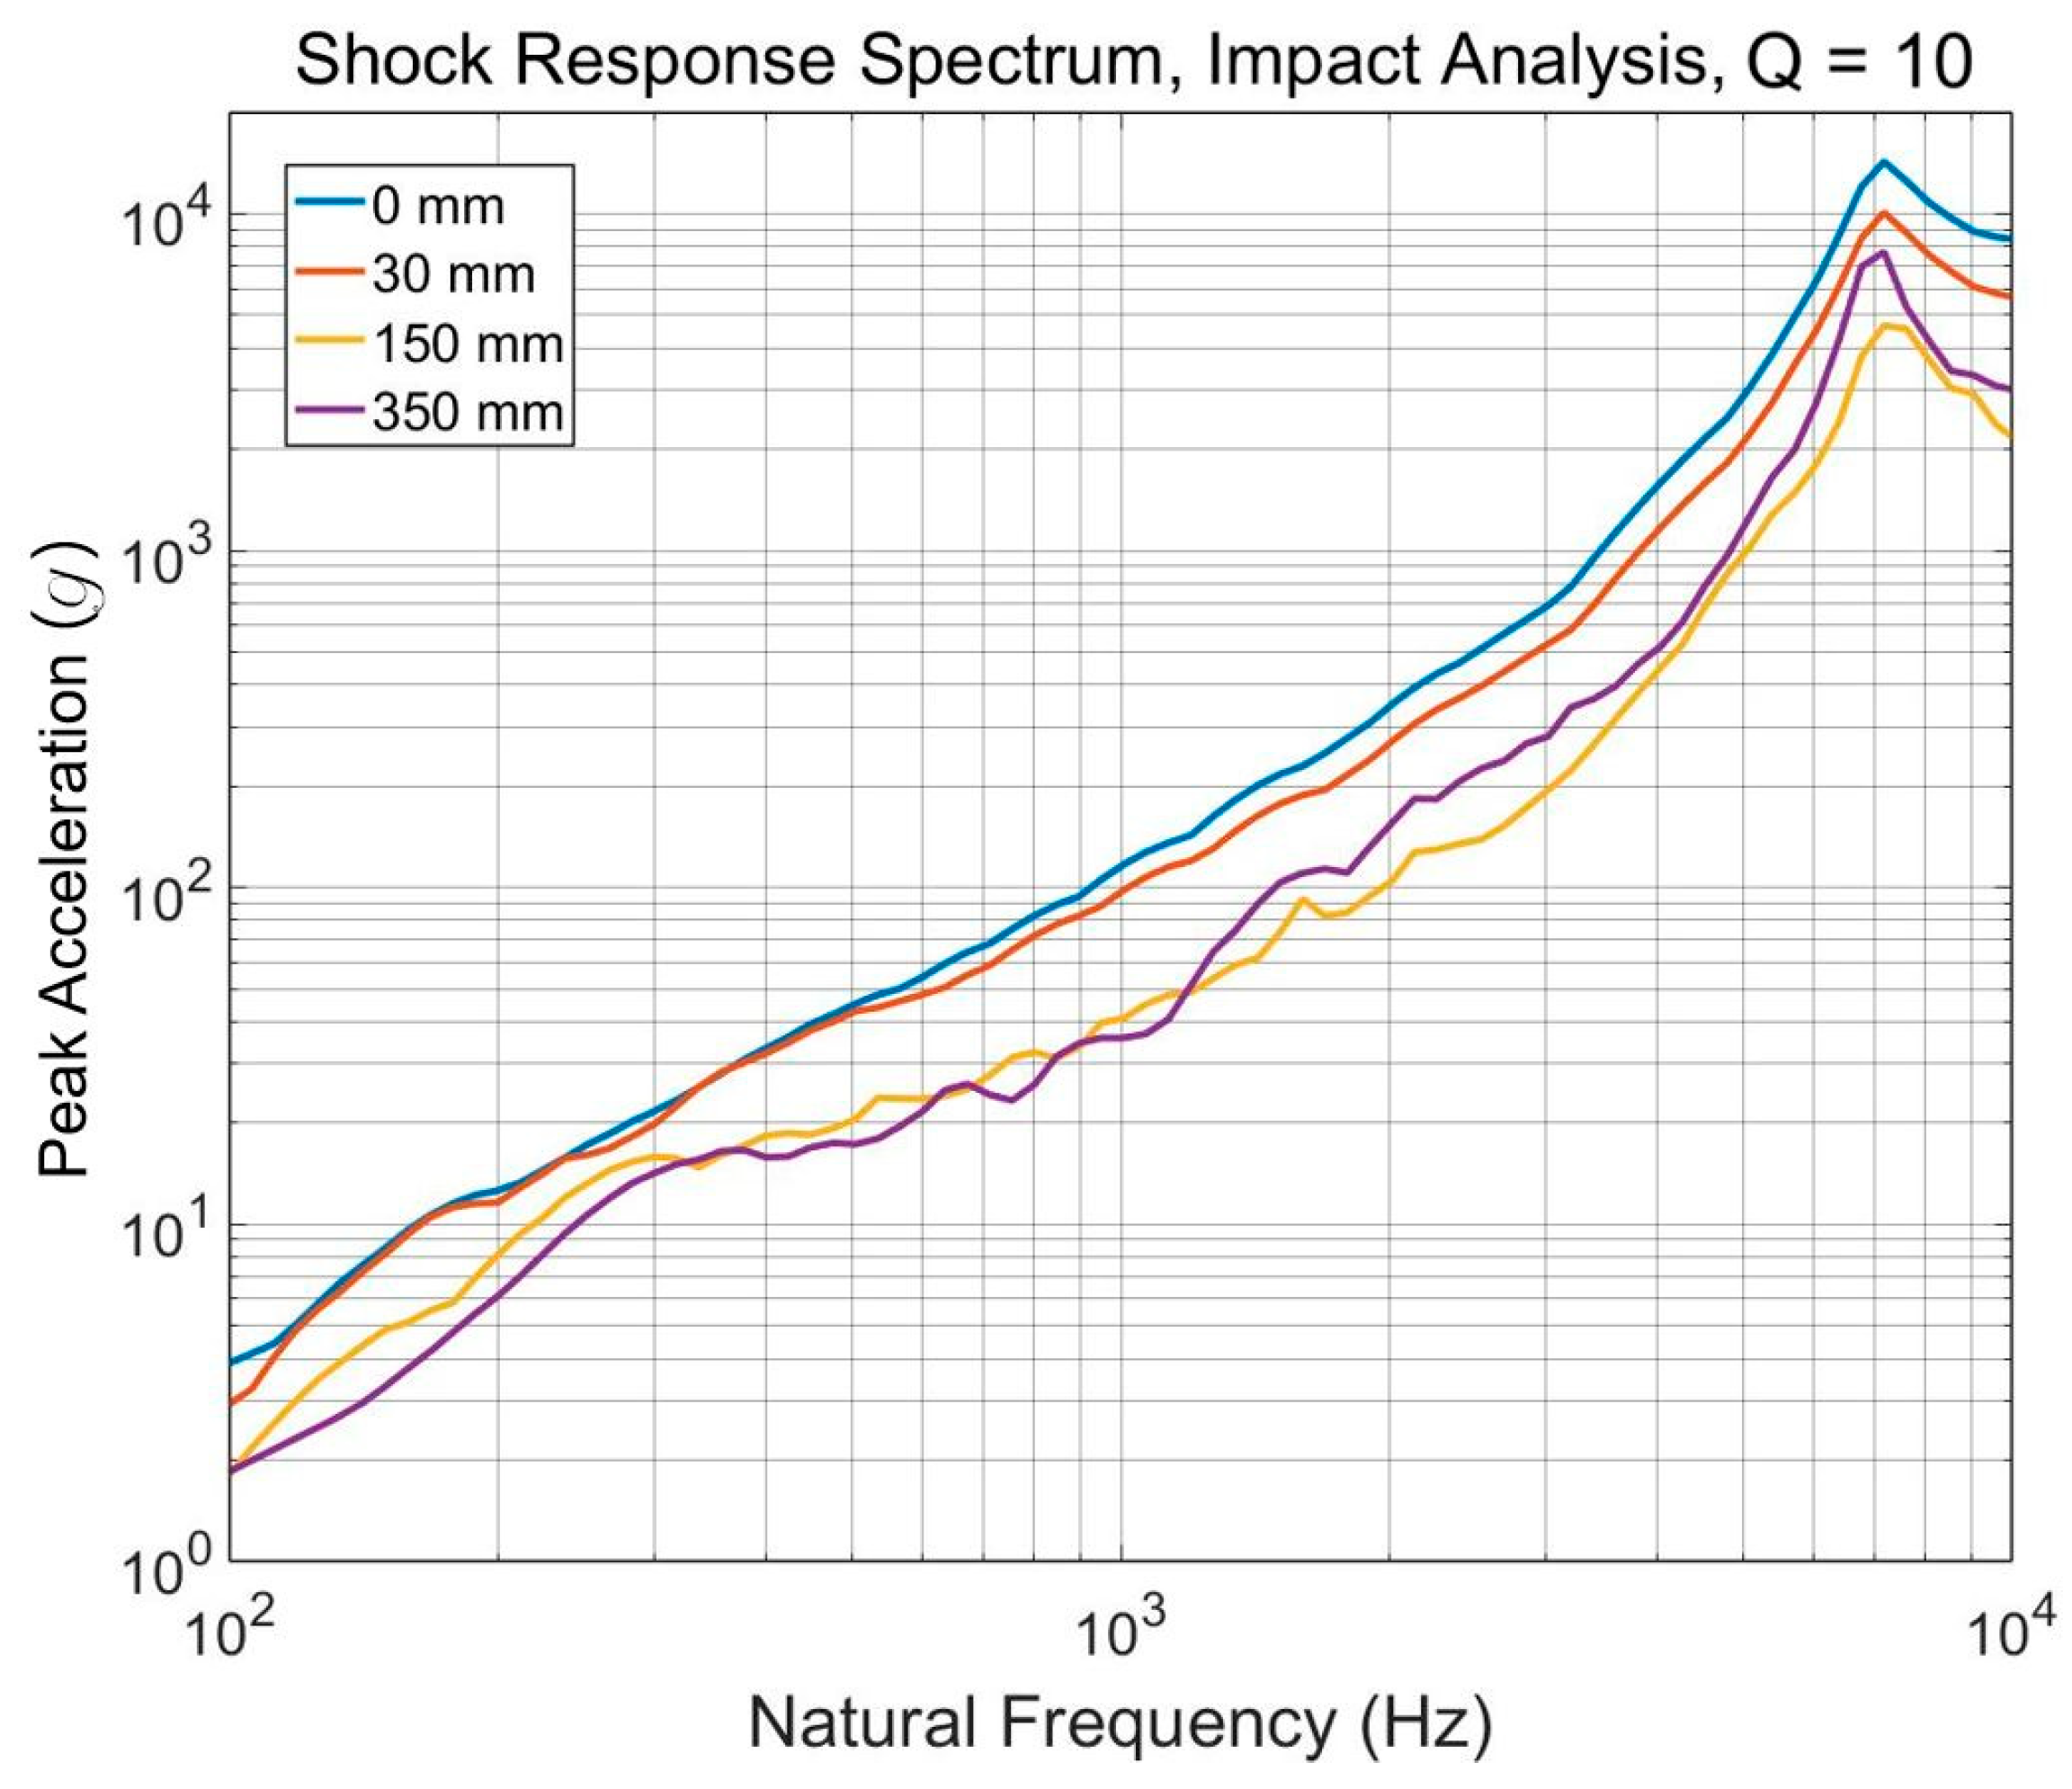
2.4. Impact Analysis Results

Impact analyses were performed for the cases where steel balls collide at various speeds. Numerical analyses were performed up to 20 ms. Before drawing the SRS, down sampling to 1 MHz was performed through cubic spline interpolation. As shown in Figure 11, acceleration values were calculated at positions 0, 30, 150, and 350 mm away from the center of the aluminum plate. If the SRS is drawn using the acceleration value, a graph such as that shown in Figure 12 can be obtained. Previously, the resonator with a natural frequency of 7 kHz was designed to create a shock environment with a knee frequency of 7 kHz, and it was confirmed that the knee frequency occurred at 7 kHz in the impact analysis. In general, the magnitude of SRS decreases with increasing distance from the impact point due to diffusion. However, at the boundary, the shock wave is reflected, and the magnitude of SRS increases near the boundary. Therefore, the magnitude of SRS at the 350 mm position is slightly higher than that at the 150 mm position. Analyses with various collision velocities were performed, and it was confirmed that an appropriate level of SRS was generated when the steel balls collided at 80 m/s. For example, as shown in Figure 13, if the SRS obtained from the impact analysis at the 30 mm position is compared with that of the pyrotechnic initiator at the same position, the two are found to be very similar. The SRS of the initiator at the 30 mm position can be approximated by a red dotted line with a knee frequency of 7 kHz and a maximum peak acceleration of 4000 g. Based on this approximation, the range where an error of ±6 dB below 3 kHz and +9/−6 dB above 3 kHz is allowed is indicated by black dotted lines. The predicted shock environment of the test device is found to be included in this region. Therefore, it is predicted that a shock environment similar to that of the pyrotechnic initiator will be created when a steel ball collides with the designed resonator at a velocity of 80 m/s.

2.5. Design of Launch Device

In this study, a simple launch-device system was implemented; a pneumatic steel-ball launch device was designed and fabricated as shown in Figure 14. The chamber is filled with high-pressure air, a steel ball (as projectile) is put inside the block, and the pneumatic solenoid valve is opened to accelerate and fire the steel ball. As the steel ball is accelerated and passes through the barrel, the pressure in the chamber and the barrel decreases. Assuming that the gas expansion process is quasistatic and isothermal, the product of pressure and volume remains constant as given by Equation (8):
P ( x ) ( V 0 + A x ) = P 0 V 0 ,
where P ( x ) is the internal air pressure that changes as the steel ball passes through the barrel, P 0 is the initial pressure of the chamber, V 0 is the initial volume of the chamber, A is the cross-sectional area of the barrel, and x is the distance traveled by the steel ball in the barrel. The movement of the steel ball can be expressed using the equation of motion given by Equation (9); further, the pressure obtained by subtracting the atmospheric pressure ( P a t m ) from the pneumatic pressure ( P 0 ) acts as an effective pressure on the steel ball [19]:
F = m d 2 x d t 2 = m d v d t = m d x d t d v d x = m v d v d x = A ( P ( x ) P a t m ) f ,
where m is the mass of the steel ball, v is its velocity, and f is the friction force. Ignoring the friction force, the velocity of the steel ball is given by Equation (10):
v = 2 m ( P 0 V 0 ln ( 1 + A L V 0 ) A L P a t m ) ,
where L is the distance from the starting position of the steel ball to the barrel exit. It is designed to accelerate at the same distance in every trial through a groove created inside the block to prevent the steel ball from moving. Therefore, steel balls are fired at the same velocity under constant pressure. Using the pneumatic pressure of a general compressor (up to 12 bar), calculations revealed that the steel ball with a diameter of 9.525 mm and a weight of 3.5 g can be fired at a velocity of 172 m/s. However, under the action of frictional force, pressure is lost through the gap between the steel ball and the inner wall of the barrel while the steel ball is accelerated by the pneumatic pressure; therefore, the actual firing velocity will be lower, which needs to be experimentally verified.
Table 2 summarizes the main design parameters of the launch device. The collision velocity was measured using two optical-fiber sensors (FT-420-10 with BF5R-D1-P), which had a fast response speed because the velocity of the steel ball was high. As shown in Figure 15, the optical-fiber sensors were installed at two points spaced by 50 mm, and the velocity was calculated by measuring the time of the steel ball’s passage through each point. It was experimentally verified that, depending on the pressure, the steel ball with a diameter of 9.525 mm and weight of 3.5 g could be fired at a velocity between 20 and 106 m/s if an air compressor of up to 12 bar was used. The developed launch device is shown in Figure 16; accurate excitation is possible at the location where the shock is to be generated in the test structure.

3. Evaluation of Pyroshock Simulator

3.1. Experimental Setup

The experimental structure comprised an aluminum plate having the same size as the numerical analysis model described in Section 2.3, the resonator described in Section 2.2, and bolts and nuts. The steel ball was fired using the launch device described in Section 2.5, and the shock propagation on the plate was measured using 4EA shock accelerometers (PCB 350C03) and a data-acquisition device (SIRIUS-HS-8xLV-8xAO). A hole was created at the center of the aluminum plate, and the resonator was fastened with a nut. The four corners of the plate were hung on the frame structure with strings; the experiment was performed according to the free-end boundary conditions used in the impact analysis. The shock accelerometers were installed at positions 0, 30, 150, and 350 mm away from the center of the resonator, as shown in Figure 17. As in the numerical analysis, the SRS was calculated using the measurement results up to 20 ms. The sampling frequency was selected as 1 MHz to prevent aliasing problems. As the shock accelerometer can measure up to 10 kHz with an error of ±1 dB, a Butterworth filter in the range of 100 Hz–10 kHz was applied to remove noise and low-frequency drift of the measured signal.

3.2. Pyroshock Simulation Test

To create a shock environment similar to the pyroshock of the pyrotechnic initiator, a pyroshock simulation experiment was performed, in which the steel ball collided with the 7 kHz resonator at 80 m/s. Figure 18 shows the calculation of the SRS by measuring the acceleration at four points. The goal was to create a shock environment with a knee frequency of 7 kHz by designing a resonator with a natural frequency of 7 kHz; from the test, it was confirmed that the knee frequency occurred near 7 kHz. In addition, the magnitude of SRS was found to decrease as the distance from the impact point increased.
Figure 19 compares the SRS at the 30 and 350 mm position for the pyrotechnic initiator and the pyroshock simulator. As predicted through impact analysis in Section 2.4, the shock environment generated by the pyroshock simulator is within the allowable error range. Thus, when a steel ball collides with the fabricated 7 kHz resonator at a velocity of 80 m/s, a shock environment similar to that of the pyrotechnic initiator is generated.
Figure 19a shows that the SRS from the pyroshock simulator has a higher peak than the real pyroshock. This is because the pyroshock simulator uses the natural frequency and natural mode of the resonator to implement the knee frequency. This is also shown in the impact analysis result as shown in Figure 13. However, as shown in Figure 19b, as the shock wave propagates, this peak disappears and a smooth knee frequency like a real pyroshock appears.
Here, the current pyroshock simulation experiments were performed on an aluminum plate (AL 6061-T6 1 m × 1 m × 5 mm) with the free-end boundary conditions, but the pyrotechnic initiator experiments [4] were performed on an aluminum plate (AL 6061-T6 1 m × 0.5 m × 5 mm) with the fixed support boundary conditions. The difference in the size and boundary conditions of these plates has little effect at the 30 mm position; most of the primary shock waves pass before the reflected shock wave from the boundary condition arrives. However, it is affected by the boundary condition at the 350 mm position closer to the boundary condition than the excitation position. This is because the shock wave reflected from the boundary condition interferes with the primary shock wave. Therefore, in this study, comparison was performed at the 30 mm position.

3.3. Performance of Pyroshock Simulator

First, the repeatability of the pyroshock simulator fabricated in this study was evaluated. Figure 20 shows the results of experiments repeated 10 times for the case where a steel ball collides with a 7 kHz (9.8 mm) resonator at 80 m/s, which is a condition for simulating the SRS of the pyrotechnic initiator. In repeated trials, the launch device fabricated in this study exhibited high accuracy; the center of the resonator was hit, and very similar SRSs appeared. This pyrotechnic simulator has good repeatability because a simple pneumatic-firing mechanism with a solenoid valve is employed.
Section 3.2 described the results for the case of colliding a steel ball at 80 m/s with the 7 kHz (9.8 mm) resonator to simulate the shock environment of the pyrotechnic initiator. Here, the intention was to generate a desired shock environment other than the standard initiator pyroshock. Impact analysis and experiments were performed by changing the thickness of the resonator disk and the collision velocity of the steel balls. Frequencies of 5 kHz (6.0 mm) and 7 kHz (9.8 mm) were considered for the resonator, and 50 and 80 m/s were considered as the collision velocity. The impact analysis results are shown in Figure 21. Comparison of the results of collision at 80 and 50 m/s for a 7 kHz resonator revealed that in both cases, the knee frequency occurred near 7 kHz and only the overall magnitude of acceleration (or SRS) changed. In addition, to observe the knee frequency change according to the change in the resonator, the results of the impact analysis with 5 kHz (6.0 mm) and 7 kHz (9.8 mm) resonators were compared. If the collision velocity is the same, similar SRSs are observed in the low-frequency region of 2 kHz or less, and only the knee frequency changes from approximately 5 to 7 kHz. As shown in Figure 22, in the experiment using the pyroshock simulator, only the magnitude of SRS changes when the collision velocity changes and only the knee frequency changes when the resonator changes. Therefore, by changing these two variables, a shock environment with the desired SRS magnitude and knee frequency can be obtained, and the appropriate velocity and resonator thickness can be predicted through impact analysis prior to fabricating the experimental device.

4. Conclusions

In this study, an impact test device capable of simulating pyroshock using a mechanical-impact method was developed. To simulate the shock environment, a resonator with a specific natural frequency was attached to the test structure to generate a shock having a desired knee frequency, and the magnitude of the shock level was changed by controlling the collision velocity of the steel ball. Through impact analysis, the desired shock environment was predicted prior to device fabrication. Based on the numerical analysis results, an experimental device was manufactured and impact tests were performed. It was verified that a shock similar to the shock environment of the pyrotechnic initiator was generated.
The proposed pyrotechnic simulator has good repeatability. In addition, if only the disk of the resonator is replaced, the knee frequency of SRS can be changed, and the magnitude of the SRS can be adjusted by adjusting the collision velocity of the steel ball; thus, the desired shock environment can be easily generated.

Author Contributions

Conceptualization, B.-S.K. and J.L.; methodology, B.-S.K. and J.L.; software, B.-S.K.; validation, B.-S.K. and J.L.; formal analysis, B.-S.K.; investigation, B.-S.K.; writing—original draft preparation, B.-S.K.; writing—review and editing, J.L.; supervision, J.L.; project administration, J.L.; funding acquisition, J.L. All authors have read and agreed to the published version of the manuscript.

Funding

This work was supported by the 2021 Research Fund of the University of Ulsan.

Conflicts of Interest

The authors declare no conflict of interest.

References

  1. Wang, X.; Liu, W.; Ding, J.; Sun, Y.; Dang, Y. Pyroshock Response Prediction of Spacecraft Structure in Wide Frequency Domain Based on Acceleration FRF. Aerospace 2022, 9, 54. [Google Scholar] [CrossRef]
  2. Lee, J.; Han, J.-H.; Lee, Y.; Lee, H. Separation characteristics study of ridge-cut explosive bolts. Aerosp. Sci. Technol. 2014, 39, 153–168. [Google Scholar] [CrossRef]
  3. Lee, J.-R.; Chia, C.C.; Kong, C.-W. Review of pyroshock wave measurement and simulation for space systems. Measurement 2012, 45, 631–642. [Google Scholar] [CrossRef]
  4. Lee, J.; Hwang, D.-H.; Han, J.-H. Study on pyroshock propagation through plates with joints and washers. Aerosp. Sci. Technol. 2018, 79, 441–458. [Google Scholar] [CrossRef]
  5. Lee, J.; Hwang, D.-H.; Jang, J.-K.; Kim, D.-J.; Lee, Y.; Lee, J.-R.; Han, J.-H. Pyroshock Prediction of Ridge-Cut Explosive Bolts Using Hydrocodes. Shock. Vib. 2016, 2016, 1218767. [Google Scholar] [CrossRef]
  6. Xiong, S.; Li, Y.; Ye, Y.; Wang, J.; Mu, H.; Wen, Y. Quantitatively Decoupling the Impact of Preload and Internal Mechanism Motion on Pyrotechnic Separation Shock. Int. J. Aeronaut. Space Sci. 2021, 22, 1106–1117. [Google Scholar] [CrossRef]
  7. Lee, J.; Kim, Y.-S.; Baek, S.-J.; Jeong, H.S. Study of Separation Mechanism and Characteristics of Ridge-Cut Explosive Bolts Using Numerical Analysis. Int. J. Aeronaut. Space Sci. 2021, 22, 84–93. [Google Scholar] [CrossRef]
  8. Bateman, V.I.; Davie, N.T. Pyroshock Testing. In Harris’ Shock and Vibration Handbook, 6th ed.; Piersol, A.G., Paez, T.L., Eds.; McGraw-Hill: New York, NY, USA, 2002; pp. 28.1–28.19. [Google Scholar]
  9. Moening, C.J. Pyrotechnic shock flight failures. In Proceedings of the 31st Annual Technical Meeting of the Institute of Environmental Sciences, Las Vegas, NV, USA, 29 April–3 May 1985. [Google Scholar]
  10. Department of Defense. Pyroshock; MIL-STD-810G, 517.1; Department of Defense: Arlington, VI, USA, 2008. [Google Scholar]
  11. Jeong, J.-W.; Lim, J.H.; Kim, K.-W.; Lee, J.-J. Development of a point pyroshock source simulator. Shock. Vib. 2017, 2017, 6834601. [Google Scholar] [CrossRef] [Green Version]
  12. Lee, S.-J.; Hwang, D.-H.; Han, J.-H. Development of pyroshock simulator for shock propagation test. Shock. Vib. 2018, 2018, 9753793. [Google Scholar] [CrossRef]
  13. Hwang, D.-H.; Park, H.-S.; Han, J.-H. Development of a miniature point source pyroshock simulator. J. Sound Vib. 2020, 481, 115438. [Google Scholar] [CrossRef]
  14. Ryschkewitsch, M.G. Pyroshock Test Criteria; NASA-STD-7003A; NASA: Washington, DC, USA, 2011. [Google Scholar]
  15. Harris, C.M.; Piersol, A.G. Introduction to the Handbook. In Harris’ Shock and Vibration Handbook, 6th ed.; Piersol, A.G., Paez, T.L., Eds.; McGraw-Hill: New York, NY, USA, 2002; p. 1.14. [Google Scholar]
  16. Meyers, M.A. Dynamic Behavior of Materials; John Wiley & Sons: New York, NY, USA, 1994. [Google Scholar]
  17. Zukas, J.A. Introduction to Hydrocodes; Elsevier: Amsterdam, The Netherlands, 2004. [Google Scholar]
  18. Su, Z.; Lin, Y. Identification of Damage Using Lamb Waves from Fundamentals to Applications; Springer: Berlin, Germany, 2009; pp. 15–53. [Google Scholar]
  19. Rohrbach, Z.J.; Buresh, T.R.; Madsen, M.J. Modeling the exit velocity of a compressed air cannon. Am. J. Phys. 2012, 80, 24–26. [Google Scholar] [CrossRef] [Green Version]
Figure 1. Schematic of pyroshock simulator.
Aerospace 09 00407 g001
Figure 2. Existing pyroshock simulators: (a) Bateman et al.’s pyroshock simulator; (b) point-source pyroshock simulator; (c) breech method-based pyroshock simulator; (d) pyroshock simulator with a launch device.
Aerospace 09 00407 g002
Figure 3. Shock-response spectrum (SRS).
Aerospace 09 00407 g003
Figure 4. Energy scale change of SRS.
Aerospace 09 00407 g004
Figure 5. Knee frequency change in SRS.
Aerospace 09 00407 g005
Figure 6. SRS of pyrotechnic initiator (PC-800).
Aerospace 09 00407 g006
Figure 7. Test tolerance of NASA’s pyroshock environment.
Aerospace 09 00407 g007
Figure 8. The 3D modeling of resonator.
Aerospace 09 00407 g008
Figure 9. Modal analysis results according to thickness of resonator.
Aerospace 09 00407 g009
Figure 10. Numerical analysis model.
Aerospace 09 00407 g010
Figure 11. Acceleration calculation positions.
Aerospace 09 00407 g011
Figure 12. SRS of impact analysis when steel ball collides with 7 kHz resonator at 80 m/s.
Aerospace 09 00407 g012
Figure 13. Comparison of SRS between impact analysis and pyrotechnic initiator.
Aerospace 09 00407 g013
Figure 14. Design of launch device.
Aerospace 09 00407 g014
Figure 15. Measurement of steel ball velocity.
Aerospace 09 00407 g015
Figure 16. Developed launch device.
Aerospace 09 00407 g016
Figure 17. Shock accelerometer installation.
Aerospace 09 00407 g017
Figure 18. SRS of shock-propagation test using pyroshock simulator.
Aerospace 09 00407 g018
Figure 19. Comparison between pyrotechnic initiator and pyroshock simulator: (a) 30 mm position; (b) 350 mm position.
Aerospace 09 00407 g019
Figure 20. Repeatability test results of pyroshock simulator.
Aerospace 09 00407 g020
Figure 21. Parametric study through numerical analysis of pyroshock simulator.
Aerospace 09 00407 g021
Figure 22. Parametric study through experiments of pyroshock simulator.
Aerospace 09 00407 g022
Table 1. Material properties used for impact analysis.
Parameter of Shock EOSUnitAluminum Alloy 6061-T6Stainless Steel 304
Density   ρ kg / m 3 27037900
Gruneisen   coefficient   γ none 1.971.93
Empirical   parameter   C 0 m / s 52404570
Empirical   parameter   s none 1.41.49
Reference   temperature   T r K 295.15295.15
Specific   heat   C v J / kgK 885423
Parameter of Steinberg–Guinan strength model
Initial   shear   modulus   G 0 kPa 2.76 × 10 7 7.7 × 10 7
Initial   yield   stress   Y 0 kPa 2.9 × 10 5 3.4 × 10 5
Maximum   yield   stress   Y m a x kPa 6.8 × 10 5 2.5 × 10 5
Hardening   constant   β none 125 43
Hardening   exponent   n none 0.10.35
Derivative   d G / d P   G P none 1.81.74
Derivative   d G / d T   G T none 1.7 × 10 4 3.504 × 10 4
Derivative   d Y d P   Y P none 0.0189080.007684
Melting   temperature   T m K 12202380
Table 2. Design parameters of launch device.
ParametersValue
Length of Barrel ( L )800 mm
Inner Diameter of Barrel10 mm
Barrel Area ( A )7.854 × 10⁻⁵ m2
Mass of Projectile ( m )3.5 g
Diameter of Projectile9.525 mm
Chamber Volume ( V 0 )1.059 × 10⁻⁴ m3
Chamber Length116 mm
Thickness of Chamber10 mm
Inner Diameter of Chamber36 mm
Publisher’s Note: MDPI stays neutral with regard to jurisdictional claims in published maps and institutional affiliations.

