Article

Regional and Seasonal Dependence of the Potential Contrail Cover and the Potential Contrail Cirrus Cover over Europe

1
Institut für Physik der Atmosphäre, Deutsches Zentrum für Luft- und Raumfahrt, D-82234 Oberpfaffenhofen, Germany
2
Institut für Physik der Atmosphäre, Johannes Gutenberg-Universität Mainz, D-55128 Mainz, Germany
*
Author to whom correspondence should be addressed.
Aerospace 2022, 9(9), 485; https://doi.org/10.3390/aerospace9090485
Submission received: 1 June 2022 / Revised: 29 July 2022 / Accepted: 24 August 2022 / Published: 30 August 2022
(This article belongs to the Special Issue Aircraft Emissions and Climate Impact)

Abstract

:
Ambient weather conditions strongly impact contrail formation and persistence. The implementation of contrail avoidance and mitigation strategies, therefore, requires regional and altitude-dependent information on the frequency of contrail occurrence. To this end, we have developed a method to quantify the potential contrail cover based on 10 years of high-resolution reanalysis of climatology and weather data from the European Center for Medium-Range Weather Forecast (ECMWF). We use the Schmidt–Appleman threshold temperature for contrail formation and additionally select thresholds for the relative humidity to evaluate the occurrence of persistent contrails and assess their regional and seasonal variation. We find a potential contrail cirrus cover of 10% to 20% above Europe at higher altitudes of 200 and 250 hPa in the 10-year climatology and a weak seasonal variation. At lower altitudes, near 300 hPa, a steep onset and a high potential contrail cirrus cover of 20% is found in late fall and in winter, decreasing to 2% potential contrail cirrus cover in summer. In comparison to ECMWF data, evaluations using data from the National Centers for Environmental Prediction (NCEP) show a significantly lower potential contrail cirrus cover. Our results help to investigate the seasonal and altitude dependence of contrail mitigation strategies, in particular for warming nighttime contrails that contribute strongly to the total climate impact from aviation.

1. Introduction

About 4% of the anthropogenic effective radiative forcing is caused by global aviation [1], mainly by emissions of CO 2 , NO x and contrail cirrus. Contrail cirrus has a cooling effect through the reflection of incoming short-wave solar radiation and a warming impact due to the trapping of outgoing long-wave radiation. In summary, contrail cirrus represents the major forcing component from aviation with a net effective radiative forcing of about 57mW m 2 , followed by CO 2 (34mW m 2 ) and NO x (18mW m 2 ) [1].
Unlike the direct emissions of CO 2 , the climate impact of contrails is strongly influenced by the prevailing atmospheric conditions. Whether a contrail forms and persists is dependent on the temperature and the relative humidity with respect to ice in the atmospheric environment. Contrails are the result of the cooling of the hot and moist exhaust plume. Water vapor from the aircraft engine condenses on exhaust aerosols, usually soot, and subsequently freezes at high altitudes at temperatures below −38 °C [2]; the maximum air temperature that allows contrail formation is determined by the Schmidt–Appleman criterion [2,3]. Since soot is a poor ice nucleus, the Schmidt–Appleman criterion requires the humidity in the plume to exceed liquid saturation at some point during cooling. After its formation, a contrail persists when the relative humidity of the ambient air is at least saturated with respect to ice. In subsaturated conditions, the contrail evaporates within seconds to minutes. The formation and persistence of contrails, therefore, depend on the region, season, and altitude and is subject to large variability.
The aim of this work is to gain a better overview of where and when contrails develop predominantly. This is described by the potential contrail cover, which helps to assess the frequency of contrail formation and persistence for dedicated campaign planning, regional contrail modeling, and contrail avoidance strategies. For this purpose, climatology was developed that evaluates the atmospheric contrail formation conditions based on ECMWF ERA-5 Reanalysis data [4]. We determine the potential contrail cover based on the local air temperature of the past 10 years within a requested region, a given time period, and pressure level. Hereto, the Schmidt–Appleman threshold temperature is calculated on the basis of the prevailing conditions. Additionally, the persistence of contrails can be analyzed by adding a threshold for the relative humidity over ice. For this purpose, two different thresholds for the relative humidity over ice are introduced in order to determine, on the one hand, the frequency of the formation of persistent contrail cirrus and, on the other hand, the formation of contrails that persist at least a couple of minutes so that they can be detected during aircraft measurements. As a result, the mean value of the potential contrail cover or the potential contrail cirrus cover in a certain area is derived, and a map shows the geographical distribution.
The analysis can be used to address open questions on the regional or seasonal occurrence and frequency of persistent contrails. It is, for instance, particularly useful for the long-term planning of flight measurement campaigns and has already been consulted for the planning of the Emission and CLimate Impact of alternative Fuel campaign (ECLIF 3) of the German Aerospace Center (DLR) and Airbus in April 2021. For this purpose, the potential contrail cover over Europe is analyzed seasonally and at different pressure levels between 300 and 200 hPa. Additionally, the temporal evolution of the potential contrail cirrus cover over central Europe is investigated.

2. Data and Methods

2.1. Schmidt–Appleman Threshold Temperature

Contrails are the result of cooling of the warm (≈600K) and humid exhaust air from the aircraft engines. The air is cooled isobarically by mixing with cold ambient air and may reach liquid saturation in the plume, causing small droplets to form via condensation predominantly on emitted soot particles [5,6]. Experiments have shown the importance of local liquid saturation in the plume. These droplets can freeze when the temperature has cooled below −38 °C [2].
The need for low temperatures explains why contrails usually only occur at high altitudes above 8km [7]. For a persistent contrail to form and develop into contrail cirrus, ice-saturated air is required [8]. Otherwise, the contrail dissipates within seconds to minutes, depending on the prevailing temperature and humidity conditions.
The Schmidt–Appleman threshold temperature depends on various aircraft-related parameters. The propulsion efficiency η of the aircraft determines the fraction of fuel energy used for the propulsion of the aircraft and depends on both the aircraft engine and flight parameters. A higher propulsion efficiency leads to lower exhaust temperatures. Newer aircraft with improved engines have a higher propulsion efficiency and release less heat than older ones, and are, therefore, more likely to produce visible contrails. The parameter normally ranges from 0.2 for older to 0.4 for newer aircraft [9,10].
Two further parameters are important in this context. First is the emission index of water vapor E I H 2 O , which defines the mass unit of water vapor per mass unit of aviation fuel that is produced during the combustion. Values of E I H 2 O can be calculated and are found, e.g., in [2], and typically amount to around 1.23 kg kg 1 fuel for kerosene [9]. The second parameter, the net heat value Q, can be defined in a similar way. It specifies the combustion heat per mass unit of aviation fuel released by the engine. For kerosene, typical values lie around 43MJ kg 1 [9]. Since η defines the fraction of fuel energy converted into the propulsion of the aircraft, a total of (1 − η )Q heat per mass of fuel is released via the exhaust air. The relation of water concentration m p and the water vapor partial pressure e in the plume is given by
m p = M H 2 O M a i r e p = ϵ e p
where ϵ = M H 2 O / M a i r = 0.622 is the molar mass ratio of water vapor and dry air, and p is the total air pressure. When the air of the environment and the plume mix, the ratio of change in partial pressure to change in temperature is given by
e p e E T p T E = Δ e Δ T = E I H 2 O c p p ϵ Q ( 1 η ) = G ,
where c p 1004 J kg 1 K 1 is the specific heat capacity of air at constant pressure, e E is the water vapor partial pressure of the environment, e p is the water vapor partial pressure of the plume, and T p / E is the temperature of the plume and the environmental air, respectively.
In order to obtain the threshold value T L C of the formation of contrails, one has to identify the point T L M at which the mixing line is the tangent of the liquid saturation curve (see Figure 1).
d p L ( T L M ) d T = G ,
where p L is the saturation vapor pressure of liquid water. For the calculated critical mixing line, the ambient water vapor partial pressure defines the threshold temperature T L C . If the temperature of the environment is below the threshold temperature T L C , the mixing line crosses the curve of liquid saturation at some point. Using Equations (3) and (7) T L M can be calculated. Moreover, the vapor pressure at T L M is naturally just p L ( T L M ) . The e-axis intercept of the mixing line in the e—T diagram can now be calculated via
e 0 = p L ( T L M ) G T L M ,
so in the last step, the threshold temperature for contrail formation T L C can be derived using
T L C = e a m b i e n t e 0 G .
The vapor pressure of the environment e a m b i e n t can be obtained using the relative humidity of the environment and the saturation vapor pressure of ice p i . An analytical approximation for p i that fits the numerical solution of the Clausius–Clapeyron equation with respect to ice saturation to within 0.025% in the temperature range of 111K to the triple point is given by [11]
p i = exp 9.550426 5723.265 / T + 3.53068   ln ( T ) 0.00728332 T .
In a similar way, within a temperature range of 123 to 332 K, the saturation vapor pressure of liquid water necessary for the calculation of T L M can be approximated as follows [11]
p L exp { 54.842763 6763.22 / T 4.210   ln ( T ) + 0.000367 T   + tanh ( 0.0415 ( T 218.8 ) ) ( 53.878 1331.22 / T   9.44523   ln ( T ) + 0.014025 T ) } .
Consequently, many different factors are involved in the formation of contrails. The Schmidt–Appleman criterion is a measure of the maximum temperature that may prevail in the ambient air in order to reach liquid saturation in the plume so that contrails can form. Air temperature, relative humidity, and aircraft parameters, which determine the amount of water vapor and heat released by the engine, play an important role in this context. To ensure a persistent contrail, the ambient air has to be supersaturated with respect to ice ( R H i 100%). In this case, contrail ice particles can take up water vapor from the environment and develop into contrail cirrus. These may spread, e.g., by wind shear, leading to further increasing cloud cover [12].

2.2. Meteorological Data

In order to determine the frequency of contrail formation and persistence based on the Schmidt–Appleman criterion, the temperature and the relative humidity over ice are required as input parameters from the model. The evaluations are carried out on the basis of ERA-5 Reanalysis data from the European Centre for Medium-Range Weather Forecasts (ECMWF). The frequency of contrail occurrence is determined based on atmospheric conditions in which the air temperature is below the Schmidt–Appleman criterion, independent of the relative humidity ( R H i > 0%). Persistent contrails that do not evaporate immediately after their formation, i.e., those that are to a great extent responsible for the warming climate impact of contrails, naturally require a relative humidity over ice of the ambient air of at least 100%. However, some weather models tend to underestimate the relative humidity close to saturation [13,14]. Gierens et al. [15] showed that persistent contrails are more reliably predicted at a threshold of 95% when using ECMWF ERA-5 data. In order to investigate persistent contrails, the threshold for the relative humidity over ice is, therefore, set to 95% instead of 100%. The analyses can be used as a proxy for the potential contrail cirrus cover, for contrail model evaluation, and to assess the efficacy of contrail mitigation measures [10,16].
During several flight measurement campaigns, we observed that a relative humidity of ice exceeding 80% is sufficient for contrails to survive for several minutes so that they can be measured [17,18]. Hence, a second threshold for the relative humidity is established that covers an intermediate range between short-lived contrails and long-lived contrail cirrus. These contrails are sufficient for campaign planning and may also develop into long-lived contrails, for example, through convection into supersaturated regions. Analyses for which the threshold for the relative humidity over ice is set to 80% are referred to as potential contrail cover in the following.
The relative humidity over ice and the relative humidity over liquid water are combined into one parameter within the ERA-5 Reanalysis dataset. Above 0 °C, the relative humidity over liquid water is used, in the interval 0 °C to −23 °C, an interpolation is provided, and below −23 °C, the relative humidity over ice is used [4]. At altitudes where contrails are possible, temperatures are usually lower than −40 °C, so the relative humidity in ERA-5 is with respect to ice.
For further data processing, air temperature and relative humidity data are downloaded for the time interval, area, and pressure level under investigation. These data were obtained from the Copernicus Climate Change Service [4]. For this work, datasets from the years 2010 to 2019 were used. The Schmidt–Applemann threshold temperature, referred to as Schmidt–Applemann Criterion (SAC), is then calculated separately for each data point using the parameters listed in Table 1.
The resulting value of the Schmidt–Applemann threshold temperature is then compared with the actual air temperature in order to determine whether a contrail would have formed at that location and time (air temperature < SAC). This is performed for all data points and years. This means that the hourly temperature data are compared with the respective calculated criteria for contrail formation. The resulting frequency of contrail formation is then averaged over a certain period of time (i.e., two weeks). As a result, a map with a spatial resolution of the data is created, showing the average frequency of contrail occurrence from the past 10 years during the selected time period.
The contrail occurrence frequency computed in that way does not yet make any statement about the persistence of the contrails. A contrail that is predicted (air temperature < SAC) is only considered a persistent contrail if, additionally, the relative humidity over ice at this point is above 95% (or 80% for campaign planning). Including this second criterion, the calculations are carried out as described above. As a result, the frequency of the formation of persistent contrails is obtained. This frequency can be translated into a potential persistent contrail cover or a potential contrail cirrus cover.

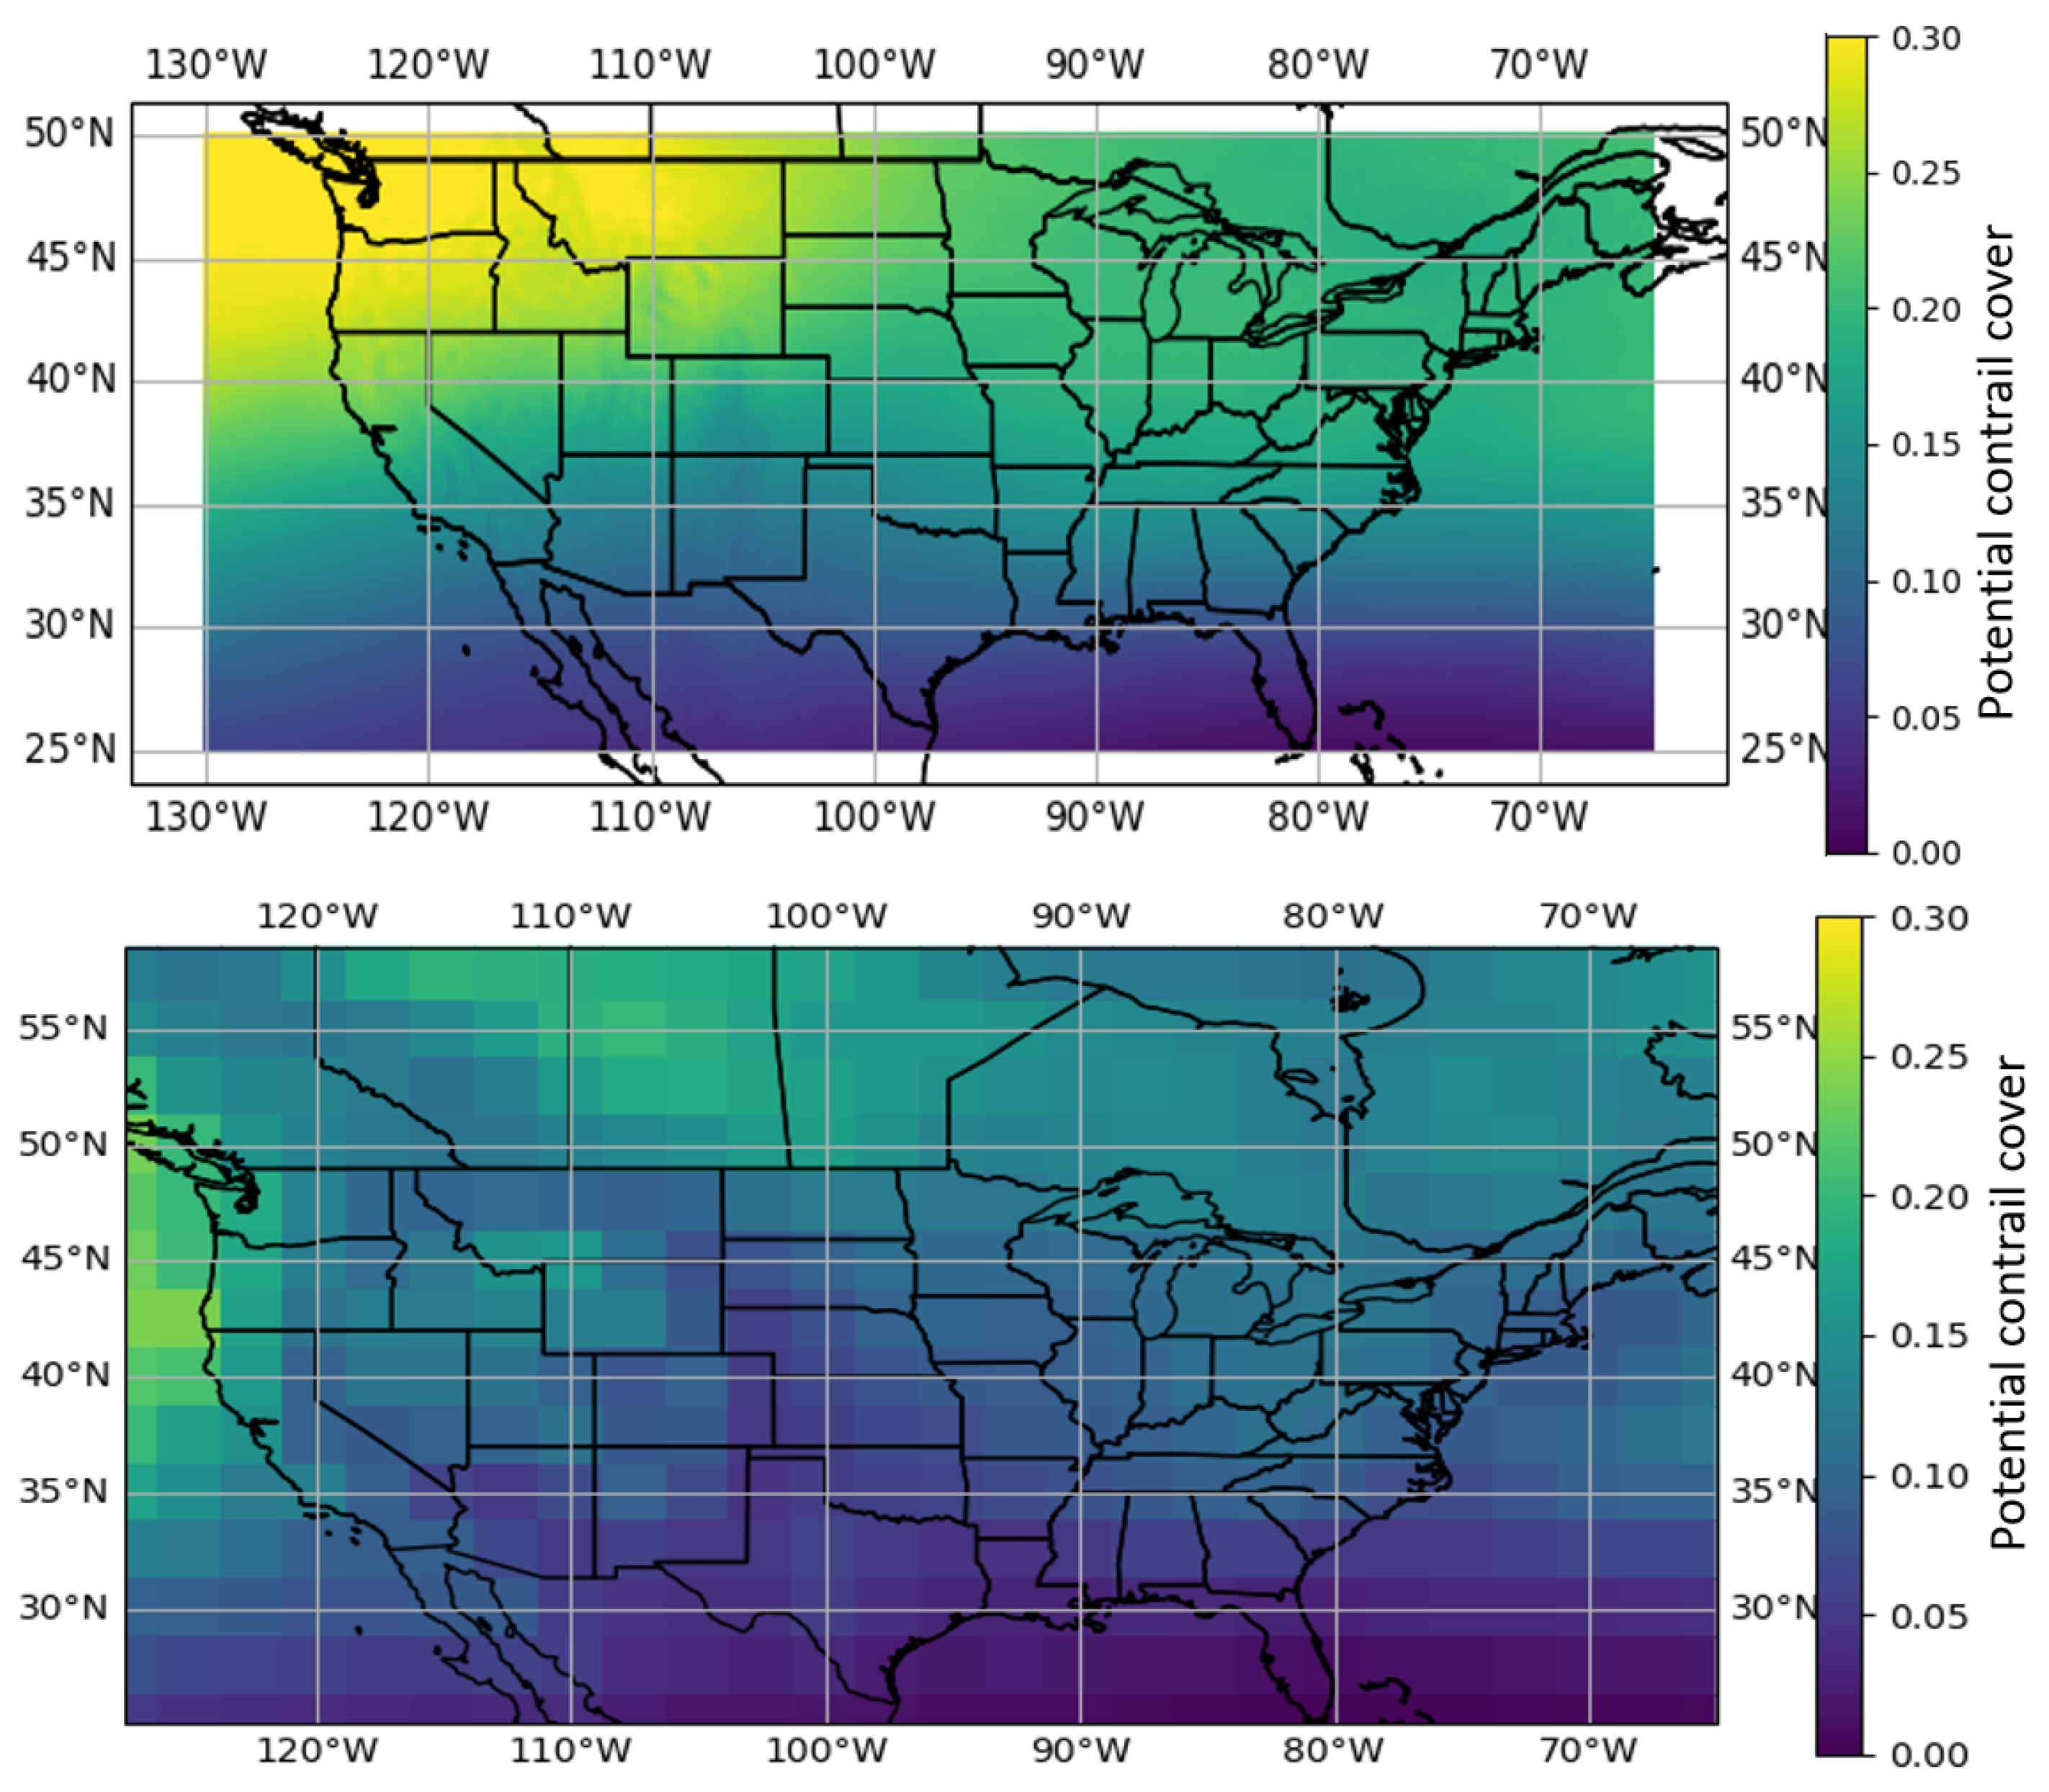
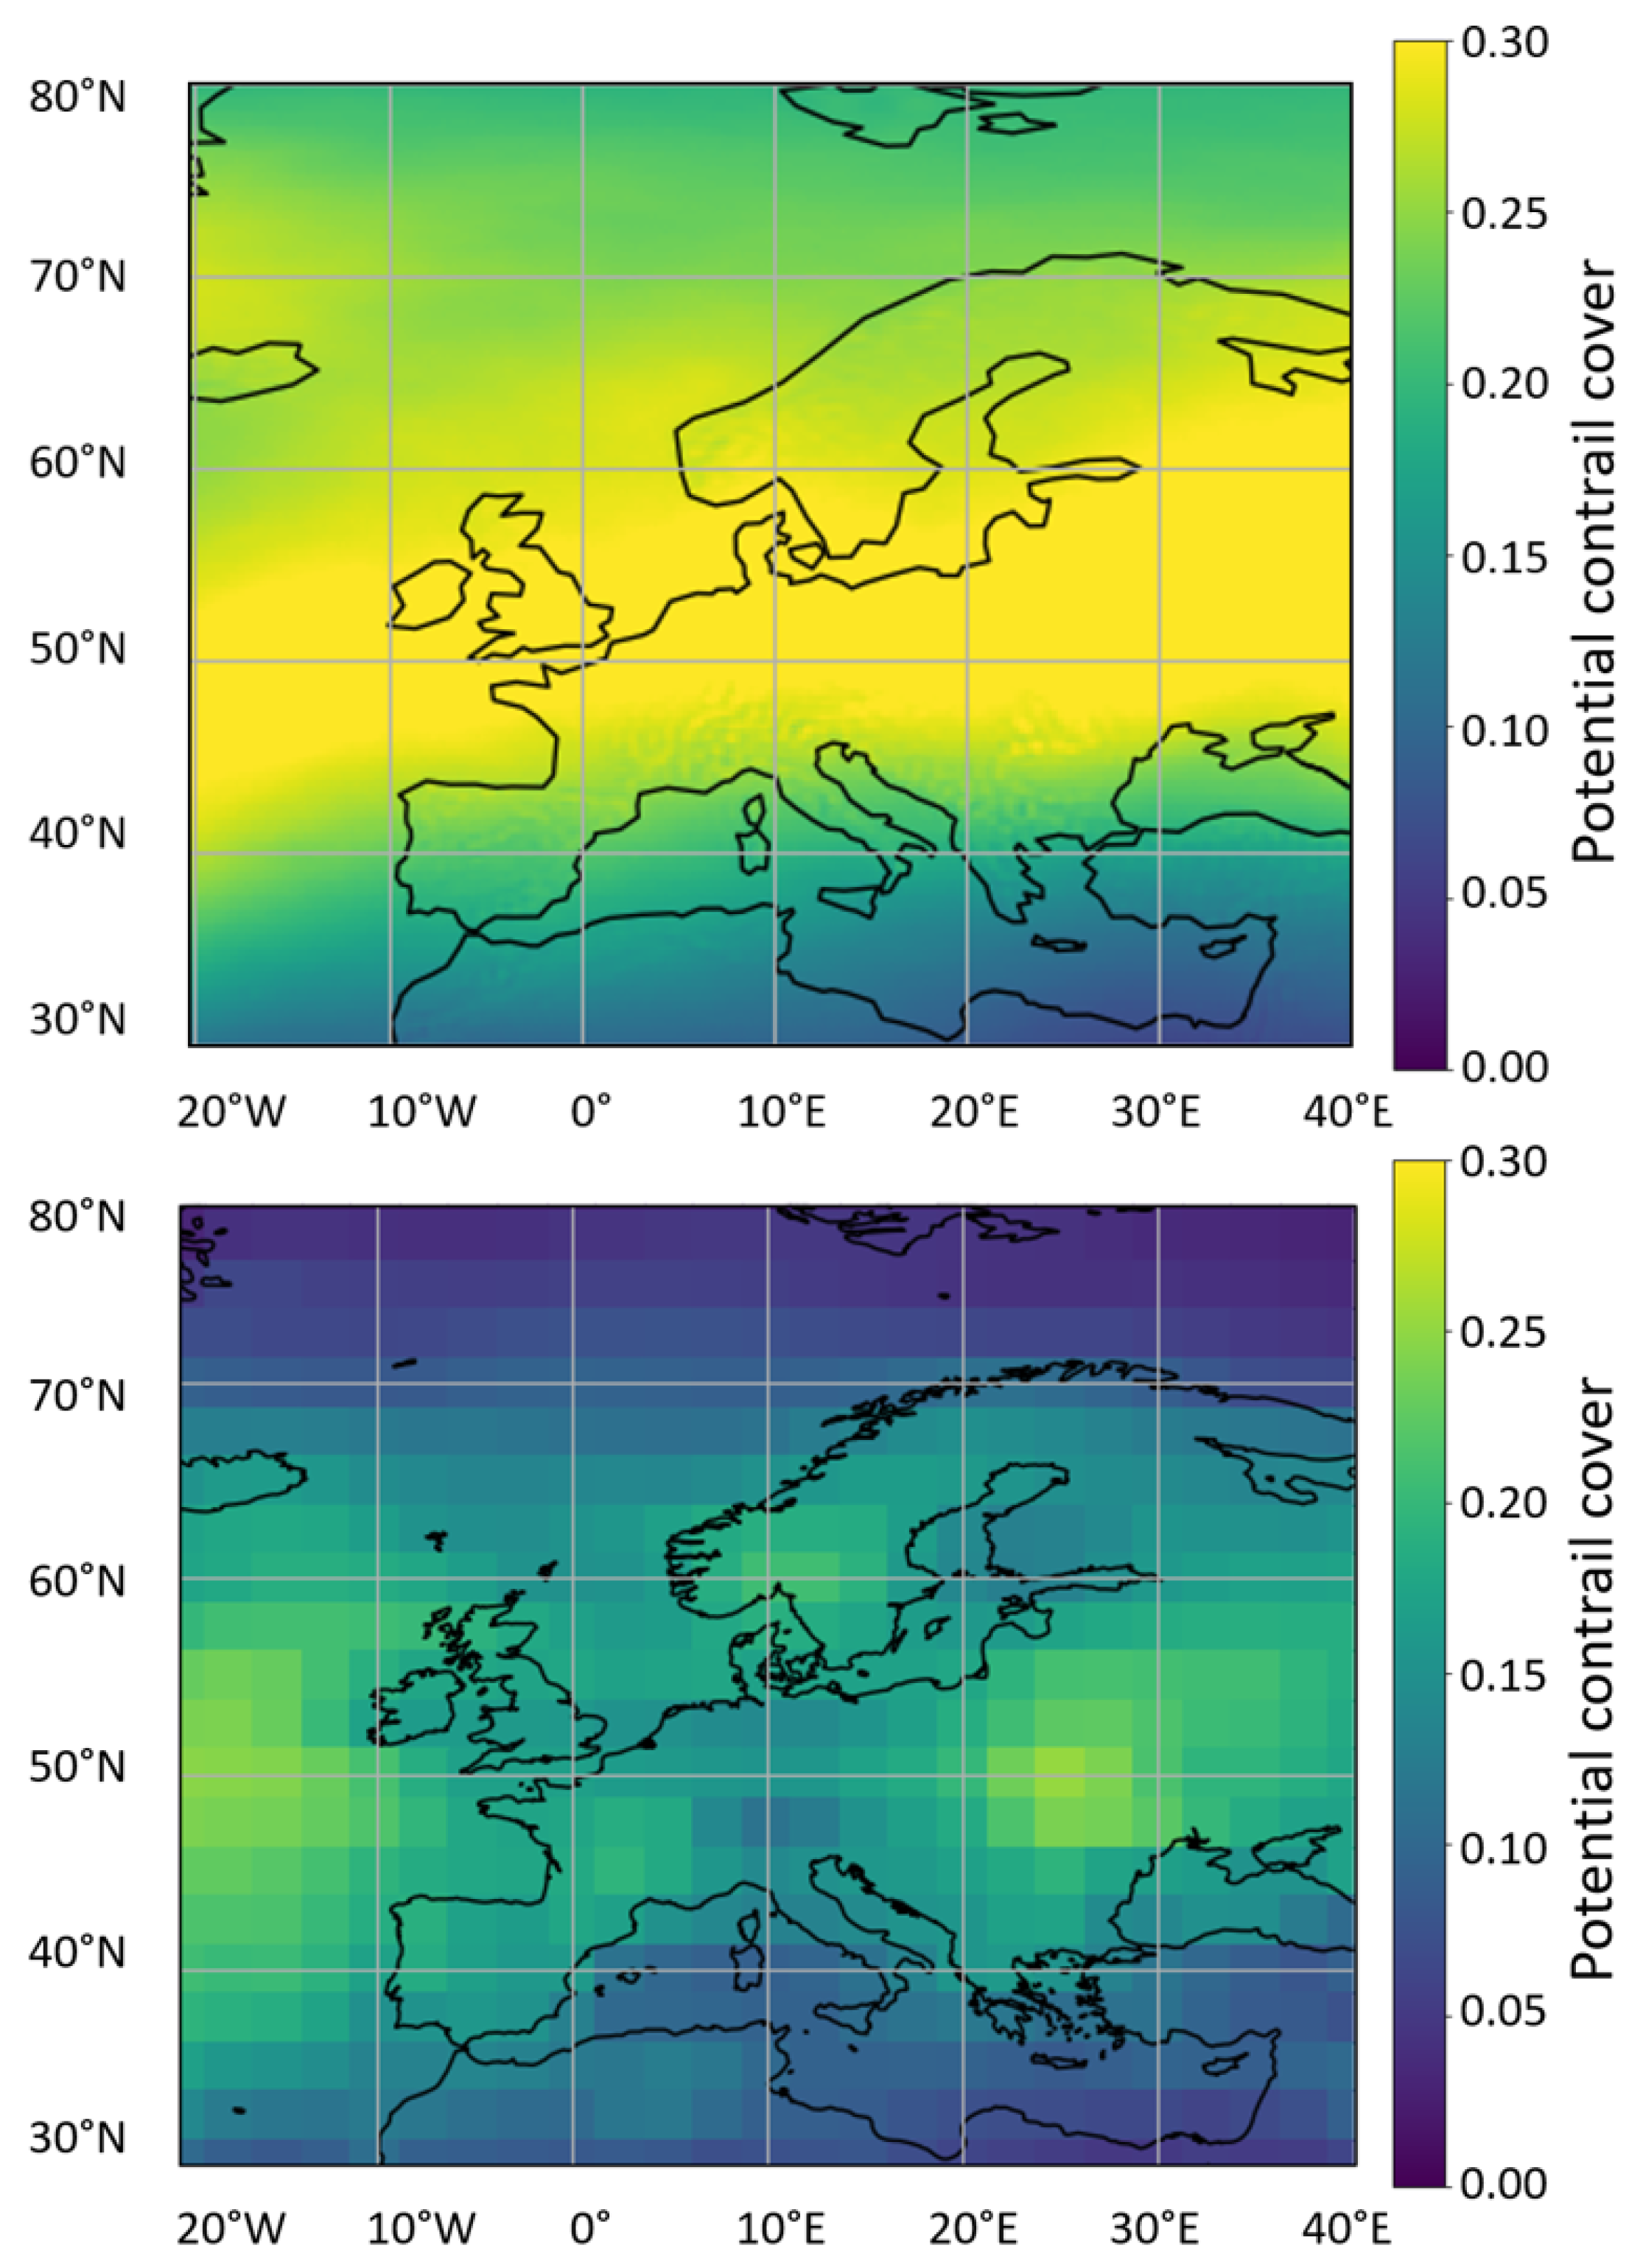
2.3. Comparison of ECMWF and NCEP Data

For comparison, we use data from the National Centers for Environmental Prediction (NCEP) and the European Centre for Medium-Range Weather Forecasts (ECMWF). NCEP/NCAR Reanalysis data have a spatial resolution of 2.5° × 2.5° and temporal coverage of four daily values from 1 January 1948 to the present [20]. ECMWF ERA-5 Reanalysis data are available at a higher spatial resolution of 0.25° × 0.25° and a temporal resolution of hourly data. Figure 2 shows the annual mean potential contrail cover over Europe based on ERA-5 Reanalysis data compared to NCEP/NCAR Reanalysis data. A similar analysis covering North America can be found in Appendix Figure A1. The higher resolution of the ERA-5 data is noticed first. Further, the potential contrail cover is lower for the NCEP/NCAR data compared to ERA-5 due to differing relative humidity data. The relative humidity shows strong gradients in the UTLS, which can be represented more precisely by the increased altitude resolution of the ERA-5 Reanalysis with 12 pressure levels in the range of 100 to 500 hPa, compared to the NCEP Reanalysis offering 7 pressure levels in this range. Due to the higher resolution, gradients in relative humidity typical for the upper troposphere and lower stratosphere can be resolved more accurately in the ERA-5 dataset. Further, the horizontal resolution for ECMWF data of 0.25° is an order of magnitude larger than the NCEP data of 2.5°, which enables the better resolving of small-scale cloud fields [20,21]. Additionally, Paltridge et al. [22], as one example, suggest that the humidity data of the NCEP Reanalysis, which is based on balloon-borne radiosonde measurements, are not precise and, therefore, not very suitable for scientific questions concerning water vapor in the lower stratosphere and upper troposphere. Kaufmann et al. [23] have shown that H 2 O data from the ECMWF Integrated Forecasting System (IFS), on which the ERA-5 Reanalysis builds upon [21], provide a good agreement with in situ measurements. This holds particularly in the upper troposphere for mixing ratios down to 30 ppm. Therefore, we decided to use the ERA-5 Reanalysis for further data processing.

3. Results

Based on the calculations described in Section 2.1 and the data specified in Section 2.2, the analysis provides the possibility to receive a quick and straightforward overview of the potential contrail cover and the potential contrail cirrus cover of the past years. Hereto, any time interval and region worldwide can be selected. Within the context of the ECLIF 3 flight measurement campaign, contrail statistics have been performed to evaluate the contrail conditions over Europe during the first half of April. This time period is well suited for the demonstration of the variability of contrail formation since it represents the junction between the warm and rather contrail-poor summer and the cold, contrail-rich winter and will, therefore, be presented in the following.

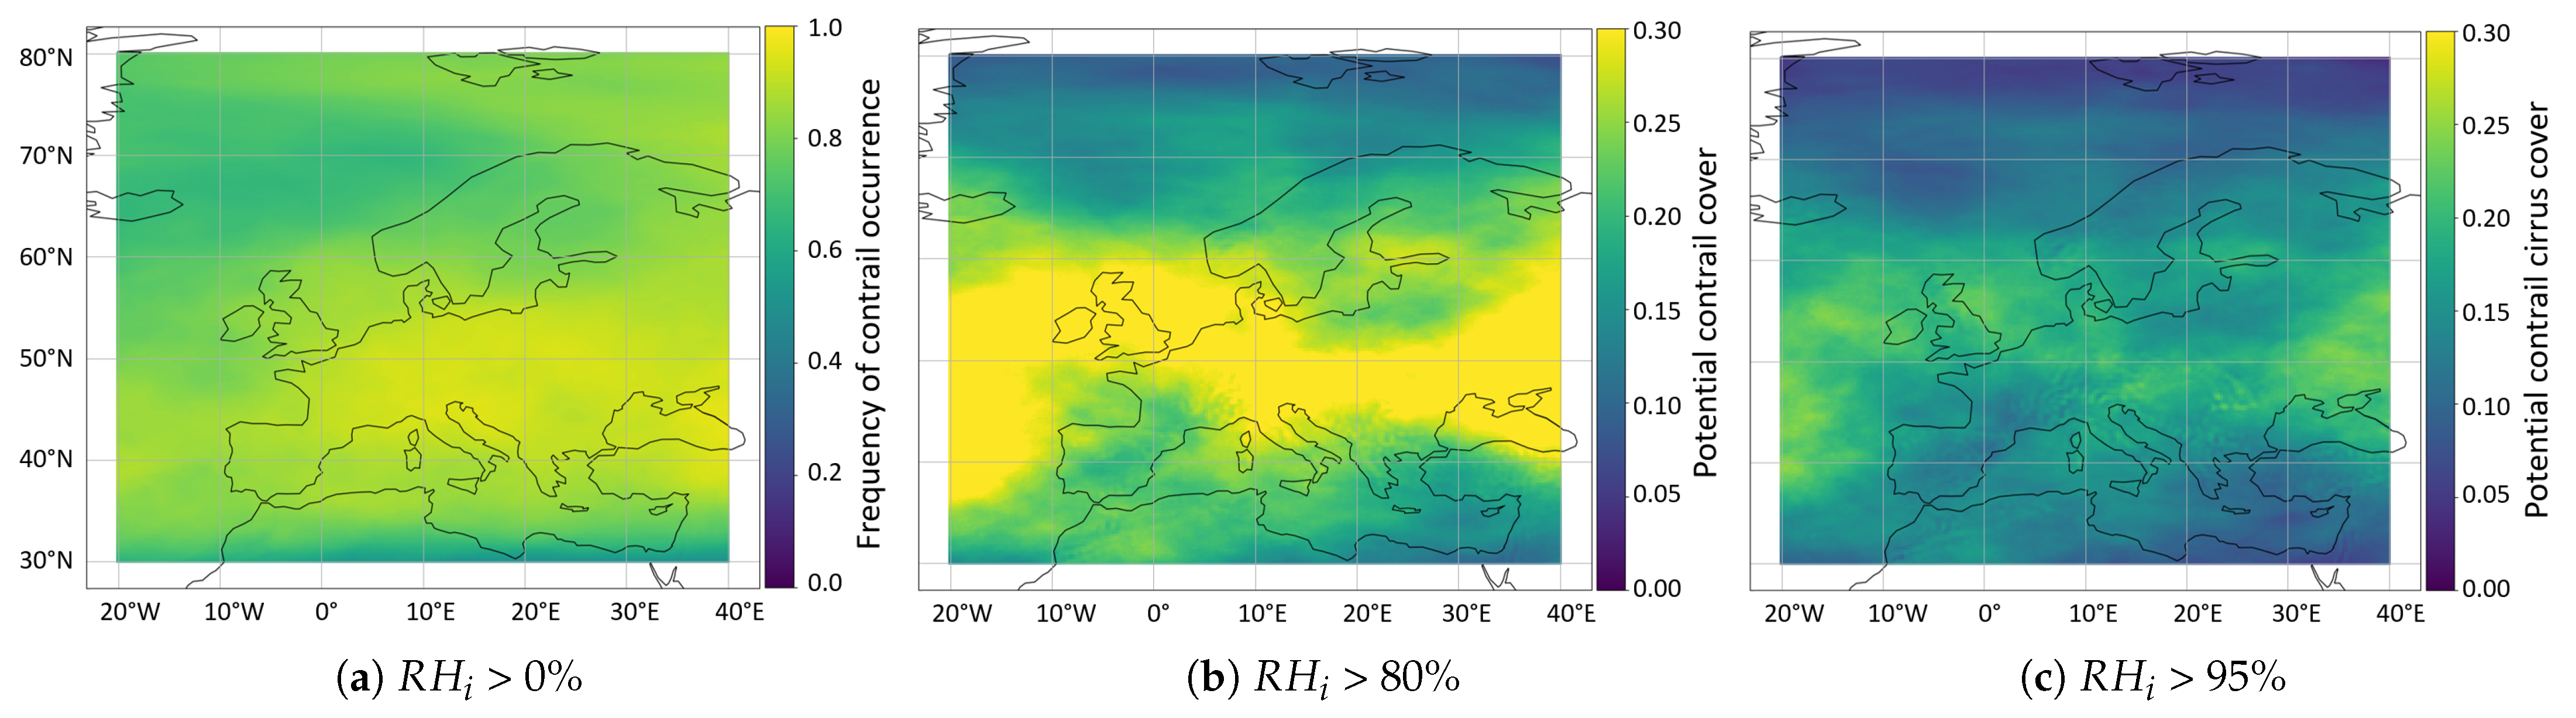
3.1. Influence of the Threshold for Relative Humidity on the Potential Contrail Cover

The impact of using different thresholds for the relative humidity is shown in Figure 3 as the potential contrail cover over Europe from 1 to 15 April. The frequency of contrail occurrence alone (Figure 3a) with no threshold for the relative humidity, the potential contrail cover (>80% R H i ), in Figure 3b), and the potential contrail cirrus cover (>95% R H i ) in Figure 3c) are shown. Panels (b) and (c) additionally use the relative humidity thresholds. Figure 3a) suggests that in the first half of April, the frequency of contrail formation at 250 hPa exceeds 90% almost everywhere in Europe. However, Figure 3b) indicates that relative humidity is an important limiting factor when investigating persistent contrails. In the north and south of Europe, the frequency of contrails long-lived enough for in-flight measurements reduces to 10–15%. A measurement area in central Europe would be preferred here.
With respect to the frequency of the formation of persistent contrails ( R H i > 95%), which are mainly responsible for the climate impact of contrails, the potential contrail cirrus cover is significantly reduced. Most contrails evaporate after a few minutes since the relative humidity is usually not high enough to support persistent contrails. The highest potential contrail cirrus cover appears towards Russia and over the Atlantic. Hence, in particular, flight routes over the North Atlantic are sensitive for contrail avoidance measures in that period [24,25].

3.2. Variation in Potential Contrail Cover over Altitude

The effect of changing flight altitudes, e.g., within the context of flight route optimization or, on the contrary, to force contrail formation during flight measurements, is demonstrated in Figure 4. In the following, in order to investigate contrail cirrus, which is most relevant for the climate, the threshold for the relative humidity is set to 95%. This way, the investigated contrails may persist for several hours if the atmospheric conditions remain favorable.
The potential contrail cirrus cover over Europe is shown for the first half of April. For the analysis, three pressure levels of the ERA-5 dataset were chosen, which are located within cruising altitudes at FL300 (or 300 hPa), FL340 (250 hPa), and FL390 (200 hPa). These cover an altitude range between 9 and 12 km. A comparison of pressure level 300 and 250 hPa shows that the potential contrail cirrus cover at pressure level 300 hPa is significantly larger over the continent and especially in the north due to higher relative humidity in these regions. On the contrary, the potential contrail cirrus cover over the Atlantic, west of the Bay of Biscay, decreased compared to FL340. It is still cold enough to meet the SAC; however, the relative humidity seems to be too low for long-lived contrails at FL300. Moreover, the potential contrail cirrus cover decreases significantly towards the south. The reason is not the relative humidity at this point but the air temperature at the lower flight altitude, which is too warm for contrail formation.
At FL390, contrail frequencies decrease further, leaving only a small patch with a potential contrail cirrus cover of 15–20% in the southwest. This altitude is located in the stratosphere, so low relative humidity and slightly higher air temperature prevent persistent contrail formation.

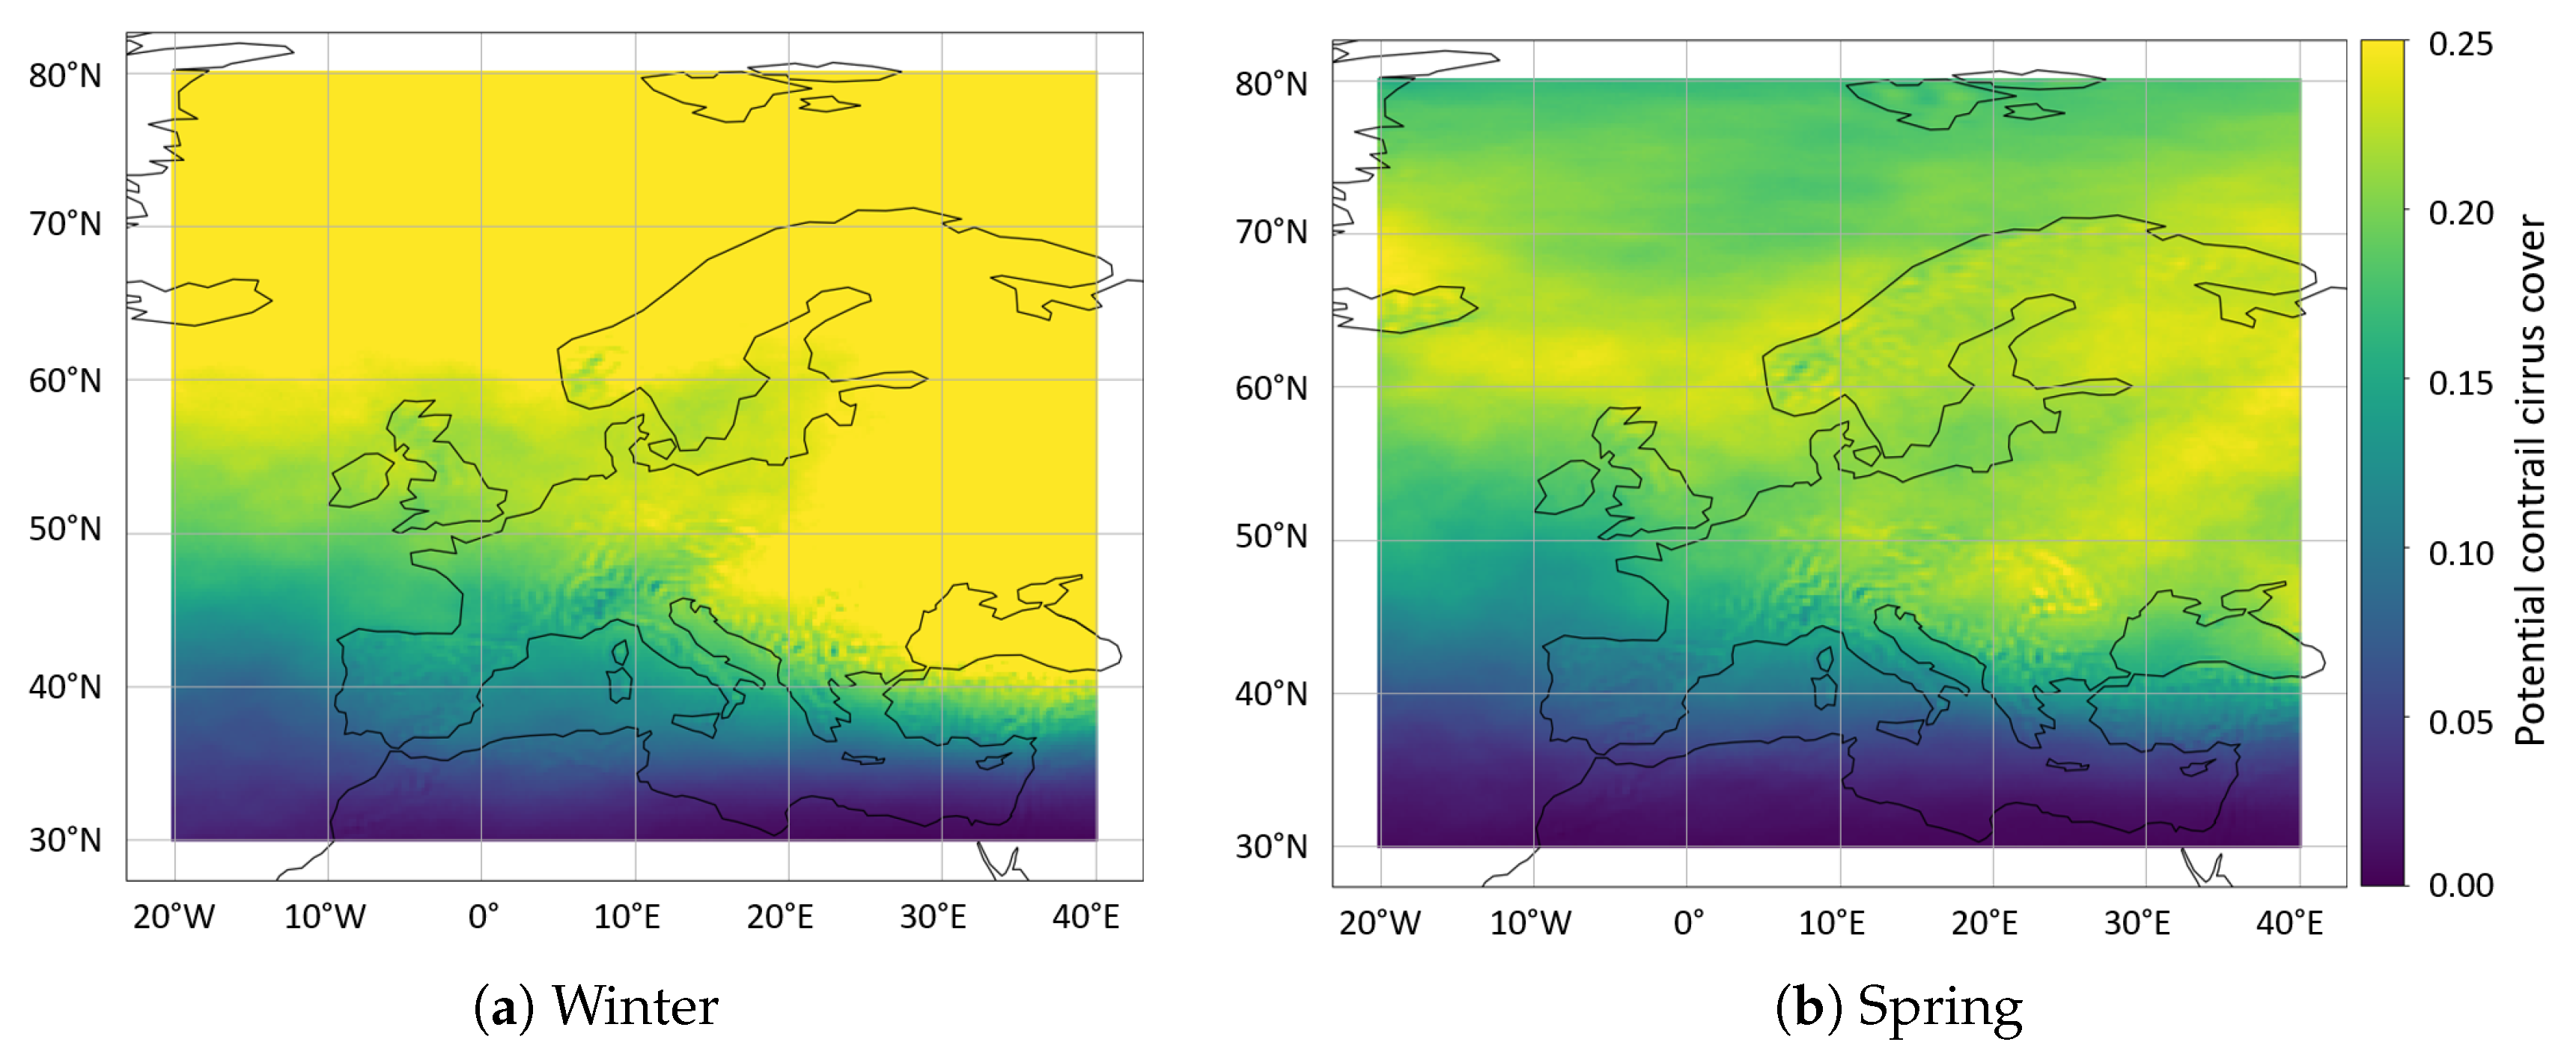
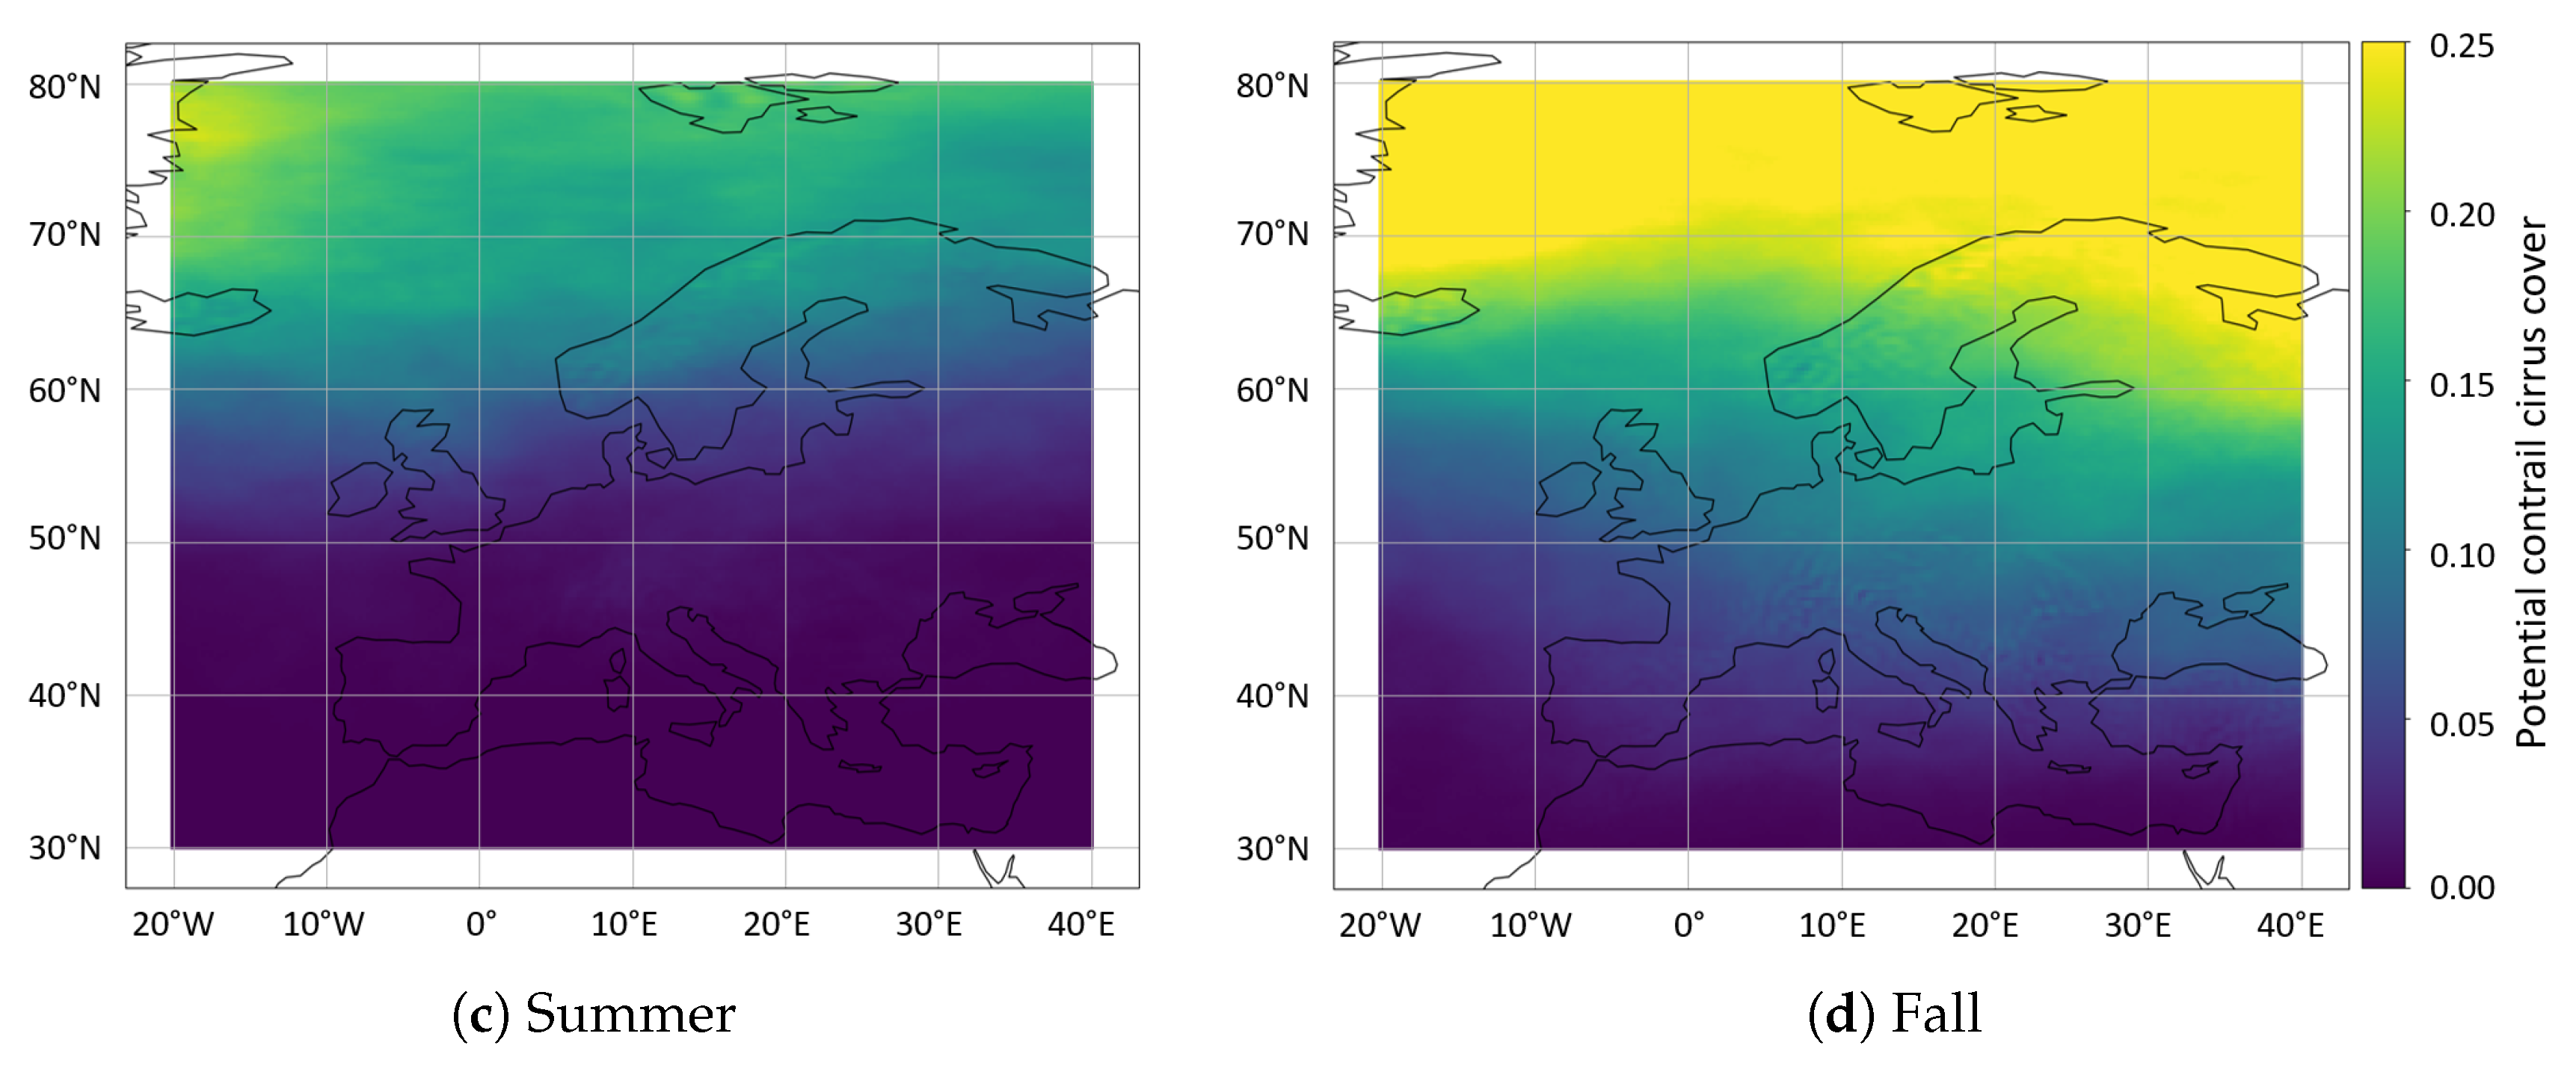
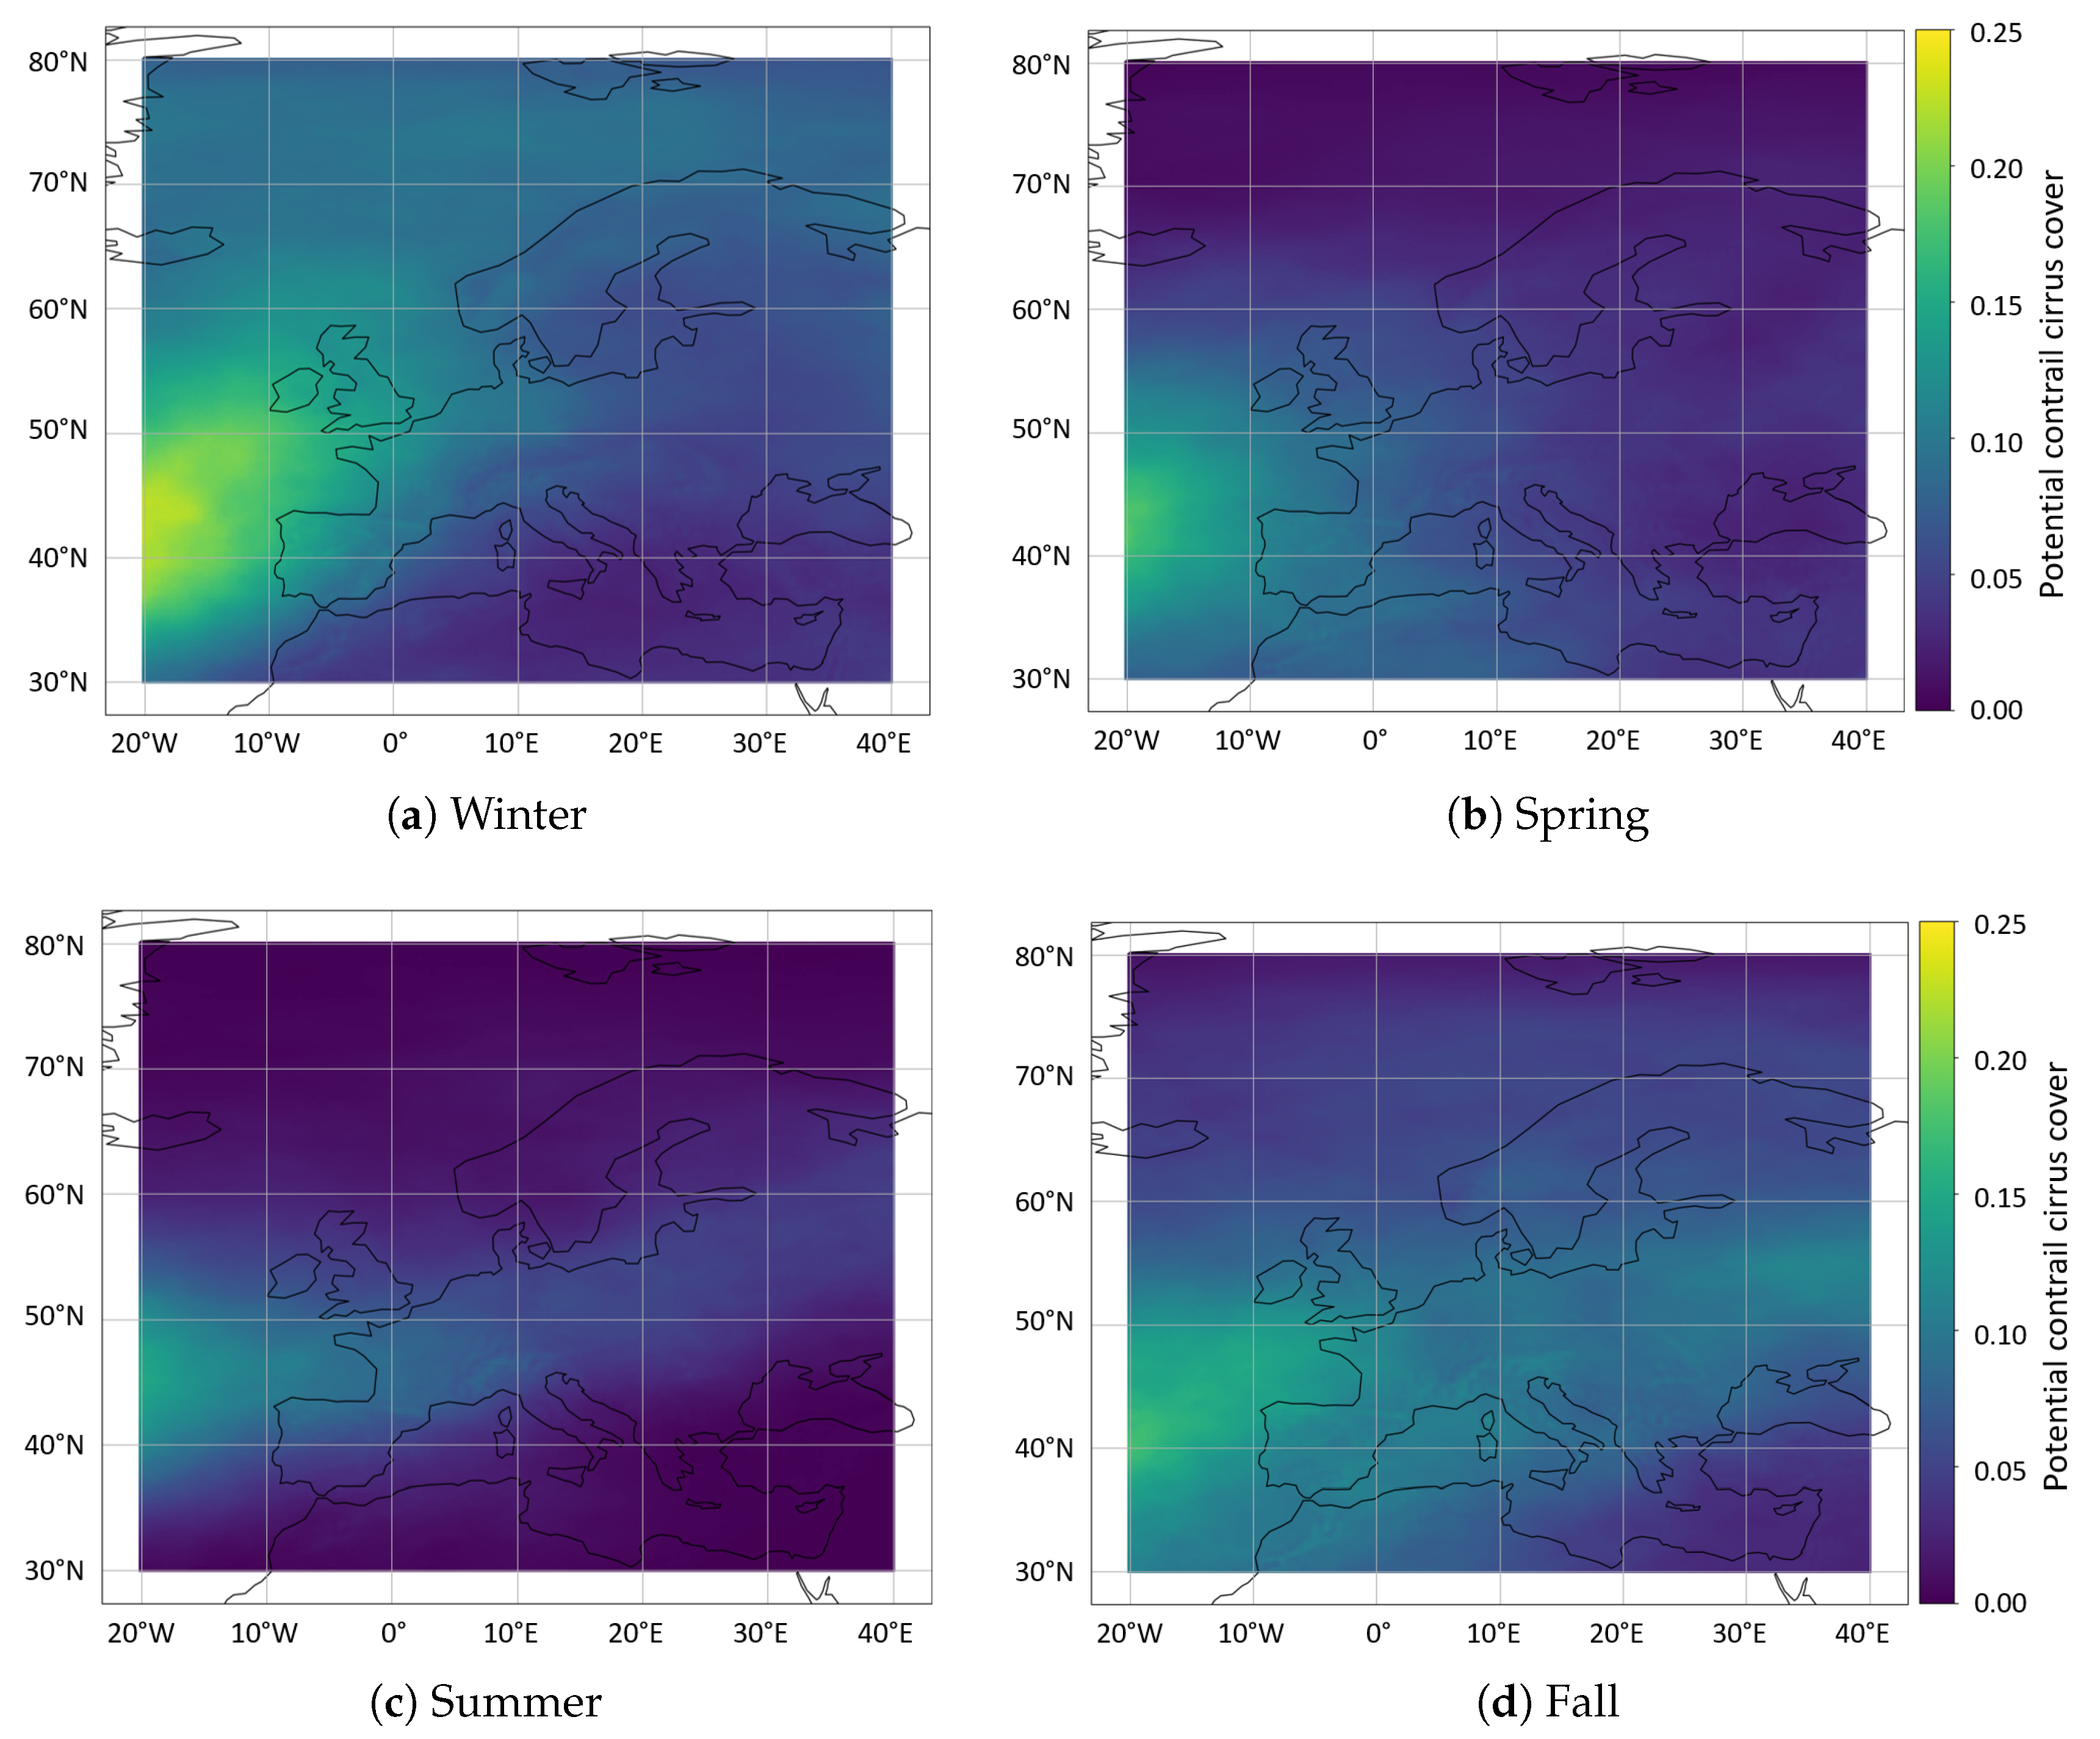
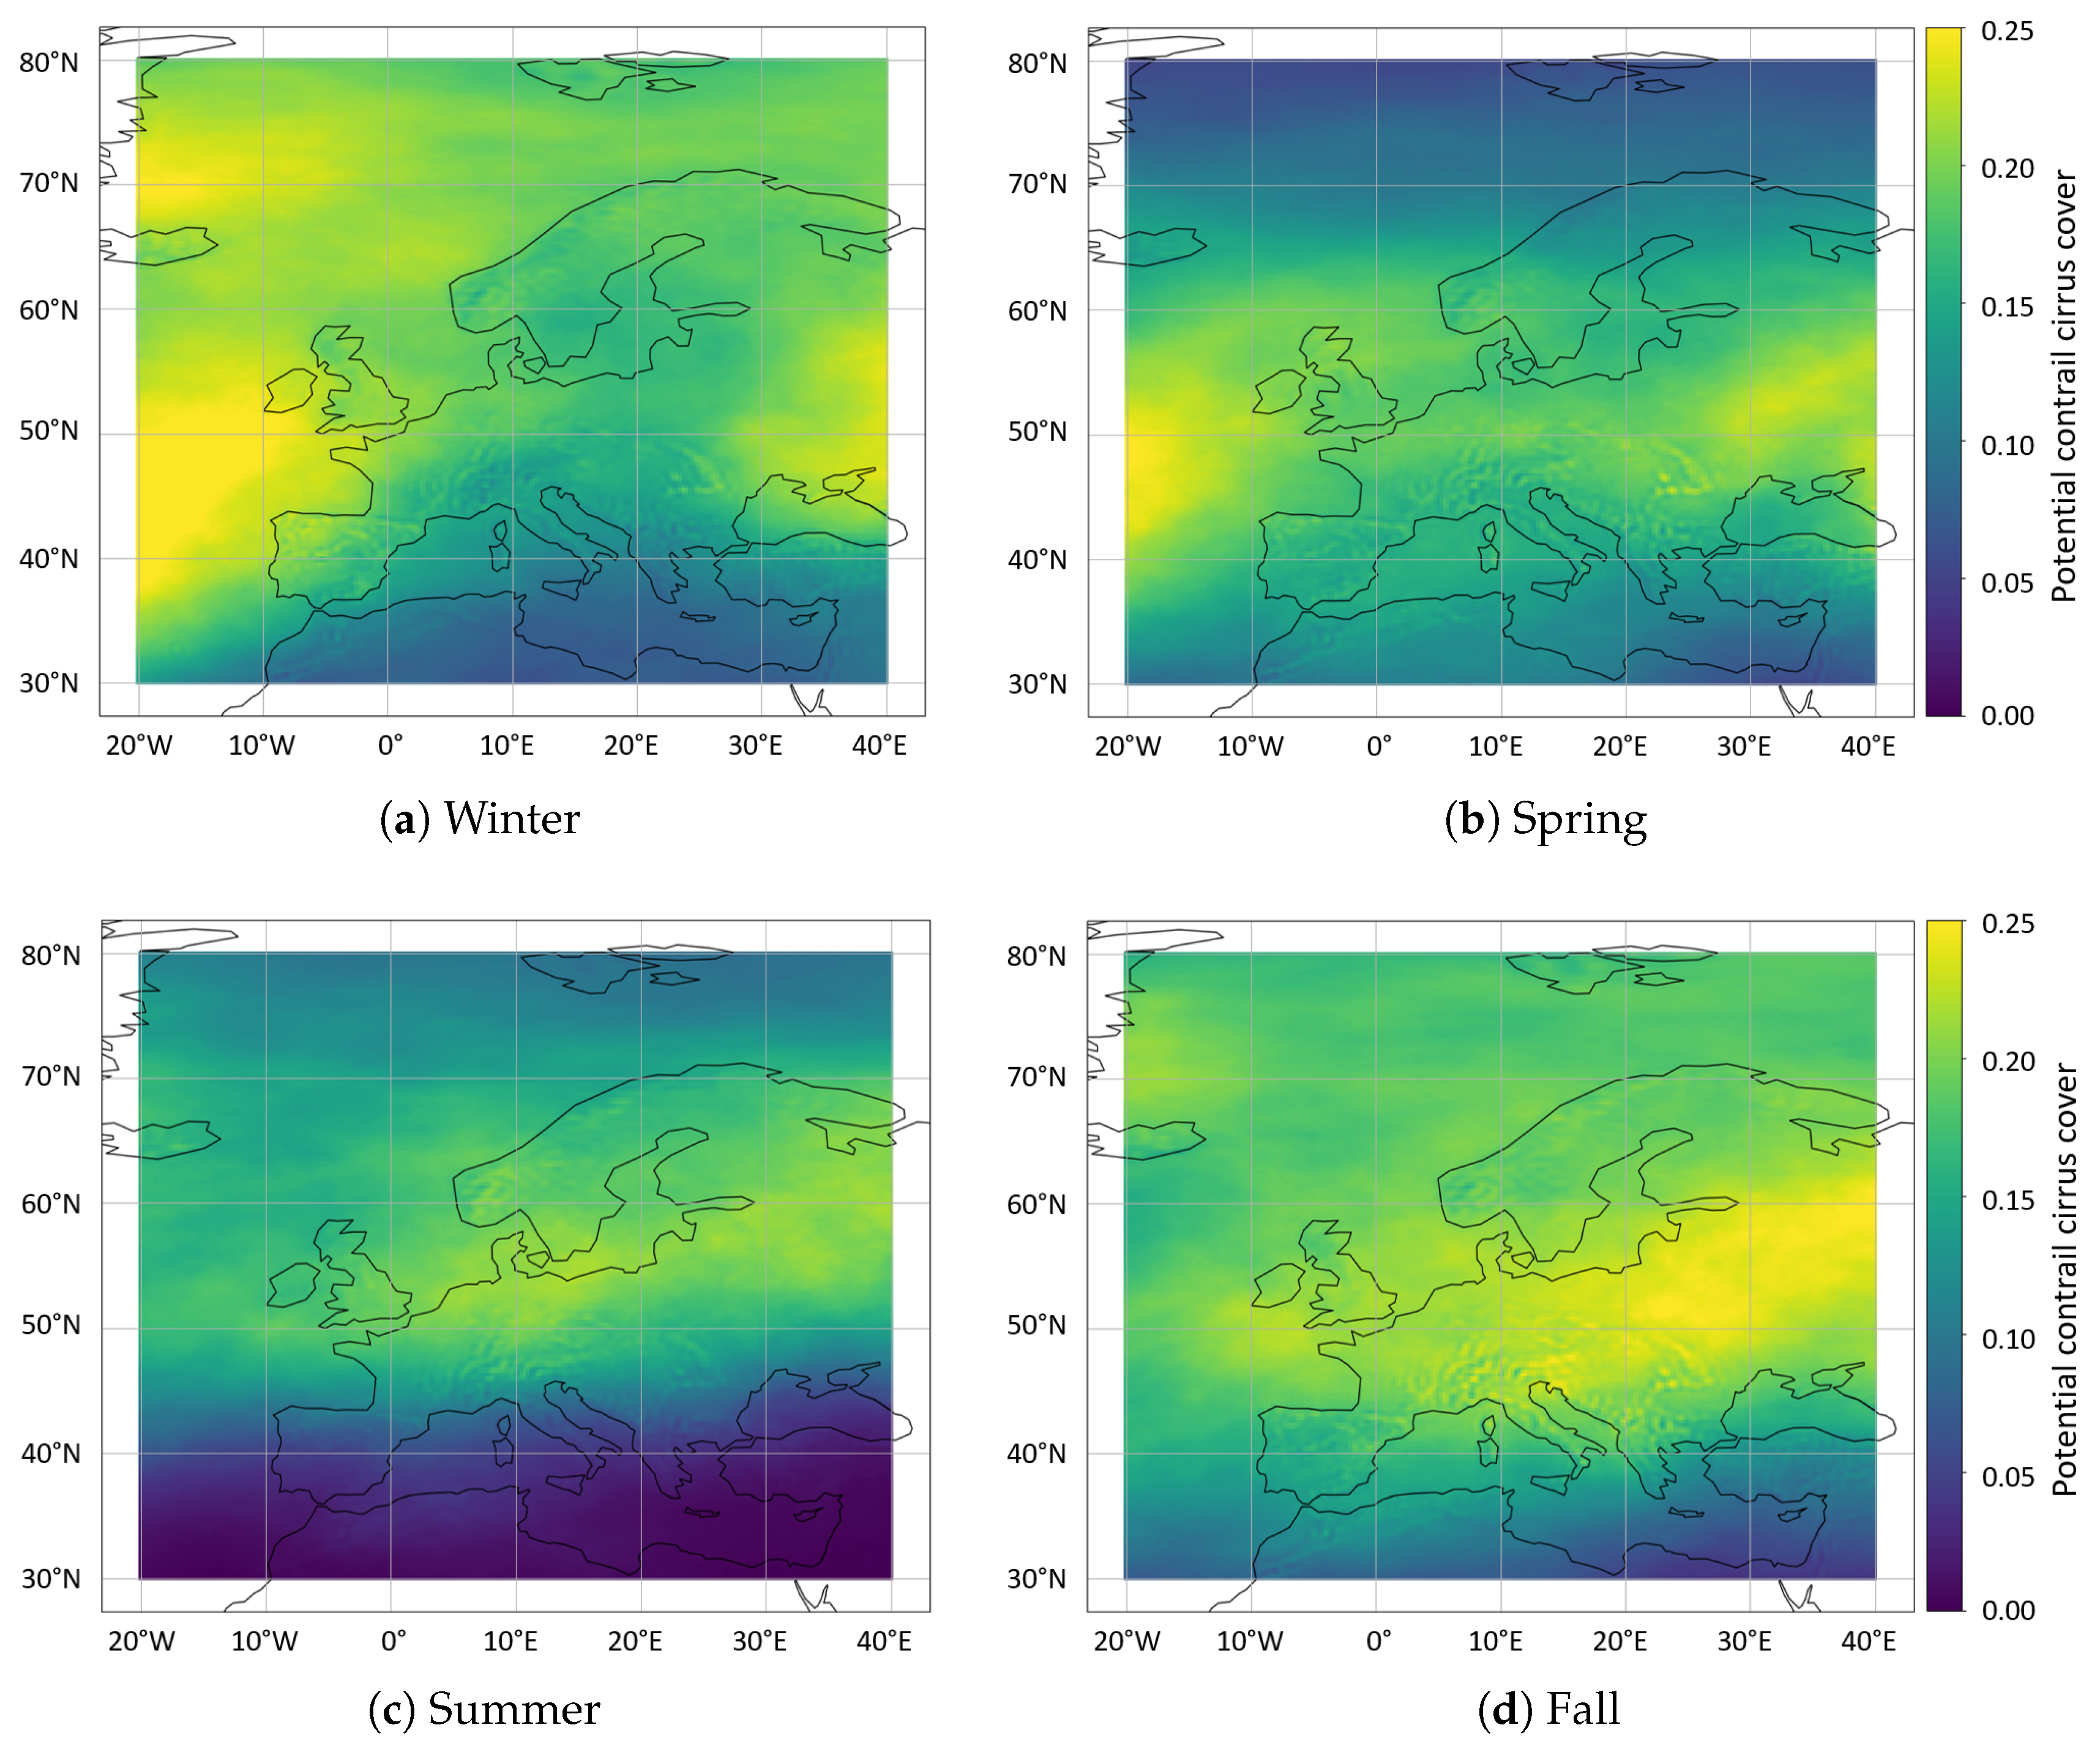
3.3. Seasonal Variation of the Potential Contrail Cirrus Cover

Not only the altitude but also the season has an influence on the formation and persistence of contrails, as shown in Figure 5. Here, the potential contrail cirrus cover averaged over the seasons (DJF, MAM, JJA, and SON) is shown over Europe at 250 hPa, using a threshold for the relative humidity of 95%. It is evident that the potential contrail cirrus cover is highest in winter and fall. During these seasons, the air temperature is generally low enough for the formation, and the relative humidity is also high enough for the persistence of contrails. Only in southern Europe, the formation is limited by the air temperature. At FL300 (see Appendix Figure A2), this trend is amplified, while at higher flight levels (see Appendix Figure A3), the decreasing relative humidity reduces the potential contrail cirrus cover. In spring, dry air masses prevent contrail persistence in northern Europe since the investigated pressure level is usually located in the stratosphere. Here, the potential contrail cirrus cover increases for lower flight levels due to an increase in relative humidity and decreases with increasing altitude. In summer, warm air masses almost completely prevent the formation of contrails in southern Europe. The same effect can be observed in the north, and it further increases with altitude. Hence, at a certain point, it does not necessarily improve the chances for contrail formation to shift flight experiments further north during the warm seasons. However, there are good chances to perform in-flight measurements of contrails at cruising altitudes all year around between 45° N and 65° N, although the fall and winter months are best suited for this purpose. Further, these regions and seasons are best suited for contrail mitigation studies by the targeted use of sustainable aviation fuels [6,26,27].

3.4. Temporal and Seasonal Evolution of the Potential Contrail Cirrus Cover

Figure 6 shows the biweekly distribution of the potential contrail cirrus cover over the year within the region 35° N–60° N, 15° W–15° E. Since we observe regional and latitudinal variations in contrail conditions, this area was selected to exclude the extremes of northern and southern Europe. Thus, a representative result for central Europe, where the main air traffic takes place, is obtained.
As discussed in Section 3.3, the highest potential contrail cirrus cover of up to 20% occurs between late fall and early spring, most evident at pressure level 300 hPa in Figure 6a). This applies, in particular, to the months of December to April. Thereafter, the potential contrail cirrus cover decreases continuously towards summer due to increasing air temperatures and finally reaches its minimum of 2% in July. At this point, the natural variability is also low. In fall, the potential contrail cirrus cover increases again due to decreasing air temperatures. At pressure level 250 hPa (Figure 6b), the potential contrail cirrus cover increases, especially during the summer months. As discussed in Section 3.3, this flight level offers the highest potential contrail cirrus cover averaged over the year, and the potential contrail cirrus cover shows less variation between 10% and 27%. On the one hand, air temperatures are lower compared to FL300 due to the temperature gradient in the troposphere, and, on the other hand, this pressure level is located largely in the troposphere so that rising stratospheric temperatures and low relative humidity, often found at 200 hPa, still play a minor role. Potentially climate-relevant contrails could be minimized by flying towards 200 hPa or even higher since the potential contrail cirrus cover is almost halved there (see Figure 6c). However, it should be noted that once the stratosphere is reached, aircraft-generated water vapor emissions become more climate relevant.

4. Discussion

Contrail cover assessment faces the same challenges as model validation in general. Due to their local and temporal limitations, in situ measurements are hardly applicable in this context. A preferred method could be a 10-year statistical analysis of satellite data to determine whether predicted persistent contrails really formed and whether they were long-lived. Contrail detection algorithms exist, which can identify linear contrails on satellite images [8,28,29]. Only contrails on a specific pressure level have to be evaluated since the calculation of the potential contrail cover and the potential contrail cirrus cover shown here is based on a fixed pressure level. This is difficult for satellite data, especially in the presence of multi-layer clouds [30], and makes it hard to obtain reliable results.
However, the calculations for the formation of contrails are well established and based on fundamental thermodynamic principles. It remains to be considered whether the data and the parameters used are reasonably chosen. Of course, the accuracy of temperature and relative humidity data provides the basis for the reliability of the results. While there is little controversy about the quality of the temperature data, there is greater uncertainty regarding the relative humidity data. Studies indicate that towards the tropopause, the model might overestimate the relative humidity in the order of 100% or even more [23,31]. As a result, the potential contrail cover and the potential contrail cirrus cover would be overestimated to a similar extent. In particular, flight altitudes above 10km would be affected. Gierens et al. [15,32] found large uncertainties when comparing the relative humidity from the ECMWF ERA-5 model to observations from the MOZAIC program. In order to improve the accuracy and reliability of the prediction of the potential contrail cirrus cover, an improvement in the relative humidity data of the ERA-5 Reanalysis in the tropopause region would be necessary. To constrain this evaluation to larger ice-supersaturated regions might improve the uncertainties.
Furthermore, fuel and engine-dependent parameters, especially the propulsion efficiency, varying between 0.2 and 0.4 depending on the aircraft and engine type, influence the SAC. For an ambient temperature of 224K, relative humidity of 90%, and air pressure of 250 hPa, an increase in η from 0.2 to 0.4 leads to an increasing Schmidt–Applemann threshold temperature by 2K due to more efficient engines only. The propulsion efficiency might further increase with improved engines in the future. Since kerosene is currently still the main fuel used for aviation, the variability regarding the emission index of water vapor and combustion heat is less evident. Based on theoretical calculations as well as measurements, the emission index of water vapor is 1.22–1.23kg kg 1 [9,19], resulting in a 0.08K difference in the SAC. Even larger deviations in E I H 2 O do not lead to significant changes in the threshold temperature. The same applies to combustion heat. Most jet category A fuels have a combustion heat of 43.0–43.2MJ kg 1 [33], which changes the SAC by only 0.04 K.
However, if the use of alternative fuels such as biofuels or even hydrogen increases, these parameters and calculation methods have to be adjusted (e.g., [34]). More difficult to predict than the formation is the persistence of the contrails. Constant conditions, as they are assumed here, are rarely found in the atmosphere. The lifetime of a contrail is rather determined by atmospheric dynamics, such as wind shear, advection, and turbulent mixing, but also by particle sedimentation and by the type and size of the emitted soot particles [35].
In the future, it would be valuable to further investigate the variability within the potential contrail cover and the potential contrail cirrus cover. Atmospheric conditions promoting contrail formation and persistence are highly dependent on synoptic weather conditions and the tropopause height and can change rapidly, especially during spring and fall.

5. Summary and Conclusions

At mid-latitude cruising altitudes, the atmosphere exhibits great variability, which also affects the frequency of the formation and persistence of contrails. In this context, two parameters are of particular importance; that is, the temperature of the ambient air and relative humidity over ice. For the formation of contrails, the air temperature must remain below a certain threshold temperature, whereas for contrail persistence, ice supersaturation of the ambient air is required. This results in seasonal variations of the potential contrail cover as well as dependencies on altitude and region. A general assessment of the frequency of contrail formation in the distant future, which cannot be based on recent weather forecasts, is, therefore, difficult. For instance, for the long-term planning of airborne measurements on the subject of contrails, knowledge regarding the atmospheric contrail conditions according to the Schmidt–Applemann criterion and the assessment of the relative humidity is important in order to identify in which regions and at which time of the year contrails preferentially form.
To address this question, climatology was developed that evaluates the air temperature and relative humidity based on ECMWF ERA-5 data from the last 10 years. The potential contrail cover and the potential contrail cirrus cover differ depending on the flight level, but, in general, it was found that the best conditions for contrail formation are in fall and winter at altitudes between 250 and 300 hPa, while the frequency is lowest in July. Furthermore, an area over central Europe is well suited for contrail measurements throughout the year. In southern Europe, warm air masses frequently prevent the formation of contrails, and in the north, their persistence is often inhibited as a result of low relative humidity. It is also the low relative humidity that reduces the potential contrail cirrus cover at higher flight altitudes towards the tropopause, while, in turn, warm air masses suppress the formation of contrails at lower altitudes.
The analysis makes it easy to obtain an overview of the potential contrail cover prevailing in selected regions and time periods. In the future, the analysis can, therefore, be used for further contrail cover evaluations in order to answer scientific questions related to the regional and seasonal assessment of the contrail climate impact. The analysis is not limited to Europe but can be expanded worldwide and to additional pressure levels. Our study also provides new insights into contrail avoidance strategies [36]. To assess these, the potential contrail cover fields have to be folded with flight routes and dedicated contrail climate models [35]. Contrail avoidance strategies could be most efficient during the night [10] in regions with high air traffic and high potential contrail cirrus cover.

Author Contributions

The work described here is part of R.D.’s Master thesis. Conceptualization, R.D. and S.K.; methodology, R.D. and S.K.; software, R.D. and S.K.; formal analysis, R.D.; investigation, R.D.; resources, S.K. and C.V.; writing—original draft preparation, R.D.; writing—review and editing, S.K. and C.V.; visualization, R.D.; supervision, S.K.; project administration, C.V.; funding acquisition, C.V. All authors have read and agreed to the published version of the manuscript.

Funding

This research has been supported by the Helmholtz-Gemeinschaft (grant no. W2/W3-060) and the Deutsche Forschungsgemeinschaft (grant nos. TRR 301—Project-ID 428312742 and SPP 1294 HALO—VO 1504/7-1).

Institutional Review Board Statement

Not applicable.

Informed Consent Statement

Not applicable.

Data Availability Statement

The source code of the tool can be made available by the authors on request. ERA-5 data are available from the Copernicus Climate Change Service Climate Data Store (CDS) under the link https://cds.climate.copernicus.eu/cdsapp#!/dataset/reanalysis-era5-pressure-levels?tab=overview (accessed on 28 July 2022). NCEP Reanalysis data are available from their web site at https://psl.noaa.gov/data/gridded/data.ncep.reanalysis.pressure.html (accessed on 29 January 2021).

Acknowledgments

ERA-5 data are provided by the European Copernicus Data Service. NCEP Reanalysis data are provided by the NOAA/OAR/ESRL PSL, Boulder, Colorado, USA. The authors would like to thank Andreas Dörnbrack for his support in data provision. We would also like to thank Klaus Gierens for reading and commenting on the draft version of this paper. We thank Ulrich Schumann and Daniel Sauer for useful discussions and support.

Conflicts of Interest

The authors declare no conflict of interest.

Appendix A

Figure A1. Annual mean potential contrail cover of the years 2010 to 2019 based on the ERA-5 Reanalysis (top) and the NCEP/NCAR Reanalysis (bottom) over North America at 250 hPa pressure level. The panels show clear differences between the models in terms of spatial resolution and potential contrail cover. The latter results from differences in humidity data between ERA-5 and NCEP/NCAR.
Aerospace 09 00485 g0a1
Figure A2. Seasonality in contrail formation and persistence, plotted over Europe at 300 hPa using a threshold for the relative humidity of 95%.
Aerospace 09 00485 g0a2aAerospace 09 00485 g0a2b
Figure A3. Seasonality in contrail formation and persistence, plotted over Europe at 200 hPa using a threshold for the relative humidity of 95%.
Aerospace 09 00485 g0a3

References

  1. Lee, D.; Fahey, D.; Skowron, A.; Allen, M.; Burkhardt, U.; Chen, Q.; Doherty, S.; Freeman, S.; Forster, P.; Fuglestvedt, J.; et al. The contribution of global aviation to anthropogenic climate forcing for 2000 to 2018. Atmos. Environ. 2021, 244, 117834. [Google Scholar] [CrossRef]
  2. Schumann, U. Über Bedingungen zur Bildung von Kondensstreifen aus Flugzeugabgasen. Meteorol. Z. 1996, 5, 4–23. [Google Scholar] [CrossRef]
  3. Appleman, H. The Formation of Exhaust Condensation Trails by Jet Aircraft. Bull. Am. Meteorol. Soc. 1953, 34, 14–20. [Google Scholar] [CrossRef]
  4. Hersbach, H.; Bell, B.; Berrisford, P.; Biavati, G.; Horányi, A.; Muñoz Sabater, J.; Nicolas, J.; Peubey, C.; Radu, R.; Rozum, I.; et al. ERA5 hourly data on pressure levels from 1979 to present. Copernic. Clim. Chang. Serv. (C3S) Clim. Data Store (CDS) 2018. [Google Scholar] [CrossRef]
  5. Kleine, J.; Voigt, C.; Sauer, D.; Schlager, H.; Scheibe, M.; Jurkat-Witschas, T.; Kaufmann, S.; Kärcher, B.; Anderson, B.E. In Situ Observations of Ice Particle Losses in a Young Persistent Contrail. Geophys. Res. Lett. 2018, 45, 13553–13561. [Google Scholar] [CrossRef]
  6. Voigt, C.; Kleine, J.; Sauer, D.; Moore, R.; Bräuer, T.; Le Clercq, P.; Kaufmann, S.; Scheibe, M.; Jurkat-Witschas, T.; Aigner, M.; et al. Cleaner burning aviation fuels can reduce contrail cloudiness. Commun. Earth Environ. 2021, 2, 114. [Google Scholar] [CrossRef]
  7. Bräuer, T.; Voigt, C.; Sauer, D.; Kaufmann, S.; Hahn, V.; Scheibe, M.; Schlager, H.; Diskin, G.S.; Nowak, J.B.; DiGangi, J.P.; et al. Airborne Measurements of Contrail Ice Properties—Dependence on Temperature and Humidity. Geophys. Res. Lett. 2021, 48, e2020GL092166. [Google Scholar] [CrossRef]
  8. Vázquez-Navarro, M.; Mannstein, H.; Kox, S. Contrail life cycle and properties from 1 year of MSG/SEVIRI rapid-scan images. Atmos. Chem. Phys. 2015, 15, 8739–8749. [Google Scholar] [CrossRef]
  9. Schumann, U.; Busen, R.; Plohr, M. Experimental Test of the Influence of Propulsion Efficiency on Contrail Formation. J. Aircr. 2000, 37, 1083–1087. [Google Scholar] [CrossRef]
  10. Teoh, R.; Schumann, U.; Gryspeerdt, E.; Shapiro, M.; Molloy, J.; Koudis, G.; Voigt, C.; Stettler, M. Aviation contrail climate effects in the North Atlantic from 2016–2021. Atmos. Chem. Phys. Discuss. 2022, 2022, 1–27. [Google Scholar] [CrossRef]
  11. Murphy, D.M.; Koop, T. Review of the vapour pressures of ice and supercooled water for atmospheric applications. Q. J. R. Meteorol. Soc. 2005, 131, 1539–1565. [Google Scholar] [CrossRef]
  12. Schumann, U. (Ed.) Atmospheric Physics: Background, Methods, Trends; Research topics in aerospace; Springer: Heidelberg, Germany; New York, NY, USA, 2012; OCLC: Ocn793690099. [Google Scholar]
  13. Weger, M.; Heinold, B.; Engler, C.; Schumann, U.; Seifert, A.; Fößig, R.; Voigt, C.; Baars, H.; Blahak, U.; Borrmann, S.; et al. The impact of mineral dust on cloud formation during the Saharan dust event in April 2014 over Europe. Atmos. Chem. Phys. 2018, 18, 17545–17572. [Google Scholar] [CrossRef]
  14. Kunz, A.; Spelten, N.; Konopka, P.; Müller, R.; Forbes, R.M.; Wernli, H. Comparison of Fast In situ Stratospheric Hygrometer (FISH) measurements of water vapor in the upper troposphere and lower stratosphere (UTLS) with ECMWF (re)analysis data. Atmos. Chem. Phys. 2014, 14, 10803–10822. [Google Scholar] [CrossRef]
  15. Gierens, K.; Matthes, S.; Rohs, S. How Well Can Persistent Contrails Be Predicted? Aerospace 2020, 7, 169. [Google Scholar] [CrossRef]
  16. Schumann, U.; Baumann, R.; Baumgardner, D.; Bedka, S.T.; Duda, D.P.; Freudenthaler, V.; Gayet, J.F.; Heymsfield, A.J.; Minnis, P.; Quante, M.; et al. Properties of individual contrails: A compilation of observations and some comparisons. Atmos. Chem. Phys. 2017, 17, 403–438. [Google Scholar] [CrossRef]
  17. Kaufmann, S.; Voigt, C.; Jeßberger, P.; Jurkat, T.; Schlager, H.; Schwarzenboeck, A.; Klingebiel, M.; Thornberry, T. In situ measurements of ice saturation in young contrails. Geophys. Res. Lett. 2014, 41, 702–709. [Google Scholar] [CrossRef]
  18. Kübbeler, M.; Hildebrandt, M.; Meyer, J.; Schiller, C.; Hamburger, T.; Jurkat, T.; Minikin, A.; Petzold, A.; Rautenhaus, M.; Schlager, H.; et al. Thin and subvisible cirrus and contrails in a subsaturated environment. Atmos. Chem. Phys. 2011, 11, 5853–5865. [Google Scholar] [CrossRef]
  19. Vay, S.A.; Anderson, B.E.; Sachse, G.W.; Collins, J.E.; Podolske, J.R.; Twohy, C.H.; Gandrud, B.; Chan, K.R.; Baughcum, S.L.; Wallio, H.A. DC-8-based observations of aircraft CO, CH4, N2O, and H2O emission indices during SUCCESS. Geophys. Res. Lett. 1998, 25, 1717–1720. [Google Scholar] [CrossRef]
  20. Kalnay, E.; Kanamitsu, M.; Kistler, R.; Collins, W.; Deaven, D.; Gandin, L.; Iredell, M.; Saha, S.; White, G.; Woollen, J.; et al. The NCEP/NCAR 40-year reanalysis project. Bull. Amer. Meteor. Soc. 1996, 77, 437–470. [Google Scholar] [CrossRef]
  21. European Centre for Medium-Range Weather Forecasts. ERA-Interim. Available online: https://www.ecmwf.int/en/forecasts/datasets/reanalysis-datasets/era-interim (accessed on 24 August 2021).
  22. Paltridge, G.; Arking, A.; Pook, M. Trends in middle- and upper-level tropospheric humidity from NCEP reanalysis data. Theor. Appl. Climatol. 2009, 98, 351–359. [Google Scholar] [CrossRef]
  23. Kaufmann, S.; Voigt, C.; Heller, R.; Brown, T.R.; Krämer, M.; Rolf, C.; Zöger, M.; Giez, A.; Buchholz, B.; Ebert, V.; et al. Intercomparison of midlatitude tropospheric and lower-stratospheric water vapor measurements and comparison to ECMWF humidity data. Atmos. Chem. Phys. 2018, 18, 16729–16745. [Google Scholar] [CrossRef]
  24. Lührs, B.; Linke, F.; Matthes, S.; Grewe, V.; Yin, F. Climate Impact Mitigation Potential of European Air Traffic in a Weather Situation with Strong Contrail Formation. Aerospace 2021, 8, 50. [Google Scholar] [CrossRef]
  25. Matthes, S.; Lührs, B.; Dahlmann, K.; Grewe, V.; Linke, F.; Yin, F.; Klingaman, E.; Shine, K.P. Climate-Optimized Trajectories and Robust Mitigation Potential: Flying ATM4E. Aerospace 2020, 7, 156. [Google Scholar] [CrossRef]
  26. Bräuer, T.; Voigt, C.; Sauer, D.; Kaufmann, S.; Hahn, V.; Scheibe, M.; Schlager, H.; Huber, F.; Le Clercq, P.; Moore, R.H.; et al. Reduced ice number concentrations in contrails from low-aromatic biofuel blends. Atmos. Chem. Phys. 2021, 21, 16817–16826. [Google Scholar] [CrossRef]
  27. Schripp, T.; Anderson, B.E.; Bauder, U.; Rauch, B.; Corbin, J.; Smallwood, G.; Lobo, P.; Crosbie, E.; Shook, M.A.; Miake-Lye, R.C.; et al. Aircraft Engine Particulate Matter and Gaseous Emissions from Sustainable Aviation Fuels: Results from Ground-Based Measurements During the Nasa/Dlr Campaign Eclif2/Nd-Max. Preprint. SSRN Electron. J. 2022. [Google Scholar] [CrossRef]
  28. Vazquez-Navarro, M.; Mannstein, H.; Mayer, B. An automatic contrail tracking algorithm. Atmos. Meas. Tech. 2010, 3, 1089–1101. [Google Scholar] [CrossRef]
  29. Duda, D.P.; Bedka, S.T.; Minnis, P.; Spangenberg, D.; Khlopenkov, K.; Chee, T.; Smith Jr., W.L. Northern Hemisphere contrail properties derived from Terra and Aqua MODIS data for 2006 and 2012. Atmos. Chem. Phys. 2019, 19, 5313–5330. [Google Scholar] [CrossRef]
  30. Tan, Z.; Ma, S.; Zhao, X.; Yan, W.; Lu, E. Evaluation of Cloud Top Height Retrievals from China’s Next-Generation Geostationary Meteorological Satellite FY-4A. J. Meteorol. Res. 2019, 33, 553–562. [Google Scholar] [CrossRef]
  31. Agarwal, A.; Meijer, V.R.; Eastham, S.D.; Speth, R.L.; Barrett, S.R.H. Reanalysis-driven simulations may overestimate persistent contrail formation by 100%–250%. Environ. Res. Lett. 2022, 17, 014045. [Google Scholar] [CrossRef]
  32. Wilhelm, L.; Gierens, K.; Rohs, S. Meteorological Conditions That Promote Persistent Contrails. Appl. Sci. 2022, 12, 4450. [Google Scholar] [CrossRef]
  33. Edwards, J.T. Reference Jet Fuels for Combustion Testing. In Proceedings of the 55th AIAA Aerospace Sciences Meeting, Grapevine, TX, USA, 9–13 January 2017; American Institute of Aeronautics and Astronautics: Grapevine, TX, USA, 2017. [Google Scholar] [CrossRef]
  34. Gierens, K. Theory of Contrail Formation for Fuel Cells. Aerospace 2021, 8, 164. [Google Scholar] [CrossRef]
  35. Schumann, U. A contrail cirrus prediction model. Geosci. Model Dev. 2012, 5, 543–580. [Google Scholar] [CrossRef]
  36. Teoh, R.; Schumann, U.; Stettler, M.E.J. Beyond Contrail Avoidance: Efficacy of Flight Altitude Changes to Minimise Contrail Climate Forcing. Aerospace 2020, 7, 121. [Google Scholar] [CrossRef]
Figure 1. Partial Pressure of water vapor vs. temperature, including saturation vapor pressure of ice (light blue) and liquid saturation (blue). The mixing line at p = 300 hPa is depicted in red. At point T LM , the latter is the tangent of the curve of liquid saturation. If the ambient air is colder than the threshold temperature T LC , contrails may form. This is shown exemplarily for an ambient temperature of 222.5K and relative humidity of 100% (green).
Aerospace 09 00485 g001
Figure 2. Annual mean potential contrail cover for the years 2010 to 2019 based on the ERA-5 Reanalysis (top) and the NCEP/NCAR Reanalysis (bottom) at the 250 hPa pressure level. The panels show clear differences between the models in terms of spatial resolution and potential contrail cover. The latter results from differences in humidity data between ERA-5 and NCEP/NCAR.
Aerospace 09 00485 g002
Figure 3. Influence of the different thresholds for the relative humidity over ice on contrail formation and persistence. (a) The frequency of contrail occurrence with no threshold for the relative humidity, (b) the potential contrail cover (>80% R H i ), and (c) the potential contrail cirrus cover (>95% R H i ) is mapped over Europe at pressure level 250 hPa for the first half of April. Note the different color scales for (a) compared to (b,c).
Aerospace 09 00485 g003
Figure 4. Influence of the flight altitude on the formation and persistence of contrails. The potential contrail cirrus cover over Europe is mapped for the first half of April with a fixed threshold of 95% for the relative humidity. (a) At FL300, a high-potential contrail cirrus cover is visible over the continent. (b) At FL340, the chances are highest in central Europe. (c) At FL390, only a small patch in the southwest with a potential contrail cirrus cover of 15–20% is left.
Aerospace 09 00485 g004
Figure 5. Seasonality in contrail formation and persistence, plotted over Europe at 250 hPa using a threshold for the relative humidity of 95%. The highest potential contrail cirrus cover appears in winter (a) and fall (d) due to cold air temperatures and high relative humidity in fall. In spring (b), persistent contrails are limited by the low relative humidity in the north, and in summer (c), by the high air temperatures in the south.
Aerospace 09 00485 g005
Figure 6. Temporal evolution of the potential contrail cirrus cover ( R H i > 95%) over the year. The potential contrail cirrus cover, including the standard deviation, within the region 35° N–60° N, 15° W–15° E is calculated for the pressure levels (a) 300, (b) 250, and (c) 200 hPa. The vertical sections indicate the seasons, and the grey area marks the minimum and maximum values of the two-week average.
Aerospace 09 00485 g006
Table 1. Parameters used for the calculation of the Schmidt–Applemann Criterion.
ParameterValueSource
Air temperature, TvariableECMWF ERA-5
Rel. humidity (ice), R H i variableECMWF ERA-5
Air pressure, pvariableECMWF ERA-5
Specific heat capacity (air), c p 1004 J kg 1 K 1 [2]
Molar mass ratio H 2 O/air, ϵ 0.622[2]
Emission index of water vapor, E I H 2 O 1.23 kg kg 1 [19]
Combustion heat, Q43.2 MJ kg 1 [9]
Propulsion efficiency, η 0.33[9,10]
Publisher’s Note: MDPI stays neutral with regard to jurisdictional claims in published maps and institutional affiliations.

