3.1. Flow Field Characteristics Analysis
As for the flow field of Case1 and Case 2, the Mach number contours of
z = 0 single jet and counter-flow jet are compared in
Figure 6. In
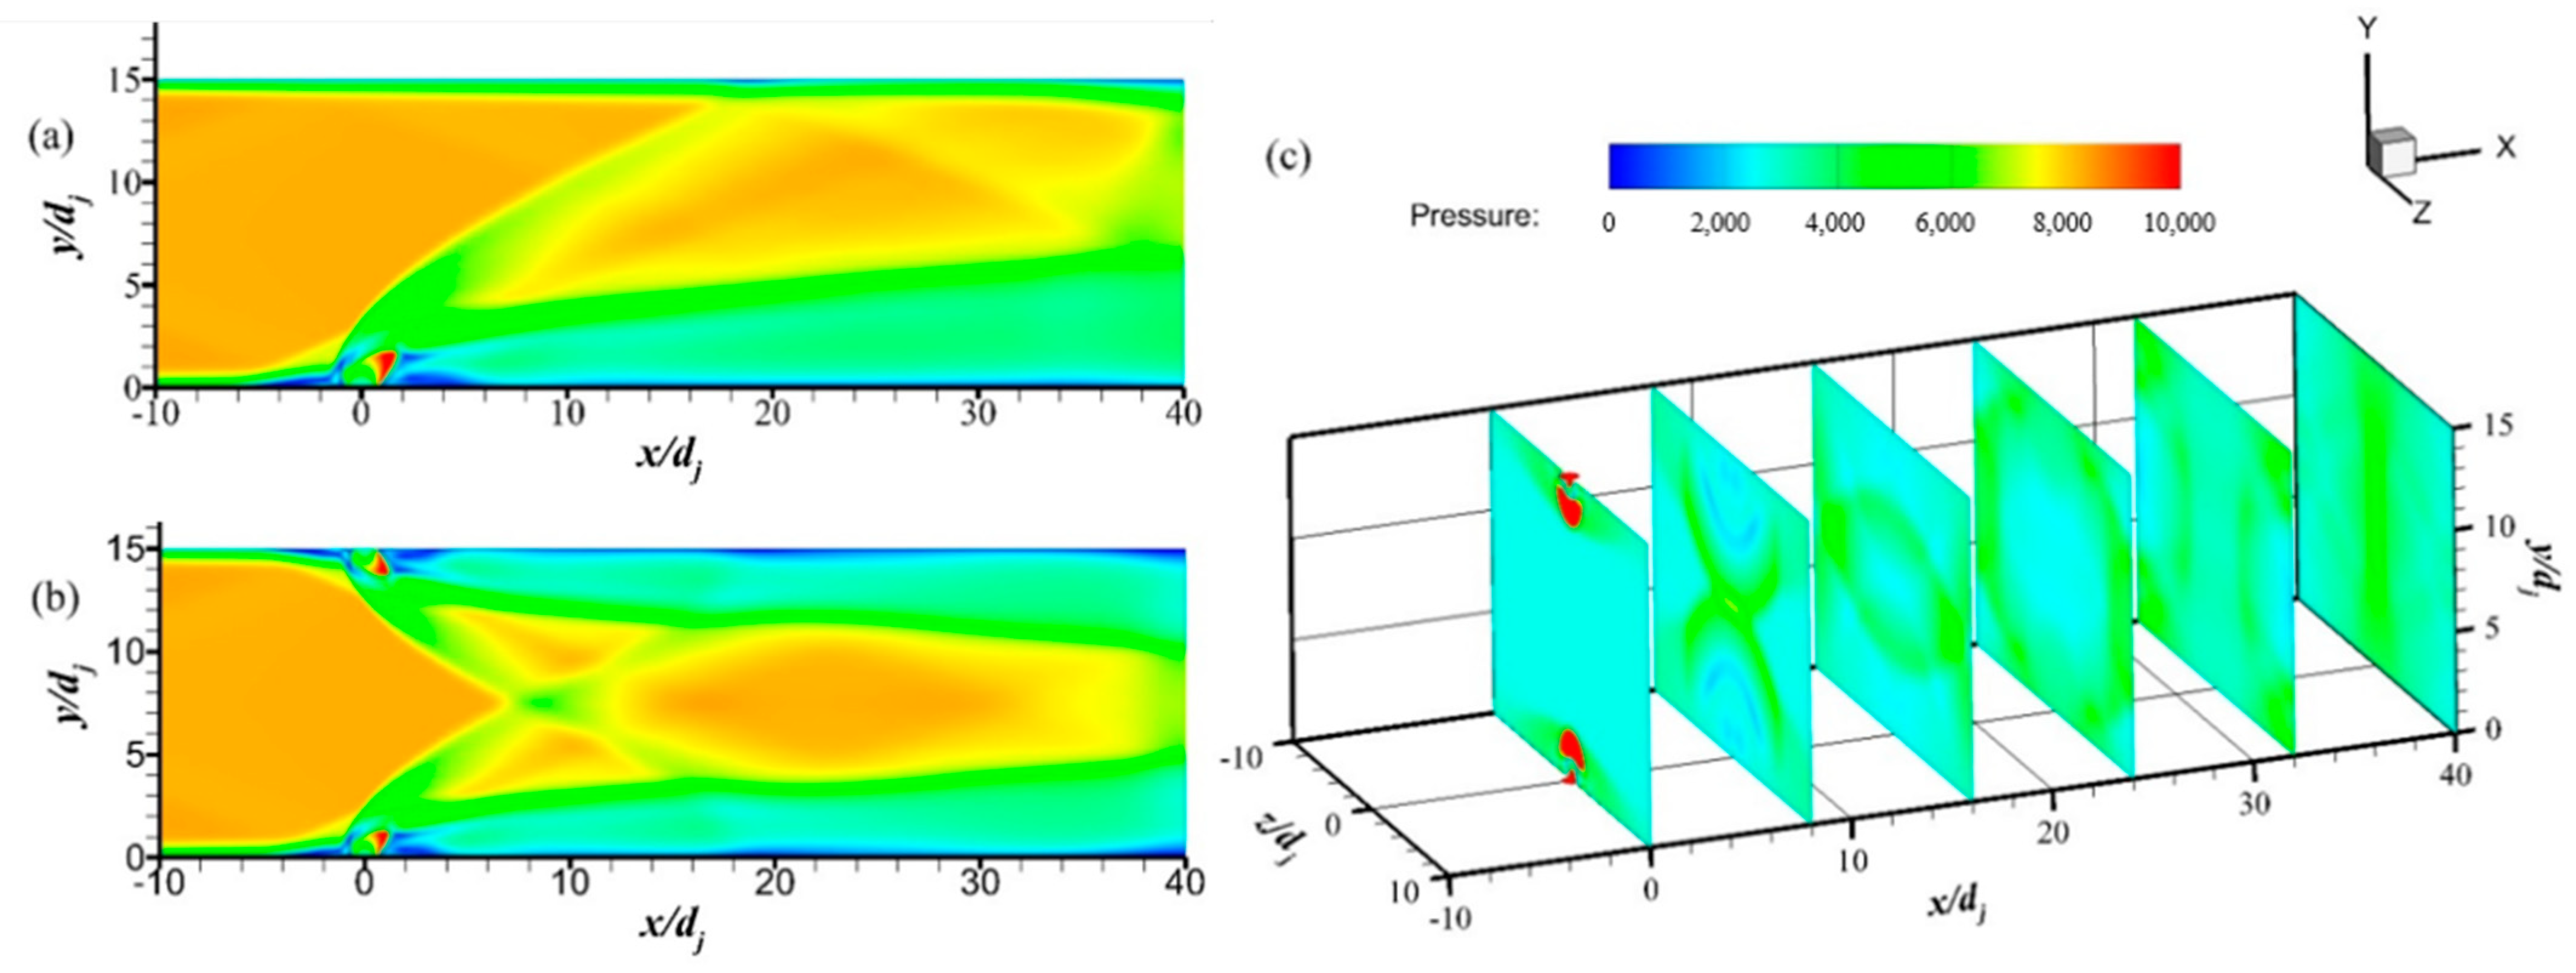
Figure 6a, the bow shock formed on the windward side of the fuel jet due to jet obstruction, forming reflected shock waves on the upper wall interacting with downstream. In
Figure 6b, both the upper and lower jets form bow shock waves on the windward side. Two oblique shock waves were generated at the intersection point and then reflected downstream on the upper and lower walls. The total mass flow rate of the single orifice jet is the same as that of the counter-flow jet. The position of the bow shock generated in Case1 interacting on the upper wall was the same as that in Case2, which was around
x/dj = 20. In
Figure 6c, at
x/dj = 8, the upper and lower groups of bow shocks intersect and spread downstream.
The vicinity of the hydrogen jet orifice in Case2 was studied, as shown in
Figure 7. In
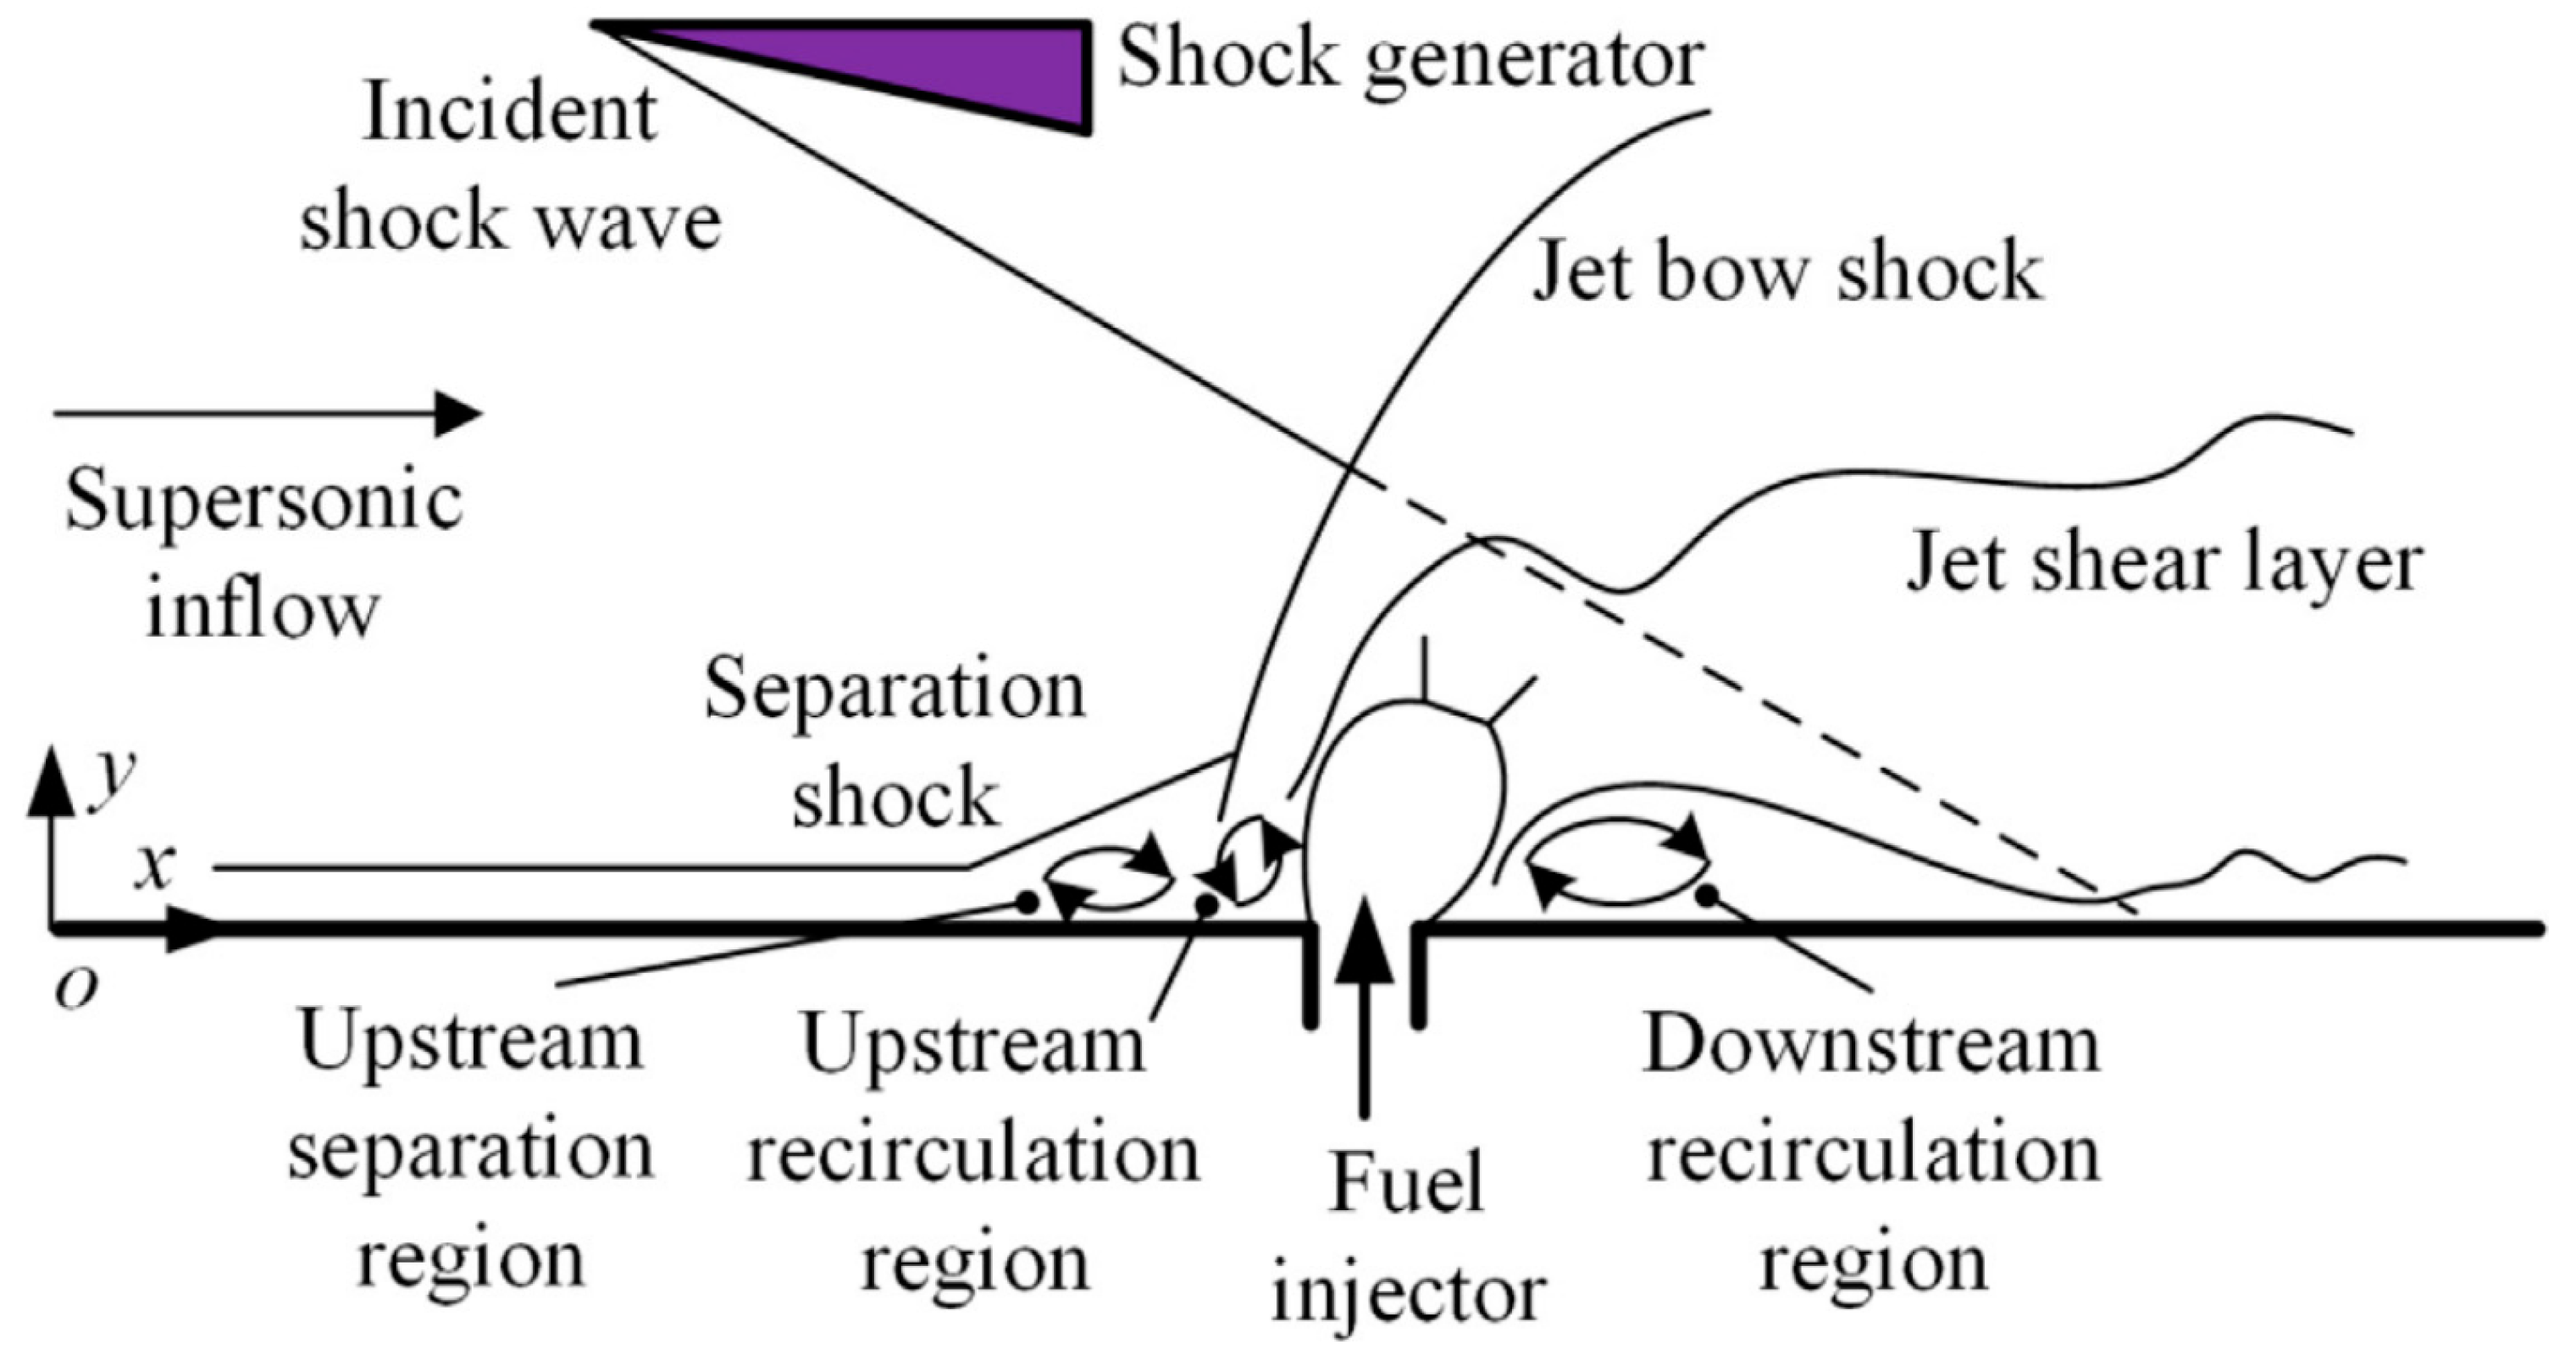
Figure 7a, due to the interaction of the fuel jet with supersonic inflow, the bow shocks, forming on the windward side of the jet, intersect at M and generate shock waves MN and MP, acting on the downstream. The bow shock waves interact with the boundary layer in front of the jet orifice. There is a zone of high pressure after the shock. An adverse pressure gradient is formed in the upstream zone of the jet orifice, which leads to the boundary layer separation. Then, the separation shock wave forms while the recirculation zone generates. The boundary layer separation zone upstream of the jet forms the horseshoe vortex zone, which can strengthen the mixing of inflow and fuel. After leaving the jet orifice, the under-expanded jet starts the approximatively isentropic expansion and interacts with supersonic crossflow, forming a barrel shock and Mach disk. In the front of the jet, the adverse pressure gradient caused by the fuel jet leads to a recirculation zone. Near the downstream zone of the jet, there is a region of low pressure, forming a flow separation zone and a recirculation zone, resulting in the ignition to maintain. The black curve in
Figure 7b is an isoline with flow velocity
Vx of 0, and the main recirculation zones are concentrated around the curve, which is reflected in the upstream, front of the jet, and downstream of the jet.
In Case3, the SWG was installed on the upper wall, and its induced shock wave mainly interacted with the hydrogen jet orifice on the lower wall. A series of expansion wave fans were generated at the top of the SWG and acted on the downstream, and intersected with the bow shock generated by the upper and lower wall jet, respectively. The Mach number increases after the expansion wave, as shown in
Figure 8a. In
Figure 8b, the fuel jet on the lower wall of the counter-flow jet deflects downward due to induced shock waves, and the fuel plume becomes more adherent to the wall. There is a significant uplift of hydrogen flow downstream.
The under-expanded fuel injected from the orifice spreads rapidly. Due to the k-H instability and the interaction between the jet and the inflow, there is a disturbance in the shear layer of the jet, resulting in the counter-rotating vortex pair (CVP) entraining the fluid around the CVP into the plume. The fluid around the CVP is mixed rapidly by shearing action during the enrolling process.
Figure 9 shows the pressure contour of the
z = 0 plane and bottom plane from jet orifice to
x/dj = 5, the contour of hydrogen mass fraction on
x/dj = 5, and the streamline is colored by hydrogen mass fraction. The streamlines due to the induced shock wave appear obvious downfold, the core of the fuel plume is closer to the wall, and self-ignition may occur due to the induced shock wave. The existence of the recirculation zone can provide an area for flame stability. The streamlines colored by the hydrogen mass fraction show the mixing progress of CVP coiling fuel. Hydrogen mass fraction of streamlines flowing to the core zone of CVP decreases obviously for the high mixing speed. In addition, at
x/
dj = 5, the trailing counter-rotating vortex pairs (TCVP) originate from the bottom boundary layer. Horseshoe vortexes are generated in the upstream recirculation zone and are displayed in
Figure 9.
In Case4, the SWG is set symmetrically to induce shock waves to intersect in front of the fuel jet, generating waves.
Figure 10a,b show the Mach number contour and hydrogen mass fraction contour of the axial plane (Z = 0) of Case4. In
Figure 10c, streamlines are colored with velocity in the
x direction, and the movement in the flow direction is shown. The wall surface is colored with temperature. The progress of unfolding and downfolding of inflow is shown due to induced shock wave, as well as the acceleration and deceleration of inflow due to shock wave and expansion wave action.
3.2. Fuel Distribution and Vortex Structure Analysis
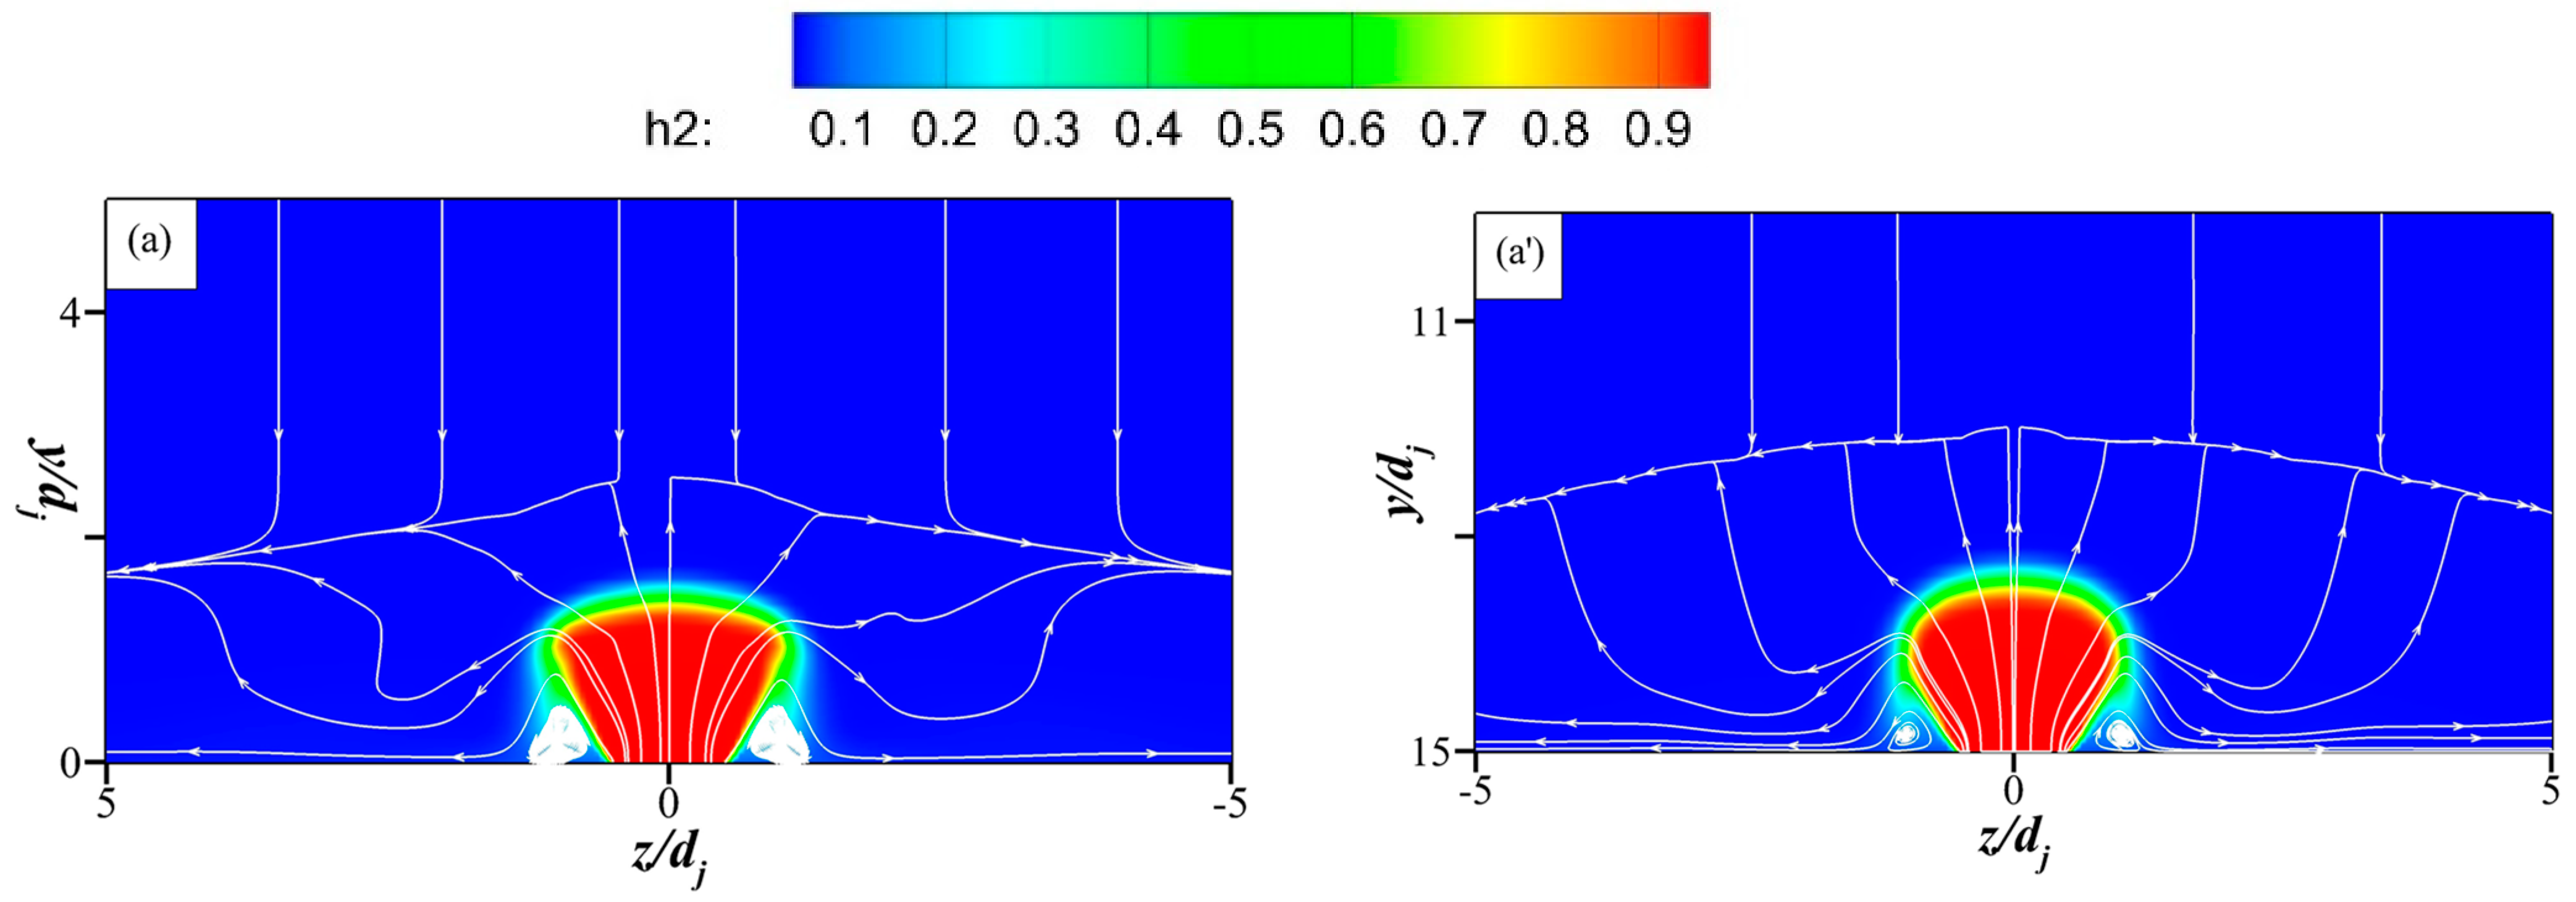
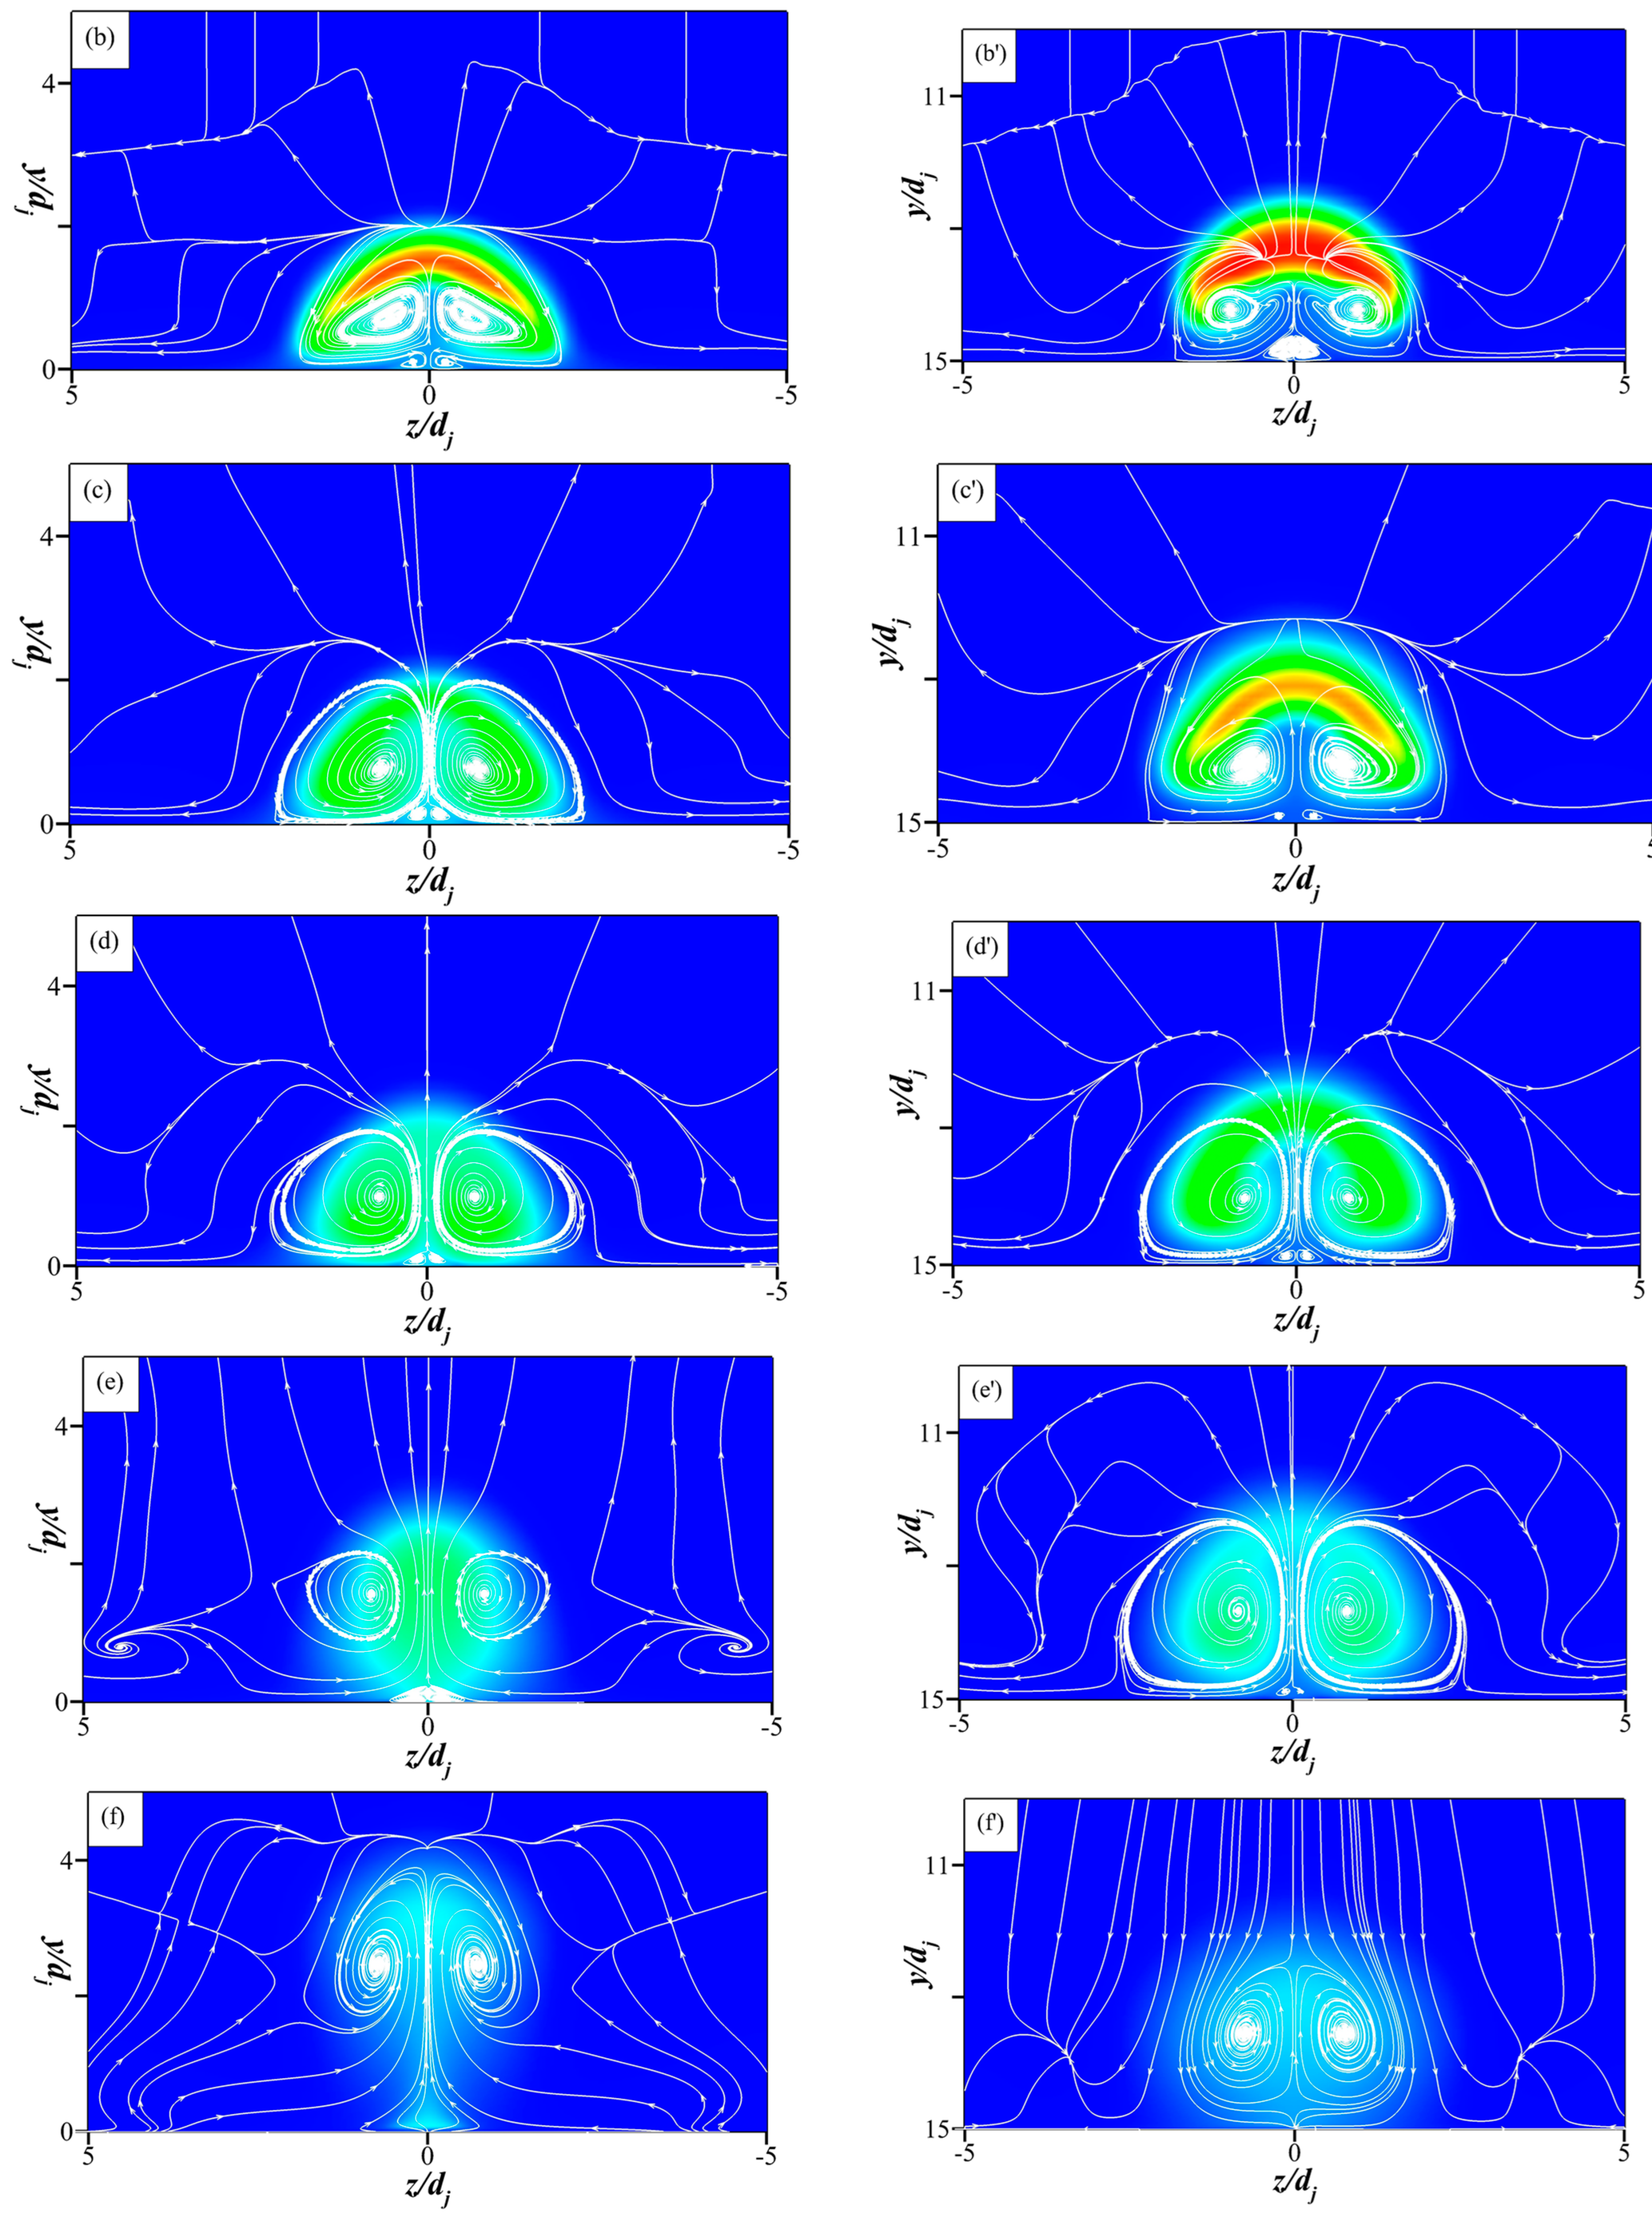
Figure 11 shows the spatial distribution of hydrogen in the flow field of Case3. In
Figure 11a,a′, fuel is injected into the flow field through the injection orifice. The hydrogen concentration is high in the fuel core area, and the horseshoe vortex structure appears on both sides of the bottom of the fuel core. In
Figure 11b,b′, the CVP structure has been formed, mainly under the fuel core, and the CVP drives the mixing of fuel and inflow. TCVP appears below the CVP structure, while there is less fuel distribution in the middle zone of CVP, and the fuel is confined to the CVP region. The Structure of CVP gradually expands and develops in an extensional direction, absorbing incoming flow in a larger area for mixing in
Figure 11c,d,c′,d′.
Figure 11e,e′,f,f′ show significant differences, mainly in the effect of induced shock waves on fuel jets. By comparing the left and right columns in
Figure 11, the core of the hydrogen plume is lower due to the induced shock wave, and the area of hydrogen mass fraction above 0.7 is significantly reduced. In the spreading direction, the horseshoe vortex structure can be found at
x/dj = 5, closer to the fuel center region, but it does not penetrate the fuel core region, so it has little effect on the mixing process [
30].
In Case4, Q criterion iso-surface of 1.0 and
x direction vorticity of each section, as shown in
Figure 12. Near
x/dj = 0 and
x/dj = 23, as shock waves generated by SWG and counter-flow jet act on
x/dj = 0 and
x/dj = 23, respectively, the distribution of Q criterion iso-surface in the two regions increases significantly in the direction of the spread. In the core region of the jet, the Q criterion iso-surface passes through the region with solid vorticity in the
x direction of each section.
As for the impact of the angle of SWG change on hydrogen distribution and vorticity of each section, the flow field data near the lower wall fuel jet in Case3, Case5 and Case7 were extracted, as shown in
Figure 13. The left side of the figure is the hydrogen mass fraction diagram, while the right is the
x-direction vorticity diagram. With the increase in the angle of SWG, the intensity of the oblique shock wave increases, and the shock/jet shear layer effect becomes more apparent. At
x/dj = 0, the horseshoe vortex area increases, and the region with higher vorticity is widely distributed. At
x/dj = 5, hydrogen is mainly distributed in the high vorticity region, CVP enrolling and dominating the mixing. At
x/dj = 10, the horseshoe vortex develops outward in the spreading direction and gradually moves away from the fuel core region. The distribution of hydrogen core breaks out of the limitation of the CVP structure. At
x/dj = 20, the fuel distribution and vortex structure are uplifted with the increase in the angle of SWG.
3.3. Analysis of the Mixing Parameters
In order to quantitatively study the induced shock wave’s influence on the counter-flow jet, the following parameters are selected for in-depth study. The total pressure recovery coefficient is defined as the ratio of total local pressure to inlet total pressure, reflecting the degree of total pressure loss. The larger the total pressure recovery coefficient is, the smaller the total pressure loss is, which is defined as:
where
represents the local total pressure and
represents the inlet total flow pressure.
The mixing degree of fuel and air is evaluated by the mixing efficiency, which mainly reflects the percentage of the fuel involved in the reaction in the overall fuel. The higher the mixing efficiency is, the better the mixing degree of effect is considered and is defined as:
where,
mtotal represents the total mass flow rate of hydrogen of jet fuel,
mmix represents the mass rate of hydrogen involved in mixing,
α represents the mass fraction of hydrogen of jet fuel,
αr represents the mass fraction of hydrogen involved in the reaction,
αs represents the chemical equivalent mass fraction of fuel which is 0.0283. The total pressure recovery coefficient and the mixing efficiency of the supersonic transverse jet directly affect the combustion efficiency [
31].
In experiments, the fuel penetration depth is usually represented by the upper boundary of the jet, which is considered as the 1% concentration iso-surface of the fuel [
32]. Li [
29] demonstrated the relationship between the mixing length and fuel concentration: that is, when fuel is mixed with the inflow, its mass fraction drops to 0.5, and its distance in the flow direction can be considered as the mixing length.
The influence on the layout of SWG is shown in
Figure 14. Compared with Case2 without SWG, the total pressure recovery coefficient of Case3 with unilateral setting and Case4 with symmetric setting decreased by 9.6% and 19.0%, respectively, at
x/dj = 40. Compared with Case2, the mixing efficiency of Case3 and Case4 is improved by 12.3% and 25.8%, respectively, at
x/dj = 40. The symmetrical setting of SWG can improve the mixing efficiency.
The impact of the angle of SWG is shown in
Figure 15 and
Figure 16. Based on the unilateral setting of the SWG, the total pressure recovery coefficients of Case2, Case3, Case5, and Case7 decrease successively after
x/dj = −10. At
x/dj = 40, the total pressure recovery coefficients of Case5, Case3, and Case7 decrease 3.4%, 9.7% and 16.5%, respectively, compared with Case2. In terms of mixing efficiency, the opposite conclusion is presented. At
x/dj = 40, the mixing efficiency of Case5, Case3, and Case7 is 3.9%, 12.3%, and 30.0% higher than that of Case2, respectively.
Based on the symmetric setting of the SWG, the total pressure recovery coefficients of Case6, Case4, and Case8 decrease by 5.7%, 23.4%, and 30.7%, respectively, compared with Case2 at x/dj = 40. In terms of mixing efficiency, at x/dj = 40, the mixing efficiency of Case6, Case4, and Case8 increase by 9.0%, 26.7%, and 56.7%, respectively, compared with Case2. The angle of SWG is between 10 and 30°, and the mixing efficiency increases with the angle increase.
The influence of the shock wave interacting position on the mixing augmentation is in
Figure 17. The difference in total pressure recovery coefficients of Case3, Case9, and Case10 are small in terms of total pressure loss. The shock wave interacting position affects the fuel counter-flow jet mixing in terms of mixing efficiency. After the fuel injection orifice, the mixing efficiency of Case9 is significantly higher than that of Case3 and 10. At
x/dj = 40, Case9 improves by 16.8% compared with Case3 and 10. The oblique shock wave acts on the front of the jet, influencing the mixing efficiency.
As for the fuel penetration depth, the influence of the angle of SWG and oblique shock position is mainly studied on the data in Case3, Case5, Case7, Case9, and Case10. In terms of fuel penetration depth, the angle of SWG is changed based on the unilateral setting of the SWG. In
Figure 18a,b, the penetration depth of Case7 is the largest, and the penetration depth of Case3 and 5 was the same. In
Figure 18c,d, the impact of the shock wave interacting position on fuel penetration depth is as follows: at the lower wall surface, the penetration depth of Case10 is the largest before
x/dj = 20, while that of Case9 is the largest after
x/dj = 20. Case3, Case9, and Case10 are the same near the upper wall. In terms of fuel penetration depth, the change of angle of SWG influences fuel penetration depth.
The coordinates of the furthest point of the mixing length in Case3, Case5, Case7, Case9, and Case10 are shown in
Figure 19. The mixing length of the lower wall fuel jet is smaller than that of the upper wall. At the lower wall, the mixing length decreases with the increase in the angle of SWG. In Case3, Case9, and Case10, the mixing length can be effectively shortened when the shock wave interacts near the fuel jet.
3.4. AHP Decision-Making Scheme
By the mixing parameters mentioned above: the total pressure recovery coefficient, mixing, mixing length, and the penetration depth of fuel efficiency, as an evaluation criterion, two mixing augmentation schemes are proposed: the angle of SWG and the position of SWG. To determine the enhancing effect of these two schemes on the mixing, the analytic hierarchy process (AHP) [
33] was used to make the optimization decision [
34,
35].
Firstly, the hierarchical structure was established, and G, the optimal mixing augmentation scheme, was taken as the target layer. C
1, the total pressure recovery coefficient, C
2, the mixing efficiency, C
3, the mixing length, and C
4, the penetration depth of fuel, are taken as the main influencing factors of the mixing augmentation scheme as the criterion layer. At the scheme layer, there are two schemes: A
1 changing the angle of SWG and A
2 changing the position of SWG, as shown in
Figure 20.
Secondly, to construct the judgment matrix, it is necessary to give the relative importance of each element at each level to each element at the upper level. In order to facilitate comparison, the judgment matrix is quantified, and the 1–9 scale is introduced based on the experience of scholars [
33], as shown in
Table 5.
For the mixing augmentation scheme, the total pressure recovery coefficient is determined as the primary objective to achieve the minimum total pressure loss to ensure thrust, mixing efficiency, mixing length to reduce the combustor length, and finally, the penetration depth. The scale values of the mixing augmentation scheme are shown in
Table 6.
Thus, the comparison matrix of the target layer and criterion layer is constructed:
Thirdly, the criterion layer is connected with the scheme layer to determine the pairwise comparison matrix of A
1 and A
2 on the four criteria. In terms of C
1, the total pressure recovery coefficient, according to the comparison of the total pressure recovery coefficient in
Section 3.3, changing the angle of SWG has a decisive influence on the total pressure recovery coefficient, which is very important compared with changing the position of the shock wave. Therefore, the comparison matrix of A
1 and A
2 on the C
1 criterion is:
In terms of the C
2 mixing efficiency, the mixing efficiency can be improved to a certain extent by changing the position of the SWG to change the shock wave interacting position, with the total pressure recovery coefficient unchanged, but the range of improvement is limited. Therefore, the comparison matrix of A
1 and A
2 on the C
2 criterion is determined as follows:
In terms of penetration depth, the fuel jet penetration depth varies significantly when the angle of the SWG is changed, whether on the upper or lower wall. Therefore, it is considered that the changing angle of SWG has a slightly significant influence. In comparing the mixing lengths of fuel jets on the upper and lower wall, Case3, Case5, and Case7 have a significant gap in flow distribution compared with Case3, Case9, and Case10. It can be determined that changing the angle of SWG has a significant relative influence. Therefore, the comparison matrices on C
3 and C
4 criteria are, respectively:
Fourthly, the following is a single hierarchical sorting and consistency test. Normalized the above judgment matrix:
The relative weight coefficient of
G is
. According to the weight coefficient vector, the maximum eigenvalue is approximately calculated.
Consistency indicators CI and RI are used to test. These corresponding values are shown in
Table 7.
The result shows that the inconsistency of
G is within the allowable range. As for judgment matrices B
1, B
2, B
3, and B
4, all pass the consistency test through the above process, and their weight coefficient vectors are:
Through the calculation of AHP, the evaluation result of A1 and A2 for the mixing augmentation scheme is . The decision-making outcome is that the A1 scheme is better than the A2. The effect of changing the SWG Angle on the mixing augmentation is better than that of changing the position of SWG.


