Abstract
Research on L1 to L2 transfer has mainly focused on segments, while less work has examined transfer in intonation patterns. Particularly, little research has investigated transfer patterns when the L1 has a lexical pitch contrast, such as tone or lexical pitch accent, and the L2 does not. The current investigation is a longitudinal study of the L2 English of an L1 Norwegian speaker, comparing two timeframes. One suprasegmental feature and one segmental feature are examined: rise–fall pitch accents and /z/, because Norwegian and English have different patterns for these features. The results showed that the speaker actually produced more pitch movements in the later timeframe, contrary to the hypothesis, and suggesting that he was hypercorrecting in the earlier timeframe. In the early timeframe, virtually no /z/ was produced with voicing, while in the later timeframe, about 50% of /z/ segments were voiced. This suggests that the speaker had created a new category for this sound over time. Implications for theories of L2 learning are discussed.
1. Introduction
Among multilingual speakers, L1 to L2 transfer in segments has been well-described (e.g., Flege and Port 1981; Nagy 2015), and recent research has also described transfer in suprasegmental aspects (e.g., Mennen and de Leeuw 2014). The goal of the current study is to examine, across time, the intonation patterns of a speaker whose L1 (Norwegian) uses lexical pitch accent but whose L2 (English) does not. I also examine a segmental pattern—voicing in English /z/—to see how that pattern develops across time in comparison with the intonation pattern.
1.1. Second Language Acquisition
Much work on L2 acquisition has focused on how segmental patterns transfer between a speaker’s languages, whether at the individual level or at the community level. At the individual level, work on segments has found that the L1 and L2 can influence one another in either direction (e.g., Flege and Eefting 1987; Jarvis and Pavlenko 2009; Lein et al. 2016; Major 1992). At the community level, when a whole group is bilingual, this can lead to larger scale transfer effects and the emergence of a contact variety (Mayr and Siddika 2018; McCarthy et al. 2013; Nagy 2015; Treffers-Daller and Mougeon 2005).
One common measure in phonetic studies of bilingualism is voice onset time (VOT), a measurement of stop voicing which examines the time between the release of a stop closure and the onset of vocal fold vibration (Lisker and Abramson 1964). As languages can have different patterns for this measurement, it has proven to be a useful way of measuring transfer patterns in bilinguals’ speech. For example, Flege and Eefting (1987) investigated stops in L1 Spanish speakers who were learning English, and found that in English, their voiceless stops had lower VOT values than monolingual English speakers, meaning that they were producing English voiceless stops with a more Spanish-like VOT pattern.
In terms of L2 acquisition theories, the Speech Learning Model (SLM) (Flege 1987, 1995; Flege and Bohn 2021; Flege and Eefting 1987; Flege et al. 2003) states that L2 phonemes are classified as new phonemes or as being similar to a phoneme in the L1 system. When the latter is the case, the L2 phoneme may be categorised as a phonetic realisation of an L1 phoneme, a process called equivalence classification. If the L2 phoneme is perceptually different from an L1 phoneme, it can be classified as a new sound and is thus easier to learn. The Perceptual Assimilation Model (PAM) (Best 1994; Best and Tyler 2007) also proposes that L2 sounds are perceived based on their similarity to L1 phonemes. As such, L2 phonemes may be assimilated in one of three ways: Two Category (TC) assimilation, where two L2 phonemes are categorised as two separate L1 phonemes (leading to accurate discrimination between them), Single Category (SC) assimilation, where two L2 phonemes are categorised as equally good (or poor) tokens of the same L1 phoneme, so discrimination between them is poor, and Category Goodness (CG), where two L2 phonemes are categorised as the same L1 phoneme, but they are not considered equally good examples of this phoneme.
1.1.1. Suprasegmentals
In terms of suprasegmental patterns in L2 learners, some general patterns have been found. For example, L1 Spanish speakers and L1 Dutch speakers learning English have a narrower pitch range in English than L1 English speakers (e.g., Backman 1979; Mennen 2008; Willems 1982). Similarly, Ordin and Mennen (2017) found that female bilingual speakers of English and Welsh used a wider pitch range in Welsh than in English. No such difference was found for male speakers. Intonation patterns have also been shown to transfer between a bilingual’s languages, for example, bilinguals of Dutch and Greek were found to have transfer in alignment patterns in both directions (e.g., Mennen 2004).
In some instances, a speaker’s languages may differ not just in alignment patterns or intonational pitch accent categories, but in whether pitch is used in lexical contrasts, as is the case in tonal languages. While intonation languages use different pitch accent categories for pragmatic purposes, such as focus, many languages use pitch lexically, including tonal languages and pitch accent languages. It is thought that over 40% of the world’s spoken languages use lexical pitch (Maddieson 2011), with tonal languages being able to use pitch changes on every syllable, and pitch accent languages on every stressed syllable (Hayes 1995). In such languages, pitch accent is a tonal pattern found on stressed syllables (Beckman 1986; Hyman 2009), defined by Hualde (2012) as “a class of stress languages where words contrast in the tonal melody that is associated with the stressed syllable” (p. 1335). (More detail on the pitch accent system of Norwegian is provided in Section 1.2).
Some research has investigated transfer patterns when both of the languages use pitch lexically, but in different ways. One study on a speaker of L1 Swedish (a pitch accent language) and L2 Mandarin (a tonal language) found that the Swedish speaker could not produce a contour tone on a monosyllabic word, presumably since in Swedish, the pitch accent contrast only occurs on words of minimum two syllables (Tung 2006). As such, it appears that lexical pitch patterns in the L1 can interfere with the learning of tonal patterns in an L2. However, this study did not compare the Swedish speaker’s productions to speakers of a language that does not use pitch lexically. A study comparing speakers of Swedish as an L2 who had L1s with or without tone found that those with a tonal L1 did not necessarily have an advantage in learning the Swedish pitch accents, but that it depended on what type of tonal language the L1 was (Tronnier and Zetterholm 2013).
Most relevant to the current study, research on L1 speakers of a tonal language who learn a non-tonal L2 has found that the L1 tonal patterns can transfer to the L2. For example, Cantonese English has been described as having tonal patterns (Gussenhoven 2012; Yiu 2014); similarly, Hong Kong English has been described as having high, mid, low, and falling tones (Wee 2016). French spoken by L1 Cantonese speakers has been analysed as having the Cantonese high tone on content words and the Cantonese low tone on function words (Lee and Matthews 2014). Japanese has a lexical pitch accent, and research on L1 Japanese speakers learning Spanish as an L2 found that they produce Japanese pitch accent patterns where none would occur in Spanish (Flores 2016). As such, lexical pitch patterns in the L1 can be transferred to an L2 even if it does not use pitch lexically. However, beyond the studies just cited, little is known about the extent to which bilingual speakers transfer L1 tonal patterns to a non-tonal L2.
Acoustic measures related to intonation include f0 level, f0 range, and pitch dynamism quotient (PDQ). F0 level is a measure of how high- or low-pitched a speaker’s intonation sounds, while f0 range measures the difference between a speaker’s maximum and minimum f0. F0 range is often measured as the middle 80% of a speaker’s range (Busà and Urbani 2011; Meer and Fuchs 2021). PDQ is a measure of the overall variability of f0, meaning how much f0 movement is produced, and this is measured as the standard deviation divided by its mean in Hertz (e.g., Hincks 2004; Meer and Fuchs 2021). These measures are relevant to the current study because they can provide a description of how much pitch movement a speaker is producing, which is relevant to rise–fall pitch accents.
1.1.2. Voicing Contrasts
The acquisition of voicing contrasts that differ between the L1 and L2 have been examined mainly in terms of stops (e.g., Bundgaard-Nielsen and Baker 2015; Flege and Eefting 1987). Mandarin has a stop contrast between voiceless unaspirated and voiceless aspirated stops, similar to English. In contrast, Russian has a contrast between voiceless unaspirated stops and voiced stops. Yang et al. (2022) examined the perception of Russian stops by L1 Mandarin speakers, and found that Russian voiced stops and voiceless unaspirated stops were perceived as being similar to Mandarin voiceless unaspirated stops, indicating that “when L2 sounds are perceptually similar to certain L1 sounds, their acquisition can be difficult even with an increase of L2 experience” (p. 20). If the voicing contrast exists at a different place of articulation, it may be possible for L2 learners to adapt their perception and production to a new place of articulation, as found by Flege and Port (1981) for L1 Arabic learners of English.
In English, the /s-z/ contrast also occurs as the allomorphic variants of the plural marker, with voicing assimilation occurring to that of the preceding obstruent; for example, in cats vs. dogs—in the former, the plural marker is [s] but in the latter it is produced as [z]. Recent research examined the acquisition of English sibilant voicing among speakers whose L1 varies in the use of /z/ (Contreras-Roa et al. 2020). French has /s/ and /z/ word-finally, Italian has word-final /s/ (although rarely) but not /z/, but has both word-medially, and Spanish does not have phonemic /z/ word-finally but has [z] allophonically (but non-obligatorily) in this position. Based on these differences, it was hypothesised that L1 French speakers would be able to produce English word-final /z/, L1 Italian speakers would be able to produce it by analogy with the word-medial contrast in their L1, and L1 Spanish speakers would have difficulty with it. The results supported the hypothesis regarding L1 French speakers, but for their measure of periodicity, L1 Spanish outperformed L1 Italian speakers in the production of English word-final morphemic /z/. The authors also note that L1 Italian speakers were able to produce English word-final /z/ when non-morphemic (that is, part of the stem, in a word such as buzz). They suggest that morphemic and non-morphemic /z/ in English are not treated the same by L2 learners.
1.2. Norwegian vs. English
Norwegian has a lexical pitch accent system (also called “tonal accent” (Kristoffersen 2000) or “word accent” (Bruce 1977)), whereby words carry either Accent I or Accent II. The phonetic implementation of the accent contrast varies by dialect, either in tonal makeup or tonal timing, but the pitch accent is generally a fall or rise–fall pattern (e.g., Almberg 2004; Fintoft 1970; Gårding 1973; Gussenhoven 2004). Figure 1 shows the accent contrast in disyllabic words in West Norwegian, which is relevant to the current study. In this figure, the thin vertical lines represent the beginning of the second syllable, showing that the high tone occurs earlier in Accent I than in Accent II.

Figure 1.
The West Norwegian lexical pitch accent contours (Accent I left, Accent II right), based on Gårding (1977).
In contrast, English uses (intonational) pitch accents for pragmatic reasons, such as on focused words (e.g., Pierrehumbert 1980). As such, L1 speakers of Norwegian learning English as an L2 are required to reduce the number of pitch accents in a sentence in order to approximate the intonational pattern of English. That is, they may be inclined to overuse pitch accents in English until they learn to supress this. As with segmental features of L2 learning (e.g., Flege 1995; Flege et al. 2003; Heselwood and McChrystal 1999), it is likely that as the learner becomes more proficient in the L2, the intonation patterns become more L2-like. Mennen (2015) developed the L2 Intonation Learning theory (LILt) specifically about L2 learning of intonation patterns, and this may be more appropriate to describe what an L1 Norwegian speaker might do in the production of English intonation. Particularly, LILt includes the frequency dimension, which refers to the frequency with which a particular intonational element is used. This is relevant to the current study because Norwegian uses pitch accents more frequently than English. Previous studies have found that L2 learners tend to use pitch accent patterns from their L1 even when this is not the same pattern as the L2 (e.g., Jilka 2000).
It is not just the intonation patterns that differ between these two languages. One feature of Norwegian- or Swedish-accented English is the lack of voicing in the English /z/ sound (Hincks 2003). This pattern occurs due to transfer from the L1, since Norwegian and Swedish do not have /z/ in their phonological inventories and also do not have it allophonically (e.g., Engstrand 2004; Kristoffersen 2000). In fact, Norwegian has no voiced fricatives at any place of articulation. As such, it may be difficult for L1 Norwegian speakers to perceive voicing contrasts in fricatives. In the PAM model (Best 1994), this would mean that the English /z/ could be assimilated to the Norwegian /s/ phoneme category, in SC assimilation, or else CG may take place, where English /s/ may be a good example of the Norwegian /s/, but English /z/ may be a poor example of the same phoneme. In the SLM model (Flege 1995), the process of equivalence classification may take place, whereby due to acoustic similarity, the English /z/ may be categorised as a phonetic realisation of the Norwegian /s/. Similar to Norwegian, Danish has /s/ but not /z/, and research on L1 Danish speakers’ perception of the /s/-/z/ contrast in English found that they had difficulty distinguishing them, and perceived /z/ as similar to /s/ (Bohn and Ellegaard 2019). This difficulty in perception may naturally correlate with a difficulty in production of the contrast.
1.3. Current Study
The current investigation is a longitudinal study of the L2 English of one L1 Norwegian speaker, Ole Gunnar Solskjær. Using interviews from two time periods, 1996–1998 and 2021, I examined one suprasegmental pattern and one segmental pattern of his English. The recordings were taken from YouTube in July 2021. In a similar logitudinal study, de Leeuw (2019) examined some German segments and average pitch of L1 German speaker Steffi Graf. Examining one speaker does not require controlling for interspeaker differences, and comparing an earlier timeframe with a later timeframe where the speaker has more exposure and practice with the L2 can provide insight into how speech patterns change over time. Using interviews available online allows for an examination of spontaneous speech. Solskjær was chosen as the subject of the current study because he moved to England in 1996 (aged 23) and has mostly lived in the UK (Manchester) ever since. He is from Kristiansund on the west coast of Norway, where a West Norwegian dialect is spoken. While he spoke English before moving to the UK, his English was audibly more Norwegian-accented in the earlier timer period, and his English has been described in a number of YouTube comments as having features of the Mancunian accent. For example, “is it just me or does it sound like hes got abit of a manchester sort of accent he just pronounces his words in such away?” and “He sounds very Mancunian” (YouTube Channel 2011). The goal of the study was to examine how these two features (one suprasegmental, one segmental) changed over time as the speaker gained more experience with the L2.
2. Study 1: Intonation
2.1. Methods
2.1.1. Speaker
Ole Gunnar Solskjær is from Kristiansund, on the west coast of Norway. He moved to Manchester in 1996, aged 23, to play for Manchester United. He remained in the region ever since, except for a brief period where he managed a Norwegian team in 2011–2013.
2.1.2. Recordings
In total, ten English-language interviews were examined, five from each time period (1996–1998 and 2021). These were obtained from YouTube. The recordings were a combination of press conferences and interviews.
2.1.3. Labelling and Measurements
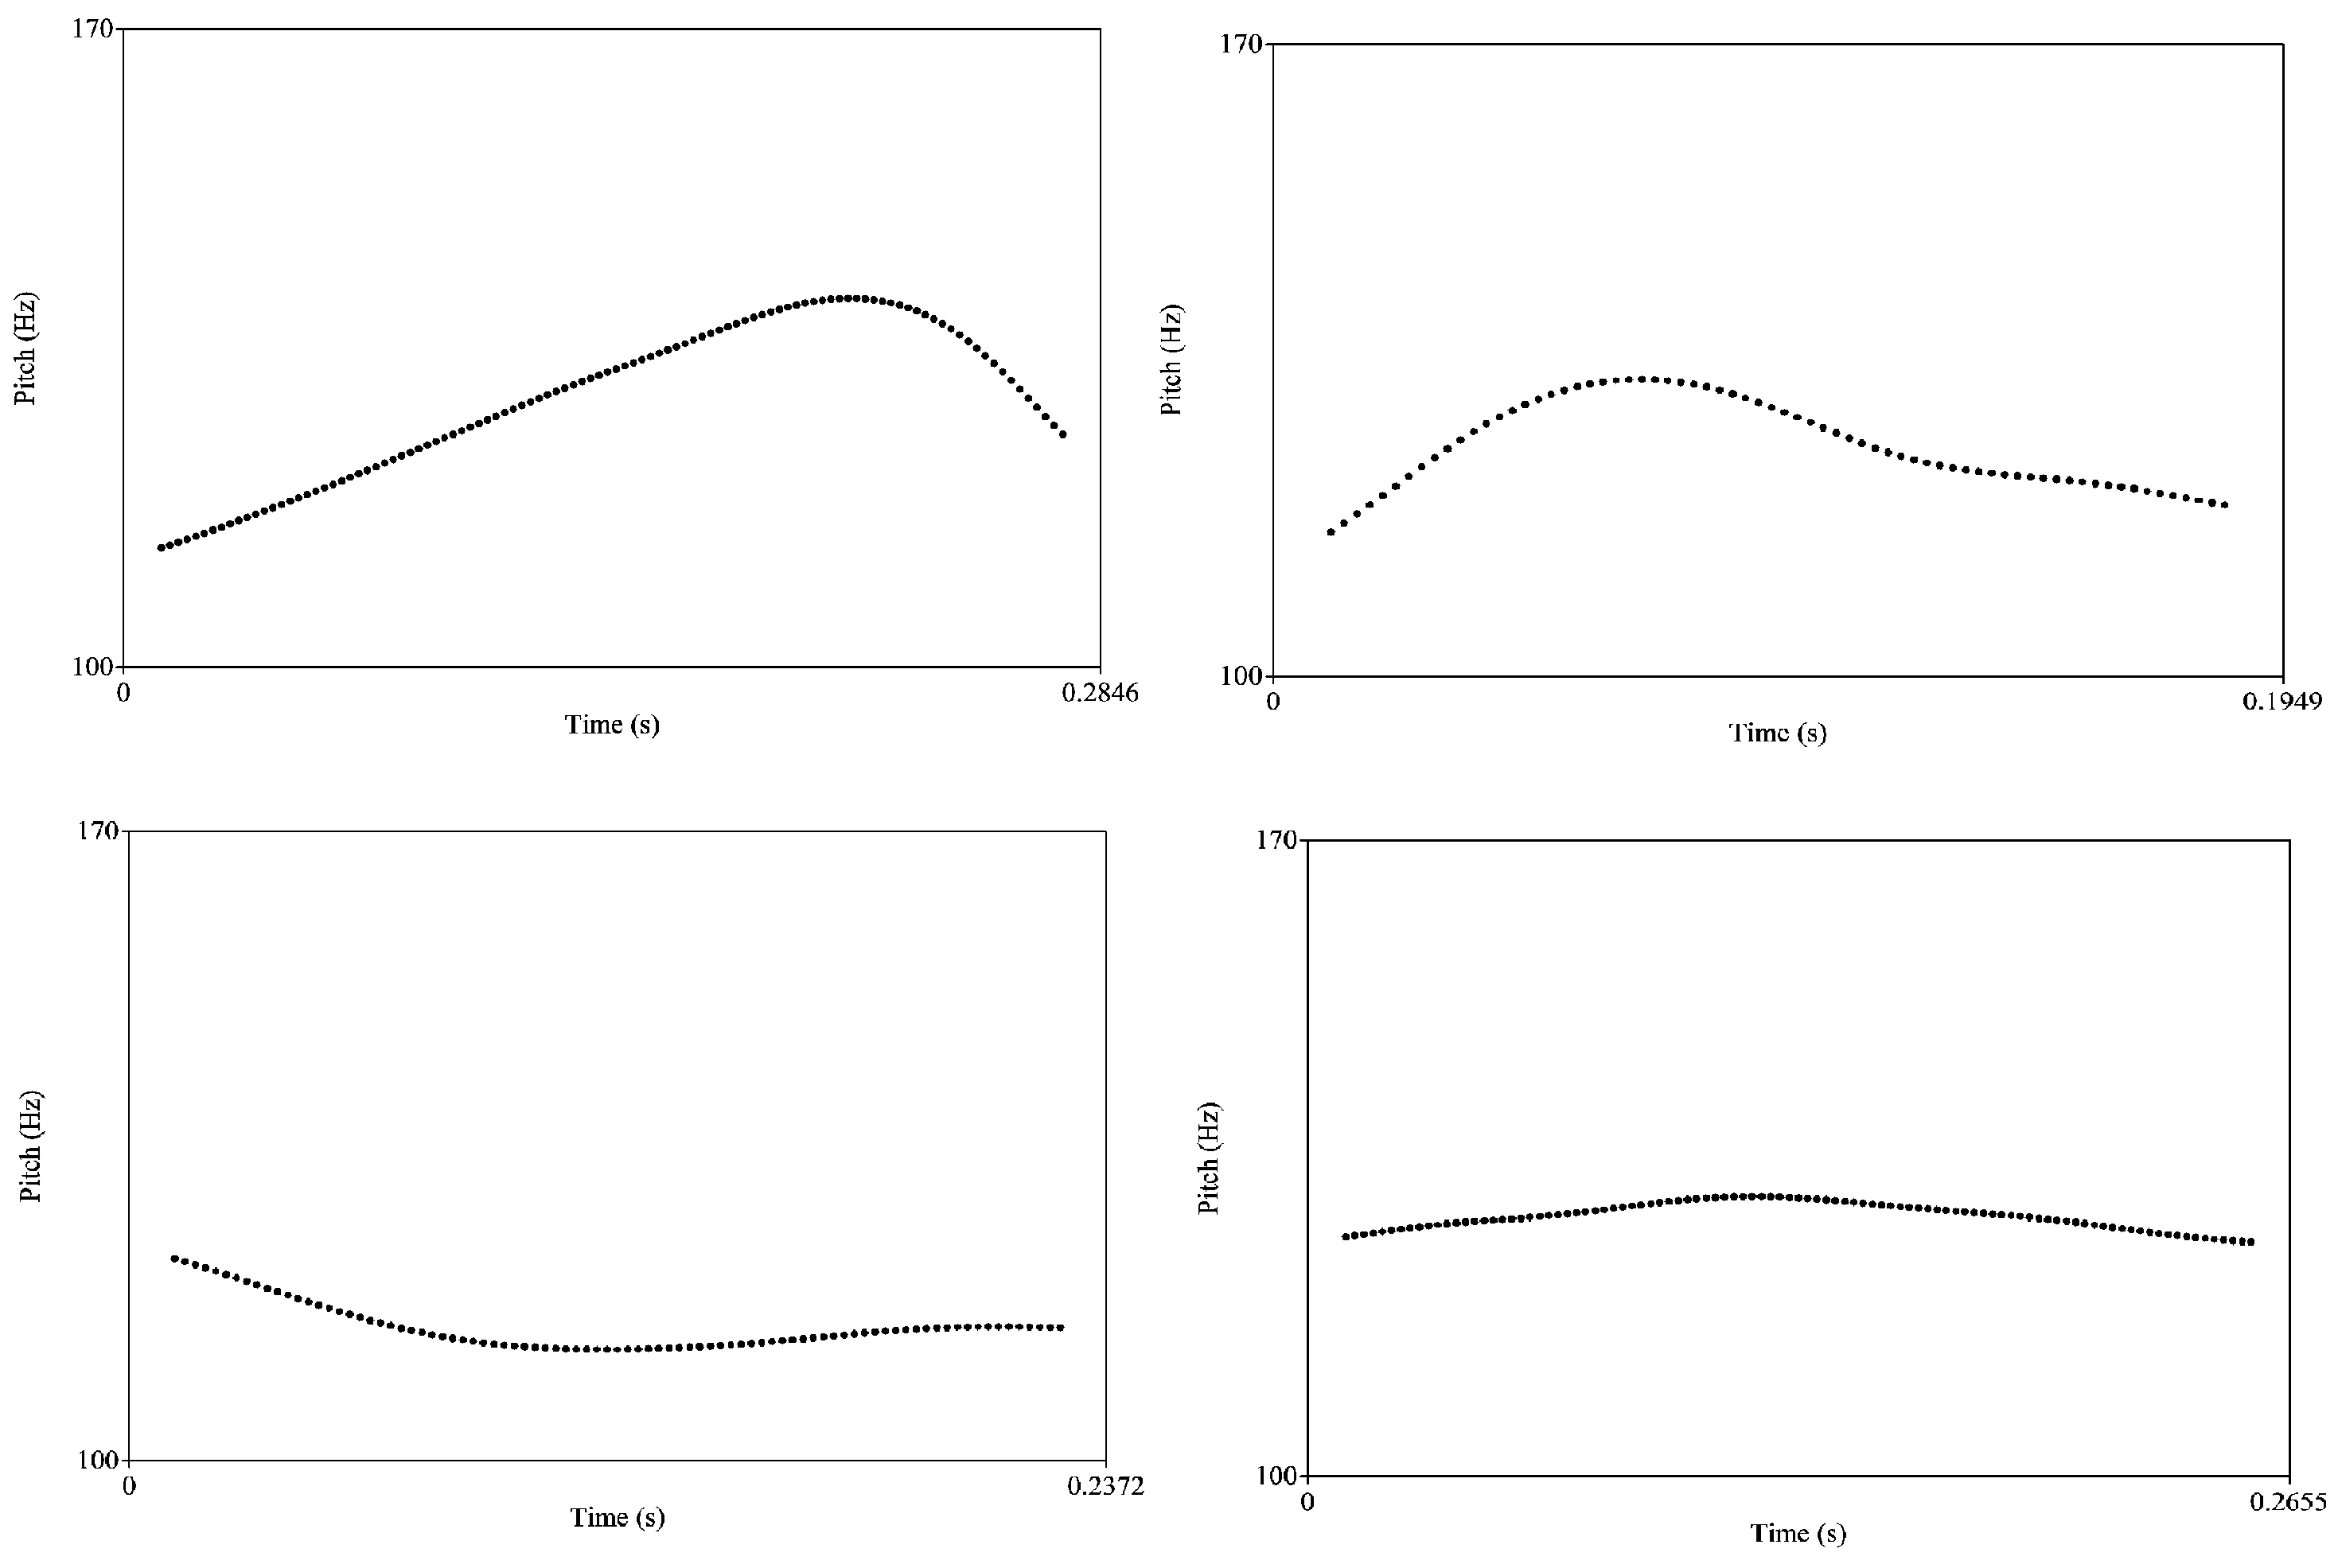
The interviews were divided into tokens that consisted of prosodic words, usually a 1–4 syllable span, totalling 1694 tokens. Each token was coded (by the author) for whether it exhibited a rise–fall pitch accent, based on auditory and visual examination of the spectrogram and pitch track. One of the clear acoustic correlates of a pitch accent is a rise–fall pattern, which entails a wider f0 excursion than on words without a pitch accent, as shown in Figure 2. These tokens were also measured for two acoustic correlates of intonation patterns mentioned in Section 1.1.1: f0 level (measured as the f0 median per token in semitones) and f0 range (measured as the middle 80% of the speaker’s range per token in semitones). Pitch dynamism quotient (PDQ) (the overall variability of f0) was also measured, but not on the tokens as coded for the previous measures. Instead, the same interviews were broken up into longer phrases, usually constituting a sentence or phrase each, with pauses removed. This resulted in 271 tokens for PDQ.
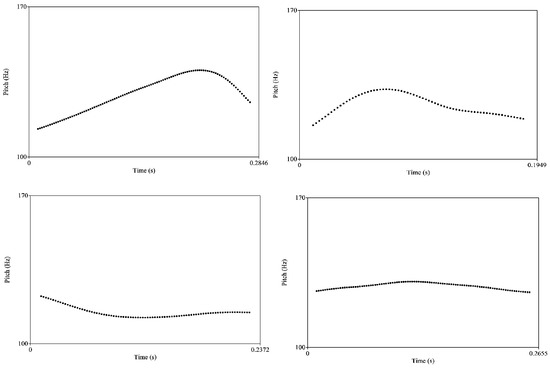
Figure 2.
(Top): tokens labelled as pitch accents; (Bottom): tokens labelled as no pitch accent.
2.1.4. Statistical Analysis
A logistic regression was run to compare the proportion of speech that contained pitch accents in the Early vs. Late timeframes, while linear regressions were run on the acoustic measures. Pitch Accent was coded as Y (pitch accent present) or N (no pitch accent) and Timeframe was coded as Early or Late. All models had the random intercept of Interview. All tests were run using the lmerTest package in R (R Development Core Team 2008).
2.1.5. Hypotheses
It was hypothesised that there would be a higher proportion of pitch accents in the Early than Late timeframe, and relatedly, that there would be a higher pitch level, wider pitch range, and higher PDQ in the Early timeframe, due to a stronger influence of the L1 intonation pattern.
2.2. Results
The results for each measure will be discussed in turn.
2.2.1. Pitch Accents
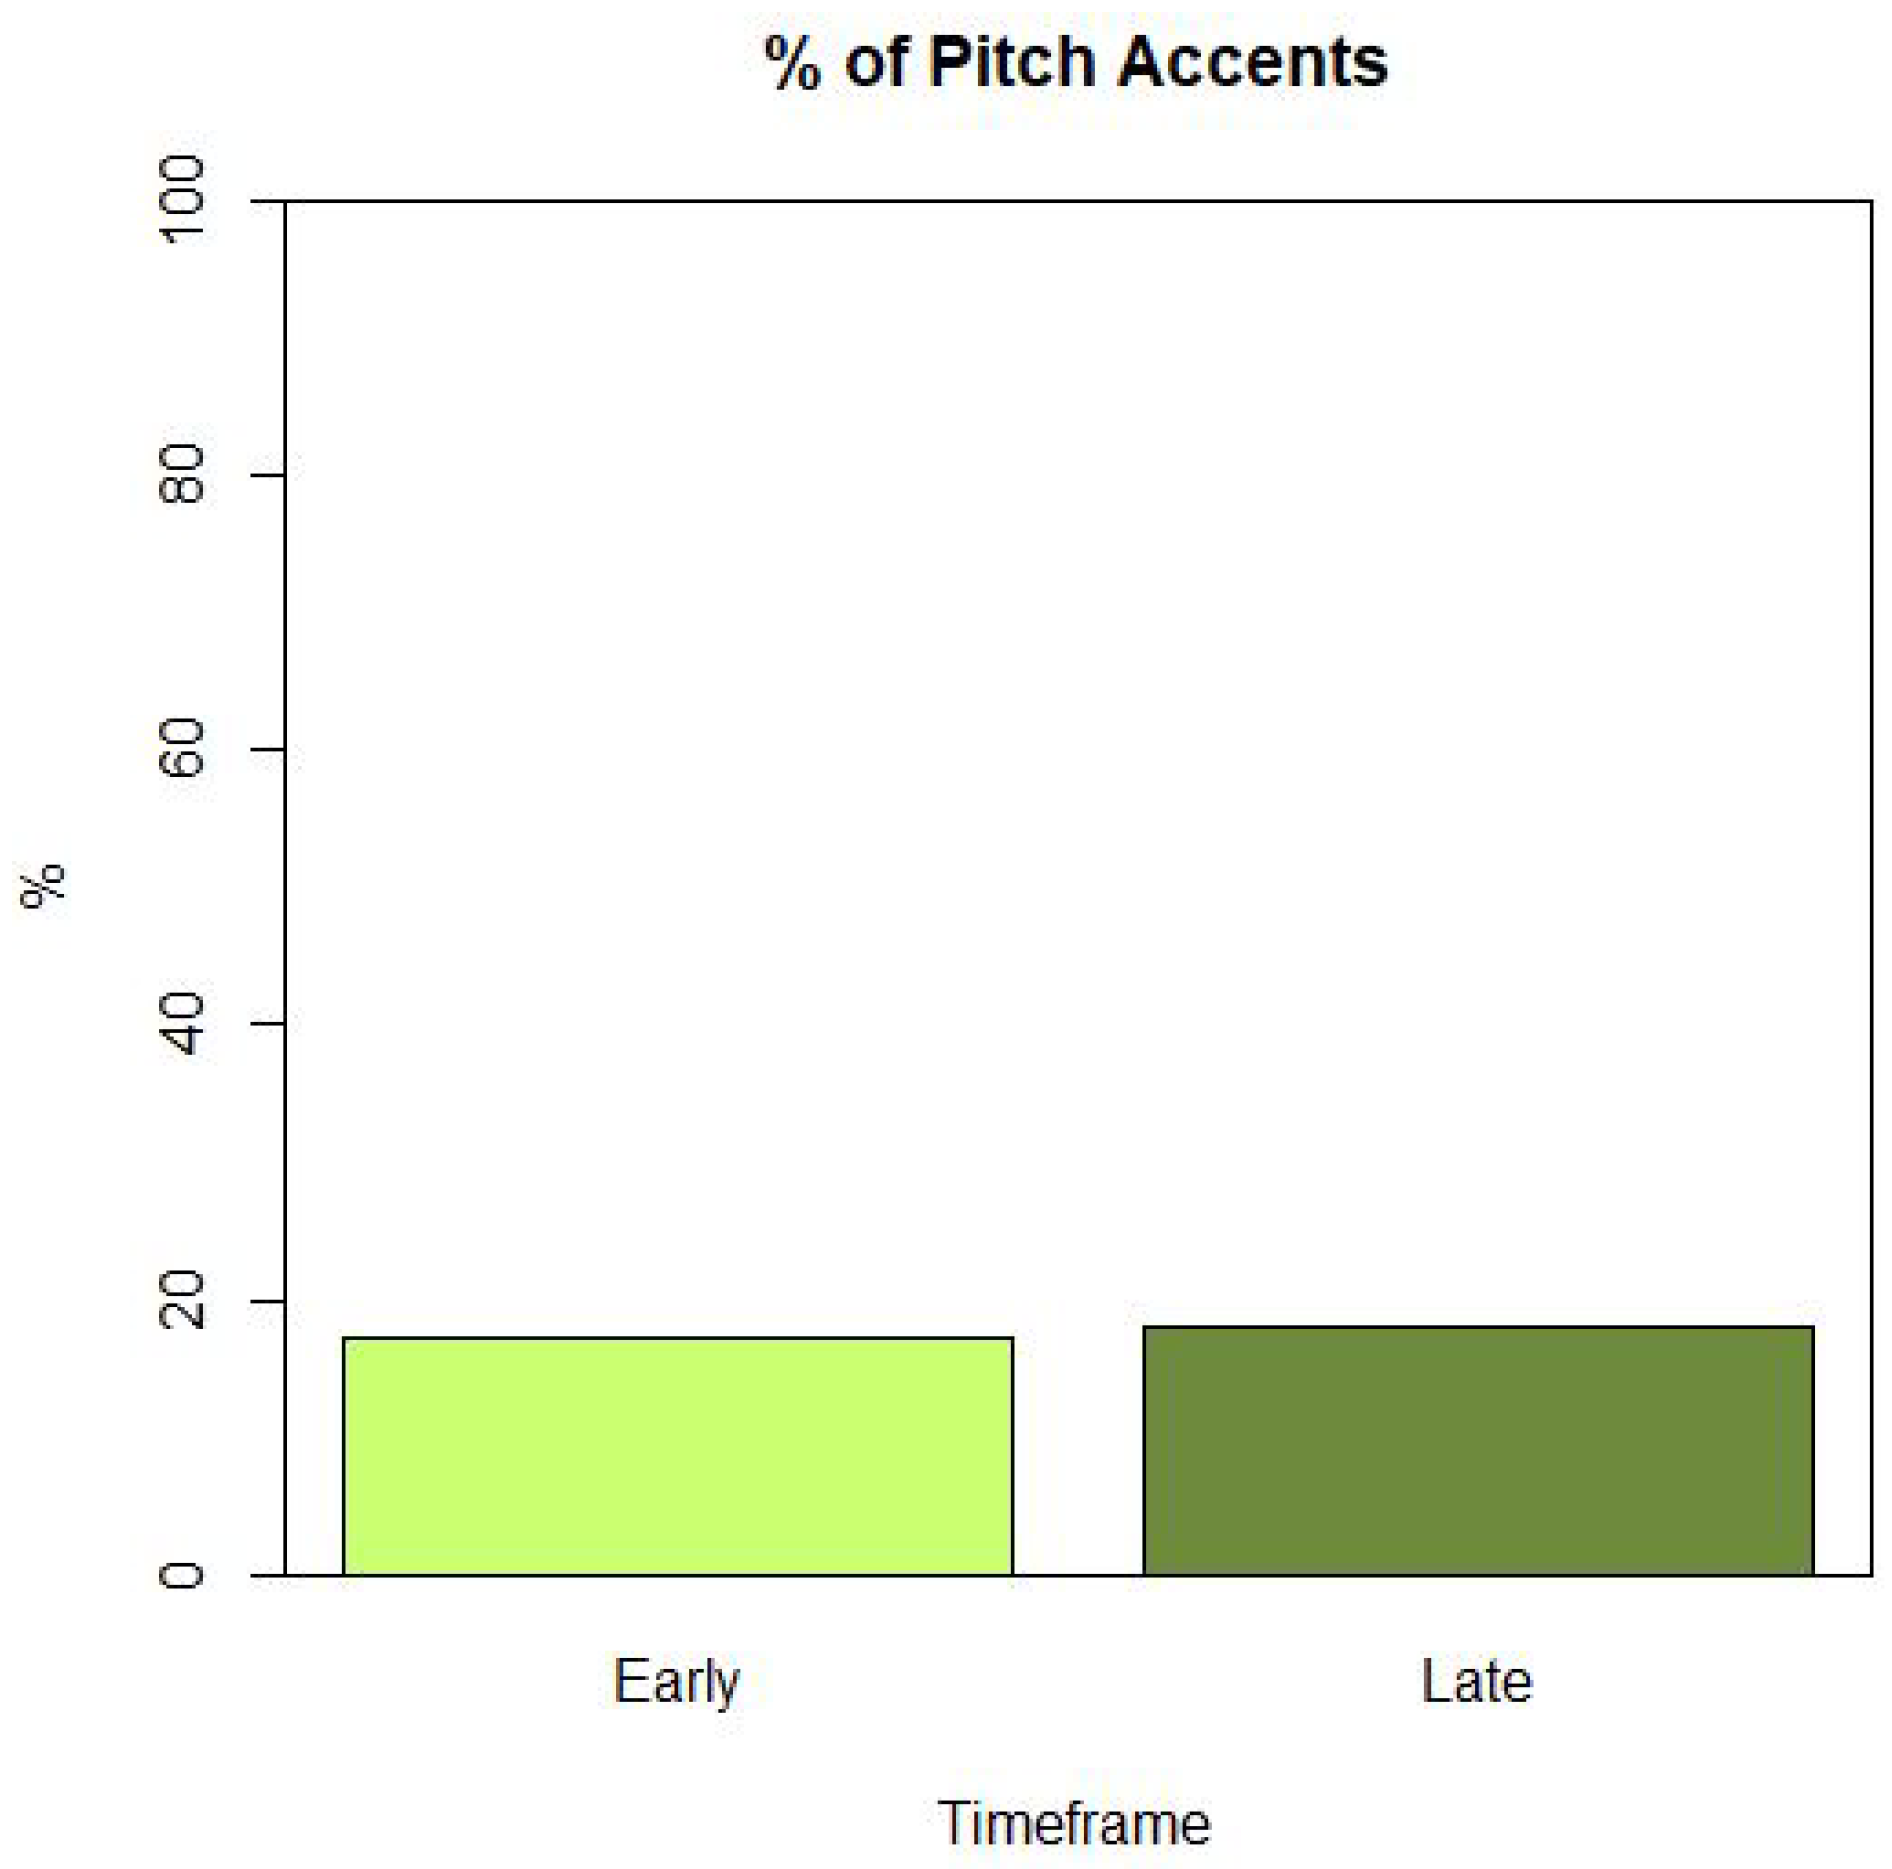
The logistic regression comparing the proportion of speech that contained pitch accents was not found to differ between the two timeframes, with both having 17–18% of tokens carrying a pitch accent (Table 1, Figure 3).

Table 1.
Statistical results for the logistic regression on the proportion of tokens with pitch accents. In all tables, * means the result is significant.
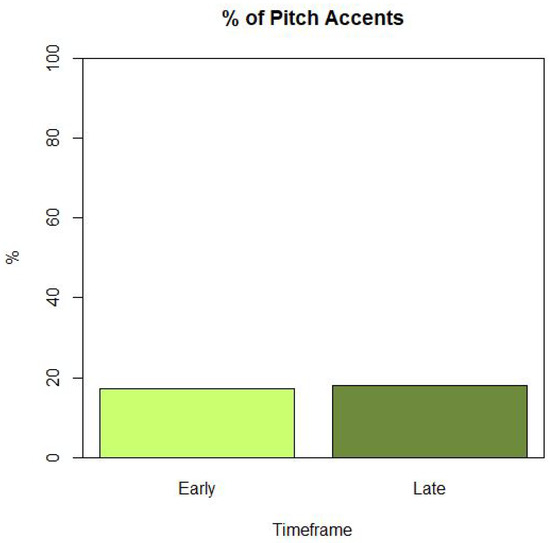
Figure 3.
Proportion of tokens with a pitch accent in each timeframe.
2.2.2. F0 Level
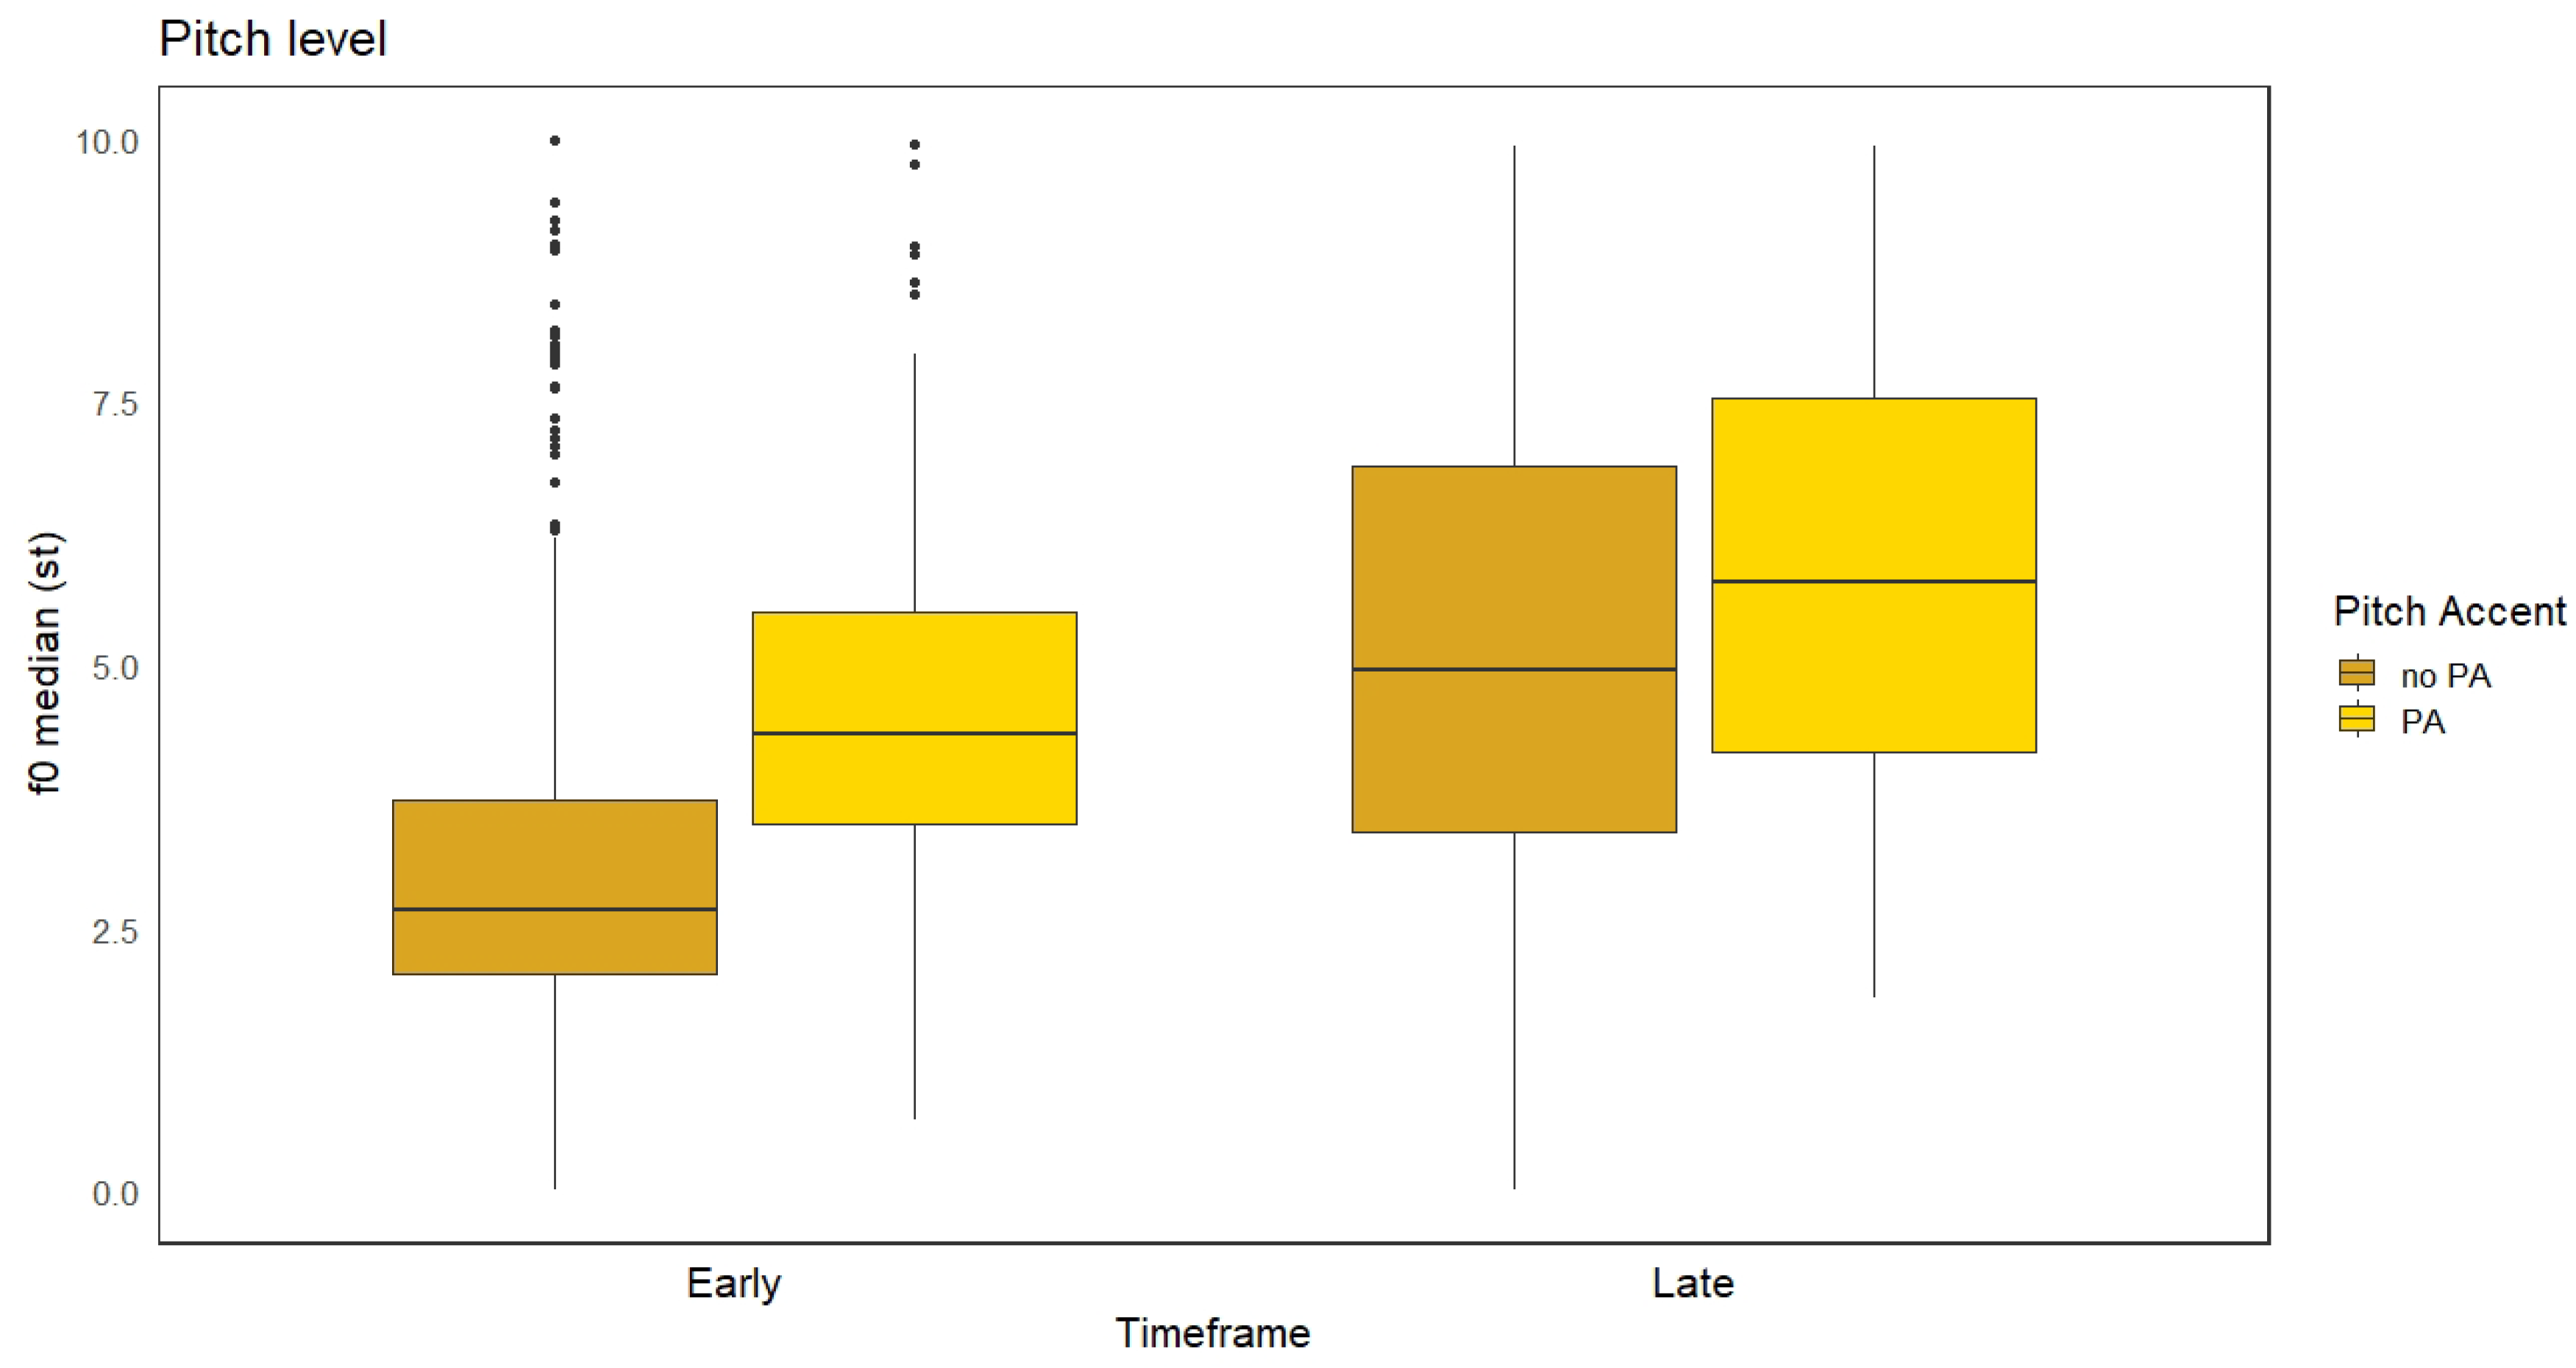
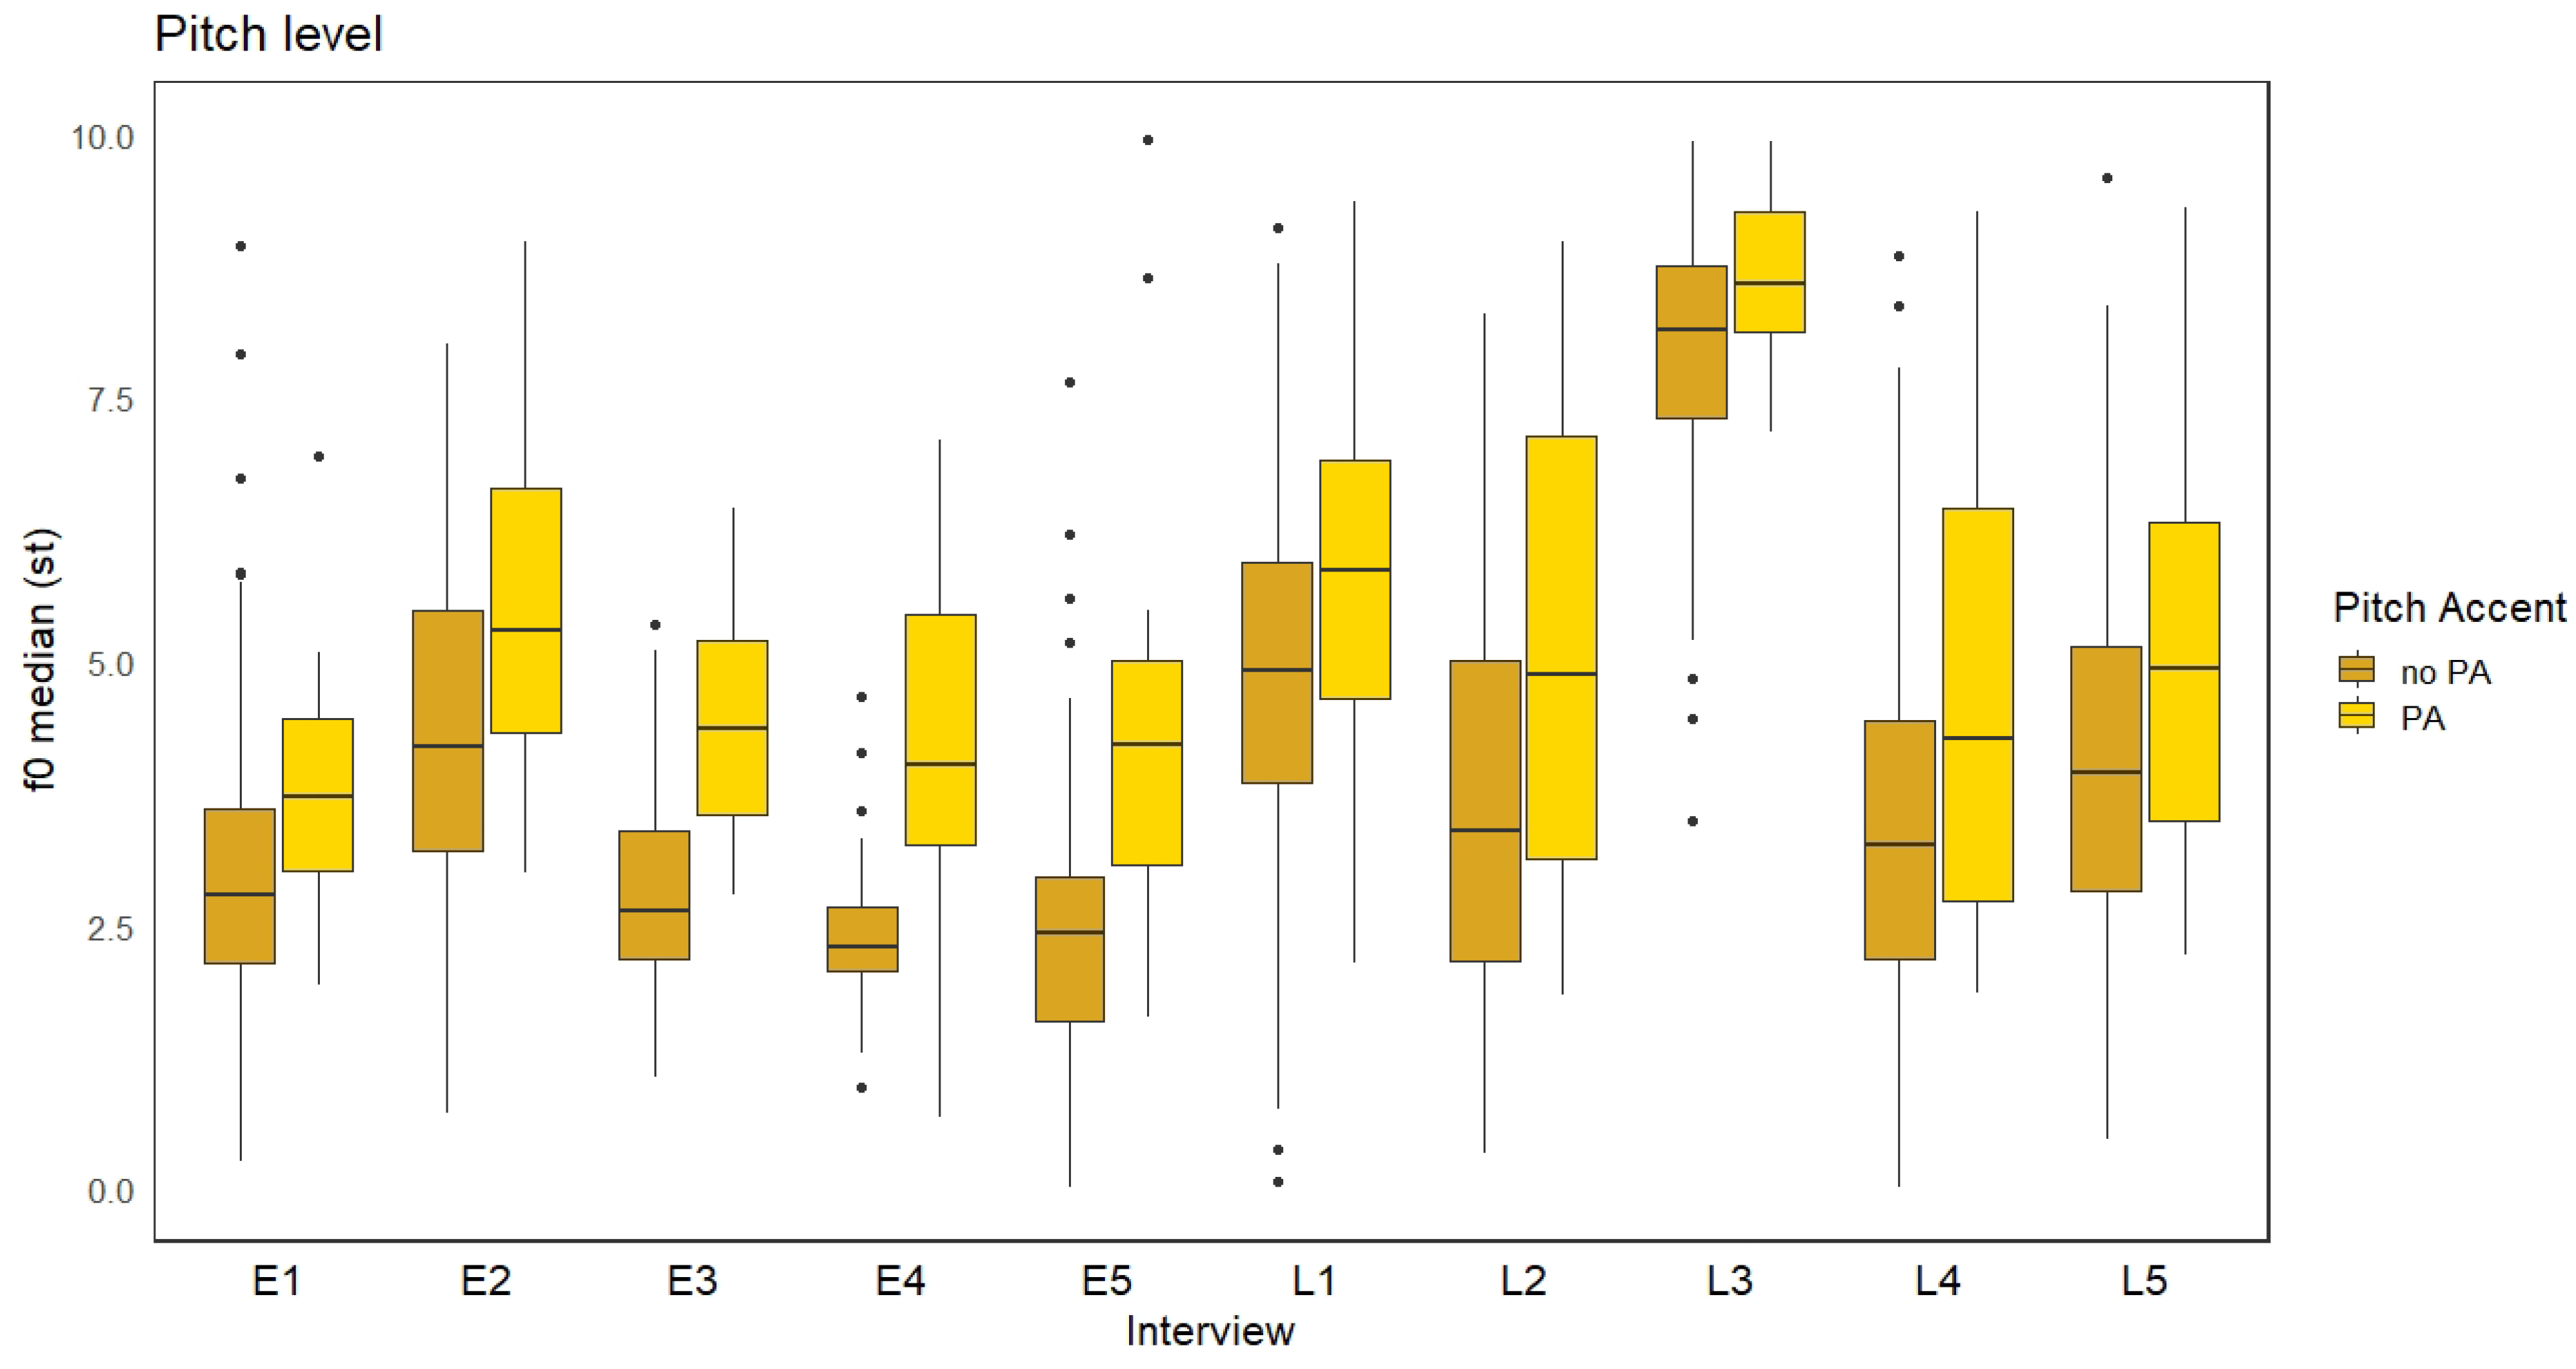
In order to find the best model to predict the f0 level data, linear regression models were built up term by term and compared using the anova function in R (R Development Core Team 2008). In this approach, the goal is to find the model that best explains the data, meaning the fixed factors that most accurately predict the findings. The best model for f0 level was one with both Timeframe and Pitch Accent, with no interaction. There was no significant effect of timeframe on f0 level (Figure 4), but tokens containing a pitch accent had a significantly higher f0 level (Table 2). These results mean that Early vs. Late Timeframe was not a significant predictor of the data, but the presence vs. absence of a pitch accent was, with the finding that when there was a pitch accent, the speaker’s f0 level was higher. Figure 5 shows this measure broken down by interview.
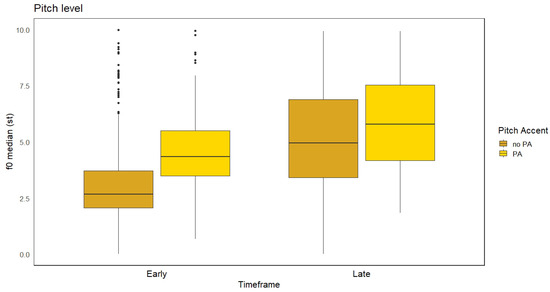
Figure 4.
F0 level for Early vs. Late timeframes and presence vs. absence of a Pitch Accent.

Table 2.
Statistical results for the linear regression on f0 level.
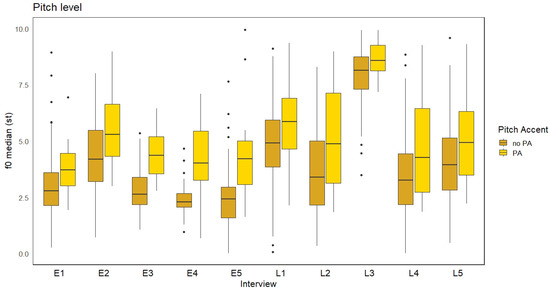
Figure 5.
F0 level by Interview (E = Early, L = Late) and presence vs. absence of a Pitch Accent.
2.2.3. F0 Range
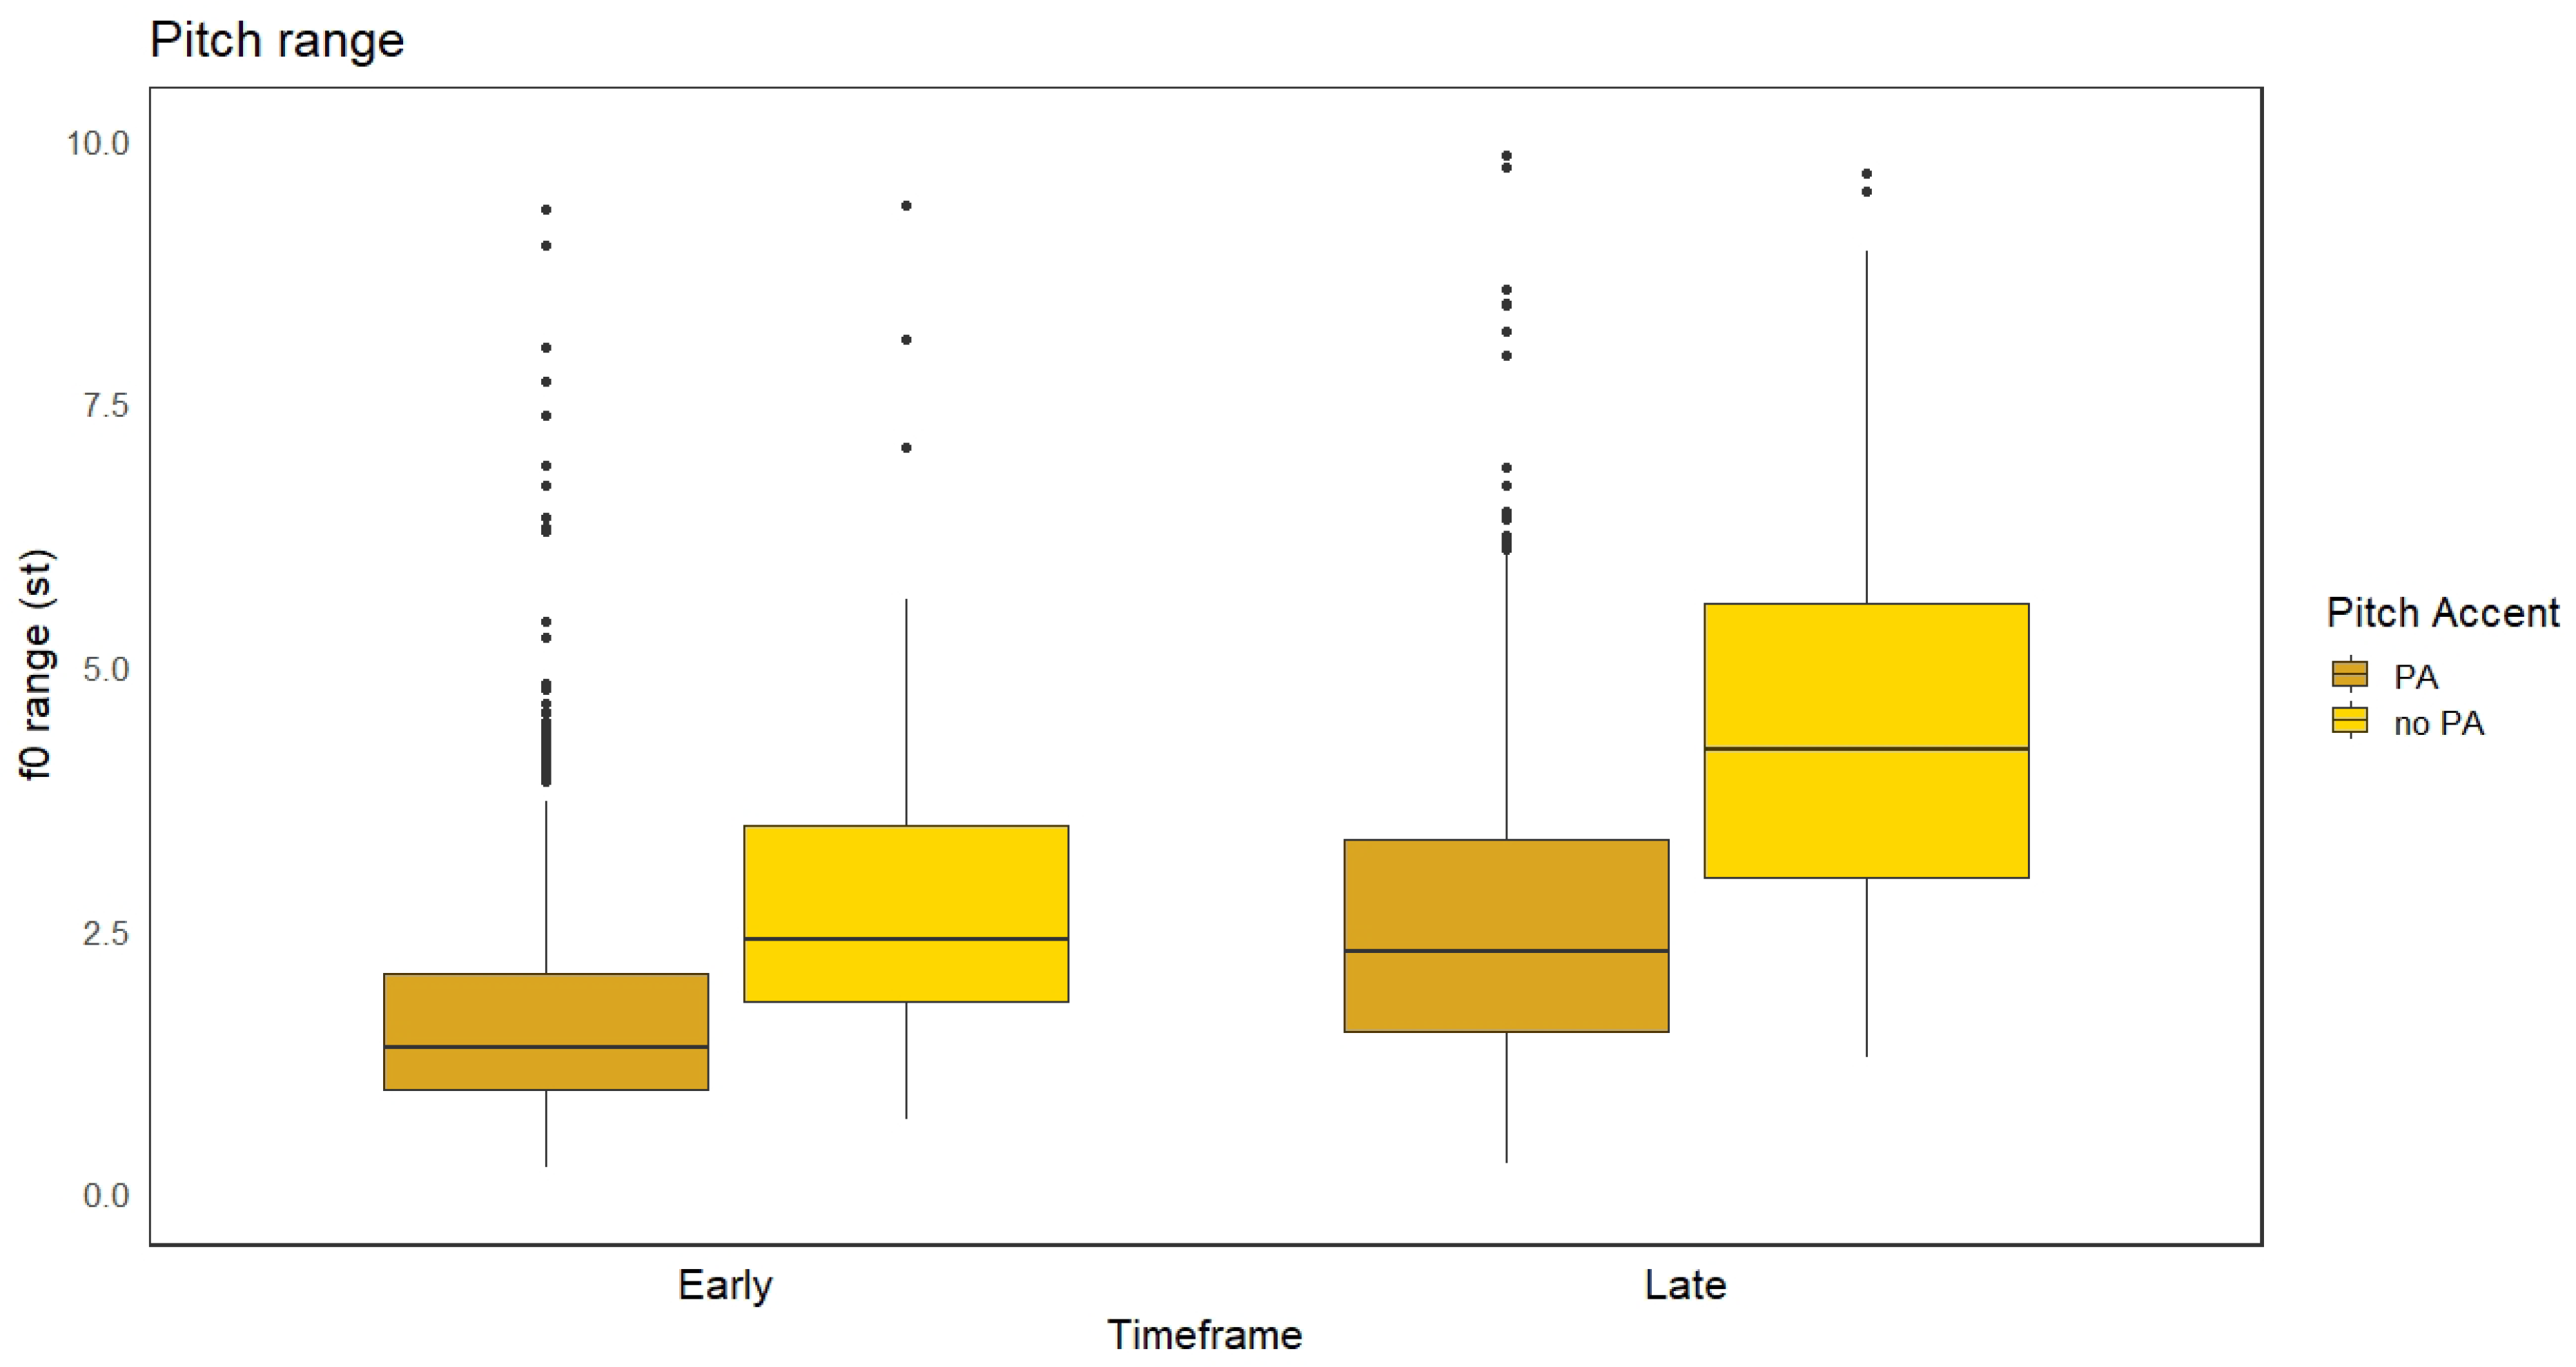
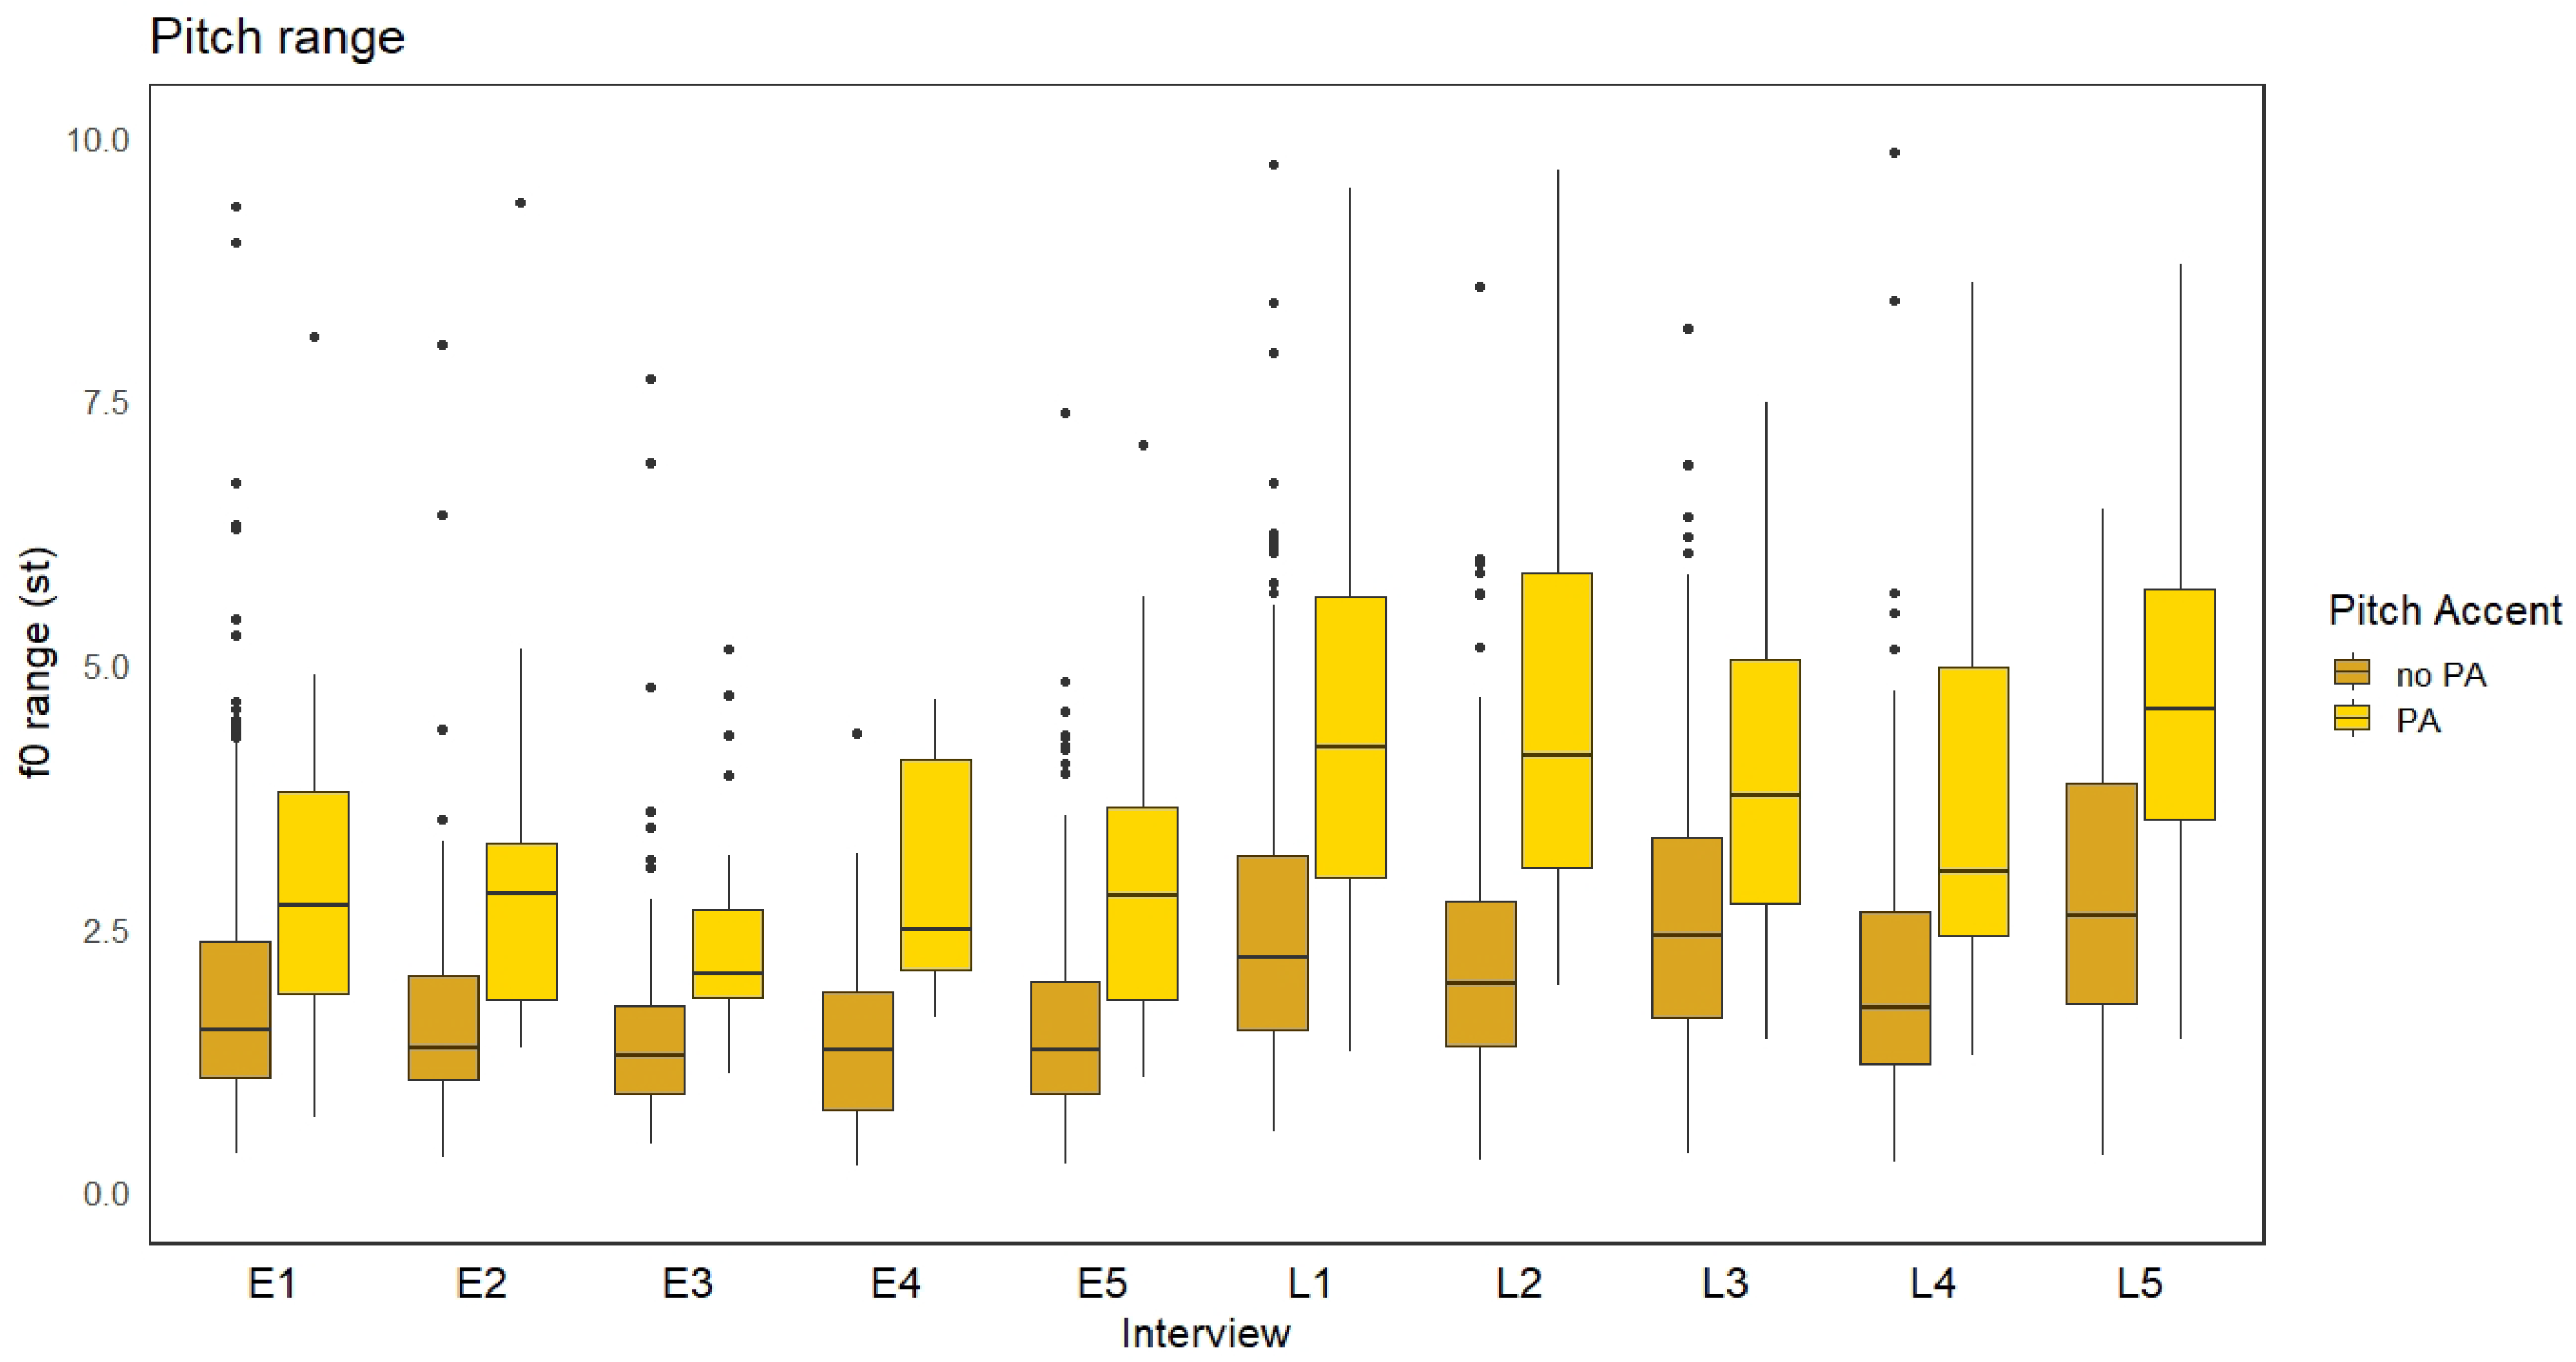
The best model (the one that best explained the data) for f0 range was one with both Timeframe and PitchAccent and an interaction (Table 3). Since there was an interaction, a post-hoc pairwise test was conducted using the emmeans package in R. The results showed a significantly wider f0 range for the Late timeframe, the opposite of what was expected, as well as a wider f0 range for pitch-accented tokens (Figure 6). Figure 7 shows this measure broken down by interview.

Table 3.
Statistical results for the linear regression on f0 range. PA = Pitch Accent.
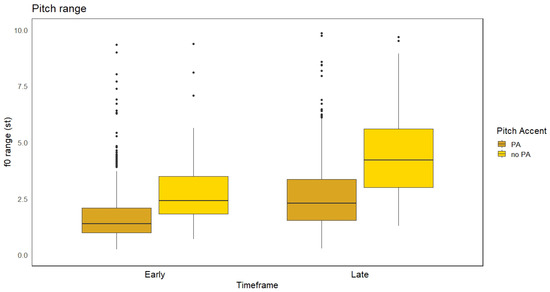
Figure 6.
F0 range for Early vs. Late timeframes and presence vs. absence of a Pitch Accent.
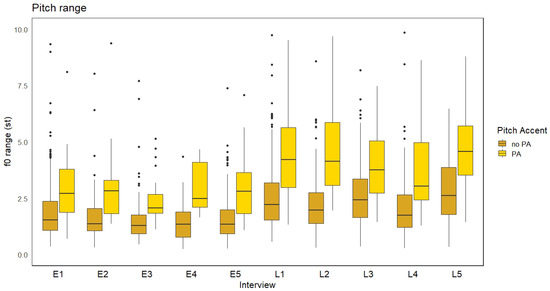
Figure 7.
F0 range by Interview (E = Early, L = Late) and presence vs. absence of a Pitch Accent.
2.2.4. Pitch Dynamism Quotient
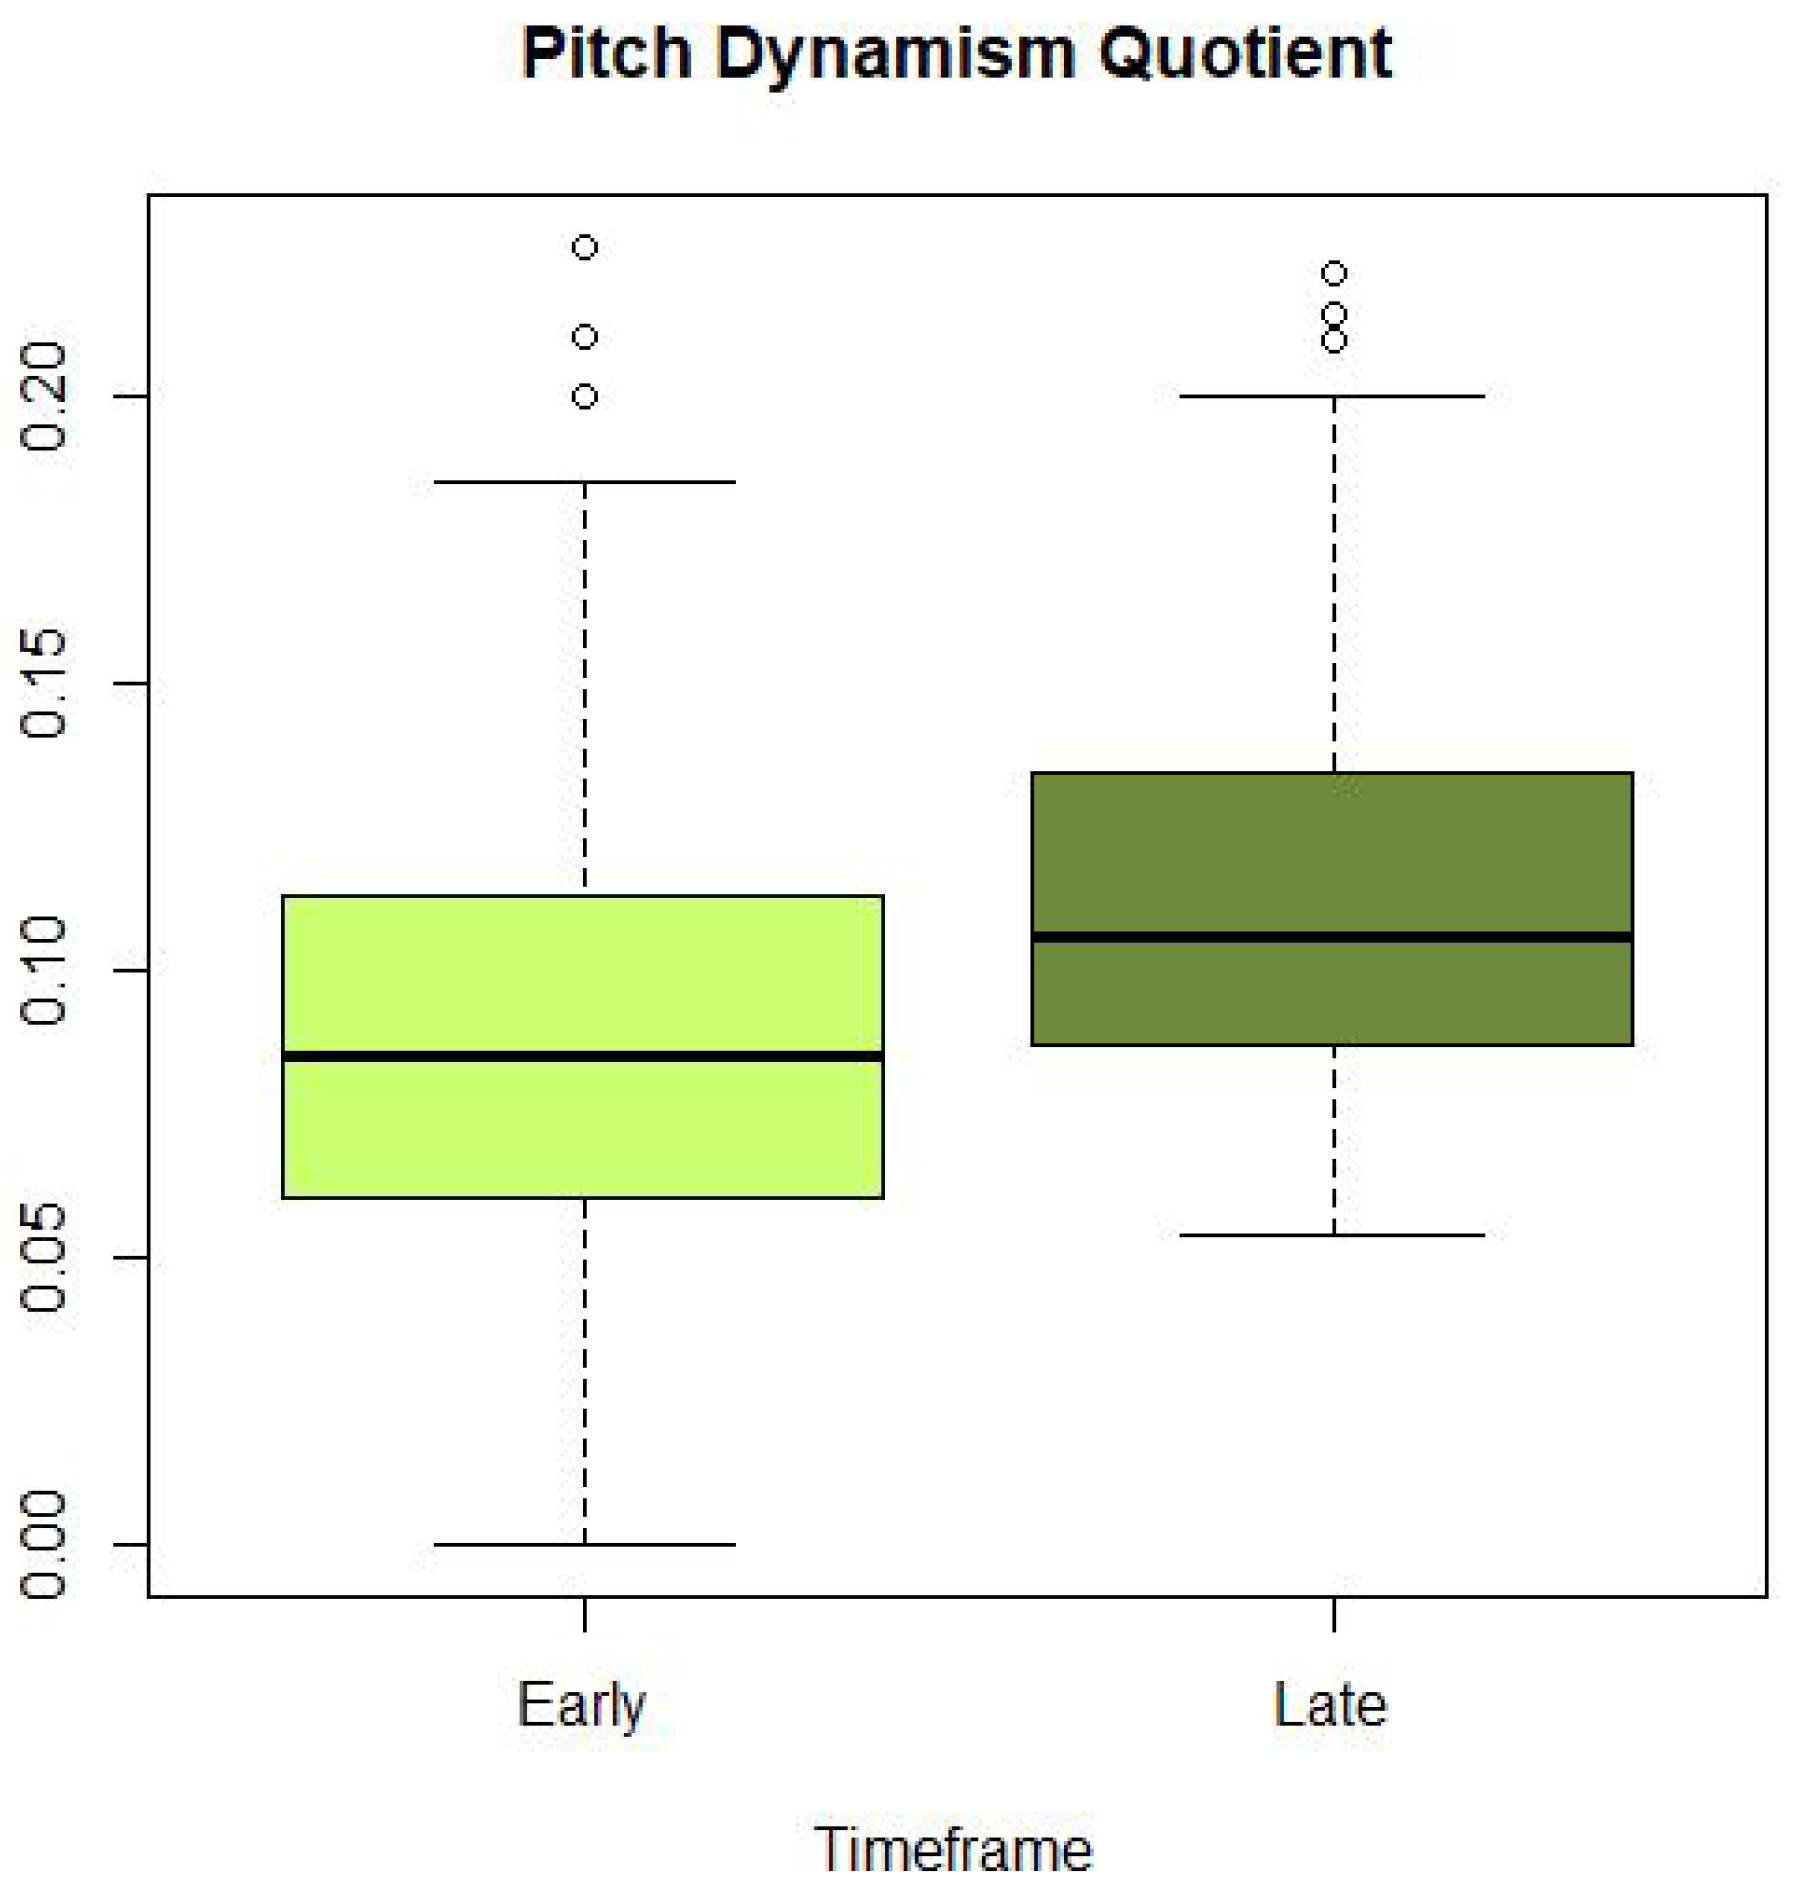
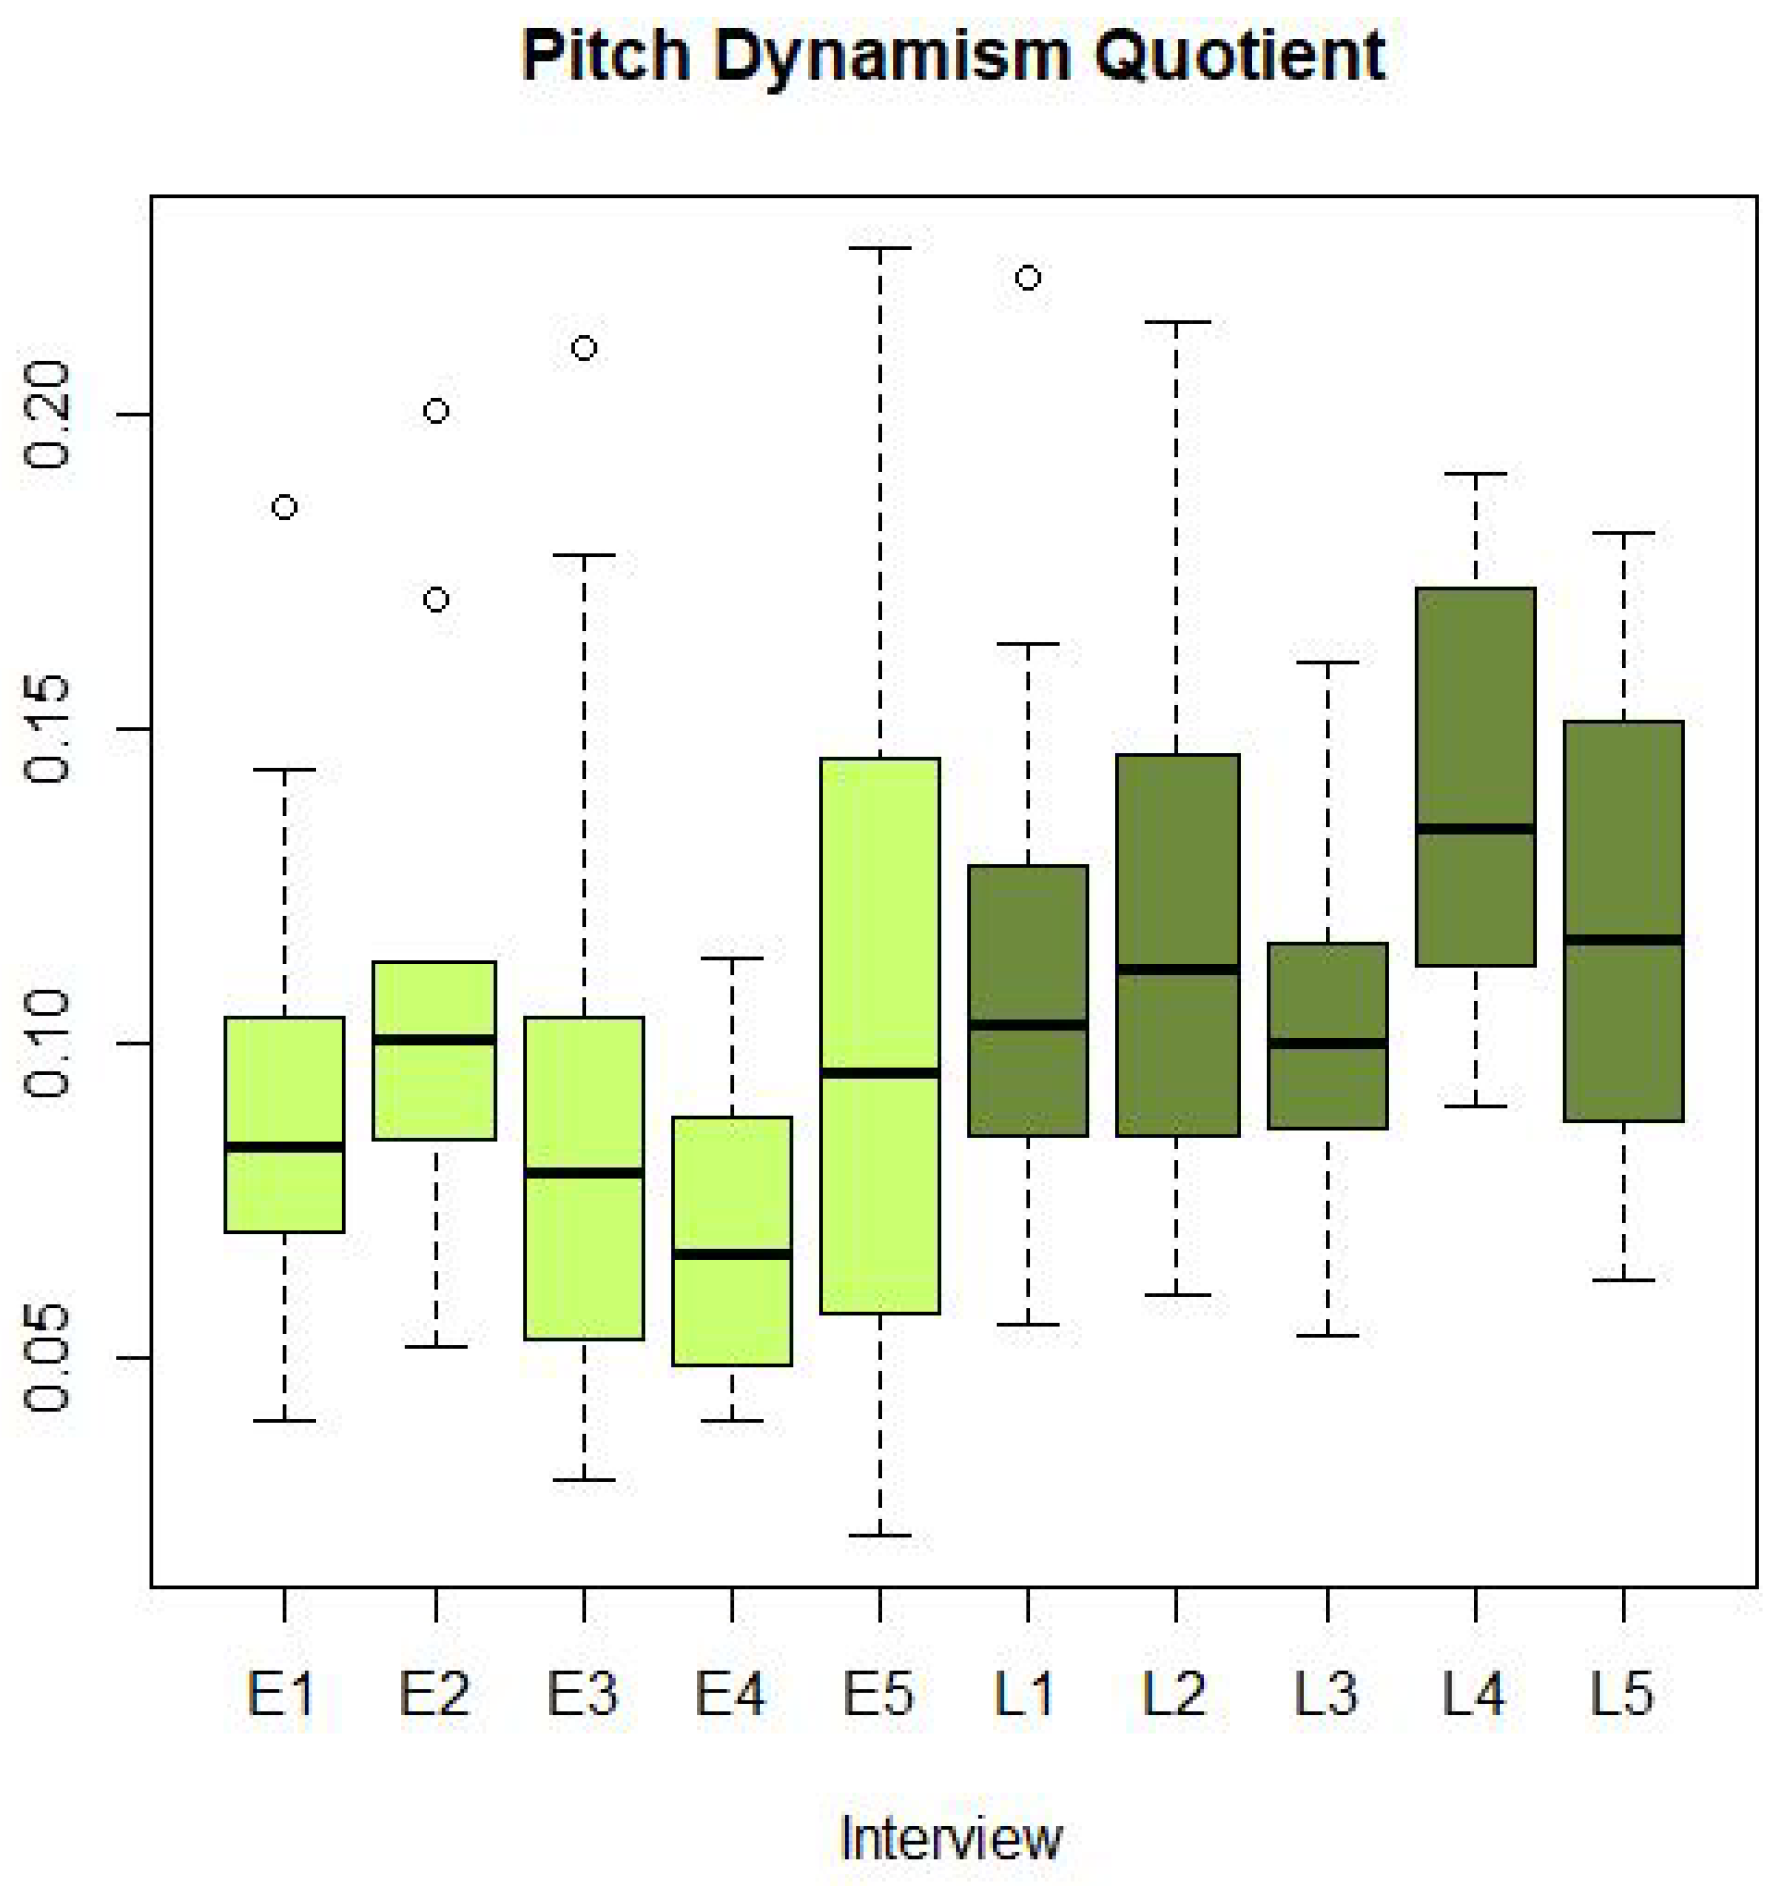
Since PDQ was measured over longer spans than those in the previous measures (which were not coded for Pitch Accent), only Timeframe was examined as a fixed factor. It was found to have a significant effect on the PDQ but in the opposite direction of what was hypothesised, that is, the speaker had a higher PDQ in the Late timeframe than in the Early timeframe (Table 4, Figure 8). Figure 9 shows this measure broken down by Interview.

Table 4.
Statistical results for the linear regression on PDQ.
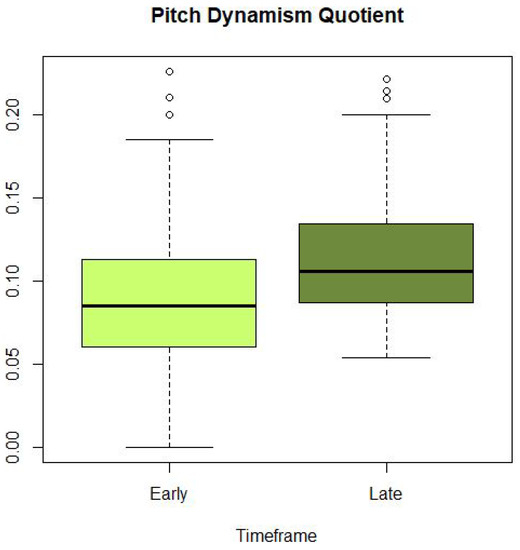
Figure 8.
Pitch Dynamism Quotient for Early vs. Late timeframes. I used yellows when comparing Pitch Accent vs No Pitch Accent, and greens when comparing Early vs Late timeframes, but this is explained in every chart either by the legend or the labels on the axes.
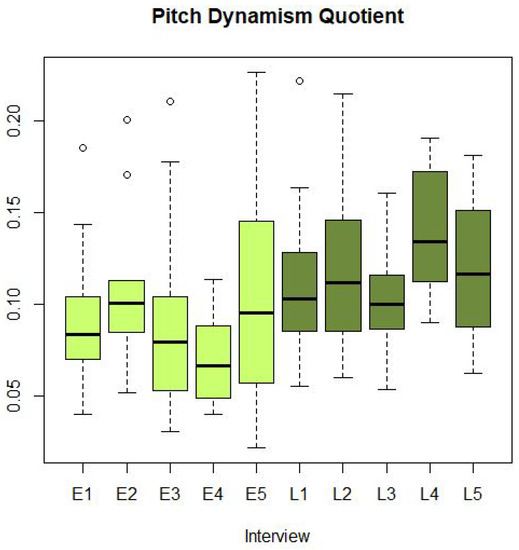
Figure 9.
Pitch Dynamism Quotient by Interview (E = Early, L = Late).
2.3. Discussion
These findings indicate that, contrary to the hypothesis, the speaker did not seem to be transferring the L1 pitch accent system to the L2 even in the Early timeframe, at least in terms of the number of pitch accents, which did not differ between the two timeframes. The f0 level was also (contrary to the hypothesis) not found to differ between the two timeframes, but as expected, it was higher for pitch accented-tokens in both timeframes. Additionally, contrary to the hypothesis, his f0 range was wider and the PDQ was higher in the Late timeframe, which suggests more pitch movement in this timeframe. This may indicate that the speaker produced a more compressed f0 range and movements when he was less fluent in the L2 (in the Early timeframe), and since becoming more comfortable speaking it, he has more dynamic f0 patterns. This may suggest a type of hypercorrection in the earlier stages of learning the L2, resulting from an overreaction to the L1 influence (Eckman et al. 2013; Janda and Auger 1992; Odlin 1989). When a small number of tokens of the L1 were examined, the speaker’s f0 range and PDQ were higher than the Late L2 results (as expected for a pitch accent language), corroborating the idea that he was compressing his f0 range and movements in the Early timeframe.
Figure 5 and Figure 7 show that pitch-accented tokens have a consistently higher f0 level and wider range than non-pitch accented tokens. While there is generally consistency in these patterns across interviews, it is possible that temporary factors such as emotional state could affect his intonation patterns. This may explain the higher average level in L3 (Figure 5).
These findings will be discussed further in Section 4.
3. Study 2: Segments
For this experiment, the speaker and recordings were the same as in Study 1.
3.1. Methods
3.1.1. Labelling and Measurements
For the segmental part, all words in which English has a /s/ or /z/ were coded for whether they were produced as voiced or voiceless (based on auditory analysis, similar to (Dehé and Wochner 2022) for a total of 673 tokens. The English underlying /z/ tokens were also coded for their position in the word (medial or final) as well as their morphemic status, that is, whether they were morphemic (for example, the plural marker) or part of a stem (e.g., the /z/ in because), based on results from Contreras-Roa et al. (2020).
Since the recordings came from interviews which were not of the highest sound quality, the types of acoustic measurements that could be made were limited. For this reason, duration was chosen as a useful variable, because it was easily measured and duration is also a cue to fricative voicing, with voiceless fricatives being longer than voiced ones (Contreras-Roa et al. 2020; Crystal and House 1988; Jongman et al. 2000).
3.1.2. Statistical Analysis
Two logistic regression tests were run on the auditory categorisation of /s/ and /z/ as voiced or voiceless.1 The /z/ segments in the Late timeframe were also examined to determine whether morphemic status or word position had a significant effect on whether they were voiced.
A linear regression was run on the duration of /z/ phonemes, with possible independent variables of voicing and word position.
3.1.3. Hypotheses
It was hypothesised that the proportion of /s/ produced as voiced would not differ between timeframes but that /z/ would have a higher proportion produced as voiced in the Late timeframe. This is based on the fact that Norwegian does not have voiced fricatives, so it is likely difficult for the speaker to acquire the voiced /z/. Based on the literature previously cited, it is possible that over time and exposure to English, he has started to learn this pattern. In terms of duration, it was expected that voiceless fricatives would be longer than voiced ones, and that those in final position would be longer than those in medial position.
3.2. Results
3.2.1. Patterns of Voicing
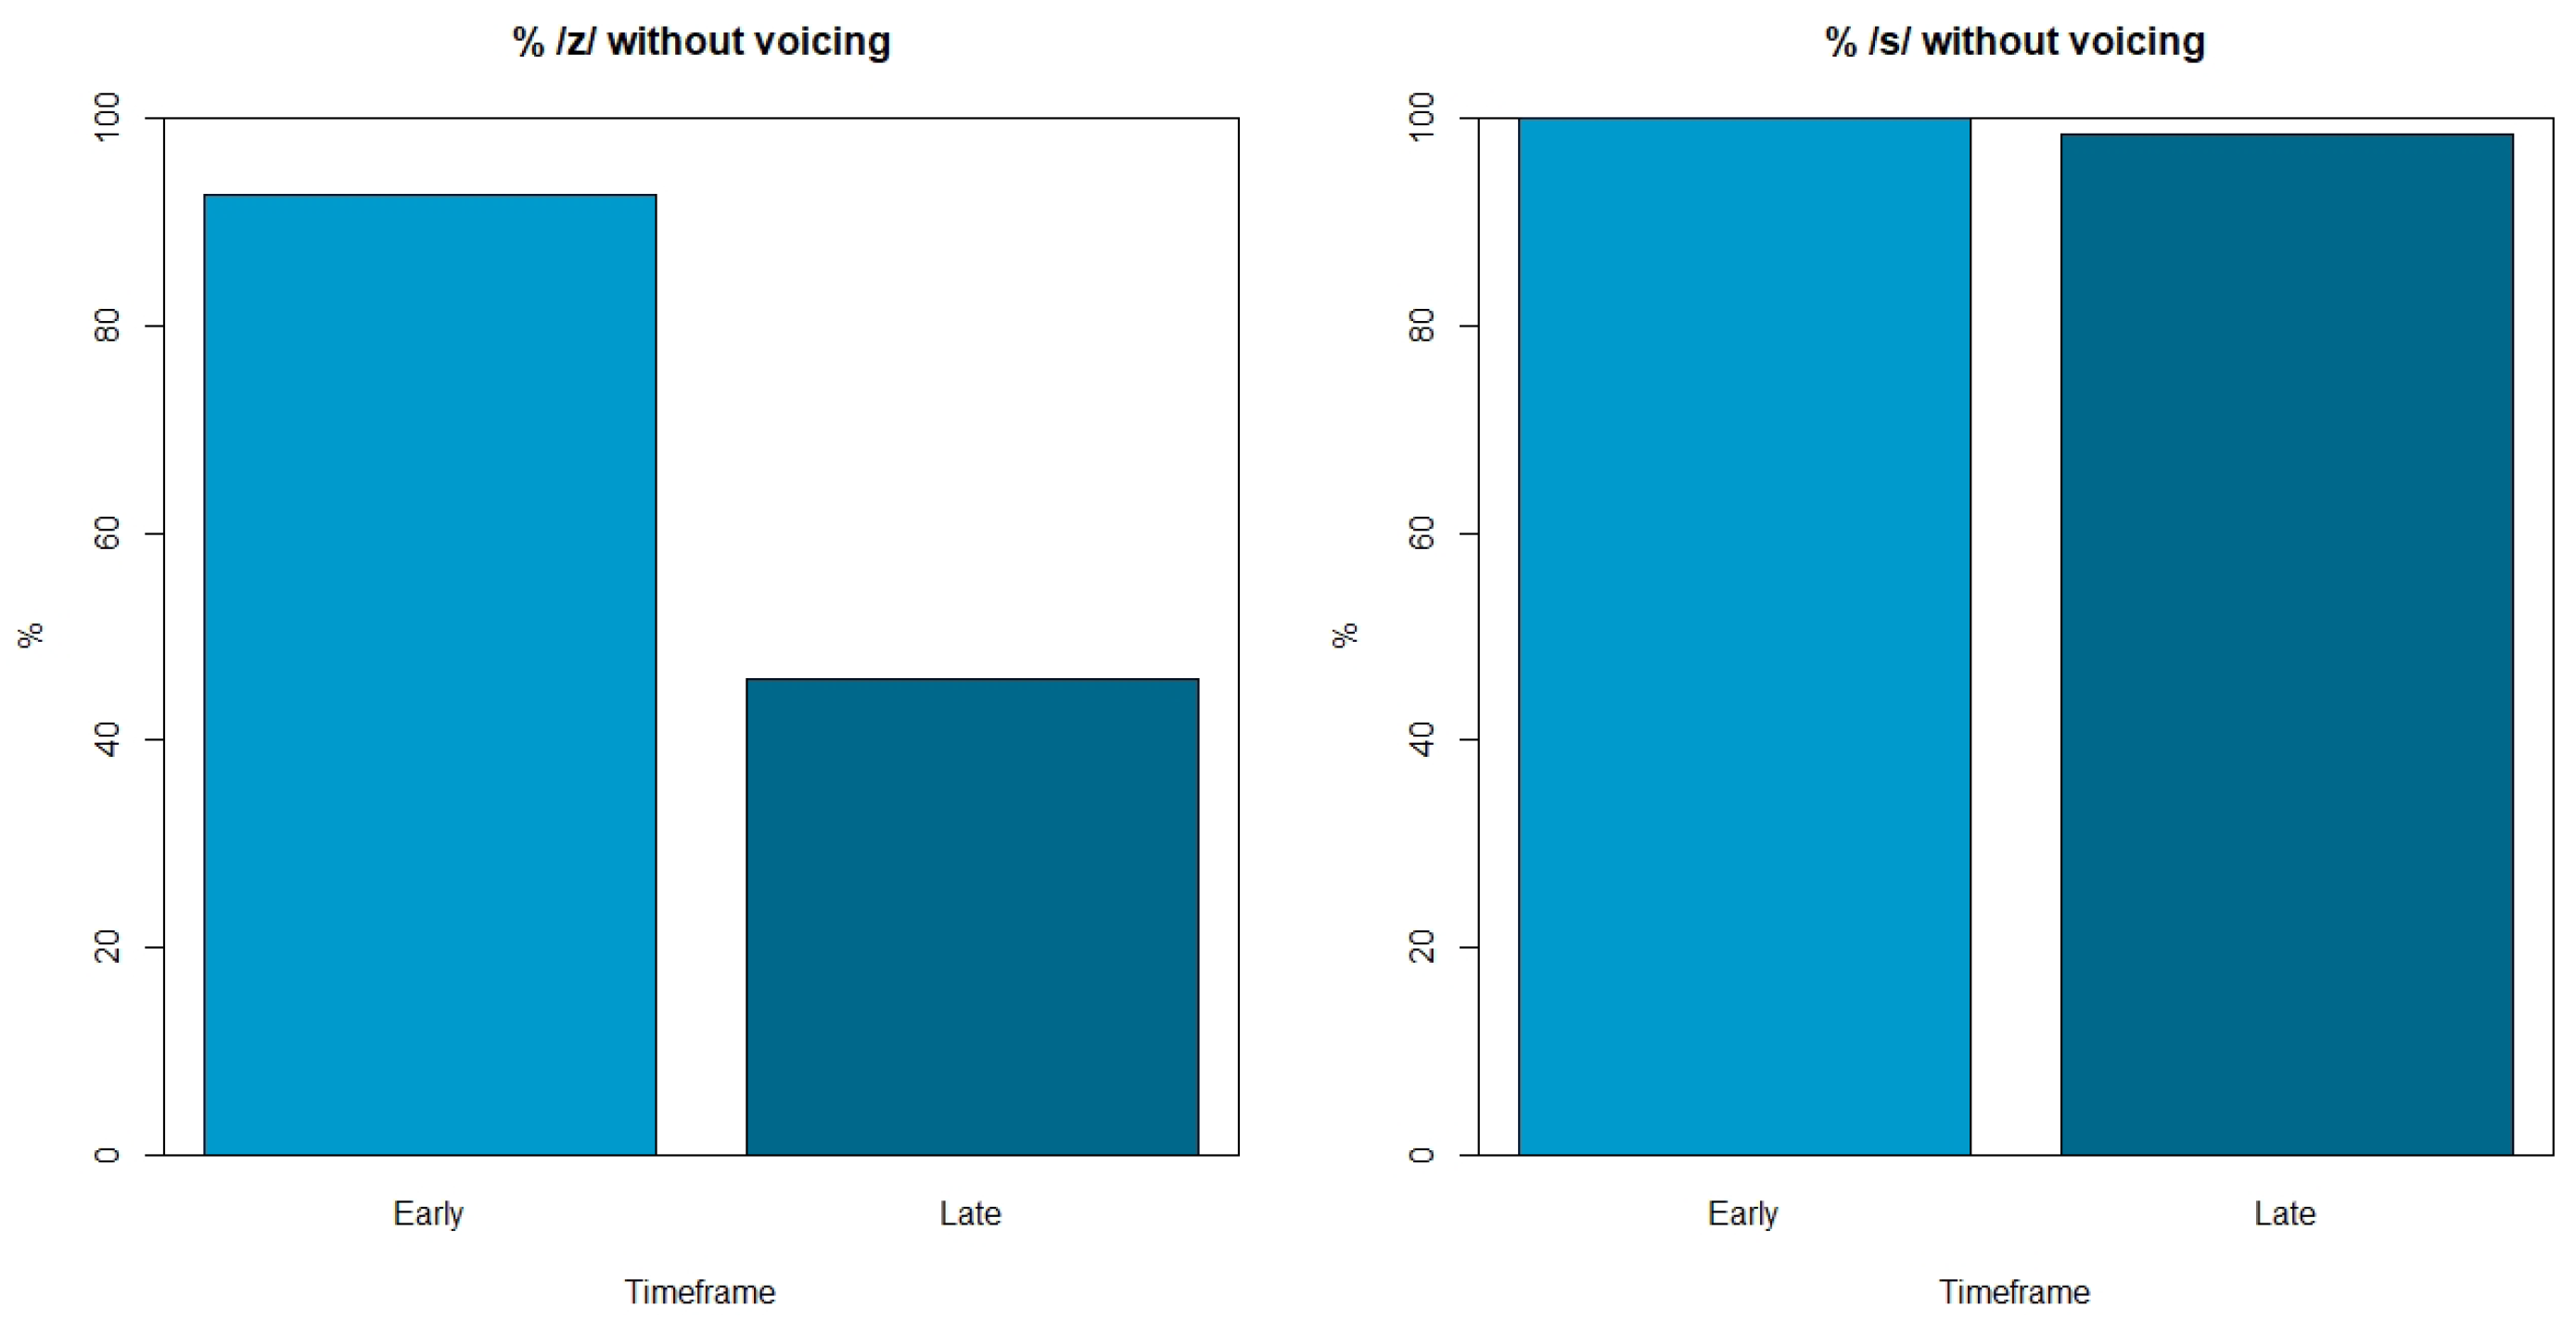
The results showed a significant effect of timeframe only for the phoneme /z/, with more voiced productions of /z/ in the Late timeframe (Table 5). In the Early timeframe, 93% of /z/ were voiceless and in the Late one, 46% of /z/ were voiceless (Figure 10); in comparison, in the Early timeframe, 100% of /s/ were voiceless and in the Late one, 98.5% were voiceless. Both of these findings (the effect of Timeframe and the difference between the two phonemes) are in line with the hypotheses. Including morphemic status and word position did not improve the model, meaning that these factors do not significantly predict whether the segments were produced with voicing.

Table 5.
Statistical results for the logistic regression on voicing.
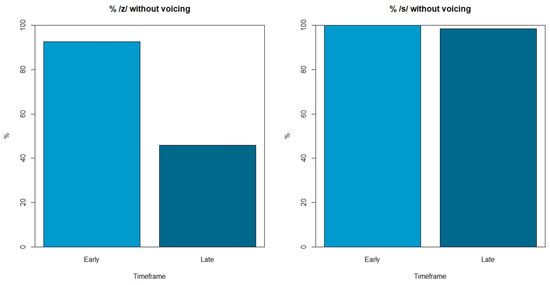
Figure 10.
Proportion of /z/ (left) and /s/ (right) segments that were voiceless in Early vs. Late timeframes.
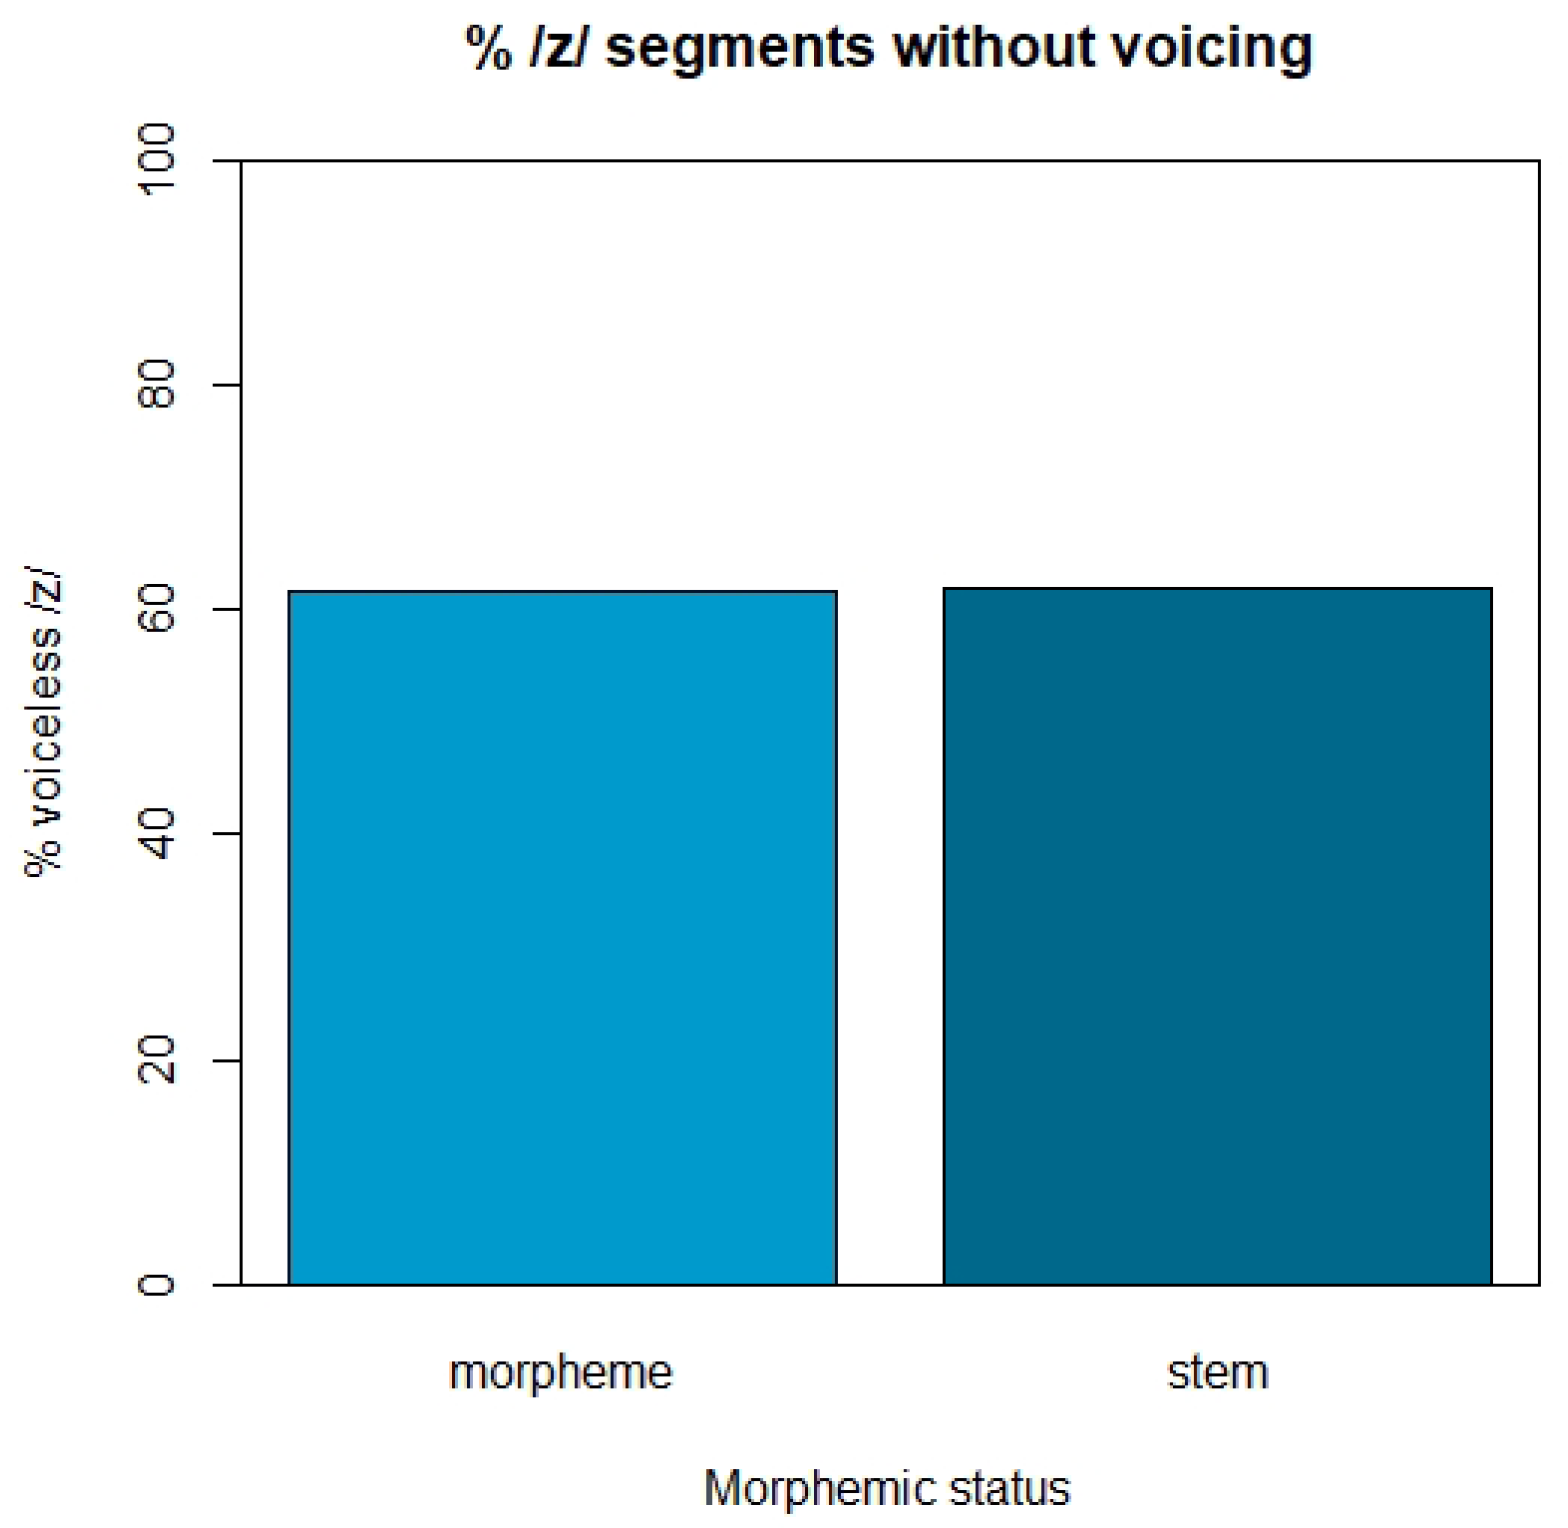
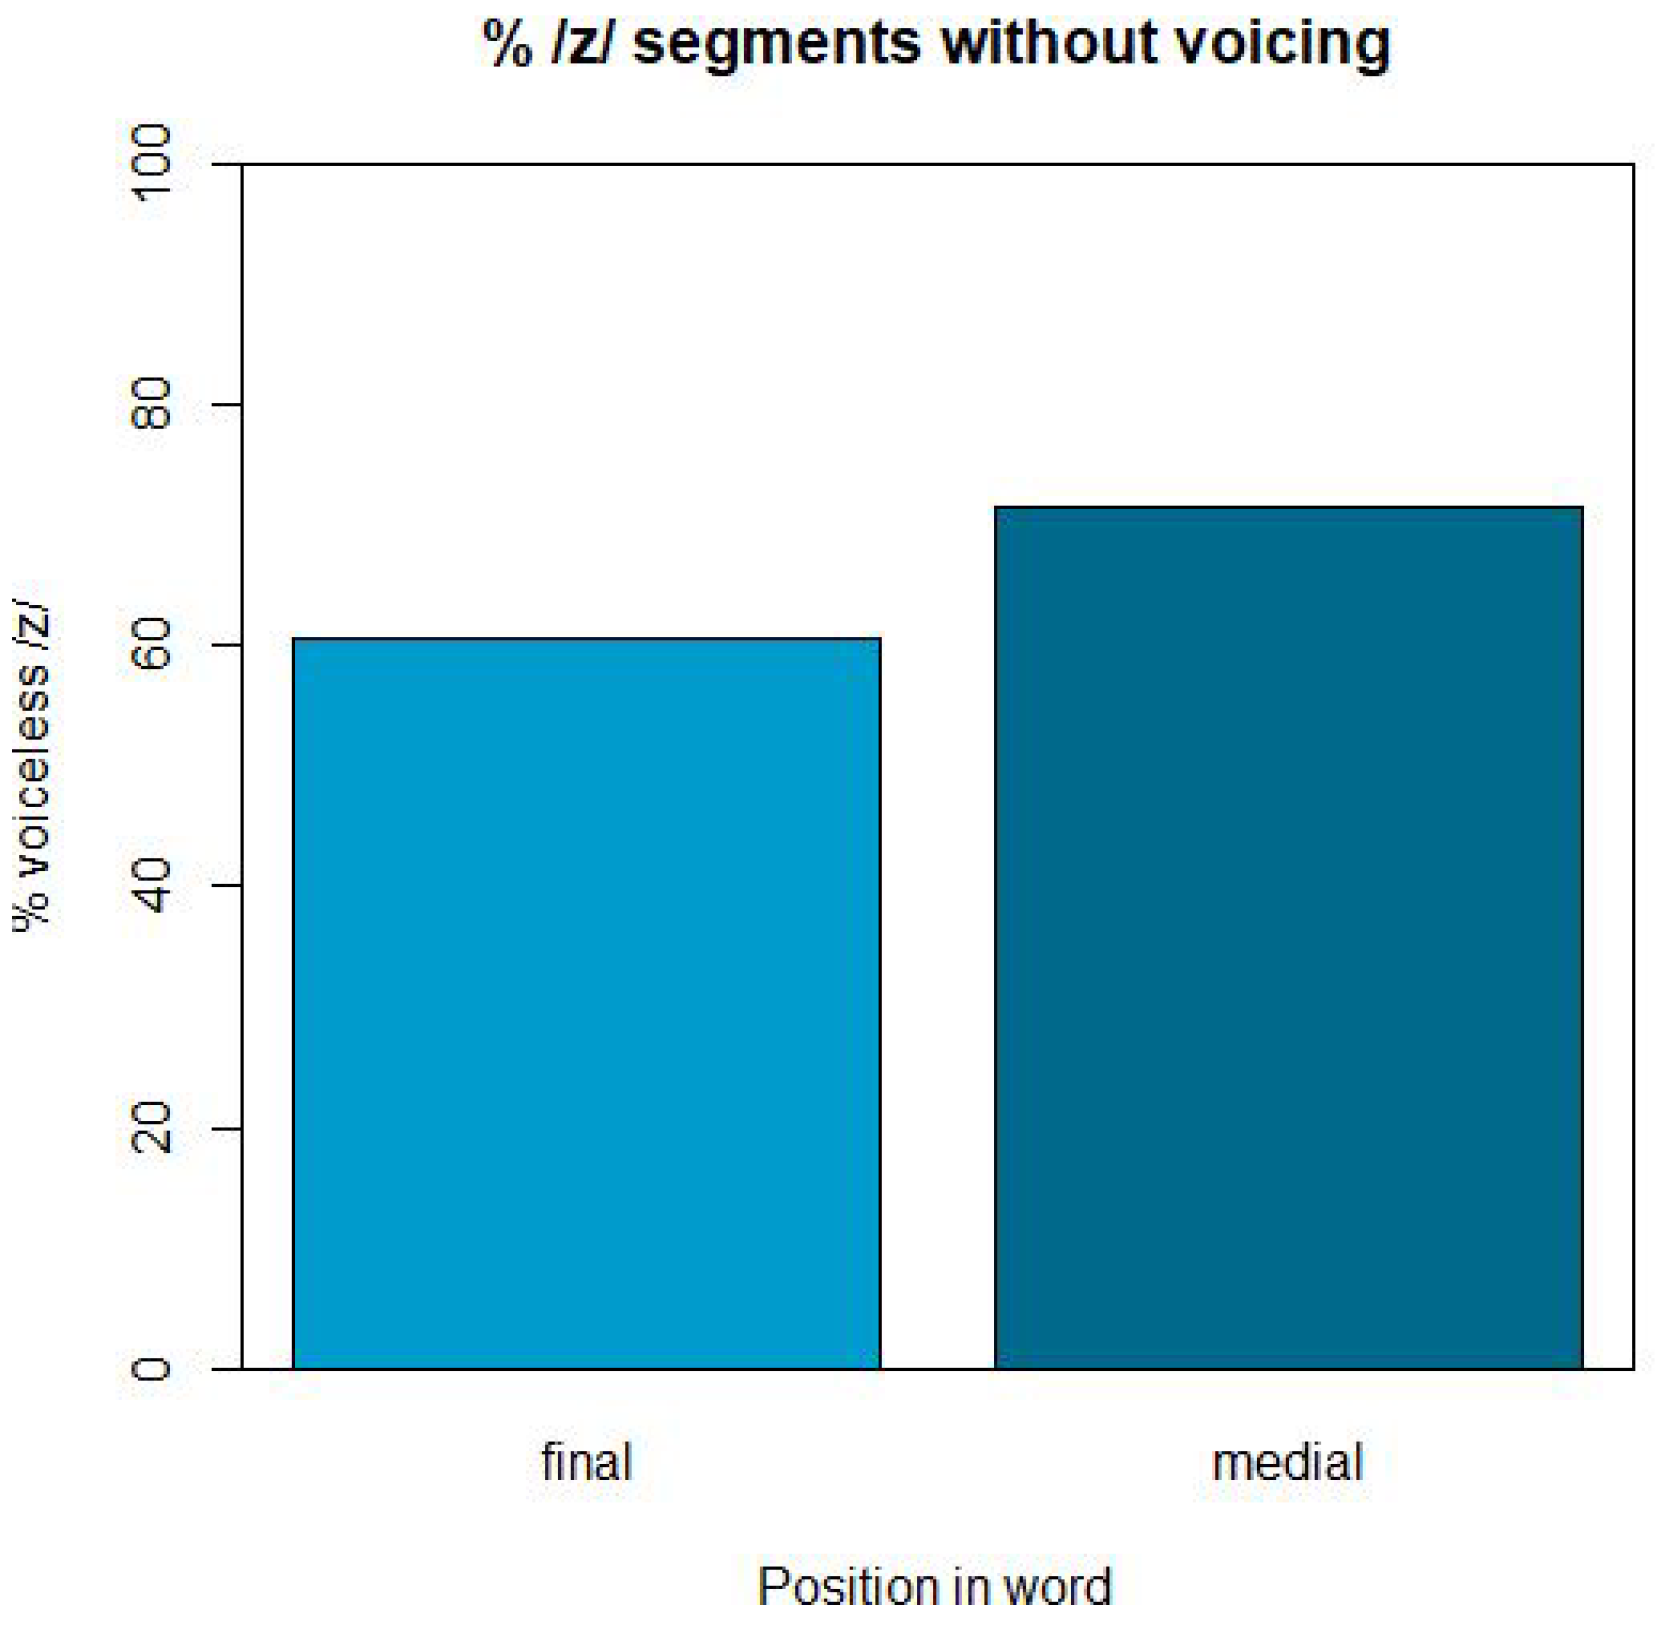
As shown in Figure 11, there was no difference in voicing patterns for English /z/ based on whether it was a separate morpheme or part of a stem. Figure 12 shows that 61% of word-final /z/ were voiceless and 71% of word-medial /z/ were voiceless. That is, /z/ was more commonly voiced in final position than in medial position, although this effect was not found to be significant.
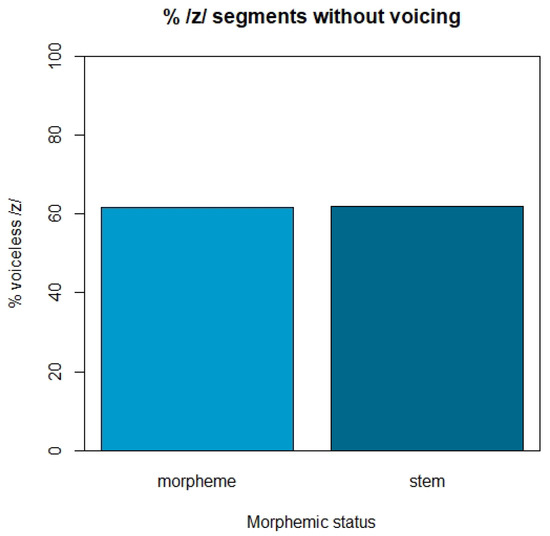
Figure 11.
Proportion of voiceless /z/ in the Late timeframe, based on whether it was a morpheme or part of a stem.
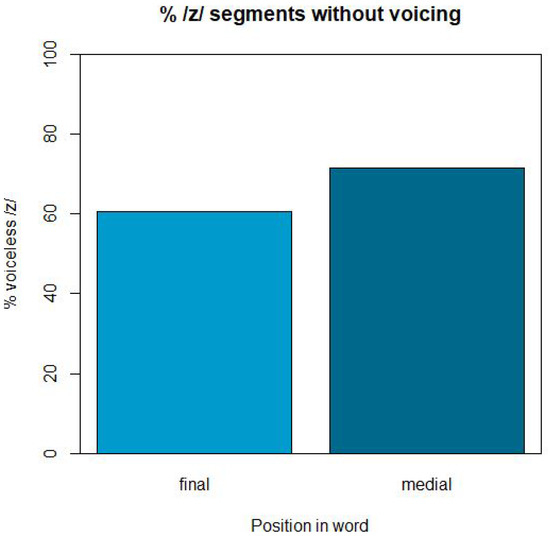
Figure 12.
Proportion of voiceless /z/ in the Late timeframe, based on word position.
3.2.2. Duration
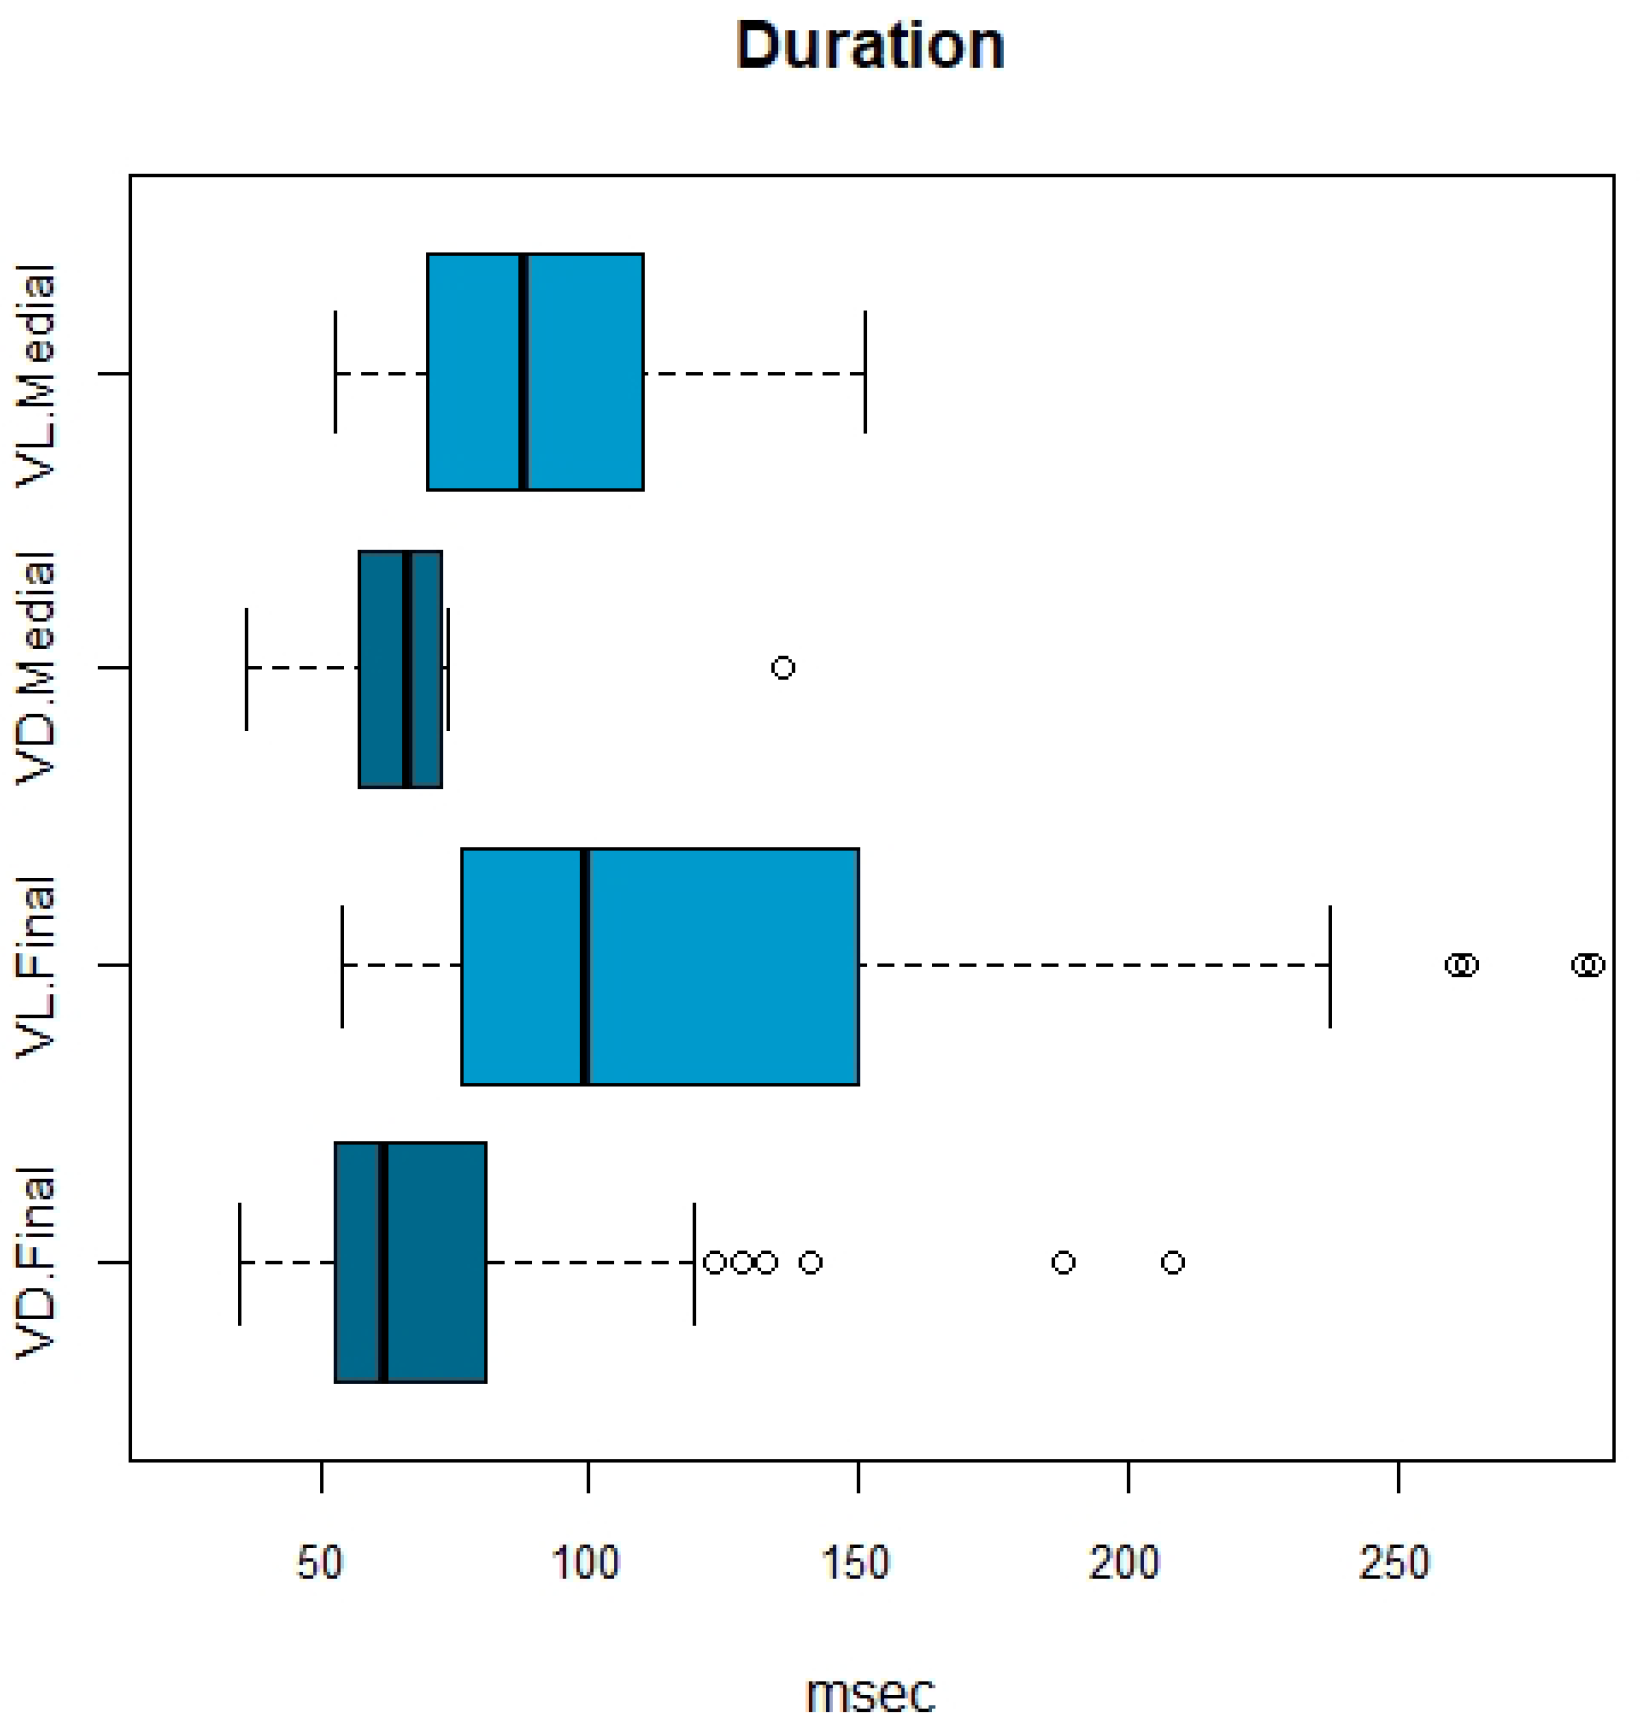
Figure 13 shows the duration of voiced and voiceless segments in word-medial and final position.
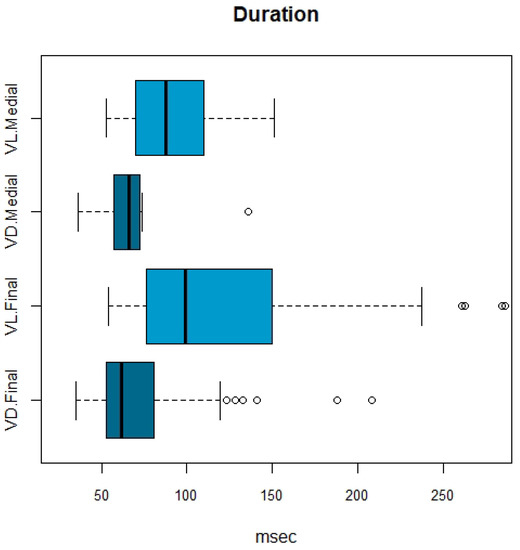
Figure 13.
Duration of /z/ produced as voiced or voiceless, by word position.
The best model for the linear regression on duration included both voicing and position as independent variables, and showed a main effect of both. This means that, as shown in Table 6, duration was significantly longer in voiceless segments and in final position.

Table 6.
Statistical results for the linear regression on duration.
3.3. Discussion
These results suggest that more exposure to and practice with the L2 has led to an increase in L2-like voicing productions. This means the speaker is acquiring a voicing contrast that is not in the L1, but has not yet acquired it completely, since only just over half of /z/ productions were voiced in the Late timeframe. The results for morphemic status are different from those of Contreras-Roa et al. (2020), because the current study found the same pattern for both types of /z/. These results are discussed in terms of SLM and PAM in Section 4.
The duration results were expected in that the voiceless segments were longer than the voiced onces, similar to previous work (Crystal and House 1988; Jongman et al. 2000). (These results also add support to the auditory categorisation of the sounds as voiced or voiceless.) Additionally, as predicted, segments were longer in word-final than word-medial position.
4. General Discussion
For the intonation experiment, the results were contrary to the hypotheses, because it was found that the speaker did not appear to be transferring the lexical pitch accent system of Norwegian to his English even in the Early timeframe. He did not over-apply the L1 pitch accent pattern, contrary to what has been found in previous work on L2 intonation (Jilka 2000; Mennen 2015). Further, the wider f0 range and higher PDQ in the Late timeframe seem to suggest that he may have been compressing his pitch range and movements in the Early timeframe. It is also useful to note that since the proportion of speech that was counted as a pitch accent did not differ between the two timeframes, the difference found in f0 range and PDQ are not related to how many pitch accents occurred. This suggested the speaker is doing something qualitatively different between the two timeframes. If he has become more comfortable speaking the L2 over time, he may be allowing himself more pitch variation in the Late timeframe; that is, that lower fluency in the Early timeframe is connected to his compression, perhaps similar to previous work that found that L2 learners of English showed a narrower pitch range (Mennen 2008). Related to this, as noted in Section 2.3, is the idea that he was hypercorrecting (Eckman et al. 2013; Odlin 1989) in the Early timeframe, knowing that English has less pitch movement than Norwegian. Norwegian has substantial dialect variation in the lexical pitch accent system (Kristoffersen 2000), and Norwegian speakers are familiar with the different patterns. This may suggest that an L1 Norwegian speaker has an awareness of intonation patterns even in an L2. Previous work on hypercorrection in L2 learning has found that L1 French speakers learning English showed both h-deletion and h-insertion, although the latter at lower rates (Janda and Auger 1992). In the current study, it is possible that this awareness of the different patterns between Norwegian and English made the speaker hesitant in the Early timeframe, and he therefore hypercorrected by compressing his pitch range and movements. With increased comfort in the L2, he no longer does this. If he is aware that Norwegian and English have very different intonation patterns, the results fit in with the SLM (Flege 1995; Flege and Bohn 2021) prediction that patterns that differ substantially between languages are easier for learners to acquire.
For the segmental pattern, the results align with the SLM (Flege 1995; Flege and Bohn 2021) and PAM (Best 1994) insofaras the speaker did not voice the /z/ in the Early timeframe; that is, he used the closest L1 sound /s/ instead. The SLM (Flege 1995) of L2 learning would explain these results as the speaker categorising the English /z/ initially as /s/, which is in the L1—an example of equivalence classification. Over time, with more exposure to English, he has created a separate category for /z/ and has begun to distinguish the two phonemes. Particularly, though, the findings here may be best explained through the PAM CG analysis, where both /s/ and /z/ were originally considered to be the same /s/ phoneme, but /z/ was a less good example of it, so over time, the speaker has begun to learn that it is a separate phoneme in English. Future work could compare this speaker’s productions to L1 English speakers’ voicing patterns, because it has been reported that especially in word-final position, /z/ is not always fully voiced (Ogden 2009). However, in the current study, even in medial position, the speaker often does not produce English /z/ with voicing, indicating that he is not L1-like in this pattern. The results for morphemic status are different from those found by Contreras-Roa et al. (2020), since the morphemic status of /z/ was not found to have any effect on whether it was produced as voiced or voiceless. It may simply be that when no fricative voicing contrasts are in the L1, the first challenge is to perceive and produce the voiced fricative, and morphemic status is not (yet) relevant. However, the speaker is not voicing haphazardly, since he was not found to voice the phoneme /s/. In terms of duration, the results showed that the English /z/ phoneme was longer when in final position and when produced as voiceless.
It is also interesting to note that for the intonation pattern, the speaker’s task is to suppress a feature from the L1, while for the segmental pattern, his task is to acquire a new contrast that does not exist in the L1. Perhaps it is easier to suppress a pattern than acquire a new one? Or perhaps prosodic systems that differ between languages are particularly salient to language learners.
This work provides insight into changes in the L2 over time by directly comparing changes in a segmental pattern with a suprasegmental pattern, in the same speaker. These findings contribute to descriptions of hypercorrection in L2 learning, specifically in the context of intonational features.
Funding
This research received no external funding.
Institutional Review Board Statement
Not applicable.
Informed Consent Statement
Not applicable since all recordings were publicly available.
Data Availability Statement
Not applicable.
Conflicts of Interest
The author declares no conflict of interest.
Note
| 1 | This analysis was used because including both fixed factors (Timeframe and Phoneme) as well as an interaction caused a scaling error, and an ANOVA could not be run because it is unsuitable for categorical dependent measures, so instead the two phonemes were examined separately. |
References
- Almberg, Jørn. 2004. Tonal differences between four Norwegian dialect regions—Some acoustic findings. In Nordic Prosody IX. Edited by Gösta Bruce and Merle Horne. Lund: Peter Lang, pp. 19–28. [Google Scholar]
- Backman, Nancy Ellen. 1979. Intonation errors in second language pronunciation of eight Spanish speaking adults learning English. Interlanguage Studies Bulletin 4: 239–66. [Google Scholar]
- Beckman, Mary E. 1986. Stress and Non-Stress Accent. Dordrecht: Foris. [Google Scholar]
- Best, Catherine T. 1994. The emergence of native-language phonological influences in infants: A perceptual assimilation model. In The Development of Speech Perception: The Transition from Speech Sounds to Spoken Words. Cambridge: MIT. [Google Scholar]
- Best, Catherine T., and Michael D. Tyler. 2007. Nonnative and second-language speech perception: Commonalities and complementarities. In Language Experience in Second Language Speech Learning: In Honor of James Emil Flege. Amsterdam: John Benjamins Publishing, pp. 13–34. [Google Scholar]
- Bohn, Ocke-Schwen, and Anne Aarhøj Ellegaard. 2019. Perceptual assimilation and graded discrimination as predictors of identification accuracy for learners differing in L2 experience: The case of Danish learners’ perception of English initial fricatives. Paper presented at the 19th International Congress of Phonetic Sciences, Melbourne, Australia, August 5–9; pp. 2070–74. [Google Scholar]
- Bruce, Gösta. 1977. Swedish word accents in sentence perspective. Travaux de L’Institut de Linguistique de Lund 12. [Google Scholar]
- Bundgaard-Nielsen, Rikke Louise, and Brett Baker. 2015. Perception of voicing in the absence of native voicing experience. Paper presented at the INTERSPEECH, Sixteenth Annual Conference of the International Speech Communication Association, Dresden, Germany, September 6–10; pp. 2352–56. [Google Scholar]
- Busà, Maria Grazia, and Martina Urbani. 2011. A cross linguistic analysis of pitch range in English L1 and L2. Paper presented at the 17th International Congress of Phonetic Sciences, Hong Kong, China, August 17–21; pp. 380–83. [Google Scholar]
- Contreras-Roa, Leonardo, Paolo Mairano, Marc Capliez, and Caroline Bouzon. 2020. Voice assimilation of morphemic -s in the L2 English of L1 French, L1 Italian and L1 Spanish learners. Anglophonia—French Journal of English Linguistics 30. [Google Scholar] [CrossRef]
- Crystal, Thomas H., and Arthur S. House. 1988. Segmental durations in connected speech signals: Current results. Journal of the Acoustical Society of America 83: 1553–73. [Google Scholar] [CrossRef]
- de Leeuw, Esther. 2019. Native speech plasticity in the German-English late bilingual Stefanie Graf: A longitudinal study over four decades. Journal of Phonetics 73: 24–39. [Google Scholar] [CrossRef]
- Dehé, Nicole, and Daniela Wochner. 2022. Voice quality and speaking rate in Icelandic rhetorical questions. Nordic Journal of Linguistics, 1–10. [Google Scholar] [CrossRef]
- Eckman, Fred R., Gregory K. Iverson, and Jae Yung Song. 2013. The role of hypercorrection in the acquisition of L2 phonemic contrasts. Second Language Research 29: 257–83. [Google Scholar] [CrossRef]
- Engstrand, Olle. 2004. Fonetikens Grunder. Lund: Studenlitteratur. [Google Scholar]
- Fintoft, Knut. 1970. Acoustical Analysis and Perception of Tonemes in Some Norwegian Dialects. Oslo: Universitetsforlaget. [Google Scholar]
- Flege, James Emil. 1987. The production of “new” and “similar” phones in a foreign language: Evidence for the effect of equivalence classification. Journal of Phonetics 15: 47–65. [Google Scholar] [CrossRef]
- Flege, James Emil. 1995. Second language speech learning: Theory, findings and problems. In Speech Perception and Linguistic Experience: Theoretical and Methodological Issues. Baltimore: York Press, pp. 233–77. [Google Scholar]
- Flege, James Emil, and Ocke-Schwen Bohn. 2021. The revised speech learning model (SLM-r). In Second Language Speech Learning: Theoretical and Empirical Progress. Edited by Ratree Wayland. Cambridge: Cambridge University Press, pp. 3–83. [Google Scholar]
- Flege, James Emil, and Robert Port. 1981. Cross-language phonetic interference: Arabic to English. Language and Speech 24: 125–46. [Google Scholar] [CrossRef]
- Flege, James Emil, and Wieke Eefting. 1987. The production and perception of English stops by Spanish speakers of English. Journal of Phonetics 15: 67–83. [Google Scholar] [CrossRef]
- Flege, James Emil, Carlo Schirru, and Ian R. A. MacKay. 2003. Interaction between the native and second language phonetic subsystems. Speech Communication 40: 467–91. [Google Scholar] [CrossRef]
- Flores, Tanya. 2016. Declarative intonation in the Spanish of Japanese-Spanish bilinguals. Proceedings of Meetings on Acoustics 29: 060013. [Google Scholar] [CrossRef]
- Gårding, Eva. 1973. The Scandinavian word accents. In Working Papers 8. Lund: Phonetics Laboratory, Lund University. [Google Scholar]
- Gårding, Eva. 1977. The Scandinavian Word Accents. Lund: Gleerup. [Google Scholar]
- Gussenhoven, Carlos. 2004. The Phonology of Tone and Intonation. Cambridge: Cambridge University Press. [Google Scholar]
- Gussenhoven, Carlos. 2012. Tone and intonation in Cantonese English. Paper presented at the Third International Symposium on Tonal Aspects ofLanguages (TAL) 2012, Nanjing, China, May 26–29. [Google Scholar]
- Hayes, Bruce. 1995. Metrical Stress Theory: Principles and Case Studies. Chicago: University of Chicago Press. [Google Scholar]
- Heselwood, Barry, and Louise McChrystal. 1999. The effect of age group and place of L1 acquisition on the realisation of Panjabi stop consonants in Bradford: An acoustic sociophonetic study. Leeds Working Papers in Linguistics and Phonetics 7: 49–68. [Google Scholar]
- Hincks, Rebecca. 2003. Pronouncing the Academic Word List: Features of L2 Student Presentations. Paper presented at the 15th International Congress of Phonetic Sciences, Barcelona, Spain, August 3–9; pp. 1545–48. [Google Scholar]
- Hincks, Rebecca. 2004. Processing the prosody of oral presentations. Paper presented at the Proceedings of InSTIL/ICALL, Venice, Italy, June 17–19. [Google Scholar]
- Hualde, José I. 2012. Two Basque accentual systems and the notion of pitch-accent language. Lingua 122: 1335–51. [Google Scholar] [CrossRef]
- Hyman, Larry. 2009. How (not) to do phonological typology: The case of pitch-accent. Language Sciences 31: 213–38. [Google Scholar] [CrossRef]
- Janda, Richard D., and Julie Auger. 1992. Quantitative evidence, qualitative hypercorrection, sociolinguistic variables—And French speakers’ ‘eadhaches with English h/∅. Language and Communication 12: 195–236. [Google Scholar] [CrossRef]
- Jarvis, Scott, and Aneta Pavlenko. 2009. Cross-Linguistic Influence in Language and Cognition. London: Routledge. [Google Scholar]
- Jilka, Matthias. 2000. Testing the Contribution of Prosody to the Perception of Foreign Accent. In Proceedings of New Sounds 2000. Edited by Allan James and Jonathan Leather. Amsterdam: University of Amsterdam, pp. 199–207. [Google Scholar]
- Jongman, Allard, Ratree Wayland, and Serena Wong. 2000. Acoustic Characteristics of English Fricatives. Journal of the Acoustical Society of America 108: 1252–63. [Google Scholar] [CrossRef]
- Kristoffersen, Gjert. 2000. The Phonology of Norwegian. Oxford: Oxford University Press. [Google Scholar]
- Lee, Jackson L., and Stephen Matthews. 2014. When French becomes tonal: Prosodic transfer from L1 Cantonese and L2 English. Paper presented at the 6th Annual Pronunciation in Second Language Learning and Teaching Conference, Santa Barbara, CA, USA, September 5–6. [Google Scholar]
- Lein, Tatjana, Tanja Kupisch, and Joost van de Weijer. 2016. Voice onset time and global foreign accent in German-French simultaneous bilinguals during adulthood. International Journal of Bilingualism 20: 732–49. [Google Scholar] [CrossRef]
- Lisker, Leigh, and Arthur S. Abramson. 1964. A Cross-Language Study of Voicing in Initial Stops: Acoustical Measurements. Word 20: 384–422. [Google Scholar] [CrossRef]
- Maddieson, Ian. 2011. Tone. In The World Atlas of Language Structures Online. Edited by Matthew S. Dryer and Martin Haspelmath. Munich: Max Planck Digital Library. [Google Scholar]
- Major, Roy C. 1992. Losing English as a first language. The Modern Language Journal 76: 190–208. [Google Scholar] [CrossRef]
- Mayr, Robert, and Aysha Siddika. 2018. Inter-generational transmission in a minority language setting: Stop consonant production by Bangladeshi heritage children and adults. International Journal of Bilingualism 22: 255–84. [Google Scholar] [CrossRef]
- McCarthy, Kathleen M., Bronwen G. Evans, and Merle Mahon. 2013. Acquiring a second language in an immigrant community: The production of Sylheti and English stops and vowels by London-Bengali speakers. Journal of Phonetics 41: 344–58. [Google Scholar] [CrossRef]
- Meer, Philipp, and Robert Fuchs. 2021. The Trini Sing-Song: Sociophonetic variation in Trinidadian English prosody and differences to other varieties. Language and Speech. [Google Scholar] [CrossRef] [PubMed]
- Mennen, Ineke. 2004. Bi-directional interference in the intonation of Dutch speakers of Greek. Journal of Phonetics 32: 543–63. [Google Scholar] [CrossRef]
- Mennen, Ineke. 2008. Phonological and phonetic influences in non-native intonation. In Non-Native Prosody: Phonetic Description and Teaching Practice. Edited by Juergen Trouvain and Ulrike Gut. Berlin and New York: De Gruyter Mouton, pp. 53–76. [Google Scholar]
- Mennen, Ineke. 2015. Beyond segments: Towards a L2 intonation learning theory. In Prosody and Language in Contact. Edited by Elisabeth Delais-Roussarie, Mathieu Avanzi and Sophie Herment. Berlin and Heidelberg: Springer, pp. 171–88. [Google Scholar]
- Mennen, Ineke, and Esther de Leeuw. 2014. Beyond Segments: Prosody in SLA. Studies in Second Language Acquisition 36: 183–94. [Google Scholar] [CrossRef]
- Nagy, Naomi. 2015. A sociolinguistic view of null subjects and VOT in Toronto heritage languages. Lingua 164: 309–27. [Google Scholar] [CrossRef]
- Odlin, Terence. 1989. Language Transfer: Cross-Linguistic Influence in Language Learning. Cambridge: Cambridge University Press. [Google Scholar]
- Ogden, Richard. 2009. An Introduction to English Phonetics. Edinburgh: Edinburgh University Press. [Google Scholar]
- Ordin, Mikhail, and Ineke Mennen. 2017. Cross-Linguistic Differences in Bilinguals’ Fundamental Frequency Ranges. Journal of Speech Language and Hearing Research 60: 1493–506. [Google Scholar] [CrossRef]
- Pierrehumbert, Janet. 1980. The Phonology and Phonetics of English Intonation. Ph.D. thesis, MIT, Cambridge, MA, USA. [Google Scholar]
- R Development Core Team. 2008. R: A Language and Environment for Statistical Computing. Vienna: R Core Team. ISBN 3-900051-07-0. [Google Scholar]
- Treffers-Daller, Jeanine, and Raymond Mougeon. 2005. The role of transfer in language variation and change: Evidence from contact varieties of French. Bilingualism: Language and Cognition 8: 93–98. [Google Scholar] [CrossRef]
- Tronnier, Mechtild, and Elisabeth Zetterholm. 2013. Tendencies of Swedish word accent production by L2-learners with tonal and non-tonal L1. In Nordic Prosody: Proceedings of the XIth Conference, Tartu 2012. Edited by Eva Liina Asu and Lippus Pärtel. Pieterlen and Bern: Peter Lang Publishing Group, pp. 391–400. [Google Scholar]
- Tung, Yi-Chen. 2006. The language interference of pitch accent language on tone language—A case study of Mandarin and Swedish. The Journal of the Acoustical Society of America 119: 3392–92. [Google Scholar] [CrossRef]
- Wee, Lian-Hee. 2016. Tone assignment in Hong Kong English. English 92: e67–e87. [Google Scholar] [CrossRef][Green Version]
- Willems, Nico. 1982. English Intonation from a Dutch Point of View. Dordrecht: Foris. [Google Scholar]
- Yang, Yuxiao, Xiaoxiang Chen, and Qi Xiao. 2022. Cross-linguistic similarity in L2 speech learning: Evidence from the acquisition of Russian stop contrasts by Mandarin speakers. Second Language Research 38: 3–29. [Google Scholar] [CrossRef]
- Yiu, Suki S. Y. 2014. Tone spans of Cantonese English. Paper presented at the 4th International Symposium on Tonal Aspects of Languages (TAL) 2014, Nijmegen, The Netherlands, May 13–16. [Google Scholar]
- YouTube Channel. 2011. Ole Gunnar Solskjaer FA Inquiry. Fitchburg: Fitchburg Access Television. [Google Scholar]
Publisher’s Note: MDPI stays neutral with regard to jurisdictional claims in published maps and institutional affiliations. |
© 2022 by the author. Licensee MDPI, Basel, Switzerland. This article is an open access article distributed under the terms and conditions of the Creative Commons Attribution (CC BY) license (https://creativecommons.org/licenses/by/4.0/).


