Article

Impacts of Investor Attention and Accounting Information Comparability on Stock Returns: Empirical Evidence from Chinese Listed Companies

1
International College of Digital Innovation, Chiang Mai University, Chiang Mai 50200, Thailand
2
School of Business, Chengdu University, Chengdu 610106, China
*
Authors to whom correspondence should be addressed.
Int. J. Financial Stud. 2024, 12(1), 18; https://doi.org/10.3390/ijfs12010018
Submission received: 25 November 2023 / Revised: 25 January 2024 / Accepted: 4 February 2024 / Published: 14 February 2024

Abstract

:
The efficient capital markets hypothesis (EMH) posits that security prices incorporate all available information in capital markets. Nevertheless, real stock markets often exhibit speculative behavior due to information asymmetry and the limited rationality of investors. This paper employs statistical analysis, a multiple regression approach, and robustness tests to investigate the impact of investor attention and accounting information comparability on stock returns. We collected monthly data from all Chinese A-share stocks listed on the main board of the Shanghai Stock Exchange for the period 2017–2021. Our findings reveal a significant positive correlation between current investor attention and current monthly stock returns and a significant negative correlation between lagged investor attention and current monthly stock returns. Moreover, accounting information comparability serves as a substantial moderator, amplifying the positive effect of current investor attention on current stock returns and mitigating the negative impact of lagged investor attention. We investigate the indicator of accounting information comparability from the perspective of investor attention. Significantly, we use accounting information comparability as a moderating variable for the first time to assess its influence on stock returns. Our results demonstrate that accounting information comparability significantly contributes to mitigating excessive share price declines and stimulating share price increases. This discovery also acts as an internal driver for listed companies to proactively improve accounting information comparability.

1. Introduction

Accounting information comparability is regarded as a distinctive quality among other qualitative aspects of financial data that improve a company’s mechanisms (Choi and Suh 2019). It has drawn interest from theoretical and technical perspectives due to the numerous advantages it provides to stakeholders and investors (Luo et al. 2020). There is a replacement effect between earnings and cash flow measures that is favorably correlated with the compensation weight of earnings and negatively correlated with the weight of earnings (Thakkar and Chaudhari 2021). As seen by the extensive volume of specialist literature, the theory discussed in the following pages, the efficient market hypothesis (EMH), is highly contentious and of particular interest to financial economists, educators, and researchers (Kong and So 2023). Despite numerous attempts to uncover the truth about the EMH, no definitive answer has yet been found. Consequently, stock prices reflect a timely and effective response to information. However, due to the complexity of human nature and the inherent game properties of financial markets, financial chaos such as excessive stock price volatility, total earnings announcements, and surplus drift have occurred frequently in capital markets, leading scholars to challenge the assumptions made by modern financial theory.
The implementation of the International Financial Reporting Standards for high-quality accounting information, which guarantees financial stability and economic efficiency in the globalized market, has been promoted by numerous nations, global professional organizations, and trade associations. The goal of adopting international accounting standards is to raise the level of financial reporting quality in order to boost users’ confidence in financial statements when making decisions and to make financial statements more comparable across various organizations and nations (Shahid et al. 2022). High-quality accounting information can assist shareholders and investors in making better decisions by overcoming information asymmetry. Accounting information informs the capital market about a company’s financial status and business performance. However, not all publicly traded corporations’ accounting information is of unquestionable quality. Financial fraud has been more frequently reported in the press in recent years (Liang et al. 2022). For investors and financial markets around the world, the COVID-19 pandemic breakout has brought up previously unheard-of difficulties. The pandemic’s uncertainty and information overload have had a severe influence on investors’ attention spans and their capacity to comprehend sophisticated financial information. Accounting information comparability becomes crucial in such a situation for investors to make wise investment decisions (Olayinka 2022).
The challenges within the Chinese stock market not only influence investor decisions but also hold significant implications for market health. Against this background, we aim to address the following questions:
Question (1): Can limited investor attention impact stock returns in China?
Question (2): To what extent does investor attention impact the stock returns of the capital market in China?
Question (3): Does the relationship between investor attention and stock returns vary depending on accounting information comparability?
To tackle the above questions, this study employs the following theoretical foundations to investigate the Chinese stock market. Firstly, the information asymmetry theory explores the impact of information availability on market efficiency, revealing mechanisms behind trading behavior and stock valuation (Akerlof 1970; Kyle 1985). Secondly, the limited attention theory elucidates the challenges faced by individual Chinese investors in information acquisition, especially under subjective market sentiments and media influence, resulting in their limited attention (Simon 1955; Mullainathan and Thaler 2000). The accounting information comparability theory plays a crucial role in the Chinese market, acting as a positive regulator in an environment with non-standardized information disclosure. It reduces investors’ information search costs and enhances information understanding (Lang et al. 2019). The herd behavior theory explains how, in the face of information uncertainty, investors collectively focus on specific stocks, influencing market dynamics (Bikhchandani et al. 1992). In the context of the Chinese market, herd effects are more pronounced, as investors are more susceptible to others’ behavior, resulting in excessive attention to certain stocks. Lastly, signal transmission theory emphasizes the strategic use of accounting information in the Chinese market, particularly considering comparability, to attract investors (Spence 1973; Lambert et al. 2011).
This paper investigates the impact of individual investor attention on current stock returns, examining the moderating effect of accounting information comparability, providing essential insights into the Chinese market and suggesting meaningful improvements. We use monthly data from a comprehensive sample of Chinese A-shares for listed companies on the main board market of the Shanghai Securities Exchange from 2017 to 2021. Subsequently, we employ statistical analysis and multiple regression methods, supplemented by robustness tests, to validate the applicability of the theoretical framework. Regression analysis reveals a statistically significant positive relationship between current investor attention and monthly stock returns, along with a significant negative correlation between lagged investor attention and current monthly stock returns. Moreover, our findings indicate that accounting information comparability partially moderates the outlined relationships. To ensure the robustness of our results, we employ the instrumental variables method and quantify the core dependent variable using monthly stock returns that account for reinvested cash dividends to check the robustness.
Compared with the existing literature, the main contributions of our study are as follows. (a) Enhanced positive influence and mitigation of adverse effects: In contrast to earlier scholars concentrating on the impact of accounting information comparability on stock prices, we advance the discourse by underscoring the dual role of comparability within the realm of limited investor attention. Accounting information comparability not only enhances the positive influence of current investor attention on stock returns but also mitigates the adverse effects of delayed attention. (b) In-depth exploration of investor attention’s impact on stock returns: Departing from the focus on how investor attention affects stock returns, we delve into the underlying reasons behind this impact. The argument is that heightened investor attention in the current period positively influences stock returns. However, in line with the limited attention theory and signaling theory, information distortion during subsequent dissemination leads to investor overreaction and a subsequent decline in stock prices. (c) Innovative use of accounting information comparability as a moderating variable: This study introduces accounting information comparability as a novel moderating variable to scrutinize the impact of investor concerns on stock returns. Companies with high comparability of accounting information effectively reduce costs associated with information search, understanding, and dissemination distortion. This innovative approach captures the intricate process through which investor attention influences stock returns.
The remainder of this paper is organized as follows. Section 2 includes a literature review and theoretical deductions, followed by the formulation of research hypotheses in Section 3. Additionally, Section 4 presents the methodology, including data collection and the empirical research design. Section 5 provides a detailed exposition of our empirical test analysis. The final section offers our conclusions and their implications.

2. Literature Review

2.1. Limited Investor Attention

Prior studies have concentrated on quantifying investor attention through various proxies. Table 1 shows the characteristics of asset trading itself, news media coverage and advertising expenditure, event study methodology, social media information, and the internet search index used (Zhang et al. 2019), with early researchers relying on financial asset trading characteristics. Common indicators include excess stock returns (Yang et al. 2017), trading volume (Seok et al. 2021), turnover rate (Kim et al. 2021a), and cumulative market index returns (Kim et al. 2021b). Some scholars indirectly quantify investor attention using metrics like news headlines (Barber and Odean 2008) and advertising (Hsu and Chen 2019; Yang et al. 2021) to examine investor attention. Meanwhile, others identify changes in attention triggered by specific stock market events (Sundar et al. 2021), employing event study methodology (Li and Wu 2024). These studies face a significant challenge, as indirect measurements are effective only when investors genuinely notice and read the information. Moreover, the popularity of social media accelerates platforms like stock forums, attracting investors to actively seek and exchange investment information online. Active engagement on these platforms aids in understanding attention and investment decisions (Vishnu Maniy et al. 2023). In contrast to traditional media, online search indices reflect proactive information-seeking behavior. With the development of search engines like Baidu and Google, they become primary platforms, leading to the “online search index” metric (Chen et al. 2020). Using internet search volume as a proxy for investor attention is the most common approach in the literature. Although other proxies measure the passive attention of investors, internet search volume data measure active attention. Akarsu and Süer (2022) examine the effects of limited investor attention on stock returns by using the Google search volume index to measure investor attention.
The quantitative indicators of investor attention mentioned above can be classified into direct and indirect indicators. When comparing these indicators, there are three key distinctions, as follows (1) Data source: Indirect indicators are derived from self-defining characteristics of asset trading, news media, and advertising expenditure. In contrast, direct indicators utilize social media information and internet search indices. (2) Nature of indicators: Indirect indicators are indirect and often passive portrayals of investor attention, which can introduce high levels of noise. They encompass metrics like trading volume, turnover rate, the number of news reports, and advertising expenditure. Direct indicators are more active portrayals with less noise and include social media posts, stock forum postings, and internet search trends. (3) Data availability: Indirect indicators are typically associated with readily accessible data. Conversely, obtaining direct indicators, such as social media and internet search indices, can pose challenges and necessitate access to specific online platforms (Srijiranon et al. 2022). In summary, indirect indicators are available and easy to access, but they are indirect and noisy. Direct indicators offer a more natural reflection of investor sentiment, but may require more effort to collect (Tumasjan 2023).
Studies that examine the impact of investor attention on stock returns in the Chinese market predominantly use the Baidu index instead of the Google SVI, because Baidu is the leader in the search engine market in China. The Baidu search index provides real-time daily data, offering an ideal source to reflect netizens’ interests and attention. Specifically, leveraging data from the Baidu search index, a platform capturing extensive user behavior on Baidu, a leading Chinese search engine with an 84.6% market share in 2018 (Yang et al. 2017). Zhang et al. (2013) find a bidirectional causal relationship between investor attention and abnormal returns. Zhang and Wang (2015) find that the Baidu index can positively predict higher stock returns. By contrast, Shen et al. (2017) find a negative relationship between the Baidu index and stock returns. Hence, we quantify investor attention using the variable of “internet search index” to examine investor attention.

2.2. Accounting Information Comparability

Comparability makes similar goods appear similar and differing ones appear to be different as an enhancing qualitative attribute. Comparability is useful for practical decision-making, since users must choose between options while making decisions. The current macroeconomic trends emphasize its value even more. From a global standpoint, economic globalization is advancing and becoming more pervasive: cross-border investment and international money flows are increasing. From a domestic standpoint, investment fields and product targets are expanding in number in tandem with economic expansion. Investors have more options in this new climate, and comparing various investment industries or goals has grown increasingly challenging. As a result, after relevance and reliability, comparability has drawn both academics’ and stakeholders’ interest. Early research was mostly based on the convergence of international accounting standards, exploring the measurement, drivers, and economic consequences of comparability (Dorr et al. 2021), due to the complexity of evaluating comparability at the firm level. The major argument of this research is that among these early studies, analyses of economic effects provided support for the value of comparability. Improving the comparability of financial reporting across nations is the most crucial and immediate goal of accounting standards convergence (Weetman et al. 2020). The earnings-return regression model is used to map firms’ accounting systems and create a comparability measurement at the firm-pair level. The firm-level comparability measurement is then created using the average value, which is based on the conceptual framework’s definition of comparability. The new measure makes it possible to examine comparability at the firm level, which circumvents the restrictions of comparability assessment in the context of standards convergence, which has seen limited research at the national or regional level (Chen et al. 2022). Since late 2019, the COVID-19 epidemic has garnered significant global attention, and many communities and economies affected by the issue are currently experiencing an unanticipated exogenous shock. The COVID-19 pandemic has generated significant stock market volatility (Baker et al. 2020). Employing text-based approaches to assess the influence of COVID-19 on U.S. stock market volatility, Salisu et al. (2022) evaluate the effectiveness of U.S. equities as a hedge against financial and health risks and come to the conclusion that defensive stocks can act as a hedge against uncertainty brought on by pandemics (Rakshit and Neog 2022). Moreover, the COVID-19 outbreak had an impact on Chinese stock market results, Data analysis clearly illustrates that the outbreak had a detrimental impact on the China stock market (Cheng et al. 2022). The pandemic has had a negative impact on China’s transportation, mining, electrical, heating, and environmental industries based on event research methodology. These investigations have established that the pandemic is adversely affecting almost every industry globally. The impact of the pandemic on tourism-related companies has received far less attention than the economic and social disruptions caused by COVID-19 (Lee and Chen 2022). COVID-19 deaths have a significant negative impact on the travel and leisure industry returns across 65 countries. In an analysis of the effect of the COVID-19 epidemic on the returns of Chinese-listed companies using panel data (He et al. 2020), the spread of the virus had significantly negative effects on the performance of domestic equities across several industries (Erdem 2020). Moreover, the pandemic increased volatility and decreased market returns, based on a sample of 75 countries (Ashraf 2020).
In summary, this paper addresses research gaps in the following areas. (1) Theoretical significance: Firstly, we extensively explore the impact mechanism of limited investor attention on stock returns. While existing research primarily focuses on the outcomes of this event on stock returns, explanations for its impact mechanism are relatively limited. By incorporating the limited attention theory and information asymmetry theories, we posit that information distortion in dissemination is the primary mechanism leading to investors’ excessive reactions to stock prices. This analysis addresses the theoretical gap in previous research concerning why investor attention influences stock returns. Secondly, we introduce the role of accounting information comparability in stock return analysis, broadening the research scope on accounting information comparability. Past studies predominantly concentrated on its impact on stock price information content, and we further argue that enhancing accounting information comparability can elevate stock returns and reduce reversal effects. This provides new theoretical support for listed companies aiming to improve their accounting information comparability, addressing limitations in existing research on this subject. (2) Practical significance: We offer valuable insights into the financial market and policy development. Given the substantial presence of individual investors in China’s financial market, considering their characteristics of limited rationality and attention becomes crucial. We suggest that improving accounting information comparability can effectively mitigate the adverse impact of limited investor attention on stock returns. Consequently, this enhances the stability of stock returns and prevents extreme fluctuations in stock prices.

3. Research Hypothesis

3.1. Current Investor Attention and Current Stock Returns

Unlike the modern financial theory that suggests investors can process information at zero cost, Kahneman proposed the cognitive resource theory (Kahneman 1973), which argues that investors’ attention is limited when making investment decisions and must be allocated to specific investment targets. Stocks that attract investors’ attention can reduce their information search costs and generate buying pressure. In 2010, Google unexpectedly withdrew its search business from mainland China due to the failure of negotiations with the Chinese government regarding its censorship of Google’s search results (Xu et al. 2021). After that, Baidu has become a dominant search engine in mainland China (Barber and Odean 2008), which also highlights that stocks with higher investor attention tend to exhibit higher returns due to short-selling constraints. By quantifying investors’ attention using the Baidu search index, we found a positive correlation between current investor attention and stock returns. The impact of investor attention on stock returns has been investigated extensively in the literature in the last decade, especially with the use of search volume data. Whereas most studies find a positive relationship between investor attention and stock returns, others find a negative or insignificant relationship (Akarsu and Süer 2022). Considering the late start of China’s securities market, the underdeveloped disclosure system, the absence of a short-selling mechanism, high information search costs, and the information disadvantage for individual investors, investors tend to buy stocks that attract their attention. Based on the analysis above, this paper proposes Hypothesis 1.
Hypothesis 1 (H1).
Current investor attention is positively correlated with current stock returns. The greater the attention that current investors pay to stocks, the higher the current stock returns.

3.2. Lagged Investor Attention and Current Stock Returns

Harold Dwight Lasswell’s “5W” communication model states that information dissemination is a process in which the communicator encrypts and transmits information to the audience through the channel for decoding, and the audience subsequently responds to the decoded data (Li 2022). However, various factors, including the complexity of the information and the individual comprehension of the audience, can lead to distortions during both the encoding by the communicator and the decoding by the audience (Li et al. 2018). The audience is given distorted information in this study, specifically that “the hotter the stock and the more attention it receives, the higher the return” (Jiang et al. 2017). Consequently, the momentum buying behavior resulting from this information generates a stock premium that lacks fundamental support and ultimately causes the stock price to reverse (Choi et al. 2020).
According to the extended functional fixation hypothesis (EFFH) (Hand 1990), the less rational momentum investors among individual investors can cause overreaction by locking in the higher stock returns obtained by rational, information-advantaged investors, as any investor who continues to invest in the stock will still obtain a positive stock return. The overattention underperformance theory (Sun et al. 2020) also argues that investors end up overreacting to a particular stock due to the momentum generated by distorted information, ultimately leading to stock price reversals. Based on the above analysis, this paper proposes Hypothesis 2.
Hypothesis 2 (H2).
Lagged investor attention is negatively correlated with current stock returns. The greater the lagged investors’ attention, the greater the reversal of current stock returns.

3.3. The Moderating Effect of Accounting Information Comparability on the Relationship between Investor Attention and Current Stock Returns

A growing number of studies have shown that highly comparable accounting information can effectively improve the information content of stock prices and thus reduce the cost of information comprehension for investors (Yang et al. 2023). Furthermore, increased accounting information comparability can serve as a disincentive for management to hide bad news, thereby reducing the risk of stock price collapse (Karolyi et al. 2020). Moreover, in the context of highly comparable target companies, greater accessibility to information tends to attract more investor attention.
Secondly, highly comparable accounting information in the capital market can greatly reduce the difficulty of understanding by investors, reduce the degree of distortion in the process of information dissemination, and make the stock price better reflect the fundamental information (Hirshleifer and Teoh 2003). Accounting information with high comparability can effectively reduce the irrational bias caused by investors’ comprehension difficulties, thereby diminishing the irrational fluctuation in stock prices caused by investors using distorted information as informative (Daniel et al. 2002). In essence, the higher the accounting information comparability, the lower the cost of information comprehension for investors, thereby attracting more attention from investors. High comparability and easily comprehensible information also reduce information distortion during dissemination and mitigate investors’ tendency to overreact to distorted information. Based on the above analysis, this paper proposes Hypotheses 3 and 4:
Hypothesis 3 (H3).
High accounting information comparability reinforces the positive correlation between current Investor attention and current stock returns.
Hypothesis 4 (H4).
High accounting information comparability weakens the negative correlation between lagged investor attention and current stock returns.
The four hypotheses are summarized in Figure 1.

4. Data and Methodology

4.1. Sample Data

All China’s listed A-share companies on the main board market of the Shanghai Securities Exchange (SSE) were selected as the sample. The initial sampling period spans from 1 January 2013 to 1 January 2021, with monthly data selected for the sample. The reason for choosing 2013 as the starting time is that the China Securities Regulatory Commission (CSRC) decided to push forward the reform of the IPO system in that year, accelerating the conversion of stock issuance from the approval system to the registration system. In December of that year, significant non-market-oriented restrictions, such as administrative price limits, were abolished. Hence, initiating the study from 2013 holds substantial research significance. Given that the calculation of accounting information comparability necessitates utilizing data from the initial sixteen financial quarters, the final sample interval spans from 1 January 2017 to 1 January 2021. The following entities were excluded: (1) insurance and financial companies, due to their special characteristics regarding accounting and final financial statements; (2) ST an *ST companies; and (3) companies with missing or abnormal key data. Finally, 41,016 valid monthly data points were obtained.
As depicted in Figure 2, industry selection and exclusion are guided by the Industry Category of Listed Companies issued by the China Securities Regulatory Commission (CSRC). The independent, moderating, and control variable data in this study are sourced from the China Stock Market and Accounting Research (CSMAR) database, while the dependent variable data are obtained from the Chinese Research Data Services (CNRDS) platform. Additionally, we used Python for data preprocessing, including data cleaning, outlier detection, and handling missing values. Subsequently, we employed STATA (version 17.0) (data science statistical software) for advanced statistical analysis, regression modeling, and hypothesis testing.

4.2. Selection and Design of Major Variables

4.2.1. Dependent Variable

To exclude the impact of reinvesting cash dividends on stock returns, this study calculates monthly stock returns without factoring in cash dividend reinvestment. To enhance the reliability of the regression results, we conducted robustness tests by redefining the individual stock monthly returns, considering the reinvestment of cash dividends. The specific method for calculating individual stock monthly returns is as follows:
r n , t = P n , t × i = 1 m 1 + F n , i + S n , i × C n , i + i = 1 m { j = 1 i 1 + F n , j 1 + S n , j 1 × C n , j 1 × D n , j } P n , t 1 + i = 1 m { j = 1 i 1 + F n , j 1 + S n , j 1 × C n , j 1 × C n , i × S n , i × K n , i } 1
where m represents the number of ex-dividend events for stock n during the calculation period, P n , t signifies the closing price of stock n on the last trading day of the t-th calculation period, while P n , t 1 denotes the closing price of stock n on the last trading day of the t − 1-th calculation period, D n , i represents the cash dividend per share of stock n at the i-th ex-dividend date, F n , i signifies the number of bonus shares per share of stock n at the i-th ex-dividend date, F n , 0 = 0 , S n , i represents the number of allotted shares per share of stock n at the i-th ex-dividend date, S n , i = 0 , K n , i denotes allotment price per share when stock n is the ex-dividend date on the day i , and C n , i represents stock n split per share at the i-th ex-dividend date.

4.2.2. Independent Variable

This study quantifies investor attention by using the Web Search Index (Li et al. 2021). The Web Search Index is taken from the Web Search Volume Index of Chinese Listed Companies (WSVI) in the Chinese Research Data Services Platform (CNRDS) (Zhang et al. 2013).
Compared with institutional investors, individual investors face an inherent disadvantage in terms of capital size, access to information, interpretation of data, and knowledge reservoirs. Compared with professional institutional investors who benefit from dedicated analyst teams, individual investors primarily rely on search engines to access investment-related information, leading to a heightened motivation among individual investors to utilize search engines for this purpose. These searches conducted by individual investors encompass not only stock codes but also company abbreviations and full names (Du et al. 2019).
In summary, internet search engines are predominantly used by individual investors as their primary source of information. Due to the diversity in their search patterns, the method used by Carpenter and Whitelaw (2017) to measure investor attention solely based on stock codes is not applicable in China. Investor attention is quantified as the cumulative search indices for stock codes, stock abbreviations, and full stock names (Bae and Wang 2012).
Monthly investor attention for the t-th company is computed as follows:
I n a t t e n t i o n t = L n N u m b e r i n d e x t + N a m e i n d e x t + N a m e t
where I n a t t e n t i o n t represents the logarithm of investor attention for a particular stock in month t , Numberindex t denotes the stock code, N a m e i n d e x t refers to the stock abbreviation, and N a m e t signifies the search index for the full name of the stock.

4.2.3. Moderating Variable

De Franco et al. (2011a) proposed a pioneering measurement model for enterprise-level accounting information comparability, suggesting that accounting information within enterprises is influenced by the process through which accounting systems transform economic events into financial statements. Similarly, this study measures accounting information comparability at the enterprise level, drawing on the earnings-return model proposed by De Franco et al. (2011b), with a specific focus on measuring the extent of information divergence among different companies when faced with the same economic events (De Franco et al. 2015). As depicted in Equation (3), where f i ( ) represents the accounting system of firm i , E c o n o m i c   E v e n t s i stands for the economic event specific to firm i , and F i n a n c i a l   S t a t e m e n t s i embodies the result of mapping the economic event of firm i through the accounting system of this firm. For firms i and j , if given a set of economic events, similar financial information can be obtained, then the accounting systems of these two firms are comparable. If the accounting information of the two firms is comparable, there must be a similar mapping process f ( ) . This paper uses accounting earnings to measure accounting information, and individual stock return to measure the net effect of economic events on the firm (Kalantonis et al. 2020).
F i n a n c i a l   S t a t e m e n t s i = f i E c o n o m i c   E v e n t s i
We quantify the accounting information comparability in three steps, as detailed below.
(1) To compute the accounting information comparability of enterprise i during period t, we initially estimate its accounting system using the accounting earnings and stock returns of the preceding 16 quarters of enterprise i during period t . According to Equation (4), E A R N I N G S i , t represent the accounting earnings, equivalent to the ratio of quarterly net profit to the beginning-of-quarter market value of equity, while R E T U R N i , t denotes the stock return. Due to the asymmetric nature of firms’ confirmation bias towards different types of information, with a tendency to promptly recognize negative news, this paper draws on Campbell et al. (1993) to modify the De Franco et al. (2011b) model by introducing an additional dummy variable N E G and the cross-product term with stock returns R E T U R N N E G . If the quarterly stock return is negative, N E G takes 1; otherwise, it takes 0, while ε represents the residual term (Barber et al. 2022).
E A R N I N G S i , t = γ 0 i + γ 1 i R E T U R N i , t + γ 2 i N E G i , t + γ 3 i R E T U R N i , t × N E G i , t + ε i , t
(2) To examine the accounting information comparability, after conducting rolling regression, firms i and j obtain regression coefficients, denoted as γ 0 i ,   γ 1 i ,   γ 2 i ,   γ 3 i ,   γ 0 i ,   γ 1 i ,   γ 2 i ,   γ 3 i , representing their respective accounting systems during identical economic events. Consequently, individual stock returns (denoted as R E T U R N i , t ) are treated as identical for both firm i and j under the same economic circumstances. These values are then applied to Equations (5) and (6) to calculate the accounting earnings for both firm i and firm j . Model (6) reflects the situation where firm j experiences the economic event that firm i undergoes, and the accounting recognition is carried out according to firm j ’s accounting system. This model aids in assessing the similarity between the accounting systems of enterprises i and j . Models (5) and (6) are used to calculate the expected accounting earnings for the preceding 16 consecutive quarters prior to period t (Kim 2023).
E A R N I N G S i , i , t = γ 0 i + γ 1 i R E T U R N i , t + γ 2 i N E G i , t + γ 3 i R E T U R N i , t × N E G i , t
E A R N I N G S i , j , t = γ 0 j + γ 1 j R E T U R N i , t + γ 2 j N E G i , t + γ 3 j R E T U R N i , t × N E G i , t
(3) Finally, accounting information comparability is defined as the negative of the average difference over the preceding 16 periods in estimated expected earnings. In accordance with the Guidelines on Industry Classification of Listed Companies issued by the China Securities Regulatory Commission (CSRC), the target company is cross-referenced with all companies denoted as j within its industry. This process yields the comparability value denoted as a c c i , j , t , which is subsequently averaged to derive the annual comparability value a c c i , t for company i . When this indicator assumes a positive value, its magnitude directly correlates with the robustness of the accounting information comparability for the company i .
a c c i , j , t = 1 16 t 15 t   E A R N I N G S i , i , t E A R N I N G S i , j , t
Other variables are illustrated in Table 2.

4.3. Multiple Regression Models

To test Hypothesis 1, Model (8) was established as follows:
R e t u r n i , t = α + β 1 I n a t t e n t i o n i , t + i = 1 6 γ i C o n t r o l s i , t + ε i , t
where R e t u r n i , t denotes the return of stock i in month t, I n a t t e n t i o n i , t represents the logarithm of investor attention for stock i in month t, the coefficient β 1 captures the influence of investor attention on stock return, and C o n t r o l s i , t represents the individual outstanding market capitalization of stock i in month t (taking logarithm), as well as other control variables such as gearing and ROE, and other control variables. The parameter α represents the intercept term, while ε represents the residual term. If the regression results are significantly positive, it indicates that higher investor attention in the current period corresponds to increased stock returns, so we expect β 1 will exhibit a significantly positive relationship.
To test Hypothesis 2, Models (9) and (10) were established as follows:
R e t u r n i , t = α + β 1 I n a t t e n t i o n i , t 1 + i = 1 6 γ i C o n t r o l s i , t + ε i , t
R e t u r n i , t = α + β 2 L n a t t e n t i o n i , t 2 + i = 1 6 γ i C o n t r o l s i , t + ε i , t
where I n a t t e n t i o n i , t 1 and I n a t t e n t i o n i , t 2 refer to the logarithm of investor attention for stock i in month t 1 and month t 2 , respectively. If the regression results show that β 1 are β 2 are significantly negative, it indicates that the higher the lagged investor’s attention, the lower the stock return. Consequently, this study anticipates observing significantly negative values for β 1 and β 2 .
To test Hypothesis 3, Model (11) was established as follows:
R e t u r n i , t = α + β 1 I n a t t e n t i o n i , t + β 2 a c c i , t + β 3 I n a t t e n t i o n i , t × a c c i , t + i = 1 6 γ i C o n t r o l s i , t + ε i , t
To test Hypothesis 4, Models (12) and (13) were established as follows:
R e t u r n i , t = α + η 1 I n a t t e n t i o n i , t 1 + η 2 a c c i , t + η 3 I n a t t e n t i o n i , t 1 × a c c i , t + i = 1 6 γ i C o n t r o l s i , t + ε i , t
R e t u r n i , t = α + δ 1 I n a t t e n t i o n i , t 2 + δ 2 a c c i , t + δ 3 I n a t t e n t i o n i , t 2 × a c c i , t + i = 1 6 γ i C o n t r o l s i , t + ε i , t
where a c c i , t denotes the accounting information comparability for stock i in month t . The hypothesis posited is that enhanced accounting information comparability diminishes the consumption of investor attention and amplifies the influence of current investor attention on current stock returns. Consequently, prediction β 3 will exhibit a significantly positive effect. This paper hypothesizes that increased accounting information comparability reduces the consumption of investors’ attention, making information more comprehensible and less distorting. Increased accounting information comparability weakens the reversal phenomenon of lagged investor attention on stock returns. Furthermore, as the number of lags increases, the reversal effect diminishes, thus predicting that η 3 will exhibit a significantly positive impact, while δ 3 will be positive, but not as significant as at one lag.

5. Empirical Results and Discussion

This section is divided into two main subsections. Firstly, descriptive statistics, stationary tests, and correlation analyses are performed on the cleaned data in 
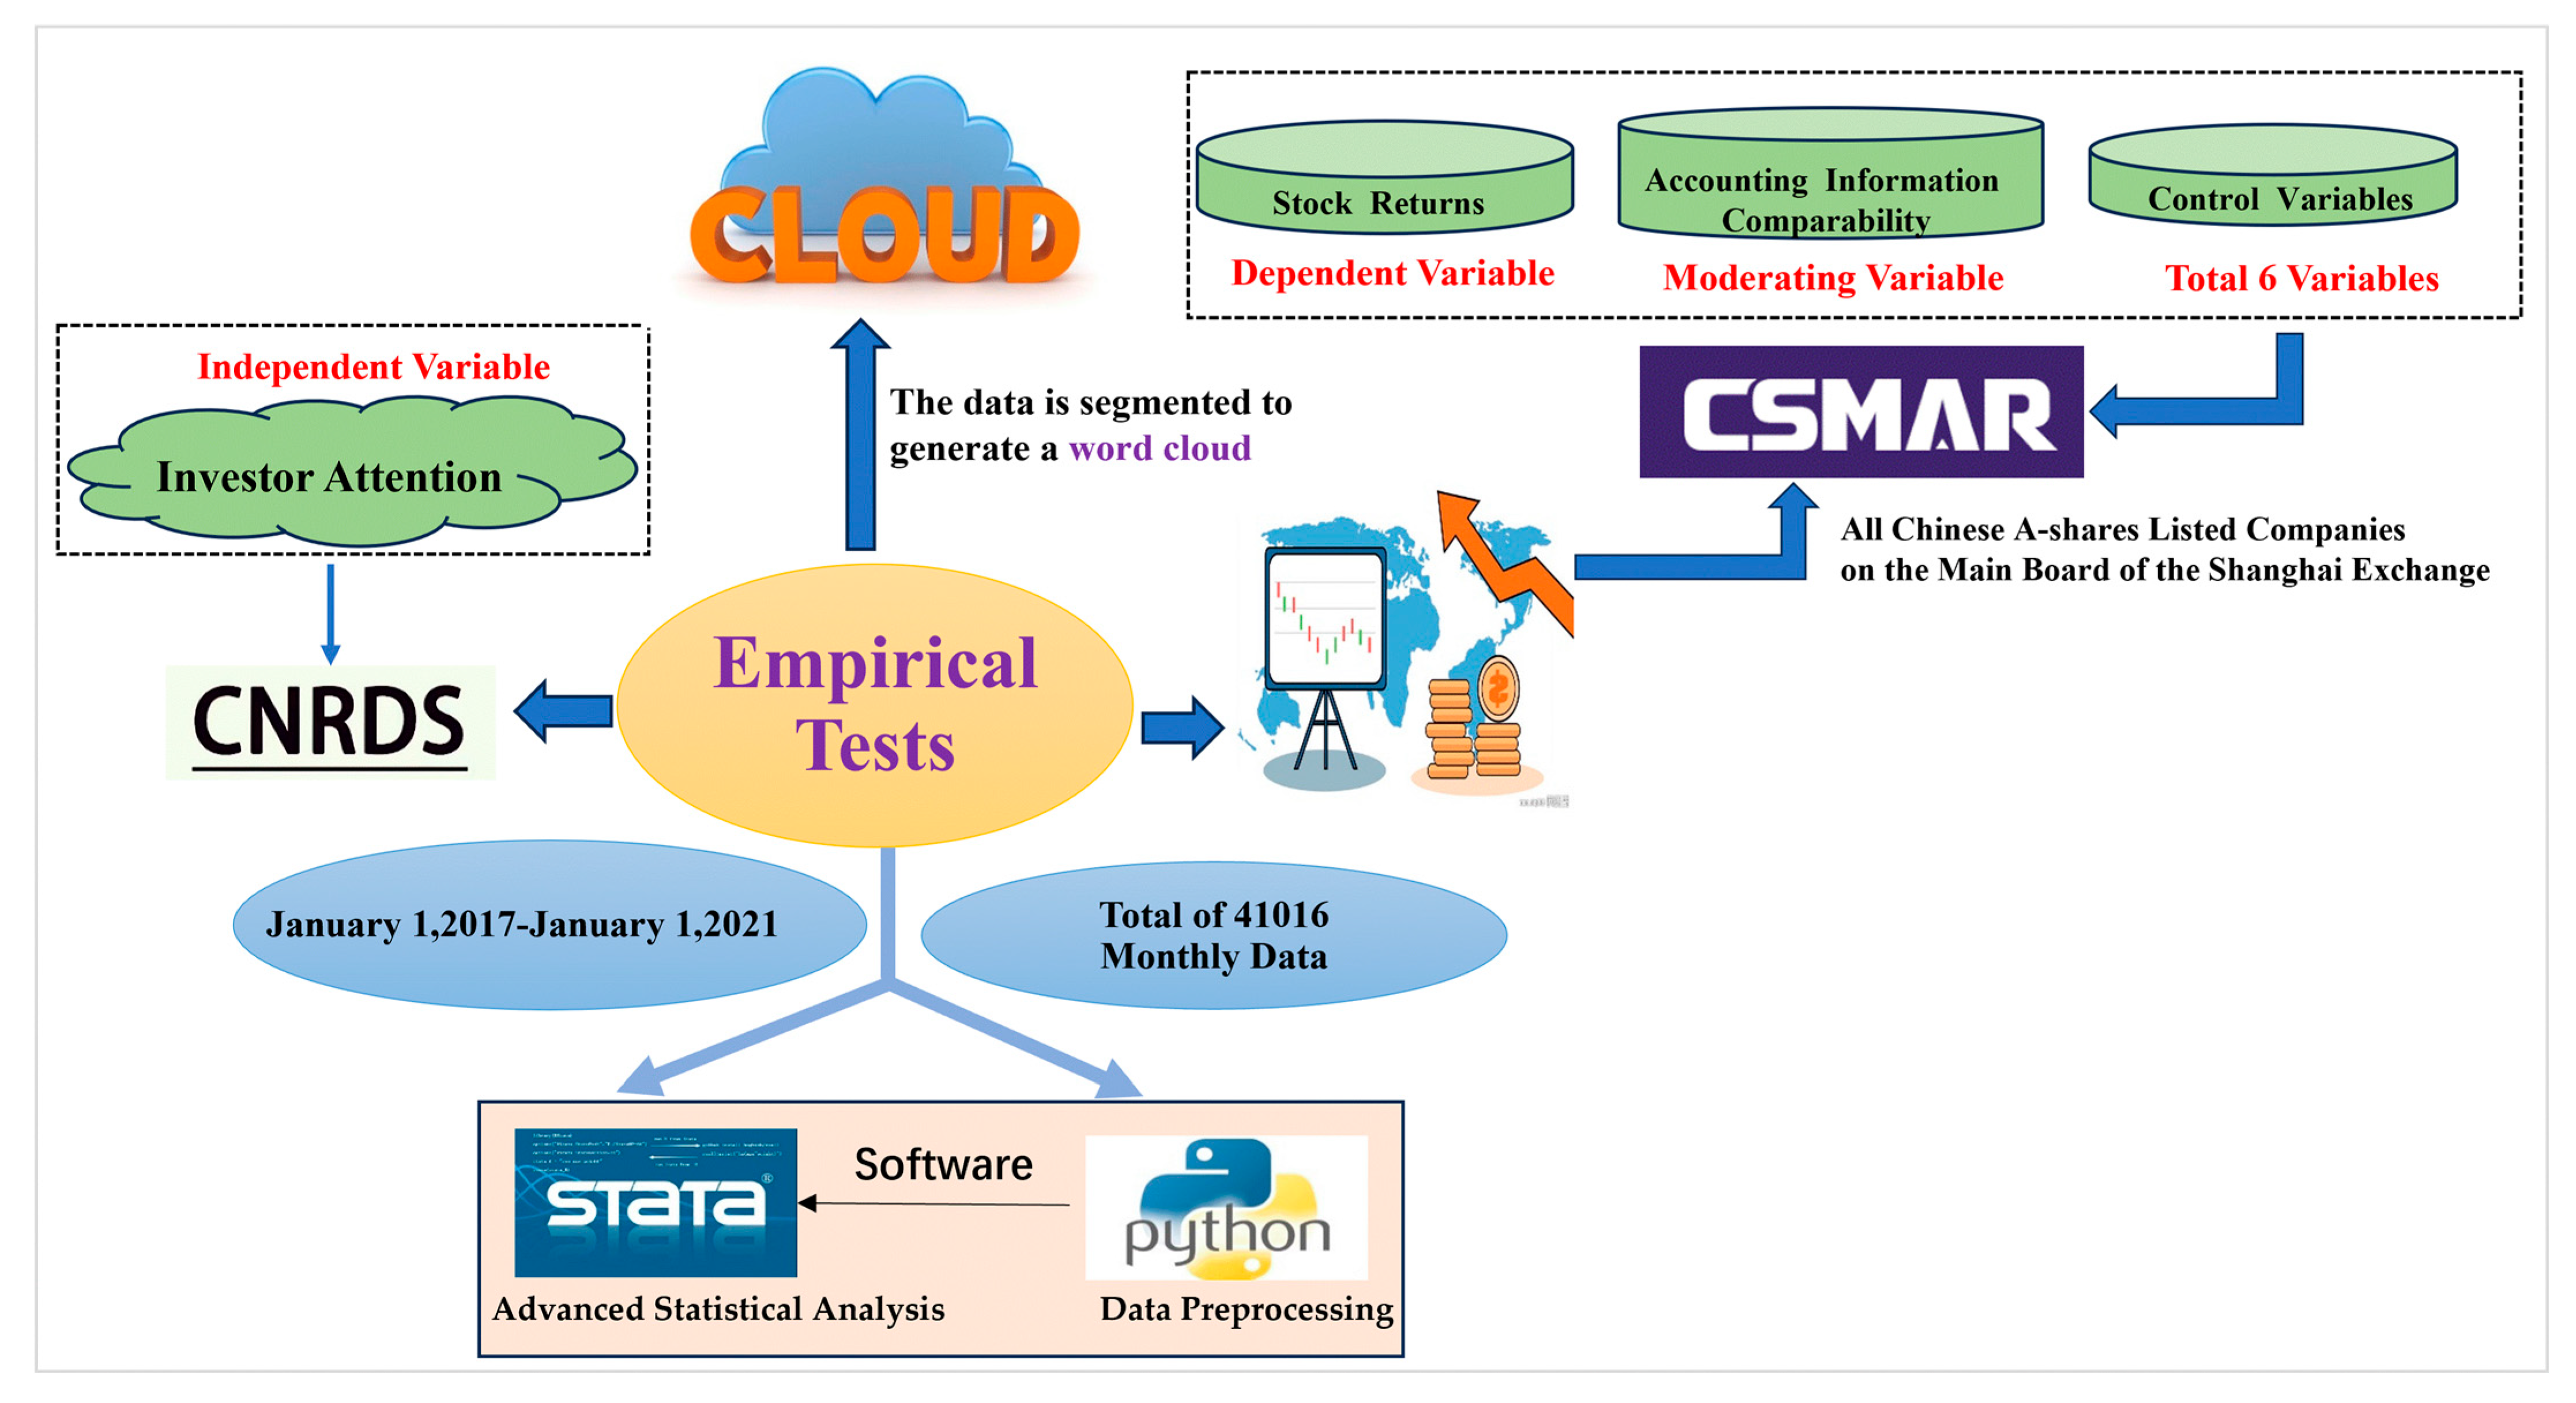
Section 4. Second, based on this, a fixed-effects regression model is applied to regress investor attention on monthly current stock returns. Additionally, we examine the moderating impact of accounting information comparability through both multiple regression analysis and robustness tests. Figure 3 visually presents the workflow of the empirical tests.

5.1. Descriptive Statistics

In this study, we conducted an analysis on a dataset that included 1021 companies selected from the period between 1 January 2017, and 1 January 2021, focusing on the Shanghai Stock Exchange (SSE) main board A-shares market as our research sample, resulting in a total of 41,016 valid data points. Table 3 presents the descriptive statistics for the entire dataset.

5.1.1. Dependent Variable of Monthly Stock Returns

As depicted in Table 3, the monthly stock return indicator exhibits a range from a minimum of −58% to a maximum of 249.6%, demonstrating a significant standard deviation. In addition, the mean value of the monthly stock return indicator is 1%, indicating that investors have the potential to realize positive returns in the stock market. However, these returns are relatively modest and do not match the scale of China’s economic development, leaving substantial room for further growth and development.

5.1.2. Independent Variable of Investor Attention

As shown in Table 3, the composite index of investor attention presents a range from a minimum value of 0 to a maximum value of 15.315, with a mean value of 10.101. This variation suggests that investor attention is not uniform across different stocks, suggesting the existence of a phenomenon commonly referred to as the “herding effect”. In this context, stocks with more visibility tend to garner more attention, often irrespective of their intrinsic value. This observation aligns with the prevailing dynamics of the Chinese stock market, characterized by a tendency to speculate on specific sectors, chase hot topics, and pursuit rising up and abandoned down.

5.1.3. Moderating Variable of Accounting Information Comparability

As illustrated in Table 3, the mean value of accounting information comparability of the sample companies is −0.015 and the median value is −0.013, which indicates that the sample is more evenly distributed and there is no significant left or right bias. Another point to note is that accounting information comparability is a positive indicator, with larger values indicating stronger comparability. Descriptively, the minimum value for accounting information comparability is −0.161, the maximum value is −0.002, and the standard deviation is 0.011. Considering the effect of the dimension, this result indicates the presence of variations in accounting information comparability between different sample companies.

5.2. Stationary Test

Our dataset consists of an extensive panel of data exhibiting time-series characteristics. The temporal nature of this dataset introduces the possibility of non-random sampling, thereby necessitating an initial stationarity test to guard against spurious regression. We employ the Fisher panel unit root test to examine the stationarity of all variables.
In columns (2) and (3) of Table 4, notably high Chi-squared statistics and a p-value of 0 were observed for each variable, indicating the rejection of the unit root hypothesis at a 1% significance level. These results confirm the stationarity of all variables, including “Return”, “Inattention”, “Mc”, “Lev”, “Roe”, “Cashflow”, “BM”, and “Growth”. This confirmation enhances the dataset’s reliability, establishing a robust foundation for subsequent empirical analyses.

5.3. Correlation Analysis

Before conducting regression analysis, this study undertakes a correlation analysis for two primary objectives: 1. to establish an initial understanding of the relationship between the independent variables and the dependent variables without considering other variables; and 2. to test the presence of multicollinearity.
The results are presented in Table 5 and can be summarized as follows. Column (1) indicates that the regression coefficient between the current investor attention and current stock returns was 0.073 at the 1% confidence level. Conversely, investor attention with a one-period lag and a two-period lag shows a significant negative correlation with stock returns in the current period, with a coefficient of −0.049, also passing the 1% confidence level test. These results align with the hypothesis of this paper. Column (2) shows the highest coefficient observed is 0.577. and all the absolute values of the Pearson correlation coefficients are below 0.8, indicating that the model does not exhibit significant substantial multicollinearity among the variables.
However, the Pearson correlation coefficient between the control variable, monthly circulating market value of individual stocks (MC), and investor attention surpasses 0.5 in magnitude. To improve the reliability of the findings, a subsequent variance inflation factor (VIF) test is conducted. In this test, if VIF exceeds 10, it indicates a severe collinearity issue, while VIF exceeding 5 indicates a moderate collinearity problem (Cheng et al. 2020). The results of this test are displayed in Table 6. Column 2 indicates that the maximum VIF value of the variable is 1.66 and the mean value is 1.34. All the VIF values are less than 5. Therefore, the independent variable does not cause multicollinearity problems.

5.4. Multiple Linear Regression Analysis

Based on the previous correlation analysis, we have gained a preliminary understanding of the relationships among the main variables. Our hypotheses have received initial validation. Building upon this foundation, this research employs a fixed-effects model to conduct regression analysis of the relationships between the variables. This choice is made for the following reasons: in contrast to the random effects model, the fixed-effects model consistently yields stable estimates; and the variables used do not include any time-invariant variables, thereby ensuring that the fixed-effects model does not omit any critical variables.

5.4.1. Baseline Regression

  • Current Investor Attention and Current Stock Returns
First, to test the effect of current investor attention on stock returns as hypothesized in Hypothesis 1, we conducted a regression analysis using Model 8 on the sample data. The regression results are presented in Table 7 (1). The below table shows that after adding control variables and controlling for industry and monthly fixed effects, the coefficient of Inattention β 1 is calculated to be 0.041, exhibiting a positive sign and passing the significance test at the 1% level. This result proves that stocks with greater investor attention during the current period exhibit higher monthly stock returns, thereby validating Hypothesis 1. In other words, increased investor attention to a stock lowers the search costs for investors, reduces their cognitive demands, and makes the stock more attractive for investment. This results in a positive pressure to buy, consequently leading to higher stock returns.
2.
Lagged Investor Attention and Current Stock Returns
Through the above analysis, we find that greater investor attention correlates with increased stock returns, However, whether this attention-driven buying phenomenon is enduring necessitates further investigation. To test the effect of lagged investor attention on current period stock returns in Hypothesis 2, we conducted a regression analysis using models 9 and 10 on the sample data. The regression results are presented in Table 7 (2) and (3).
After adding the control variables and controlling for industry and monthly fixed effects, column (2) shows that the coefficient β 1 for Inattention (−1) is −0.083, while column (3) presents that the coefficient β 2 for Inattention (−2) is −0.069, both of which passes the significance test at the 1% level. This indicates that stocks receiving significant investor attention experience a subsequent decrease in stock returns, Furthermore, this reversal effect persists for at least two periods. Additionally, the absolute value of the Inattention (−1) coefficient is 0.083, and the absolute value of the Inattention (−2) coefficient is 0.069, suggesting that as the number of periods increases, the strength of the reversal effect diminishes.
In summary, Hypothesis 2 is validated, indicating an inverse relationship between lagged investor attention and current stock returns. The more attention a stock receives in the current period, the greater the likelihood of a return reversal in the subsequent period.

5.4.2. Moderating Effect Regression of Accounting Information Comparability

The above analysis demonstrates that the increase in stock returns due to increased investor attention is not sustainable, Investor attention lagged by one to two periods is inversely related to stock returns. The reason for this phenomenon is that stocks that receive investor attention in the current period can reduce investors’ information search costs and lessen the consumption of investors’ attention, consequently triggering investors’ buying behavior. Such increases are driven by factors unrelated to fundamentals, making them unsustainable, and ultimately leading to stock price reversals caused by overreactions resulting from distorted information received by investors.
Moreover, increased accounting information comparability enhances greater accessibility and comprehensibility of information. As a result, it is less susceptible to distortion and imposes a reduced burden on investors’ attention. Then how does accounting information comparability serve as a moderating factor? To explore this question, this study brings the sample data into models 11, 12, and 13 for regression analysis. The specific regression results are shown in Table 8.
From Table 8 (1), the coefficient β3 of the cross-product term between Inattentioni,t, and acci,t is 0.283, which passes the significance test at the 1% level, even after accounting for control variables and industry and monthly fixed effects. This result suggests that higher accounting information comparability amplifies the positive influence of current investor attention on current stock returns. This finding is also consistent with common sense. People naturally direct greater attention towards information that is straightforward, easily comprehensible, and readily comparable, as opposed to complex data.
Additionally, it is noteworthy that the regression results indicate a positive coefficient for accounting information comparability, which remains significant at the 1% level. This signifies that the format of accounting information, characterized by its ease of comprehension and comparability, can influence stock returns independently of its content. This finding underscores the potential for regulatory authorities to craft policies and incentives encouraging companies to simplify their financial statements. Hypothesis 3 is hereby confirmed.
As shown in Table 8 (2), after adding control variables and controlling for industry and monthly fixed effects, the coefficient η3 of the cross-product term between Inattentioni,t−1, and acci,t is 0.249, which passes the significance test at the 1% level. Furthermore, in column (3) of Table 8, the coefficient δ 3 of the cross-product term between Inattentioni,t−2, and acci,t is 0.182, which passes the significance test at the 10% level. In other words, the higher the comparability of accounting information, the less effort is required to comprehend the information, making it easier for investors to understand the information itself without being influenced by distorted details. Consequently, the overreactions caused by distorted details are suppressed.
The coefficient δ 3 of the cross-product term between Inattentioni,t−2, and acci,t is positive, but insignificant. This suggests that the inverse effect of lagged investor attention on stock returns weakens over time, and the moderating effect of accounting information comparability becomes less important. This observation serves as a reminder that policymakers should not solely focus on the quality of annual reports for listed companies, as the positive moderating effect of accounting information comparability is time-sensitive. In practice, semiannual, quarterly, and monthly reports are essential sources of information for investors to understand a company’s operation and stock valuation and deserve equal attention. Hypothesis 4 is substantiated.

5.5. Robustness Tests

To ensure the robustness of the research conclusions, the following robustness tests are carried out.

5.5.1. Alternative Dependent Variables

Recognizing that the selection of variable measurement methods can potentially influence the final regression results, this study employs a requantified measurement of the dependent variable, accounting for the reinvestment of cash dividends, denoted as “returns 1”. The specific calculation method is as follows:
r e t u r n 1 i , t = p i , t p i , t 1 1
p i , t represents the comparable price of the daily closing price of stock i on the last trading day of month t , considering the reinvestment of cash dividends.
p i , t 1 signifies the comparable cost of the daily closing price of stock i on the last trading day of month t 1 , also considering reinvestment of cash dividends.
The regression results are presented in Table 9. A subsequent regression analysis was conducted using the new measure of stock returns, which resulted in minimal changes in the coefficients among the main variables. This reaffirms the robustness of the regression results.
  • Baseline Regression of Investor Attention and Current Stock Returns
Column (1) of Table 9 indicates a significant positive relationship at the 1% level between current investor attention and stock returns, with a coefficient of 0.046, thus validating hypothesis 1. In addition, from Table 9 (2) and (3), the regression results also indicate that lagged one-period investor attention and lagged two-period investor attention continue to exhibit a significant negative correlation with current stock returns at the 1% level, with coefficients of −0.079 and −0.066, respectively, thereby supporting Hypothesis 2.
2.
Moderating Effect Regression of Accounting Information Comparability
From Table 9 (1), the regression result for the cross-product term involving current investor attention and accounting information comparability with stock returns is 0.283, which remains significantly positive at the 1% level, indicating that high accounting information comparability reinforces the positive association between current investor attention and stock returns, thereby validating Hypothesis 3.
According to column (2) in Table 9, lagged one-period investor attention and the cross-product term of accounting information comparability regressed on current stock returns yield a coefficient of 0.249, which remains significantly positively correlated at the 1% level. Furthermore, column (3) in Table 9 shows that the cross-product term involving lagged two-period investor attention and accounting information comparability produces a regression coefficient of 0.182, showing a significant positive correlation at the 10% confidence level. This proves that high accounting information comparability mitigates the negative correlation between lagged investor attention and current stock returns, thereby confirming Hypothesis 4.

5.5.2. Instrumental Variable (IV) Method

Potential issues must be addressed, including the possibility of independent variables and core independent variables acting as causal or omitted variables (Frankel et al. 2022). Firstly, we indicate that investors’ attention can significantly influence stock returns. However, it is essential to consider the reciprocal effect, where high stock returns can attract investors’ attention, potentially leading to a two-way causality problem. Secondly, the realm of factors impacting stock returns is extensive, and the selected control variables do not encompass them all, potentially resulting in omitted variables. To address these concerns and enhance the robustness of the findings, we employ the first-order difference of the core independent variables as an instrumental variable to test the baseline regression outcomes.
Since the number of instrumental variables equals the number of endogenous independent variables, there is no problem of over-identification. The specific test results are shown in Table 10. First, in the underidentification test, the p-values of the core independent variables Inattentioni,t, Inattentioni,t−1, Inattentioni,t−2 are all 0, which is less than the critical value of 0.05, leading to the firm rejection of the original hypothesis. Second, in the weak identification test, Wald F values for Inattentioni,t, Inattentioni,t−1, and Inattentioni,t−2 are 6846.204, 6260.734, and 6580.861, respectively. These values significantly exceed the 10% threshold value of 16.38, indicating the absence of a weak instrumental variable problem.
The preceding discussion demonstrates the reasonableness of the instrumental variables used in this paper. Based on these instruments, the regression analysis for the underlying hypotheses is conducted with Inattention IV as the core independent variable, which is brought into models 8, 9, and 10. The specific regression results are shown in Table 11.
From Table 11 (1), the coefficient between Inattention IV and stock return is 0.407, signifying a positive relationship and passing the significance test at the 1% level, thereby validating Hypothesis 1. Moving to Table 11 (2), the coefficient between Inattention (−1) IV and stock return is −0.051, indicating a negative association and passing the significance test at the 1% level, confirming the validity of Hypothesis 2. Furthermore, Table 11 (3) displays a coefficient of −0.047 for the connection between Inattention (−2) IV and stock return, reflecting a negative relationship and passing the significance test at the 1% level, also validating Hypothesis 2. These findings align with the baseline regression results, confirming their robustness even after employing the instrumental variables method to mitigate endogeneity problems resulting from factors such as reciprocal causality or omitted variables.

6. Conclusions

In contrast to most previous studies that indirectly quantify investor attention indicators, we directly quantify investor attention using an internet search index. This approach allows for a more direct exploration of how fluctuations in investor attention influence stock returns and how the relationship evolves over time. Additionally, we quantify accounting information comparability using a rolling regression of individual stock returns and accounting earnings for company i and j to quantify accounting information comparability and investigate its moderating role.
Drawing on theories related to information asymmetry, signal transmission, herd behavior, and the limited attention theory, this study utilizes a comprehensive sample of all A-share stocks listed on the main board of the Shanghai Stock Exchange during the period from 2017 to 2021. The dataset comprises 41,016 valid data points, which are empirically analyzed to assess the influence of investor attention on stock returns, as well as the moderating effect of accounting information comparability. This study shows several key findings. First of all, current investor attention exhibits a positive correlation with current stock returns. In other words, stocks attracting higher investor attention in the current period tend to yield higher returns. This is attributed to the limited attention span of investors, resulting in lower search costs for stocks that capture investor attention, ultimately leading to increased stock returns. Lagged investor attention is negatively related to current stock returns. In other words, the higher the lagged investor’s attention, the greater the reversal in current-period returns for the stock. This is because the information is distorted in the process of dissemination, and investors are influenced by the distorted information to overreact to their investment behavior later on. This momentum buying behavior caused by the distorted information leads to a stock premium that lacks fundamental support and ultimately leads to a stock price reversal later on. Concurrently, high accounting information comparability strengthens the positive correlation between current investor attention and current stock returns while weakening the negative correlation between lagged investor attention and current stock returns. Highly comparable accounting information can effectively increase the informational value embedded in stock prices, consequently diminishing the cognitive costs associated with information comprehension for investors. When the target company exhibits a high degree of comparability, greater accessibility to information tends to attract more investor attention. Finally, highly comparable accounting information can effectively reduce the irrational bias caused by investors’ comprehension difficulties, thereby reducing the irrational fluctuations in stock prices resulting from investors mistaking distorted information for reliable insights.

Author Contributions

Conceptualization, L.Z., N.N. and A.Y.D.; methodology, L.Z.; software, L.Z. and B.Z.; validation, L.Z., A.Y.D.; formal analysis, L.Z.; investigation, L.Z.; resources, L.Z.; data curation, L.Z.; original draft preparation, L.Z. and A.Y.D.; review and editing, L.Z., N.N., A.Y.D.; visualization, L.Z. and A.Y.D.; supervision, N.N. and A.Y.D.; funding acquisition, L.Z., N.N. and A.Y.D. All authors have read and agreed to the published version of the manuscript.

Funding

This research received no external funding.

Institutional Review Board Statement

Not applicable.

Informed Consent Statement

Informed consent was obtained from all the subjects involved in this study.

Data Availability Statement

We used private sources of data. Consistent with the contracts entered into by our academic institutions, we are not licensed to distribute such information. We refer readers to the sources cited and publicly available information.

Acknowledgments

We gratefully acknowledge the support of the Graduate School and International College of Digital Innovation at Chiang Mai University.

Conflicts of Interest

The authors declare no conflicts of interest.

References

  1. Akarsu, Sergen, and Ömür Süer. 2022. How investor attention affects stock returns? Some international evidence. Borsa Istanbul Review 22: 616–26. [Google Scholar] [CrossRef]
  2. Akerlof, George A. 1970. The market for “lemons”: Quality uncertainty and the market mechanism. The Quarterly Journal of Economics 84: 488–500. [Google Scholar] [CrossRef]
  3. Ashraf, Badar Nadeem. 2020. Economic Impact of Government Interventions during the COVID-19 Pandemic: International Evidence from Financial Markets. Journal of Behavioral and Experimental Finance 27: 100371. [Google Scholar] [CrossRef]
  4. Bae, Kee-Hong, and Wei Wang. 2012. What’s in a “China” Name? A Test of Investor Attention Hypothesis. Financial Management 41: 429–55. [Google Scholar] [CrossRef]
  5. Baker, Scott R., Nicholas Bloom, Steven J. Davis, Kyle Kost, Marco Sammon, and Tasaneeya Viratyosin. 2020. The Unprecedented Stock Market Reaction to COVID-19. The Review of Asset Pricing Studies 10: 742–58. [Google Scholar] [CrossRef]
  6. Barber, Brad M., and Terrance Odean. 2008. All That Glitters: The Effect of Attention and News on the Buying Behavior of Individual and Institutional Investors. The Review of Financial Studies 21: 785–818. [Google Scholar] [CrossRef]
  7. Barber, Brad M., Xing Huang, Terrance Odean, and Christopher Schwarz. 2022. Attention-Induced Trading and Returns: Evidence from Robinhood Users. The Journal of Finance 77: 3141–90. [Google Scholar] [CrossRef]
  8. Bikhchandani, Sushil, David Hirshleifer, and Ivo Welch. 1992. A theory of fads, fashion, custom, and cultural change as informational cascades. Journal of Political Economy 100: 992–1026. [Google Scholar] [CrossRef]
  9. Campbell, John Y., Sanford J. Grossman, and Jiang Wang. 1993. Trading Volume and Serial Correlation in Stock Returns. The Quarterly Journal of Economics 108: 905–39. [Google Scholar] [CrossRef]
  10. Carpenter, Jennifer N., and Robert F. Whitelaw. 2017. The development of China’s stock market and stakes for the global economy. Annual Review of Financial Economics 9: 233–57. [Google Scholar] [CrossRef]
  11. Chen, Han, Chunyu Meng, and Qilin Cao. 2022. Measurement and Influencing Factors of Low Carbon Urban Land Use Efficiency—Based on Non-Radial Directional Distance Function. Land 11: 1052. [Google Scholar] [CrossRef]
  12. Chen, Ting, Sarah Gentry, Dechao Qiu, Yan Deng, Caitlin Notley, Guangwen Cheng, and Fujian Song. 2020. Online information on electronic cigarettes: Comparative study of relevant websites from Baidu and Google search engines. Journal of Medical Internet Research 22: e14725. [Google Scholar] [CrossRef]
  13. Cheng, Jiehong, Jun Sun, Kunshan Yao, Min Xu, and Yan Cao. 2022. A variable selection method based on mutual information and variance inflation factor. Spectrochimica Acta Part A: Molecular and Biomolecular Spectroscopy 268: 120652. [Google Scholar] [CrossRef]
  14. Cheng, Yuhan, Dongqi Cui, and Zixuan Li. 2020. COVID-19 Virus Pneumonia’s Economic Effect in Different Industries: A Case Study in China. Journal of Applied Finance and Banking 10: 129–47. [Google Scholar]
  15. Choi, Heeick, and SangHyun Suh. 2019. The Effect of Financial Reporting Quality on CEO Compensation Structure: Evidence from Accounting Comparability. Journal of Accounting and Public Policy 38: 106681. [Google Scholar] [CrossRef]
  16. Choi, Jaewoong, Janghyeok Yoon, Jaemin Chung, Byoung-Youl Coh, and Jae-Min Lee. 2020. Social Media Analytics and Business Intelligence Research: A Systematic Review. Information Processing & Management 57: 102279. [Google Scholar] [CrossRef]
  17. Daniel, Kent, David Hirshleifer, and Siew Hong Teoh. 2002. Investor Psychology in Capital Markets: Evidence and Policy Implications. Journal of Monetary Economics 49: 139–209. [Google Scholar] [CrossRef]
  18. De Franco, Gus, M. H. Franco Wong, and Yibin Zhou. 2011a. Accounting Adjustments and the Valuation of Financial Statement Note Information in 10-K Filings. The Accounting Review 86: 1577–604. [Google Scholar] [CrossRef]
  19. De Franco, Gus, Ole-Kristian Hope, and Stephannie Larocque. 2015. Analysts’ Choice of Peer Companies. Review of Accounting Studies 20: 82–109. [Google Scholar] [CrossRef]
  20. De Franco, Gus, Sagar P. Kothari, and Rodrigo S. Verdi. 2011b. The Benefits of Financial Statement Comparability. Journal of Accounting Research 49: 895–931. [Google Scholar] [CrossRef]
  21. Dorr, Cian, Jacob M. Nebel, and Jake Zuehl. 2021. Consequences of Comparability. Philosophical Perspectives 35: 70–98. [Google Scholar] [CrossRef]
  22. Du, Yong, Ziyi Li, Jun Du, Ning Li, and Bo Yan. 2019. Public Environmental Appeal and Innovation of Heavy-Polluting Enterprises. Journal of Cleaner Production 222: 1009–22. [Google Scholar] [CrossRef]
  23. Erdem, Orhan. 2020. Freedom and Stock Market Performance during COVID-19 Outbreak. Finance Research Letters 36: 101671. [Google Scholar] [CrossRef] [PubMed]
  24. Frankel, Richard, Jared Jennings, and Joshua Lee. 2022. Disclosure Sentiment: Machine Learning vs. Dictionary Methods. Management Science 68: 5514–32. [Google Scholar] [CrossRef]
  25. Hand, John R. M. 1990. A Test of the Extended Functional Fixation Hypothesis. The Accounting Review 65: 740–63. [Google Scholar]
  26. He, Pinglin, Yulong Sun, Ying Zhang, and Tao Li. 2020. COVID-19’s Impact on Stock Prices Across Different Sectors—An Event Study Based on the Chinese Stock Market. Emerging Markets Finance and Trade 56: 2198–212. [Google Scholar] [CrossRef]
  27. Hirshleifer, David, and Siew Hong Teoh. 2003. Limited Attention, Information Disclosure, and Financial Reporting. Journal of Accounting and Economics 36: 337–86. [Google Scholar] [CrossRef]
  28. Hsu, Ching-Chi, and Miao-Ling Chen. 2019. Asymmetric effect of advertising on the Chinese stock market. Applied Economics Letters 26: 157–62. [Google Scholar] [CrossRef]
  29. Jiang, Cuiqing, Yao Liu, Yong Ding, Kun Liang, and Rui Duan. 2017. Capturing Helpful Reviews from Social Media for Product Quality Improvement: A Multi-Class Classification Approach. International Journal of Production Research 55: 3528–41. [Google Scholar] [CrossRef]
  30. Kahneman, Daniel. 1973. Attention and Effort. Prentice-Hall Series in Experimental Psychology; Englewood Cliffs: Prentice-Hall. ISBN 978-0-13-050518-7. [Google Scholar]
  31. Kalantonis, Petros, Sotiria Schoina, Spyros Missiakoulis, and Constantin Zopounidis. 2020. The Impact of the Disclosed R & D Expenditure on the Value Relevance of the Accounting Information: Evidence from Greek Listed Firms. Mathematics 8: 730. [Google Scholar] [CrossRef]
  32. Karolyi, G. Andrew, Dawoon Kim, and Rose Liao. 2020. The Theory and Practice of Investor Relations: A Global Perspective. Management Science 66: 4746–71. [Google Scholar] [CrossRef]
  33. Kim, Karam, Doojin Ryu, and Heejin Yang. 2021a. Information uncertainty, investor sentiment, and analyst reports. International Review of Financial Analysis 77: 101835. [Google Scholar] [CrossRef]
  34. Kim, Karam, Doojin Ryu, and Jinyoung Yu. 2021b. Do sentiment trades explain investor overconfidence around analyst recommendation revisions? Research in International Business and Finance 56: 101376. [Google Scholar] [CrossRef]
  35. Kim, Yong-Shik. 2023. The Association between Voluntary Carbon Disclosure and Accounting Comparability: Examining the Moderating Effect of Korean Business Groups. Sustainability 15: 4830. [Google Scholar] [CrossRef]
  36. Kong, Minseok, and Jungmin So. 2023. Empirical Analysis of Automated Stock Trading Using Deep Reinforcement Learning. Applied Sciences 13: 633. [Google Scholar] [CrossRef]
  37. Kyle, Albert S. 1985. Continuous auctions and insider trading. Econometrica 53: 1315–36. [Google Scholar] [CrossRef]
  38. Lambert, Richard A., Christian Leuz, and Robert E. Verrecchia. 2011. Information asymmetry, information precision, and the cost of capital. Review of Finance 16: 1–29. [Google Scholar] [CrossRef]
  39. Lang, Mark, Karl V. Lins, and Mark Maffett. 2019. Transparency, liquidity, and valuation: International evidence on when transparency matters most. Journal of Accounting Research 57: 297–348. [Google Scholar] [CrossRef]
  40. Lee, Chien-Chiang, and Mei-Ping Chen. 2022. The Impact of COVID-19 on the Travel and Leisure Industry Returns: Some International Evidence. Tourism Economics 28: 451–72. [Google Scholar] [CrossRef]
  41. Li, Hui, and Dongdong Wu. 2024. Online investor attention and firm restructuring performance: Insights from an event-based DEA-Tobit model. Omega 122: 102967. [Google Scholar] [CrossRef]
  42. Li, Lu. 2022. Data News Dissemination Strategy for Decision Making Using New Media Platform. Soft Computing 26: 10677–85. [Google Scholar] [CrossRef]
  43. Li, Nian, Chunling Li, Runsen Yuan, Muhammad Asif Khan, Xiaoran Sun, and Nosherwan Khaliq. 2021. Investor attention and corporate innovation performance: Evidence from web search volume index of Chinese listed companies. Mathematics 9: 930. [Google Scholar] [CrossRef]
  44. Li, Qing, Yan Chen, Jun Wang, Yuanzhu Chen, and Hsinchun Chen. 2018. Web Media and Stock Markets: A Survey and Future Directions from a Big Data Perspective. IEEE Transactions on Knowledge and Data Engineering 30: 381–99. [Google Scholar] [CrossRef]
  45. Liang, Xin, Lizi Luo, Shiying Hu, and Yuke Li. 2022. Mapping the Knowledge Frontiers and Evolution of Decision Making Based on Agent-Based Modeling. Knowledge-Based Systems 250: 108982. [Google Scholar] [CrossRef]
  46. Luo, Lizi, Xin Liang, Chao Fang, Zezhou Wu, Xia Wang, and Yingjie Wang. 2020. How to Promote Prefabricated Building Projects through Internet of Things? A Game Theory-Based Analysis. Journal of Cleaner Production 276: 124325. [Google Scholar] [CrossRef]
  47. Mullainathan, Sendhil, and Richard Thaler. 2000. Behavioral Economics. NBER Reporter 2012. Cambridge: National Bureau of Economic Research, vol. 2, pp. 22–27. [Google Scholar] [CrossRef]
  48. Olayinka, Aminu Abdulrahim. 2022. Financial Statement Analysis as a Tool for Investment Decisions and Assessment of Companies’ Performance. International Journal of Financial, Accounting, and Management 4: 49–66. [Google Scholar] [CrossRef]
  49. Rakshit, Bijoy, and Yadawananda Neog. 2022. Effects of the COVID-19 Pandemic on Stock Market Returns and Volatilities: Evidence from Selected Emerging Economies. Studies in Economics and Finance 39: 549–71. [Google Scholar] [CrossRef]
  50. Salisu, Afees A., Ibrahim D. Raheem, and Godstime O. Eigbiremolen. 2022. The Behaviour of U.S. Stocks to Financial and Health Risks. International Journal of Finance & Economics 27: 4607–18. [Google Scholar] [CrossRef]
  51. Seok, Sang Ik, Hoon Cho, and Doojin Ryu. 2021. Stock Market’s responses to intraday investor sentiment. The North American Journal of Economics and Finance 58: 101516. [Google Scholar] [CrossRef]
  52. Shahid, Ahmad Usman, Chris Patel, and Peipei Pan. 2022. Corporate Social Responsibility, Intrinsic Religiosity, and Investment Decisions. Journal of Behavioral and Experimental Finance 34: 100650. [Google Scholar] [CrossRef]
  53. Shen, Dehua, Yongjie Zhang, Xiong Xiong, and Wei Zhang. 2017. Baidu index and predictability of Chinese stock returns. Financial Innovation 3: 1–8. [Google Scholar] [CrossRef]
  54. Simon, Herbert A. 1955. A Behavioral model of rational choice. The Quarterly Journal of Economics 69: 99. [Google Scholar] [CrossRef]
  55. Spence, Michael. 1973. Job market signaling. The Quarterly Journal of Economics 87: 355–74. [Google Scholar] [CrossRef]
  56. Srijiranon, Krittakom, Yoskorn Lertratanakham, and Tanatorn Tanantong. 2022. A Hybrid Framework Using PCA, EMD and LSTM Methods for Stock Market Price Prediction with Sentiment Analysis. Applied Sciences 12: 10823. [Google Scholar] [CrossRef]
  57. Sun, Yuan, Xuan Liu, Guangyue Chen, Yunhong Hao, and Zuopeng (Justin) Zhang. 2020. How Mood Affects the Stock Market: Empirical Evidence from Microblogs. Information & Management 57: 103181. [Google Scholar] [CrossRef]
  58. Sundar, Harshavardhan, Ming Sun, and Chao Wang. 2021. Event Specific Attention for Polyphonic Sound Event Detection. Paper presented at Interspeech 2021, Brno, Czechia, August 30–September 3. [Google Scholar]
  59. Thakkar, Ankit, and Kinjal Chaudhari. 2021. A Comprehensive Survey on Deep Neural Networks for Stock Market: The Need, Challenges, and Future Directions. Expert Systems with Applications 177: 114800. [Google Scholar] [CrossRef]
  60. Tumasjan, Andranik. 2023. The Many Faces of Social Media in Business and Economics Research: Taking Stock of the Literature and Looking into the Future. Journal of Economic Surveys 6: 1–38. [Google Scholar] [CrossRef]
  61. Vishnu Maniy, R. V., S. Rishi Priyan, S. Tharun Selvan, Padwalkar Anisha Sadanand, S. Vinoth, and Gopalakrishnan. 2023. The impact of social media on investment decisions: An empirical analysis of user behavior on investment platforms. International Research Journal of Modernization in Engineering Technology and Science 5: 3992–4000. [Google Scholar]
  62. Weetman, Pauline, Ioannis Tsalavoutas, and Paul Gordon. 2020. International Corporate Reporting: Global and Diverse. London: Routledge. ISBN 978-0-429-77461-4. [Google Scholar]
  63. Xu, Yongxin, Yuhao Xuan, and Gaoping Zheng. 2021. Internet Searching and Stock Price Crash Risk: Evidence from a Quasi-Natural Experiment. Journal of Financial Economics 141: 255–75. [Google Scholar] [CrossRef]
  64. Yang, Dan, Tingyu Ma, Yuetang Wang, and Guojun Wang. 2021. Does investor attention affect stock trading and returns? Evidence from publicly listed firms in China. Journal of Behavioral Finance 22: 368–81. [Google Scholar] [CrossRef]
  65. Yang, Heejin, Doojin Ryu, and Doowon Ryu. 2017. Investor sentiment, asset returns and firm characteristics: Evidence from the Korean stock market. Investment Analysts Journal 46: 132–47. [Google Scholar] [CrossRef]
  66. Yang, Kaiyuan, Xiaoyan Huo, Zhaoyu Sun, Peigong Li, Stavros Sindakis, and Saloome Showkat. 2023. Investigating The Role of Accounting Information Comparability in Mitigating Stock Price Crash Risk: Evidence from China’s Knowledge-Based Economy. Journal of the Knowledge Economy 9: 1–35. [Google Scholar] [CrossRef]
  67. Zhang, Bing, and Yudong Wang. 2015. Limited attention of individual investors and stock performance: Evidence from the ChiNext market. Economic Modelling 50: 94–104. [Google Scholar] [CrossRef]
  68. Zhang, Binru, Yulian Pu, Yuanyuan Wang, and Jueyou Li. 2019. Forecasting Hotel Accommodation Demand Based on LSTM Model Incorporating Internet Search Index. Sustainability 11: 4708. [Google Scholar] [CrossRef]
  69. Zhang, Wei, Dehua Shen, Yongjie Zhang, and Xiong Xiong. 2013. Open source information, investor attention, and asset pricing. Economic Modelling 33: 613–19. [Google Scholar] [CrossRef]
Figure 1. Hypothesis framework.
Ijfs 12 00018 g001
Figure 2. Sample selection and data collection.
Ijfs 12 00018 g002
Figure 3. Empirical tests’ workflow.
Ijfs 12 00018 g003
Table 1. Comparison of the five key indicators to quantify investor attention.
TypeData SourceIndicatorScholarsAdvantagesDisadvantages
Indirect indicator(1) Self-defining characteristics of asset trading(1) Trading volume, turnover rate, etc.Yang et al. (2017)Data are easy to obtainAn indirect, passive portrayal indicator with high noise
(2) News media and advertising expenditure(2) The number of reports, advertising expenditure, etc.Barber and Odean (2008); Hsu and Chen (2019); Yang et al. (2021)
(3) Event study(3) Specific eventsSundar et al. (2021); Li and Wu (2024)
Direct indicator(4) Social media information(4) Stock forums, stock bar postings, etc.Vishnu Maniy et al. (2023)A natural and active portrayal indicator with less noiseData are difficult to obtain
(5) Internet search index(5) Google search index, Baidu search index, internet search indexChen et al. (2020); Akarsu and Süer (2022)
Table 2. Variable definitions.
Indicator TypeVariable CodeVariable NameCalculation Method
Dependent VariableReturnIndividual Stock Monthly ReturnsReferring to Equation (1)
Independent VariableInattentionInvestor FocusThe sum of the stock code, company abbreviation, and company full name search index is taken as the logarithm
Moderating VariableaccAccounting information comparabilityCalculated according to the method of De Franco et al. (2011b)
Control variablesmcThe market capitalization of individual stocks outstanding in the monthThe monthly market value of exceptional stocks is taken as the natural logarithm: m c = L n s i z e
LevAsset-to-liability ratio L e v t = L i a b i l i t i e s   i n   p e r i o d   t / A s s e t s   i n   p e r i o d   t
ROEReturn on Equity R O E t = N e t   i n c o m e   i n   p e r i o d   t /
A v e r a g e   s h a r e h o l d e r s   e q u i t y   i n   p e r i o d   t
CashflowOperating Cash Flow Ratio C a s h f l o w t = N e t   c a s h   f l o w   f r o m   o p e r a t i n g   a c t i v i t i e s   i n   p e r i o d   t
         / E n d i n g   c u r r e n t   l i a b i l i t i e s   i n   p e r i o d   t
BMBook-to-market ratio B M T = S h a r e h o l d e r s   e q u i t y   i n   p e r i o d   t /
M a r k e t   c a p i t a l i z a t i o n   o f   t h e   c o m p a n y   i n   p e r i o d   t
GrowthOperating Revenue Growth Rate G r o w t h t = ( O p e r a t i n g   i n c o m e   o f   p e r i o d   t
o p e r a t i n g   i n c o m e   o f   p e r i o d   t 1 ) / o p e r a t i n g   i n c o m e   o f   p e r i o d   t
MonthMonthly fixed effectsMonthly dummy variables
Note: The symbols and definitions for all variables are provided in Table 2. All data were sourced from the China Stock Market and Accounting Research (CSMAR) database, except for the accounting information comparability data, which were obtained from the Chinese Research Data Services (CNRDS) platform.
Table 3. Descriptive statistics.
VariablesMeanSDMinMedianMax
Return0.010 0.120 −0.580 −0.004 2.496
Inattention10.101 0.816 0.000 10.035 15.315
mc15.994 1.163 13.258 15.799 21.748
Lev0.476 0.202 0.013 0.479 1.522
ROE0.065 0.270 −4.570 0.073 8.715
Cashflow0.056 0.074 −0.744 0.053 0.920
BM1.911 2.347 0.024 1.166 27.005
acc−0.015 0.011 −0.161 −0.013 −0.002
Growth0.179 1.251 −0.965 0.093 58.956
Table 4. Stationary test.
VariablesChi2p-Value
Return3.20 × 1040.0000
Inattention1.20 × 1040.0000
Mc6685.430 0.0000
Lev3369.905 0.0000
Roe3406.043 0.0000
Cashflow3747.957 0.0000
BM3889.366 0.0000
Growth3837.397 0.0000
Table 5. Pearson correlation analysis between variables.
VariablesReturnInattentionInattention (−1)Inattention (−2)mcLevROECashflowBMGrowth
Return1
lnattention0.073 ***1
Inattention (−1)−0.0049 ***0.951 ***1
Inattention (−2)−0.035 ***0.919 ***0.951 ***1
mc0.083 ***0.577 ***0.571 ***0.566 ***1
Lev−0.013 ***0.121 ***0.121 ***0.121 ***0.065 ***1
ROE0.026 ***0.053 ***0.053 ***0.052 ***0.167 ***−0.147 ***1
Cashflow0.038 ***0.063 ***0.064 ***0.065 ***0.255 ***−0.154 ***0.190 ***1
BM−0.035 ***0.079 ***0.078 ***0.079 ***0.106 ***0.543 ***−0.039 ***−0.108 ***1
Growth0.022 ***−0.016 ***−0.016 ***−0.017 ***−0.025 ***0.035 ***0.050 ***0.044 ***−0.014 ***1
Note: *** represent statistical significance at the 1% confidence levels.
Table 6. Variance inflation factor test.
VariablesVIF1\VIF
Mc1.660.601
Inattention1.530.653
Lev1.490.673
BM1.440.694
Cashflow1.140.878
ROE1.080.926
Growth1.010.990
Mean VIF1.34
Table 7. Baseline regression results of investor attention on current stock returns.
Variables(1)(2)(3)
ReturnReturnReturn
Inattention0.041 ***
(20.42)
mc0.058 ***0.112 ***0.105 ***
(26.94)(52.48)(48.34)
Lev−0.0160.019 *0.011
(−1.53)(1.77)(0.97)
ROE0.0010.000−0.001
(0.39)(0.13)(−0.14)
Cashflow0.0030.0070.009
(0.27)(0.64)(0.84)
BM0.001−0.001−0.000
(1.50)(−0.62)(−0.31)
Growth0.002 ***0.002 ***0.002 ***
(2.98)(3.86)(3.50)
Inattention (−1) −0.083 ***
(−41.23)
Inattention (−2) −0.069 ***
(−33.75)
_cons−1.348 ***−0.937 ***−1.024 ***
(−40.70)(−27.75)(−29.16)
Firm/MonthYesYesYes
N41,01639,98138,955
F174.729200.356181.419
R20.2240.2510.235
Note: *, *** represent statistical significance at the 10% and 1% confidence levels, respectively, with corresponding t-values provided in parentheses.
Table 8. Moderating effect regression results of accounting information comparability.
Variables(1)(2)(3)
ReturnReturnReturn
Inattention0.046 ***
(17.89)
acc−3.488 ***−3.412 ***−2.642 ***
(−3.55)(−3.47)(−2.64)
Inattention × acc0.283 ***
(3.05)
mc0.059 ***0.114 ***0.107 ***
(27.26)(52.95)(48.75)
Lev−0.0160.018 *0.010
(−1.54)(1.73)(0.92)
ROE0.0050.006 *0.005
(1.49)(1.77)(1.32)
Cashflow−0.0020.0010.004
(−0.15)(0.05)(0.33)
BM0.001−0.001−0.001
(0.89)(−1.49)(−1.07)
Growth0.002 ***0.002 ***0.002 ***
(2.90)(3.78)(3.44)
Inattention (−1) −0.079 ***
(−31.12)
Inattention (−1) × acc 0.249 ***
(2.68)
Inattention (−2) −0.066 ***
(−25.58)
Inattention (−2) × acc 0.182 *
(1.92)
_cons−1.415 ***−1.008 ***−1.082 ***
(−38.42)(−26.98)(−27.97)
Firm/MonthYesYesYes
N41,01639,98138,955
Note: *, *** represent statistical significance at the 10% and 1% confidence levels, respectively, with corresponding t-values provided in parentheses.
Table 9. Alternative measure of the core dependent variable.
Variables(1)(2)(3)
ReturnReturnReturn
Inattention0.046 ***
(17.90)
acc−3.487 ***−3.413 ***−2.643 ***
(−3.55)(−3.47)(−2.64)
Inattention × acc0.283 ***
(3.05)
mc0.060 ***0.114 ***0.107 ***
(27.29)(52.96)(48.77)
Lev−0.0160.018 *0.010
(−1.54)(1.72)(0.92)
ROE0.0050.006 *0.005
(1.48)(1.77)(1.31)
Cashflow−0.0020.0010.004
(−0.15)(0.05)(0.33)
BM0.001−0.001−0.001
(0.88)(−1.49)(−1.07)
Growth0.002 ***0.002 ***0.002 ***
(2.89)(3.78)(3.44)
Inattention (−1) −0.079 ***
(−31.09)
Inattention (−1) × acc 0.249 ***
(2.68)
Inattention (−2) −0.066 ***
(−25.56)
Inattention (−2) × acc 0.182 *
(1.92)
_cons−1.416 ***−1.010 ***−1.084 ***
(−38.45)(−27.02)(−28.01)
Firm/MonthYesYesYes
N41,01639,98138,955
F170.248195.623176.904
R20.2250.2520.236
Note: *, *** represent statistical significance at the 10% and 1% confidence levels, respectively, with corresponding t-values provided in parentheses.
Table 10. Instrumental variable benchmark regression.
Related TestsInattentiontInattentiont−1Inattentiont−2
underidentification tests(1) LM218.715469.996531.417
(2) p-value0.00000.00000.0000
weak identification tests(1) Wald-F6846.2046260.7346580.861
(2) KPWald-F541.681771.0661206.376
Table 11. Instrumental variables method.
Variables(1)(2)(3)
ReturnReturnReturn
Inattention IV 0.407 ***
(13.54)
mc−0.105 ***0.101 ***0.100 ***
(−7.58)(25.37)(23.52)
Lev−0.117 ***0.0050.007
(−6.43)(0.45)(0.54)
ROE0.002−0.000−0.001
(0.32)(−0.07)(−0.19)
Cashflow−0.0100.0060.006
(−0.65)(0.56)(0.55)
BM0.007 ***0.0000.000
(6.46)(0.12)(0.54)
Growth−0.0010.002 ***0.002 ***
(−0.92)(3.18)(2.96)
Inattention (−1) IV −0.051 ***
(−6.85)
Inattention (−2) IV −0.047 ***
(−6.45)
Firm/MonthNoNoNo
N39,98138,94837,920
F82.562111.62598.291
Note: *** represent statistical significance at the 1% confidence levels, with corresponding t-values provided in parentheses.
Disclaimer/Publisher’s Note: The statements, opinions and data contained in all publications are solely those of the individual author(s) and contributor(s) and not of MDPI and/or the editor(s). MDPI and/or the editor(s) disclaim responsibility for any injury to people or property resulting from any ideas, methods, instructions or products referred to in the content.

