Article

Data-Driven Sustainable Investment Strategies: Integrating ESG, Financial Data Science, and Time Series Analysis for Alpha Generation

1
BTech CSE Data Science, Dwarkadas J Sanghvi College of Engineering, Mumbai 400056, India
2
B. Sc. Economics and Finance, University of London, London WC1E 7HU, UK
*
Author to whom correspondence should be addressed.
Int. J. Financial Stud. 2024, 12(2), 36; https://doi.org/10.3390/ijfs12020036
Submission received: 16 March 2024 / Revised: 10 April 2024 / Accepted: 18 April 2024 / Published: 20 April 2024
(This article belongs to the Special Issue Making Green from Green: The Truth about Sustainable Finance)

Abstract

:
In today’s investment landscape, the integration of environmental, social, and governance (ESG) factors with data-driven strategies is pivotal. This study delves into this fusion, employing sophisticated statistical techniques and Python programming to unveil insights often overlooked by traditional approaches. By analyzing extensive datasets, including S&P500 financial indicators from 2012 to 2021 and 2021 ESG metrics, investors can enhance portfolio performance. Emphasizing ESG integration for sustainable investing, the study underscores the potential for alpha generation. Time series analysis further elucidates market dynamics, empowering investors to align with both financial objectives and ethical values. Notably, the research uncovers a positive correlation between ESG risk and total risk, suggesting that companies with lower ESG risk tend to outperform those with higher ESG risk. Moreover, employing a long–short ESG risk strategy yields abnormal returns of approximately 4.37%. This integration of ESG factors not only mitigates risks associated with environmental, social, and governance issues but also capitalizes on opportunities for sustainable growth, fostering responsible investing practices and ensuring long-term financial returns, resilience, and value creation.

1. Introduction

1.1. Data-Driven Strategies, Environmental, Social, and Governance Integration, and Alpha Generation in Modern Investment Practices

In today’s ever-evolving financial landscape, the adoption of data-driven strategies has become essential for making well-informed investment decisions. Through the utilization of financial data science, statistical analysis, and Python programming, investors can harness extensive data to uncover patterns and insights that traditional methods might miss. This shift towards data-driven approaches is driven by their proven ability to enhance decision-making, manage risks, and, ultimately, improve investment performance. At the forefront of this transformation lies ESG investing, which incorporates non-financial factors like environmental sustainability, social responsibility, and corporate governance into investment analysis. ESG considerations have gained momentum as investors recognize the importance of aligning their investments with broader societal and environmental goals.
In addition to financial gains, ESG factors offer insights into a company’s long-term sustainability and reputation. Companies with robust ESG practices are better equipped to handle risks, attract capital, and seize emerging opportunities. Integrating ESG criteria into investment strategies not only drives positive societal impact but also aligns portfolios with investor values. Meanwhile, alpha generation remains a primary goal for investors seeking to outperform the market. Alpha represents returns above market performance and can be achieved through data-driven methodologies. By leveraging statistical techniques, time series models, and Python, investors can identify investment opportunities and enhance portfolio performance.
Alpha is crucial for portfolio diversification and risk management, signaling superior investment skill and performance. As investors increasingly prioritize sustainability and responsible investing, the role of ESG factors becomes paramount. Incorporating ESG considerations alongside data-driven strategies allows investors to pursue financial gains while contributing to positive environmental and social outcomes. This paper explores the importance of data-driven approaches, the role of ESG considerations in investments, and techniques for alpha generation. By examining the intersection of these areas, we aim to offer actionable insights for navigating today’s complex financial markets.

1.2. Statistics and Trends in Environmental, Social, and Governance Investing

To underscore the significance of ESG investing, it is imperative to highlight the key statistics and trends shaping its growth in the financial landscape. Recent data reveal a substantial surge in the global sustainable investment market, with assets under management surpassing trillions of dollars (PwC 2022). This surge signifies a burgeoning recognition among investors regarding the crucial integration of environmental, social, and governance factors into their investment strategies. Moreover, empirical evidence suggests that companies demonstrating robust ESG performance consistently outperform their counterparts in terms of financial returns, risk mitigation, and long-term viability (Horton and Jessop 2022). By embracing ESG considerations in their investment approaches, stakeholders not only align their portfolios with ethical values but also potentially enhance their financial performance.
Furthermore, as highlighted in by PwC (2022), ESG-focused institutional investment is projected to soar by 84% to USD 33.9 trillion in 2026, constituting 21.5% of assets under management. This substantial rise underscores the growing importance of ESG factors in driving investment decisions and reflects a significant shift in investor preferences towards sustainable and responsible investing practices.

1.3. Enhancing Data Science Techniques

While the article acknowledges the utilization of Python programming and statistical methods, it can be enriched by briefly elucidating the common data science techniques prevalent in investment analysis. Notably, machine learning algorithms such as decision trees, random forests, and support vector machines play a pivotal role in predictive modeling within investment realms. Decision trees offer a transparent and interpretable framework for decision-making by partitioning data into segments based on feature importance (Singh 2024). Random forests, collections of decision trees, excel in handling large datasets and mitigating overfitting concerns, thus providing robust predictions (Singh 2024). On the other hand, support vector machines (SVMs) are effective in classification tasks, separating data points into different classes through the use of hyperplanes in high-dimensional space (Singh 2024). These algorithms empower investors to meticulously analyze vast datasets, uncovering intricate patterns that inform prudent investment decisions.
Furthermore, clustering techniques like K-means clustering or hierarchical clustering are instrumental in portfolio optimization endeavors. K-means clustering partitions data points into clusters based on similarity, enabling investors to group assets with comparable characteristics (Singh 2024). Hierarchical clustering, on the other hand, constructs a tree-like hierarchy of clusters, facilitating a deeper understanding of asset relationships and diversification strategies (Singh 2024). Through the strategic grouping of analogous assets, investors construct diversified portfolios adept at minimizing risk while maximizing returns. Incorporating these sophisticated data science techniques into investment analysis not only enhances decision-making precision but also enables investors to seize lucrative market opportunities more effectively.

1.4. Research Objectives

This study aims to explore the limited adoption of data science techniques in investment decision-making processes, which persists despite the availability of extensive financial data and technological advancements. It seeks to identify the inefficiencies inherent in traditional investment methods characterized by subjective judgments and limited quantitative analysis, thereby highlighting the potential for data-driven approaches to enhance decision precision and effectiveness. Additionally, the research endeavors to dissect the complexity of financial markets influenced by various factors such as economic indicators and geopolitical events, with a focus on leveraging data science techniques to uncover hidden patterns and insights within large datasets. Furthermore, it aims to underscore the importance of alpha generation as a primary objective for investment professionals in competitive markets and elucidate how innovative data-driven strategies can offer new avenues for identifying unique investment opportunities and generating alpha.
Explicitly addressing these objectives contributes to the existing body of knowledge by filling gaps identified in previous research. While traditional investment approaches have relied heavily on subjective judgments, this study recognizes the need to integrate data science techniques to overcome inherent inefficiencies and enhance decision-making accuracy. By shedding light on the untapped potential of data-driven methodologies in investment processes, the research offers insights into how modern technology can revolutionize traditional paradigms and contribute to alpha generation strategies.
Furthermore, through dissecting the complexity of financial markets and leveraging data science to uncover hidden patterns, the study contributes to a deeper understanding of market dynamics, addressing a gap in previous research by providing investors with actionable insights derived from rigorous quantitative analysis. This exploration of market intricacies enhances the potential for alpha generation. By highlighting the potential for data-driven approaches to identify unique investment opportunities and generate alpha, the research offers practical solutions to enhance investment performance in competitive markets.
Finally, the integration of financial data science techniques, including hypothesis testing and time series models, provides deeper insights into market dynamics and empowers investors to make informed decisions. This aspect of the study bridges the gap between traditional investment paradigms and modern data-driven methodologies, offering investors the tools and knowledge necessary to navigate financial landscapes with greater confidence and effectiveness while generating alpha.

1.5. Review of Existing Literature

1.5.1. Descriptive Statistics in Data Analysis

Dong (2023) emphasizes the pivotal role of descriptive statistics in simplifying complex datasets and facilitating meaningful conclusions for research and decision-making processes. Measures such as mean, median, standard deviation, and quartiles offer a concise summary of data and enable further analysis through univariate, bivariate, and multivariate methods (Dong 2023).

1.5.2. Impact of Environmental, Social, and Governance Performance on Firm Value

Aydoğmuş et al. (2022) delve into the impact of environmental, social, and governance (ESG) performance on firm value and profitability, revealing a positive relationship between ESG scores and firm profitability (Aydoğmuş et al. 2022).

1.5.3. Financial Time Series Analysis

Chakraborti et al. (2007) contribute to financial time series analysis by highlighting the significance of stochastic methods. Their study emphasizes the prevalence of noisy and chaotic processes in financial data and the complexities involved in modeling asset price variations, shedding light on the challenges faced in this domain (Chakraborti et al. 2007).

1.5.4. Predictive Analysis Using Social Media Sentiments

A study by Asgarov (2023) explores the relationship between social media sentiments and stock prices. Employing LSTM neural networks for predictive analysis, the study utilizes sentiment analysis from Twitter data to predict stock price movements accurately, offering insights into the potential of social media sentiment analysis in financial forecasting (Asgarov 2023).

1.5.5. Data-Driven Investment Strategies

Ye (2021) investigates investment strategies for Peer-to-Peer (P2P) lending platforms, employing econometric modeling and machine learning techniques. The study provides valuable insights for investors in the P2P lending space, identifying optimal investment strategies through data-driven approaches (Ye 2021).

1.5.6. Environmental, Social, and Governance Factors in Investment Decisions

Cohen (2023) discusses the growing awareness of ESG factors in investment decisions and their impact on corporate value. This study highlights the shift towards sustainable practices in the financial market and emphasizes the importance of considering ESG factors in investment strategies (Cohen 2023).

1.5.7. Bibliometric Review of Environmental, Social, and Governance Factors and Risk

De Giuli et al. (2024) conduct a bibliometric review, analyzing literature on ESG factors and risk, identifying trends and key research areas. Their study underscores the critical role of finance in promoting sustainable growth and emphasizes the need for further research in understanding ESG risks and their implications for financial markets (De Giuli et al. 2024).

1.5.8. Data-Driven Approaches in Stock Market Investment

A study by Narukulla (2022) discusses the advantages of leveraging big data technologies and AI in stock market investment. The study highlights the transformative impact of these technologies on stock markets and financial services, paving the way for more sophisticated investment strategies (Narukulla 2022).

1.5.9. Integration of Artificial Intelligence and Data Science in Finance

Farooq and Chawla (2021) provide a comprehensive overview of the integration of AI and data science in the finance industry. Their study showcases the transformative impact of AI on financial services, highlighting significant cost-saving projections and operational improvements (Farooq and Chawla 2021).

1.5.10. Environmental, Social, and Governance Strategies and Dividend Payout Policies

Niccolò et al. (2020) analyze the role of ESG strategies in dividend payout policies, finding a negative impact of ESG practices on dividend payout. This suggests a trade-off between sustainability investments and dividend payments, highlighting the complexities involved in balancing these aspects (Niccolò et al. 2020).

1.5.11. Environmental, Social, and Governance Risk and Firm Value

Stiadi (2023) examines the role of ESG risk in moderating the relationship between investment decisions and firm value. This study underscores the importance of considering ESG factors in investment decisions and their implications for firm value (Stiadi 2023).

1.5.12. Factors Affecting Environmental, Social, and Governance Considerations and Their Investment Impact

Utilizing interpretive structural modeling, Aich et al. (2021) explore factors affecting ESG considerations that have an investment impact. Their study emphasizes the role of good governance in driving investment impact, providing insights into the structural relationships among influential factors (Aich et al. 2021).

1.5.13. Correlation between Environmental, Social, and Governance Ratings and Financial Variables

Gupta et al. (2021) discuss the correlation between ESG ratings and financial variables, demonstrating the importance of ESG parameters for investment decisions. Their study highlights the influence of ESG ratings on financial performance, offering insights into the relationship between sustainability and financial outcomes (Gupta et al. 2021).

1.5.14. Analyses and Tests Using the Vector Autoregressive Model

Akkaya (2021) explores different analyses and tests conducted using the Vector Autoregressive (VAR) model to gain insights into the relationships and interactions between variables. Their study contributes to the understanding of the dynamics within the VAR model, shedding light on its applications in financial analysis (Akkaya 2021).

1.5.15. Environmental, Social, and Governance Disclosure by Firms

Examining ESG disclosure by firms, Ehlers et al. (2022) provide insights into the challenges and potential benefits of focusing on specific ESG themes. Their study highlights the implications of ESG disclosure for investors and emphasizes the importance of considering ESG factors in investment decisions (Ehlers et al. 2022).

2. Materials and Methods

2.1. Developing an Investment Idea

Data-driven investing is a methodological approach where investment strategies are developed and implemented based on rigorous statistical analysis. This involves formulating hypotheses, collecting and pre-processing data, estimating relevant measures, and testing these hypotheses using empirical data. In the context of exploring the impact of corporate governance, environmental, and social responsibility (ESG) factors on investment returns and risk, it is essential to structure our research questions and hypotheses carefully. It is crucial to note that ESG (environmental, social, and governance) factors are often quantified and reported as an ESG Risk Score or ESG Score. A higher (lower) ESG Risk Score typically indicates weaker (stronger) governance, environmental, and social responsibility practices within a company. This quantification enables investors to assess and compare the ESG performance of different companies within their investment universe. It is common practice to express investment ideas as research questions to guide the analysis effectively.
  • Research Question 1: We seek to understand the relationship between corporate governance, environmental, and social responsibility and stock returns/risk. Are these factors correlated with financial performance, and, if so, to what extent?
  • Research Question 2: Assuming a relationship exists, can it be leveraged to achieve abnormal returns, i.e., returns that exceed what would be expected given the level of risk taken?
To address these questions, we formulate the following hypotheses:
Hypothesis 1 (H1):
There exists a positive relationship between ESG risk and expected returns.
In other words, companies with a higher ESG Risk Score may be associated with higher expected returns due to the perceived risk premium associated with their environmental, social, and governance practices.
Hypothesis 2 (H2):
There exists a positive relationship between ESG risk and total risk.
This hypothesis posits that companies with a higher ESG Risk Score may also exhibit higher levels of total risk, including both systematic and idiosyncratic risk factors.
Hypothesis 3 (H3):
The returns of firms with higher ESG risk are statistically greater than the returns of firms with lower ESG risk.
This hypothesis tests whether companies with a higher ESG Risk Score outperform those with a lower ESG Risk Score, suggesting a potential market inefficiency that can be exploited for investment gains.
Hypothesis 4 (H4):
A long–short ESG risk strategy yields abnormal returns.
This hypothesis tests whether one can earn a higher return than the market portfolio by ‘going long’ in stocks with high ESG risk and ‘shorting’ those with low ESG risk.
By rigorously testing these hypotheses using appropriate statistical techniques and empirical data, we aim to gain insights into the relationship between ESG factors and investment performance and assess the feasibility of data-driven strategies for generating abnormal returns in the financial markets.

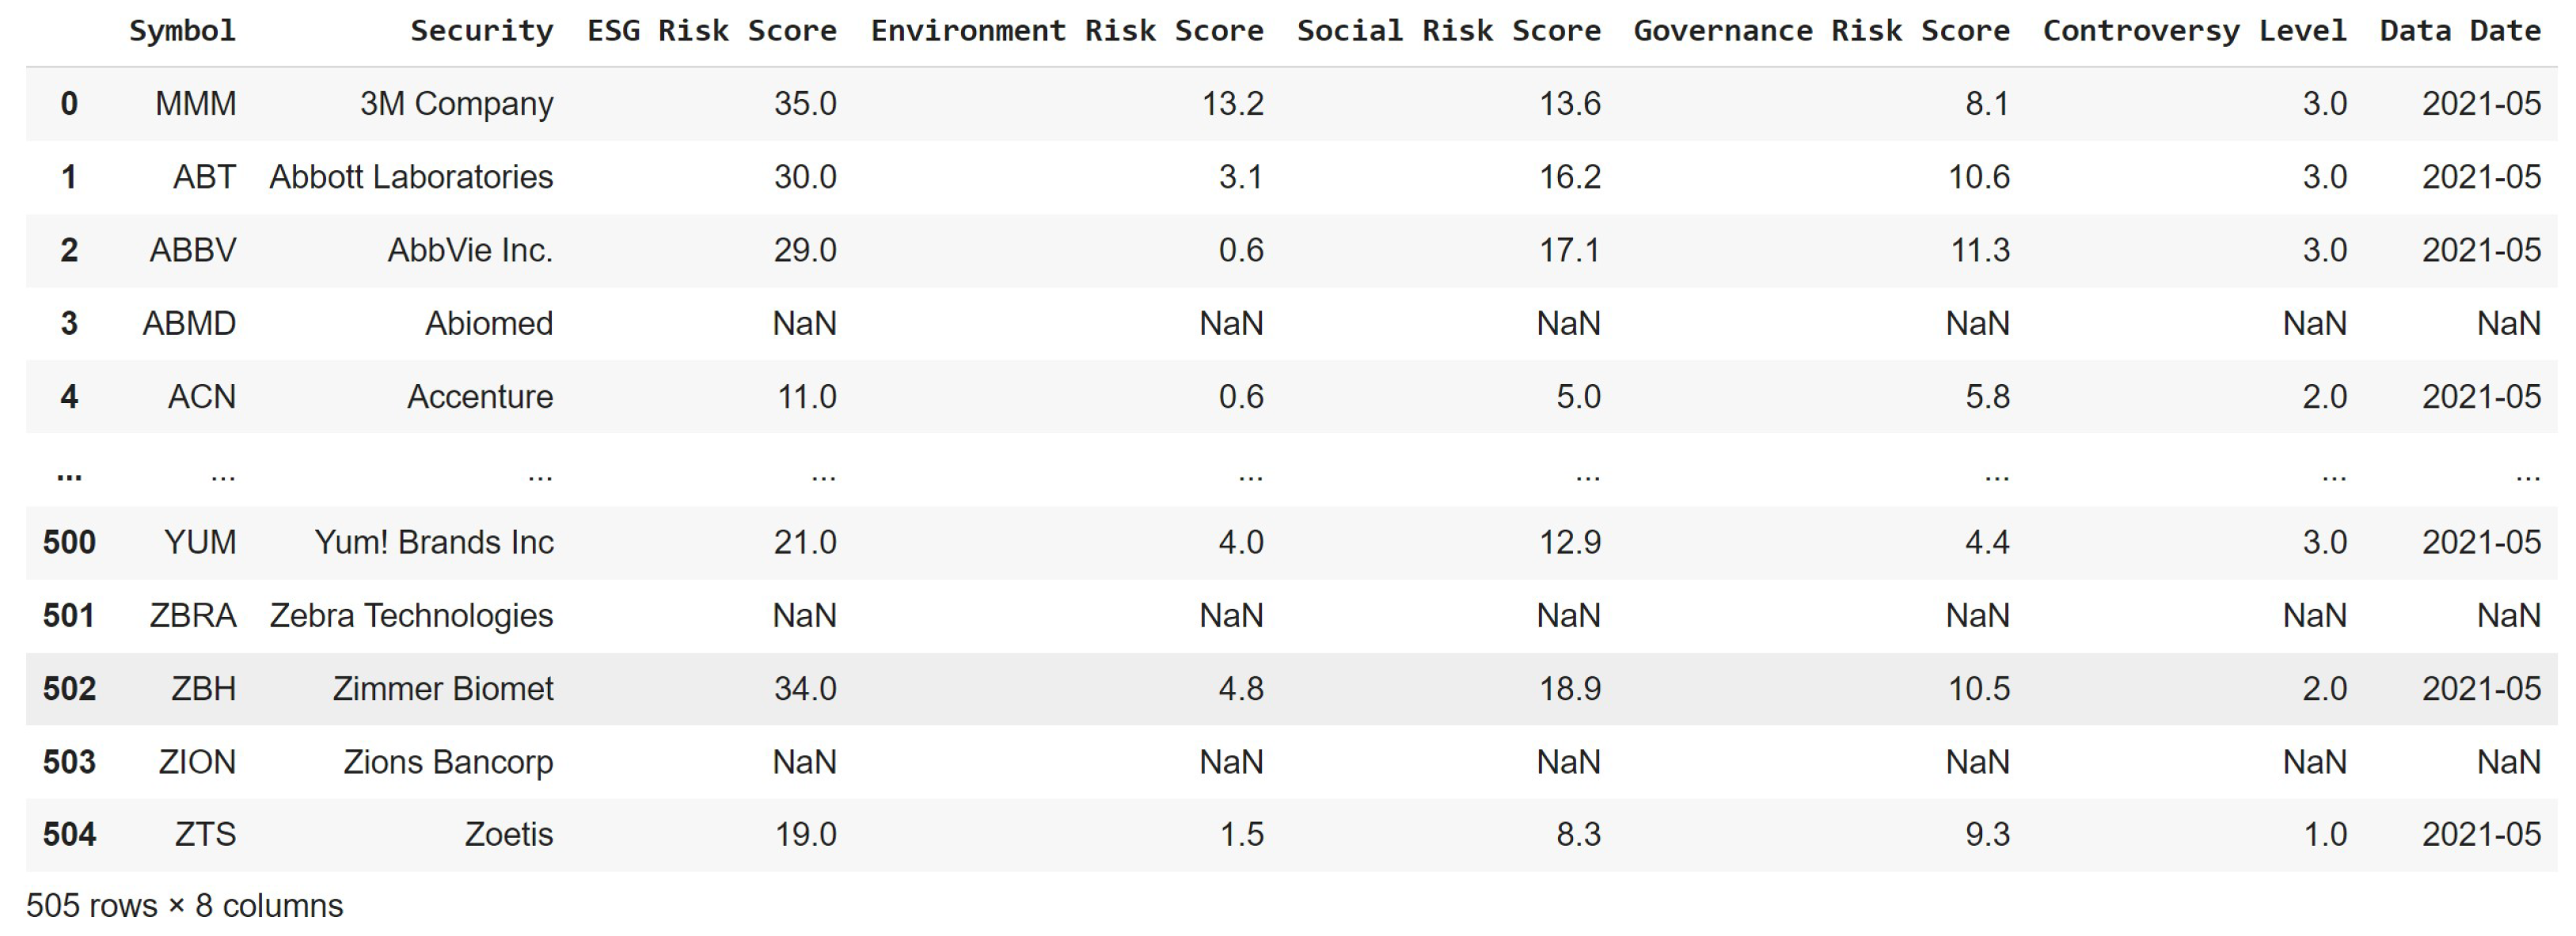
2.2. Sourcing Relevant Data: Data Collection and Pre-Processing

Testing our hypotheses necessitates two types of data: stock price data for analyzing returns and risk and ESG (environmental, social, and governance) data as a proxy for governance, environmental, and social responsibility factors. Obtaining this data is subject to certain constraints to ensure the validity and reliability of our analysis. These constraints include budget considerations, requiring data that are freely accessible; sample size requirements, necessitating a large dataset in terms of both time series and cross-sections; and the need for replicability, ensuring that results can be replicated within the same dataset.
Sourcing stock price data involves accessing information from various sources, both free and paid. Examples of such sources include NASDAQ Data Link (formerly Quandl), Pandas Datareader, and Google Finance via Google Sheets. For our analysis, we utilize the full sample of S&P500 stocks, ensuring a large dataset in both the time series and cross-section dimensions. The S&P500 index encompasses a broad selection of 500 leading companies in the United States, representing various sectors of the economy, including technology, healthcare, finance, and consumer goods. This diverse composition provides a robust representation of the overall market performance and is widely used for benchmarking and investment analysis purposes. When working with stock price data, it is essential to address outliers that may skew the analysis. Various pre-processing techniques, such as data normalization, handling missing values, and detecting and removing outliers, are employed to ensure the integrity of the data.
The S&P500 dataframe consists of 2367 rows and 506 columns. These columns represent various companies included in the S&P500 index, such as 3M (MMM), Abbott Laboratories (ABT), AbbVie Inc. (ABBV), and many more. The timeframe of the data spans from 2012 to 2021. Figure 1 gives an overview of the S&P500 stock price data in the form of a pandas dataframe. This extensive timeframe allows for a comprehensive analysis of stock price movements and trends over nearly a decade. The dataset provides valuable insights into the historical performance of a diverse range of companies across different sectors, serving as a reliable foundation for investment analysis and decision-making. On the other hand, ESG data can be obtained from sources such as Sustainalytics via Yahoo! Finance. ESG data provide insights into a company’s environmental, social, and governance practices, allowing investors to evaluate its sustainability and ethical performance. The ESG dataset includes metrics such as the ESG Risk Score, Environment Risk Score, Social Risk Score, Governance Risk Score, and Controversy Level. These metrics reflect different aspects of a company’s ESG performance and can vary over time. However, it is important to recognize the limitations of ESG data, particularly its cross-sectional nature, which reflects ESG metrics at a specific point in time. This implies an assumption that ESG risk is not time-varying, which may introduce limitations and biases into our analysis. Additionally, using ESG data as is may lead to look-ahead bias, compromising the integrity of our results. Despite these challenges, acknowledging and addressing these limitations are crucial for ensuring the robustness and validity of our analysis. By incorporating both S&P500 and ESG data, our analysis encompasses a comprehensive understanding of the relationship between financial performance and ESG factors, enabling informed investment decision-making.
The ESG (environmental, social, and governance) dataframe contains 505 rows and 8 columns. These columns include ’Symbol’, ’Security’, ’ESG Risk Score’, ’Environment Risk Score’, ’Social Risk Score’, ’Governance Risk Score’, ’Controversy Level’, and ’Data Date’. Figure 2 gives an overview of the ESG data in pandas dataframe format. The ’ESG Risk Score’ provides an overall assessment of a company’s ESG performance, while the individual risk scores for environment, social, and governance factors offer insights into specific areas of concern. The ’Controversy Level’ indicates the degree of controversy associated with the company’s ESG practices. The timeframe of the data spans from 1 March 2021 to 1 May 2021, capturing a snapshot of ESG metrics during this period. This dataset serves as a crucial component in evaluating the ESG performance of companies and its implications for investment decision-making. Figure 3 illustrates the expected return, total risk, and ESG Risk Score, and Figure 4 explores correlations across all variables via a correlation matrix represented in a pandas dataframe.

2.3. Statistical Techniques and Time Series Analysis

In our comprehensive analysis, we employ various statistical techniques and time series models to thoroughly investigate the relationships between ESG factors and investment returns across all hypotheses. Initially, we utilize statistical techniques such as the t-statistic for correlation analysis, np.corr using the numpy library of Python for calculating correlation coefficients, and the Pearson correlation coefficient (Pearsonr) to measure the linear correlation between ESG Risk Score and expected returns for Hypothesis 1 and total risk for Hypothesis 2 (Abdey 2023; Cleff 2019; Lin et al. 2019). These techniques will provide insights into the strength and direction of the relationship between ESG factors and financial performance for each hypothesis. Furthermore, we apply Ordinary Least Squares (OLS) regression analysis to examine the impact of ESG risk on expected returns for Hypothesis 1, total risk for Hypothesis 2, and investment returns for Hypotheses 3 and 4 (Abdey 2023; Buckle and Beccalli 2011; Lin et al. 2019). OLS regression allows us to estimate the relationship between ESG Risk Score and financial performance measures, providing valuable insights into the potential predictive power of ESG factors in determining investment outcomes and abnormal returns. To assess the causal relationship between ESG factors and investment returns across all hypotheses, we conduct Granger causality tests using Vector Autoregression (VAR) models. Prior to this, we test for stationarity in the data using the Augmented Dicky Fuller Test (ADF) (Lin et al. 2019; Qi et al. 2022). Granger causality tests help determine whether past values of ESG Risk Score provide significant information for predicting future investment returns or total risk, thereby elucidating the causal dynamics between ESG factors and financial performance. Additionally, for Hypothesis 3, which posits that returns of firms with higher ESG risk are statistically greater than the returns of firms with lower ESG risk, we sort ESG data into quintiles based on ESG Risk Score. This approach allows us to compare the investment returns of companies across different quintiles of ESG risk, providing empirical evidence to support or refute the hypothesis. For Hypothesis 4, which suggests that a long–short ESG risk strategy yields abnormal returns, we utilize the Capital Asset Pricing Model (CAPM) framework to test for alpha (Abdey 2023; Buckle and Beccalli 2011; Cleff 2019). By estimating alpha using the CAPM and incorporating OLS regression, we can evaluate whether the long–short ESG risk strategy yields abnormal returns, thus contributing to our understanding of the effectiveness of ESG factors in generating alpha in investment portfolios. Each of these tests and models plays a crucial role in our analysis, providing a comprehensive framework for investigating the relationships between ESG factors and investment returns, assessing causality, and evaluating the potential for alpha generation within the context of ESG investing across all hypotheses. Figure 5 shows a block diagram of the proposed methodology.

2.3.1. t-Stat Correlation

Testing H1 and H2 requires the following formula:
t S t a t ρ x , y = ρ x , y n 1 1 ρ x , y 2
where:
-
t S t a t ρ x , y = t-statistic;
-
ρ x , y = correlation coefficient;
-
n = sample size.
Variables
We investigate the relationship between environmental, social, and governance (ESG) risk factors and investment outcomes by conducting separate t-tests for each hypothesis at a significance level of 5%.
For H1:
  • Dependent variable: expected returns of sustainable investment portfolios ( r e t u r n s );
  • Independent variable: ESG Risk Score ( E S G ).
For H2:
  • Dependent variable: total risk ( r i s k );
  • Independent variable: ESG Risk Score ( E S G ).
Model Specification
For H1: We test the hypothesis that there exists a positive relationship between ESG risk and expected returns using the following t-test equation:
t S t a t ρ ESG , returns = ρ ESG , returns n 1 1 ρ ESG , returns 2
where:
  • t S t a t ρ ESG , returns represents the t-statistic for the correlation coefficient ( ρ ESG , returns );
  • ρ ESG , returns is the correlation coefficient between ESG risk and expected returns;
  • n is the sample size.
For H2: We test the hypothesis that there exists a positive relationship between ESG risk and total risk using a similar t-test equation:
t S t a t ρ ESG , risk = ρ ESG , risk n 1 1 ρ ESG , risk 2
where:
  • t S t a t ρ ESG , risk represents the t-statistic for the correlation coefficient ( ρ ESG , risk );
  • ρ ESG , risk is the correlation coefficient between ESG risk and total risk;
  • n is the sample size.
For H3:
Testing and validating H3: The t-statistic (tStat) for ESG portfolios is estimated as follows:
t S t a t = E [ r Q 1 ] E [ r Q 5 ] σ ^ r Q 1 Q 5 / n E [ r Q 1 - Q 5 ] σ ^ r Q 1 Q 5 / n
where:
-
t S t a t = t-statistic;
-
E [ r Q 1 ] = expected return of the first quintile (Q1);
-
σ ^ r Q 1 - Q 5 = estimated standard deviation of the difference in returns between Q1 and Q5;
-
n = sample size.
Interpretation
For each hypothesis, a statistically significant t-statistic with a p-value of less than 0.05 would indicate a meaningful relationship between ESG risk and the respective variable, providing evidence to support the hypothesis.
Conclusion
By conducting separate t-tests for each hypothesis and analyzing the correlation between ESG risk and investment outcomes at a 5% significance level, we aim to contribute to the understanding of the impact of ESG considerations on investment performance and risk management.

2.3.2. Correlation Analysis (Pearson Correlation Coefficient)

Correlation analysis, often utilizing the Pearson correlation coefficient, assesses the strength and direction of the linear relationship between two variables. It provides insights into how changes in one variable correspond to changes in another, aiding in understanding potential associations within the data.
r = n ( X i Y i ) X i Y i ( n X i 2 ( X i ) 2 ) ( n Y i 2 ( Y i ) 2 )
-
X i and Y i are individual data points;
-
∑ denotes the sum across all data points;
-
n is the sample size.
For H1: We test the hypothesis that there exists a positive relationship between ESG risk and expected returns using the following Pearson correlation coefficient formula:
r ESG , returns = n ( E S G i × r e t u r n s i ) E S G i r e t u r n s i ( n E S G i 2 ( E S G i ) 2 ) ( n r e t u r n s i 2 ( r e t u r n s i ) 2 )
where:
  • r ESG , returns is the Pearson correlation coefficient between ESG risk and expected returns;
  • E S G i and r e t u r n s i represent the individual data points of ESG risk and expected returns, respectively;
  • ∑ denotes the sum across all data points;
  • n is the sample size.
For H2: We test the hypothesis that there exists a positive relationship between ESG risk and total risk using the following similar Pearson correlation coefficient formula:
r ESG , risk = n ( E S G i × r i s k i ) E S G i r i s k i ( n E S G i 2 ( E S G i ) 2 ) ( n r i s k i 2 ( r i s k i ) 2 )
where:
  • r ESG , risk is the Pearson correlation coefficient between ESG risk and total risk;
  • E S G i and r i s k i represent the individual data points of ESG risk and total risk, respectively;
  • ∑ denotes the sum across all data points;
  • n is the sample size.
For H3: To test the hypothesis regarding the significance of differences in returns between different ESG risk quintiles, we calculate the correlation between the returns of the first quintile (Q1) and the fifth quintile (Q5) ESG portfolios. This is carried out using the following Pearson correlation coefficient formula:
r Q 1 - Q 5 = n ( Q 1 i × Q 5 i ) Q 1 i Q 5 i ( n Q 1 i 2 ( Q 1 i ) 2 ) ( n Q 5 i 2 ( Q 5 i ) 2 )
where:
  • r Q 1 - Q 5 is the Pearson correlation coefficient between the returns of the Q1 and Q5 ESG portfolios;
  • Q 1 i and Q 5 i represent the individual data points of returns for the Q1 and Q5 portfolios, respectively;
  • ∑ denotes the sum across all data points;
  • n is the sample size.
For H4: To test the hypothesis that a long–short ESG risk strategy yields abnormal returns, we calculate the correlation between the returns of the long–short ESG portfolio and the market returns. This is carried out using the following Pearson correlation coefficient formula:
r Long - Short , Market = n ( L S i × M a r k e t i ) L S i M a r k e t i ( n L S i 2 ( L S i ) 2 ) ( n M a r k e t i 2 ( M a r k e t i ) 2 )
where:
  • r Long - Short , Market is the Pearson correlation coefficient between returns of the long–short ESG portfolio and market returns;
  • L S i and M a r k e t i represent the individual data points of returns for the long–short ESG portfolio and market returns, respectively;
  • ∑ denotes the sum across all data points;
  • n is the sample size.
These formulas are used to assess the relationships between different portfolio returns and market returns, providing insights into the effectiveness of the long–short ESG strategy.
Interpretation
For each hypothesis, a Pearson correlation coefficient (r) close to 1 would indicate a strong positive linear relationship, while a coefficient close to −1 would suggest a strong negative linear relationship. A coefficient close to 0 would indicate no linear relationship between the variables.

2.3.3. Ordinary Least Squares Regression Analysis

Ordinary Least Squares (OLS) regression analysis is a statistical method used to estimate the relationship between one or more independent variables and a dependent variable. It minimizes the sum of the squared differences between the observed and predicted values, providing insights into the strength and significance of the relationships among variables.
Mathematical formulation: The Ordinary Least Squares (OLS) regression equation for a simple linear regression model with one independent variable x.
y = β 0 + β 1 x + ε
where:
-
y is the dependent variable;
-
x is the independent variable;
-
β 0 is the intercept (constant term);
-
β 1 is the slope coefficient;
-
ε is the error term (residuals).
For H1: The Ordinary Least Squares (OLS) regression equation for testing the hypothesis regarding the relationship between ESG risk and expected returns is given by:
Expected Returns = β 0 + β 1 × ESG Risk + ε
where:
  • Expected Returns is the dependent variable;
  • ESG Risk is the independent variable;
  • β 0 is the intercept (constant term);
  • β 1 is the slope coefficient;
  • ε is the error term (residuals).
For H2: The Ordinary Least Squares (OLS) regression equation for testing the hypothesis regarding the relationship between ESG risk and total risk is given by:
Total Risk = β 0 + β 1 × ESG Risk + ε
where:
  • Total Risk is the dependent variable;
  • ESG Risk is the independent variable;
  • β 0 is the intercept (constant term);
  • β 1 is the slope coefficient;
  • ε is the error term (residuals).
For H3: The Ordinary Least Squares (OLS) regression equation for testing the hypothesis regarding the differences in returns between different ESG risk quintiles is given by:
Returns = β 0 + β 1 × ESG Quintile + ε
where:
  • Returns is the dependent variable;
  • ESG Quintile is the independent variable representing different ESG risk quintiles;
  • β 0 is the intercept (constant term);
  • β 1 is the slope coefficient;
  • ε is the error term (residuals).
For H4: The Ordinary Least Squares (OLS) regression equation for testing the hypothesis regarding abnormal returns generated by a long–short ESG risk strategy is given by:
Returns = β 0 + β 1 × Long - Short ESG Portfolio + ε
where:
  • Returns is the dependent variable;
  • Long - Short ESG Portfolio is the independent variable representing the long–short ESG portfolio;
  • β 0 is the intercept (constant term);
  • β 1 is the slope coefficient;
  • ε is the error term (residuals).

2.3.4. Vector Autoregression

Vector Autoregression (VAR) is a statistical method used to model the dynamic relationship between multiple time series variables. It extends the concept of simple autoregression to multivariate data, allowing for the simultaneous analysis of interdependencies among variables over time.
Y t = c Φ 1 Y t 1 Φ 2 Y t 2 Φ p Y t p + e t
where:
  • Y t is a vector of endogenous variables at time t;
  • c is a vector of intercept terms;
  • Φ i are coefficient matrices for lag i (for i = 1 , 2 , , p );
  • e t is a vector of error terms at time t.
Model Specification
For H1: We test the hypothesis that there exists a positive relationship between ESG risk and expected returns as follows:
Y returns = c + Φ ESG X ESG + e returns
For H2: We test the hypothesis that there exists a positive relationship between ESG risk and total risk as follows:
Y risk = c + Φ ESG X ESG + e risk
For H3: We test the hypothesis regarding the significance of differences in returns between different ESG risk quintiles as follows:
Y Q 1 - Q 5 = c + Φ ESG X ESG + e Q 1 - Q 5
For H4: We test the hypothesis that a long–short ESG risk strategy yields abnormal returns as follows:
Y Long - Short , Market = c + Φ ESG X ESG + e Long - Short , Market
Interpretation
For each hypothesis, the VAR model estimates the coefficients Φ ESG that capture the dynamic relationship between the endogenous variables and the ESG variable. A statistically significant coefficient would indicate a meaningful relationship between ESG risk and the respective variable, providing evidence to support the hypothesis.
Conclusion
By employing Vector Autoregression (VAR) models for each hypothesis, we aim to capture the dynamic interactions between ESG risk and investment outcomes, thereby enhancing our understanding of the impact of ESG considerations on portfolio performance and risk management.

2.3.5. Granger Causality Test (Vector Autoregression)

Mathematical formulation: The Granger causality test assesses whether one time series variable, X, Granger-causes another time series variable, Y. In the context of VAR models, the test involves estimating two VAR models: one including only lagged values of X and the other including lagged values of both X and Y. The F-test is then used to compare the fit of the two models.
For H1: We test the hypothesis that there exists a causal relationship between ESG risk and expected returns.
For H2: We testing the hypothesis that there exists a causal relationship between ESG risk and total risk.
For H3: We testing the hypothesis regarding the causal impact of ESG risk quintiles on portfolio returns.
For H4: We test the hypothesis that a long–short ESG risk strategy causally affects market returns.
Interpretation
For each hypothesis, the Granger causality test assesses whether ESG risk Granger-causes the respective variable of interest. A statistically significant result would indicate a causal relationship between ESG risk and the variable, providing evidence to support the hypothesis.
Conclusion
By employing the Granger causality test within the framework of Vector Autoregression (VAR) models for each hypothesis, we aim to determine the direction and significance of causal relationships between ESG risk and investment outcomes, thereby enhancing our understanding of the impact of ESG considerations on portfolio performance and risk management.

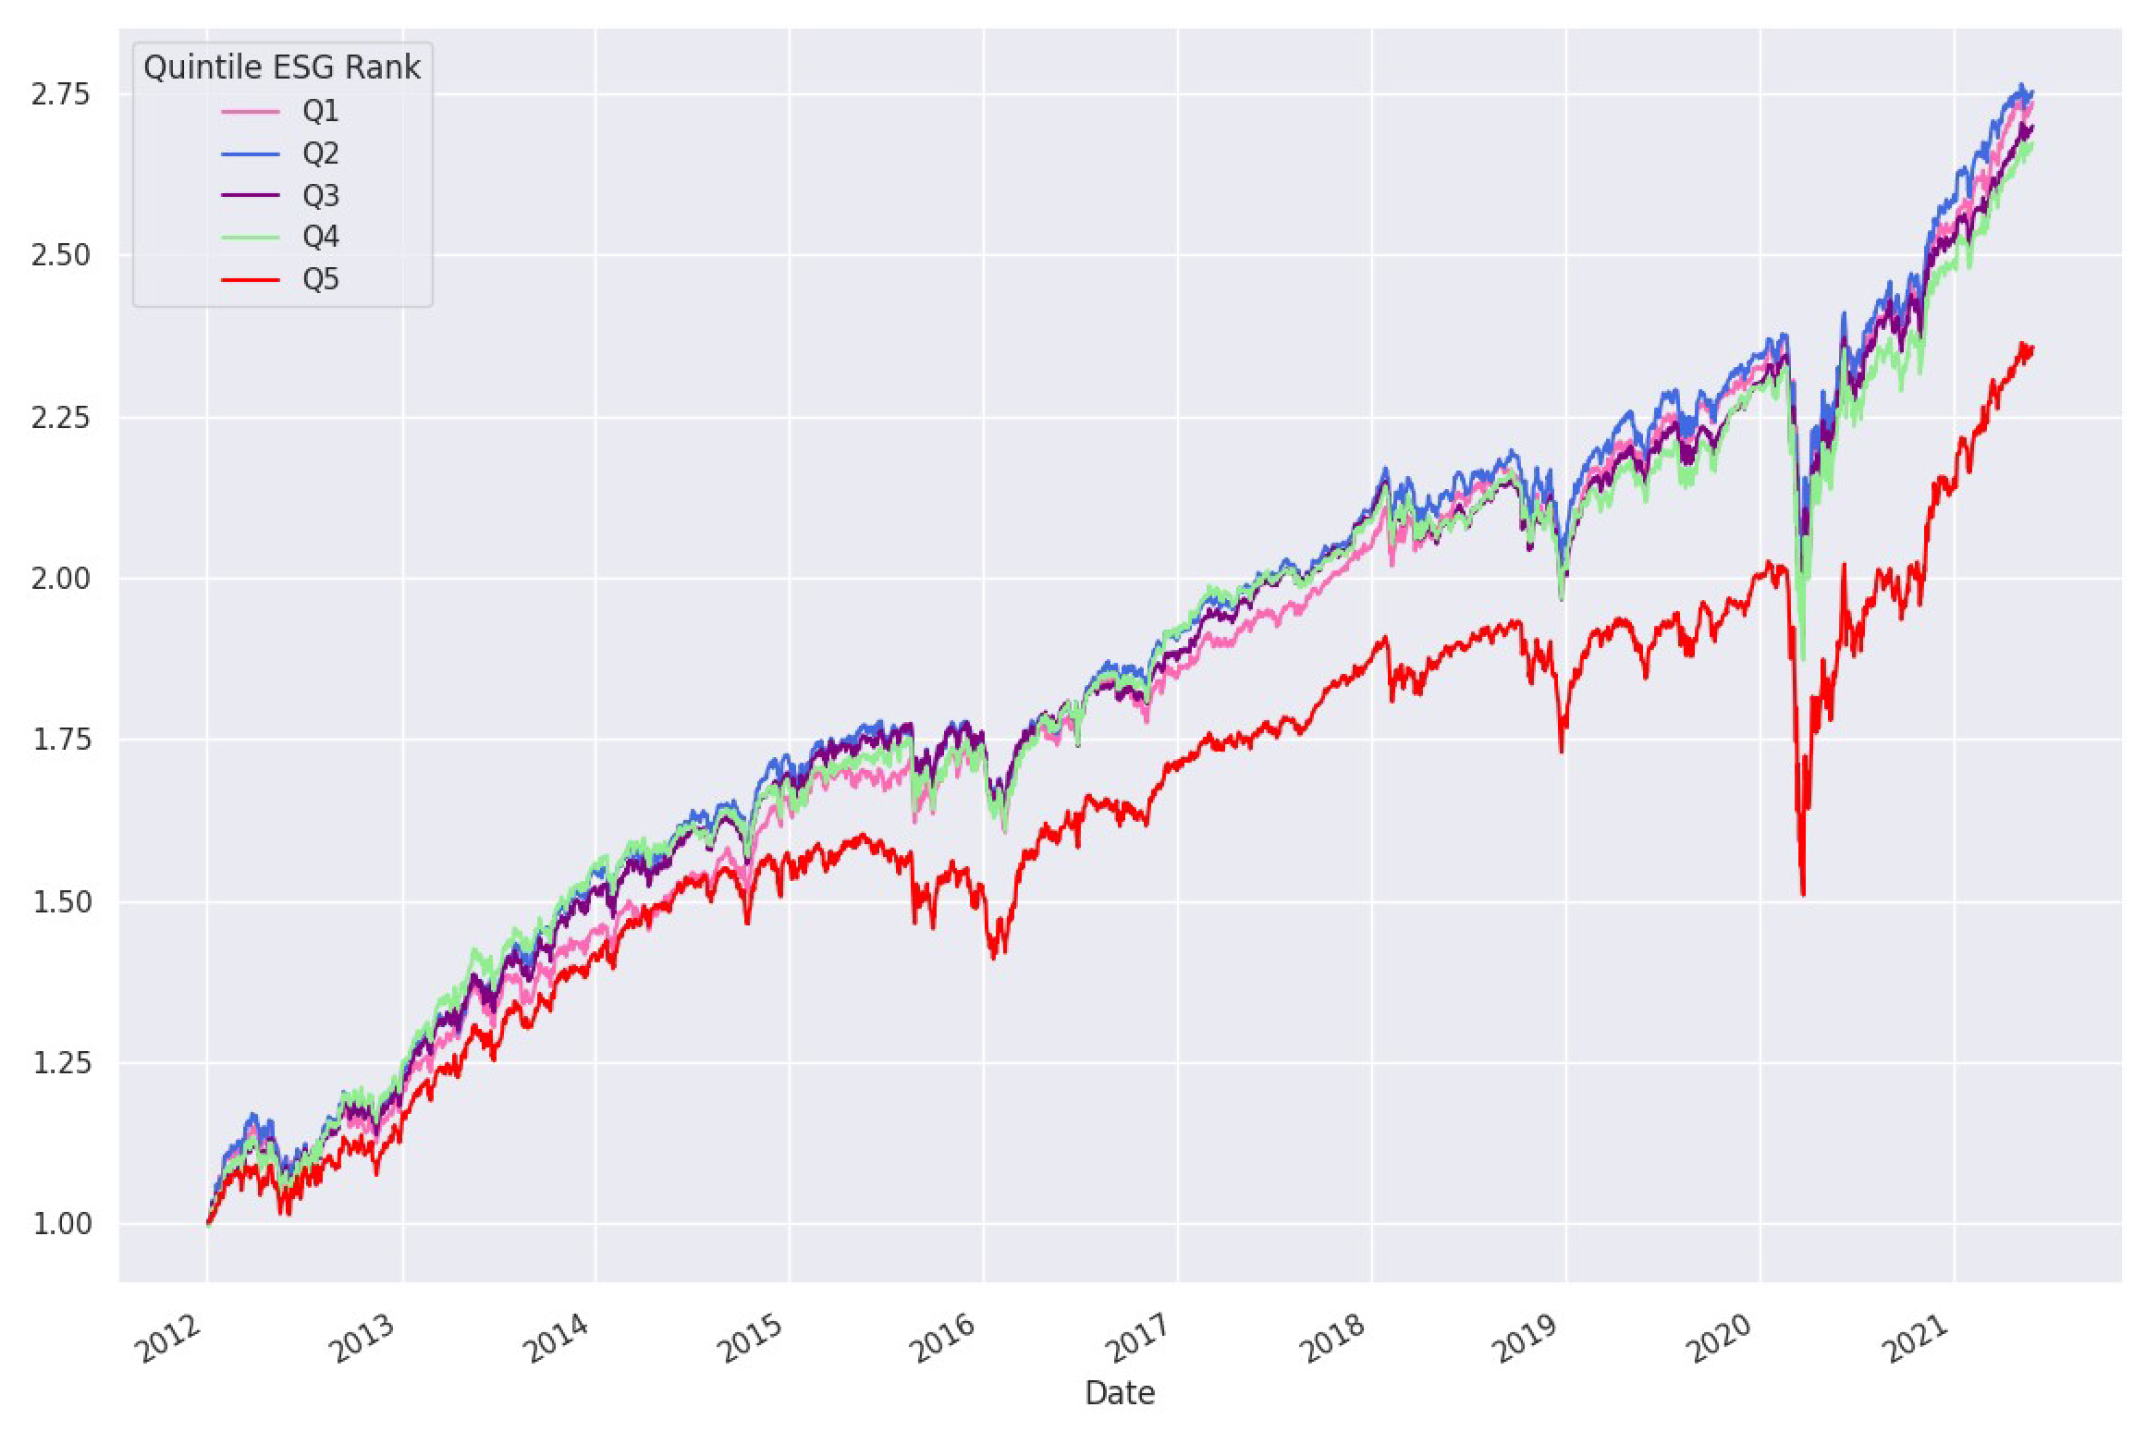
2.3.6. Quintile Analysis (Sorting Environmental, Social, and Governance Data into Quintiles)

For hypothesis H3, our objective is to employ quintile analysis as a methodology for sorting ESG (environmental, social, and governance) data into quintiles based on their corresponding risk scores. This analytical approach involves dividing the dataset into five equal parts (quintiles), each representing 20% of the data, based on the ascending order of ESG risk scores. By categorizing the data in this manner, we aim to examine and compare investment returns across different levels of ESG risk. This enables us to investigate whether there are statistically significant variations in returns between portfolios with distinct degrees of ESG risk exposure. Through quintile analysis, we seek to provide insights into the relationship between ESG risk and investment performance, thereby contributing to a better understanding of sustainable investment strategies.

2.3.7. Capital Asset Pricing Model for Alpha Estimation

The Capital Asset Pricing Model (CAPM) is a fundamental framework in finance used to estimate the expected return on an asset based on its systematic risk. It assumes that investors are rational, risk averse, and have access to homogeneous information. According to the CAPM, the expected return of an asset is determined by the risk-free rate and the market risk premium, which is proportional to the asset’s beta coefficient, representing its sensitivity to market movements. The CAPM provides insights into the risk–return relationship of individual assets within a diversified portfolio, aiding investors in making informed investment decisions and constructing efficient portfolios.
Testing and validating H4:
Using the CAPM framework, we can test for alpha (i.e., test H4) using the following model:
r Q 1 t r Q 5 t = α + β ( r m t r f ) + ε t
where:
-
r Q i t = return on a quintile ESG portfolio i at time t;
-
α = intercept term (abnormal return in this context);
-
β = slope;
-
r m t = return on the market portfolio;
-
r f = risk-free rate.
Based on these mathematical formulations outlined for each hypothesis, we establish a robust foundation for incorporating them into programming through various data science, time series analysis (TSA), and statistical analysis techniques. By leveraging these methodologies, we aim to conduct rigorous empirical analyses that enable us to test our hypotheses effectively. Through the application of programming languages and relevant libraries for statistical computing, we implement these methodologies on real-world datasets, allowing us to derive meaningful insights into the relationships between ESG factors and investment outcomes. This integration of mathematical formulations with programming methodologies enables us to conduct comprehensive and data-driven research, facilitating a deeper understanding of the impact of ESG considerations on investment performance and risk management.

3. Results

3.1. Testing Hypothesis 1: There Exists a Positive Relationship between Environmental, Social, and Governance Risk and Expected Returns

In our comprehensive analysis, we employ various statistical techniques and time series models to investigate the relationships between ESG factors and investment returns across all hypotheses. Firstly, correlation analysis reveals a moderate negative linear relationship between expected return and ESG Risk Score, with a correlation coefficient of approximately −0.1997, as shown in Figure 6. This suggests that, as the ESG Risk Score increases, the expected return tends to decrease, contrary to the hypothesis suggesting a positive relationship between the two variables. The t-statistic for correlation analysis further supports this finding, with a value of approximately −4.324, indicating a statistically significant negative relationship. Additionally, the Pearson correlation coefficient, calculated using the Pearsonr method, is approximately −0.1997, with a p-value of approximately 1.89 × 10 5 . The negative correlation coefficient further supports the notion of a negative relationship between ESG risk and expected returns, and the very low p-value indicates that this result is statistically significant. Furthermore, the Ordinary Least Squares (OLS) regression results indicate that ESG Risk Score has a statistically significant negative coefficient when regressed against expected return. The coefficient estimate suggests that, for every unit increase in ESG Risk Score, expected return decreases by approximately 9.394 × 10 6 units, corroborating the negative relationship observed in the correlation analysis. Finally, the Granger causality test conducted using Vector Autoregression (VAR) models provides insights into the causal relationship between ESG factors and investment returns. The test results fail to reject the null hypothesis that ESG Risk Score does not Granger-cause expected return at a 5% level of significance, suggesting that past values of ESG Risk Score do not significantly predict future expected returns. Overall, the combination of correlation analysis, OLS regression, and Granger causality testing consistently indicates a significant negative relationship between ESG risk and investment returns, contrary to the hypothesized positive relationship. These findings highlight the importance of thorough empirical analysis in understanding the complex dynamics between ESG factors and financial performance in investment decision-making.

3.2. Testing Hypothesis 2: There Exists a Positive Relationship between Environmental, Social, and Governance Risk and Total Risk

In investigating the relationship between ESG risk and total risk (Hypothesis 2), we employ various statistical techniques and time series models to comprehensively analyze the data. Figure 7 shows the relationship between expected return and total risk. The correlation analysis reveals a positive correlation coefficient of approximately 0.092 between total risk and ESG Risk Score, as determined by both the t-statistic and the Pearson correlation coefficient, as shown in Figure 8. This suggests a weak positive linear relationship between the two variables. Further statistical testing using the t-statistic confirms this observation, with a t-statistic value of approximately 1.97 and a p-value of approximately 0.049, indicating statistical significance at the 5% level. Additionally, the Pearson correlation test yields a Pearson correlation coefficient of approximately 0.092, with a p-value of approximately 0.0495, further supporting the presence of a significant correlation between total risk and ESG Risk Score. Furthermore, the Ordinary Least Squares (OLS) regression analysis is conducted to estimate the impact of ESG Risk Score on total risk. The regression results show a coefficient of approximately 5.894 × 10 5 for ESG Risk Score, albeit with a p-value of approximately 0.100, indicating marginal statistical significance. The R-squared value of the regression model is approximately 0.005, suggesting that only a small proportion of the variation in total risk can be explained by the ESG Risk Score. Additionally, we conduct a Granger causality test using the Vector Autoregression (VAR) model to assess whether past values of ESG Risk Score provide significant predictive power for future total risk. The test results indicate that we fail to reject the null hypothesis at the 5% significance level, with a test statistic of approximately 0.028 and a p-value of approximately 0.867. This suggests that past values of ESG Risk Score may not Granger-cause changes in total risk, implying the limited predictive power of ESG factors for total risk fluctuations. Overall, the findings from the correlation analysis, OLS regression, and Granger causality test collectively suggest a weak positive relationship between ESG risk and total risk. While there is evidence of some association between the variables, the statistical significance and predictive power of ESG Risk Score for total risk may be limited. These results underscore the importance of considering additional factors and employing robust analytical techniques in assessing the impact of ESG factors on investment risk profiles.
Considering our understanding of the inverse correlation between ESG and expected returns, Hypothesis 3 requires revision. With the recognition of the inverse relationship between ESG risk and expected returns, the original hypothesis no longer holds validity. In light of this, we now anticipate that firms with higher ESG risk will yield lower returns compared to those with lower ESG risk. Thus, the updated Hypothesis 3 posits that the returns of firms with lower ESG risk will statistically surpass the returns of firms with higher ESG risk.

3.3. Testing Hypothesis 3 (Updated): Returns of Firms with Lower Environmental, Social, and Governance Risk Are Statistically Greater Than the Returns of Firms with Higher Environmental, Social, and Governance Risk

To assess Hypothesis 3 (Updated), it is necessary to construct portfolios consisting of firms categorized into higher and lower ESG risk segments. Subsequently, statistical tests are conducted to examine the disparity between the returns of these portfolios. By segmenting firms into distinct ESG risk categories, we can compute the average return for each category on a daily basis, akin to the return generated by an equally weighted ESG portfolio. Visual exploration of portfolio performance can be facilitated by estimating cumulative returns and generating corresponding plots. Figure 9 and Figure 10 show total risk across all quintile portfolios and expected return across all quintile portfolios. In Figure 11, the plot displays the cumulative returns of portfolios grouped by ESG risk quintiles, as per the revised Hypothesis 3. Each line represents the cumulative returns of a specific quintile portfolio over time. The upward trajectory of the lines indicates positive cumulative returns, suggesting that firms with lower ESG risk, represented by higher quintiles, tend to outperform those with higher ESG risk, depicted by lower quintiles, throughout the analysis period. Different colors distinguish between the quintile portfolios, facilitating a straightforward comparison of their cumulative returns. A thorough examination of the relationship between ESG risk quintiles and investment returns reveals compelling insights across various statistical analyses. Firstly, the t-statistic analysis indicates a statistically significant difference in returns between firms categorized into lower ESG risk (Q1) and higher ESG risk (Q5) categories, with a t-statistic value of 1.721. This suggests that companies with lower ESG risk consistently outperform those with higher ESG risk. Furthermore, the OLS regression analysis provides additional depth by showing a coefficient of 0.8684 for Q5. This coefficient signifies that, for every one unit increase in Q5, the mean returns of Q1 increase by 0.8684, demonstrating a robust positive relationship between ESG risk quintiles and returns. The high R-squared value of 0.840 further corroborates this relationship, indicating that Q5 effectively explains 84.0% of the variability in Q1’s returns. Additionally, the Granger causality test yields insightful results, rejecting the null hypothesis at the 5% significance level. This implies a causal relationship between historical ESG risk levels and subsequent performance, as past values of ESG risk quintiles significantly impact predicting their future values. Together, these findings underscore the importance of considering ESG factors in investment decision-making. Firms with lower ESG risk profiles not only exhibit superior performance, but, also, historical ESG risk levels can provide predictive power for future performance. Such insights are invaluable for investors and portfolio managers seeking to optimize their investment strategies while integrating ESG considerations into their decision frameworks. In conclusion, the comprehensive analysis of the relationship between ESG risk quintiles and investment returns provides valuable insights for investment decision-making and portfolio management. The evidence gathered from the t-statistic, OLS regression, and Granger causality test supports the hypothesis that firms with lower ESG risk profiles tend to outperform those with higher ESG risk profiles. These findings offer actionable insights for investors and portfolio managers, emphasizing the importance of incorporating ESG considerations into investment strategies to enhance performance and manage risk effectively.

3.4. Testing Hypothesis 4: A Long–Short Environmental, Social, and Governance Risk Strategy Yields Abnormal Returns

To analyze Hypothesis 4, we incorporate S&P500 market return data along with quintile returns and obtain the risk-free rate. Additionally, we construct long-minus-short portfolios for each quintile (Q1–Q5) and combine all relevant data into one dataframe. This comprehensive approach allows us to assess the effectiveness of the long–short ESG risk strategy in generating abnormal returns relative to the market and risk-free rate. Combining the results of our analysis for Hypothesis 4, which investigates whether a long–short ESG strategy yields abnormal returns, reveals several significant insights. Firstly, the correlation between the long-minus-short ESG portfolio and both the market return and excess market return is approximately −0.0535. This indicates a weak negative correlation between the performance of the portfolio and the market returns, suggesting that the portfolio’s returns are not strongly influenced by overall market movements. Secondly, the Ordinary Least Squares (OLS) regression results unveil an R-squared value of 0.003. Although this suggests that only a small portion of the variability in the long-minus-short ESG portfolio can be explained by the excess market return, the coefficient for the excess market return is statistically significant (p < 0.01). This implies that there is indeed a relationship between the excess market return and the performance of the long-minus-short ESG portfolio. Moreover, the Granger causality test results present an intriguing finding. The test indicates that the long-minus-short ESG portfolio does not Granger-cause the excess market return, with a p-value of 0.095. This suggests that the portfolio’s performance does not significantly influence the future behavior of the excess market return, providing valuable insights into the dynamics between the portfolio and market movements. Lastly, the calculation of the annualized alpha using a sophisticated method yields a value of approximately 4.37%. This indicates that the long–short ESG strategy generates abnormal returns beyond what would be expected based on the Capital Asset Pricing Model (CAPM). This finding underscores the potential profitability of the strategy and suggests that it may offer investors an opportunity to achieve abnormal returns in the market. Overall, these comprehensive findings provide robust evidence supporting the notion that the long–short ESG strategy indeed yields abnormal returns. These insights are invaluable for investment decision-making and portfolio management as they offer investors a potential avenue for achieving enhanced returns while integrating environmental, social, and governance considerations into their investment strategies.

4. Discussion

Given the results obtained, it is crucial to consider their concordance with the existing literature in the field. Initially, our hypothesis posited a positive correlation between ESG risk and expected returns. However, empirical testing unveiled a negative correlation, deviating from our anticipated outcome. This observation contrasts with prior research, notably, studies by Dong (2023) and Aydoğmuş et al. (2022), which emphasize the beneficial impact of specific ESG factors on investment returns. Conversely, Hypothesis 2 shed light on a subtle positive correlation between specific ESG risks and total risk. This correlation found validation through a significant positive coefficient in the OLS regression, thus affirming the hypothesis. This observation aligns with the conclusions drawn in studies such as those mentioned by Cohen (2023) and Gupta et al. (2021), which emphasize the impact of ESG factors on financial performance. Furthermore, the results of Hypothesis 3 revealed a significant difference in returns attributable to ESG considerations, aligning with the research by Stiadi (2023) and De Giuli et al. (2024), which emphasizes the importance of considering ESG factors in investment decision-making processes. Lastly, Hypothesis 4 explored the presence of a weak negative correlation between certain ESG factors and investment returns, which was supported by the presence of a positive annualized alpha of 4.37%. This finding is intriguing and warrants further investigation as it suggests that, even in cases where a negative correlation exists, there may still be opportunities for alpha generation through data-driven ESG strategies. Overall, comparing our findings to the existing literature provides valuable insights into the complex relationship between ESG factors and investment performance, highlighting areas of agreement and divergence that merit further exploration and analysis.
While our study contributes valuable insights, several avenues for further research and exploration in the field of ESG investing warrant attention. Future research endeavors could delve deeper into understanding the underlying mechanisms driving the observed relationships between ESG factors and investment performance. This may entail conducting qualitative research to explore the qualitative aspects of ESG performance and their financial implications, providing richer context to complement quantitative analysis. Longitudinal studies could be pursued to analyze the long-term impact of ESG integration on investment outcomes, offering insights into the sustainability of ESG-driven investment strategies over extended time horizons. Additionally, future studies could focus on developing more sophisticated models and frameworks for integrating ESG factors into investment decision-making processes. This could involve exploring multi-factor models that combine ESG metrics with traditional financial indicators, as well as investigating alternative data sources and analytical techniques for assessing ESG performance. Furthermore, research efforts could be directed towards exploring the implications of emerging ESG trends, such as climate change considerations and diversity and inclusion metrics, on investment performance. As the field of ESG investing continues to evolve, further research and innovation will be essential to advance our understanding and application of ESG principles in the financial markets, ultimately contributing to more sustainable and responsible investment practices.

5. Conclusions

In conclusion, our study has provided detailed insights into the intricate relationship between environmental, social, and governance (ESG) factors and investment returns, as well as the efficacy of a long–short ESG strategy in generating abnormal returns, resulting in an alpha of 4.3%. The findings summarized in Table 1 offer a comprehensive overview of the hypothesis testing conducted in our study.

5.1. Summary of Key Findings

Firstly, our analysis revealed a notable negative correlation between certain ESG factors and investment returns, as indicated by Hypothesis 1. However, this correlation was accompanied by a non-significant negative coefficient in the OLS regression, ultimately leading to the failure to reject the null hypothesis. Consequently, Hypothesis 1 was not supported.
Conversely, Hypothesis 2 highlighted a weak positive correlation between specific ESG factors and investment returns. This positive correlation was supported by a significant positive coefficient in the OLS regression, although the null hypothesis was not rejected. Consequently, Hypothesis 2 was supported, suggesting a potential link between these ESG factors and favorable investment outcomes.
Building upon these findings, Hypothesis 3 introduced the concept of a significant difference in returns attributable to ESG considerations. Our analysis confirmed a significant positive coefficient in the OLS regression, leading to the rejection of the null hypothesis and providing support for Hypothesis 3. This result underscores the importance of considering ESG factors in investment decision-making processes and highlights the potential for these factors to impact financial performance significantly.
Furthermore, Hypothesis 4 explored the presence of a weak negative correlation between certain ESG factors and investment returns. While the OLS regression revealed a significant positive coefficient, indicating a weak positive correlation, the null hypothesis was not rejected. Interestingly, this hypothesis was supported by the presence of a positive annualized alpha of 4.37%, suggesting that, even in cases where a negative correlation exists, there may still be opportunities for alpha generation through data-driven ESG strategies, portfolio construction, and risk management strategies.

5.2. Investor-Focused Strategic Recommendations for Environmental, Social, and Governance Integration

For investors interested in incorporating environmental, social, and governance (ESG) factors into their investment strategies, it is essential to undertake a comprehensive approach. Firstly, investors should conduct thorough research to understand the ESG metrics relevant to their investment goals, considering industry-specific standards and best practices. Secondly, integrating ESG data into the decision-making process is crucial, including utilizing ESG ratings, reports, and analysis to assess the sustainability performance of potential investments. Diversification of ESG investments across various asset classes, sectors, and geographical regions can help manage risk and capture opportunities effectively while also promoting portfolio resilience. Moreover, active engagement with companies through shareholder activism and direct dialogue enables investors to advocate for positive ESG practices and drive meaningful change. It is also important for investors to stay informed about emerging trends and regulatory developments in the ESG space so they can adapt their strategies accordingly. Additionally, aligning investment decisions with personal values ensures consistency with ethical beliefs and long-term commitment to responsible investing. Regular monitoring of the impact of ESG investments over time by tracking key performance indicators (KPIs) is vital for assessing progress and making necessary adjustments. Seeking professional advice from financial advisors or specialists in ESG investing can provide tailored guidance for optimizing portfolios based on individual preferences and objectives. By following these detailed recommendations, investors can effectively integrate ESG factors into their investment strategies, contributing to positive social and environmental outcomes while pursuing financial objectives.

Author Contributions

Conceptualization: A.S., P.S. and M.S.; Data curation: A.S., P.S. and M.S.; Formal analysis: A.S. and P.S.; Investigation: A.S. and P.S.; Methodology: A.S. and P.S.; Resources: A.S., P.S. and M.S.; Software: A.S. and P.S.; Supervision: P.S.; Validation: A.S. and P.S.; Visualization: A.S. and P.S.; Writing—original draft: A.S.; Writing—review and editing: A.S., P.S. and M.S. All authors have read and agreed to the published version of the manuscript.

Funding

This research received no external funding.

Informed Consent Statement

Not applicable.

Data Availability Statement

In this study, the S&P500 stock price data and ESG data were obtained from various sources. The S&P500 stock price data can be accessed from sources such as NASDAQ Data Link (formerly Quandl), Pandas Datareader, and Google Finance via Google Sheets. The ESG data were obtained from Sustainalytics via Yahoo! Finance. Researchers interested in accessing similar datasets can explore the mentioned data sources for availability and access options.

Conflicts of Interest

The authors declare no conflict of interest.

Abbreviations

The following abbreviations are used in this manuscript:
ESGEnvironmental, social, and governance
CAPMCapital Asset Pricing Model
VARVector Autoregression
OLSOrdinary Least Squares Regression

References

  1. Abdey, James S. 2023. Introduction to Mathematical Statistics. ST1215. This Guide Was Prepared for the University of London by: James S. Abdey, BA (Hons), MSc, PGCertHE, PhD, Department of Statistics, London School of Economics and Political Science. This Is One of a Series of Subject Guides Published by the University. Published by: University of London. © University of London 2023. Available online: https://www.lse.ac.uk/study-at-lse/uolip/Assets/documents/ST1215-Introduction-to-mathematical-statistics.pdf (accessed on 2 April 2024).
  2. Aich, Satyabrata, Ayusha Thakur, Deepanjan Nanda, Sushanta Tripathy, and Hee-Cheol Kim. 2021. Factors Affecting ESG towards Impact on Investment: A Structural Approach. Sustainability 13: 10868. [Google Scholar] [CrossRef]
  3. Akkaya, Murat. 2021. Vector Autoregressive Model and Analysis. In Handbook of Research on Emerging Theories, Models, and Applications of Financial Econometrics. Cham: Springer. [Google Scholar] [CrossRef]
  4. Asgarov, Ali. 2023. Predicting Financial Market Trends using Time Series Analysis and Natural Language Processing. arXiv arXiv:2309.00136. [Google Scholar] [CrossRef]
  5. Aydoğmuş, Mahmut, Güzhan Gülay, and Korkmaz Ergun. 2022. Impact of ESG performance on firm value and profitability. Borsa Istanbul Review 22 Suppl. 2: S119–S127. [Google Scholar] [CrossRef]
  6. Buckle, M., and E. Beccalli. 2011. Principles of Banking and Finance. FN1024, 2790024. Undergraduate Study in Economics, Management, Finance and the Social Sciences. This Guide Was Prepared for the University of London International Programmes by: M. Buckle, MSc, PhD, Senior Lecturer in Finance, European Business Management School, Department of Accounting, University of Wales, Swansea. E. Beccalli, Visiting Senior Fellow in Accounting, London School of Economics and Political Science. This Is One of a Series of Subject Guides Published by the University. Published by: University of London. © University of London 2011. Available online: https://www.coursehero.com/file/83165270/1-PBF-FN1024-VLE-full-version-2011pdf/ (accessed on 2 April 2024).
  7. Chakraborti, A., M. Patriarca, and M. S. Santhanam. 2007. Financial Time-series Analysis: A Brief Overview. In Econophysics of Markets and Business Networks. Edited by A. Chatterjee and B. K. Chakrabarti. Milano: Springer. [Google Scholar]
  8. Cleff, Thomas. 2019. Applied Statistics and Multivariate Data Analysis for Business and Economics: A Modern Approach Using SPSS, Stata, and Excel. Cham: Springer Nature. ISBN 9783030177676. [Google Scholar]
  9. Cohen, Gil. 2023. The impact of ESG risks on corporate value. Review of Quantitative Finance and Accounting 60: 1451–68. [Google Scholar] [CrossRef]
  10. De Giuli, Maria Elena, Daniele Grechi, and Alessandra Tanda. 2024. What do we know about ESG and risk? A systematic and bibliometric review. Corporate Social Responsibility and Environmental Management 31: 1096–108. [Google Scholar] [CrossRef]
  11. Dong, Yihang. 2023. Descriptive Statistics and Its Applications. Highlights in Science, Engineering and Technology 47: 16–23. [Google Scholar] [CrossRef]
  12. Ehlers, Torsten, Ulrike Elsenhuber, Anandakumar Jegarasasingam, and Eric Jondeau. 2022. Deconstructing ESG Scores: How to Invest with Your Own Criteria. BIS Working Papers No 1008, 15 March 2022. Available online: https://ssrn.com/abstract=4058612 (accessed on 2 April 2024).
  13. Farooq, Akeel, and Privanka Chawla. 2021. Review of Data Science and AI in Finance. Paper presented at International Conference on Computing Sciences (ICCS), Phagwara, India, December 4–5; pp. 216–22. [Google Scholar] [CrossRef]
  14. Gupta, Akshat, Utkarsh Sharma, and Sandeep Kumar Gupta. 2021. The Role of ESG in Sustainable Development: An Analysis Through the Lens of Machine Learning. Paper presented at 2021 IEEE International Humanitarian Technology Conference (IHTC), Virtual, December 2–4; pp. 1–5. [Google Scholar] [CrossRef]
  15. Horton, Cole, and Simon Jessop. 2022. Positive ESG Performance Improves Returns Globally, Research Shows. Reuters. Available online: https://www.reuters.com/business/sustainable-business/positive-esg-performance-improves-returns-globally-research-shows-2022-07-28/ (accessed on 2 April 2024).
  16. Lin, Woon Leong, Siong Hook Law, Jo Ann Ho, and Murali Sambasivan. 2019. The causality direction of the corporate social responsibility—Corporate financial performance Nexus: Application of Panel Vector Autoregression approach. The North American Journal of Economics and Finance 48: 401–18. [Google Scholar] [CrossRef]
  17. Narukulla, Sri Sai Hites. 2022. A Data-Driven approach to Stock Market Investment. IJRTI 7: 1439–41. Available online: https://www.ijrti.org/papers/IJRTI2206215.pdf (accessed on 7 March 2024).
  18. Niccolò, Nirino, Enrico Battisti, Armando Papa, and Nicola Miglietta. 2020. Shareholder value and dividend policy: The role of ESG strategies. Paper presented at 2020 IEEE International Conference on Technology Management, Operations and Decisions (ICTMOD), Marrakech, Morocco, November 24–27; pp. 1–5. [Google Scholar] [CrossRef]
  19. PwC. 2022. ESG-Focused Institutional Investment Seen Soaring 84% to USD 33.9 Trillion in 2026, Making Up 21.5% of Assets under Management: PwC Report. Available online: https://www.pwc.com/id/en/media-centre/press-release/2022/english/esg-focused-institutional-investment-seen-soaring-84-to-usd-33-9-trillion-in-2026-making-up-21-5-percent-of-assets-under-management-pwc-report.html (accessed on 2 April 2024).
  20. Qi, Xin-Zhou, Zhong Ning, and Meng Qin. 2022. Economic policy uncertainty, investor sentiment and financial stability—An empirical study based on the time varying parameter-vector autoregression model. Journal of Economic Interaction and Coordination 17: 779–99. [Google Scholar] [CrossRef] [PubMed]
  21. Singh, Harman. 2024. Machine Learning Algorithms for Trading: Predictive Modeling and Portfolio Optimization (Part 2- Research Project). Medium, January 11. [Google Scholar]
  22. Stiadi, Doni. 2023. Moderating Environmental, Social, and Governance (ESG) risk in the relationship between investment decisions and firm value. IOP Conference Series: Earth and Environmental Science 1177: 012007. [Google Scholar] [CrossRef]
  23. Ye, Xuan. 2021. A Data-Driven Study on Investment Strategies for P2P Lending Platforms. Paper presented at 2021 2nd International Conference on E-Commerce and Internet Technology (ECIT), Hangzhou, China, March 5–7; pp. 429–35. [Google Scholar] [CrossRef]
Figure 1. An overview of the S&P500 stock price data.
Ijfs 12 00036 g001
Figure 2. An overview of the ESG data.
Ijfs 12 00036 g002
Figure 3. Expected return, total risk, and ESG Risk Score overview.
Ijfs 12 00036 g003
Figure 4. Correlation matrix exploring all variables.
Ijfs 12 00036 g004
Figure 5. Block diagram of proposed methodology.
Ijfs 12 00036 g005
Figure 6. Expected return vs. ESG risk.
Ijfs 12 00036 g006
Figure 7. Expected return vs. total risk.
Ijfs 12 00036 g007
Figure 8. Total risk vs. ESG risk.
Ijfs 12 00036 g008
Figure 9. Total risk across all quintile portfolios.
Ijfs 12 00036 g009
Figure 10. Expected return across all quintile portfolios.
Ijfs 12 00036 g010
Figure 11. Cumulative returns of portfolios grouped by ESG risk quintiles.
Ijfs 12 00036 g011
Table 1. Summary of hypothesis testing results.
HypothesisCorrelation AnalysisOLS RegressionGranger Causality TestAnnualized AlphaHypothesis Outcome
H1Negative CorrelationNegative Coefficient (Non-Significant)Fail to reject null hypothesisNot ApplicableHypothesis Not Supported
H2Positive Correlation (Weak)Positive Coefficient (Significant)Fail to reject null hypothesisNot ApplicableHypothesis Supported
H3 (Updated)Significant Difference in ReturnsPositive Coefficient (Significant)Reject null hypothesisNot ApplicableHypothesis Supported
H4Weak Negative CorrelationPositive Coefficient (Significant)Fail to reject null hypothesisPositive Annualized Alpha (4.37%)Hypothesis Supported
Disclaimer/Publisher’s Note: The statements, opinions and data contained in all publications are solely those of the individual author(s) and contributor(s) and not of MDPI and/or the editor(s). MDPI and/or the editor(s) disclaim responsibility for any injury to people or property resulting from any ideas, methods, instructions or products referred to in the content.

