

The Impact of Bank Fintech on Corporate Short-Term Debt for Long-Term Use—Based on the Perspective of Financial Risk

Abstract
1. Introduction
- (1)
- Theoretical Framework Innovation: For the first time, a transmission framework is established that encompasses both the supply side of banking, characterized by “technological empowerment → dual enhancement of capital mobility and liquidity → expansion of long-term lending”, and the demand side of enterprises, marked by “technological empowerment → hardening of financing conditions → proactive risk governance”. This framework elucidates how BankFintech optimizes the capital structure of banks to achieve expansion in long-term lending, as well as how the “hardening” of financing conditions “action-forces” enterprises to proactively engage in risk governance to mitigate the impact of SDLU.
- (2)
- Risk Governance Upgrade: Based on the framework of financial stability, it reveals that FinTech penetrates SDLU for risk identification and mitigation and provides tech-driven solutions for banks’ digital transformation, corporate resilience enhancement, and prevention of systemic maturity structure mismatch risks.
2. Theoretical Analysis and Research Hypothesis Proposal
2.1. BankFintech and the Misuse of Short-Term Debt for Long-Term Purposes
2.2. Supply Side: BankFintech, Capital Liquidity, and Long-Term Financing Supply
2.3. Demand Side: BankFintech, Information Screening, and Proactive Risk Governance
3. Research Design
3.1. Sample Selection and Data Sources
3.2. Variable Measurement
3.2.1. Explained Variable: Short-Term Debt for Long-Term Use by Enterprises (SDLU)
3.2.2. Core Explanatory Variable: Bank Financial Technology (BankFintech)
3.2.3. Mechanism Variables
3.2.4. Control Variables
3.3. Model Construction
3.3.1. Two-Way Fixed Effects Model
3.3.2. Mediating Effect Model
3.4. Statistical Analysis of Key Variables
- (1)
- Overall Trend: From 2013 to 2017, the number of financial technology patents in China’s commercial banks remained at a low level. However, a rapid growth trend emerged post-2018, culminating in a total of 4025 patents by 2022. This reflects a significant improvement in the banking sector’s innovation investment in the financial technology domain over time.
- (2)
- Variance by Bank Type: State-owned large commercial banks experienced an explosive growth in patent numbers post-2020, reaching 3589 patents by 2022. These banks have become the core driving force behind the overall growth in financial technology patents, highlighting their resource advantages and dominant position in financial technology research and development. Stock-holding commercial banks saw a noticeable rise in patent numbers post-2019, peaking at 549 patents in 2021 but falling back to 407 patents in 2022, indicating some fluctuations in their innovation investment. Urban and rural commercial banks have long maintained a low level of patented inventions, particularly rural commercial banks, whose annual patent counts significantly lag behind those of other bank types. This underscores resource constraints and capacity disparities in their financial technology research and development efforts.
- (1)
- 2013–2017: The number of financial technology patents was at an extremely low level, while the non-performing loan ratio continued to rise (from 0.0084 to 0.0153), which reflected that during this period, the application of financial technology in banks was insufficient and risk management relied more on conventional models, making it difficult to effectively curb the rising trend of non-performing loan ratios.
- (2)
- 2018–2020: The number of financial technology patents began to grow gradually, and the non-performing loan ratio showed a moderating trend (from 0.0135 down to 0.0123), indicating that the application of financial technology patents might have enhanced the banks’ ability to identify and manage risks, with technological means playing a positive role in reducing non-performing loan ratios.
- (3)
- 2021–2022: The number of financial technology patents experienced explosive growth (reaching a peak value in 2022), but the non-performing loan ratio slightly increased (from 0.01212 to 0.0134). This phase requires a comprehensive consideration of complex factors such as the external economic environment. Although increased investment in financial technology, if macroeconomic fluctuations and other shocks exceed the effects of technological optimization, it may still lead to short-term fluctuations in non-performing loan ratios. However, in the long run, it still demonstrates the potential supportive role of accumulated financial technology patents in bank risk control.
4. Empirical Results
4.1. Benchmark Regression Result
4.2. Robustness Tests
4.2.1. Substitution of Core Explanatory Variables
4.2.2. Substitution of Explained Variables
4.2.3. Instrumental Variable Approach
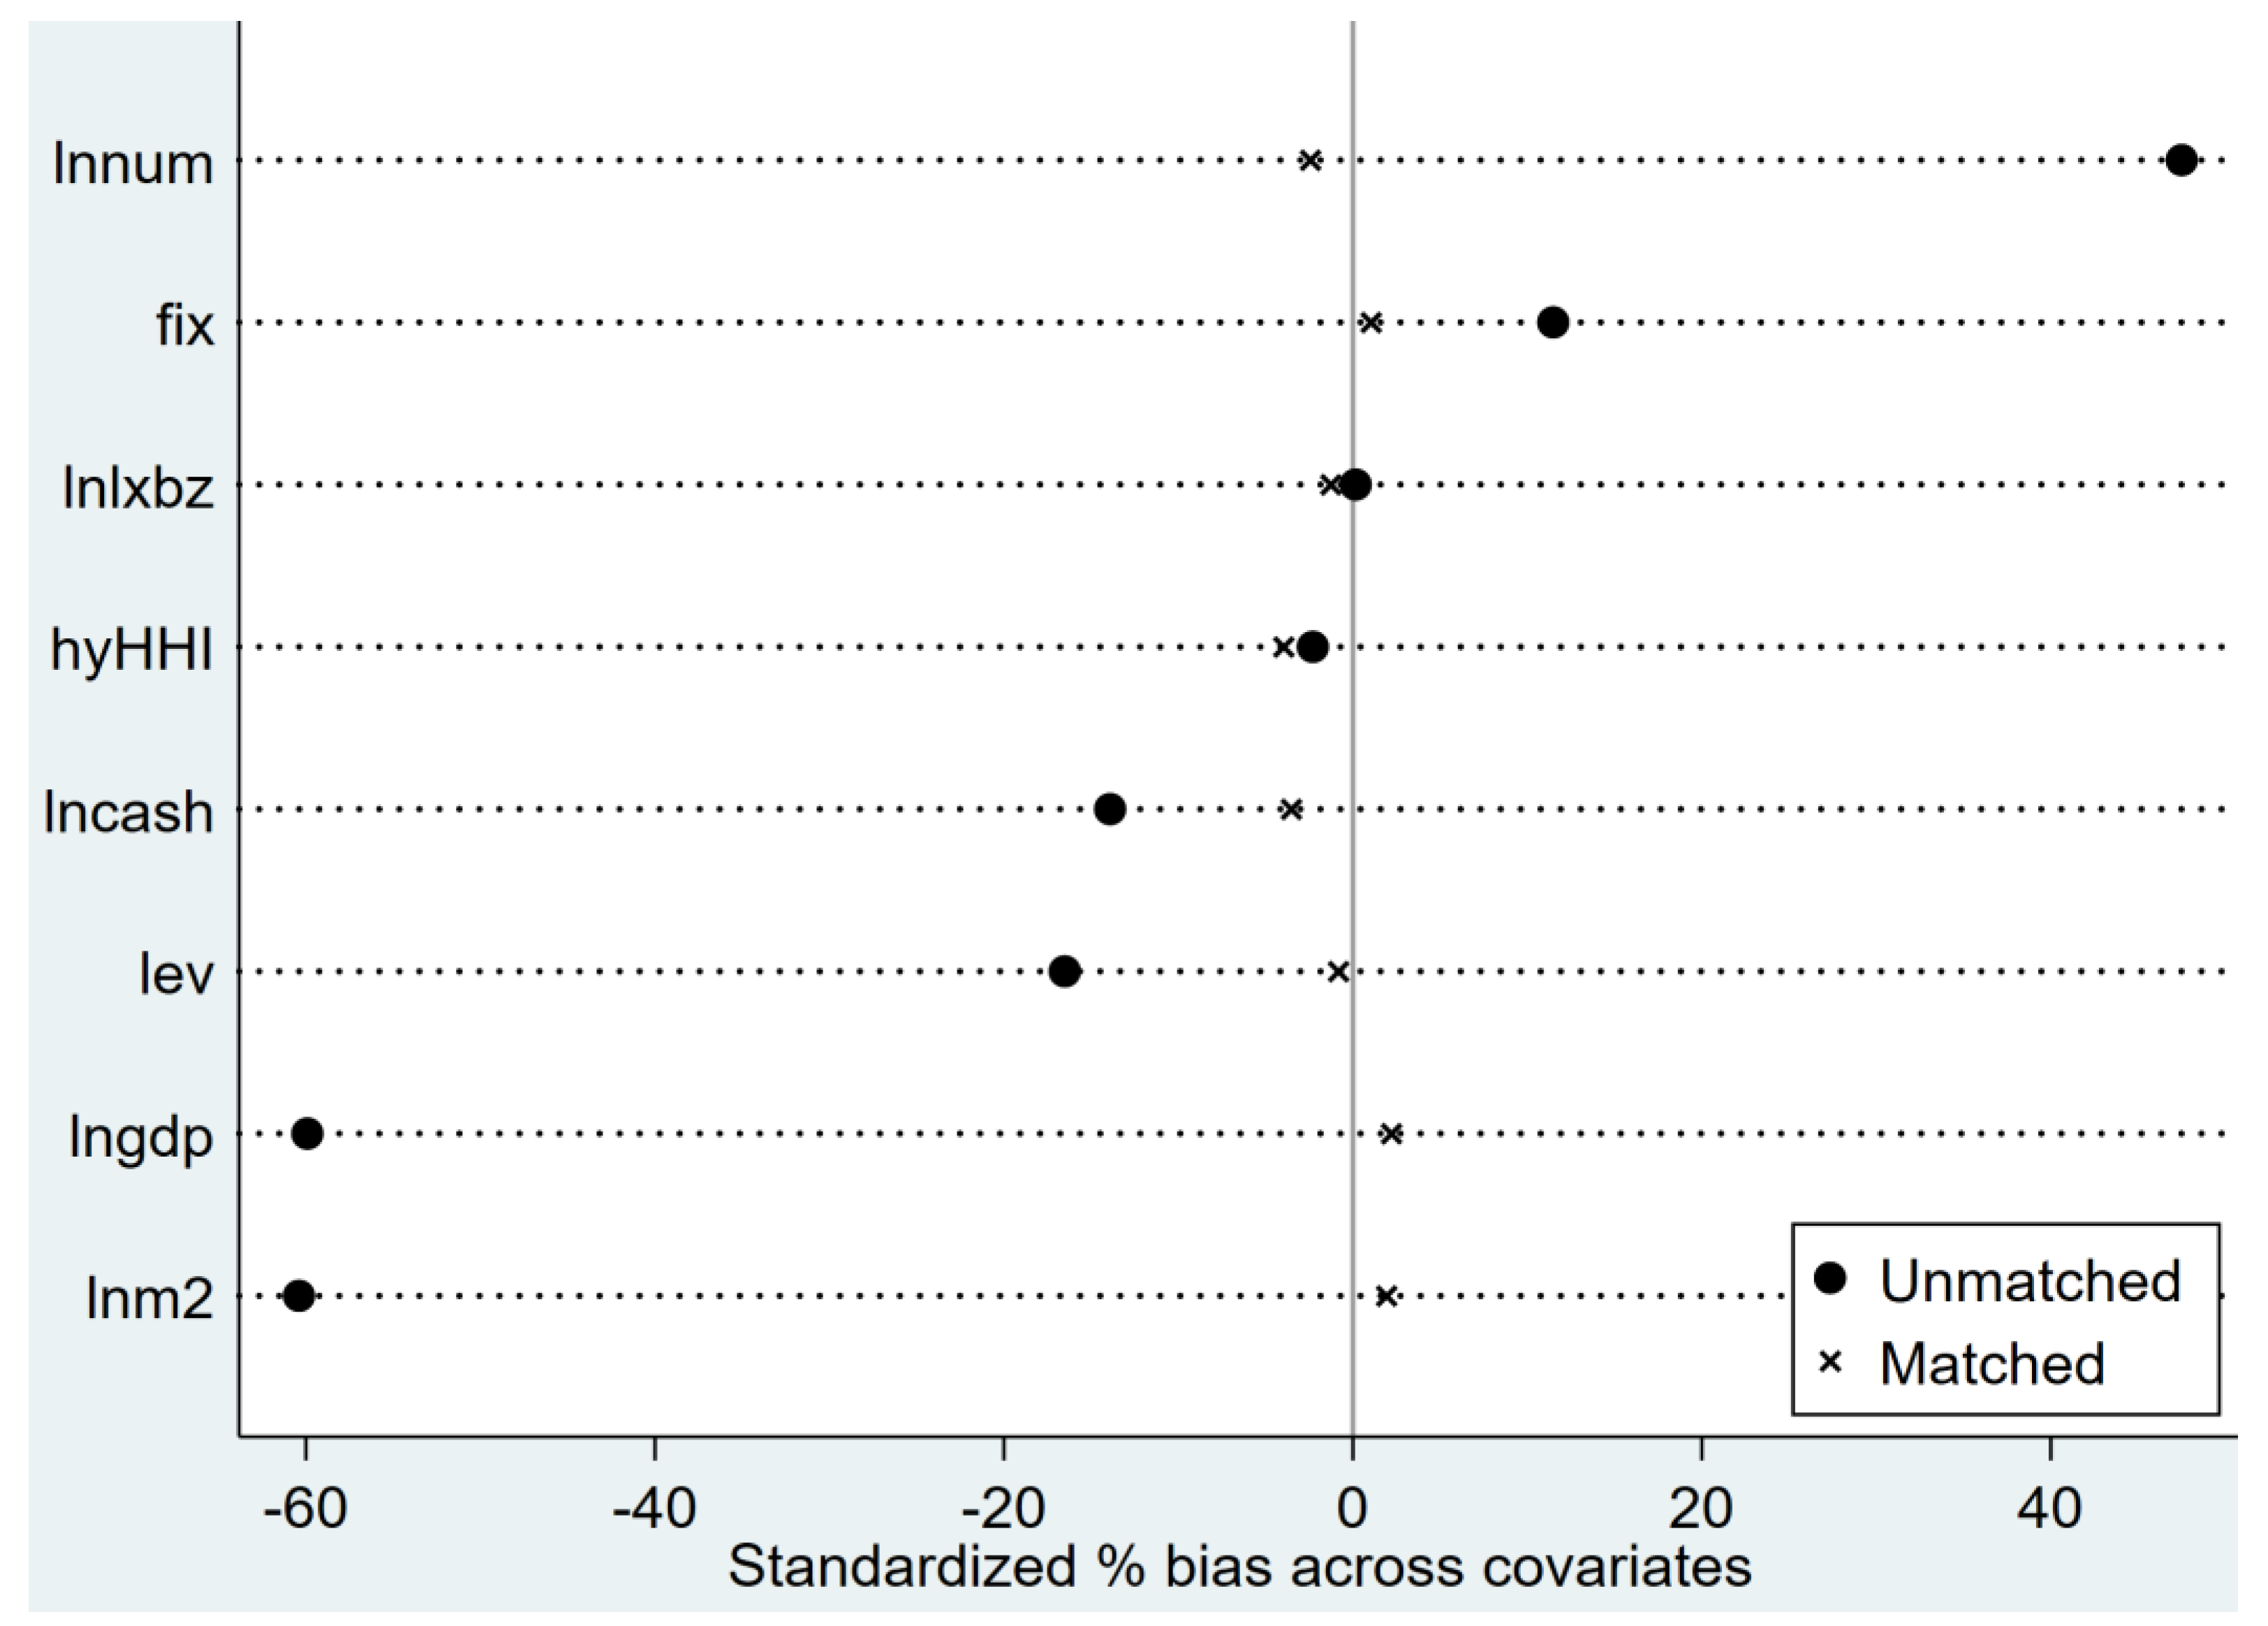
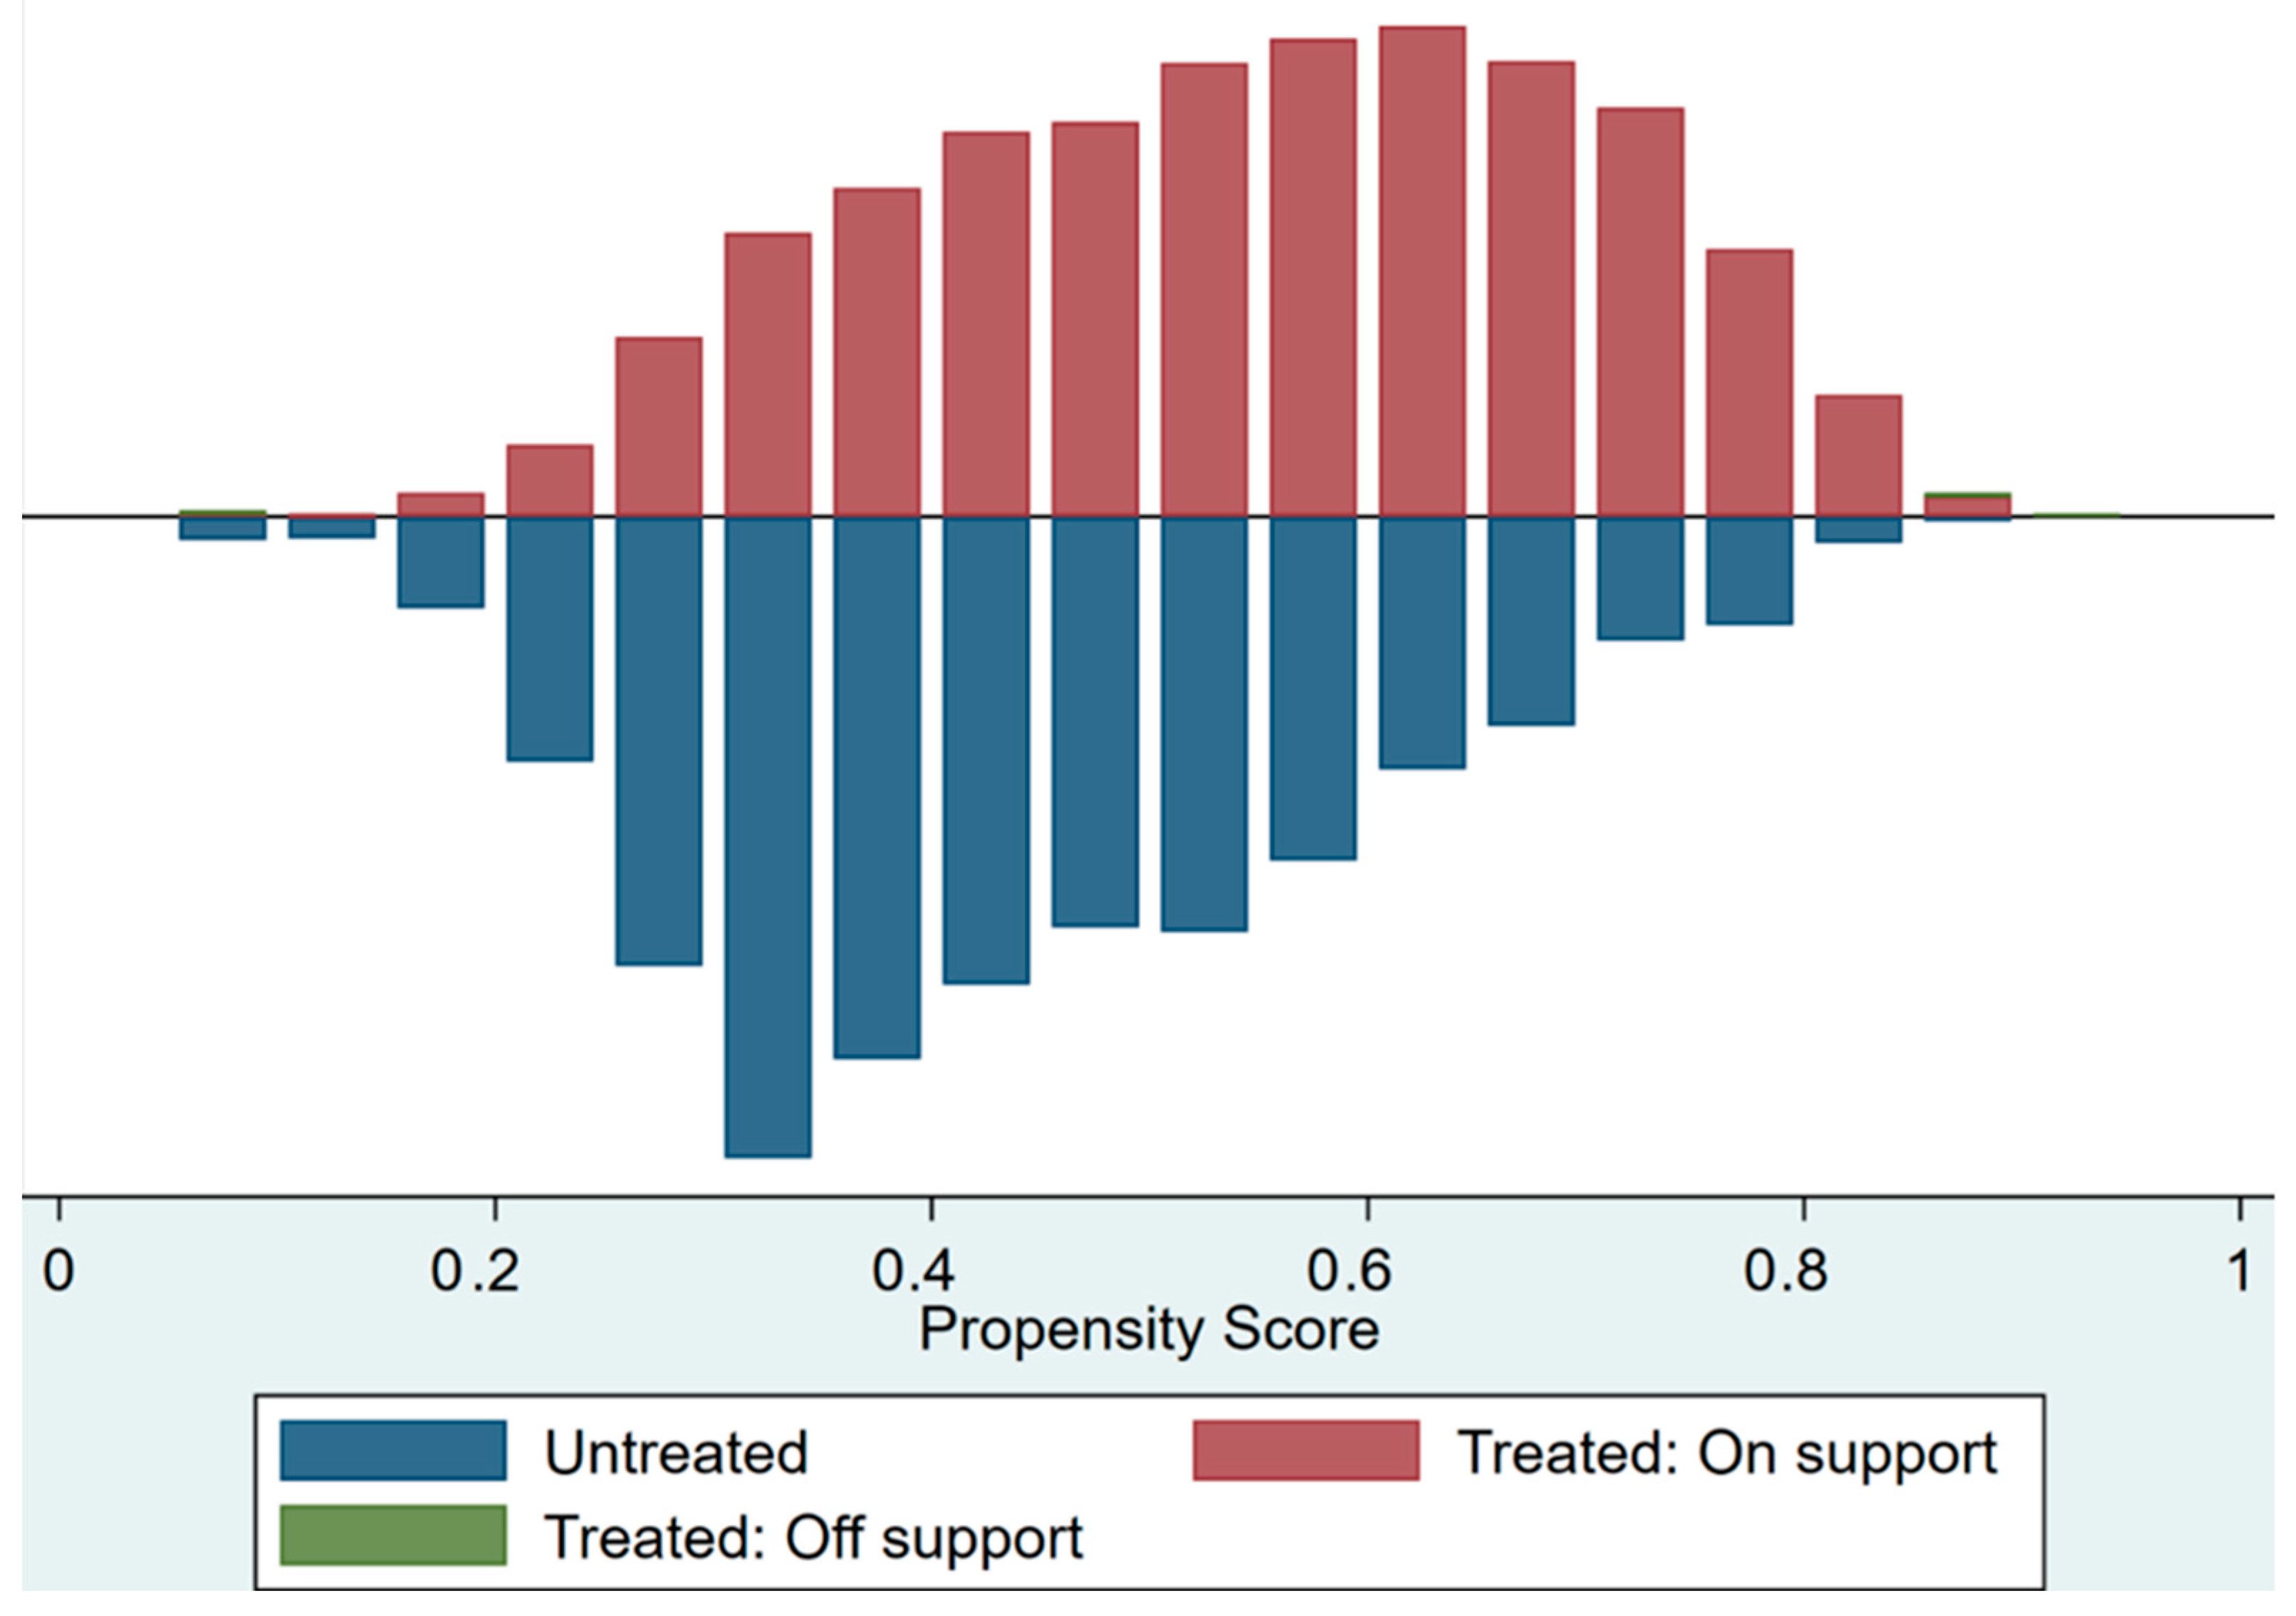
4.2.4. PSM Approximate Sample Matching
4.3. Analysis of Heterogeneity
4.3.1. Analysis of Heterogeneity Based on Enterprise Property Rights
4.3.2. Heterogeneity Analysis of Industries
5. Further Analysis
5.1. Mechanism Testing
5.1.1. BankFintech, Capital Liquidity, and Long-Term Financing Supply
5.1.2. BankFintech, Information Screening, and Proactive Risk Governance
5.2. Moderating Effect Test
5.2.1. Moderating Effect of Enterprise Digitalization Level
5.2.2. Moderating Effect of Financial Regulatory Intensity
5.2.3. Moderating Effect of Policy Shocks
- (1)
- Technological Diffusion Effect: Pilot policies establish technical standards and ideal practices that exhibit spillover effects. In the “National Pilot Policy of Information Benefiting the People”, government-led supply chain finance platforms (e.g., Shenzhen Financial Services Platform) standardize IoT monitoring technologies, enabling banks to deploy cargo tracking systems at a low cost, thereby directly reducing the likelihood of enterprises from misusing short-term loans for fixed asset investments. In the “Pilot Policy of Combining Science and Technology with Finance”, the “Science and Technology Financial Brain” established in Suzhou Industrial Park uses knowledge graph technology to dynamically link enterprise R&D investments with operating cash flows, providing early warnings against the risks of short-term debt used for long-term purposes.
- (2)
- Collaborative Governance Network: Pilot policies foster cross-departmental cooperation to build new regulatory sandboxes. For example, Hangzhou’s “Financial Technology Innovation Regulatory Pilot” during the “National Pilot Policy of Information Benefiting the People” allows banks to test smart contract fund monitoring systems in specific scenarios, balancing innovation with risk control. In the “Pilot Policy of Combining Science and Technology with Finance”, the Science Branch in Chengdu High-tech Zone connects directly with the Science Bureau’s data to automatically verify R&D expense deduction data with bank credit systems, thereby directly reducing corporate financial window-dressing risks.
- (3)
- These policy-driven technological governance innovations align with path dependency theory in new institutional economics and reflect the role of “order parameters” in reconstructing financial ecosystems within complex system theory, offering a Chinese solution for financial risk management in the digital era. Future efforts should focus on strengthening cross-domain data flow mechanisms and promoting collaborative innovation in policy tools to foster a more efficient digital governance ecosystem.
6. Comprehensive Discussion
6.1. Research Conclusions
- (1)
- The benchmark regression results indicate that the development of BankFintech is conducive to reducing the level of short-term debt used for long-term purposes by enterprises. Moreover, the results remain robust even after replacing the nuclear center explanatory variables with the explained variables, employing the instrumental variable method, and using PSM approximate sample matching.
- (2)
- The heterogeneity analysis reveals that BankFintech’s effects are more pronounced in non-state-owned companies and technology-intensive industries, inhibiting SDLU more effectively.
- (3)
- The intermediary mechanism analysis shows that BankFintech enhances the rate of capital sufficiency (CAR) and liquidity ratio (Liquidity Ratio) of banks, strengthening their willingness and ability to supply long-term financing. Simultaneously, BankFintech alleviates the issue of insufficient information-screening capabilities in banks, exhibiting a “quality preference” that “forces” enterprises to proactively improve their financial health and information disclosure quality.
- (4)
- The moderating effects indicate that the improvement in enterprise digitalization levels strengthens BankFintech’s inhibiting effect on SDLU; the “National Pilot Policy of Information Benefiting the People” and the “Pilot Policy of Combining Science and Technology with Finance” policies respectively form institutional empowerment from social governance and economic governance perspectives, reducing the phenomenon of term mismatch; it is noteworthy that in samples with high financial regulation intensity, BankFintech’s inhibiting effect on SDLU is not significant, reflecting that China’s financial regulation intensity has not yet reached the “optimal level”.
6.2. Policy Implications
- (1)
- Optimize the financial regulation system and implement differentiated dynamic regulation.
- (2)
- Targeted support for financial institutions to enhance their long-term financing supply capacity.
- (3)
- Promoting digital transformation of enterprises and strengthening governance capabilities.
- (4)
- Deepening policy pilot coordination to unlock institutional empowerment effects.
6.3. Research Limitations
- (1)
- The article does not establish a more reasonable framework for measuring the materiality of enterprises’ “short-term debt and long-term use”.
- (2)
- Due to the availability of data, the metrics of bank financial risk are not comprehensive enough.
- (3)
- The conclusion of the article ignores the ethical risks of technology (e.g., AI discrimination, data privacy leakage, etc.).
Author Contributions
Funding
Institutional Review Board Statement
Informed Consent Statement
Data Availability Statement
Conflicts of Interest
References
- Akerlof, G. A. (1970). The market for “lemons”: Quality uncertainty and the market mechanism. The Quarterly Journal of Economics, 84(3), 488–500. [Google Scholar] [CrossRef]
- Altunbas, Y., Gambacorta, L., & Marqués-lbanez, D. (2011). Bank risk and capital under Basel l: The impact of IRB approaches. Journal of Financial Intermediation, 20(2), 224–255. [Google Scholar]
- Berger, A. N., & Udell, G. F. (2006). A more complete conceptual framework for SME finance. Journal of Banking & Finance, 30(11), 2945–2966. [Google Scholar]
- Bernanke, B. S., Gertler, M., & Gilchrist, S. (1999). The financial accelerator in a quantitative business cycle framework. Handbook of Macroeconomics, 1, 1341–1393. [Google Scholar]
- Bharath, S. T., & Shumway, T. (2008). Forecasting default with the Merton distance to default model. The Review of Financial Studies, 21(3), 1339–1369. [Google Scholar] [CrossRef]
- Borio, C. (2014). The financial cycle and macroeconomics: What have we learnt? Journal of Banking & Finance, 45, 182–198. [Google Scholar]
- Buchak, G., Matvos, G., Piskorski, T., & Seru, A. (2018). Fintech, regulatory arbitrage, and the rise of shadow banks. Journal of Financial Economics, 130(3), 453–483. [Google Scholar] [CrossRef]
- Cypher, J. M. (1996). Mexico: Financial fragility or structural crisis? Journal of Economic Issues, 30(2), 451–461. [Google Scholar] [CrossRef]
- Demirgüç-Kunt, A., & Maksimovic, V. (1999). Institutions, financial markets, and firm debt maturity. Journal of Financial Economics, 54(3), 295–336. [Google Scholar] [CrossRef]
- Diamond, D. W. (1991). Debt maturity structure and liquidity risk. The Quarterly Journal of Economics, 106(3), 709–737. [Google Scholar] [CrossRef]
- Diamond, D. W., & Dybvig, P. H. (1983). Bank runs, deposit insurance, and liquidity. Journal of Political Economy, 91(3), 401–419. [Google Scholar] [CrossRef]
- Diamond, D. W., & Verrecchia, R. E. (1991). Disclosure, liquidity, and the cost of capital. The Journal of Finance, 46(4), 1325–1359. [Google Scholar] [CrossRef]
- Fan, J. P., Titman, S., & Twite, G. (2012). An international comparison of capital structure and debt maturity choices. Journal of Financial and Quantitative Analysis, 47(1), 23–56. [Google Scholar] [CrossRef]
- Frame, W. S., & White, L. J. (2021). The transformation of small business lending and the rise of relationshipless banking. Journal of Money, Credit, and Banking, 53(5), 1043–1076. [Google Scholar]
- He, Y., & Zhang, Y. (2024). Fintech and corporate investment and financing maturity mismatch-based on accounting disclosure quality and banking competition perspectives. Financial Development Research, (1), 70–78. [Google Scholar]
- He, Y. K., Niu, G., Lu, J., & Zhao, G. C. (2024). Digital governance and urban entrepreneurial vitality: Evidence from the “National digital inclusion pilot program”. The Journal of Quantitative & Technical Economics, 41(1), 47–66. [Google Scholar]
- Huang, H. T., Yu, Z. J., & Yang, X. H. (2020). Impact of financial regulation on corporate financialization and construction of regulatory roles: Empirical evidence from the perspective of term structure heterogeneity. Journal of Financial Economics Research, 35(3), 146–160. [Google Scholar]
- Jia, X. Y., Di, L. Y., & Wu, J. F. (2024). How does digital transformation affect corporate short-term debt for long-term use? An examination based on dual paths of investment and financing. Journal of Financial Economics Research, 39(4), 142–160. [Google Scholar]
- Kane, E. J. (1988). Interaction of financial and regulatory innovation. The American Economic Review, 78(2), 328–334. [Google Scholar]
- Kim, O., & Verrecchia, R. E. (2001). The relation among disclosure, returns and trading volume information. The Accounting Review, 76, 633–654. [Google Scholar] [CrossRef]
- Kornai, J. (1986). The soft budget constraint. Kyklos, 39(1), 3–30. [Google Scholar] [CrossRef]
- Li, Y. F., Li, M. L., & Li, J. (2022). Bank fintech, credit allocation and corporate short-term debt for long-term use. China Industrial Economy, 10, 137–154. [Google Scholar]
- Liu, X. G., & Liu, Y. C. (2019). Leverage ratio, short-term debt for long-term use, and firm performance. Economic Research Journal, 54(7), 127–141. [Google Scholar]
- Liu, Y. Y., & Guo, S. J. (2023). The impact of corporate digital transformation on investment and financing maturity mismatch. Finance and Economy, (1), 39–50. [Google Scholar]
- Ma, L. Y., & Li, X. M. (2019). Does science and technology financial policy promote regional innovation level? A quasi-natural experiment based on the “pilot program for promoting the integration of science, technology and finance”. China Soft Science, (12), 30–42. [Google Scholar]
- Ma, W. T., Yu, M. M., & Fan, R. (2024). Can bank fintech development reduce corporate debt default risk? Modern Finance and Economics (Journal of Tianjin University of Finance and Economics), 44(6), 73–92. [Google Scholar]
- Myers, S. C., & Majluf, N. S. (1984). Corporate financing and investment decisions when firms have information that investors do not have. Journal of Financial Economics, 13(2), 187–221. [Google Scholar] [CrossRef]
- Sheng, T. X., & Fan, C. L. (2020). Fintech, optimal banking market structure and credit supply for micro and small enterprises. Financial Research, 2020(6), 114–132. [Google Scholar]
- Stiglitz, J. E., & Weiss, A. (1981). Credit rationing in markets with imperfect information. The American Economic Review, 71(3), 393–410. [Google Scholar]
- Tang, S., Wu, X. C., & Zhu, J. (2020). Digital finance and enterprise technological innovation: Structural characteristics, mechanism identification, and effect differences under financial regulation. Management World, 36(5), 52–66+9. [Google Scholar]
- Wang, C., & Yu, P. (2020). Financial innovation, financial regulation, and economic growth. Statistics and Decision, 36(7), 137–141. [Google Scholar]
- Wang, Q., & Wu, W. (2012). Capital Regulation and Bank Credit Expansion: An Empirical Study Based on the Chinese Banking Sector. Economics Dynamic, (3), 63–66. [Google Scholar]
- Wang, R., Zhang, Q. J., & He, Q. (2019). Does financial regulation impair financial efficiency? Journal of Financial Economics Research, 34(6), 93–104. [Google Scholar]
- Xie, X. L., & Wang, S. H. (2022). Digital transformation of chinese commercial banks: Measurement, process, and impact. China Economic Quarterly, 22(6), 1937–1956. [Google Scholar]
- Xu, X. P., Li, H. J., & Ge, Y. F. (2021). Can fintech applications promote bank credit structure adjustment? A quasi-natural experiment based on bank external cooperation. Journal of Finance and Economics, 47(6), 92–107. [Google Scholar]
- Yang, L., Wei, K., Feng, Y., & Yin, L. (2020). Bank heterogeneity, financial regulatory intensity, and bank credit expansion: An empirical study based on PSTR model. Shanghai Finance, (6), 19–28. [Google Scholar]
- Yang, M., & Wu, H. M. (2022). Does industrial policy alleviate mismatch in corporate investment and financing maturity? Research on Economics and Management, 43(8), 56–77. [Google Scholar]
- Zhang, J. Q., Li, K. L., & Zhang, J. Y. (2022). How does BankFintech affect corporate structural deleveraging? Journal of Finance and Economics, 48(1), 64–77. [Google Scholar]


| Variable Symbol | Variable Definition |
|---|---|
| Explained Variable | |
| SDLU | Enterprise short-term debt and long-term use: the difference between the proportion of short-term liabilities and the proportion of short-term assets. |
| Core Explanatory Variable | |
| BankFintech | Calculated based on the Fintech patents invented by the bank and the size of the corresponding lending bank of the enterprise. |
| Mechanism Variables | |
| TRWA | Bank risk-weighted assets: sum of credit risk-weighted assets, market risk-weighted assets, and operational risk-weighted assets |
| CAR | Bank Capital Adequacy Ratio: Compliance Regulatory Capital/Risk-Weighted Assets × 100% |
| LiquidityRatio | Bank Liquidity Ratio: Liquid Assets/Liquid Liabilities × 100% |
| Z-Score | Corporate financial health: Z-Score score |
| KV | Corporate disclosure quality: coefficient of impact of trading volume on rate of return |
| Control Variables | |
| Fix | Fixed Asset Ratio: Net Fixed Assets/Total Assets |
| Lev | Financial Leverage Ratio: Total Liabilities/Total Assets |
| Cash | Cash Flow Position: Net Cash Flow from Operating Activities/Total Assets at the Beginning of the Period |
| ICR | Interest Coverage Multiple: EBITDA/Interest Expense |
| Industry-HHI | Industry Competitiveness: Herfindahl–Hirschman Index |
| BFI | Number of financial institutions in the banking sector |
| m2 | Monetary policy environment: broad money growth rate |
| GDP | Level of economic development: GDP growth rate of each province |
| (1) | (2) | |
|---|---|---|
| SDLU | SDLU | |
| BankFintech | −0.464 ** | −0.479 ** |
| (0.206) | (0.212) | |
| Fix | −0.433 | −0.417 |
| (0.545) | (0.556) | |
| Lev | 0.128 * | 0.126 * |
| (0.074) | (0.075) | |
| Cash | −0.087 ** | −0.087 ** |
| (0.038) | (0.039) | |
| ICR | −0.116 *** | −0.116 *** |
| (0.040) | (0.041) | |
| Industry-HHI | −0.162 | |
| (0.577) | ||
| BFI | 1.404 * | |
| (0.799) | ||
| M2 | −0.185 | |
| (1.503) | ||
| GDP | 1.198 | |
| (1.989) | ||
| _cons | −0.790 ** | −19.483 ** |
| (1.021) | (9.515) | |
| Id/Year FE | YES | YES |
| Observations | 3378 | 3315 |
| (1) | (2) | (3) | (4) | |
|---|---|---|---|---|
| Replacement of Core Explanatory Variables | Replacement of Explained Variables | |||
| SDLU | SDLU | SFLI | SFLI | |
| Bank Digitization | −0.004 * | −0.004 * | ||
| (0.002) | (0.002) | |||
| BankFintech | −0.038 * | −0.038 * | ||
| (0.022) | (0.022) | |||
| Fix | −0.051 | −0.057 | −0.074 | −0.076 |
| (0.487) | (0.496) | (0.058) | (0.058) | |
| Lev | −0.141 ** | −0.153 ** | −0.012 | −0.014 * |
| (0.062) | (0.066) | (0.008) | (0.008) | |
| Cash | −4.719 × 10⁸ | −3.834 × 10⁸ | −0.010 ** | −0.011 *** |
| (1.508 × 10⁹) | (1.557 × 10⁹) | (0.004) | (0.004) | |
| ICR | −0.102 *** | −0.107 *** | 0.006 | 0.007 * |
| (0.033) | (0.034) | (0.004) | (0.004) | |
| Industry-HHI | 0.005 | −0.169 *** | ||
| (0.490) | (0.060) | |||
| BFI | 3.239 ** | −0.031 | ||
| (1.283) | (0.084) | |||
| M2 | 1.454 | 0.097 | ||
| (1.323) | (0.158) | |||
| GDP | 2.322 | −0.198 | ||
| (1.861) | (0.209) | |||
| _cons | 1.522 *** | −64.090 *** | −0.309 *** | 0.660 |
| (0.249) | (22.941) | (0.107) | (0.998) | |
| Id/Year | YES | YES | YES | YES |
| Observations | 3701 | 3629 | 3244 | 3206 |
| (1) First | (2) Second | |
|---|---|---|
| BankFintech | SDLU | |
| Tech-Innovation | 0.0132 *** | |
| (4.46) | ||
| BankFintech | −10.3581 ** | |
| (−1.97) | ||
| Fix | −0.0315 | 0.1755 |
| (−1.44) | (0.32) | |
| Lev | 0.0041 * | 0.3880 *** |
| (1.76) | (6.55) | |
| Cash | 0.0007 | −0.6289 *** |
| (0.29) | (−11.10) | |
| ICR | 0.0047 | −0.0800 |
| (1.62) | (−1.10) | |
| Industry-HHI | −0.0285 | 0.8251 |
| (−1.39) | (1.62) | |
| BFI | 0.2697 *** | −2.6581 * |
| (10.02) | (−1.71) | |
| M2 | 0.6564 *** | −9.9571 ** |
| (5.56) | (−2.21) | |
| GDP | −0.6235 *** | 10.3849 ** |
| (−4.26) | (2.17) | |
| _cons | −4.1287 *** | 27.3396 |
| (−9.43) | (1.14) | |
| Cragg–Donald Wald F statistic (critical value) | 19.927 (16.38) | |
| Anderson canonical correlation LM statistic (p value) | 19.868 *** (0.000) | |
| Observations | 3313 | 3313 |
| Variable | Sample | Treated | Controls | Difference | S.E. | T-Stat |
|---|---|---|---|---|---|---|
| SDLU | Unmatched | 1.0384872 | 1.19423777 | −0.155750572 | 0.119632839 | 1.3 |
| ATT | 1.03933692 | 1.56690546 | −0.527568534 | 0.153869509 | 3.43 | |
| ATU | 1.19423777 | 0.857559298 | −0.33667847 | |||
| ATE | −0.430403772 |
| Observed Coefficient | Bootstrap Std. Err. | z | P > z | Normal-Based [95% Conf. Interval] | ||
|---|---|---|---|---|---|---|
| _bs_1 | 0.528 | 0.18 | 2.94 | 0.003 | 0.176 | 0.879 |
| _bs_2 | 0.337 | 0.136 | 2.48 | 0.013 | 0.071 | 0.602 |
| _bs_3 | 0.43 | 0.138 | 3.11 | 0.002 | 0.159 | 0.702 |
| (1) SOEs | (2) Non-SOEs | |
|---|---|---|
| SDLU | SDLU | |
| BankFintech | −0.341 | −0.674 ** |
| (−0.990) | (−2.439) | |
| Fix | 0.108 | −0.929 |
| (0.114) | (−1.301) | |
| Lev | 0.091 | 0.160 * |
| (0.684) | (1.743) | |
| Cash | −0.032 | −0.130 *** |
| (−0.461) | (−2.670) | |
| ICR | −0.138 * | −0.102 ** |
| (−1.950) | (−1.988) | |
| Industry-HHI | −0.589 | 0.516 |
| (−0.634) | (0.640) | |
| BFI | 0.853 | 2.039 ** |
| (0.619) | (2.043) | |
| M2 | 1.396 | −1.134 |
| (0.528) | (−0.619) | |
| GDP | −1.000 | 2.718 |
| (−0.285) | (1.127) | |
| _cons | −13.041 | −27.676 ** |
| (−0.805) | (−2.307) | |
| Id/Year FE | YES | YES |
| Observations | 1422 | 1893 |
| (1) Labor-Intensive | (2) Capital-Intensive | (3) Technology-Intensive | |
|---|---|---|---|
| SDLU | SDLU | SDLU | |
| BankFintech | −0.678 * | 0.041 | −0.755 ** |
| (−1.653) | (0.125) | (−1.983) | |
| Fix | −0.792 | 0.364 | −1.543 |
| (−0.793) | (0.415) | (−1.248) | |
| Lev | 0.093 | 0.063 | 0.459 ** |
| (0.744) | (0.517) | (2.401) | |
| Cash | −0.052 | −0.092 | −0.132 ** |
| (−0.598) | (−1.508) | (−2.026) | |
| ICR | −0.080 | −0.142 ** | −0.158 ** |
| (−1.007) | (−2.103) | (−2.152) | |
| Industry-HHI | −0.049 | 0.286 | −0.651 |
| (−0.047) | (0.336) | (−0.545) | |
| BFI | 2.078 | 0.565 | 1.955 |
| (1.341) | (0.453) | (1.396) | |
| M2 | −1.187 | 0.007 | 0.381 |
| (−0.390) | (0.003) | (0.154) | |
| GDP | 2.496 | 0.162 | 1.557 |
| (0.627) | (0.052) | (0.469) | |
| _cons | −22.277 | −6.389 | −35.475 ** |
| (−1.214) | (−0.426) | (−2.124) | |
| Id/Year FE | YES | YES | YES |
| Observations | 1057 | 1089 | 1169 |
| (1) | (2) | (3) | (4) | |
|---|---|---|---|---|
| Credit Risk | ||||
| Total Risk Weighted Assets | Capital Adequacy Ratio | |||
| lnBank_Patent | −0.044 *** | −0.049 *** | 0.439 *** | 0.364 *** |
| (0.010) | (0.012) | (0.077) | (0.085) | |
| Size | 0.089 *** | 0.506 *** | ||
| (0.016) | (0.099) | |||
| Age | 0.030 | −0.087 | ||
| (0.018) | (0.126) | |||
| ROA | 7.828 ** | 63.715 *** | ||
| (3.217) | (20.419) | |||
| DAR | −2.482 *** | −14.563 *** | ||
| (0.432) | (2.740) | |||
| AT | −2.890 ** | 2.587 | ||
| (1.273) | (8.269) | |||
| BFI | 0.303 * | −1.640 | ||
| (0.167) | (1.122) | |||
| Financial_GDP | 0.071 | 0.149 | ||
| (0.061) | (0.370) | |||
| _cons | 25.182 *** | 21.571 *** | 13.118 *** | 27.712 *** |
| (0.015) | (1.581) | (0.102) | (10.527) | |
| Id/Year FE | YES | YES | YES | YES |
| Observations | 1504 | 1294 | 1659 | 1421 |
| (1) | (2) | |
|---|---|---|
| Liquidity Risk–Liquidity Ratio | ||
| lnBank_Patent | 2.342 *** | 2.977 *** |
| (0.516) | (0.605) | |
| Size | −2.451 *** | |
| (0.754) | ||
| Age | 0.638 | |
| (0.909) | ||
| ROA | −327.021 ** | |
| (151.065) | ||
| DAR | 63.253 *** | |
| (20.753) | ||
| AT | 104.947 * | |
| (61.659) | ||
| BFI | −18.690 ** | |
| (8.263) | ||
| Financial_GDP | 2.946 | |
| (2.786) | ||
| _cons | 10.551 *** | 154.028 ** |
| (0.706) | (77.523) | |
| Id/Year FE | YES | YES |
| Observations | 1493 | 1287 |
| (1) | (2) | (3) | (4) | |
|---|---|---|---|---|
| Corporate Financial Health | Information Disclosure Quality | |||
| Z-Score | Z-Score | KV | KV | |
| BankFintech | 0.401 ** | 0.431 ** | −0.047 ** | −0.052 ** |
| (2.167) | (2.278) | (2.281) | (2.486) | |
| Fix | 0.243 | 0.304 | 0.018 | 0.029 |
| (0.486) | (0.599) | (0.333) | (0.539) | |
| Lev | −0.006 | 0.004 | −0.005 | −0.006 |
| (−0.078) | (0.056) | (−0.724) | (−0.813) | |
| Cash | 0.218 *** | 0.226 *** | 0.010 *** | 0.011 *** |
| (6.244) | (6.375) | (2.671) | (2.929) | |
| ICR | 0.614 *** | 0.621 *** | −0.001 | −0.000 |
| (16.914) | (16.786) | (−0.302) | (−0.047) | |
| Industry-HHI | 0.684 | −0.021 | ||
| (1.332) | (−0.371) | |||
| BFI | 45.819 *** | 0.156 ** | ||
| (3.550) | (1.994) | |||
| M2 | −58.138 *** | 0.708 *** | ||
| (−3.759) | (4.797) | |||
| GDP | 97.357 *** | −0.683 *** | ||
| (3.714) | (−3.498) | |||
| _cons | 7.408 *** | −500.824 *** | 0.723 *** | −2.756 *** |
| (7.949) | (−3.495) | (7.162) | (−2.957) | |
| Id/Year FE | YES | YES | YES | YES |
| Observations | 3674 | 3607 | 3373 | 3310 |
| (1) Low-Digitalization | (2) High-Digitalization | |
|---|---|---|
| SDLU | SDLU | |
| BankFintech | 0.342 | −0.587 ** |
| (0.434) | (0.256) | |
| Fix | −0.124 | −0.075 |
| (1.169) | (0.680) | |
| Lev | 0.345 * | 0.072 |
| (0.202) | (0.082) | |
| Cash | 0.036 | −0.113 ** |
| (0.068) | (0.049) | |
| ICR | −0.174 ** | −0.084 * |
| (0.074) | (0.050) | |
| Industry-HHI | 1.938 * | 0.139 |
| (1.095) | (0.770) | |
| BFI | −0.800 | 2.846 *** |
| (1.461) | (0.998) | |
| M2 | −3.476 | −0.304 |
| (2.471) | (1.900) | |
| GDP | 3.796 | 1.961 |
| (3.273) | (2.501) | |
| _cons | 15.119 | −35.676 *** |
| (20.834) | (11.642) | |
| Id/Year FE | YES | YES |
| Observations | 891 | 2424 |
| (1) Low-Regulation | (2) High-Regulation | |
|---|---|---|
| SDLU | SDLU | |
| BankFintech | −0.575 ** | −0.466 |
| (0.273) | (0.535) | |
| Fix | −0.484 | −1.932 |
| (0.682) | (1.715) | |
| Lev | −0.136 | 0.000 |
| (0.088) | (0.237) | |
| Cash | −0.065 | −0.244 ** |
| (0.048) | (0.114) | |
| ICR | −0.114 ** | −0.221 ** |
| (0.052) | (0.109) | |
| Industry-HHI | −0.736 | 1.556 |
| (0.690) | (1.758) | |
| BFI | 0.548 | 5.828 *** |
| (0.976) | (2.095) | |
| M2 | 0.559 | −4.675 |
| (1.880) | (3.693) | |
| GDP | −0.250 | 9.860 ** |
| (2.460) | (5.001) | |
| _cons | −8.355 | −81.055 *** |
| (11.498) | (27.318) | |
| Id/Year FE | YES | YES |
| Observations | 2405 | 910 |
| (1) | (2) | (3) | (4) | |
|---|---|---|---|---|
| National Pilot Policy of Information Benefiting the People | Pilot Policy of Combining Science and Technology with Finance | |||
| Treated | Untreated | Treated | Untreated | |
| SDLU | SDLU | SDLU | SDLU | |
| BankFintech | −1.008 ** | −0.192 | −1.190 ** | −0.157 |
| −0.509 | −0.208 | −0.48 | −0.296 | |
| Fix | −1.374 | 0.532 | −0.596 | −0.438 |
| −1.223 | −0.604 | −1.114 | −0.801 | |
| Lev | 0.073 | 0.185 ** | 0.038 | 0.315 ** |
| −0.133 | −0.094 | −0.122 | −0.151 | |
| Cash | −0.118 | −0.046 | −0.126 | −0.009 |
| −0.095 | −0.039 | −0.088 | −0.054 | |
| ICR | −0.300 *** | −0.004 | −0.168 * | −0.106 * |
| −0.093 | −0.043 | −0.089 | −0.061 | |
| Industry-HHI | 1.022 | −1.071 * | 0.445 | 0.279 |
| −1.477 | −0.611 | −1.343 | −0.825 | |
| BFI | 3.996 ** | 0.464 | 3.780 ** | 0.159 |
| −1.896 | −1.447 | −1.717 | −1.13 | |
| M2 | −3.832 | 1.104 | −2.598 | 1.624 |
| −3.665 | −1.447 | −3.332 | −2.109 | |
| GDP | 7.737 | −1.099 | 5.977 | −1.922 |
| −4.858 | −2.094 | −4.401 | −2.792 | |
| _cons | −54.813 ** | −6.436 | −52.329 ** | −1.752 |
| −22.405 | −24.861 | −20.474 | −13.426 | |
| Id/Year FE | YES | YES | YES | YES |
| Observations | 1089 | 1905 | 1165 | 1274 |
Disclaimer/Publisher’s Note: The statements, opinions and data contained in all publications are solely those of the individual author(s) and contributor(s) and not of MDPI and/or the editor(s). MDPI and/or the editor(s) disclaim responsibility for any injury to people or property resulting from any ideas, methods, instructions or products referred to in the content. |
© 2025 by the authors. Licensee MDPI, Basel, Switzerland. This article is an open access article distributed under the terms and conditions of the Creative Commons Attribution (CC BY) license (https://creativecommons.org/licenses/by/4.0/).
Share and Cite
Wu, W.; Lin, X. The Impact of Bank Fintech on Corporate Short-Term Debt for Long-Term Use—Based on the Perspective of Financial Risk. Int. J. Financial Stud. 2025, 13, 68. https://doi.org/10.3390/ijfs13020068
Wu W, Lin X. The Impact of Bank Fintech on Corporate Short-Term Debt for Long-Term Use—Based on the Perspective of Financial Risk. International Journal of Financial Studies. 2025; 13(2):68. https://doi.org/10.3390/ijfs13020068
Chicago/Turabian StyleWu, Weiyu, and Xiaoyan Lin. 2025. "The Impact of Bank Fintech on Corporate Short-Term Debt for Long-Term Use—Based on the Perspective of Financial Risk" International Journal of Financial Studies 13, no. 2: 68. https://doi.org/10.3390/ijfs13020068
APA StyleWu, W., & Lin, X. (2025). The Impact of Bank Fintech on Corporate Short-Term Debt for Long-Term Use—Based on the Perspective of Financial Risk. International Journal of Financial Studies, 13(2), 68. https://doi.org/10.3390/ijfs13020068