1. Introduction
The exponential technological development of the last few years has led to the overall development of society and, at the same time, to an increase in the comfort and quality of daily life for each of us. It should be emphasized that this development is directly based on increasing electricity consumption in parallel with the search for new, clean, green energy sources. When we talk about pollution, we usually think only about the pollution caused by carbon emissions and greenhouse gases and neglect an also important and increasing pollution source, namely electromagnetic pollution. This results from increased electricity consumption and is manifested by the existence of an electromagnetic field (EMF) in the vicinity of any equipment that uses electrical energy. It has been proven that the electromagnetic fields in the vicinity of electro-energetic equipment affect people, causing different effects. As such, exposure to electromagnetic fields is regulated by a Directive of the European Union; thus, it must be measured and monitored, both in areas considered for the general exposure of the population (areas located near transmission and distribution power lines), where, in Romania, the provisions given by the Order of the Ministry of Public Health, WHOP 1193 of 29 September 2006, on limiting the exposure of the population to electromagnetic fields from 0 Hz to 300 GHz must be observed [
1], and in areas in which there is considered to be a professional exposure (the premises of electrical transformer stations); this is where, in Romania, the provisions contained in Government Decision GD 520/2016 on the minimum safety and health requirements regarding the exposure of workers to the risks posed by electromagnetic fields [
2] must be observed.
The evaluation of human exposure to electric and magnetic fields is a subject of great interest worldwide, as can be seen from the attached bibliographic list. The biological effects of electromagnetic fields on the human body were and still are a subject of both scientific and public interest, considering their risks to living organisms; these risks are presented in [
3,
4,
5,
6,
7,
8,
9].
The calculation of the electromagnetic field around and in the proximity of overhead transmission lines, which pass over some houses, factories, and schools, is presented in [
10], while in [
11], the authors present field monitoring in the area and in the immediate vicinity of a high-voltage (HV) substation in Novi Sad, Serbia.
The effect of human exposure to the magnetic field generated by an electricity transport and distribution overhead transmission line is also studied in [
12], and in [
13], Ghervenkov presents an evaluation of the electric and magnetic fields generated by an overhead transmission line (OHTL) in an urban area of Bulgaria.
S.M. Ghania, in [
14], presents an analytic and numeric evaluation of the potential risk posed by electromagnetic fields emitted in the interior of an HV station, this being considered a subject of great interest for designers and biomedical researchers in the field. In [
15], analytical and numerical methods for the calculation of the electric and magnetic field distribution in the proximity of electrical installations’ equipment from HV stations are presented.
Of great importance in the evaluation of human exposure to electric and magnetic fields are also the standards in force. In this context, in [
16,
17], the most-used standards in this field are presented together with different methods to calculate the parameters involved in these evaluations.
Experimental and numerical evaluations of electric and magnetic fields are presented in [
18], in the area of an electric station in Xanthi, Greece; in [
19], in a station in Jingmen, China; in [
20], in a station in Finland; in [
21,
22,
23], in different stations in Romania; in [
24], in a station in the north-east of Brazil; in [
25], in a station in Libya; and in [
26], in the area of an OHTL in Bosnia and Herzegovina.
All this research in the domain of human exposure to electric and magnetic fields through analytic, numeric, and/or experimental methods presented in the articles mentioned above confirm the actuality of the subject addressed in this article.
In this light, the main aim of this article is the development, implementation, and testing of a software application dedicated to the evaluation of human exposure to electric and magnetic fields that is also able to be accessed on a mobile phone.
The concept for this study derives from the growing demands of the private companies that contribute to the retrofitting of electrical substations for the assessment of human exposure to electric and magnetic fields in these stations. In addition, we cannot neglect the requests that we have had over the years for the assessment of electric and magnetic fields in urban areas crossed by OHTLs. In the process of evaluating the exposure of humans to electric and magnetic fields, we have measured the high values of electric and magnetic fields many times and asked ourselves whether the measured value is the real one or whether it is a measurement error, or whether there are other electromagnetic fields emitted by devices/sources near the test area. These measured values can be influenced by the presence of underground cables, by meteorological factors, and also by other devices functioning at the industrial frequency, 50 Hz.
In order to provide a rapid answer to this question, in the field, in precisely the place the electromagnetic compatibility (EMC) tests were carried out, we considered that it would be useful to design and develop a software application to determine electric and magnetic fields at low frequencies, and that this application should be easily accessed even from a mobile phone; this is how the EMF application was born.
Section 1 highlights the novelty and importance of the subject addressed in this paper. In
Section 2, the calculation algorithms for the electric and magnetic field are presented, along with the analytical models and the design and implementation of the EMF software program.
Section 3 consists of a case study on an OHTL of 400 kV in Cluj-Napoca, Romania, where the electric and magnetic field were determined using three different methods: experimentally, using the EMF software program developed by the authors, and using a commercial software program. In
Section 4, the EMF software program is tested and validated by comparing the results obtained using the three methods and by calculating the error percentages. The final conclusions of this study are presented in
Section 5.
2. Materials and Methods
2.1. Calculation Module of the Electric and Magnetic Field Generated by a Transmission and Distribution Electric Line
The EMF software program was designed so that it could determine the electric potential, the electric field intensity, and the magnetic induction values from the proximity of the transmission and distribution electric lines. For the development, conception, and implementation of this application, it was necessary, first of all, to develop an analytic module for calculating the electromagnetic field.
The electromagnetic field in the proximity of conductors and bars from a high or very high voltage varies in time with a low frequency, with a value of 50 Hz in Europe (called industrial frequency); thus, the wavelength of the field is 6000 km. The practical consequence of this wavelength is the fact that the electromagnetic field radiant properties can be neglected. From this point of view, the difference between the electromagnetic field at a low frequency and the electromagnetic field at a high frequency is that microwaves, radars, or radio waves can be clearly observed. The wavelength, being significantly larger than the characteristic dimensions of the exposed organisms, and the skin depth of the field in biological environments, being greater than these dimensions, enable the application of the theory of the quasi-stationary electromagnetic field in linear environments. The approximation of the solutions to Maxwell’s equations can be made with an extremely small error (2 × 10
−6%), in comparison to the real situation, if this theory is applied to determine the fields at distances up to 100 m from an OHTL [
27,
28,
29].
Thus, as is clear from the ideas presented above and from a study of the literature in the field of interest [
12,
13,
15,
18,
19,
21,
22,
23,
24,
26], it is well known that in the assessment of the electromagnetic field generated by an OHTL, the stationary operating regime of the electromagnetic field is considered valid, so the electric field and magnetic field are analyzed and treated independently.
In this context, the following paragraphs will present the analytical expressions and the implemented algorithms used to analytically and numerically determine the electric and magnetic fields generated in the proximity of the OHTL.
2.1.1. Calculation Module of the Electric Field Generated by OHTL
The calculation of the electric field in the proximity of the OHTL (and station bars) was performed by starting with the theory of long and thin conductors in the presence of the ground [
27,
28].
Starting with the fundamental laws of the electromagnetic field, the expression for the electric potential distribution of a filiform conductor can be determined for the case in which the conductor’s potential is set as V
0 [
29]:
where:
r1 is the distance from the real conductor to the calculation point;
r2 is the distance from the image conductor to the calculation point;
h is the distance from the ground to the real conductor;
r0 is the conductor radius.
Finally, the expression of the potential distribution for the case of a three-phase power line is as follows:
where:
r1k is the distance from each real conductor to the calculation point;
r2k is the distance from each image conductor to the calculation point;
hk is the distance from the ground to each real conductor;
r0k is the radius of each conductor.
To exemplify the configuration of the three-phase OHTL considered in the relationships involved in the analytical models for the calculation of the electric potential and the respective electric field intensity,
Figure 1 shows a sketch of the considered model.
To determine the calculation expression of the electric field intensity, if we consider the case of a single conductor, the calculation relationship is as follows [
27]:
and in the case of a three-phase power line, the expression is determined by overlapping the effects as follows [
29]:
2.1.2. Calculation Module of the Magnetic Field Generated by OHTL
To determine the calculation expression for the magnetic field intensity in proximity to the OHTL, the theory of long and thin conductors was also used. Therefore, in order to determine the magnetic field intensity in the case of a filiform conductor, the following well-known relation can be used [
27,
28]:
where:
r is the distance from the conductor to the calculation point;
is a vector of the module equal to r, but rotated from the position vector with π/2 in a trigonometric reverse direction.
In these conditions, in the case of the three-phased OHTL, the calculation relation becomes the following [
27,
29]:
Based on these relations, we can finally determine the calculation expression of the magnetic induction for the three-phased OHTL:
2.2. The EMF Software Program
The software application for the human exposure to electric and magnetic fields assessment, named EMF, allows us to determine the electric potential (V), the electric field intensity (E), the magnetic field intensity (H), and also the magnetic induction (B), both in points and along the calculation/measurement path. Also, with the help of the EMF program, we can obtain the electric and magnetic field distribution on a surface between two poles, making it possible to represent the calculated values in 1D or 2D.
The determination of the electric and magnetic field is carried out in numerical form, adapted for different LEA configurations; this is so that its geometric parameters (distances, heights, sections, coordinates for the calculation points, etc.) and electric parameters (electrical voltage, electric current intensity) can be easily modified by users. The calculation algorithm (back-end) is made with the programming language PYTHON 3.11 and is based on the analytical calculation expressions presented in the paragraphs above. PYTHON 3.11 programming language was chosen because many libraries with mathematical functions for scalar and vectorial calculations, as well as many useful libraries for creating graphic and post-process representations of the results, are available to its users.
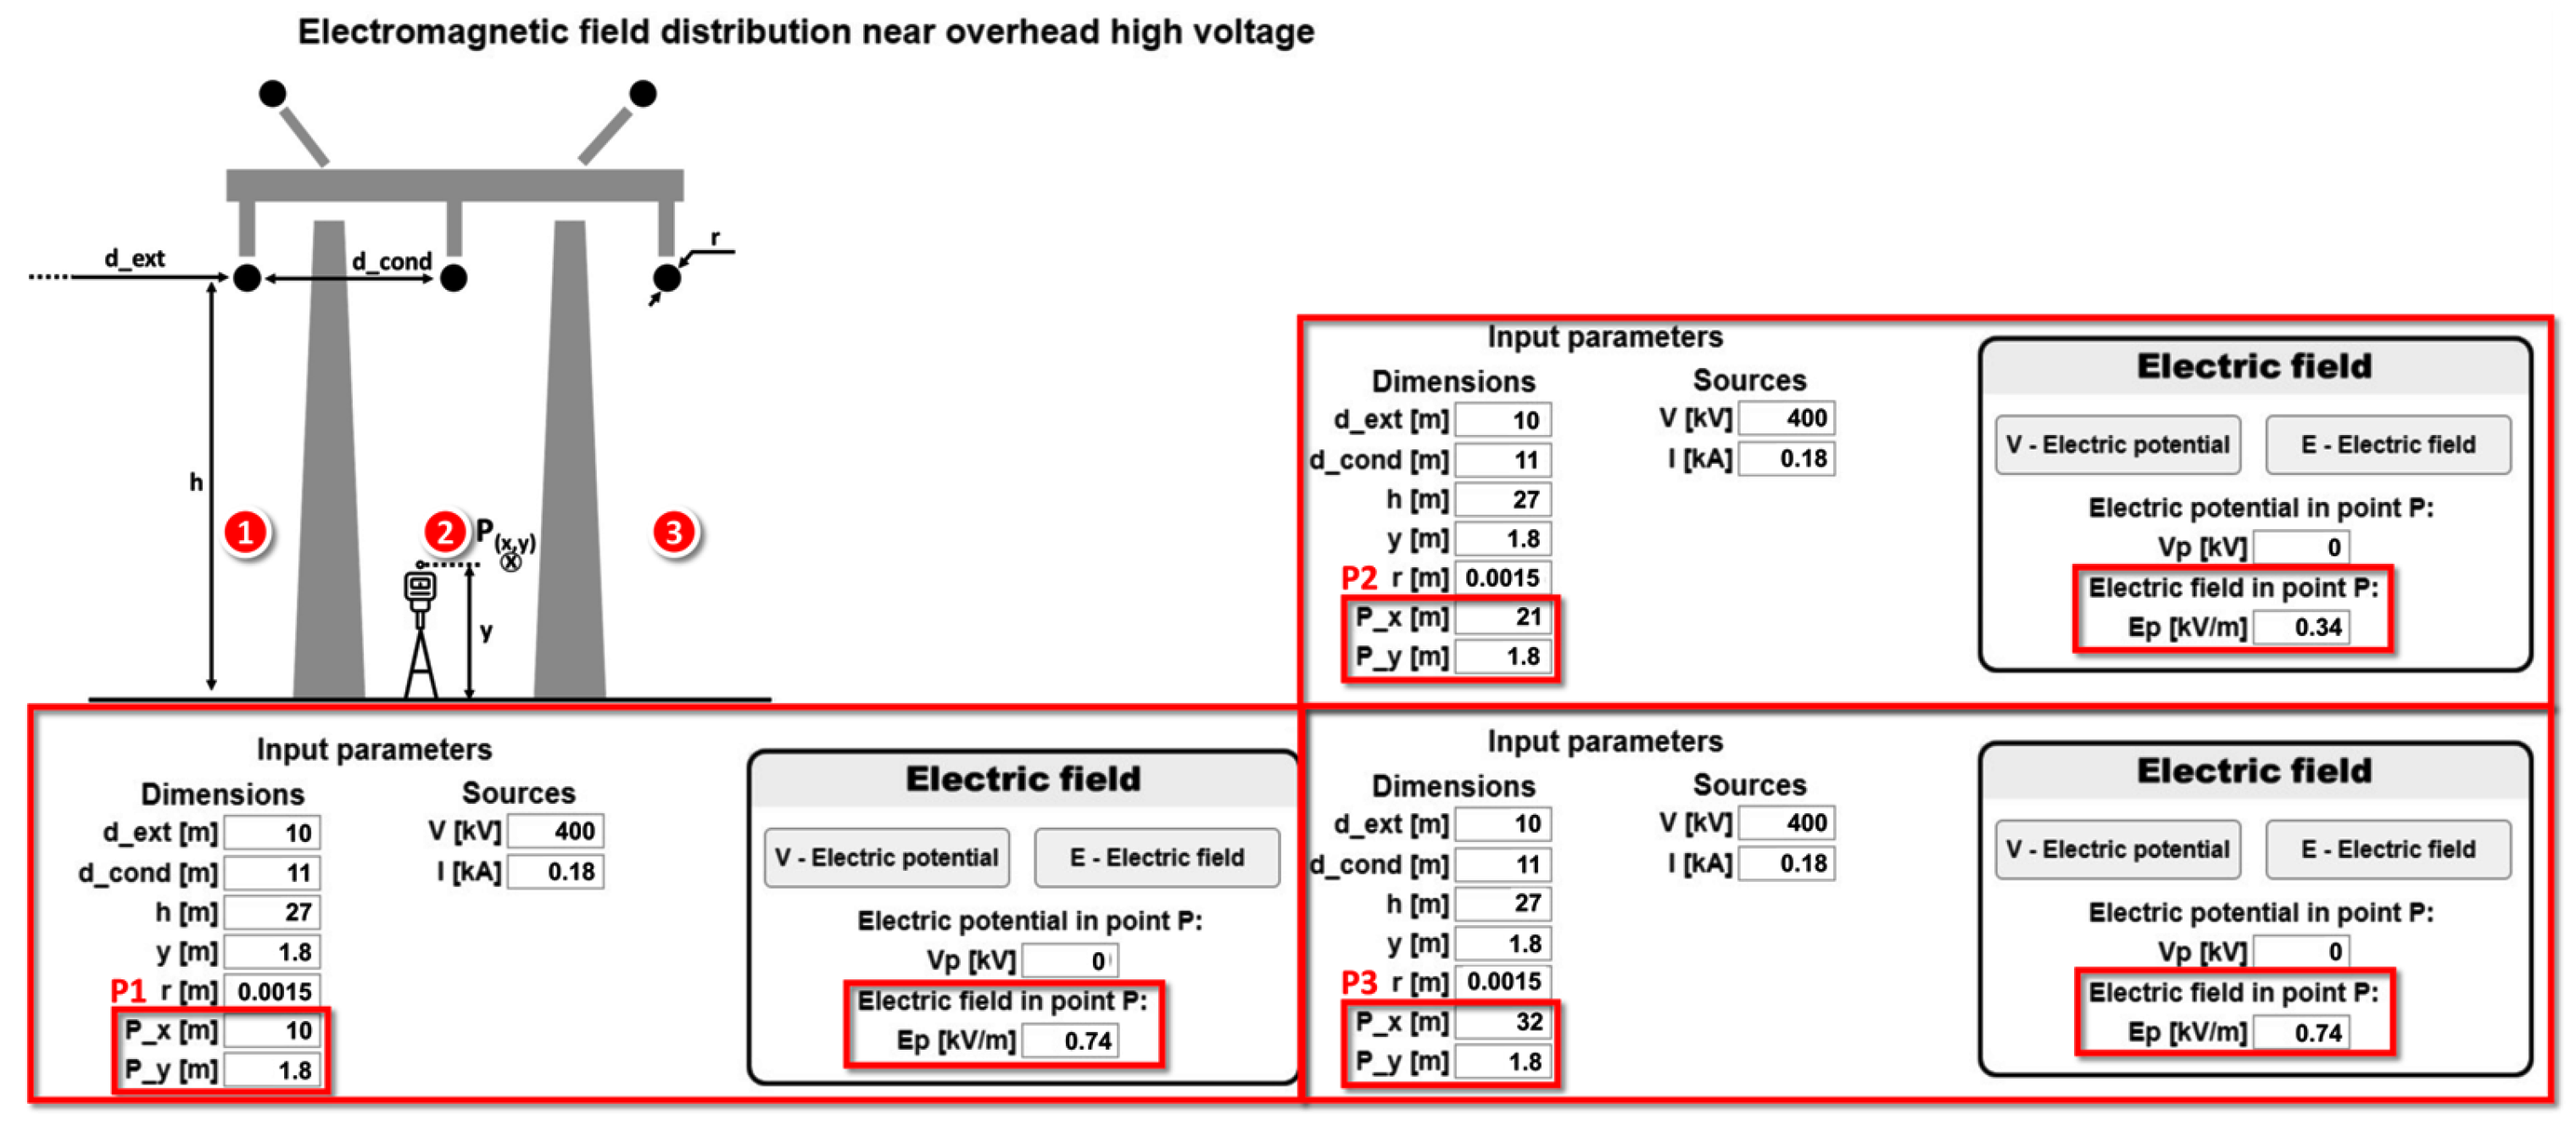
The graphical interface of the developed program uses the same programming language. The data are taken from the alphanumeric boxes in which the details of the studied model are introduced. The introduced data are stored in variables corresponding to each parameter. From the graphical interface of the developed program, presented in
Figure 2, a section in the left of the window can be distinguished; this section is intended for entering data related to the analyzed project:
Distance between the OHTL conductors;
The height of the conductors from the ground;
The height at which the calculations are made;
The conductor’s radius;
The distance from the outside of the conductors up to that at which the analyses are made;
The supply voltage of the conductors;
The intensity of the electric current passing through the three conductors.
On the right side of the window, one can distinguish the display section for the variation plots of the electrical parameters, as well as the section of action buttons and the display of the calculated values at a point. A calculation can be reperformed when pressing any button, so that closing the program window is not necessary.
This software program can also be accessed on a mobile phone, which greatly helps because it can also be used in the field, during EMC experimental measurements and tests. Practically, the EMF program includes two calculation modules: one for determining the electric field, which allows the assessment of the electric potential and the electric field intensity generated by the OHTL conductors, and the other one for determining the magnetic field, more precisely, the magnetic field intensity and magnetic induction.
2.2.1. The Calculation Algorithm for the Electric Field Generated by the OHTL
Following this, a study case analysis was conducted to assess the efficacy of the mathematical model integrated into the EMF program. The results obtained from the EMF program were compared with the previously validated measurements and numerical computations available in the literature [
30], where a similar mathematical model was applied. This comparison established the utility and accuracy of the mathematical model integrated into the EMF program, as corroborated by the state-of-the-art research in the field. The study case presented in [
30] considers the initial input data as follows:
The height of the conductors from the ground (to the lines’ sag), h = 11.2 m;
The distance between conductors, d_cond = 10.2 m;
The height of the calculation point P, y = 1.8 m;
The nominal voltage on the phase V0 = 419 kV;
The nominal current on the phase is In = 151 A.
The electromagnetic field calculation is performed for the entire width of the OHTL corridor, at a distance of 40 m, on both sides of the longitudinal axis of the corridor. These data were introduced into the EMF program and, in
Figure 3, the electric field distribution is obtained for this case.
In
Figure 4, the electric field distribution obtained using the EMF calculation program and the electric field distribution obtained in [
30] are overlapped. By comparing the two sets of values, it can be observed that the calculation algorithm for the electric field implemented in the EMF program provides values approximately equal to those validated in the literature [
30]. The difference between the values of the electric field E around the y = 0 coordinate may come from the error in the conductor height measurements in [
30], with the height being measured using an ultrasound device.
2.2.2. The Calculation Algorithm of the Magnetic Field Generated by the OHTL
The same validation method was maintained to assess the computed magnetic field, like the one presented in
Section 2.2.1. Therefore, the magnetic field generated by the OHTL measured in [
30] was compared to that computed using the EMF program. The input data of the test case were the same.
The variation in the magnetic field obtained using the EMF program is presented in
Figure 5, and in
Figure 6, these results overlap with the ones taken from the literature [
30], with the aim being to verify and validate the calculation algorithm for the magnetic field using the EMF program.
Comparing the two sets of values, it can be observed that the values of the magnetic induction B obtained using the EMF program are approximately equal to the ones obtained in [
30] on the entire width of the OHTL corridor. Thus, we can say that our calculation algorithm for the magnetic field using the EMF program is more precise from the perspective of the calculated values.
4. Discussion
Further validations of the electric and magnetic fields computed with the EMF program developed by the authors and described in this article are required in order to assess the precision of the implemented mathematical model. Therefore, the accuracy of the EMF program results, e.g., E and B, is assessed by comparing them with the experimental EMC tests measured on the 400 kV OHTL in Cluj-Napoca and the FEM results computed in the ANSYS Maxwell 3D commercial software program, respectively.
The results from the experimental measurements, EMF program, and Ansys are compared along the three measurement paths described in
Section 3.1. The absolute relative error ε
r is chosen as the assessment metric, being computed between the (i) measurement and EMF program, and the (ii) Ansys results and EMF program, respectively, for all three paths.
First, the distribution of the electric field intensity is assessed. Comparisons along the 1st, 2nd, and 3rd measurement paths are shown in
Figure 21a–c, respectively. It can be observed that the ε
r decreases with the OHTL height; thus, on the 3rd path, minimum ε
r values are obtained. The maximum ε
r is around 0.2 for both the measured and Ansys results. On the one hand, for the case of the measurements ε
r, important deviations can emerge due to physical influences (e.g., vegetation, terrain, OHTL steel structure). On the other hand, for the case of the Ansys ε
r, important deviations can emerge due to meshing and a domain region around the studied model.
Second, the distribution of the magnetic field intensity is assessed. Comparisons along the 1st, 2nd, and 3rd measurement paths are shown in
Figure 22a–c, respectively.
It can be observed that the εr decreases with the OHTL height; thus, on the 3rd path, minimum εr values are obtained. In this case, the maximum εr is around 0.2 for both the measured and Ansys results, as in the previous case. The measurement εr values are smaller compared to the E measurement εr, with the maximum value being under 0.1 (10%).
Comparing the results obtained using the three methods, it can be observed that the experimental method, using the commercial software program ANSYS Maxwell 3D, and using the EMF software program lead to similar results, which validates the software program developed and presented in this article by the authors.
Analyzing the results obtained using the three different methods, we find that the values are in the limits imposed by the standards in force for professional exposure.
The major advantages of the EMF software program are that the results can be extracted with a high accuracy, the discretization is 0.1 to 0.1 m or smaller, and the user can impose the step for discretization; meanwhile, in general, in the process of EMC testing, measurements are performed from 3 to 3 m or in the best case, from 1 to 1 m.
Compared with other similar commercial software programs, our program is easier to use; takes less time to run; offers the possibility of post-processing the results in points, lines, surfaces, and 2D or 3D plots; has a very friendly interface; and can be used on smartphones. Also, the EMF software program allows users to determine the electric and magnetic field in an area between two OHTL poles, something that helps to previsualize the field distribution in a specific area before starting measurement testing. All these advantages make our EMF software program extremely useful in the process of evaluating the exposure of humans to the electric and magnetic fields emitted by OHTL conductors.
5. Conclusions
This article proposes a software program dedicated to evaluating the exposure of humans to electric and magnetic fields, which is very useful in electromagnetic compatibility tests; this is because it allows the values of the electric and magnetic fields emitted by OHTLs to be quickly found and made available for use directly on smartphones. This means that the EMF software program can be used simultaneously with the experimental measurements directly at the place in which the measurements are made. The software program consists of two principal modules, one for the electric field and the other for the magnetic field, and each is based on a calculation algorithm. It is a very performant tool that can be useful in the process of EMC test digitalization.
The EMF software program was verified and validated by comparing the results with the experimental results and with those obtained using similar commercial programs. A 400 kV OHTL in Cluj-Napoca, Romania, was analyzed, and the results obtained using the EMF software program were compared with experimental tests and with those obtained using a commercial software program, ANSYS; this proved the precision and accuracy of our program. By comparing the results obtained from the three methods used for electric and magnetic field determination, the EMF software program accuracy can be observed, with the errors calculated being insignificant in most cases.
Using the EMF software program, we can determine electric and magnetic fields in a large number of points with a high accuracy, with less effort, and in a much shorter time than experimentally; thus, it is considered to be a welcome addition in the process of evaluating human exposure to electric and magnetic fields.
This EMF software program is part of a research program that aims to digitalize the process of evaluating human exposure to electric and magnetic fields.


 ,
, 
